Embed Size (px)
Citation preview

EQUALIZATION, ENERGY PRICES AND CANADIAN FEDERALISM
by Thomas J. Courchene
Jarislowsky-Deutsch Professor School of Policy Studies, Queen’s
and Senior Scholar
Institute for Research on Public Policy Montreal
Class Notes
2011
This powerpoint deck can be downloaded from my class powerpoints. Go to the SPS
home page, click on faculty gallery, scroll down and then click on my name, then click on MPA 844 course materials.
It will be under powerpoints.

Introduction
l The two approaches to equalization l Equalization: principles and program l Overview of energy prices :1972-2005 l First energy shock -- 1973-86
Ÿ Changes in eq’n, Ontario as have-not province, NEP, S.92A of Constitution Act 1982, alternative approaches to eq;n, Five-Province Standard, summary
l Second energy shock (on-going) Ÿ Differences this time around; eq’n capped, petro-currency, etc Ÿ Is another NEP-type policy in the works? ( No) Ÿ Fault lines are Interprovincial (equalization) not federal- provincial
l The new equalization framework l Proposals for addressing horizontal imbalance (especially if non-
renewable resources are not subject to equalization) Ÿ An Interprovincial resource-revenue sharing pool Ÿ Clawbacks on cash transfers Ÿ Transfers of powers upward by poorer province
l Conclusion

The Equalization Principle
l The Equalization Principle s.36(2) Parliament and the government of Canada are committed to the principle of making equalization payments to ensure that provincial governments have sufficient revenues to provide reasonably comparable levels of public services at reasonably comparable level of taxation. (Note: Does not say revenues per capita)
l Hypothesis: Equalization began at the same time(1957)
that the federation decentralized its tax system. Would the poorer provinces have allowed tax decentralization to proceed as far as it has without a comprehensive eq’n program so that all provinces would benefit? Do energy provinces now view that there still a link between decentralization and eq’n?

The Equalization Formula
1. Per-capita-base approach Under the national average standard (NAS or ten province standard), for each revenue source (there were over 30 of them, now under the O’Brien formula, there are only 5) the per capita equalization equals the difference between the per-capita yield at the national average tax rate for the ten provinces for this source and the per capita yield at national average tax rate for the province for this revenue source. Then sum these + or - entitlements over all revenues sources. If sum is positive, this is the province’s per capita equalization. If negative, equalization is set to zero. That is, Ottawa makes equalization payments from its consolidated revenue fund. (Provinces do not pay into equalization). Payments are unconditional.
2. Population share approach
Under the national average standard (NAS), the dollar value of equalization for each tax source equals total revenues from this source multiplied by the difference between the province’s population share and the province’s tax base share.

EQUALIZATION FORMULA Per Capita Base Approach
Where Eij = equalization from revenue source j to province i. Pi = population of province i. Eij/Pi= per capita Eq’n to province i from revenue source j. tcj = national average tax rate for revenue source j. r = this should be a “c” ( for Canada)– couldn’t change the PDF, sorry Brj/Pr = the national average per capita base for revenue source j. Read this as Bcj/Pc, where Pc is population of Canada Bij/Pi = The per capita base for province i for revenues source j.
J goes from 1 to 5, where 1= personal income taxes, 2= corporate income taxes, 3= consumption taxes, 4=property taxes, 5= Resources revenues.

The Population Share Approach to Eq’n

Intuition: province gets overall revenues equal to the national average tax rate times the national average tax base

Equalization Rationales: Political
l Two Political/Federal Rationales for Equalization
l 1. Federal/Constitutional Rationale: For federalism to be meaningful, provinces need funds adequate to discharge their powers and responsibilities as outlined in the Constitution.
l 2. Citizenship Rationale: Canadians no matter where they reside need access to comparable levels of some key public services (as a right of citizenship, as it were). If these happen to fall under provincial jurisdiction, then the provinces need revenues sufficient to provide these services.
l We now turn to the economic rationales

Equalization Rationales: Economic
l The Economic Rationale for Equalization l Assuming no costs to migration, citizens will arrange
themselves geographically so that ; Wi + NFBi = Wj + NFBj, where Wi= marginal product in province i (and similarly for province j) and NFBi= net fiscal benefits in province i (similarly for NFBj), where NFB’s are the difference between what one pays to the gov’t and the benefits one receives from the gov’t . Output is maximized when Wi is equal to Wj.
l If NFBj > NFBi, the migration will proceed until Wj < Wi, which will decrease real output nationally. This is termed fiscally-induced (and fiscally-inefficient) migration, although the sum of overall private and public benefits are equal.
l Fiscal efficiency requires NFBi = NFBj so that migration will lead to Wi=Wj. In turn this requires equalization to ensure that net fiscal benefits are equalized across provinces.

Equalization Prior to 1st Energy Shock
l Began in 1957. Linked to Quebec’s introduction of its PIT and consequent income tax decentralization
l Initially, shares of 3 taxes (PIT, CIT, succession duties) Ÿ Standard= top two province (ON and BC). ON only non- recipient. Ÿ 1958 = Diefenbaker increases share of PIT to provinces to 13% and this enters the formula.
l 1962 Ÿ Included resource revenues (RR) in formula (50% of 3 year average of NR revenues). Standard = National Average Standard (NAS
l 1963+ (Pearson Government) Ÿ Resource revenues withdrawn for equalization formula. Replaced by resource-revenue override (50% of RR revenues deducted from
any equalization) Ÿ Standard= back to top two. ON is only “have” province but RR Override keeps AB and BC from receiving equalization.

1967 Fiscal Arrangements
l Introduction of comprehensive eq’n formula l All provincial revenues included (miscellaneous category) l 100% of resource revenues in formula (1967-73 period is
the only period from the inception of Eq’n to the present where RR revenues were equalized in full)
l NAS again becomes the standard l Introduction of RTS (Representative Tax System), which
requires developing both a tax base and a tax rate for each revenue source.
l Logic of RTS is that when a new tax becomes representative of provincial taxing procedures, it will be brought into the formula in its own right (e.g., lottery revenues, which uses personal income as the tax base)

Equalization Tax bases at Peak Coverage
l Personal Income taxes, business income revenue (CIT +), capital taxes, general sales taxes, tobacco taxes, gas taxes, diesel duel taxes, non-commercial licenses, commercial licenses, alcohol revenues, hospital and Medicare premiums, forestry revenues, mineral revenues, water power revenues, insurance premium revenues, payroll taxes, prov-local property tax, lottery revenues, other games of chance, miscellaneous prov-local taxes, shared dividend revenues
l Energy categories: New oil revenues; old oil revenues; heavy oil revenues; third-tier oil revenues; heavy third-tier oil revenues; natural gas revenues; sales of crown leases; other oil and gas revenues; Newfoundland/Labrador offshore energy; Nova Scotia offshore energy.

Immediate reactions to the 1973-74 Spike
l Canada decides to keep domestic price below world price l Imposes export tax on the difference between fixed
domestic price and world price l Uses proceeds to subsidize imports to Eastern Canada l Provinces react by substantially increasing royalty rates l Ottawa then disallows royalty these payments for purposes
of federal corporate tax calculations l To prevent equalization from soaring, Ottawa alters (circa
1975) program—existing revenues (indexed for production) remain fully equalized, but only one-third of new (price related) revenues will be equalized.
l In 1977 fiscal arrangements, i) resource cap: only one-third of eq’n could come from resources and ii) henceforth 50% of all resource revenues would enter formula.

Ontario As A Have-not Province: 1977-82
l Result of 50% provision was that Ontario became have-not province for each and every year until 1982. Challenge was how to prevent Ontario from receiving payments
l Ottawa’s Response: l 1. Took Ontario out of resource ceiling calculations l 2. Phased out “sales of crown leases” category” l 3. But key was the “Personal Income Override”
Ÿ No province would be eligible for equalization if its per capita personal income exceeds national average. Passed in 1981 but made retroactive (earlier bills died on order paper because of elections)
l Effectively only affected Ontario. But Ontario agreed on condition that the 1982 agreements would rework the relationship between energy and the equalization formula.
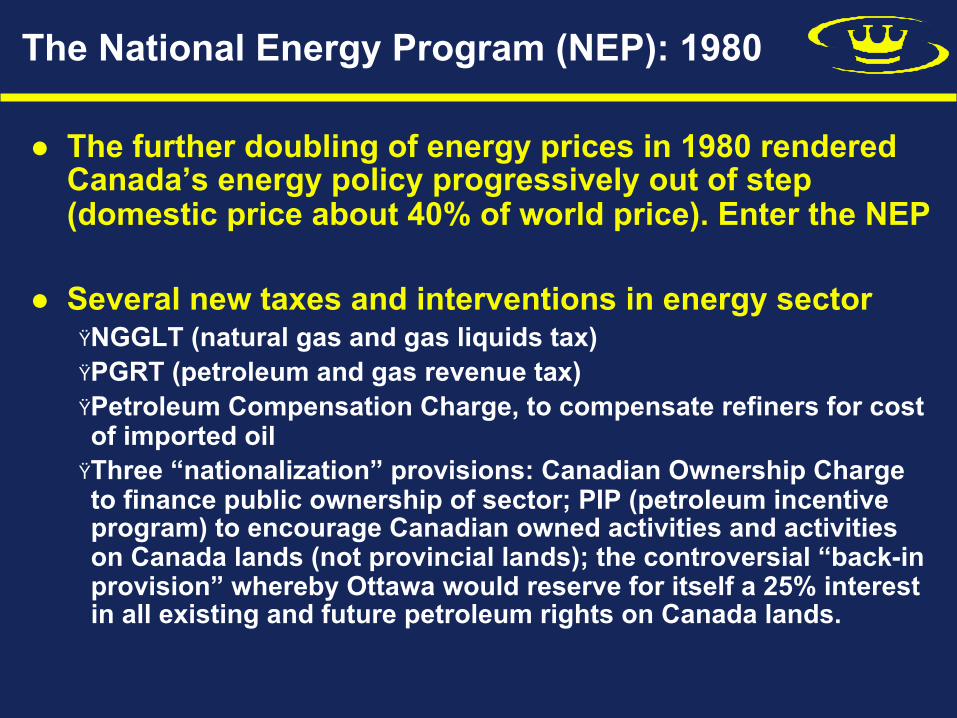
The National Energy Program (NEP): 1980
l The further doubling of energy prices in 1980 rendered Canada’s energy policy progressively out of step (domestic price about 40% of world price). Enter the NEP
l Several new taxes and interventions in energy sector Ÿ NGGLT (natural gas and gas liquids tax) Ÿ PGRT (petroleum and gas revenue tax) Ÿ Petroleum Compensation Charge, to compensate refiners for cost of imported oil Ÿ Three “nationalization” provisions: Canadian Ownership Charge to finance public ownership of sector; PIP (petroleum incentive program) to encourage Canadian owned activities and activities on Canada lands (not provincial lands); the controversial “back-in provision” whereby Ottawa would reserve for itself a 25% interest in all existing and future petroleum rights on Canada lands.

NEP: continued
l Alberta reaction: negative to outright hostile l 1981 EPTA helped a little (Canada-Alberta Energy
Pricing and Taxation Agreement). EPTA had more rapid increases in domestic price toward world level, e.g., the 1986 EPTA domestic price was C$60 vs. C$ 40 for NEP.
l West supported Mulroney in 1984 election in part on promise to dismantle NEP. This was made easier by collapse of world energy prices.
l Intriguingly, Canadian prices eventually had to fall to world levels. They have remained at world levels.
l Note also that the West’s support for the Canada-US FTA was in part driven by the knowledge that the FTA ensured that Canada could not mount another NEP.
l Premier Laugheed said the FTA is Alberta’s auto-pact

S. 92A of Constitution Act 1982
l Ottawa’s interventions under NEP (as well as earlier export taxes) and the CIGOL decision led the energy provinces to demand increased powers over resources
l Result: Section 92A to bring energy provinces on side for the constitutional amendment and repatriation process. Ÿ Grants provinces exclusive legislative authority over natural resource development, conservation and management. Ÿ On the tax side, provinces can make laws in relation to raising money by any mode on RR and the production therefrom and on electricity generation. This applies whether or not production is exported from the province.
l NL and NS did not succeed in getting amendments that would cede offshore resources to them, but Ottawa did agree to provide the provinces with a revenue stream from the offshore. Predecessor to offshore accords of the 1980s and perhaps even the 2005 NL and NS bilaterals .

1982 Fiscal Arrangements: Alternative Equalization Proposals
l An Ontario Standard Ÿ Bring all provinces up to Ontario per capita level Ÿ Ontario by definition could never be a have-not province Ÿ Ontario has no fossil energy so solves Ottawa’s financing concern Ÿ Proposed by Ottawa in November of 1981
l Gainer-Powrie model (1976) Ÿ federal share of energy revenues should equal tax rate that would prevail if royalties accrued to private sector (assumed to be 30% in 1976). Other 70% would enter equalization formula (financed by Ottawa). This would need to be negotiated since Ottawa could not do this unilaterally.
l Parliamentary Task Force (1981) Ÿ Should equalize the portion of revenues that would accrue to the province if all sub-surface rights were privately owned (assumed to be 20%).

1982 Fiscal Arrangements: Alternative Equalization Proposals: II
l Economic Council of Canada(1982) Ÿ Would prefer a comprehensive equalization formula (bring provinces up and down to the NAS standard and all revenues entering at 100%) Ÿ But since this runs up against the constitution, the ECC Report settles for equalizing the resource revenues that would accrue to Ottawa were natural resources in private hands
l The Saskatchewan Proposal(1981) Ÿ Can be termed NAS-20, ie equalize to NAS but include only 20% of natural resource revenues in the formula
l The Quebec Proposal (1982) Ÿ Resource revenues would be equalized to NAS but with the following two nuances: i) resource revenues would be treated as a single aggregate rather than as a dozen or so separate categories and ii) the fiscal capacity deficiencies for calculating equalization from resource revenues would be the provinces’ average deficiencies for the regular taxation categories (e.g., PIT, CIT, sales taxes. excises on tobacco and alcohol, etc)
l Two-tier Proposals (addressed later)

1982 Fiscal Arrangements: The Five Province Standard
l Ottawa needed two things from a new formula: keep Ontario from receiving equalization; and reduce the role of energy
l Ottawa surprised everybody by choosing the FPS, (Ontario, Quebec, Manitoba, Sask. and B.C.)
l Because Alberta is excluded from the FPS this reduces role of energy as well as keeps ON as have province
l Resource cap was replaced by floor and ceiling provisions on overall equalization
l All in all a stroke of policy genius , especially since it remained in place until 2004.
l Nonetheless, it has created its own set of problems, which led to the 2004 new framework for equalization.

First Energy Price Cycle: Summary
The first energy shock obviously had a dramatic impact on the political economy of Canada, running the gamut from the Constitutional dossier, to the politics of the federation, to Canada-US relations and, of course, to Canada’s system of equalization payments. Beyond this, the rise in energy prices began the process, continuing in the current time frame, of shifting the economic capital of Canada westward.
What is the likelihood that the second and on-going energy
price cycle will have equally dramatic implications? This is the focus of much of the rest of the presentation
Current Energy Price Cycle: Introduction
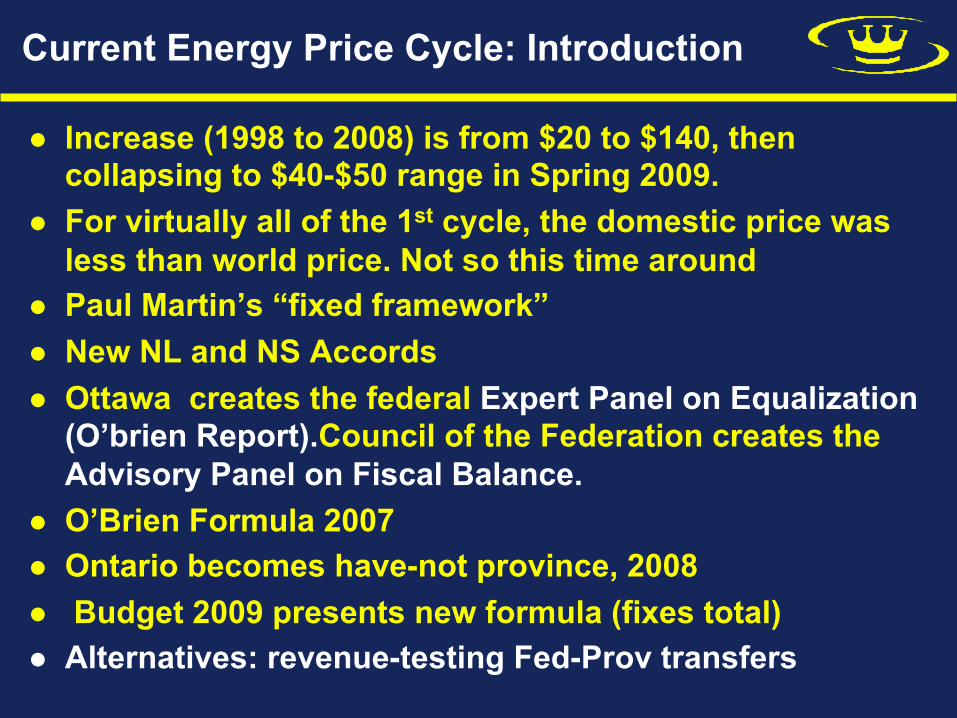
l Increase (1998 to 2008) is from $20 to $140, then collapsing to $40-$50 range in Spring 2009.
l For virtually all of the 1st cycle, the domestic price was less than world price. Not so this time around
l Paul Martin’s “fixed framework” l New NL and NS Accords l Ottawa creates the federal Expert Panel on Equalization
(O’brien Report).Council of the Federation creates the Advisory Panel on Fiscal Balance.
l O’Brien Formula 2007 l Ontario becomes have-not province, 2008 l Budget 2009 presents new formula (fixes total) l Alternatives: revenue-testing Fed-Prov transfers

Equalization developments since the FPS
l Mid 1980s: Ottawa signs offshore energy accords with NL and NS that reduce equalization tax-back rates on their offshore energy revenues
l Ottawa introduces the so-called “generic solution” that allows provinces to equalize only 70% of their revenues for any tax base where they have at least 70% of the revenues. Ottawa creates separate tax bases for NL and NS offshore energy so both can access the generic solution, but denies this to most of Sask. energy bases because while they have at least 70% of the FPS base they do not have 70% of the NAS (ten-province) base. As a result Sask. experiences very high tax-back rates (e.g., over 100% in fiscal 2000-01)
l In 2004 election Martin (secretly) promises special deal with NL and NS. Basically, the accords will return the Eq’n offset from resource royalties back to NL and NS
l While NL has almost zero eq’n offset, SK has over 100%! l Equalization is again in shambles.
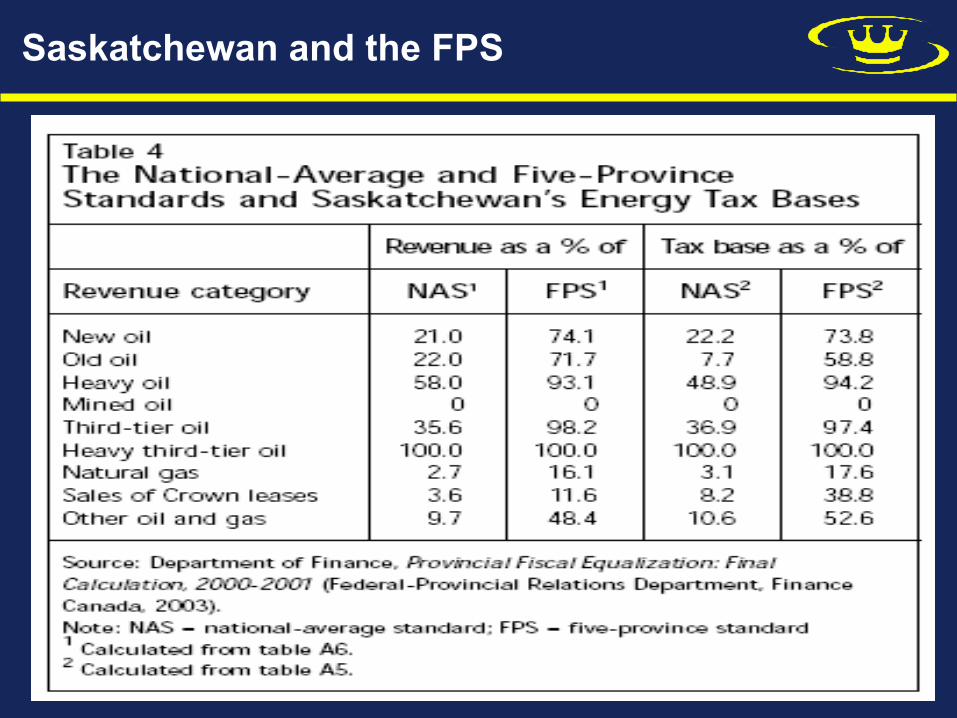
Saskatchewan and the FPS

Saskatchewan and the FPS: 2

Saskatchewan and the Five Province Std: 3

Notes: NRR = non-resource revenues; RR = resource revenues; FPS = five-province standard; NAS = national average standard.
1. This reproduces line D3 with two alterations: a) Ontario’s equalization is set to zero (offset against its positive entitlements from row D2); and b) the negative entitlements of the contributing provinces are correspondingly scaled back to reflect zero equalization for Ontario.
2. Courchene (2005), Table 3.
EQUALIZATION AND RESOURCE REVENUES - ($ millions, 2003-04)
Line
NL PEI NS NB QC ON MB SK AB BC Total
A
1 2 3
FPS Eq’n (Total) from NRR from RR
678 835 -157
227 203 24
1,093 965 128
1,158 1,070 88
3,895 3,265 629
-5,415 -7,221 1,806
1,351 1,227 124
- 6 917 -923
-13,285 - 5,196 - 8,089
175 1,811 -1,636
8,577
10,294
-1,717
B
1 2 3
NAS Eq’n (Total) from NRR from RR
845 870 -25
271 212 59
1,382 1,028 354
1,401 1,121 280
6,312 3,769 2,542
-1,463 -6,397 4,934
1,726 1,306 420
279 984 -704
-12,264 - 4,983 - 7,286
1,514 2,090 - 576
13,731
11,380
2,351
C
Pure FPS (NRR only) 866 212 1,006 1,109 3,436 -7,486 1,278 941 -5,552 1,830
10,679
D
1 2 3
NAS with 20% RR from NRR from RR
868 870 -5
224 212
12
1,099 1,028 71
1,177 1,121 56
4,278 3,769 509
-5,410 -6,397 987
1,390 1,306 84
843 984 -140
-6,441 -4,983 -1,457
1,975 2,090 - 115
11,851
11,380
470
E
RR Sharing Pool1 -5 12 71 56 509 987 84 -140 -1,457 -115
1,718
F % Population 1.64 .44 2.97 2.38 23.75 38.82 3.68 3.15 10.01 13.16 100
G
% Federal Revenues2 1.16 .35 2.33 1.76 21.66 43.19 2.89 2.52 11.85 11.84 99.6
From FPS to the New Eq’n Framework
l Beyond this, in recent years FPS equalization has been falling. This results from tax decreases in Ontario, Alberta and BC (although Alberta is not one of the five provinces in the FPS, the tax rate for the FPS formula is a national-average tax rate, not a five province tax rate)
l As part of the Council of the Federation meeting in July of 2004, the premiers called for an increase in eq’n to its previous high level. In the FMM in October of 2004 the PM and the premiers agreed to increase eq’n to $10.9 bill for 2005-06 and then index it by 1.035 annually (i.e. 3.5%)
l This changes eq’n dramatically. The formula will now only determine the allocation across provinces and not the total.
l Martin creates expert (O’Brien) panel, tasked with proposing a new allocation mechanism, as well as reflecting on the longer term evolution of the formula.
The O’Brien Model
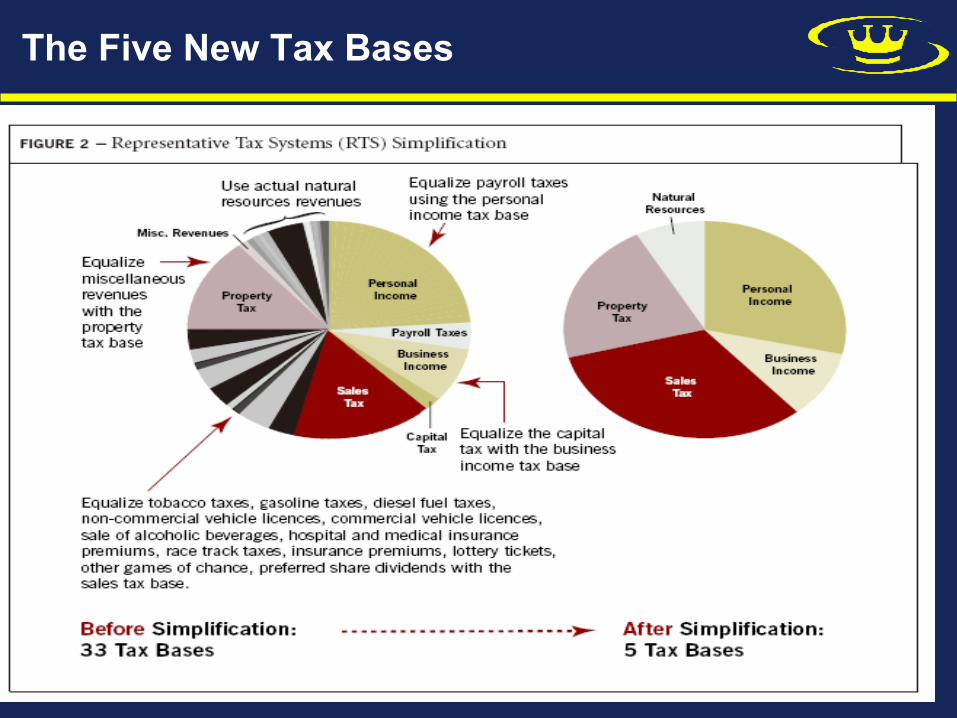
l Returns to formula basis for both total and allocation l The standard will be the 10-province standard l Allocates 30+ revenues source into 5 tax bases (property,
personal income, business income, sales, resources) l Tax base for resource revenues is actual revenues
collected. l 50% of resource revenues (RR) will enter the formula l A cap will exist: no receiving province will end up with a
fiscal capacity higher than that of the lowest non-receiving province (calculation includes 100% of RR)
l Calculation will be based on a three-year average (50%, 25%, 25%), lagged two years.
l Implemented in 2007 budget
The Five New Tax Bases

The Resource Cap

Ontario Becomes a Have-Not Province
l Because of rising energy prices and the Dutch Disease Ontario becomes a have-not province even though the really high energy prices are not yet in the formula
l BC replaces Ontario as the lowest non-receiving province, which eases the cap: energy-rich NL and SK get extra Eq’n
l In fall 2008 and in Budget 2009, Ottawa again alters formula. Eq’n will now grow by a rate equal to a three year average of nominal GDP. Once again the formula only determines the allocation. This total will be a floor as well as a ceiling.
l Not sure what will happen if nominal GDP turns negative. l If Ontario’s fiscal capacity collapses, it could lower
everyone’s Eq’n because of its population size l Equalization is arguably in shambles again

Equalization Challenges
l The Funding Inequity: Ÿ Ottawa cannot tax energy rents that flow to the provinces (s.125 of the Constitution). It must finance them from its general revenues, about 40% of which come from Ontario.
l No Capitalization: Ÿ Eq’n is intended to ensure that provinces have funds for roughly similar amounts of public services. But it costs more to provide services in Ontario/ Alberta than in the Atlantic region. Hence AB
and ON need more per capita revenues than the Maritimes to deliver comparable public G&S. But our Eq’n program focuses on revenues and assumes that prices are identical. And in terms of actual tax revenues, Ontario has the lowest per capita value
Failure to deliver horizontal equity: Ÿ After equalization, there are huge differences across provinces; e.g., from my calculations for actual 2007-08: AB (13,000), NL (11,000), SK (8,400).BC (8,100), rest (about 72,000-75,000)

Equalization Challenges: II
l Heritage Funds: Ÿ If AB, SK or NL were to put their royalties into a heritage fund, these monies would not enter the equalization formula. But if and when they are withdrawn and taken into general revenues they would enter.
l Hydro Royalties; Ÿ For example, QB sells hydro to its citizens at less than market rates. We know this because its proposed sales to new England are at prices that are almost double domestic sales. Both of these rents should enter. Yet only a small proportion does. But QB collects huge payments from equalizing RR and because of the inappropriate O’Brien move toward a market base for property
l More on Quebec: Ÿ In 2005-06, Quebec’s Eq’n was $4.8 bill (43% of total Eq’n). In 2009-10 these #s are $8.4 bill and 56%). Over this period overall eq’n went up by $3.702 bill, while Quebec’s increased by $3.557 bill

Alternatives: An Interprovincial Energy Revenue Sharing Pool:1
l In 1980 or so, I proposed a two-tier proposal for equalization. While this is novel in the Canadian context, the German federation has such an inter-Laender revenue-sharing pool. (not for energy specifically)
l The first tier would employ a 10-province-standard approach for equalizing non-resource revenues. This could be open ended, or have the amount determined in advance as under the current approach.
l The second tier would be an interprovincial resource-revenue sharing pool that would be operated by and for the provinces (preferably under the aegis of the Council of the Federation). Hence this tier would bypass Ottawa entirely. The updated version of this proposal might, for example, select 20% as the appropriate share of natural resource revenues to be subject to the second tier of equalization. Each province would contribute 20% of their resource revenues to the pool and would withdraw their population share equalization.
l This would have to agreed to by all provinces. However, from experience, this does not go down well in the energy patch.
l But if you like the United Way, you should like this!

An Interprovincial Energy Revenue Sharing Pool:2
l By the very nature of a self-financing pool, contributions from the rich provinces will equal withdrawals by the poor provinces (essentially each province contributes 20% of its resource revenues and withdraws its population share). This total is $1.718 billion.
l However, if one assumes that these tiers are integrated so that a province can receive a second tier payment only to the extent that its second-tier positive entitlement exceeds any first tier negative entitlement, then Ontario becomes ineligible to be a recipient in the second tier. This means that the cost to the contributing provinces will be $731 million (i.e., $1.718 billion minus Ontario’s $987 million), and all contributing provinces’ payments are scaled down accordingly (to 42.6%). These are the figures that appear as panel E of Table 2. The $620 million contribution by Alberta represents just under 8% of its resource revenues.

Revenue-Testing the CHT and CST: I
Existing Cash Transfer Clawbacks l Part of CHT entitlements are based on 13.5 PIT tax points and 1 CIT
tax points (i.e., the 1977 arrangements) l Ontario and Alberta have per capita revenues from these tax points
in excess of the national average. l Therefore, ON and AB lose CHST cash transfers (dollar-for-dollar)
on these tax point transfers in excess of the national average. l For Ontario this reduces its cash transfers by nearly a billion
dollars. The reduction for Alberta is smaller in dollar value, but it is larger in per capita terms. In the 2009 budget, this revenue-testing was removed.
l Ontario’s transfers have been restored to the level of others. However, Alberta’s are not yet restored.
l Key message: Scaling back (or revenue testing) cash transfers in accordance with resource or total revenues would not be novel.
l Accordingly, what follows is my proposal along these lines.

Revenue-Testing the CHT and CST: II
PROPOSAL
l Revenue-test the roughly 30 billion of federal –provincial cash transfers (CHT and CST) on the basis of overall fiscal capacity (resource and non-resource own revenues plus equalization).
l For example, once a province reaches a threshold fiscal capacity (say 110% of this overall national average, then Ottawa would clawback, say, 20 cents of the CHT/CST transfer for every additional dollar of a province’s revenues beyond the 110% threshold. The savings would then be again revenue tested, etc, until the value of the CHT/CST is exhausted
l This would ensure that these transfers will reduce revenue disparities across provinces. i.e., they would be fully in line with s. 36(2).
l As noted, revenue testing the CHT /CST would not be novel in that we do it for the CCTB, the GIS and OAS
l But this will not be well received by some provinces. l Yet something may have to be done if we want to avoid some
provinces being able to provide more public services than others