Embed Size (px)
Citation preview

Indian Journal of Chemi stry Vol. 42A, June 2003, pp. 1436- 1441
Equalized electronegativity and topological indices: Application for modeling toxicity of nitrobenzene derivatives
Padmakar V Khadikar l .*, Istvan Lukovits2, Vijay K.AgrawaI 3
, Shachi Shrivastava3' , Mona Jaiswal4,
lvan Gutman5 ,Sneha Karmarkar ' & Anjali Shrivastava4
I Research Divi sion, Laxmi Fumigat ion & Pest Control (P), 3,Khatipura, Indore 452 007, India *E-mail: pvkhad ikar@red iffmail.com
2Chemical Research Center. Hungarian Academy of Sc iences, H- 1525 Budapest, P. O. Box 17. Hungary 3QSAR & Computer C hemical Laboratories, A.P.S. Uni vers ity, Rewa 486 003, Indi a
4Department of Chemi stry, Govt. Model and Autonomous Ho lkar Coll ege, Indore 452 00 I, Indi a 'Faculty of Science, Un iversi ty
of Krag ujevac. P. O. Box 60, YU-34000 Kragujevac, Serbia & Montenegro
Received 6 JanUal) 1 2003
Use of eq uali zed e lectronegati vity CX:"q) in modeling tox icity of nitrobenzene is discussed. Resul ts show that more reliable models can be obtained when Xcq is combined wi th topological indices. The results are di scussed by using multiple regression and cross-validation procedures.
An important field of predictive toxicology IS the development of quantitative structure - toxicity relationships (QSTR) for modeling tOXICity of chemicalsl.2.QSTRs can be used for the preliminary evaluation of the potential hazards of chemical compounds. The number of such mathematical models is increasing and there are numerous applications. For QSTR analysis the toxicological data and pertinent structure-descriptors of the chemicals are used.
Recently the toxicity of solubl e organ ic ions has been investigated by using topological indices3
-8
.
Other applications of topological indices in QSAR/QSTR studies have also been reported9
•1O
. A topological index is a numerical descriptor of molecular structure and is sensitive to such key constitutional features as size, shape, symmetry, branching, and heterogenity of the molecule t' •
12.
Of course, for modeling toxicity of chemical one may also employ molecular descriptors other than topological indices9
.1O
. The present work investigates the equalized electronegativity (Xeq)13.1 4 for modeling toxicity of nitrobenzene derivatives (Table 1). Index Xeq has already been used for modeling physiological activi ty tS-'8. As discussed below, we have observed that Xeq can also be used for modeling toxicity and that reasonably good results are obtained when Xeq is combined with topological indices, including an
indicator parameter. The topological indices used in combinati on with Xeq are the Wiener '9 (W), hyperWiener20
-26 (WW), Balaban27 (1), first-order valence
connectiv ity indices28 (IXV), and 10gRB indices29 . The indicator parameter, lP, is equal to 1 if a halogen is present, and is equal to zero if th ~re is no halogen substituent. The results indicate that Xeq is the most important parameter.
Methodology Dataset
The data for 43 nitrobenzene derivatives , with experimental toxicity against Tetrahymena pyriformis, have been reported in the literature.3D
•31 The toxicities.
are the 50% growth inhibitory concentrations of nitrobenzenes agains t the Tetrahymena pyriformis strain GL-C, g iven as logIGCso-1
• Detai ls concerning the experiment are given in the work of Cronin et al.30
The experimental values of 10gIGCso-' are listed in Table 1.
Equalized electronegativity (Xeq) The charge conservation equation leads to the
following expression for equalized electronegativity (Xeq): 13. 14
Xeq = N/'iv/x (1)
where N=Iv is the total number of atoms 111 the molecule; v denotes the number of atoms of a
KHADIKAR et aL.: EQUALIZED ELECTRONEGATIVITY AND TOPOLOGICAL INDICES 1437
particular element of the molecule, and X is the electronegativity of that particular atom.
Topological indices All topological indices used (W, WW, J, lXV, and
log RB) were calculated from hydrogen-depleted graphs. Their definitions and methods of calculation are described elsewhere. 19-29 Within the present investigation they were calculated using a computer program developed by one of us (LL.) .
Indicator parameter (I P) It is a dummy parameter used to indicate the
presence (IP=l) of a halogen atom in the respective nitrobenzene derivative. If no halogen atom is present, then IP=O.
Statistics Regression analysis was carried out using a
computer program, adapted to P.c. by one of us (LL.). In order to obtain appropriate models, we used the maximum R2 method31,32. In addition, we also calculated the quality factor33
, Q as the ratio of correlation coefficient (R) and the standard error of estimation (Sc) i,e, Q=RISe .Finally, the crossvalidation method was used to establish the predictive potential of our models.
Results and Discussion A preliminary analysis revealed that out of the
original set of 43 nitrobenzene derivatives3o.34, four compounds (Comp nos. 2,24,27,43 in Table 1) are serious outl iers. They were, therefore, deleted from the present study and we considered only 39 compounds (Table 1). The toxicity of these compounds and the value of indicator parameter are also given in Table 1. In addition, values of indices Xeq, W, WW, J, IXv. and 10gRB are listed in Table 2.
The intercorrelation of the aforementioned topological indices and their relationship with toxici ty (\ogIGCso-l
) is presentd in Table 3.
A perusal of Table 3 shows that Xeq is the most suitable molecular descriptor for modeling toxicity of the compounds studied, and that other molecular descriptors i.e. topological indices (W, WW, J, and logRB) have similar potential. On the other hand, the first-order valence connectivity (IXV) does not correlate with the activity.
The data presented in Table 3 show that W, WW, and logRB are highly correlated with each other. A
Table I-Set of 39 compounds used in the present study.
No. Compo Log IP IGCso
· 1
I. 2,6-Dimethylnitrobenzene 0.30 0 2. 2,3- Dimethylnitrobenzene 0.56 0 3. 2-Methyl-3-chloronitrobenzene 0.68 0 4. 2-Methylnitrobenzene 0.052 0 5. 2-Chloronitrobenzene 0.68 0 6. 2-Methyl-5-chloronitrobenzene 0.82 0 7. 2,4,5-Trichloronitrobenzene 1.53 0 8. 2,5-Dichloronitrobenzene 1.13 0 9. 6-Chloro- I,3-dinitrobenzene 1.98 I 10. Nitrobenzene 0.14 0 II. 3-Methylnitrobenzene 0.054 0 12. 1,3-Dinitrobenzene 0.89 0 13. 3,4-Dich loron i trobenzene 1.16 0 14. 4-Methylnitrobenzene 0.17 0 15. 1,4-Dinitrobenzene 1.30 0 16. 4-Chloronitrobenzene 0.43 0 17. 2,3,5 ,6-Tetrachloroni trobenzene 1.82 0 18. 6-Methyl-I ,3-dinitrobenzene 0.87 0 19. 3-Chloronitrobenzene 0.73 0 20. 1,2- Dinitrobenzene 1.25 0 2 1. 2-Bromonitrobenzene 0.75 0 22. 6-Bromo- I,3-dinitrobenzene 2.31 I 23. 4-Bromonitrobenzene 0.38 0 24. 2,4,6-Trimethylnitrobenzene 0.86 0 25. 2,4-Dichloroni trobenzene 0.99 0 26. 3,5-Dichloronitrobenzene 1.13 0 27. 6-lodo-I,3-dinitrobenzene 2.12 1 28. 2,3,4,5-Tetrachloroni trobenzene 1.78 0 29. 2,3-Dichloronitrobenzene 1.07 0 30. 2,5-Dibromonitrobenzene 1.37 0 31. I ,2-Dichloro-4,5- dinitrobenzene 2.21 I 32. 3-Methyl-4-bromonitrobenzene 1.1 6 0 33. 2,3,4-Trichloronitrobenzene 1.51 0 34. 2,4,6-Trichloronitrobenzene 1.43 0 35. 4,6-Dichloro- I,2- dinitrobenzene 2.42 I 36. 3,5-Dinitrobenzyl alcohol 0.53 0 37. 3,4-Dinitrobenzyl alcohol 1.09 0 38. 2,4,6-Trichlorol ,3- dinitrobenzene 2.19 39. 2,3,5,6-Tetrachloro-I ,4- 2.74
dinitrobenzene
comparatively smaller colinearity is observed for the J index.
I -Parameter model We obtained fairly significant equations for all six
parameters (Xeq , W, WW, J, !ogRB and IP), accounting for toxicity (logIGCso-I
), but the best results were obtained with Xeq :
10g(lGCso·l) = -11.7495 + 4.9989(± 0.4374) Xeq
(2)
n=39, Se= 0.334 1, r=0.8823, F=130.631 , Q=2.6408

1438
Comp.No.
I. 2. 3. 4.
5. 6.
7.
8. 9. 10.
II. 12. 13.
14.
15. 16.
17. 18.
19.
20.
21.
22 .
23.
24.
25. 26.
27. 28.
29. 30.
3 1.
32.
33. 34.
35.
36.
37. 38. 39.
logIGC lso
W
WW J logRB IX"
Xcq
IP
w
144
146
146 114
11 4 148
187
148
240
88 117
197
152 120
206
120 222
240
11 7
188 114
240
120
184
150 ISO 240 226
146 148
283
84
185 184
278
296
293
332 390
1.0000 0.7463
0.7253 0.7484
0.75 14 0 .2435
0.8828
0.7687
B
5.1259
5.1259
5.1259
4.7152 4.7152
5.1090
5.5 197 5.109 1
6.0 197
4.3045
4.6984
5.6091
5.1091 4.6984
5.6091
4.6984 5.9473
6.0 197 4.6984
5.6259
4.7 152
6.0197 4.6984
5.5197 5.109 1
5.0922 6.0197 5.9473
5.1259
5.1091
6.4304
4.1984
5.5366
5.5197 6.4304
6.5409
6.5577
6.8579 7.2855
INDIAN J CHEM, SEC. A, JUNE 2003
Table 2-Topological indices used in the present study
w
J
2.5512
2.5085 2.5085
2.3960 2.3960
2.4705
2.55 14
2.4705
2.5260 2.2284
2.3199
2.4024
2.3956
2.2599
2.295 1 2.2599
2.7557 2.5260
2.3199
2.5409
2.3960
2.5260
2.2599
2.6021 2.4372
2.4273 2.5260
2.7007 2.5085
2.4705
2.6976
2.3462
2.5842
2.6021 2.7521
2.5643
2.6048
2.8403 2.9443
1.0000 0.9970 0.8238
0.9997 0 .6620
0.7630
0.6770
Sz
224
228
228
180 180 232
292
232
360 142
186
296
240 192
3 14 192
342
360 186
278 180
360 192
286 236
236
360
350 228 232
422
144
288
286 412
437
431 494
582
logRB
46.7308 47.177 1
47. 177 1
36.5035 36.5035
47.6879 60.3356
47.6879
76.8953
27.6625
37.2374
62.8613
48.4988 37.8252
64.4304 37 .8252
72.6831
76.8953 37.2374
60.9518
36.5035
76.8953
37.8252
59.6662 48.0526
48 .1987
76.8953 73.494 1 47.1771
47.6879
91.5862
26.4585
59.8248
59.6662
90.5522
94.6997 93.8686
107.8003 126.4037
Table 3 - Correlation matrix
ww
1.0000 0.7794
0.9949 0.6621
0.7492
0.6741
1.0000 0.8366 0.5663
0.6902
0.5452
logRB
1.0000 0 .661 1
0.7662
0.6777
ww
296
306 306
231 231 315
417 315
576 176
245
464
337
262 521
262 486
576 245
416
23 1
576 262
402
327 324
576
508 306 3 15
674
160
408
402
647
738
727 799 963
Xeq
2.3836
2.3836 2.4655
2.4154 2.5257
2.4655 2.6630
2.5926 2.6794
2.4623
2.4 154
2.6168
2 .5926
2.4 154
2.6168 2.5258 2.7374
2.5446 2.5258
2.6168
2.5150
2.6688 2.5150
2.3607
2.5926 2.5926
2.6629 2.7374
2.5926
2.5699 2.7451
2.4570
2.6630 2.6630
2.7451
2.5798
2.5798 2.8 141 2.8866
1.0000
0.08 12
0.3479
Xecl
6.4958
6.4958
5.8738 5.5732 4.9511
5.8738 5.5523
5.2517
6.1374
4.6505
5.573 1
5.8368 5.2517
5.5731
5.8368 4.9511 5.8529
6.7595 4.95 11
5.8368 4.9511
6.1374
4.9511
7.4184
5.2517 5.25 17
6. 1374
5.8529 2.2517
2.25 17
6.4380
5.8737
5.5523
5.5523 6.4380
6.9 138 6.9 138
6.7387 7.8558
1.0000
0.6273
IP
3.3328
3.3328 3.02 17
2.9 161 2.6051 3.0158
2.8 104 2.7047
3.1045
2.4994
2.9101
2.9989 2.7048
2.9101
2.9989 2.5991 2.9220
3.4155
2.599 1
3.0049
2.6051 3.1045
2.5991 3.7435
2.7047
2.6988 3.1045
2.9220 2.7107
2.3268
3.2 102
3.0 158
2.8164
2.8104 3.2102
3.5793
3.5853 3.32 18 3.4334
1.0000
KHADIKAR el al. : EQUALIZED ELECTRONEGATIVITY AND TOPOLOGICAL INDICES 1439
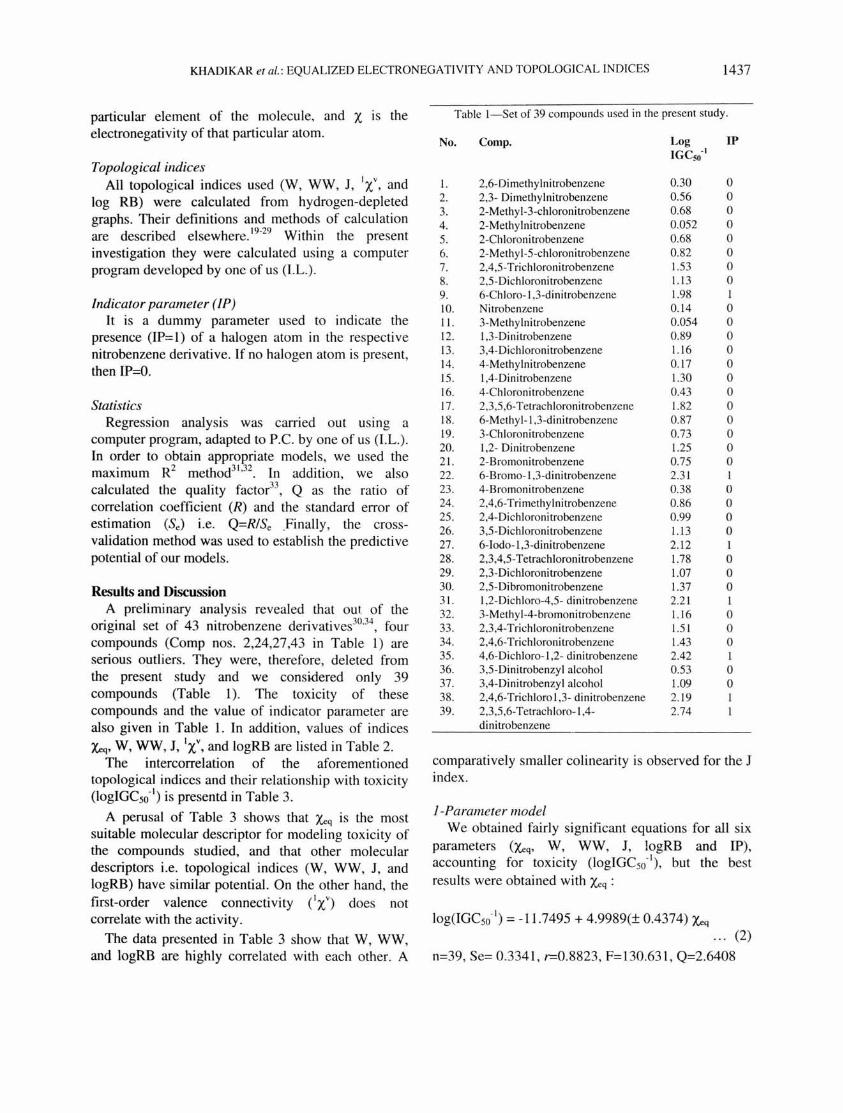
Note that Xcq is an electronic parameter. The positive coefficient of Xcq in Eq. (2) indicates that electronegati vity of the substituents of the benzene ring plays an important role in toxicity . This leads to the conclusion that the toxic effect can be minimized by the attachment of a less electronegative group to the benzene ring.
Our main objective of the present investigation was to investigate the role of Xeq in explaining toxicity of the nitrobenzene derivatives. Therefore, in what follows, all the multi-parameter models examined contain Xeq.
2-Parameter model Successive regression analysis resulted into several
binary combinations of Xeq with the topological indices used. The best 2-parametric model contained
Xeq and IP:
log(IGC50·1)= -8 .6181+3 .7403 (±0.4608) Xeq+0.6394
(± 0.1469)lP . .. (3)
n=39, Se=0.2741 , r= 0.9249, F= 106.487, Q= 3.3743
Here, both parameters have positive coefficients, and therefore, with increasing value of Xcq and IP, toxicity also increases.
The positive coefficient of IP in Eq (3) indicates that halogenation of nitrobenzene derivatives causes higher toxicity.
The regression parameters and quality of model expressed by Eq (3) indicate that addition of IP significantly improves the correlation coefficient and r increases from 0.8823 to 0.9249. Also, the quality factor Q increases from 2.6408 to 3.3743. This improvement is the result of taking into account the halogenation.
3-Parameter model This best equation contains the following
independent variables, Xeq, IX' and IP:
log(lGC50·1) = -9.3597 + 3.8399 (± 0.4672) Xcq
+ 0.1672 (± 0.1467) IX' + 0.5704 (± 0.1583) IP (4)
n=39, Se= 0.2730, r=0.9277, F= 72.015 , Q= 3.3981
All regression coefficients (except the intercept) are positive. Note that the slight improvement (relative to Eq. (3» is due to the addition of the term IXV.
The first-order valence connectivity (IXV) distinguishes the degree of unsaturation and the presence of a heteroatom. Hence, the positive coefficient of IXV term in the model (3) implies that unsaturation and the presence of heteroatoms leads to increased toxicity .
4-Parameter model The best four-parametric model containing indices
Xeq, W, J, IP is as follows:
log(IGC5o·l) = -10.7796 + 3.4295 (± 0.5301) Xeq
-0.0022 (± 0.0012) + 1.3473 (± 0.4455) J + 0.6671 (± 0 .1463) IP (5)
n=39, Se=0.2504, r=0.9413 , F=66.106, Q= 3.760
The coefficients pertaining to the indices Xeq, J, and IP are positive. The negative coefficient of index W may be due to colinearity. Note also, that the Balaban index J is a highly discriminating descriptor, whose value does not substantially increase with the molecular size and the number of rings present. The positive coefficient of J is in accordance with the negative coefficient of index W.
5-Parameter model The best five-parameter equation found is
log(lGC50·1) = -12.2443 + 3.2043 (± 0.5082) Xeq
+ 0.5812 (±0.1896) W -0.0573 (± 0 .0171) WW-1.3193 (± 0.4449) 10gRB + 0.7478 (±0.1411) IP (6)
n=39, Se=0.2351 , r=0.9500, F=61.071 ,Q=4.0408
The negative signs of the coefficients of indices, WW and log RB, might be caused by colinearity.
It is worth mentioning that W, WW, and 10gRB are highly intercorrelated. Therefore, this model may suffer from the defect due to colinearity. However, this defect is not that serious because the coefficients of all these terms in the above model are appreciably higher than their respective standard deviations.
A similar problem was recently investigated by Randic26
. He stated that one should particularly be aware of a common fit in all regression analysis , when the descriptors that are highly interrelated. He further maintained that by discarding one of the
1440 INDIAN J CHEM. SEC. A. JUNE 2003
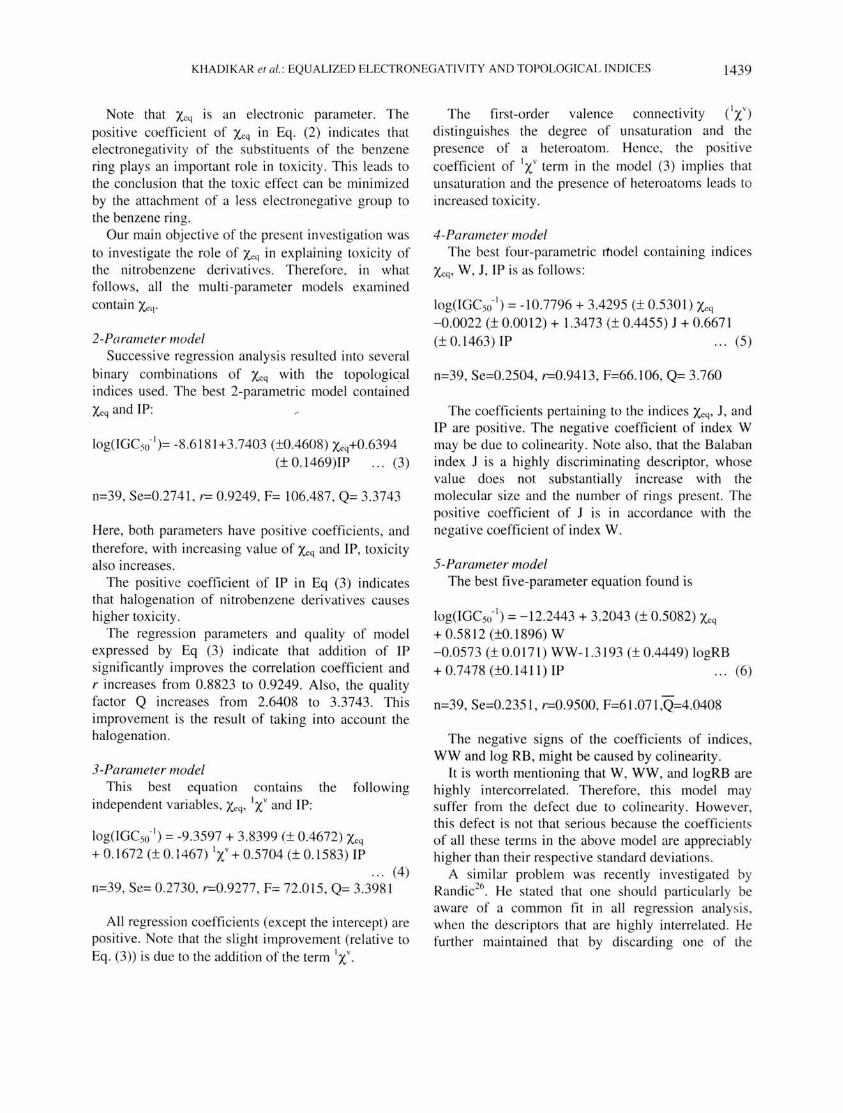
Table 4-Cross-validation parameters
Model Parameter PRESS SSY PRESS/ r2cv R2A Sprcss PSE SSY
1 Xcq 4. 1289 14.5774 0.2832 0.7168 0.3341 0.3254 CEq 12) 2 Xcq,IP 1 2.7048 16.001 5 0.1690 0.8310 0.8474 0.2741 0 .2634 CEq 13) 3 Xcq.1 X:v. IP 2.6080 16.0983 0. 1620 0.8380 0.8486 0.2730 0.2586 CEq 14) 3 Xcq.W.J.lP 2. 13 12 16.575 1 0.1 286 0.8714 0.8727 0.2504 0.2338 CEq 15) 4 Xcq.W.WW. 1. 8244 16.88 19 0 .1080 0.8919 0.8877 0.235 1 0.2 163 CEq 16) logRB,IP
descriptors that duplicates another (i n one domain) we may discard a descriptor that may carry useful structural information in another domain, in which it does not parallel with other descriptors . Bearing this in mind, we conclude that the highly correlated topological indices W, WW, and 10gRB may be retained and that their simultaneous presence (as in Eq. (6» need not be unjustified.
Predictive potential It is worth noting that regression equations with
excellent correlation coefficients need not have excellent predictive potential. Hence, one has to determine the predictive potential of the model s, too. Cross-validation is the most appropriate method for this. 31 .32
In the present case we have estimated crossvalidation parameters31 .32 for all the five proposed models and these are recorded in Table 4
PRESS (predicted residual sum squares) is a good estimate of the real predictive error of the model. If PRESS is smaller than the sum of the squares of the response values (SSY), then the model predicts better than chance and can be considered statistically significant.
A perusal of Table 4 shows that in all the five cases PRESS«SSY indicating them to be statistically significant. This provides an additional proof in favour of retaining highly correlated parameters in the proposed models.
The ratio PRESS/SSY can be used to estimate the confidence interval of the predicted toxicity.32.33 To have a reliable QSAR and QSTR model, this ratio should be smaller than 0.4. A value of this ratio less than 0.1 indicates that we have a reasonably good model. For Eq. (6) the value of PRESS/SSY is about
0.1. In other cases PRESS/SSY was found to be less than 0.4 and therefore, these equations are also reasonable QSARlQSTR models.
The overall predictive ability is obtained from the highest r 2cv (cross-val idation correlation coefficient) values. In our case r 2cv is found to be the highest for the model 5 (Eq. (6», indicating again that it has an excellent predicti ve potential.
Another cross-validation parameter used fo r deciding predictive potential is uncertainity of prediction, SPRESS. However in the present case (Table 4), SPRESS is found to be the same as the standard error of estimation (Se).
Perusal of Table 4 shows that PSE, i.e. the predictive squared error, can be used successfully fo r deciding uncertainty of the prediction. The ' PSE is found to be the lowest for the model 5 (Eq. (6) showing that this modei has excellent correlation as well as predictive potential.
At this stage it is interesting to comment upon adjustable R2 (R2
A) coefficients . R2A takes into account the adjustment of R2. R2 A is a measure of the % explained variation in the dependent variable that takes into account the relationship between the number of cases and number of independent variables in the regression model. Whereas R2 always increases when an independent variable is added, R2A will decrease if the added variable does not reduce the unexplained variation enough to offset the loss of degrees of freedom. Therefore, if a variable is added that does not contribute its fair share, the R2A will actually decline. In our case (Table 4), R2A increases with increasing number of parameters. This indicates that the new parameter(s) has a fair share in the proposed model. It should be noted that coefficient R2
KHADIKAR et al.: EQUALIZED ELECTRONEGATIVITY AND TOPOLOGICAL INDICES 1441
may appear artificially high if the number of variables is high compared to the sample size.
Hence, both R2 and R2 A indicate that the derived equations of toxicity of nitrobenzene derivatives are significant at confidence level p<O.05.
References I Karcher I N & Devillers J, Practical applications of
quantitative structure-activity relationships (QSA R) in environmelltal chemistry and toxicology, (Kluwer Academic, Dordrecht), 1990.
2 Lewis D F V, CompLller-assisted methods in the evaillatioll of chemical toxicity in Rev comp Chem, Vol. III, (VCH , New York) .
3 Khadikar P V, Phadnis A & Shrivastava A, Bioorg med Chem, 10 (2002) I 18 1.
4 Khadikar P V. Mathur K C, Sigh S, Phadni s A, Shrivastava A & Mandloi M, Bioorg med Chem, 10 (2002) 1761 .
5 Khadikar P V, Karmarkar S, Singh S & Shrivastava A. Bioorg med Chem, 10 (2002) 3163.
6 Agrawal V K & Khadikar P V, Bioorg med Chem, 10 (2002) 35 17.
7 Agrawal V K & Khadikar P V, Bioorg med Chem, 9 (2001) 3035.
8 Karmarkar S, Saxena A, Varma R G, Mathur K C, Mathur S, Singh S & Khadikar P V, Poll Res, 19 (2000) 337.
9 Karolson M, Molecular descriptors in QSARlQSPR, (Wiley, ew York) 2000.
10 Cronin M T D & Shultz J W, Chem res Toxicol, 14 (2001) 1284.
11 Trinajstic N, Chemical graph theory, (C RC, Boca Raton), 1992.
12 Guman I & Polansky 0 E, Mathematical collcepts in organic chemistry, (Springer-Verlag, Berlin), 1986.
13 Pauling L, Th e nature of the chemical bond, (Cornell Univ
Press, Itacha, New York) 1969. 14 Wells P R, Progress in physical organic chemistry, vol.6,
(Interscience, New York), 1968. 15 Agrawal V K, Joseph S, Khadikar P V & Karmarkar S, Acta
Pharm, 50 (2000) 329. 16 Agrawal V K & Khadikar P V, Oxid Commun, 25 (2002)
184. 17 Agrawal V K & Khadikar P V, Bulg chem Commun (In
press). 18 Agrawal V K, Joseph S & Khadikar P V, Nat Acad Sci
Letter, 23 (2000) 57. 19 Wiener H, JAm chem Soc, 69 ( 1947) 17. 20 Randic M, Chem Phys Lett, 211 ( 1993) 478. 2 1 Lukovits I, j chem Inf Comput Sci, 34 ( 1994) 1079. 22 Lukovits I, A formula for the Hyper- Wiener illdex in QSAR
and molecular modeling: Concepts in compLIIQtionai tools and biological applications, edited by F Sanz, J Giraldo & F Manaut (Prous Science, Barcelona) 1995.
23 Lukovits I, CompLII Chem, 19 ( 1995) 27. 24 Gutman I, Linert W, Lukovits I & Dobrynin A A, J chemlnf
CompUl Sci, 37(1997)349. 25 Lukovits I & Linert W, J chem InfComp ut Sci, 34( 1994)899. 26 Randic M, Croat chem Acta, 66 ( 1993) 289. 27 Balaban A T , Chem Phys Letl, 89 ( 1982) 399. 28 Kier L B & Hall L H, Molecular connectivity in chemistry
and drug research, (Academic Press, New York), 1976. 29 Todeschini R & Consonni V, Handbook of molecular
descriptors, (Wi ley-VCH, Weinheim), 2000. 30 Cronin M T D, Gregory B W & Shultz J W, Chem Res
Toxicol, II ( 1998) 902. 31 Box G E B, Hunter W G & Hunter J S , Statistics for
experiments, (Wi ley, New York), 1978. 32 Chatterji S, Hadi A S & Price B, Regression analysis by
examples, (Wiley, New York), 2000. 33 Pogliani L, Amino acids, 6 (1994) 141. 34 Estrada E & Uriarte E, SAR QSAR environ Res, 12 (2001 )
309.


![Strategic Analysis Of Managem...Stry And Bcg 040711 Final[1]](https://img.pdfslide.net/doc/110x75/55682cb2d8b42ab7198b4c09/strategic-analysis-of-managemstry-and-bcg-040711-final1.jpg)