Embed Size (px)
Citation preview
United StatesDepartment ofAgriculture
Forest Service
ForestProductsLaboratory
ResearchNoteFPL-RN-0268
Equilibrium MoistureContent of Wood inOutdoor Locationsin the United Statesand WorldwideWilliam T. Simpson

AbstractWith relative humidity and temperature data from theNational Oceanic and Atmospheric Administration, theaverage equilibrium moisture content for each month of theyear was calculated for 262 locations in the United Statesand 122 locations outside the United States. As an aid forstorage of kiln-dried lumber, a graph is presented for deter-mining the reduction in equilibrium moisture content thatresults from heating air in an enclosed storage space abovethe temperature of the outside air.
Keywords: Equilibrium moisture content, lumber storage,drying
August 1998
Simpson, William T. 1998. Equilibrium moisture content of wood in outdoorlocations in the United States and worldwide. Res. Note FPL-RN-0268.Madison, WI: U.S. Department of Agriculture, Forest Service, ForestProducts Laboratory. 11 p.
A limited number of free copies of this publication are available to thepublic from the Forest Products Laboratory, One Gifford Pinchot Drive,Madison, WI 53705-2398. Laboratory publications are sent to hundredsof libraries in the United States and elsewhere.
The Forest Products Laboratory is maintained in cooperation with theUniversity of Wisconsin.
The use of trade or firm names is for information only and does not implyendorsement by the U.S. Department of Agriculture of any product orservice.
The United States Department of Agriculture (USDA) prohibits discrimi-nation in all its programs and activities on the basis of race, color, nationalorigin, gender, religion, age, disability, political beliefs, sexual orientation,or marital or familial status. (Not all prohibited bases apply to all pro-grams.) Persons with disabilities who require alternative means for com-munication of program information (braille, large print, audiotape, etc.)should contact the USDA’s TARGET Center at (202) 720-2600 (voice andTDD). To file a complaint of discrimination, write USDA, Director, Officeof Civil Rights, Room 326-W, Whitten Building, 14th and IndependenceAvenue, SW, Washington, DC 20250-9410, or call (202) 720-5964 (voiceand TDD). USDA is an equal employment opportunity employer.

United StatesDepartment ofAgriculture Equilibrium MoistureForest Service
Forest Content of Wood inProductsLaboratory
Research Outdoor LocationsNoteFPL–RN-268 in the United States
and WorldwideWilliam T. Simpson
On Page 1, the equation in column 2 should read
On Page 2, the last line in column 2 should read
“. . . to 7%, a temperature rise of 20°F (11°C) is necessary.”

Equilibrium Moisture Content ofWood in Outdoor Locations in theUnited States and Worldwide
William T. Simpson, Research Forest Products TechnologistForest Products Laboratory, Madison, Wisconsin
IntroductionThe moisture content of wood depends on the relativehumidity and temperature of the air surrounding it. If woodremains long enough in air where the relative humidity andtemperature remain constant, the moisture content will alsobecome constant at a value known as the equilibrium mois-ture content (EMC). Thus, every combination of relativehumidity and temperature has an associated EMC value.The EMC increases with increasing relative humidity andwith decreasing temperature.
If we know the relative humidity and temperature, and there-fore the EMC, of any location where lumber or other woodproducts are stored, we have useful information relevant toair drying of lumber, storage of dried lumber, and optimummoisture content of lumber for use in finished wood prod-ucts. Low EMCs accelerate air drying, which is often advan-tageous but can be a detriment if a species that is susceptibleto surface checking, such as oak, dries too quickly early inthe drying process. Kiln-dried lumber that is stored in highEMC conditions can regain moisture, thus negating part ofthe results of drying and possibly creating a high moisturecontent that will adversely affect the performance of a finishedwood product. If we knew the EMC of the prospective loca-tion of a finished wood product, we ideally could dry lumberto that moisture content and maintain that moisture contentall the way through manufacture of the product. This idealsituation is not often possible in practice, but knowledge ofthe ideal EMC may sometimes be beneficial if for no otherreason than to provide an explanation for poor performanceand point out the necessity for a remedy.
The purpose of this note is to provide a list of locations,both within and outside the United States, with the mean
Equilibrium Moisture Contentat U.S. LocationsThe dependence of EMC on relative humidity and tempera-tures between 30°F and 150°F (–1.1°C and 65.6°C) isshown in Table 1 (Forest Products Laboratory 1987). Thedata in Table 1 are limited to only a small fraction of allpossible combinations of temperature and relative humidity.Intermediate EMCs can be calculated with the followingequations (Simpson 1973, Forest Products Laboratory1987):
where T is temperature, h is relative humidity (%/100),EMC is moisture content (%), and W, K, K1, and K2 arecoefficients of an adsorption model developed by Hailwoodand Horrobin (1946).
For temperature in Fahrenheit,
and for temperature in Celsius,
monthly EMC values of wood exposed to the outdoor
A secondary purpose is to provide easy to use information onthe decrease in relative humidity, and thus EMC, that resultsfrom raising the temperature of an enclosed storage space
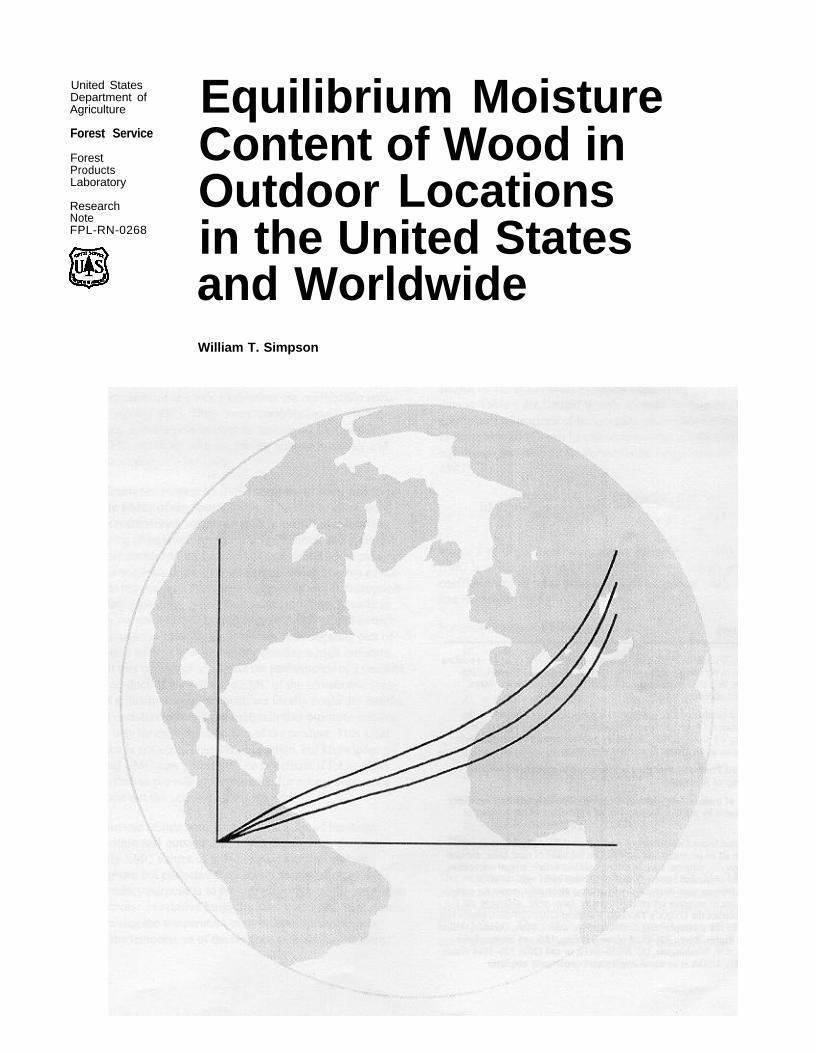
atmosphere but protected from direct precipitation or sun. The average EMC for each month is shown in Table 2 for262 locations in the United States, Puerto Rico, and PacificIsland territories and in Table 3 for 122 locations outside theUnited States. The EMCs in Tables 2 and 3 were calculated,
above the temperature of the outdoor ambient temperature. using the above equations, from relative humidity and

temperature data available from the National Climatic DataCenter (NCDC), National Oceanic and Atmospheric Admini-stration (NOAA). Most of the data in Table 2 was fromNCDC (1997), but 15 of the locations were from Wallis(1977). The tabulated relative humidities are the monthlyaverages of the daily morning and afternoon values. For thepurpose of the EMC calculations, the morning and afternoonvalues were averaged. The temperature values are themonthly averages of the normal daily temperatures. Most ofthe NOAA relative humidity and temperature data is basedon at least 30 years of observation. The EMCs in Table 3were calculated from relative humidities that were derivedfrom air and dew point temperatures (USA Today 1998;original data from NCDC). Relative humidity is the ratio ofvapor pressure at the dew point temperature to vapor pressureat the air temperature. A least-squares relationship to calcu-late vapor pressure from temperature was developed from thedata of Hawkins (1978):
for vapor pressure in inches of mercury and temperature inFahrenheit, and
for vapor pressure in pascals and temperature in Celsius.
Several factors should be noted about the EMC data inTables 2 and 3. Wood exhibits hysteresis, which means thatif wood comes to equilibrium at a given relative humidityand temperature, the EMC will be slightly higher if thisequilibrium is reached by losing moisture than it would be ifit reaches equilibrium by gaining moisture. In the extreme,this effect can be as much as 3% moisture content. However,the EMC database used in this analysis was obtained ex-perimentally under relative humidity conditions that oscil-lated slightly. This tended to establish EMCs intermediatebetween the two hysteresis extremes (Stamm and Loughbor-ough 1935) and means they can be considered reasonableestimates for practical applications. A second factor is thatthe EMC data in Table 1 does not extend below 30°F(-1.1°C), but some of the locations in Tables 2 and 3 havewinter temperatures below this level. This raises thequestion of the validity of the extrapolation to below 30°F.Hedlin (1967) showed evidence that EMC data at 10°F(-12.2°C) are approximately what would be expected byextrapolating from values above 30°F. So, it seems valid toassume that the extrapolated EMCs are reasonable approxi-mations. The third factor of concern is that the EMC values,especially at high relative humidities, of wood species with ahigh extractive content are lower than species with little orno extractives. Some tropical hardwoods exhibit thisbehavior (Spalt 1958, Wangaard and Granados 1967).
Western redcedar and redwood are two native continentalU.S. species that might be affected by this factor (Spalt 1958,Salamon and others 1975). However, high extractive contentheartwood is likely to be more prevalent in old-growthtimber, and with the current trend to harvest younger growthtimber, extractive content in wood may no longer be as high.
Tables 2 and 3 show the wide variability in EMC as affectedby location and month. For example, the EMC in Phoenix,Arizona, in June is only 4.6%, while the EMC in Eugene,Oregon, in December is 20.2%. In Fresno, California, theEMC varies from 7.8% in July to 16.6% in December—awide range that will cause a large variation in moisturecontent of wood products from summer to winter. At theother extreme, the EMC in Little Rock, Arkansas, variesthroughout the year by only about 1% EMC—from 12.8%in March to 13.9% in September and December.
Lowering EquilibriumMoisture Content for StorageIt is not uncommon for lumber to be kiln dried to 6% to 8%moisture content and then stored in a protected but unheatedarea where the relative humidity is such that the EMC ishigher than 6% to 8%. If the EMC is high enough and stor-age is long enough, the lumber can increase in moisturecontent, which can create problems in product manufacture orperformance of an end product. There are several ways tominimize this problem, including wrapping the lumber in amoisture barrier or storing it in an air-conditioned facility.One simple and not too costly method to lower EMC in anenclosed space is by simply raising the temperature abovethe outside ambient air temperature—easily controlled by adifferential thermostat. Alternatively, a humidistat can beused to control a heating system.
When inside temperature is raised above outside temperaturewithout adding any moisture to the inside air, the relativehumidity of the inside air is reduced. This is because thespecific humidity (the mass of water per unit mass of dry air)of the air remains the same when its temperature is raised,but the capacity of the air to hold moisture increases astemperature increases, therefore lowering relative humidity.Figure 1 shows the effect on EMC of raising inside tempera-ture above outside ambient temperature. Calculations weremade using the psychometric equations given in Hawkins(1978).
The graph applies to all outside ambient air temperaturesfrom 30°F to 90°F (–1.1°C to 32.2°C). For example, ifoutside EMC is 14%, Fig. 1 indicates that to reduce EMCto 7%, a temperature rise of 20°F (–6.7°C) is necessary.

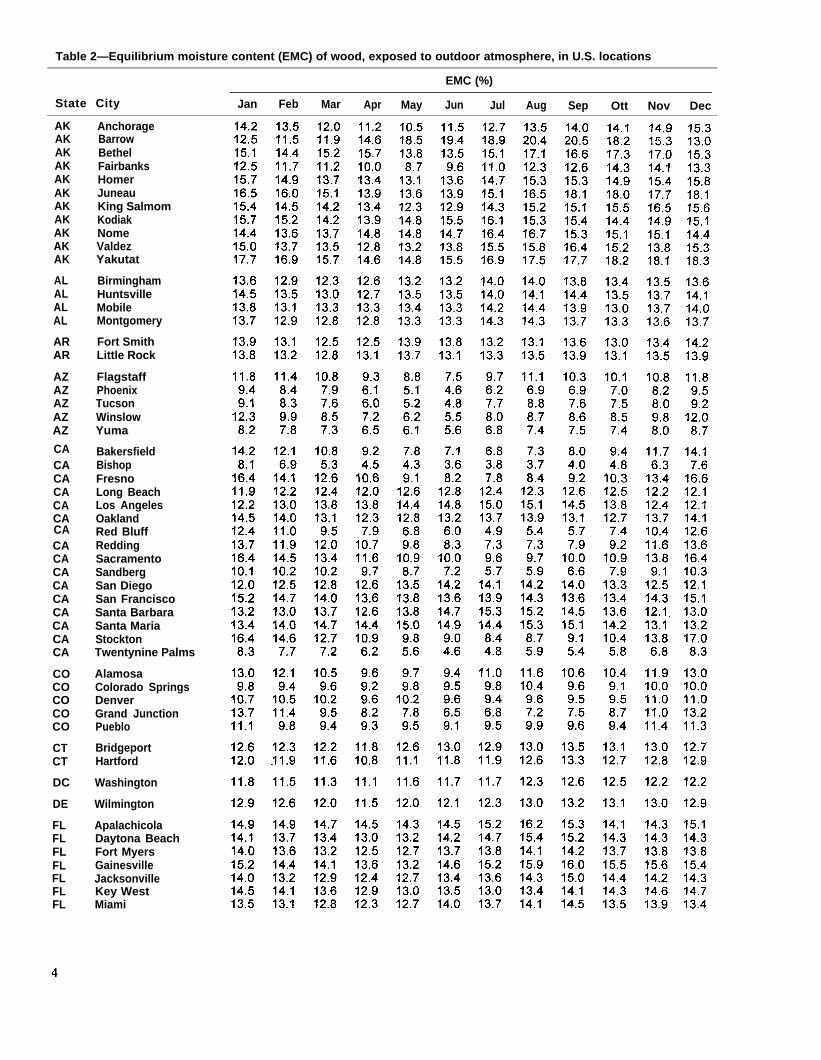
Table 2—Equilibrium moisture content (EMC) of wood, exposed to outdoor atmosphere, in U.S. locations
EMC (%)
State City Jan Feb Mar Apr May Jun Jul Aug Sep Ott Nov Dec
CA
AKAKAKAKAKAKAKAKAKAKAK
ALALALAL
ARAR
AZAZAZAZAZ
CACACACACA
CACACACACACACACACA
COCOCOCOCO
CTCT
DC
DE
FLFLFLFLFLFLFL
AnchorageBarrowBethelFairbanksHomerJuneauKing SalmomKodiakNomeValdezYakutat
BirminghamHuntsvilleMobileMontgomery
Fort SmithLittle Rock
FlagstaffPhoenixTucsonWinslowYuma
BakersfieldBishopFresnoLong BeachLos AngelesOaklandRed BluffReddingSacramentoSandbergSan DiegoSan FranciscoSanta BarbaraSanta MariaStocktonTwentynine Palms
AlamosaColorado SpringsDenverGrand JunctionPueblo
BridgeportHartford
Washington
Wilmington
ApalachicolaDaytona BeachFort MyersGainesvilleJacksonvilleKey WestMiami
CA

Table 2—Equilibrium moisture content (EMC) of wood, exposed to outdoor atmosphere, in U.S. locations-con.
EMC (%)
State City Jan Feb Mar Apr May Jun Jul Aug Sep Oct Nov Dec
FLFLFLFLFLFL
GAGAGAGAGAGAGA
HIHIHIHI
IAIAIAIA
IDIDID
ILILILILILIL
ININININ
KSKSKSKSKS
KYKYKYKYKY
LALALALA
MAMAMA
MD
OrlandoPensacolaTallahasseeTampaVero BeachWest Palm Beach
AthensAtlantaAugustaColumbusMaconRomeSavannah
HiloHonoluluKahuluiLihue
Des MoinesDubuqueSioux CityWaterloo
BoiseLewistonPocatello
CairoChicagoMolinePeoriaRockfordSpringfield
EvansvilleFort WayneIndianapolisSouth Bend
ConcordiaDodge CityGoodlandTopekaWichita
CovingtonJacksonLexingtonLouisvillePaducah
AlexandriaBaton RougeLake CharlesNew OrleansShreveport
Blue HillBostonWorcester
Baltimore
LA

Table 2—Equilibrium moisture content (EMC) of wood, exposed to outdoor atmosphere, in U.S. locations—con.
EMC (%)
State City Jan Feb Mar Apr May Jun Jul Aug Sep Oct Nov Dec
MEME
MlMlMlMlMlMlMlMlMl
MNMNMNMNMN
MOMOMOMO
MSMSMS
MTMTMTMTMTMTMTMT
NCNCNCNCNCNC
NDNDND
NENENENENENENE
NHNH
NJNJ
CaribouPortland
AlpenaDetroitFlintGrand RapidsHoughton LakeLansingMarquetteMuskegonSault Ste. Marie
DuluthInternational FallsMinneapolis–St. PaulRochesterSaint Cloud
ColumbiaKansas CitySt. LouisSpringfield
JacksonMeridianTupelo
BillingsGlasgowGreat FallsHavreHelenaKalispellMiles CityMissoula
AshevilleCape HatterasCharlotteGreensboroRaleighWilmington
BismarckFargoWilliston
Grand IslandLincolnNorfolkNorth PlatteOmahaScottsbluffValentine
ConcordMt. Washington
Atlantic CityNewark

Table 2—Equilibrium moisture content (EMC) of wood, exposed to outdoor atmosphere, in U.S. locations-con.
EMC (%)
State City Jan Feb Mar Apr May Jun Jul Aug. Sep Oct Nov Dec
NMNMNM
NVNVNVNVNV
NYNYNYNYNYNYNY
OHOH
OHOHOHOHOH
OKOK
OR
OROR
OROR
PAPAPAPAPAPAPA
PCPCPCPCPCPCPC
PR
RI
SCSCSC
AlbuquerqueClaytonRoswell
ElkoElyLas VegasRenoWinnemucca
AlbanyBinghamtonBuffaloIslipNew YorkRochesterSyracuse
AkronCincinnatiClevelandColumbusDaytonMansfieldToledoYoungstown
Oklahoma CityTulsa
AstoriaBurnsEugeneMedfordPendletonPortlandSalem
AllentownAvocaErieHarrisburgPhiladelphiaPittsburgWilliamsport
GuamKororMarshall IslandsPago PagoEast Caroline Is.Wake IslandWest Caroline Is.
San Juan
Providence
CharlestonColumbiaGreenville

Table 2—Equilibrium moisture content (EMC) of wood, exposed to outdoor atmosphere, in U.S. Iocations-con.
EMC (%)
State City Jan Feb Mar Apr May Jun Jul Aug Sep O c t N o v Dec
SDSDSDSD
TNTNTNTNTN
TXTXTXTXTXTXTXTXTXTXTXTXTXTXTXTXTX
UTUTUT
VT
VAVAVAVAVA
WAWAWAWAWA
WIWIWIWI
WVWVWVWVWV
WYWYWYWY
AberdeenHuronRapid CitySioux Falls
Bristol-Johnson CityChattanoogaKnoxvilleMemphisNashville
AbileneAmarilloAustinBrownsvilleCorpus ChristiDallas–Ft. WorthDel RioEl PasoHoustonLubbockMidland–OdessaPort ArthurSan AngeloSan AntonioVictoriaWacoWichita Falls
MilfordSalt Lake CityWendover
Burlington
LynchburgNorfolkRichmondRoanokeWallops Island
OlympiaQuillayuteSeattle–TacomaSpokaneYakima
Green BayLa CrosseMadisonMilwaukee
BeckleyCharlestonElkinsHuntingtonParkersburg
CasperCheyenneLanderSheridan
Table 3—Equilibrium moisture content (EMC) of wood, exposed to outdoor atmosphere, in locations outside U.S.
EMC (%)
Country City Jan Feb Mar Apr May Jun Jul Aug Sep Oct NO V Dec
ArgentinaAustraliaAustraliaAustraliaAustraliaAustriaBahamasBelgiumBelgiumBermudaBolivaBosniaBrazilBrazilBrazilCanadaCanadaCanadaCanadaCanadaCanadaCanadaCanadaCanadaCanadaCanadaCanadaCanadaChileChinaChinaChinaColombiaColombiaCzech RepublicDenmarkEgyptEnglandEnglandEnglandEnglandEnglandEnglandEquadorEthiopiaFinlandFranceFranceFranceFranceFranceGermanyGhanaGrand CaymanGreeceIndiaIndiaIndiaIndiaIndonesiaIraq
Buenos AiresHobart, TSMelbournePerthSydneyViennaNassauAntwerpBrusselsHamiltonLa PazTuzlaBrasiliaRio De JaneiroSao PauloCalgary, ABChurchill, MNEdmonton, ABHalifax, NSMontreal, ONMould Bay, NTQuebec, QBSt. John, NBSt. John’s, NFToronto, ONVancouver, BCWinnipeg, MNYellowknife, NTSantiagoBeijingHong KongShanghaiBarranquillaBogotaPragueCopenhagenAlexandriaBirminghamLeedsLiverpoolLondonNewcastlePlymouthQuitoAddis AbabaHelsinkiBordeauxBrestMarseilleNiceParisBerlinAccraGeorge TownAthensBombayCalcuttaMadrasNew DelhiJakartaBaghdad
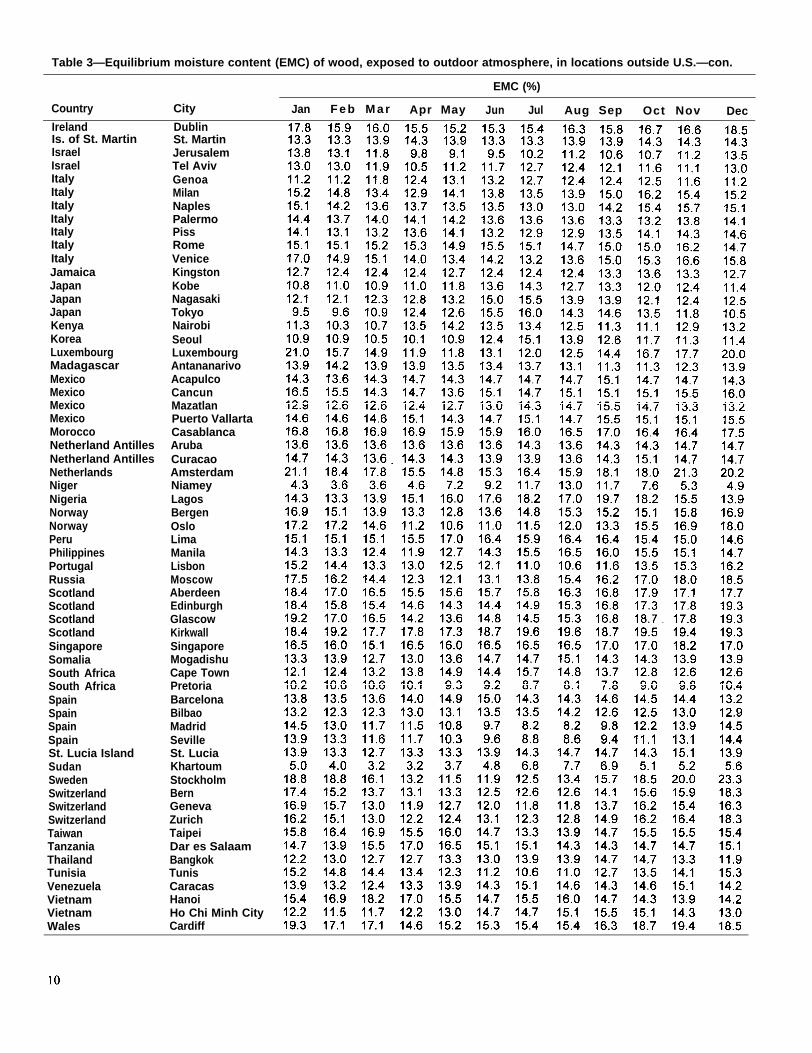
Table 3—Equilibrium moisture content (EMC) of wood, exposed to outdoor atmosphere, in locations outside U.S.—con.
St. MartinJerusalemTel AvivGenoaMilanNaplesPalermoPissRomeVeniceKingstonKobeNagasakiTokyoNairobiSeoulLuxembourgAntananarivoAcapulcoCancunMazatlanPuerto VallartaCasablancaArubaCuracaoAmsterdamNiameyLagosBergenOsloLimaManilaLisbonMoscowAberdeenEdinburghGlascowKirkwallSingaporeMogadishuCape TownPretoriaBarcelonaBilbaoMadridSevilleSt. LuciaKhartoumStockholmBernGenevaZurichTaipeiDar es SalaamBangkokTunisCaracasHanoiHo Chi Minh City
EMC (%)
Country City Jan F e b M a r Apr May Jun Jul Aug Sep Oct Nov DecIreland DublinIs. of St. MartinIsraelIsraelItalyItalyItalyItalyItalyItalyItalyJamaicaJapanJapanJapanKenyaKoreaLuxembourgMadagascarMexicoMexicoMexicoMexicoMoroccoNetherland AntillesNetherland AntillesNetherlandsNigerNigeriaNorwayNorwayPeruPhilippinesPortugalRussiaScotlandScotlandScotlandScotlandSingaporeSomaliaSouth AfricaSouth AfricaSpainSpainSpainSpainSt. Lucia IslandSudanSwedenSwitzerlandSwitzerlandSwitzerlandTaiwanTanzaniaThailandTunisiaVenezuelaVietnamVietnamWales Cardiff

Degrees above ambient (°F)
Degrees above ambient (°C)
Figure l—Equilibrium moisture content (EMC) of wood when air inan enclosed space is heated above the temperature of the outsideambient air: (a) in Fahrenheit, (b) in Celsius.