Embed Size (px)
Citation preview

OWI‐Consulting IncOnsite With Insight
David M. JonesOWI-Consulting Inc
Email: [email protected]/fax: 610-383-5091
Cell: 201-264-5173
FLUIDIZED BED SPRAY GRANULATION:
Equipment and Processing Considerations

Topics of the Presentation
Equipment description Application considerations Process and product variables Sequence of operations An example Summary
Graphics courtesy of Glatt Air Techniques, Inc., Ramsey, NJ
OWI‐Consulting IncOnsite With Insight
Why consider fluid bed spray
granulation?

OWI‐Consulting IncOnsite With Insight
Attributes of Fluid Bed Spray Granulation
1. High rates of heat and mass transferA. Quantity of liquid is immaterialB. Control of in-process moisture contentC. Water or organic solvents are possible
2. Excellent mixingA. As a solid, added to the product
containerB. As a liquid, sprayed onto the substrate
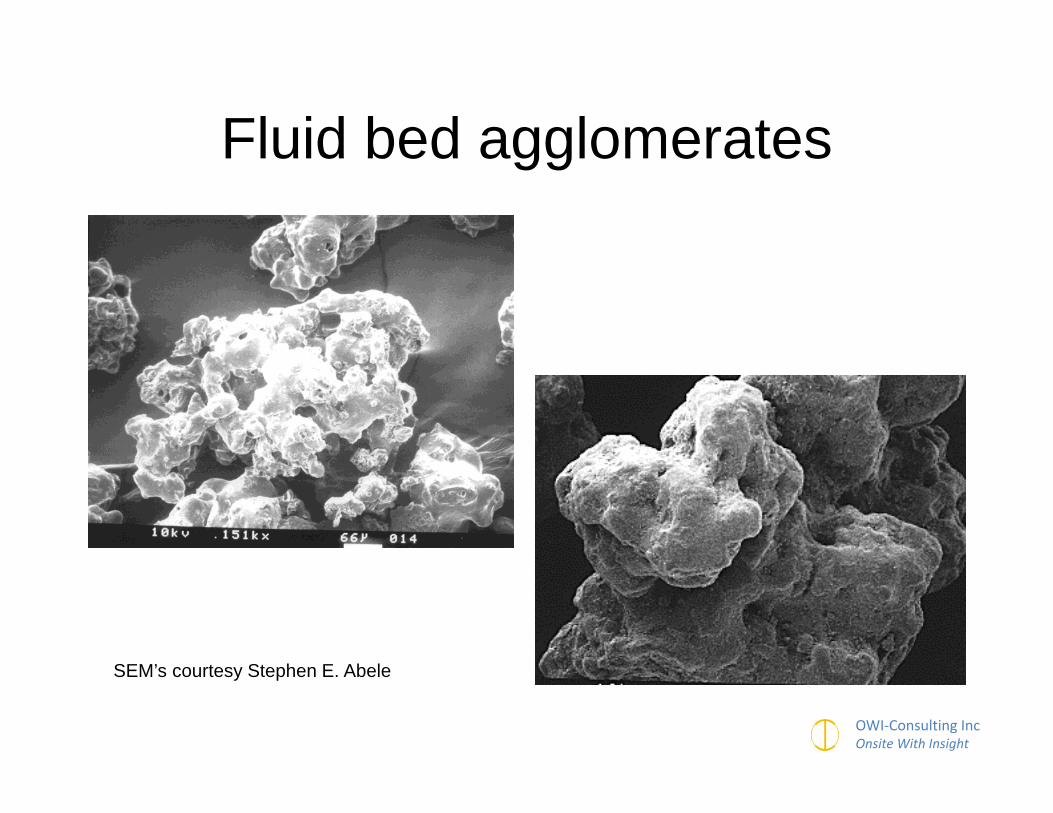
3. Porosity of agglomerates yields high wettable surface area
OWI‐Consulting IncOnsite With Insight
Fluid bed agglomerates
SEM’s courtesy Stephen E. Abele

OWI‐Consulting IncOnsite With Insight
A Typical Fluid Bed Spray Granulator Installation
Utility“GMP”
Inlet and exhaust air handling
OWI‐Consulting IncOnsite With Insight
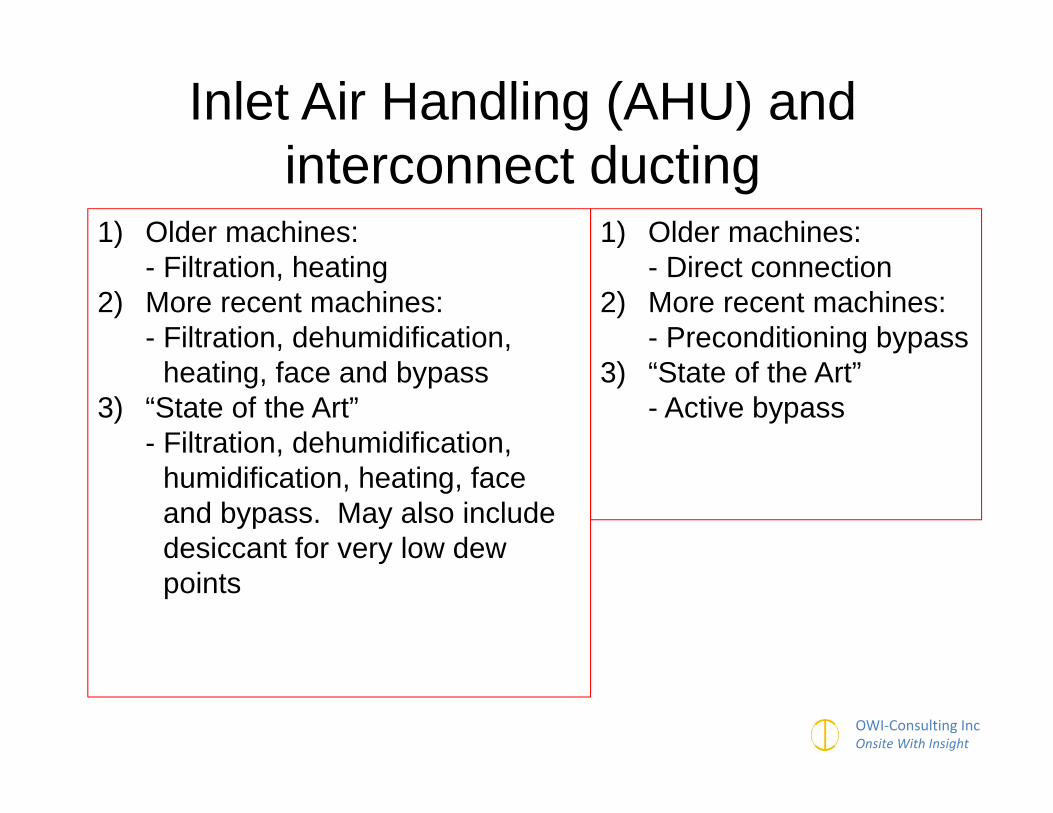
Inlet Air Handling (AHU) and interconnect ducting
1) Older machines: - Filtration, heating
2) More recent machines: - Filtration, dehumidification,
heating, face and bypass3) “State of the Art”
- Filtration, dehumidification, humidification, heating, face and bypass. May also include desiccant for very low dew points
1) Older machines: - Direct connection
2) More recent machines: - Preconditioning bypass
3) “State of the Art”- Active bypass

OWI‐Consulting IncOnsite With Insight
The Machine Tower Components
Inlet duct and lower plenum
Outlet filter housing
Expansion chamber
Product container
Spray nozzle wand

OWI‐Consulting IncOnsite With Insight
The Machine Tower Components
Product container

OWI‐Consulting IncOnsite With Insight
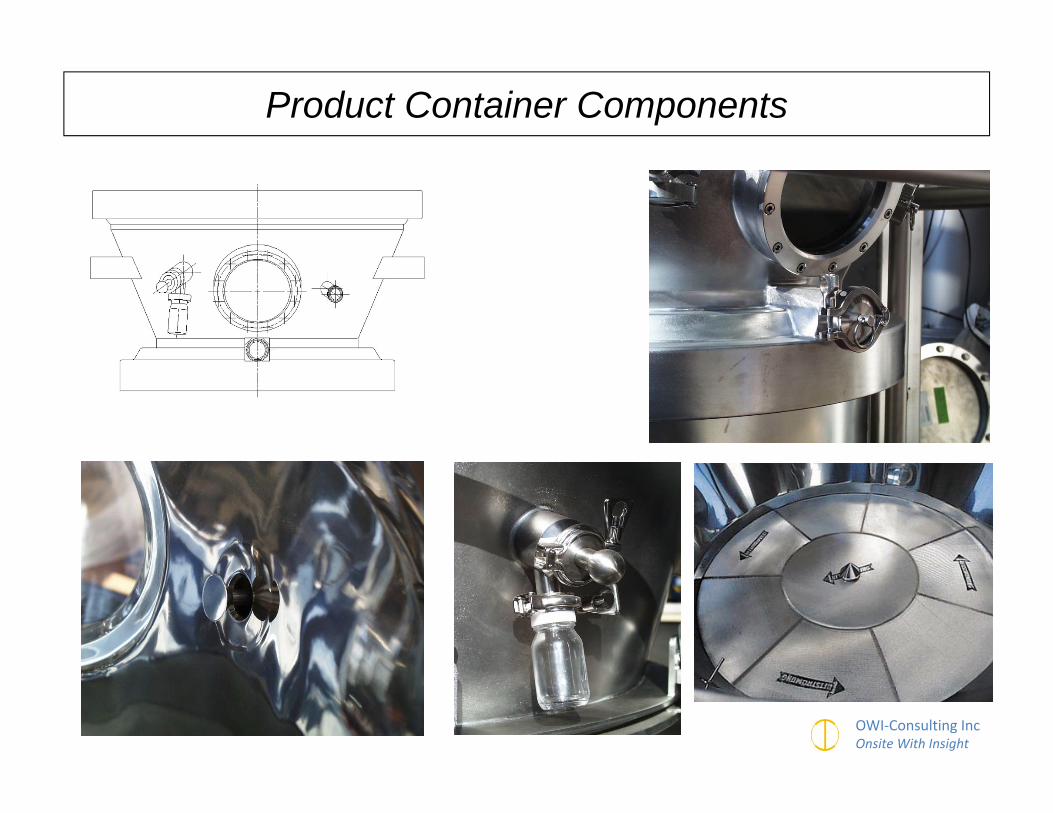
The screen retains the product, and must be strong. The rods hold the screen in place (against the strong suction of the fan).
The product container may be comprised of several components
The distributor plate provides resistance to help distribute air flow across the base of the product container. It also supports the retention screen and product.
OWI‐Consulting IncOnsite With Insight
Product Container Components

OWI‐Consulting IncOnsite With Insight
The Machine Tower ComponentsExpansion chamber
Spray nozzle wand
The spray nozzle wand is mounted in the expansion chamber, spraying downward. Make sure that the pump has the capability of pumping the binder solution at the rate at which it is needed.

OWI‐Consulting IncOnsite With Insight
The Machine Tower ComponentsOutlet filter housing

OWI‐Consulting IncOnsite With Insight
The Machine Tower ComponentsThe vast majority of fluid bed systems incorporate the use of fabric filters (as shown). The two dominant considerations are:A. Porosity (the size of the
openings in the fabric)B. Permeability (the number of
openings per unit area
However: there is NO standardized test for determining this behavior, and periodically, fabrics are discontinued.

OWI‐Consulting IncOnsite With Insight
0 20 40 60 80
Filter Differential Pressure (mm water)
1
2
3
4
5
6
7
8
9
10
11
Duc
t Vel
ocity
(m/s
ec)
PB 3% (50)PB 2% (20)T 165 P (20)Nadelfilz 3451/01 BR(10)K22 1103 (25)1893 (10)Nadelfilz TW 452 (7)WECO T15E (48)PES 9373 (3-5)
Filter Material PermeabilityVarious fabrics - duct velocity vs. filter pressure
Filter Fabric - Performance

OWI‐Consulting IncOnsite With Insight
Any questions related to the equipment?

OWI‐Consulting IncOnsite With Insight
Fluidized Bed Spray Granulation:
The Unit Operations
OWI‐Consulting IncOnsite With Insight
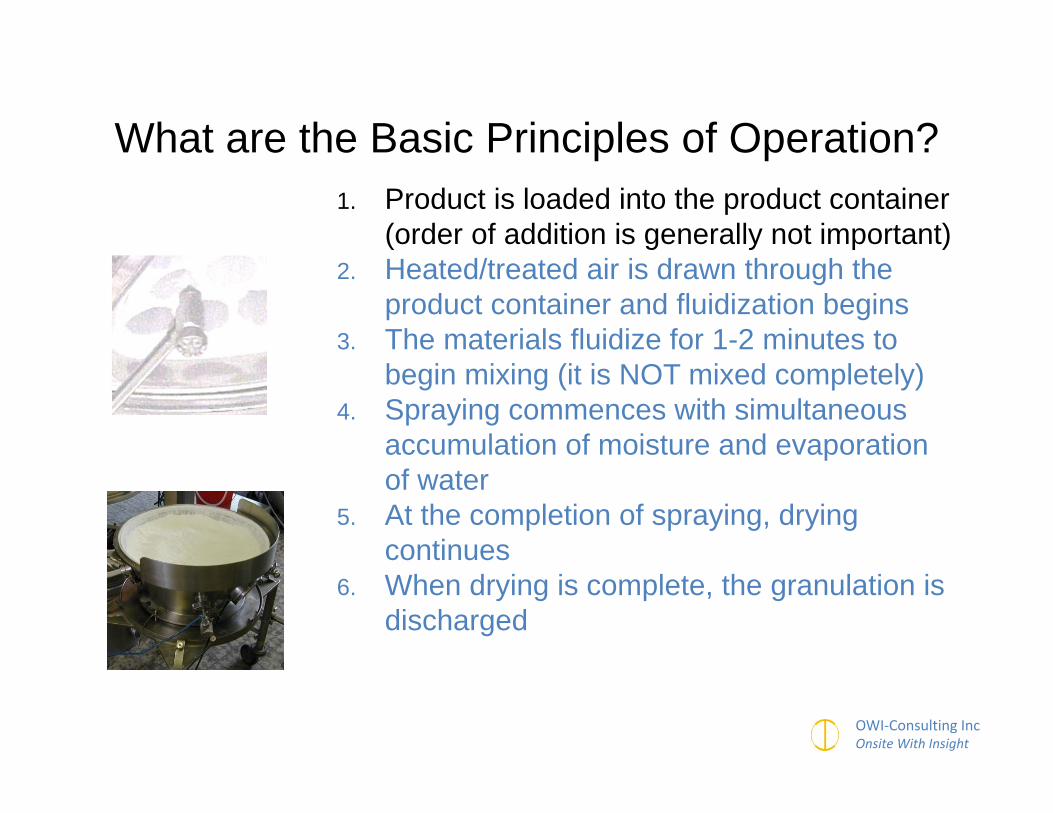
What are the Basic Principles of Operation?1. Product is loaded into the product container
(order of addition is generally not important)2. Heated/treated air is drawn through the
product container and fluidization begins3. The materials fluidize for 1-2 minutes to
begin mixing (it is NOT mixed completely)4. Spraying commences with simultaneous
accumulation of moisture and evaporation of water
5. At the completion of spraying, drying continues
6. When drying is complete, the granulation is discharged

Product – What Goes Where?1. Product is loaded into the product container
(order of addition is generally not important)
Granulation components:API (if >1% of the mix)Bulking agentsDisintegrants
Spray components:API (if <1% of the mix)BinderWater
Blending components:LubricantsExtra-granular excipients
(Product container)
(Liquid vessel)
(Blended externally)

OWI‐Consulting IncOnsite With Insight
What are the Basic Principles of Operation?1. Product is loaded into the product container
(order of addition is generally not important)2. Heated/treated air is drawn through the
product container and fluidization begins3. The materials fluidize for 1-2 minutes to
begin mixing (it is NOT mixed completely)4. Spraying commences with simultaneous
accumulation of moisture and evaporation of water
5. At the completion of spraying, drying continues
6. When drying is complete, the granulation is discharged

Process ParametersProcess Air Spraying Other
Ambient Air Dew Point Spray rate Bed Depth
Dehumidifier Dew Point Atomizing Air Pressure Batch Size
Pre-heater Temperature Atomizing Air Volume Outlet Filter Media
Process Air Dew Point Temperature Liquid Line Pressure Bowl Screen Media
Bypass Air Temperature Liquid Viscosity Filter Shake Interval
Process or Inlet Air Temperature Nozzle Port Size Filter Shake Time
Total Air Volume Air Cap Position Atomizing Air Dew Point
Process Air Volume Nozzle height dP Product
dP Outlet Filter
OWI‐Consulting IncOnsite With Insight
Of This List, Which are the “Critical Process Parameters”?
Definition:
Critical Process Parameters (CPP) have a direct and significant influence on Critical Quality Attributes (CQA) and must therefore operate within a defined or limited operating range.

OWI‐Consulting incOnsite With Insight
Knowledge
PQLI Design Space John Lepore, James SpavinsJ. Pharm. Innov. (2008) 3:79-87
Design Space
Normal Operating Ranges
OWI‐Consulting IncOnsite With Insight
Critical Process Parameters
Note: some parameters are defined as CPP only during certain process steps – a process is comprised of heating (machine tower/ substrate), spraying, drying and cooling steps.
OWI‐Consulting IncOnsite With Insight
With this as background, which of the listed items ARE likely to be CPP?
What are the direct impacts on product attributes?

Process ParametersProcess Air Comments Steps:
H, S, D, C
Ambient Air Dew Point It depends if the machine has dew point control
If yes: S, D, C
Dehumidifier Dew Point No – it can vary independently of process air dew point
Pre-heater Temperature No – it operates independently of process air temperature
Process Air Dew Point Temperature
Yes, unless the process air temperature is very high (>90 C) H,S, D, C
Bypass Air Temperature No – controlled by process air temperature PID in pre-conditioning
Process or Inlet Air Temperature Yes S, D
Total Air Volume No – accommodates process air volume
Process Air Volume Yes H, S, D, C
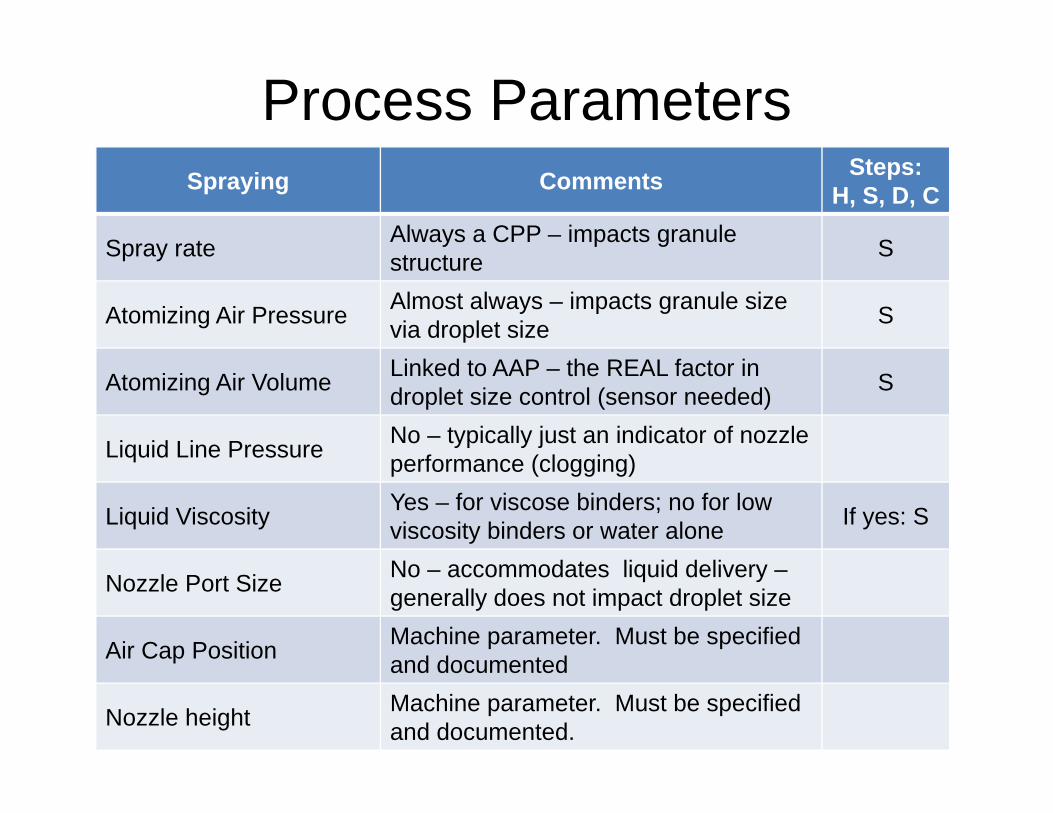
Process ParametersSpraying Comments Steps:
H, S, D, C
Spray rate Always a CPP – impacts granule structure S
Atomizing Air Pressure Almost always – impacts granule size via droplet size S
Atomizing Air Volume Linked to AAP – the REAL factor in droplet size control (sensor needed) S
Liquid Line Pressure No – typically just an indicator of nozzle performance (clogging)
Liquid Viscosity Yes – for viscose binders; no for low viscosity binders or water alone If yes: S
Nozzle Port Size No – accommodates liquid delivery –generally does not impact droplet size
Air Cap Position Machine parameter. Must be specifiedand documented
Nozzle height Machine parameter. Must be specified and documented.

Product Temperature (CPP)Condition Comments
Impact to moisture
profile
No dew point control Seasonal variation in ambient dew point will cause it to rise or fall, impacting drying rate
Up or down
Process air dew point -dehumidifier only
Minimizes seasonal variation. Batches will run dryer in winter (low dew points) Down
Process air dew point – set point control Consistent year ‘round. Best system. None
Process air volume
At saturation there is NO impact on product temperature. Below saturation the PT will change depending on adjustment to air flow. Be careful with ramping!
Up or down
Process air temperature
Direct impact on PT. Very high temperatures mitigate seasonal dew point variation; low temperatures are strongly impacted. Beware of ramping – if it is necessary, small increments are recommended to avoid condensation impacts.
Up or down
Although product temperature is a CPP, DIRECT control is NOT recommended!

OWI‐Consulting IncOnsite With Insight
Operating Ranges
• Sensor reading range
• Calibrated range• OQ range from
installation (empty machine)
• Operating range derived experimentally
• 0 – 100°C• 5, 50, 95°C• 35 - 90°C• Operating range
derived experimentally
An example: Process Air Temperature

OWI‐Consulting IncOnsite With Insight
Operating RangesProcess Air Operating
Range Comments
Ambient Air Dew Point
Dehumidifier Dew Point ± 2°C Final dew point control depends to an extent on narrow upstream control.
Pre-heater Temperature ±3°C
Process Air Dew Point Temperature ± 1°C Water in air is exponential. If it is a
CPP, it must operate in a narrow range.
Bypass Air Temperature ±2°C Process air temperature is a CPP for all products and should be controlled in
a narrow range. Process or Inlet Air Temperature ±2°C
Total Air Volume± 5% of full
scale
Tuning for these parameters is critical. Avoid ‘competing controllers’ and over-
correcting. Fluidization impacts behavior.
Process Air Volume

OWI‐Consulting IncOnsite With Insight
Spraying OperatingRange Comments
Spray rate ± 20 g/min Always a CPP, erratic variability can indicate poor nozzle performance.
Atomizing Air Pressure ± 0.1 bar Must operate in a stable, narrow range.
Atomizing Air Volume ± 5 cfm/ nozzle Reflects reproducibility of nozzle set-up.
Liquid Line Pressure
Liquid Viscosity
Nozzle Port Size Machine parameter
Air Cap Position Machine parameter
Nozzle height Machine parameter
Operating Ranges

OWI‐Consulting IncOnsite With Insight
How do the parameters work together?
1. Droplet sizea. Atomizing air pressureb. Spray ratec. Viscosity
2. Evaporation ratea. Process air volumeb. Process air temperaturec. Process air dew point
temperature

OWI‐Consulting IncOnsite With Insight
A Useful Dependent Variable…
An in-process moisture profile may be followed and confirms the accuracy of
several of the process variables
0 15 30 45 60 75 90 105 End Dry
Time (minutes)
02468
101214161820
Per
cent
Moi
stur
e
In-Process Moisture ProfileFluidized Bed Spray Granulation/Drying

Process Variables as Observed During
Manufacturing

OWI‐Consulting IncOnsite With Insight
Process Steps – a Recipe
• AHU pre-conditioning• Machine tower warm-up• Raw material loading• Product ‘mixing’• Spraying• Drying• Discharge

OWI‐Consulting incOnsite With Insight
1 7 13 19 25 31 37 43 49 55 61 67
X-Axis
0
2
4
6
8
10Y
-Axi
s
Inlet Dew Point CTotal Air Vol cfmBypass Temp CInlet Air Temp C
Process Air Vol cfmProduct dP mmWCProduct Temp CSpray Rate g/min
Spray Pump Output %Atomizing Air Press barExhaust dP mmWCExhaust Temp C
In-Process Data for a Fluidized Bed Spray Granulation
Data overview for the process variables. “Grouping” by type is more revealing…

OWI‐Consulting incOnsite With Insight
17:1
2:23
17:2
2:51
17:3
3:10
17:4
3:26
17:5
3:50
18:0
4:06
18:1
4:27
18:2
4:35
18:3
4:36
18:4
4:37
18:5
5:00
19:0
5:01
19:1
5:02
19:2
5:03
Clock Time
0102030405060708090
100110
Tem
pera
ture
(C)
Inlet Dew Point C Inlet Air Temp C Product Temp C Exhaust Temp C
Fluidized Bed Spray GranulationProcess data - temperatures
Pre-mix: The inlet temperature approaches its set point, product and exhaust temperatures rise. Is it really mixing, or is there something else to think about?

OWI‐Consulting incOnsite With Insight
0102030405060708090
100110
Tem
pera
ture
(C)
0102030405060708090
100110
Tem
pera
ture
(C)
The beginning of mixing…
Only 5 minutes later, at the start of spraying…

OWI‐Consulting IncOnsite With Insight
After the brief pre-mix…
Spraying is initiated at a controlled rate • Moisture builds slowly in the bed• Treated process air is used to evaporate
some of the moisture as it is being applied• Evaporation raises the relative humidity in
the processor, helping to dispel electrostatic charge
• Droplets help to produce and build granules• Granules are held together primarily by
liquid bridges

OWI‐Consulting incOnsite With Insight
17:1
2:23
17:2
2:51
17:3
3:10
17:4
3:26
17:5
3:50
18:0
4:06
18:1
4:27
18:2
4:35
18:3
4:36
18:4
4:37
18:5
5:00
19:0
5:01
19:1
5:02
19:2
5:03
Clock Time
0102030405060708090
100110
Tem
pera
ture
(C)
Spr
ay R
ate
(g/m
in)
Inlet Dew Point CInlet Air Temp C
Product Temp CSpray Rate g/min
Atomizing Air Press bar Exhaust Temp C
Fluidized Bed Spray GranulationProcess data - temperatures, spray rate, atomizing air
Spraying - The pump is enabled and atomizing air increases from purge pressure to the spraying set point.

17:1
2:23
17:2
2:51
17:3
3:10
17:4
3:26
17:5
3:50
18:0
4:06
18:1
4:27
18:2
4:35
18:3
4:36
18:4
4:37
18:5
5:00
19:0
5:01
19:1
5:02
19:2
5:03
Clock Time
0102030405060708090
100110
Tem
pera
ture
(C)
Spr
ay R
ate
(g/m
in)
Pro
cess
Air
Vol
ume
(cfm
)
Inlet Dew Point CInlet Air Temp C
Process Air Vol cfmProduct Temp C
Spray Rate g/minAtomizing Air Press bar
Exhaust Temp C
Fluidized Bed Spray GranulationProcess data - temperatures, spray rate, air volume
Later, air volume is increased to accommodate the increasing batch weight (to maintain a reasonable degree of fluidization).

OWI‐Consulting incOnsite With Insight
Moisture builds in the bed as the water addition rate exceeds the drying rate. Properties of the granulation may rely heavily on the moisture profile, and it should be reproduced.
At steady state, the air leaving the machine tower is at or near saturation.
0 15 30 45 60 75 90 105 End Dry
Time (minutes)
02468
101214161820
Per
cent
Moi
stur
eIn-Process Moisture ProfileFluidized Bed Spray Granulation/Drying

17:1
2:23
17:2
2:51
17:3
3:10
17:4
3:26
17:5
3:50
18:0
4:06
18:1
4:27
18:2
4:35
18:3
4:36
18:4
4:37
18:5
5:00
19:0
5:01
19:1
5:02
19:2
5:03
Clock Time
0102030405060708090
100110
Tem
pera
ture
(C)
Spr
ay R
ate
(g/m
in)
Pro
cess
Air
Vol
ume
(cfm
)
Inlet Dew Point CInlet Air Temp C
Process Air Vol cfmProduct Temp C
Spray Rate g/minAtomizing Air Press bar
Exhaust Temp C
Fluidized Bed Spray GranulationProcess data - temperatures, spray rate, air volume
What impact does the higher air volume have on the product/exhaust temperatures? Is there any impact at all?

OWI‐Consulting incOnsite With Insight
Inlet temp
Product, exhaust temp
Process air volume
Total air volume
Inlet dew point
Atomizing air pressure
OWI‐Consulting incOnsite With Insight
0 15 30 45 60 75 90 105 End Dry
Time (minutes)
02468
101214161820
Per
cent
Moi
stur
e
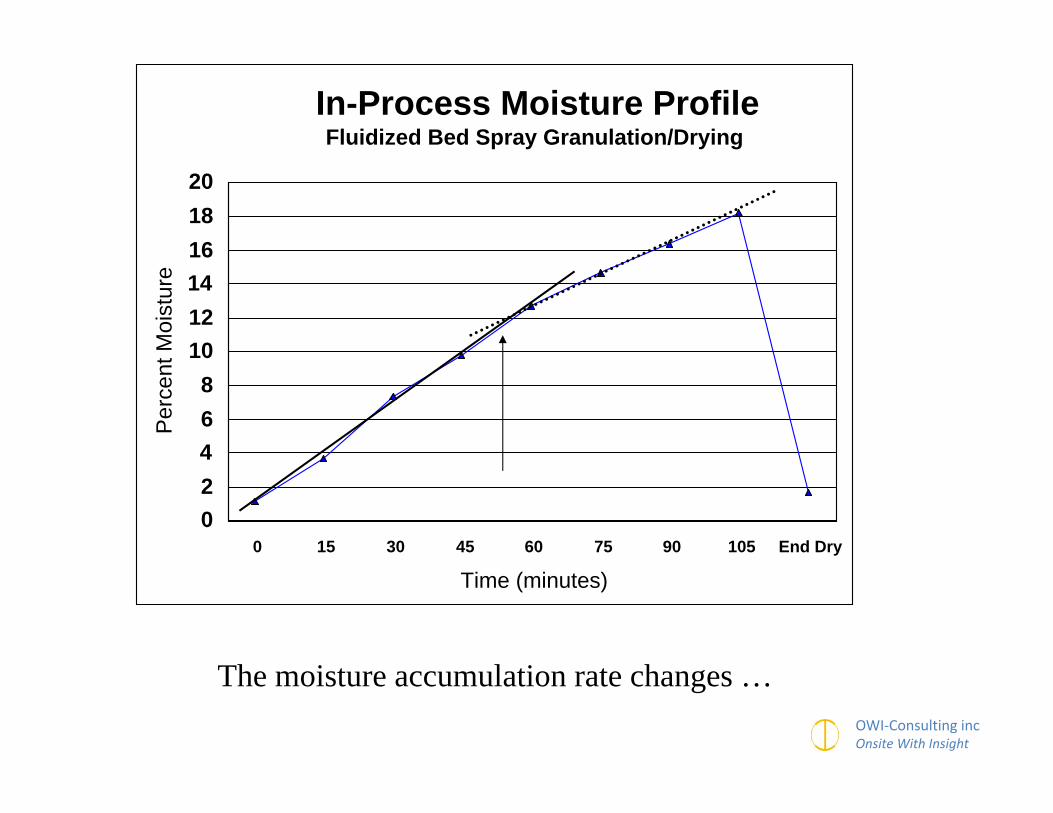
In-Process Moisture ProfileFluidized Bed Spray Granulation/Drying
The moisture accumulation rate changes …
OWI‐Consulting IncOnsite With Insight
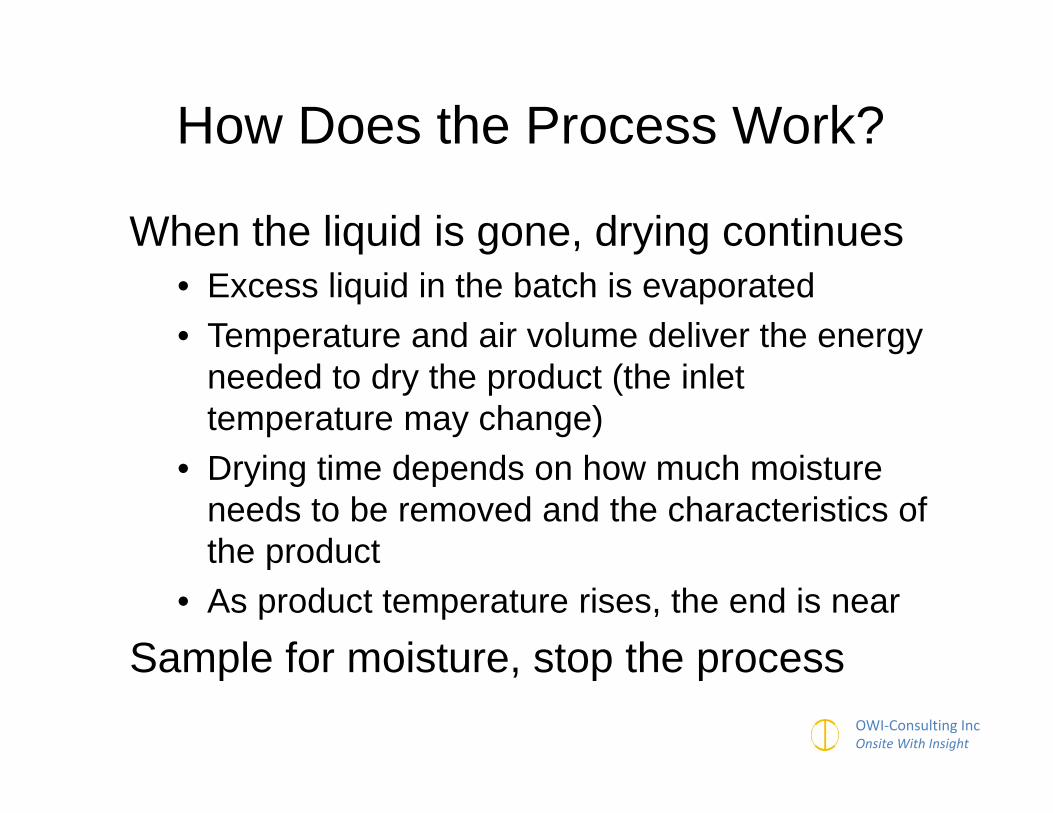
When the liquid is gone, drying continues• Excess liquid in the batch is evaporated• Temperature and air volume deliver the energy
needed to dry the product (the inlet temperature may change)
• Drying time depends on how much moisture needs to be removed and the characteristics of the product
• As product temperature rises, the end is near
Sample for moisture, stop the process
How Does the Process Work?

17:1
2:23
17:2
2:51
17:3
3:10
17:4
3:26
17:5
3:50
18:0
4:06
18:1
4:27
18:2
4:35
18:3
4:36
18:4
4:37
18:5
5:00
19:0
5:01
19:1
5:02
19:2
5:03
Clock Time
0102030405060708090
100110
Tem
pera
ture
(C)
Spr
ay R
ate
(g/m
in)
Pro
cess
Air
Vol
ume
(cfm
)
Inlet Dew Point CInlet Air Temp C
Process Air Vol cfmProduct Temp C
Spray Rate g/minAtomizing Air Press bar
Exhaust Temp C
Fluidized Bed Spray GranulationProcess data - temperatures, spray rate, air volume
The spray liquid quantity trip point has been reached, the pump goes into recirculation, atomizing air drops to purge pressure,
the inlet air temperature is raised to accelerate drying.

8090
100110
C)
Fluidized Bed Spray GranulationProcess data - temperatures
17:1
2:23
17:2
2:51
17:3
3:10
17:4
3:26
17:5
3:50
18:0
4:06
18:1
4:27
18:2
4:35
18:3
4:36
18:4
4:37
18:5
5:00
19:0
5:01
19:1
5:02
19:2
5:03
Clock Time
01020304050
Tem
pera
Inlet Dew Point C Inlet Air Temp C Product Temp C Exhaust Temp C
A new constant rate zone of drying is achieved, then as the product dries, product and exhaust temperature rise. The magnitude correlates to residual moisture.

OWI‐Consulting incOnsite With Insight
17:1
2:23
17:2
0:51
17:2
9:02
17:3
7:18
17:4
5:34
17:5
3:50
18:0
2:06
18:1
0:18
18:1
8:35
18:2
6:36
18:3
4:36
18:4
2:37
18:5
0:38
18:5
9:00
19:0
7:01
19:1
5:02
19:2
3:03
19:3
1:25
Clock Time
30
32
34
36
38
40Te
mpe
ratu
re (C
)
Product Temp C Exhaust Temp C
Comparison of Product and Exhaust Temperatures
Why the difference in product and exhaust temperatures? Can either one be used to indicate drying endpoint? Which is better?
From no difference to 3 C

OWI‐Consulting incOnsite With Insight
Summary• The fluidized bed spray granulation
process produces granules with unique properties.
• Interstitial porosity yields a high degree of wettable surface area – excellent for rapid disintegration, dissolution.
• Process variables and their impacts are well understood and reproducible.
• Scale-up is reasonably direct although mass effects must be considered, even in small scale development trials.

OWI‐Consulting IncOnsite With Insight
Any Questions?

OWI‐Consulting IncOnsite With Insight
David M. JonesOWI-Consulting Inc
Email: [email protected]/fax: 610-383-5091
Cell: 201-264-5173
FLUIDIZED BED SPRAY GRANULATION:
Scale-up Considerations

OWI‐Consulting IncOnsite With Insight
Major Scale-Up Issues to Consider• Drying capacity
Spray rates are related to the increase in drying capacity, not the increase in batch size
• Droplet sizeNozzle type/size, atomizing air
pressure/volume, spray rate• Mass effects
Agglomerate/granule porosity may be impacted by the increased batch weight
OWI‐Consulting IncOnsite With Insight
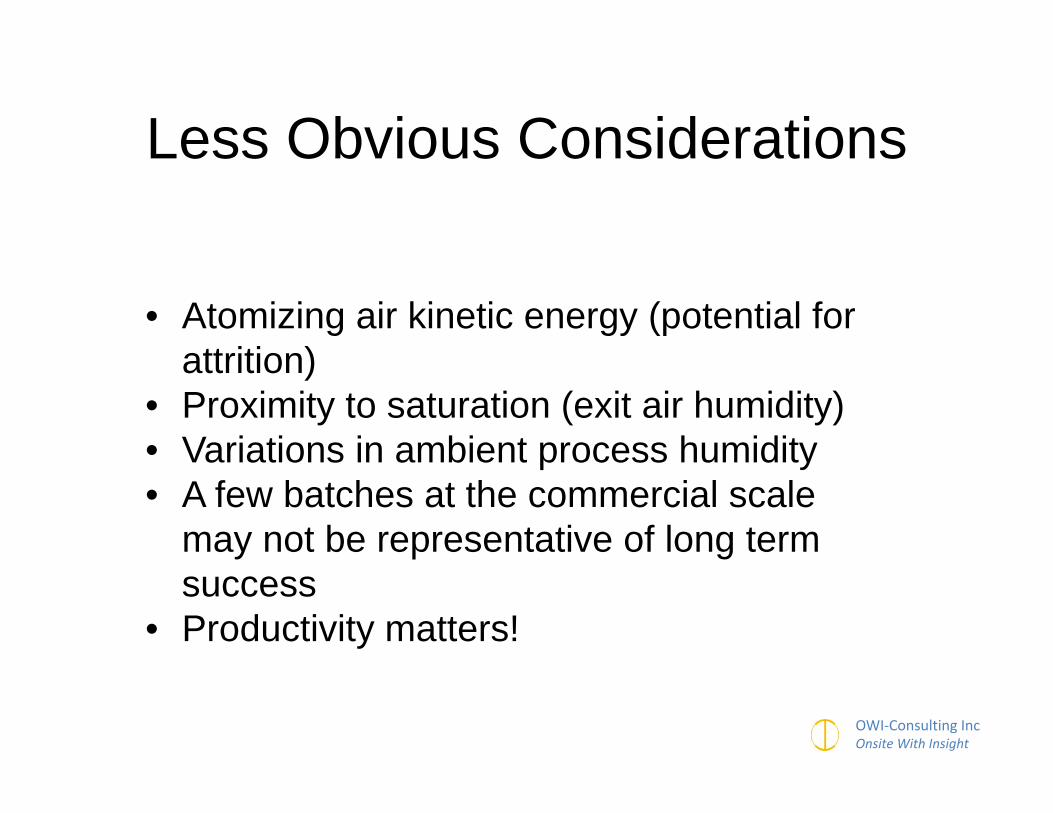
Less Obvious Considerations
• Atomizing air kinetic energy (potential for attrition)
• Proximity to saturation (exit air humidity)• Variations in ambient process humidity• A few batches at the commercial scale
may not be representative of long term success
• Productivity matters!

OWI‐Consulting IncOnsite With Insight
Common Issues in Scale-Up
• The lab trials do not effectively bracket what will be seen in scale-up
• The process used for the formulation was developed in a conservative manner
• The formulators do not have a feel for how production equipment works

OWI‐Consulting IncOnsite With Insight
Factors to Consider…
• Batch size determination• Spray rate• Droplet size• Process air volume• Temperatures (process, product)• Mass effects (bed depth, batch size)

OWI‐Consulting IncOnsite With Insight
Batch Size Determination
S min = V x 0.4 x BD S max = V x 0.8 x BD
Where:
V = Maximum Working Capacity of the Product Container
S = Batch Size (kg)BD = Finished Product Bulk Density
(kg/liter)

OWI‐Consulting IncOnsite With Insight
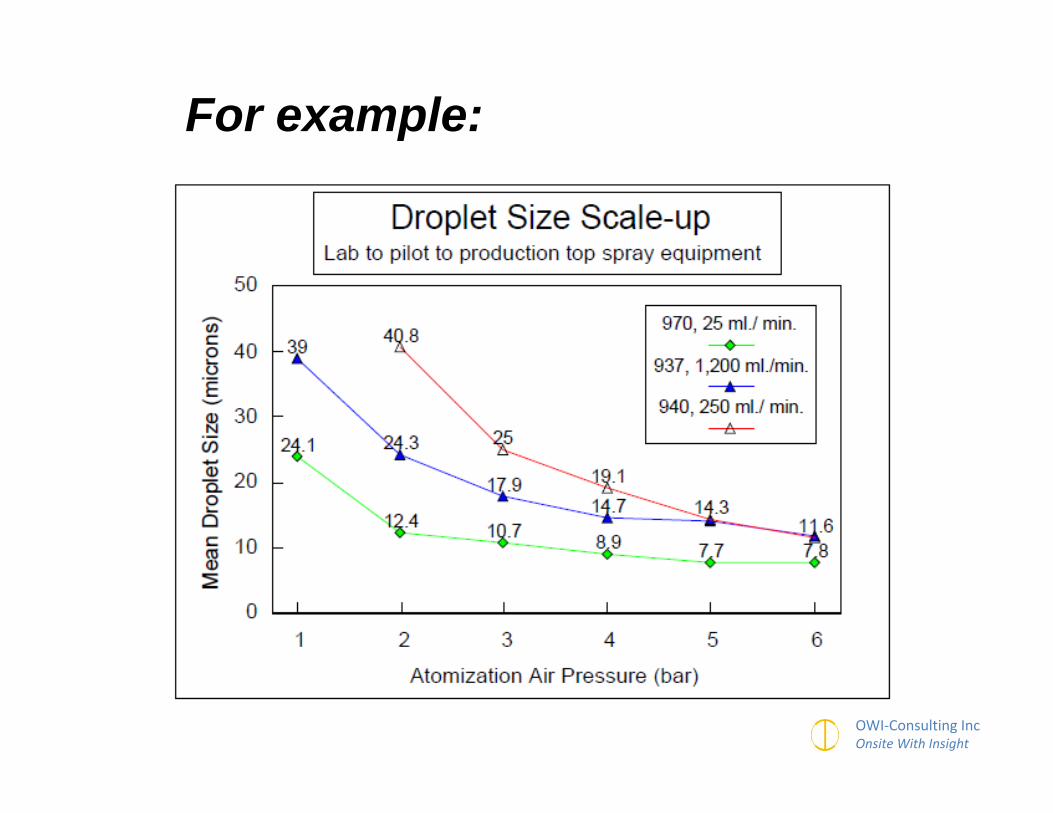
Droplet Size in Scale-up: From the lab to Pilot and Production
You must maintain the droplet size!
• Project the spray rate based on the expected increase in drying capacity (air volume) for the machine to be used.
• Make sure that the projected spray rate is within the air to liquid mass ratio capacity of the spray nozzle.
• Consider additional or multi-headed nozzles to reduce the spray rate per nozzle port.
OWI‐Consulting IncOnsite With Insight
For example:

OWI‐Consulting IncOnsite With Insight
Doubling the spray rate dramatically shifts the droplet size profile upwards

OWI‐Consulting IncOnsite With Insight
What Schlick nozzle are used in each size of top spray granulator?
• 970 series – up to 100 g/min• 940 series – up to 500 g/min• 937 series – up to 2,500 g/min (with
3 ports)• 937 – up to 5,000 g/min (with 6
ports)• Multiple 937 nozzles and wands can
be used for spray rates exceeding 5,000 g/min

OWI‐Consulting IncOnsite With Insight
Process Air VolumeIf the face velocity is kept constant at the bowl screen, the increase in air volume will be related to the increase in the bottom screen area. For example:
Machine Bowl size Screen cross-sectional area Scale-up factor
GPCG-5 22 liters 0.0415 m 1GPCG-60 220 liters 0.415 m 10GPCG-300 1,060 liters 1.0382 m 25
If the measured air flow in the 22 liter GPCG-5 was 150 cfm, the starting point for the GPCG-60 would be 1,500 cfm and about 3,750 cfm for the production scale GPCG-300.
OWI‐Consulting IncOnsite With Insight
What About the Spray Rate?

OWI‐Consulting IncOnsite With Insight
Machine Bowl volume (liters) Batch size (kg) Spray rate
(g/min)GPCG-5 22 8 100GPCG-60 220 80 1,000
GPCG-300 1,060 400 2,500
Scale-up in spray rate is based on the increase in drying capacity, not batch size. For example:
Although the batch size in the GPCG-300 is 50 times larger than that in the GPCG-5, the drying capacity, at the same inlet temperature is only 25 times greater. Spraying at 50x will quickly over-wet the batch.

OWI‐Consulting IncOnsite With Insight
Process Air Temperature Considerations
OWI‐Consulting IncOnsite With Insight
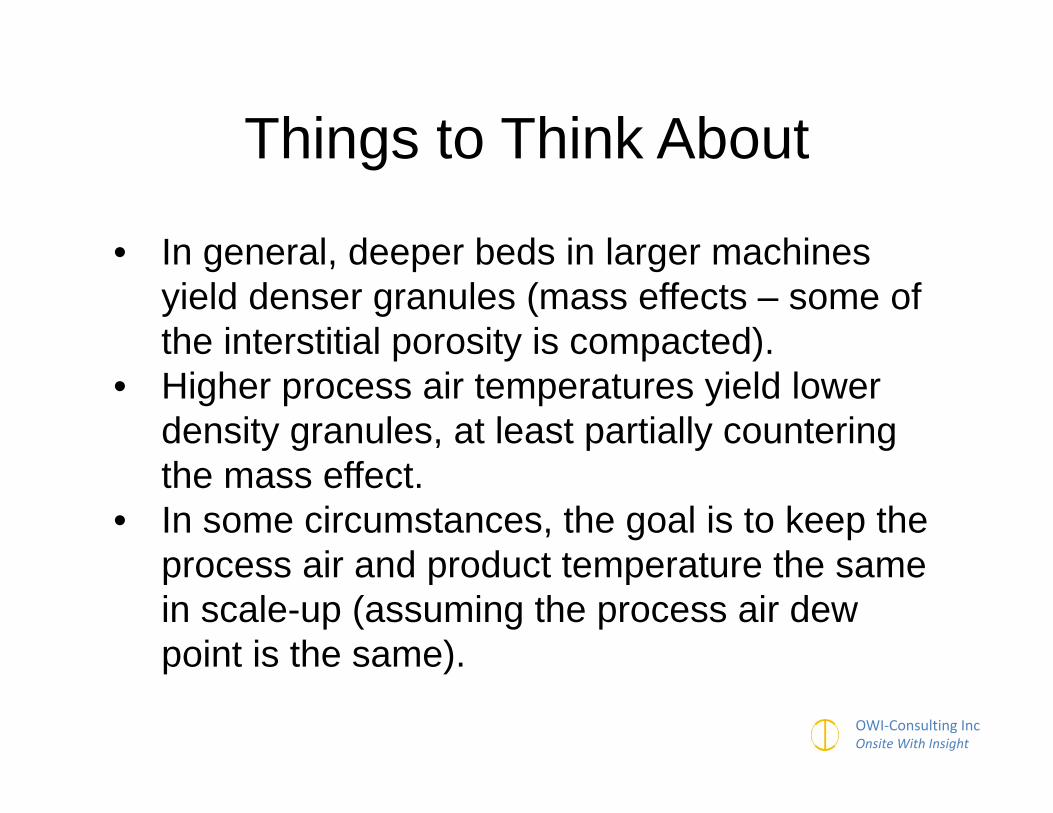
Things to Think About
• In general, deeper beds in larger machines yield denser granules (mass effects – some of the interstitial porosity is compacted).
• Higher process air temperatures yield lower density granules, at least partially countering the mass effect.
• In some circumstances, the goal is to keep the process air and product temperature the same in scale-up (assuming the process air dew point is the same).

OWI‐Consulting IncOnsite With Insight
HOWEVER…
Process air temperature can be increased to:• Increase the spray rate (within the
performance envelope of the nozzle).• Shorten the process time.• Reduce the bulk density of the product
(countering the consequences of the mass effect).
…as long as the consequences of the higher process air temperature are known and understood!

OWI‐Consulting IncOnsite With Insight
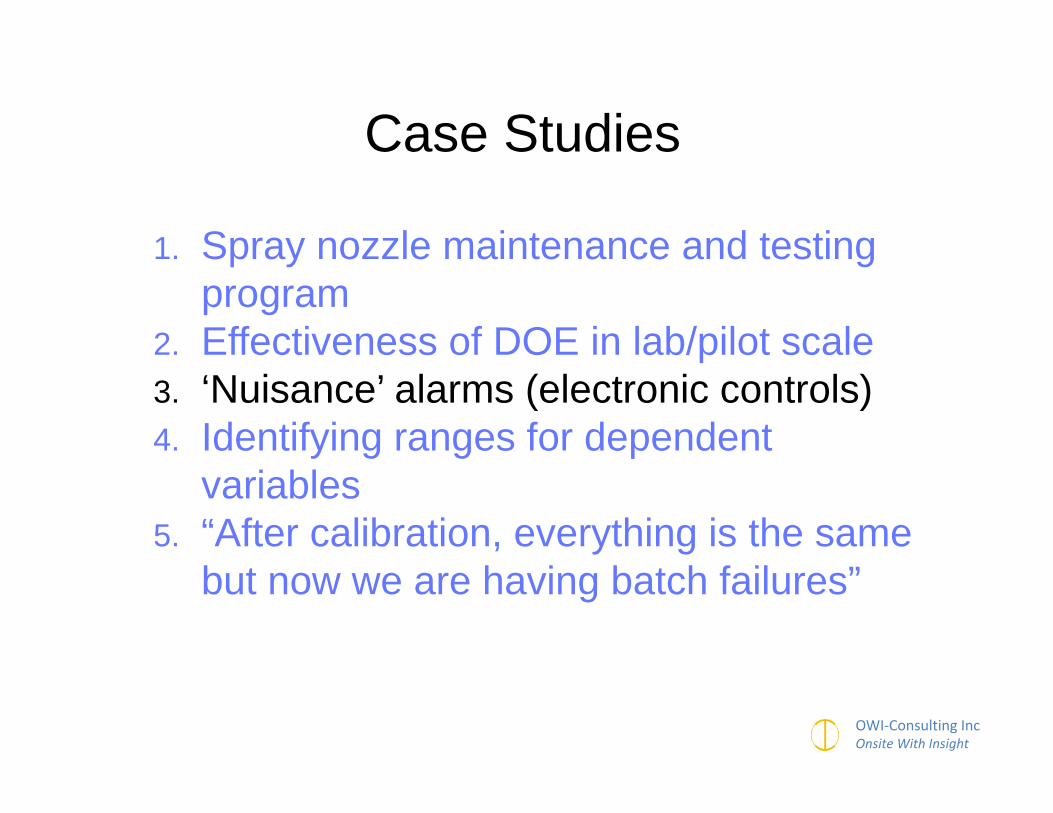
Case Studies
1. Spray nozzle maintenance and testing program
2. Effectiveness of DOE in lab/pilot scale3. ‘Nuisance’ alarms (electronic controls)4. Identifying ranges for dependent
variables5. “After calibration, everything is the same
but now we are having batch failures”

OWI‐Consulting IncOnsite With Insight
Case Studies
1. Spray nozzle maintenance and testing program
2. Effectiveness of DOE in lab/pilot scale3. ‘Nuisance’ alarms (electronic controls)4. Identifying ranges for dependent
variables5. “After calibration, everything is the same
but now we are having batch failures”

Application of DOE to pilot scale product development
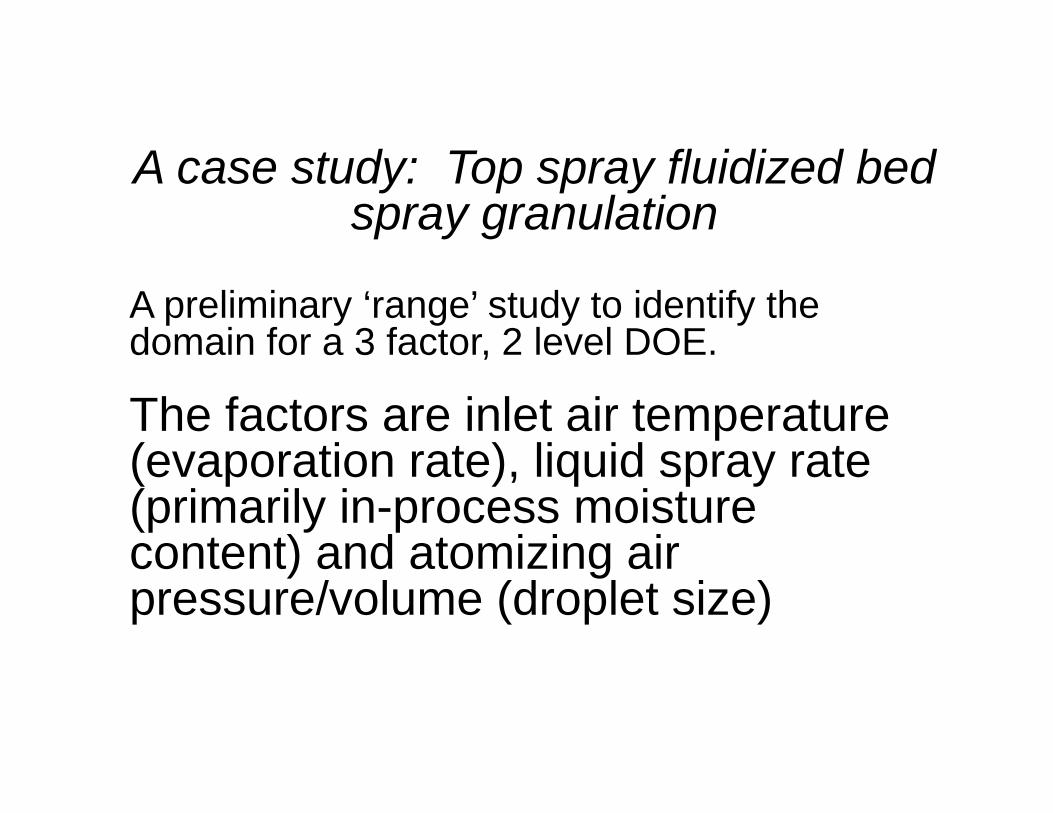
A case study: Top spray fluidized bed spray granulation
A preliminary ‘range’ study to identify the domain for a 3 factor, 2 level DOE.
The factors are inlet air temperature (evaporation rate), liquid spray rate (primarily in-process moisture content) and atomizing air pressure/volume (droplet size)

OWI‐Consulting IncOnsite With Insight
16 20 40 60 80 100 200 pan0
10
20
30
40
50
60
Per
cent
reta
ined
9392
9190
8988
87
batches 87-93a series of batches to define DOE domain
Particle size and distribution respond strongly to the range of process variables selected for study.
OWI‐Consulting IncOnsite With Insight
16 20 40 60 80 100 200 pan0
10
20
30
40
50
60
Per
cent
reta
ined
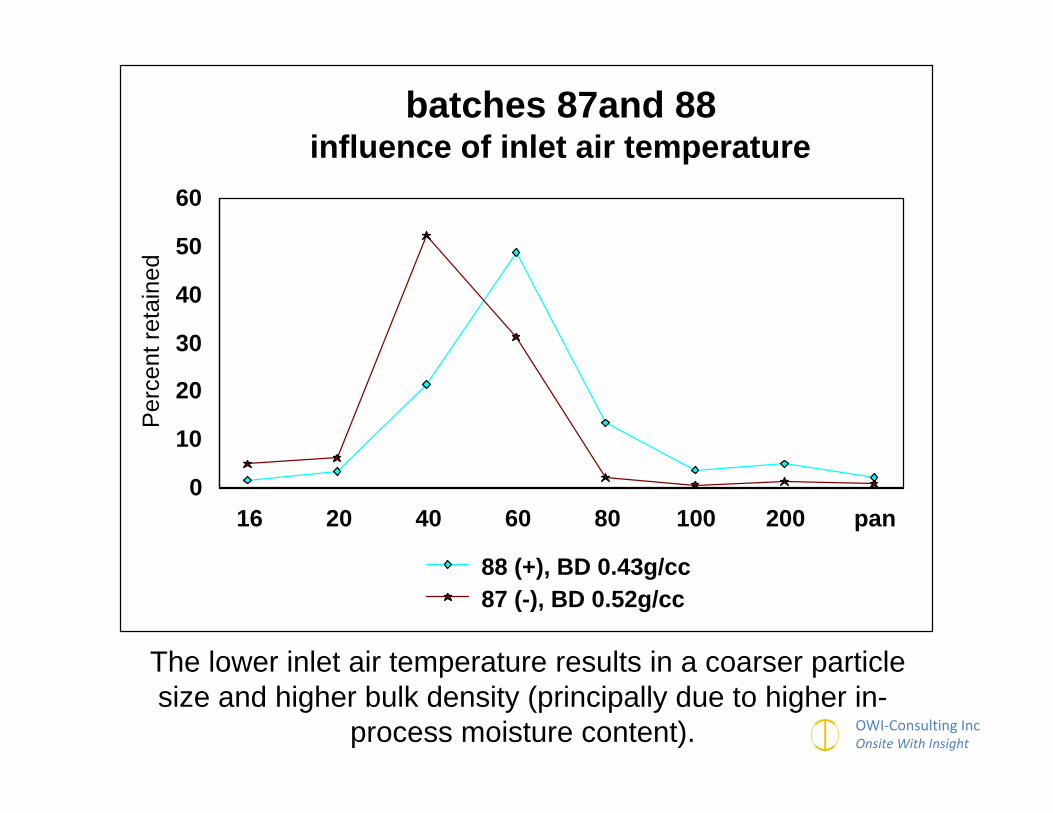
88 (+), BD 0.43g/cc87 (-), BD 0.52g/cc
batches 87and 88influence of inlet air temperature
•The lower inlet air temperature results in a coarser particle size and higher bulk density (principally due to higher in-
process moisture content).

16 20 40 60 80 100 200 pan0
10
20
30
40
50
Per
cent
reta
ined
91 (+), BD 0.56g/cc90 (0), BD 0.0.48g/cc
batches 90 and 91influence of spray rate
•The increased spray rate increases particle size and bulk density. Note: this batch was the ‘worst case’ and required a revision to the domain.

OWI‐Consulting IncOnsite With Insight
16 20 40 60 80 100 200 pan0
10
20
30
40
Per
cent
reta
ined
92 (+), BD 0.40g/cc89 (0), BD 0.42g/cc
batches 89 and 92influence of atomizing air pressure
Atomizing air pressure/volume strongly affects droplet size, and ultimately particle size and distribution

OWI‐Consulting IncOnsite With Insight
Results:
• All batches tabletted successfully. Distribution uniformity, hardness, friability and disintegration time all passed the specification. A robust process? There was an interesting impact on a machine component…

OWI‐Consulting IncOnsite With Insight
Initial behavior is interesting:
0 0.5 1 1.5 2 2.5 3 3.5 4 4.5 5 5.5 6 6.5
Elapsed Time (minutes)
0
100
200
300
400
500
Diff
eren
tial P
ress
ure
(mm
WC
)
0
200
400
600
800
1000
Spr
ay R
ate
(g/m
in)
A dP (mmWC)B dP (mmWC)
C dP (mmWC)A (g/min)
B (g/min)C (g/min)
Batches A, B, and CComparison of exhaust filter differential pressures vs. spray rate

OWI‐Consulting IncOnsite With Insight
Here, the filter pressure remains low for the entire batch, and there is no appreciable variability in process air volume.
The trend for a whole batch is also of interest:

OWI‐Consulting IncOnsite With Insight
Here, the filter pressure is trending upward, but not to an alarming level. Variability in process air volume is nominal.

OWI‐Consulting IncOnsite With Insight
Here, the filter pressure reaches the display limit, and variability in process air volume is increasing.
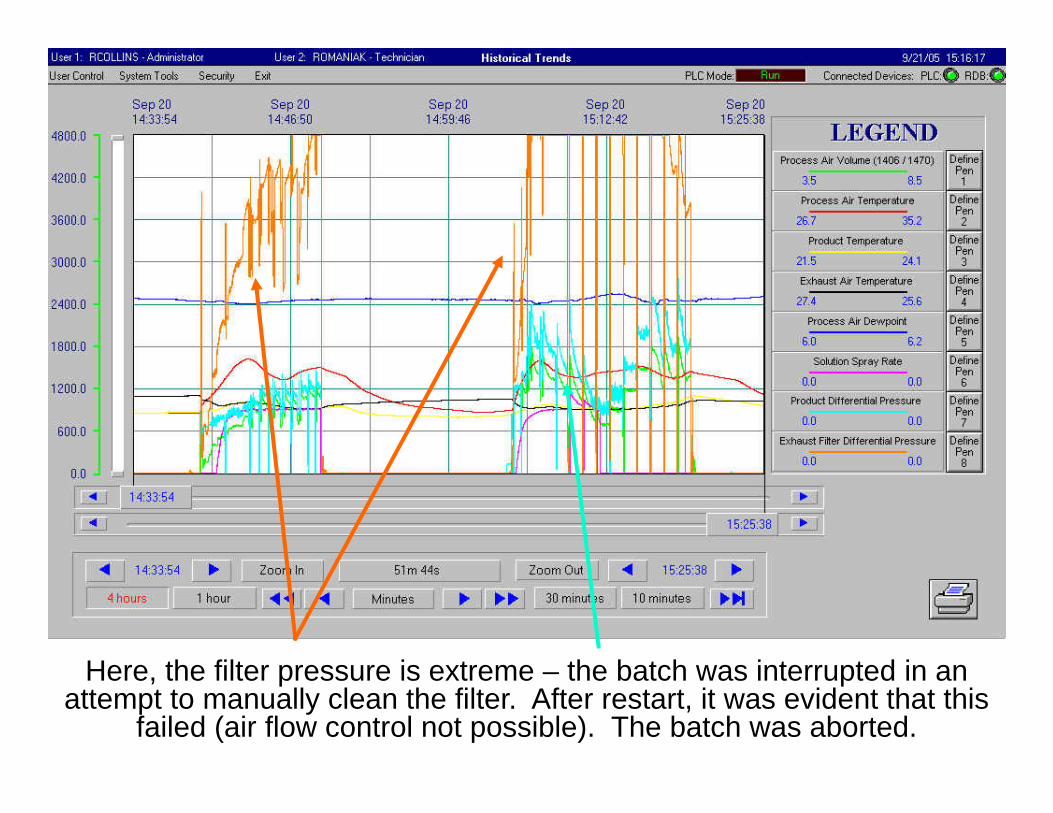
Here, the filter pressure is extreme – the batch was interrupted in an attempt to manually clean the filter. After restart, it was evident that this
failed (air flow control not possible). The batch was aborted.

OWI‐Consulting IncOnsite With Insight
It was found that the filter pressure was related to in-process moisture content. Wetter batches did not tend to foul the filter. A later batch, at high spray rate,
actually seemed to ‘clean’ the same filter.
OWI‐Consulting IncOnsite With Insight
Case Studies
1. Spray nozzle maintenance and testing program
2. Effectiveness of DOE in lab/pilot scale3. ‘Nuisance’ alarms (electronic controls)4. Identifying ranges for dependent
variables5. “After calibration, everything is the same
but now we are having batch failures”

Nuisance Alarms
17:1
2:23
17:2
2:51
17:3
3:10
17:4
3:26
17:5
3:50
18:0
4:06
18:1
4:27
18:2
4:35
18:3
4:36
18:4
4:37
18:5
5:00
19:0
5:01
19:1
5:02
19:2
5:03
Clock Time
0102030405060708090
100110
Tem
pera
ture
(C)
Spr
ay R
ate
(g/m
in)
Pro
cess
Air
Vol
ume
(cfm
)
Inlet Dew Point CInlet Air Temp C
Process Air Vol cfmProduct Temp C
Spray Rate g/minAtomizing Air Press bar
Exhaust Temp C
Fluidized Bed Spray GranulationProcess data - temperatures, spray rate, air volume

OWI‐Consulting IncOnsite With Insight
Case Studies
1. Spray nozzle maintenance and testing program
2. Effectiveness of DOE in lab/pilot scale3. ‘Nuisance’ alarms (electronic controls)4. Identifying ranges for dependent
variables5. “After calibration, everything is the same
but now we are having batch failures”

OWI‐Consulting incOnsite With Insight
In the first example, filter pressure is very low for the duration of the batch. Process air volume is not impacted during shaking.
Identifying ranges for dependent variables

In the second example, filter pressure trends upwards during the batch. Process air volume fluctuates during
shaking, but not to a great extent.

In the final example, filter pressure trends upwards to the maximum display value. Process air volume responds during shaking but the m/c
is able to maintain the desired set point between filter shakes.

OWI‐Consulting IncOnsite With Insight
Case Studies
1. Spray nozzle maintenance and testing program
2. Effectiveness of DOE in lab/pilot scale3. ‘Nuisance’ alarms (electronic controls)4. Identifying ranges for dependent
variables5. “After calibration, everything is the same
but now we are having batch failures”

OWI‐Consulting IncOnsite With Insight
Failure Analysis1. Batch data was examined for ‘good’ and
‘bad’ batches2. Calibration data was examined 3. Moisture content at the end of spray was
compared4. Drying time was examined5. Wetter batches seized, causing batch
failures6. Process air volume accuracy became the
focus of attention7. The air volume sensor was re-calibrated

OWI‐Consulting IncOnsite With Insight
SummaryThe fluidized bed spray granulation process
yields unique product attributes which are attractive for many products.
Although most commonly conducted using conventional top spray equipment, the process may be performed using the Wurster and rotor techniques.
Raw material attributes contribute to finished product properties – release specifications must be robust and well defined.
Process variables are well understood and may be controlled repeatedly.

OWI‐Consulting IncOnsite With Insight
Any Questions?