Embed Size (px)
Citation preview

A Work Project, presented as part of the requirements for the Award of a Master Degree in Finance from the
NOVA – School of Business and Economics.
Equity Research Delta Air Lines, Inc. –
A Clear Horizon to Fly?
Ana Filipa de Jesus Miranda
STUDENT NUMBER 23841
A Project carried out on the Master in Finance Program, under the supervision of:
Professor Francisco Martins
January 4th, 2021
Abstract
In 2020, the COVID-19 epidemic brought the world economy to a halt. As a result, share prices in the
airline industry fell , possibly creating interesting investment opportunities for investors. The aim of
this equity research report is to explore the value drivers of US-based airline Delta Air Lines, Inc.
(DAL:NYSE). The analysis was based the company's financial statements filed quarterly to the SEC .
At the end of the report, there is a action recommendation based on the intrinsic value of the equity.
Keywords: Equity Research; Delta Air Lines, Inc.; US Airlines; Corporate Valuation;
This work used infrastructure and resources funded by Fundação para a Ciência e a Tecnologia
(UID/ECO/00124/2013, UID/ECO/00124/2019 and Social Sciences DataLab, Project 22209), POR
Lisboa (LISBOA-01-0145-FEDER-007722 and Social Sciences DataLab, Project 22209) and POR Norte
(Social Sciences DataLab, Project 22209).

This report is part of the Deep Dive into Delta Air Lines, Inc. Value Creation report (annexed) and
should be read has an integral part of it.

Table of Contents
KEY VALUE DRIVERS ............................................................................. 5
REVENUE BREAKDOWN ....................................................................................... 5 COST BREAKDOWN .............................................................................................. 5 REVENUE .............................................................................................................. 5
▪ Available Seat Miles .................................................................... 5 ▪ Short-term Dip in ASM due to COVID-19 ................................. 6 ▪ Passenger mile yield ................................................................... 7 ▪ Load Factor ................................................................................... 7 ▪ Loyalty Program ........................................................................... 8 ▪ Ancillary Business and Refinery ................................................ 8 ▪ PPE ................................................................................................ 9
COSTS ................................................................................................................ 10 ▪ Aircraft Fuel and related taxes ................................................. 10 ▪ Salaries ....................................................................................... 11 ▪ Regional Carrier Expense ........................................................ 12 ▪ Ancillary Business and refinery ................................................ 12 ▪ Depreciation and Amortization ................................................. 13
VALUATION ............................................................................................ 13
DISCOUNTED CASH-FLOW ................................................................................. 13 ▪ Cost of Debt ................................................................................ 13 ▪ Cost of Equity ............................................................................. 13
TARGET PRICE OF $49.70 FOR FY2021 ........................................................... 14
Key Value Drivers
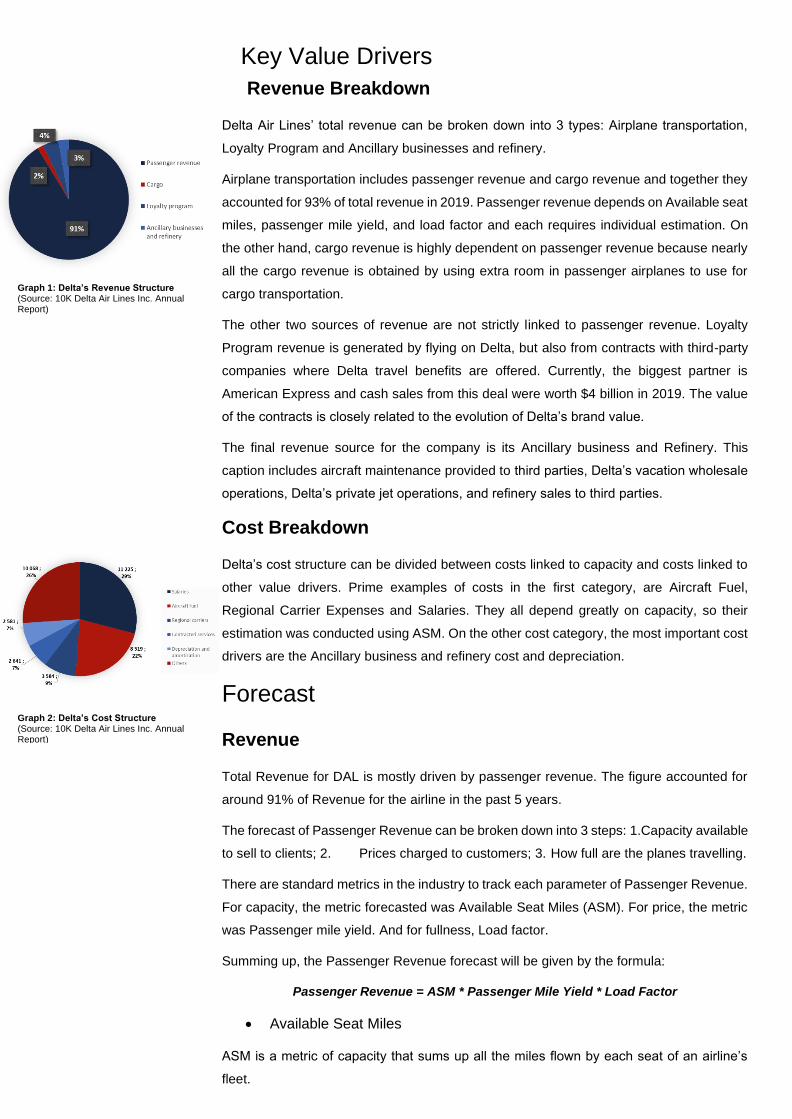
Revenue Breakdown
Delta Air Lines’ total revenue can be broken down into 3 types: Airplane transportation,
Loyalty Program and Ancillary businesses and refinery.
Airplane transportation includes passenger revenue and cargo revenue and together they
accounted for 93% of total revenue in 2019. Passenger revenue depends on Available seat
miles, passenger mile yield, and load factor and each requires individual estimation. On
the other hand, cargo revenue is highly dependent on passenger revenue because nearly
all the cargo revenue is obtained by using extra room in passenger airplanes to use for
cargo transportation.
The other two sources of revenue are not strictly linked to passenger revenue. Loyalty
Program revenue is generated by flying on Delta, but also from contracts with third-party
companies where Delta travel benefits are offered. Currently, the biggest partner is
American Express and cash sales from this deal were worth $4 billion in 2019. The value
of the contracts is closely related to the evolution of Delta’s brand value.
The final revenue source for the company is its Ancillary business and Refinery. This
caption includes aircraft maintenance provided to third parties, Delta’s vacation wholesale
operations, Delta’s private jet operations, and refinery sales to third parties.
Cost Breakdown
Delta’s cost structure can be divided between costs linked to capacity and costs linked to
other value drivers. Prime examples of costs in the first category, are Aircraft Fuel,
Regional Carrier Expenses and Salaries. They all depend greatly on capacity, so their
estimation was conducted using ASM. On the other cost category, the most important cost
drivers are the Ancillary business and refinery cost and depreciation.
Forecast
Revenue
Total Revenue for DAL is mostly driven by passenger revenue. The figure accounted for
around 91% of Revenue for the airline in the past 5 years.
The forecast of Passenger Revenue can be broken down into 3 steps: 1.Capacity available
to sell to clients; 2. Prices charged to customers; 3. How full are the planes travelling.
There are standard metrics in the industry to track each parameter of Passenger Revenue.
For capacity, the metric forecasted was Available Seat Miles (ASM). For price, the metric
was Passenger mile yield. And for fullness, Load factor.
Summing up, the Passenger Revenue forecast will be given by the formula:
Passenger Revenue = ASM * Passenger Mile Yield * Load Factor
• Available Seat Miles
ASM is a metric of capacity that sums up all the miles flown by each seat of an airline’s
fleet.
Graph 1: Delta’s Revenue Structure (Source: 10K Delta Air Lines Inc. Annual Report)
Graph 2: Delta’s Cost Structure (Source: 10K Delta Air Lines Inc. Annual Report)

ASM is sensitive to 3 factors: the number of planes used, the distance each plane is
travelling per year, and the number of seats in each plane.
Similar to Passenger Revenue, ASM is calculated by multiplying three factors:
ASM = Average Mile Flown per Plane * # Airplanes * Average Seats per Airplane
The first factor, Average Miles Flown per Plane (AMFP) is a metric that reveals how much
are Delta’s planes travelling in one year. This is a factor that depends on average airplane
speed and airtime, and both components are very hard to improve upon.
The average airplane speed limitation comes from the physics of engine design. The
overwhelming majority of planes owned by Delta have turbofan engines, which are engines
that are most efficient at speeds around 500 and 550 miles per hour. Regardless of age or
technology, all turbofan engines operate optimally at that speed range. Newer turbofan
engine models are installed not to reduce travel time by increasing speed, but rather to
decrease the fuel needed to operate them. On top of that, flying above Mach 0.81 (613
mph) increases the drag experienced by an aircraft and, consequently, decreasing fuel
efficiency.
The other way to improve AMFP is to increase airtime for each plane. Although better
airplane management techniques and better aircraft autonomy might help increase airtime
per plane, the growth of the air transportation industry is causing greater air traffic
congestion. The added congestion will make improving airtime per plane harder each year.
Historical data backs the notion that improving AMFP is very difficult. In the past 5 years,
AMFP has remained constant at around 1.45 million miles. For these reasons, we feel
comfortable to assume that the long-term trend for average miles per plane is around the
values registered in the past 5 years.
This means that capacity is mainly driven by the other two factors: Number of Airplanes
and Average Number of Seats per Airplane. To forecast both figures we analysed Delta’s
fleet composition, retirement of aircrafts and purchasing agreements, as well as overall
market trends.
Delta is investing in two main types of aircrafts: narrow-body aircrafts for short-to-medium
range2 and wide-body aircrafts for long-range3 travel. With the more efficient engines, the
new narrow-body aircrafts are economically viable in a wider range of settings. This
versatility allows Delta to replace smaller aircrafts meant for shorter routes by larger
aircrafts like the Airbus A321-200neo. Additionally, the new wide-body aircrafts are slightly
bigger than the fleet they are substituting. For these reasons, we expect an increase in
average number of seats per plane of 0.5% per year until 2030 in line with the growth rate
during the business plan. More details on fleet composition are available in the PPE section
of the report.
• Short-term Dip in ASM due to COVID-19
Planes are going to be used less frequently in the next 3 years as the industry recovers
from the pandemic and demand picks up. To calculate the impact of the pandemic on ASM
1 Mcrit is equal to Mach 0.8. At this velocity, an aircraft begins to travel within the “Transonic Range”. Source of Graph 18: https://www.skybrary.aero/index.php/Transonic_Flight 2 Most important aircrafts: Airbus A321-200neo and Airbus A321-200 (321) 3 Most important aircrafts: Airbus A330-900neo (339) and Airbus A350-900 (359)
Graph 4: Delta’s number of airplanes and AMFP, in million (Source: Delta Report | Own calculations)
Graph 3: Coefficient of Drag changing with speed. (Source: Skybrary)
Graph 5: Delta Air Lines ASM Estimation (Source: Own calculations)

more accurately, we analysed data from the Bureau of Transportation Statistics.
The available data from 2020 suggests that Delta’s market share of capacity dropped
slightly when compared to 2019 values. In real terms, this represents a forecasted 2020
ASM of 125 348 million miles, which is in line with our estimation using the previous
method.
• Passenger mile yield
Passenger mile yield is a metric that tracks how much money an airline generates per client
on a mile basis.
The second half of the 2010s has seen passenger mile yield increase to all-time highs on
the back of demand caused by the US economic growth. In the 5 year stretch between
2015 and 2019 the metric grew at 1.76% CAGR.
Despite the negative impacts of COVID-19, we expect the metric to remain high in 2020.
Due to the pandemic, Delta flew domestic flights almost exclusively, which are the flights
with higher passenger mile yield. On top of that, the US airlines industry is highly
consolidated, which prevents a steep downfall in terms of ticket fares. For this reason, we
forecast 2020’s mile yield per passenger at 17.3 cents per mile.
The real impact of COVID on passenger mile yield will occur when travel restrictions are
lifted in the second half of 2021. Historically, international flights have produced
passenger mile yields that are 30% lower than domestic flights. One of the reasons being
that most of the flights are long-haul and they generally have less costs per ASM. And
with international flights resuming, the average passenger mile yield will go down to levels
around the ones in 2015.
Afterwards, we expect a strong rebound on the back of a swift economic recovery of the
United States, reaching 16.8 by 2024. The domestic market will continue to be the largest
in terms of capacity and revenue, and US economy growth directly enhances business and
leisure travel.
For the following period between 2024 and 2030, we expect a strong increase in capacity
from APAC countries. As countries in the region develop, economic ties with the US tighten
and leisure travel to the countries become more accessible.
• Load Factor
The Load Factor metrics captures how full an airline’s airplanes operated during a specific
period4. This metric is mainly affected by passenger demand and route management. For
the period between 2015 and 2019 (apart from 2016), Delta led the industry in load factor
with numbers above 84.5%. The success is explained by its hub and spokes model,
individual route management and overbooking strategy.
But as most other metrics, the Load Factor plunged during the COVID-19 outbreak to
record lows on the back of low travel demand and sanitary restrictions. DAL took it a step
further and implemented a company policy limiting seat availability until March 2021 to
make people more comfortable when travelling5. This policy is estimated to reduce
4 For example: a Load Factor of 85% means that, on average, the airline was able to book 85 out of every 100 seats. 5 Delta Air Lines (2021). (https://news.delta.com/delta-only-us-airline-block-middle-seats-limit-onboard-capacity-through-march-30-
2021)
Graph 6: Delta’s Passenger Mile Yield: Domestic; International (Atlantic, Pacific and Latin America); and Total (Source: Bloomberg)
Graph 8: Load Factor per year – Delta Air
Lines
(Source: Bloomberg | Own calculations)
Graph 7: Passenger Mile Yield estimation
(in $) – Delta Air Lines
(Source: Bloomberg | Own calculations)

maximum load factor capacity to 65%. As a result, load factor is forecasted to be 62% for
2021.
To forecast load factor recovery for the rest of the business plan and beyond, it is important
to understand customer outlook on COVID-19. A study conducted in June 2020 focused
on aging population travel habits found that 60% of interviewees are likely to travel within
the next 12 months. Additionally, researchers found that a working vaccine was one of the
deal breakers in the decision-making process for the elderly population. This suggests that
demand for leisure travel will not change much after the pandemic, even for the older
population.
However, business travel is expected to take more time to recover due to budgetary cuts
brought on by the economic recession and less propensity to travel from employees.
All-in-all, we expect Delta’s load factor to recover by 2026. As for which value it will recover
to in 2026 and beyond, we estimated that value to be 84.5%. This value is slightly below
the average load factor of the past five year to account for the cyclicality of the industry.
• Loyalty Program
Delta offers its customers discounts if they sign up to their SkyMiles loyalty program.
Anytime they fly and use the program, they are rewarded with “miles”. These miles are
used to redeem discounts in air travel or other products like hotel accommodation.
Additionally, Delta partners with third party companies that offer Delta travel rewards in
their products. Studies6 have shown that travel rewards are one of the most popular reward
types in credit cards. The value of a good partnership with an airline will only increase in
the future since Millennials and Zoomers prefer travel rewards over.
We believe that Delta Air Lines is in prime position to take advantage of the trend.
Companies in the credit card space and in the travel industry are eager to work with Delta
due to its strong brand. The most notable partnership is with American Express, which
offers four Delta SkyMiles credit cards. The partnership was renewed in 2019 and will
extend until 2029.
For this reason, we believe that loyalty program revenue will continue to grow despite the
short-term decrease in passenger revenue due to the pandemic. We expect loyalty
program revenues to grow at a CAGR of 5% until 2030.
• Ancillary Business and Refinery
The caption is composed of Maintenance, Repair and Overhaul services provided to third
parties, Refinery sales to third parties, Delta’s vacation wholesale operations, and Delta’s
private jet operations. Although the caption is relevant in the Delta’s financial result, not
every component is.
In 2019, the refinery sector accounted for only 30% of all the revenue in the caption. This
is because most of the oil refined products are used in the Airline segment operation, which
is included in the company’s fuel cost. The excess is traded and sold at market values,
which translates into a low operating margin of around 2%. Given its marginal impact on
the caption, we disregarded the refinery segment in these calculations.
6 TSYS (2018). (www.tsys.com/Assets/TSYS/downloads/rs_2018-us-consumer-payment-study.pdf)

Similarly, vacation wholesale and private jet services representation in the caption is
negligible. In the past 5 years, they accounted for less 15% of yearly Revenue of Ancillary
Business and Refinery. Additionally, we do not expect explosive growth from either caption.
Thus, we disregarded both factors as relevant business drivers.
This leaves the Maintenance, Repair and Overhaul (MRO) business unit as the largest
driver of ancillary revenue. Delta TechOps7 not only services Delta’s own fleet, but also
does MRO to third parties. Their customers include other airlines, government
organizations and military branches.
In 2020, the demand for MRO increased drastically. With airplanes grounded due to lack
of consumer demand, many airlines took the opportunity to undergo major maintenance in
their fleets. The third quarter report of 2020 suggests that MRO revenue will be up 25%
when compared to 2019. This is a trend that we expect to continue until the end of 2021
as the pandemic restrictions are lifted and capacity increases once again. As a long-term
trend for growth rate for the MRO segment, we expect a similar growth rate to the airline
industry as a whole.
• PPE
Flight Equipment
Delta Air Lines’ aircraft purchases strategy has changed over the years. In the past, DAL
opted to buy used aircrafts from other airlines instead of investing in brand new ones. This
strategy decreased the initial capital investment per aircraft in exchange for slightly higher
maintenance costs and shorter aircraft lifespan due to the advanced age of the aircrafts.
Additionally, it provided the company with a cost-effective way to adapt the capacity
supplied and grow the operations profitably.
On average, Delta’s fleet was 4 years older than the industry average for the period
between 2015 and 2018.
However, older aircrafts have two major problems: 1) they don’t provide the best
experience to clients, which goes against DAL’s goal of offering premium products; 2) they
consume more fuel than newer models, thus affecting profitability and ecological footprint.
Currently, Delta is undergoing both a fleet renovation and a simplification process. The
company is ordering new aircrafts instead of used ones and its order backlog has only six
plane models, all of them manufactured by Airbus. Less airplane models from only one
manufacturer allows the company to save on training costs for pilots and maintenance
personnel, as well as saving in spare part inventory8. At the beginning of 2020, the DAL’s
Airbus order totalled 247 aircrafts. These investments can be a double-edged sword since
they will leave the company over reliant on few airplane models and on Airbus. If a major
grounding like the one that occurred to the Boeing 737-max in 2019 hits one of the new
Airbus models they are buying, the company can see a decrease in fleet size of 10% over
night.
With the COVID-19 pandemic, the Delta’s long-term commitment to receive 247 airplanes
from the European Aircraft manufacturer was put on hold. The shift in the strategy can be
7 MRO division of Delta Air Lines 8 We forecast a 2% increase in efficiency MRO costs per ASM flown until 2030
Graph 9: Average Age of Fleet (Peers and
Avg. of the Industry)
(Source: Bloomberg | Own calculations)

seen by comparing the purchase commitment of the end of 2019 and the third quarter of
2020 side by side. The company opted to delay nearly all their orders to reduce cash out-
flow in an uncertain post-covid recovery.
However, we do not expect aircraft orders to be altered further. Delta is aggressively
retiring old airplane models to give space to newer, more efficient ones. In 2020 alone, the
company retired 9 models, totalling up to 148 airplanes. With models like the Airbus A320-
200 and Boeing 767-300ER reaching an average age close to 25 years, we expect a
gradual retirement of said aircrafts. With this expected retirement scenario, we believe that
DAL has no choice but to fulfil their aircraft purchasing commitments.
The last important figure to determine is capital investment on Flight Equipment is the price
per airplane. Airplane prices are highly confidential and are negotiated with every airline
separately. Thus, pricing will be difficult to estimate correctly. Nevertheless, it is a known
fact in the industry that actual prices paid by airlines are below listed prices. The discount
is usually around 50 and 65 percent. Given the size of Delta and the size of the aircraft
order to Airbus, it is safe to assume that the discount was even greater. Using this
assumption and Airbus’s most recent list prices, the average cost per model was
computed. The forecasted expenditure matched the estimates released in the 10Q reports,
giving us confidence that the prices estimates are accurate.
After the business plan, the growth rate of flight equipment is forecasted to stabilize at 5%
from 2024 to 2030. This is in line with our growth expectations for the US airline industry
and with the planned retirement age of the fleet. The expansion of the Asian market
coupled with the increase in disposable income for Americans in the post pandemic years
will drive the growth of the industry. Afterwards, the growth will drop slightly to 4%, which
is in line with the growth rate of the US economy.
PPE excluding Flight Equipment
While not very big in relative terms, PPE excluding Flight Equipment is still a big portion of
capital invested for Delta Airlines. These assets include Ground property and equipment,
Information Technology-related Assets, Flight and ground equipment under finance
leases, and Advance payments for equipment.
The forecast of this caption closely follows the forecast of the Flight equipment. Historically,
Flight equipment represented around 76% of total PPE and we do not believe that the ratio
will drastically change. The two main driver of PPE excluding Flight Equipment, Ground
Property and Equipment and Information Technology-Related Assets, are directly linked
with Delta’s growth of the airline business. Thus, the forecasted values for PPE excluding
Flight Equipment are linked to Flight Equipment and the ratio between the two is constant
at 76%.
Costs
• Aircraft Fuel and related taxes
Fuel price is always an important factor on an airline’s profitability. In the last 5 years, this
caption hovered around 15.3% and 20.5% of Total Net Revenue. The final cost paid by the
airline can be broken down into 3 components: Commodity prices, fuel efficiency of the
aircraft fleet and total miles flown.
Aircraft (in $millions)
Price
Airbus A220-100 (221) 22,68
Airbus A220-300 (223) 32,025
Airbus A321-200 (321) 29,575
Airbus A321-200neo 45,325
Airbus A330-900neo (339) 118,56
Airbus A350-900 (359) 126,96
CRJ-900 16,275
Table 1: Price per Airplane Model - Estimate (Source: Airbus | Own computations)

As mentioned before, we believe that oil prices will hover around $50 to 60$ for the next 3
years. As the global economy reopens, demand for oil products has picked up. The fear of
a long recovery period of demand did not materialize, meaning that there will not be as
many problems when it comes to short-term liquidity. The V-shaped recovery of Q3 and
Q4 of 2020 makes it unlikely that major disruption in the industry occurs.
With the oil demand forecasted to reach its pre pandemic levels by the end of 2021, we
expect a similar price range to the one during 2015 to 2019.
Note that share price can change a lot with small changes in oil price estimates. If prices
are 2% lower each year, the target price for 2021 will increase 13.6% to $56.46 per share.
Regarding Aircraft Fuel Efficiency, we can see that it has been growing in the past 5 years
at an average rate of 1.38%. Better route management and fleet renovation were the main
culprits.
This is a trend that we expect to accelerate in the next 4 years due to early retirements of
older aircrafts and the purchase of new, more efficient ones. Delta is investing in 143 new
aircrafts until 2024. The highest ordered model is new Airbus A321-200neo, which Airbus
claims that provides a 20% fuel saving per seat when comparing with previous models9.
The other models have a similar efficiency gains over the planes they are replacing.
For the period until 2023, we are forecasting a yearly improvement of 1.5%. Afterwards,
fuel efficiency will continue to improve, but at a lower rate of 1% per year since the
proportion between new aircrafts and old aircrafts will shift.
• Salaries
The Salary expenditure is an expense that is closely related with the capacity output of the
airline. The airline business is a labor-intensive industry that will not change anytime soon.
Delta will continue to need the same number of pilots, flight attendants, ground personnel
and maintenance experts in the future for a similar number of flights flown since these jobs
are not easily automated or cut back. Looking at the ratio between ASM and number of
employees, there is a balance between ASM and number of employees that remains stable
over the years which corroborates the previous claim. Since we do not expect a big change
in the labor market in the industry, we assumed that the ASM/number of employees ratio
to remain the same for the future.
However, the COVID pandemic hit the airline business particularly hard and the recovery
process includes a short-term downsize of the team. In 2020, DAL implemented two
measures to control Salary expenses. First, Delta offered early retirement plans to
employees. In total, close to 17000 employees signed up for the plan and retired on the
1st of October10. Second, the company proposed voluntary unpaid leaves for a period of
up to 12 months. In its latest report11, the company stated that around 50000 employees
took unpaid leaves. Because of these cost saving measures, salary costs in 2020 were
23.6% lower when compared to 2019.
As capacity increases throughout the year of 2021, employees will be integrated back to
9 https://www.airbus.com/aircraft/passenger-aircraft/a320-family/a321neo.html 10 Financial Times (2020) - Delta steers 17,000 staff into early retirement (https://www.ft.com/content/e15a0e4f-cf51-42ee-8342-
d9b13d484dc3) 11 10Q report Delta Air Lines - 3rd quarter 2020
Graph 11: World liquid fuel consumption (Source: eia, U.S. Energy Information Administration. Short-term Energy Outlook, Dec 2020)
Graph 10: World liquid fuel production and consumption balance (Source: eia, U.S. Energy Information Administration)
Graph 12: Number of employees and average wage forecast for DAL (Source: 10K Reports | Own Calculations)

the normal operation of the airline. We expect most of the employees that took the unpaid
leave to return by the end of 2021 on the back of a 60% recovery in capacity. We forecast
that, by 2024, the ratio between ASM and number of employees will match the long-term
trend of 2.983 once again and remain stable thereafter.
As per salary growth, we expect salary stagnation until 2022. Despite the high levels of
unionization in the airline industry, Delta stands out as one of the companies in the US with
the lowest amount of unionized labor. This allows the company to hold back salary
increases while the industry recovers.
Afterwards, we expect the salaries to grow 0.9% above inflation rate. One of the main
drivers that for the salary increase is the pilot shortage that will hit the airline labor market12.
This pilot availability problem will be caused by three trends: the high number of mandatory
age-related pilot retirements; the increasing demand of regional airlines for pilots; and the
lower number of potentially qualified pilots applying for airline positions. With a limited
supply of new pilots, it will become harder for carriers to fill their vacant spots, creating
pressure for salaries to increase.
• Regional Carrier Expense
While composing a small fraction of the total ASM for Delta, Regional Carriers are essential
in the US Domestic market. According to Pew Research Center, 14% of the US population
lives in rural areas and 55% in Suburban areas. Often, the only viable way to serve these
customers is with smaller Regional flights. And despite the small size of operations, the
lack of competition means that passenger mile yields and load factors of these flights can
be very attractive for the Airline.
Regional Carrier Expenses encompass all the expenses from Delta’s operation of regional
carriers, except fuel costs. To serve small and medium-sized cities in the US, Delta has
capacity purchase arrangements with three regional carriers. The costs associated with
these agreements are ‘based on a determination of their cost of operating those flights’.
To estimate the cost of operating those flights, we resorted to capacity estimation.
In 2020, we estimate that ASM attributable to Regional Carriers will increase in relative
terms to 13% due to the decrease in international flights. Afterwards, we believe that it will
gradually decrease to pre pandemic values of around 10%.
To estimate costs, we resorted to using an average dollar cost per ASM. By looking at the
previous five years it is clear that regional flight expenses tend to hover around 14 cents
per ASM. This is 5 cents above the average dollar cost of an ASM for the whole company,
which is to be expected from capacity purchase agreement. Given the bargaining power
that Delta has over its regional carrier partners, we expect an increase in price per ASM
following the inflation rate.
• Ancillary Business and refinery
Ancillary Business cost is closely related to the revenue amount. Over the period between
12 Lutte, Rebecca (2014). An Investigation of the United States Airline Pilot Labor Supply, from
https://www.researchgate.net/publication/249315130_An_Investigation_of_the_United_States_Airline_Pilot_Labor_Supply. In a 2014 paper published on Journal of Air Transport Studies, researchers suggest that there will be a shortage of 35000 pilots between 2013 and 2035.

2015 and 2019, its profit margin hovered around 5%. Even when demand spikes, profit
margin remains steady. Since there is no major trend that makes us believe in an
improvement in profitability, we expect no change in the profit margin for the future.
• Depreciation and Amortization
To forecast depreciation and amortization, we made two assumptions. First, the
accumulated depreciation and amortization was split between flight equipment and non
flight equipment according to the ratio between them. Second, the average life cycle of
flight equipment was set to 25 years and 5 years for the non-flight equipment, in line with
the reported guidelines by the company.
Note that in the 2018 and 2019, the company included the accelerated depreciation related
to the early retirement of some of their aircrafts, skewing values for these years. That was
not the case for the early retirements caused by the COVID pandemic in 2020. These
losses in value were captured in the impairments caption of the balance sheet. That is why
the values fluctuate across different periods.
Valuation
Discounted Cash-Flow
• Cost of Debt
Cost of debt was calculated using the yield-to-maturity method. This method uses the
following formula to calculate the return on the debt asset:
Cost of Debt = Yield - Probability of Default * Loss Given Default
Yield was calculated on their $1.25 billion bond issuance that matures in January 2026 and
its value was 3.8%. To estimate the Probability of Default (PD) and Loss Given Default
(LGD) parameters, we opted to use two methods. First, we used the CDS market rates to
obtain the implicit PD and LGD. The implicit market quotes suggest that PD and LGD is
2.43% and 70%, respectively. One concern we have using this method is rate accuracy
due to low liquidity in the CDS market. However, given that DAL is a prominent company
in the world with a market cap of $25.6 billion, we feel that the market is liquid enough to
provide good inputs. The second method used was by using a Moody’s estimations given
credit ratings. In October 2020, Standard & Poor’s downgraded the credit rating of Delta to
BB+. According to the estimates of Elton et. al13, this rating is associated with a PD of 1.2%
and a LGD of 60.92%.
We believe the CDS method provides the most accurate representation of the credit risk
of the corporation, thus we ended up using that estimation in our model.
• Cost of Equity
The cost of equity required by Delta Air Lines investors is estimated to be 8%. This result
was derived using the CAPM. Thus, the final estimate for cost of equity is a function of risk-
13 Elton, Edwin J., 2001. Explaining the Rate Spread on Corporate Bonds (http://people.stern.nyu.edu/eelton/working_papers/explaining_rate_final_JF.pdf)
Graph 13: Depreciation and Amortization (Source: Own Calculations)

free rate, Market Risk Premium (MRP) and the sensitivity of Delta to the market
fluctuations.
To estimate risk-free rate we used the yield to maturity of the 10-year US bond as of
31/12/2020. Given the long-term investment horizon of the equity investment, we believe
that the best estimate for risk-free rate is the yield of a high maturity bond. For Market Risk
Premium, we used the estimates from A. Damodaran’s team of 5.46%14. This MRP is
derived from the average cash-flow payments of the US stock market in the last 10 years.
For the market sensitivity, we first calculated the unlevered beta for DAL and a set of
comparable companies by regressing each against their respective market index
benchmark. By looking at the 2-year rolling beta graph we can see a spike in levered betas
at the beginning of 2020 due to instability caused by Coronavirus. Delta’s levered beta
jumped from 1 in January to 2.2 in March, stabilizing at around 2 for the rest of the year.
This jump is explained by the way the airline industry was affected by the pandemic.
COVID-19 affect disproportionately the travel industry, making it more prone to price
swings whenever new information about the economic outlook and timeline for the vaccine
reached the market.
For 2021 and beyond, the DAL stock is expected to vary with new market information but
to a lesser extent. With the vaccination process under way in many countries, one of the
biggest uncertainties in the stock market disappeared. With less uncertainty about the
recovery timeline, there is less uncertainty to price in.
By looking at historical data, one can see that the average unlevered beta of the Air
Transport industry falls between 0.6 and 0.915. Given the current circumstances, we believe
that an unlevered beta of 0.9 reflects the added volatility short-term volatility introduced by
the pandemic without overestimating the market correlation of the equity in the post-
pandemic period.
Lastly, we submitted the model through a sensitivity analysis. As demonstrated by the
sensitivity analysis, the share price swings 13.4% with a 0.05 swing in unlevered beta in
either direction.
Target Price of $49.70 for FY2021
Delta Air Lines’ free-cash flows were forecasted until FY2035, when the cash-flows
reached steady state. Since the capital structure will evolve across time, we opted to use
the Adjusted Present Value method.
Using the APV method, we first discounted the cash-flows by the return on equity
unlevered, which resulted in a present value of $50.2 billion. To compute the remaining
present value created by the capital structure of the company, we discounted tax shields
generated by the debt using the return on assets (or return on unlevered equity) and not
return on debt. This reflects our belief that the tax shields do not offer the same risk profile
of debt since they are highly dependent on company profitability, which is uncertain in the
current environment. The present value of tax shields totaled $4.9 billion. After taking into
account the current levels of debt and non core book value, the current value of equity is
14 Value retrieved in December 2020. Source: http://pages.stern.nyu.edu/~adamodar/ 15 Source: http://pages.stern.nyu.edu/~adamodar/New_Home_Page/datafile/Betas.html
InputsRu 5,8%
Long term G 1,35%
Net Debt (@2021) 23 372$
Shares outstanding (in millions) 637,73
OutputSum Present Value of Unlevered FCF 56 187$
Sum Present Value of Tax Shields 4 895$
Non core Book Value (@2021) (6 016)$
Unlevered Enterprise Value 50 171$
Levered Enterprise Value 55 067$
Value of Equity 31 694$
Share Price 49,70$
Transaction with Shareholders (@2021) 0
Table 2: Summary of APV model output (Source: Own computations)

estimated to be $31.7 billion.
Our target price is $49.70 per share. The expected return equals 23.25% and it will come
from capital gains since Delta Air Lines will not issue any dividends in 2021. Given this
return profile, we recommend investors to BUY.
Lastly, we performed a sensitivity analysis with the two inputs of our valuation model: cost
of equity and long-term economic growth. Results can be found in the table 3.
Conclusion
The evidence put forward in this report indicates that Delta Air Lines will generate attractive
returns for shareholders in the next fiscal year.
COVID-19 and its recovery process will dictate the profitability levels of the airline industry
and, in turn, stock performance for 2021. After the terrible year of 2020, the start of the
vaccination process in December helped to define the COVID-19 recovery timeline. Health
experts suggest that herd immunity can be reached in the US as soon as June 2021,
bringing hope to the airline sector. Travel restrictions in the US are forecasted to be
removed by the end of 2021 and capacity is expected to fully recover to 2019’s all-time
highs in 2026.
Delta is in a prime position to take full advantage of this recovery period and retain its
position as the most profitable airline in the US. For starters, the company has a strong
financial position with a D/E of 71.2% and enough liquidity to operate during the recovery
period. The capital availability brought on by the low leverage ratio will allow the company
to fund investments that will yield higher profitability levels in the future. Regarding
operational profitability, we do not forecast any surprises in cost structure. Aside from a
sudden increase in fuel prices, no other cost caption should worry investors. Additionally,
Delta has some diversification when it comes to revenue streams. Delta operates its own
regional carrier, it has stakes in other international airlines and it operates business units
tangentially related to its main operation16. This diversification makes the company less
reliant on main airline’s passenger revenue for cash-flow.
The biggest threat to Delta Air Lines equity in the next 12 months will be a change in the
recovery outlook. As you can see in scenario 2, if there are new lockdown measures that
push the full recovery of the industry, we estimate a lower return of around 2.6% for 2021
($41.27 Target Price). By the same token, if demand recovers quicker than anticipated,
shareholders can expect a return increase to 35.5% for the fiscal year of 2021 (Scenario
3, $54.48 Target Price). It is important to stress that these are not unlikely scenarios due
to market uncertainty.
To conclude, we believe that the company is undervalued at $40.21 a share and, therefore,
we recommend investors to BUY the equity.
16Loyalty program and Ancillary Business and Refinery
Table 4: Share price forecast assuming a negative outlook (Source: Own computations)
Table 5: Share price forecast assuming a positive outlook (Source: Own computations)
Table 3: Sensitivity Analysis (in dollars) (Source: Own computations)
Scenario 2
Load Factor Pessimistic
Passenger Mile Yield Pessimistic
Salaries Optimistic
Tax Rate As-is
Jet Fuel Optimistic
Target Price $41,27
Scenario 3
Load Factor Optimistic
Passenger Mile Yield Optimistic
Salaries Pessimistic
Tax Rate As-is
Jet Fuel Pessimistic
Target Price $54,48
49,70 5,6% 5,8% 6,0%
1,25% 53,06 48,42 44,17
1,35% 54,49 49,70 45,32
1,45% 55,99 51,03 46,51
G
Ru