Embed Size (px)
Citation preview
Equity research│September 22, 2017
Asia Pacific Daily - 22 September 2017
Equity Research Reports…
▌Australia Brickworks (HOLD, tp:A$13.94▲) - Mixed results | P2 Commonwealth Bank (ADD▲, tp:A$80.00▼) - Perhaps a few months of reprieve | P3 NIB Holdings (HOLD, tp:A$5.82▲) - Looks a nice addition | P4 ——————————————————————————————————————————————————————————————————————————————————————— ▌China/Hong Kong AIA Group (ADD, tp:HK$72.00) - Turnaround part 2? | P5 New World Development (ADD, tp:HK$13.50) - More value to unlock | P6 ——————————————————————————————————————————————————————————————————————————————————————— ▌Malaysia Lotte Chemical Titan (ADD, tp:RM8.50) - Minimal impact from fire incident | P7 UMW Oil & Gas (HOLD, tp:RM0.32) - Shares traded ex-rights from yesterday | P8 ——————————————————————————————————————————————————————————————————————————————————————— ▌Thailand Bangkok Dusit Med Service (ADD, tp:THB24.70▲) - Tamer capex after Wellness Clinic | P9 Supalai PCL (HOLD, tp:THB23.50▼) - Big project unveiled | P10
Showcasing CIMB Research Ideas
APAC: Navigating ASIA PACIFIC 2017 20/9 China's One Belt & One Road Initiative
——————————————————————————————————————————————————————————————————————————————————
CHN: Navigating China: Education 19/9 Invest for a bright future
——————————————————————————————————————————————————————————————————————————————————
THB: BTS Group 18/9 Synergistic growth along MRT lines
——————————————————————————————————————————————————————————————————————————————————
IN: Strategy Note-Alpha 15/9 Metals: continued rally is contrary to history
——————————————————————————————————————————————————————————————————————————————————
HKG: Property - Overall 14/9 Navigating farmland conversion in HK
——————————————————————————————————————————————————————————————————————————————————
Regional Equity Research Contact
Michael GREENALL, CFP Regional Head of Research T: (60) 3 2261 9088 E: [email protected]
———————————————————————————————————————————————————————————————————————————————————
Show Style "View Doc Map"
CIMB Conference / Events |
SGX-CIMB Catalist Day 20 November 2017; Singapore; Singapore —————————————————————————————————————————
CIMB Korea C-Suite Double Bagger Conference 22 - 23 November 2017; Malaysia; Seoul —————————————————————————————————————————
CIMB 10th Annual Malaysia Corporate Day 04 January 2018; Malaysia; Kuala Lumpur
IMPORTANT DISCLOSURES, INCLUDING ANY REQUIRED RESEARCH CERTIFICATIONS, ARE PROVIDED AT THE END OF THIS REPORT. IF THIS REPORT IS DISTRIBUTED IN THE UNITED STATES IT IS DISTRIBUTED BY CIMB SECURITIES (USA), INC. AND IS CONSIDERED THIRD-PARTY AFFILIATED RESEARCH.
Powered by the EFA Platform
Cement│Australia│Equity research│September 21, 2017
IMPORTANT DISCLOSURES REGARDING COMPANIES THAT ARE THE SUBJECT OF THIS REPORT AND AN EXPLANATION OF RECOMMENDATIONS CAN BE FOUND AT THE END OF THIS DOCUMENT. MORGANS FINANCIAL LIMITED (ABN 49 010 669 726) AFSL 235410 - A PARTICIPANT OF ASX GROUP
Powered by EFA
Brickworks
Mixed results
BKW delivered a solid FY17 result with EBIT in line with Morgans’ and Bloomberg ■consensus expectations.
The divisional results were mixed with earnings lower in Building Products (EBIT -■14%) while Property (EBIT +23%) and Investments (EBIT +73%) were higher.
The short-term outlook in the Building Products division remains strong on the east ■coast while challenging conditions persist in WA. The medium-term earnings outlook however is more uncertain given higher energy costs and a potential slowdown in building activity. Hold rating maintained.
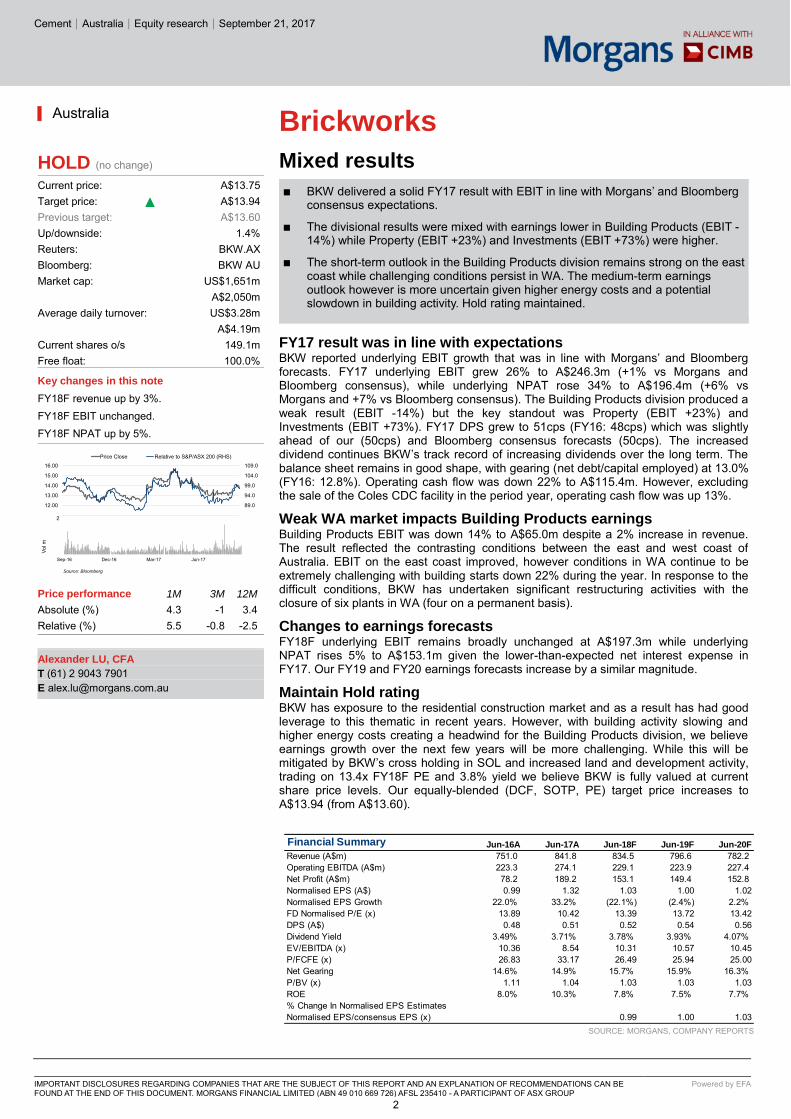
FY17 result was in line with expectations BKW reported underlying EBIT growth that was in line with Morgans’ and Bloomberg forecasts. FY17 underlying EBIT grew 26% to A$246.3m (+1% vs Morgans and Bloomberg consensus), while underlying NPAT rose 34% to A$196.4m (+6% vs Morgans and +7% vs Bloomberg consensus). The Building Products division produced a weak result (EBIT -14%) but the key standout was Property (EBIT +23%) and Investments (EBIT +73%). FY17 DPS grew to 51cps (FY16: 48cps) which was slightly ahead of our (50cps) and Bloomberg consensus forecasts (50cps). The increased dividend continues BKW’s track record of increasing dividends over the long term. The balance sheet remains in good shape, with gearing (net debt/capital employed) at 13.0% (FY16: 12.8%). Operating cash flow was down 22% to A$115.4m. However, excluding the sale of the Coles CDC facility in the period year, operating cash flow was up 13%.
Weak WA market impacts Building Products earnings Building Products EBIT was down 14% to A$65.0m despite a 2% increase in revenue. The result reflected the contrasting conditions between the east and west coast of Australia. EBIT on the east coast improved, however conditions in WA continue to be extremely challenging with building starts down 22% during the year. In response to the difficult conditions, BKW has undertaken significant restructuring activities with the closure of six plants in WA (four on a permanent basis).
Changes to earnings forecasts FY18F underlying EBIT remains broadly unchanged at A$197.3m while underlying NPAT rises 5% to A$153.1m given the lower-than-expected net interest expense in FY17. Our FY19 and FY20 earnings forecasts increase by a similar magnitude.
Maintain Hold rating BKW has exposure to the residential construction market and as a result has had good leverage to this thematic in recent years. However, with building activity slowing and higher energy costs creating a headwind for the Building Products division, we believe earnings growth over the next few years will be more challenging. While this will be mitigated by BKW’s cross holding in SOL and increased land and development activity, trading on 13.4x FY18F PE and 3.8% yield we believe BKW is fully valued at current share price levels. Our equally-blended (DCF, SOTP, PE) target price increases to A$13.94 (from A$13.60).
SOURCE: MORGANS, COMPANY REPORTS
▎Australia
HOLD (no change) Current price: A$13.75 Target price: A$13.94 Previous target: A$13.60 Up/downside: 1.4% Reuters: BKW.AX Bloomberg: BKW AU Market cap: US$1,651m A$2,050m Average daily turnover: US$3.28m A$4.19m Current shares o/s 149.1m Free float: 100.0%
Key changes in this note
FY18F revenue up by 3%. FY18F EBIT unchanged. FY18F NPAT up by 5%.
Price performance 1M 3M 12M
Absolute (%) 4.3 -1 3.4 Relative (%) 5.5 -0.8 -2.5 Alexander LU, CFA
T (61) 2 9043 7901 E [email protected]
Financial Summary Jun-16A Jun-17A Jun-18F Jun-19F Jun-20F
Revenue (A$m) 751.0 841.8 834.5 796.6 782.2Operating EBITDA (A$m) 223.3 274.1 229.1 223.9 227.4Net Profit (A$m) 78.2 189.2 153.1 149.4 152.8Normalised EPS (A$) 0.99 1.32 1.03 1.00 1.02Normalised EPS Growth 22.0% 33.2% (22.1%) (2.4%) 2.2%FD Normalised P/E (x) 13.89 10.42 13.39 13.72 13.42DPS (A$) 0.48 0.51 0.52 0.54 0.56Dividend Yield 3.49% 3.71% 3.78% 3.93% 4.07%EV/EBITDA (x) 10.36 8.54 10.31 10.57 10.45P/FCFE (x) 26.83 33.17 26.49 25.94 25.00Net Gearing 14.6% 14.9% 15.7% 15.9% 16.3%P/BV (x) 1.11 1.04 1.03 1.03 1.03ROE 8.0% 10.3% 7.8% 7.5% 7.7%% Change In Normalised EPS Estimates Normalised EPS/consensus EPS (x) 0.99 1.00 1.03
84.0
89.0
94.0
99.0
104.0
109.0
11.00
12.00
13.00
14.00
15.00
16.00
Price Close Relative to S&P/ASX 200 (RHS)
Source: Bloomberg
1122
Sep-16 Dec-16 Mar-17 Jun-17
Vol m
2
Banks│Australia│Equity research│September 21, 2017
IMPORTANT DISCLOSURES REGARDING COMPANIES THAT ARE THE SUBJECT OF THIS REPORT AND AN EXPLANATION OF RECOMMENDATIONS CAN BE FOUND AT THE END OF THIS DOCUMENT. MORGANS FINANCIAL LIMITED (ABN 49 010 669 726) AFSL 235410 - A PARTICIPANT OF ASX GROUP
Powered by EFA
Commonwealth Bank
Perhaps a few months of reprieve
We view the agreement to sell the life businesses in Australia and NZ as positive ■for CBA’s shareholders. The strategic review of CFSGAM creates potential for further positive news for CBA’s shareholders.
A credit rating downgrade and higher regulatory capital requirement for operational ■risk are conceivable consequences of the prudential inquiry and civil proceedings.
Our recommendation is upgraded to Add. WBC remains our preferred pick of the ■major banks followed by NAB.
Sale of life business for $3.8bn is a positive outcome We view the transaction as positive for CBA shareholders given we calculate that it will provide a 30bps uplift to CBA’s group return on tangible equity (RoTE). We also calculate that the impact of the transaction on CBA’s group cash EPS is neutral. The transaction is expected to result in a pro-forma uplift to the Group’s FY17 CET1 capital ratio of ~70bps on an APRA basis. CBA has also said that it is undertaking a strategic review of CFSGAM and will consider a range of options, including an IPO. This creates potential for CBA’s CET1 capital ratio to be further strengthened. Our view is that the current valuation range for CFSGAM is $3.5bn-4.8bn.
Allegations have potential for impact on medium-term ROE Potential implications of the AUSTRAC allegations include: financial penalty stemming from civil proceedings; credit rating downgrade; increased regulatory capital requirement for operational risk; and loss of market share. We believe a one notch downgrade in CBA’s credit rating and a 20% increase in CBA’s operational risk regulatory capital requirement is conceivable. If both these risks were to materialise, then we expect them to ultimately reduce CBA’s return on tangible equity (RoTE) by ~50bps with all else constant.
Timing of future news flow Based on the key dates in relation to the civil proceedings and the APRA inquiry, we do not foresee negative news for CBA at least until the end of January. CBA is expected to file its defence of AUSTRAC allegations by mid-December and we expect this to be neutral or positive for CBA’s share price as it will be CBA’s opportunity to present its view of events. In the meantime, a sale or IPO of CFSGAM is possible, and this may be positive for CBA’s share price. Announcement of a new CEO by the end of this calendar year is also on the cards, and if Rob Whitfield or Ross McEwan are appointed then we expect a positive share price reaction.
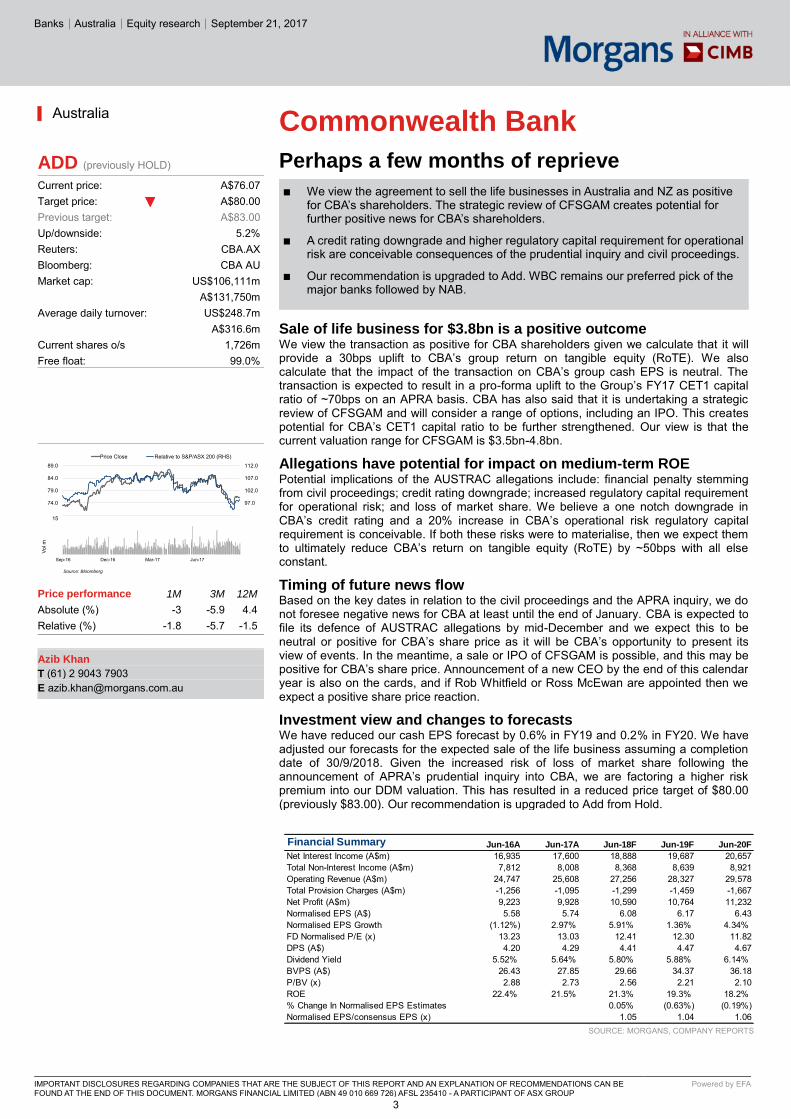
Investment view and changes to forecasts We have reduced our cash EPS forecast by 0.6% in FY19 and 0.2% in FY20. We have adjusted our forecasts for the expected sale of the life business assuming a completion date of 30/9/2018. Given the increased risk of loss of market share following the announcement of APRA’s prudential inquiry into CBA, we are factoring a higher risk premium into our DDM valuation. This has resulted in a reduced price target of $80.00 (previously $83.00). Our recommendation is upgraded to Add from Hold.
SOURCE: MORGANS, COMPANY REPORTS
▎Australia
ADD (previously HOLD) Current price: A$76.07 Target price: A$80.00 Previous target: A$83.00 Up/downside: 5.2% Reuters: CBA.AX Bloomberg: CBA AU Market cap: US$106,111m A$131,750m Average daily turnover: US$248.7m A$316.6m Current shares o/s 1,726m Free float: 99.0%
Price performance 1M 3M 12M
Absolute (%) -3 -5.9 4.4 Relative (%) -1.8 -5.7 -1.5 Azib Khan
T (61) 2 9043 7903 E [email protected]
Financial Summary Jun-16A Jun-17A Jun-18F Jun-19F Jun-20F
Net Interest Income (A$m) 16,935 17,600 18,888 19,687 20,657Total Non-Interest Income (A$m) 7,812 8,008 8,368 8,639 8,921Operating Revenue (A$m) 24,747 25,608 27,256 28,327 29,578Total Provision Charges (A$m) -1,256 -1,095 -1,299 -1,459 -1,667Net Profit (A$m) 9,223 9,928 10,590 10,764 11,232Normalised EPS (A$) 5.58 5.74 6.08 6.17 6.43Normalised EPS Growth (1.12%) 2.97% 5.91% 1.36% 4.34%FD Normalised P/E (x) 13.23 13.03 12.41 12.30 11.82DPS (A$) 4.20 4.29 4.41 4.47 4.67Dividend Yield 5.52% 5.64% 5.80% 5.88% 6.14%BVPS (A$) 26.43 27.85 29.66 34.37 36.18P/BV (x) 2.88 2.73 2.56 2.21 2.10ROE 22.4% 21.5% 21.3% 19.3% 18.2%% Change In Normalised EPS Estimates 0.05% (0.63%) (0.19%)Normalised EPS/consensus EPS (x) 1.05 1.04 1.06
92.0
97.0
102.0
107.0
112.0
69.0
74.0
79.0
84.0
89.0
Price Close Relative to S&P/ASX 200 (RHS)
Source: Bloomberg
5
10
15
Sep-16 Dec-16 Mar-17 Jun-17
Vol m
3
Insurance - General│Australia│Equity research│September 20, 2017
IMPORTANT DISCLOSURES REGARDING COMPANIES THAT ARE THE SUBJECT OF THIS REPORT AND AN EXPLANATION OF RECOMMENDATIONS CAN BE FOUND AT THE END OF THIS DOCUMENT. MORGANS FINANCIAL LIMITED (ABN 49 010 669 726) AFSL 235410 - A PARTICIPANT OF ASX GROUP
Powered by EFA
NIB Holdings
Looks a nice addition
NIB has entered into an agreement to acquire corporate health insurer, GU Health ■(GU).
Strategically the acquisition makes sense, in our view, adding to NIB’s existing ■core businesses and accelerating NIB’s corporate business growth.
The acquisition appears ~4.5% accretive after synergies in FY19 and FY20. ■ We upgrade FY18/FY19F cash EPS by 1-4%. Our price target is lifted ~4% to ■
A$5.82. We maintain our Hold recommendation, with NIB fair value trading on ~21x FY18F PE.
What happened NIB has entered into an agreement to acquire GU Health (GU) for ~A$155m. GU is the only established specialist corporate group health insurer in Australia, servicing over 34,000 policyholders across 260 corporate clients. The acquisition aims to accelerate NIB’s growth in the corporate health insurance segment, with the price paid equivalent to ~15x FY18 adjusted pro-forma NPAT, pre synergies. The acquisition will be funded by a combination of debt (A$80.5m) and equity (A$75m), with the transaction expected to complete in 4QCY17. Post transaction, NIB’s gearing ratio is expected to be ~31.7%, just above its long-term target gearing level (~30%).
Strategically the acquisition makes sense In our view, GU appears a logical strategic fit. The reasons being it adds materially to NIB’s existing core Australian Resident Health Insurance (ARHI) and International (Inbound) Health Insurance (iihi) businesses. Secondly it accelerates NIB’s growth in the corporate health insurance market, broadly doubling NIB’s corporate member numbers to 80k, while providing a stronger platform for future growth in this market. Finally it diversifies NIB’s distribution mix through growing another distribution channel outside of NIB’s direct business, aggregator platforms, and partnerships.
GU’s recent performance looks reasonable and accretion stacks up Since 2013/2014, GU has delivered an 8.8% revenue CAGR and ~34% NPAT CAGR. NIB management believes the key residential health insurance component of the GU book can achieve a 5-6% net margin (in line with the AHRI target range), with the inpatriate book component potentially achieving a slightly better outcome. We estimate the GU acquisition accretion at ~2% pre synergies in FY18F (0.2% post synergies), rising to ~4-5% accretion post synergies in FY19-FY20. The 15.5x FY18F PE acquisition multiple also appears good value when considered against NIB and MPL’s current trading multiples (~18-20x PE), and the broader market (~16x).
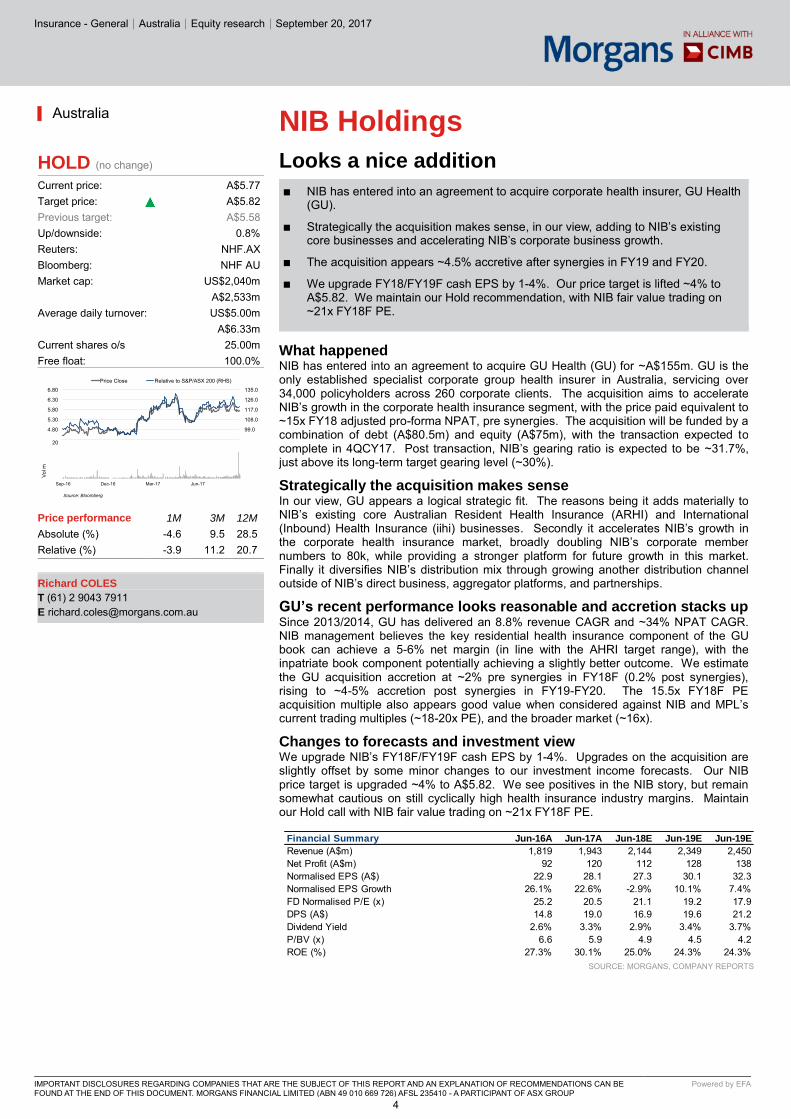
Changes to forecasts and investment view We upgrade NIB’s FY18F/FY19F cash EPS by 1-4%. Upgrades on the acquisition are slightly offset by some minor changes to our investment income forecasts. Our NIB price target is upgraded ~4% to A$5.82. We see positives in the NIB story, but remain somewhat cautious on still cyclically high health insurance industry margins. Maintain our Hold call with NIB fair value trading on ~21x FY18F PE.
SOURCE: MORGANS, COMPANY REPORTS
▎Australia
HOLD (no change) Current price: A$5.77 Target price: A$5.82 Previous target: A$5.58 Up/downside: 0.8% Reuters: NHF.AX Bloomberg: NHF AU Market cap: US$2,040m A$2,533m Average daily turnover: US$5.00m A$6.33m Current shares o/s 25.00m Free float: 100.0%
Price performance 1M 3M 12M
Absolute (%) -4.6 9.5 28.5 Relative (%) -3.9 11.2 20.7 Richard COLES
T (61) 2 9043 7911 E [email protected]
Financial Summary Jun-16A Jun-17A Jun-18E Jun-19E Jun-19E
Revenue (A$m) 1,819 1,943 2,144 2,349 2,450Net Profit (A$m) 92 120 112 128 138Normalised EPS (A$) 22.9 28.1 27.3 30.1 32.3Normalised EPS Growth 26.1% 22.6% -2.9% 10.1% 7.4%FD Normalised P/E (x) 25.2 20.5 21.1 19.2 17.9DPS (A$) 14.8 19.0 16.9 19.6 21.2Dividend Yield 2.6% 3.3% 2.9% 3.4% 3.7%P/BV (x) 6.6 5.9 4.9 4.5 4.2ROE (%) 27.3% 30.1% 25.0% 24.3% 24.3%
90.0
99.0
108.0
117.0
126.0
135.0
4.30
4.80
5.30
5.80
6.30
6.80
Price Close Relative to S&P/ASX 200 (RHS)
Source: Bloomberg
5101520
Sep-16 Dec-16 Mar-17 Jun-17
Vol m
4
Insurance - Life│Hong Kong│September 21, 2017
Company Note
IMPORTANT DISCLOSURES, INCLUDING ANY REQUIRED RESEARCH CERTIFICATIONS, ARE PROVIDED AT THE END OF THIS REPORT. IF THIS REPORT IS DISTRIBUTED IN THE UNITED STATES IT IS DISTRIBUTED BY CIMB SECURITIES (USA), INC. AND IS CONSIDERED THIRD-PARTY AFFILIATED RESEARCH.
Powered by the EFA Platform
Insert
AIA Group Turnaround part 2? ■ AIA Group’s US$3bn acquisition of CBA’s Australian & New Zealand insurance
operations, plus a 20-year bancassurance agreement, is its largest ever acquisition. ■ CBA’s low VONB margins and weak business growth momentum suggest this is an
underperforming business that could be turned around. ■ AIA’s successful integration of ING Malaysia (VONB margins rose substantially after
AIA acquisition) gives us reason to expect notable turnaround in CBA performance. ■ AIA Group has a track record of positive share price performance following past M&A. ■ No changes to estimates in this report. Add rating and HK$72 target price maintained.
US$3bn acquisition is AIA Group’s largest acquisition ever Yet the value of new business (VONB) of the acquired insurance operations from Commonwealth Bank of Australia (CBA) equates to only 1% of AIA Group’s VONB, and 3% of AIA Group’s embedded value (EV) in FY16, after upcoming reinsurance arrangements are considered. In our view, this is due to the historical underperformance of CBA’s life insurance operations, especially in recent years. In comparison, the US$1.7bn acquisition of ING Malaysia saw proforma FY11 VONB contribution of 5%.
Step 1: Significant reliance on reinsurance to control risks We applaud AIA Group’s move to reinsure the majority of the acquired life insurance business, as the Australian life insurance industry is facing rising claim inflation and the inability to reprice old policies upwards without experiencing higher lapse rates. The reinsurance would limit AIA’s exposure to possible unprofitable policies that were underpriced when sold by CBA.
Step 2: Turn around underperforming operations AIA Group’s US$1.7bn acquisition and successful integration of ING Malaysia in the past gives us reason to hope for an equally-successful turnaround in performance of the acquired CBA insurance operations. Similar to CBA’s insurance operations, ING Malaysia had significantly lower VONB margin than AIA at the time of acquisition. Following the acquisition, VONB margins for AIA Malaysia rose steadily from 37.8% in FY13 to 61.8% in 1H17, with VONB growing at a 29% CAGR over this period.
Estimate 2-4% EPS accretion in year 1-3 post acquisition We think this potential earnings accretion should not be a surprise, as the acquisition is funded by a combination of both debt and internal cash reserves, with no equity capital raising. The earnings accretion is primarily due to the earnings yield of 5.9% (the inverse of the acquisition P/E of 16.7x; note the earnings yield could be higher at 8.6% if we strip out exceptional items, resulting in an adjusted acquisition P/E of 11.7x), which is higher than the estimated cost of debt of 5%.
Integrating from a position of strength Our analysis of the data provided by the Australian Prudential Regulation Authority (APRA), the insurance industry regulator, indicates solid business momentum of AIA Australia in recent years. We are comforted that AIA Australia does not seem to be facing the same magnitude of issues as some of its peers in the industry.
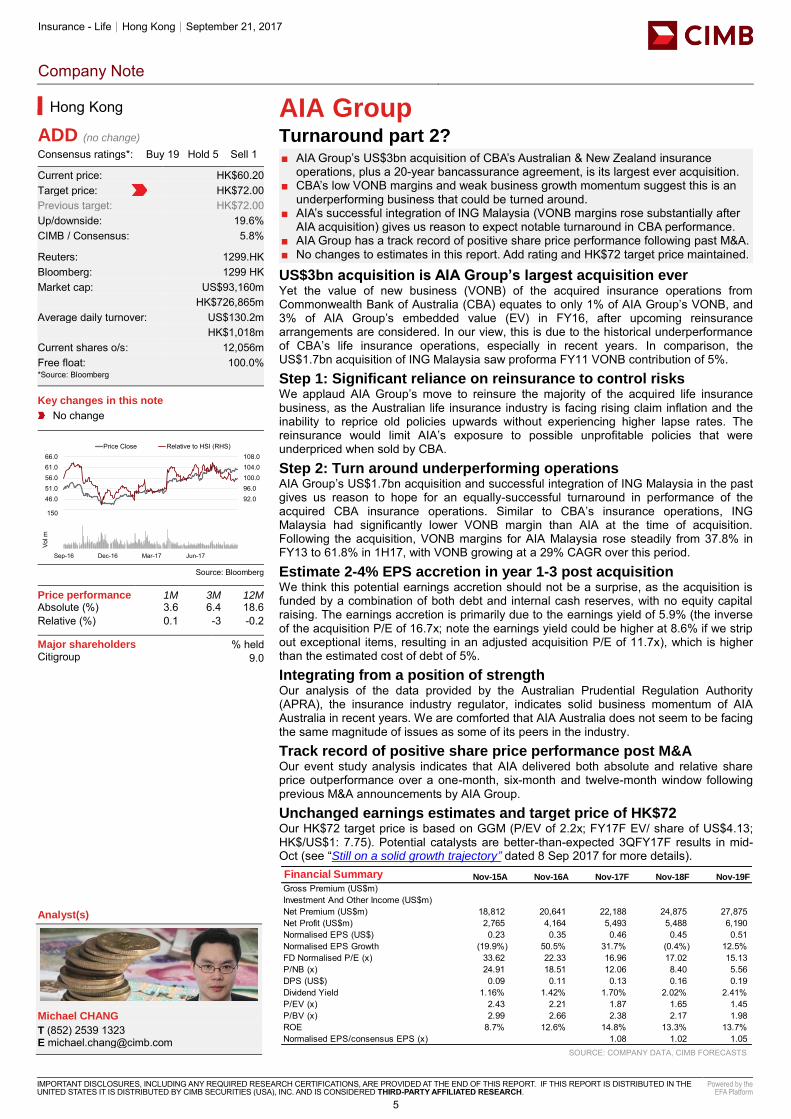
Track record of positive share price performance post M&A Our event study analysis indicates that AIA delivered both absolute and relative share price outperformance over a one-month, six-month and twelve-month window following previous M&A announcements by AIA Group.
Unchanged earnings estimates and target price of HK$72 Our HK$72 target price is based on GGM (P/EV of 2.2x; FY17F EV/ share of US$4.13; HK$/US$1: 7.75). Potential catalysts are better-than-expected 3QFY17F results in mid-Oct (see “Still on a solid growth trajectory” dated 8 Sep 2017 for more details).
SOURCE: COMPANY DATA, CIMB FORECASTS
Hong Kong
ADD (no change) Consensus ratings*: Buy 19 Hold 5 Sell 1
Current price: HK$60.20 Target price: HK$72.00 Previous target: HK$72.00
Up/downside: 19.6% CIMB / Consensus: 5.8%
Reuters: 1299.HK Bloomberg: 1299 HK Market cap: US$93,160m HK$726,865m Average daily turnover: US$130.2m HK$1,018m Current shares o/s: 12,056m Free float: 100.0% *Source: Bloomberg Key changes in this note
No change
Source: Bloomberg
Price performance 1M 3M 12M Absolute (%) 3.6 6.4 18.6 Relative (%) 0.1 -3 -0.2
Major shareholders % held Citigroup 9.0 Insert
Analyst(s)
Michael CHANG
T (852) 2539 1323 E [email protected]
88.092.096.0100.0104.0108.0
41.046.051.056.061.066.0
Price Close Relative to HSI (RHS)
50
100
150
Sep-16 Dec-16 Mar-17 Jun-17
Vol m
Financial Summary Nov-15A Nov-16A Nov-17F Nov-18F Nov-19F
Gross Premium (US$m)Investment And Other Income (US$m)Net Premium (US$m) 18,812 20,641 22,188 24,875 27,875Net Profit (US$m) 2,765 4,164 5,493 5,488 6,190Normalised EPS (US$) 0.23 0.35 0.46 0.45 0.51Normalised EPS Growth (19.9%) 50.5% 31.7% (0.4%) 12.5%FD Normalised P/E (x) 33.62 22.33 16.96 17.02 15.13P/NB (x) 24.91 18.51 12.06 8.40 5.56DPS (US$) 0.09 0.11 0.13 0.16 0.19Dividend Yield 1.16% 1.42% 1.70% 2.02% 2.41%P/EV (x) 2.43 2.21 1.87 1.65 1.45P/BV (x) 2.99 2.66 2.38 2.17 1.98ROE 8.7% 12.6% 14.8% 13.3% 13.7%Normalised EPS/consensus EPS (x) 1.08 1.02 1.05
5
Property Devt & Invt│Hong Kong│September 21, 2017
Company Note
IMPORTANT DISCLOSURES, INCLUDING ANY REQUIRED RESEARCH CERTIFICATIONS, ARE PROVIDED AT THE END OF THIS REPORT. IF THIS REPORT IS DISTRIBUTED IN THE UNITED STATES IT IS DISTRIBUTED BY CIMB SECURITIES (USA), INC. AND IS CONSIDERED THIRD-PARTY AFFILIATED RESEARCH.
Powered by the EFA Platform
Insert Insert
New World Development More value to unlock ■ NWD’s FY17 core profit dropped by 26% yoy due to disposal gains in FY16. However,
we expect more disposals in FY18. ■ NWD offers the highest FY18F dividend yield of 4.2% among developers, in our view.
Management is considering a share buyback in FY18F which would be positive. ■ NWD could be a key beneficiary of faster farmland conversion and redevelopment. ■ NWD’s China business has also benefited from the Big Bay Area concept. We
estimate that NWD may dispose another Rmb20bn of assets in China. ■ Maintain Add. HK$13.50 TP is based on a 40% discount to NAV.
Results missed but dividend above expectations NWD’s FY17 core profit came in at HK$7.1bn, missing our expectation by 5.5%, mainly due to lower property sales recognised. NWD reported core profit growth of 27% yoy after stripping out disposal gains from five projects in China in FY16. If including the disposal gains - as they are part of NWD’s property business - core profit dropped by 26% yoy. FY17 DPS rose 5% yoy to HK$0.46, implying a dividend yield of 4.2%.
Market responds positively to NWD’s projects Contracted sales in HK jumped 136% in FY17 to HK$15.6bn, mainly driven by Pavilia Bay and Mount Pavilia. Both projects were well-received by the market; 97% of the 983 units in Pavilia Bay were sold in eight months, while 159 luxury units at Mount Pavilia, with average ticket price of ~HK$20m, were sold by tender. In FY18, NWD plans to launch 100-unit The Parkville in Tuen Mun and 250-unit Artisan House in Sai Wan. Management is confident that it can achieve its HK$10bn sales target in FY18 for HK.
Beneficiary of faster farmland conversion + redevelopment As we highlighted in our thematic report on farmland conversion (link), NWD converted the Lung Tin Tsuen P3 project in Aug 17 with one of the highest plot ratios (5x) per farmland conversion. Management mentioned that it has converted 6.8msf farmland over the past decade and estimated that ~700ksf farmland may be converted in each of the next few years. Currently, NWD has 1.5msf of farmland submitted for approval. Apart from farmland, NWD has 2.4msf of old building redevelopment projects underway.
Focusing on Southern China; faster asset turnover in FY18 Contracted sales in China reached its target of Rmb16bn in FY17. Southern China accounted for 33%, and management expects the area to be a key driver going forward. The company maintains its sales target of Rmb16bn in FY18 for China. Management expects FY18 completions to increase by 29% to 1.7m sqm, following a 48% increase in FY17.
More asset reshuffling in China in FY18 The new management of NWD’s China business has been reshuffling assets in China via proactive disposals and strategic land banking since FY16. NWD disposed some of its projects in the non-core region in China for Rmb20bn and is planning to dispose more in FY18. We estimate that the 1.7m sqm landbank in the non-core region could be worth another Rmb20bn. NWD plans to focus more on land banking in Southern China.
Share buyback to create value for shareholders Management is considering a share buyback in FY18 as NWD does not have any plans for a restructuring in the next 12 months. We believe this will add value for shareholders as NWD is trading at a 51% discount to NAV.
Maintain Add We cut FY18F/19F core EPS by 5%/9% after updating the completion schedule. Our TP of HK$13.50 is based on a 40% discount to NAV. Key catalysts include 1) more farmland conversion in HK, 2) more asset disposals in China and 3) share buyback by NWD. Key risks: slowdown in HK/China’s economy, tightening policies in HK/China.
SOURCE: COMPANY DATA, CIMB FORECASTS
Hong Kong
ADD (no change) Consensus ratings*: Buy 15 Hold 3 Sell 0
Current price: HK$11.04 Target price: HK$13.50 Previous target: HK$13.50
Up/downside: 22.3% CIMB / Consensus: 10.7%
Reuters: 0017.HK Bloomberg: 17 HK Market cap: US$13,888m HK$108,404m Average daily turnover: US$23.41m HK$182.9m Current shares o/s: 9,815m Free float: 56.1% *Source: Bloomberg Key changes in this note
FY18F EPS decreased by 5%. FY19F EPS decreased by 9%.
Source: Bloomberg
Price performance 1M 3M 12M Absolute (%) 7.2 7.8 7.2 Relative (%) 3.7 -1.6 -11.6
Major shareholders % held Chow Tai Fook Enterprises Limited 44.0 Insert
Analyst(s)
Raymond CHENG, CFA
T (852) 2539 1324 E [email protected] Siu Fung LUNG, CFA T (852) 2539 1327 E [email protected]
Financial Summary Jun-16A Jun-17A Jun-18F Jun-19F Jun-20F
Total Net Revenues (HK$m) 59,570 56,629 65,059 58,935 76,979Operating EBITDA (HK$m) 11,431 12,496 13,204 11,680 16,052Net Profit (HK$m) 8,666 8,072 8,594 9,497 10,333Normalised EPS (HK$) 1.06 0.75 0.84 0.93 1.01Normalised EPS Growth 37.2% (29.3%) 11.9% 11.0% 9.2%FD Normalised P/E (x) 10.50 14.86 13.22 11.91 10.90DPS (HK$) 0.44 0.46 0.47 0.49 0.51Dividend Yield 3.99% 4.17% 4.26% 4.44% 4.62%EV/EBITDA (x) 11.93 12.99 12.67 13.81 9.45P/FCFE (x) NA 7.26 NA NA 14.02Net Gearing 39.7% 36.2% 33.0% 32.3% 29.1%P/BV (x) 0.58 0.58 0.40 0.41 0.40ROE 5.39% 3.90% 3.60% 3.40% 3.72%% Change In Normalised EPS Estimates (5.13%) (8.71%) Normalised EPS/consensus EPS (x) 1.03 1.05
80.0
86.3
92.5
98.8
105.0
7.80
8.80
9.80
10.80
11.80Price Close Relative to HSI (RHS)
50
100
150
Sep-16 Dec-16 Mar-17 Jun-17
Vol m
6
Petrochemical│Malaysia│September 21, 2017 Shariah Compliant
Company Note
IMPORTANT DISCLOSURES, INCLUDING ANY REQUIRED RESEARCH CERTIFICATIONS, ARE PROVIDED AT THE END OF THIS REPORT. IF THIS REPORT IS DISTRIBUTED IN THE UNITED STATES IT IS DISTRIBUTED BY CIMB SECURITIES (USA), INC. AND IS CONSIDERED THIRD-PARTY AFFILIATED RESEARCH.
Powered by the EFA Platform
Insert Insert
Lotte Chemical Titan Minimal impact from fire incident ■ Yesterday, LCT reported a minor fire incident at its PP3 expansion plant. The
company stated that the damage is minor and all plants are operating as usual. ■ We think LCT’s net profit growth is intact and project net profit of RM0.2bn-0.3bn for
3Q17F due to the 33-day planned shutdown of its naphtha cracker #1. ■ We expect 4Q17F earnings to return to normalised level of RM0.3bn-0.5bn a quarter,
driven by a higher utilisation rate of 90% (LCT’s historical average). ■ LCT plans to expand its water storage capacity in FY18F to prevent water shortage. ■ Maintain Add and TP of RM8.50, based on 5.5x FY18F EV/EBITDA (at 28% discount
to our PChem target EV/EBITDA of 7.6x, given PChem’s gas feedstock advantage).
Minor damage from the fire incident Yesterday, LCT reported that a fire broke out for 18 minutes at its PP3 expansion plant in Pasir Gudang, Johor. The company stated that the damage was small and all plants are operating as usual with no interruptions. LCT’s expansion projects for Ethylene (+93ktpa), Propylene (+127ktpa) and Benzene, Toluene & Xylene (BTX) (+134ktpa) are due to be completed in FY17F. This could be a key earnings growth driver in FY18F.
3Q17F earnings outlook intact After the disappointing 2Q17 results due to the unplanned shutdown because of a water shortage and multiple non-recurring items, we expect LCT’s net profit to recover in 3Q17F. We project average utilisation rate of 80% in 3Q17F for LCT, higher than the 70% in 2Q17 due to the water shortage and 60% in 1Q17 due to the 53-day planned shutdown of naphtha cracker #2 (longer than the planned shutdown of 33 days in 3Q17F for naphtha cracker #1).
4Q17F earnings outlook remains solid We project that LCT will continue improving its overall utilisation rate from 80% in 3Q17F to 90% in 4Q17F, bringing the average utilisation rate for FY17F to 75%, in line with our projection. We believe 3Q17F and 4Q17F earnings will be strong at RM0.2bn-0.5bn per quarter, thanks to high margins for HDPE-naphtha, benzene-naphtha and PP-naphtha, which would more than offset the weak BD-naphtha margin.
Water shortage prevention plan We think the major damage caused by the unplanned water shortage in 2Q17 is unlikely to recur because: 1) LCT plans to expand its water storage capacity from 1 day currently to 2 days by end-FY18F, 2) LCT has decided to only start plant operations when it is confident that there will be sufficient and consistent water supply. This is in contrast to 2Q17, when LCT incurred significant financial damages due to plants starting operations without proper confirmation of water supply from the water provider.
A deeply-undervalued play Trading at only 3.2x FY17F EV/EBITDA, significantly below its regional peers’ average of 8.3x, we think LCT remains attractive given the anticipated strong earnings growth recovery post 2Q17, driven by utilisation rate improvement in 3Q-4Q17F. Our target price of RM8.50 is based on 5.5x FY18F EV/EBITDA (at a 28% discount to our target 7.6x FY19F EV/EBITDA for PChem to reflect LCT’s higher operating risk and lower EBITDA margin). Risks are unplanned shutdowns and lower HDPE-naphtha margin.
SOURCE: COMPANY DATA, CIMB FORECASTS
Malaysia
ADD (no change) Consensus ratings*: Buy 8 Hold 0 Sell 0
Current price: RM5.25 Target price: RM8.50 Previous target: RM8.50
Up/downside: 61.9% CIMB / Consensus: 17.4%
Reuters: LOTT.KL Bloomberg: TTNP MK Market cap: US$2,850m RM11,933m Average daily turnover: US$9.07m RM39.14m Current shares o/s: 1,728m Free float: 26.4% *Source: Bloomberg Key changes in this note
No change.
Source: Bloomberg
Price performance 1M 3M 12M Absolute (%) -1.9 Relative (%) -1.9
Major shareholders % held Lotte Chemical Corporation 73.6 Dong Woo Lee 0.0 Kwan Ho Lee 0.0 Insert
Analyst(s)
Suwat SINSADOK, CFA, FRM
T (66) 2 761 9228 E [email protected]
Financial Summary Dec-15A Dec-16A Dec-17F Dec-18F Dec-19F
Revenue (RMm) 8,148 8,137 7,283 8,737 8,643Operating EBITDA (RMm) 1,546 2,190 2,166 2,578 2,627Net Profit (RMm) 613 1,315 1,299 1,590 2,013Core EPS (RM) 0.38 0.80 0.57 0.70 0.89Core EPS Growth 109% (28%) 22% 27%FD Core P/E (x) 13.76 6.58 8.08 7.51 5.93DPS (RM) 0.05 0.00 0.12 0.16 0.20Dividend Yield 0.89% 0.00% 2.29% 3.05% 3.81%EV/EBITDA (x) 4.99 3.71 3.14 3.05 3.07P/FCFE (x) 22.57 NA NA NA 48.05Net Gearing (21.9%) (12.1%) (35.0%) (25.6%) (22.1%)P/BV (x) 1.46 1.14 0.81 0.75 0.68ROE 12.2% 19.5% 11.5% 10.4% 12.0%% Change In Core EPS Estimates 0% 0% 0%CIMB/consensus EPS (x) 1.20 1.21 1.39
61.0
76.0
91.0
106.0
4.00
5.00
6.00
7.00Price Close Relative to FBMKLCI (RHS)
20
40
60
Jul-17 Jul-17 Aug-17 Sep-17
Vol m
7
Oil & Gas - Equipment & Svs│Malaysia│September 21, 2017 Shariah Compliant
Company Note
IMPORTANT DISCLOSURES, INCLUDING ANY REQUIRED RESEARCH CERTIFICATIONS, ARE PROVIDED AT THE END OF THIS REPORT. IF THIS REPORT IS DISTRIBUTED IN THE UNITED STATES IT IS DISTRIBUTED BY CIMB SECURITIES (USA), INC. AND IS CONSIDERED THIRD-PARTY AFFILIATED RESEARCH.
Powered by the EFA Platform
Insert Insert
UMW Oil & Gas Shares traded ex-rights from yesterday ■ UMW-OG’s shares traded ex-rights from 20 September 2017; our target price of 32
sen/share is on an ex-rights basis, vs. our cum-rights target of 33 sen previously. ■ Our historical per-share numbers have not changed because UMW-OG’s last cum-
rights share price was at 30 sen, which is also the exercise price of the rights. ■ We maintain our Hold call, as there are few catalysts for the stock given that day rates
in the jack-up drilling segment remain very weak. ■ Our target price remains based on DCF, using a real cost of equity of 12.6%.
Recap of the rights issue On 4 May 2017, UMW-OG proposed to raise RM1.8bn in cash, via the issue of 6,054m new rights shares, at a price of 30 sen each. Of the RM1.8bn raised, RM1.5bn will be used to pare down debt, with the residual amounts used for working capital and to defray issue costs. The settlement of the debt will free up some restricted cash, which will be used to pay back the RM308m in shareholder’s loan from UMW Holdings. The remaining debt will be refinanced into long-term loans, with the revolving credit balance cut down. Purpose of the rights UMW-OG needed to issue the rights because of the severe downturn in the jack-up drilling rig industry, with day rates halving from US$140,000/day in 2014 to just US$70,000/day currently. These low rates may persist for the foreseeable future, despite UMW-OG’s jack-up utilisation recovering from 27% last year to our forecast of 67% this year. As such, UMW-OG will not be able to generate sufficient operating cashflow to pay off its bank borrowings taken to buy new rigs at peak pre-2014 prices. Trading and payment for the rights Together with the rights, 1,513.4m free warrants will also be issued. UMW-OG’s share price traded ex-rights on 20 September 2017, and the rights shares and warrants shall be provisionally allotted to the shareholders whose names appear in the record of depositors of the company as at 5.00 p.m. on 25 September. The rights shares will commence trading on 26 September, and will cease being quoted on 3 October. The last day and time for acceptance, renunciation and payment is on 10 October. Warrants conversion period The free warrants have a 7-year validity period, and can be converted to new shares at 39.5 sen/warrant. The warrants can be converted six months after they are issued, i.e. from 25 March 2018 onwards.
UMW-OG guaranteed to receive its targeted RM1.8bn… Should minority shareholders of UMW-OG choose not to subscribe for the rights, PNB has given a guarantee to UMW-OG that UMW-OG will still be able to raise its target of RM1.8bn. However, in the interest of maintaining sufficient public spread for UMW-OG, PNB will not raise its shareholding in UMW-OG to above 65% (from 45.5% currently), but instead, PNB will subscribe for Redeemable Convertible Preference Shares (RCPS) at the same issue price of 30 sen/RCPS.
…via the RCPS issue to PNB Each RCPS can be converted to new ordinary shares in UMW-OG at zero cost, and has a maturity period of five years. RCPS not converted at the end of its maturity period will be automatically converted to new ordinary shares. The RCPS also entitles PNB to warrants with an exercise price of 39.5 sen/warrant.
SOURCE: COMPANY DATA, CIMB FORECASTS
Malaysia
HOLD (no change) Consensus ratings*: Buy 3 Hold 4 Sell 2
Current price: RM0.35 Target price: RM0.32 Previous target: RM0.32
Up/downside: -8.6% CIMB / Consensus: -29.6%
Reuters: UMOG.KL Bloomberg: UMWOG MK Market cap: US$180.7m RM756.7m Average daily turnover: US$1.50m RM6.39m Current shares o/s: 2,162m Free float: 44.9% *Source: Bloomberg Key changes in this note
No changes.
Source: Bloomberg
Price performance 1M 3M 12M
Absolute (%) 6.1 -28.6 -60 Relative (%) 6.3 -28.2 -67.1
Major shareholders % held Permodalan Nasional Bhd 45.5 EPF 9.6 Insert
Analyst(s)
Raymond YAP, CFA
T (60) 3 2261 9072 E [email protected]
Financial Summary Dec-15A Dec-16A Dec-17F Dec-18F Dec-19F
Revenue (RMm) 839.9 320.8 603.7 709.0 681.2Operating EBITDA (RMm) 263.1 (40.5) 137.1 208.1 207.1Net Profit (RMm) (369) (1,186) (189) (109) (143)Core EPS (RM) (0.00) (0.20) (0.05) (0.01) (0.02)Core EPS Growth (103%) 5043% (74%) (74%) 31%FD Core P/E (x) NA NA NA NA NADPS (RM) - - - - - Dividend Yield 0% 0% 0% 0% 0%EV/EBITDA (x) 14.08 NA 18.75 19.90 19.62P/FCFE (x) NA NA NA NA 7.11Net Gearing 88% 129% 32% 32% 31%P/BV (x) 0.23 0.34 0.71 0.73 0.75ROE (0.3%) (15.3%) (6.0%) (2.7%) (3.7%)% Change In Core EPS Estimates 0% 0% 0%CIMB/consensus EPS (x) 0.54 0.24 0.43
16
41
66
91
116
0.21
0.41
0.61
0.81
1.01Price Close Relative to FBMKLCI (RHS)
50
100
150
Sep-16 Dec-16 Mar-17 Jun-17
Vol m
8
Hospitals│Thailand│September 21, 2017 Shariah Compliant
Company Note
IMPORTANT DISCLOSURES, INCLUDING ANY REQUIRED RESEARCH CERTIFICATIONS, ARE PROVIDED AT THE END OF THIS REPORT. IF THIS REPORT IS DISTRIBUTED IN THE UNITED STATES IT IS DISTRIBUTED BY CIMB SECURITIES (USA), INC. AND IS CONSIDERED THIRD-PARTY AFFILIATED RESEARCH.
Powered by the EFA Platform
Insert Insert
Bangkok Dusit Med Service Tamer capex after Wellness Clinic ■ BDMS saw foreign and domestic patient traffic flows improve and we expect it to
report decent 3Q17F core earnings growth of 3% yoy and 43% qoq. ■ BDMS plans to open the outpatient clinics at its Wellness Clinic in Nov 17 and
inpatient clinics in 1H18. ■ BDMS also plans to open two hospitals in FY18F and three in FY19F. Thus, we
believe its heavy capex cycle is over. ■ The company subsequently aims to upgrade more of its facilities into centres of
excellence and to move into preventive care and health promotion. ■ Maintain Add. Our target price rises as we roll over valuations to FY19F, now based
on 39x P/E vs. 38x previously but still 0.5 s.d. above its 5-year historical mean.
Improving foreign patient flows in 3Q17F In a recent meeting, BDMS management said that patient traffic, especially foreigners, improved in 3Q17F. BDMS also saw a significant increase in patients from China, Russia and Australia. As such, we expect its topline to grow 6% yoy and its EBITDA margin to be 20.6% in 3Q17F, on par with that of 3Q16 but higher than 2Q17’s 19.3% as 3Q is normally the high season. As a result, we expect its core net profit to be THB2.3bn (US$68m), +3% yoy and +43% qoq, in 3Q17F.
Wellness Clinic to open in Nov 17 BDMS plans to open the outpatient segment for its Wellness Clinic in Nov 17 and inpatient department in 1H18. BDMS targets the Wellness Clinic to have 500 members within the next five years. However, the hospital has not disclosed details of the membership programme yet. There are concerns about its heavy investment in the BDMS Wellness Centre (~THB12.8bn, US$366m) and its ability to attract customers. BDMS forecasts project IRR of 14% and to achieve EBITDA breakeven by 2020.
Wellness Clinic the next catalyst As there has been some overhang given its heavy investment in the Wellness Clinic, we believe that the success of this project will be the next catalyst for its share price. As land cost accounts for 85% of the investment, depreciation is likely to be low. Given that preventive care typically generates higher margins than curative care, we believe the BDMS Wellness Centre will be a key earnings driver for BDMS in the medium term.
To achieve its 50-hospital target by FY19F BDMS plans to open two hospitals in 2018F and another three in 2019F, which will allow the group to meet its 50-hospital target by the end of FY19F. Management said that its strategy after this will be to upgrade more of its facilities into centres of excellence and move into preventive care and health promotion, rather than to add more hospitals. We concur with this strategy and believe that it is time for the group to reap the benefits of its aggressive expansion over the past two decades.
Maintain Add with target price rolled over to THB24.7 BDMS’s P/E valuation has de-rated significantly YTD on concerns about weak earnings. However, we believe that its earnings have troughed and are likely to pick up nicely over the next few years since newly-added hospitals are maturing and the pace of new opening slows. Therefore, we reiterate our Add call and roll forward our target price from THB22.20 (38x FY18F P/E, +0.5 s.d. from 5-year mean) to THB24.7 (39x FY19F P/E, +0.5 s.d.). Risks to our call are weak foreign patient flows.
SOURCE: COMPANY DATA, CIMB FORECASTS
Thailand
ADD (no change) Consensus ratings*: Buy 13 Hold 13 Sell 4
Current price: THB20.90 Target price: THB24.70 Previous target: THB22.20
Up/downside: 18.2% CIMB / Consensus: 14.4%
Reuters: BDMS.BK Bloomberg: BDMS TB Market cap: US$9,789m THB323,761m Average daily turnover: US$18.05m THB603.9m Current shares o/s: 15,491m Free float: 52.1% *Source: Bloomberg Key changes in this note
No change
Source: Bloomberg
Price performance 1M 3M 12M Absolute (%) 3.5 11.8 -6.3 Relative (%) -3.1 6 -19.7
Major shareholders % held Prasartthongorsoth family 29.7 Thongtang family 9.5 Insert
Analyst(s)
Kasem PRUNRATANAMALA, CFA
T (66) 2 761 9221 E [email protected]
Financial Summary Dec-15A Dec-16A Dec-17F Dec-18F Dec-19F
Revenue (THBm) 62,857 67,985 69,927 76,159 83,460Operating EBITDA (THBm) 13,287 13,867 13,954 15,596 17,316Net Profit (THBm) 7,917 8,386 10,242 8,987 9,818Core EPS (THB) 0.51 0.54 0.51 0.58 0.63Core EPS Growth 7.1% 5.9% (5.8%) 13.7% 9.2%FD Core P/E (x) 40.89 38.61 40.97 36.03 32.98DPS (THB) 0.24 0.26 0.27 0.33 0.29Dividend Yield 1.14% 1.22% 1.30% 1.58% 1.39%EV/EBITDA (x) 26.40 25.49 26.09 23.42 21.23P/FCFE (x) 60.7 126.5 68.8 64.2 66.7Net Gearing 43.5% 46.5% 59.9% 58.2% 57.1%P/BV (x) 6.03 5.81 5.24 4.93 4.56ROE 15.8% 15.3% 13.5% 14.1% 14.4%% Change In Core EPS Estimates 0% 0% 0%CIMB/consensus EPS (x) 1.28 1.01 0.94
72.0
82.0
92.0
102.0
17.0
19.0
21.0
23.0
Price Close Relative to SET (RHS)
100
200
300
Sep-16 Dec-16 Mar-17 Jun-17
Vol m
9
Property Development│Thailand│September 21, 2017
Company Note
IMPORTANT DISCLOSURES, INCLUDING ANY REQUIRED RESEARCH CERTIFICATIONS, ARE PROVIDED AT THE END OF THIS REPORT. IF THIS REPORT IS DISTRIBUTED IN THE UNITED STATES IT IS DISTRIBUTED BY CIMB SECURITIES (USA), INC. AND IS CONSIDERED THIRD-PARTY AFFILIATED RESEARCH.
Powered by the EFA Platform
Insert Insert
Supalai PCL Big project unveiled ■ SPALI plans to develop a mixed-use project with total value of THB17bn on the
Australian Embassy land plot in Bangkok. ■ We estimate SPALI will book a one-off gain of THB270m in 3Q17F from the sale of an
office building in Philippines. ■ We estimate EPS will contract by 10% in FY18F, as SPALI-W4 warrants are expected
to be in the money. ■ SPALI’s presales in 8M17 were THB18.9bn, representing 70% of its full-year target. ■ Retain Hold with a lower TP of THB23.50. Upside risk: stronger-than-expected
presales; downside risk: slower-than-expected transfers.
3Q17F to see one-off gain from sale of office building in Philippines SPALI sold an office building in the Philippines for Php1,620m on 7 Sep 17. The company bought the building in 2013 for Php1,340m. We estimate SPALI will book a one-off gain from the sale (net of tax and expenses) of c.THB270m (THB0.157/share) in 3Q17F. We think SPALI’s net profit will peak in 3Q17F to THB1.8bn, boosted by transfers of two condo projects (Supalai Loft Changwattana and Supalai Veranda Ratchavibha-Prachachuen) worth THB5.64bn and solid growth in low-rise housing presales YTD.
The winner of Australian Embassy land plot SPALI recently announced that it won the bid for the Australian Embassy land plot (total area of 3,182 sq wah) on Sathorn Road. It has included land acquisition cost of THB4.6bn (THB1.45m/sq wah) in its land capex budget for 2017F. We view the price as reasonable vs. the highest ASP of THB1.9m/sq wah for land on Chidlom Road. It plans to develop a mixed-use project (luxury condo and grade A-office building) on the site worth THB17bn. It plans to launch this project in 2H18F and to complete construction in 2022F.
A mixed-use project would be positive in the long term We view the announcement of the mixed-use project on the Australian Embassy plot as positive for SPALI's shareholders in the long term as the company expects this project to generate gross margin of at least 40% and IRR of 20%, on par with its other condo projects. However, we note that in the short term, its shareholders would be negatively affected by possible 20% dilution from the SPALI-W4 exercise. We estimate EPS will contract by 10% in FY18F as we expect SPALI-W4 warrants to be in the money then.
Presales likely to peak in 3Q17F We estimate SPALI’s presales in Jul-Aug 17 amounted to THB5.56bn. Presales momentum is likely to accelerate in Sep 17, boosted by launch of three condo projects worth THB5.5bn (received good feedback). The company expects Supalai Premier Charoen Nakhon to be sold out after the official launch on 22-24 Sep 17 and Supalai Loft Yaek Fai Chai Station is 65% sold. Presales in 8M17 of THB18.9bn represent 70% of its FY17F target. We expect SPALI to achieve its FY17F presales target of THB27bn.
Retain Hold in view of less attractive return in FY17-18F We raise EPS for FY17F by 0.4% but cut EPS for FY18-19F by 19.3-19.5% to factor in the changes in our key assumptions for interest expenses and number of fully-diluted shares due to the issuance of SPALI-W4. As a result, our new TP is THB23.50, based on 8.2x FY18F P/E (in line with its historical average forward P/E). We maintain our Hold call due to the suspension of dividends for FY17F and possible dilution from the exercise of SPALI-W4, which we think makes SPALI less attractive compared to its local peers.
SOURCE: COMPANY DATA, CIMB FORECASTS
Thailand
HOLD (no change) Consensus ratings*: Buy 22 Hold 4 Sell 2
Current price: THB23.30 Target price: THB23.50 Previous target: THB25.50
Up/downside: 0.9% CIMB / Consensus: -13.0%
Reuters: SPAL.BK Bloomberg: SPALI TB Market cap: US$1,209m THB39,996m Average daily turnover: US$5.91m THB197.1m Current shares o/s: 1,717m Free float: 71.2% *Source: Bloomberg Key changes in this note
FY17-19F interest expenses cut by 7.8-18.7%.
EPS increased by 0.4% for FY17F but decreased by 19.3-19.5% for FY18-19F.
FY18-19F number of outstanding shares increased by 25%.
Source: Bloomberg
Price performance 1M 3M 12M Absolute (%) -1.7 -11.2 3.1 Relative (%) -8.3 -17 -10.3
Major shareholders % held Tangmatitham family 28.2 Thai NVDR 9.6 State Street Bank 5.4 Insert
Analyst(s)
Pornthipa RAYABSANGDUAN
T (66) 2 761 9229 E [email protected]
Financial Summary Dec-15A Dec-16A Dec-17F Dec-18F Dec-19F
Total Net Revenues (THBm) 21,364 23,336 25,429 27,865 30,075Operating EBITDA (THBm) 5,956 6,498 7,136 8,030 8,722Net Profit (THBm) 4,349 4,887 5,457 6,137 6,629Core EPS (THB) 2.53 2.85 3.18 2.86 3.09Core EPS Growth (2.9%) 12.4% 11.7% (10.0%) 8.0%FD Core P/E (x) 9.20 8.18 7.33 8.15 7.54DPS (THB) 1.00 1.05 0.00 1.06 1.14Dividend Yield 4.29% 4.51% 0.00% 4.54% 4.91%EV/EBITDA (x) 10.07 9.43 8.25 8.69 7.95P/FCFE (x) 20.56 32.61 45.60 NA 22.34Net Gearing 94.8% 87.4% 64.0% 53.7% 46.1%P/BV (x) 2.02 1.74 1.46 1.46 1.30ROE 23.3% 22.8% 21.7% 19.9% 18.3%% Change In Core EPS Estimates 0.4% (19.3%) (19.5%)CIMB/consensus EPS (x) 1.04 0.91 0.88
86.0
96.0
106.0
116.0
21.0
23.0
25.0
27.0
Price Close Relative to SET (RHS)
20
40
60
Sep-16 Dec-16 Mar-17 Jun-17
Vol m
10
Asia Pacific Daily│Equity research│September 22, 2017
REGIONAL HEAD
Michael William GREENALL Regional Head of Research +60 (3) 2261 9088 [email protected]
COUNTRY HEADS OF RESEARCH
Ivy NG, CFA Siew Khee. LIM Erwan TEGUH Kasem PRUNRATANAMALA, CFA Ben BEI Malaysia Singapore Indonesia Thailand Hong Kong/China +60 (3) 2261-9073 +65 6210-8664 +62 (21) 3006-1720 +66 (2) 657-9221 +852 2532-1116 [email protected] [email protected] [email protected] [email protected] [email protected] Dohoon LEE Satish KUMAR South Korea India +82 (2) 6730-6121 +91 (22) 6602-5185 [email protected] [email protected] Yolan SEIMON Ralph Christian BODOLLO Sri Lanka Philippines +94 (11) 230-6273 +63 (2) 888-7118 [email protected] [email protected] Coverage via partnership arrangement with Coverage via partnership arrangement with John Keells Stock Brokers SB Equities
REGIONAL SECTOR HEADS
KJ KWANG Ivy NG, CFA Raymond YAP, CFA Offshore & Marine Plantations Transportation +82 (2) 6730-6123 +60 (3) 2261-9073 +60 (3) 2261-9072 [email protected] [email protected] [email protected]
7
11
Asia Pacific Daily│Equity research│September 22, 2017
DISCLAIMER WJV#05 The content of this report (including the views and opinions expressed therein, and the information comprised therein) has been prepared by and belongs to CIMB save that (i) if it is a report written by the analyst(s) of John Keells Stock Brokers (“John Keells”), it belongs to John Keells; (ii) if it is a report written by the analyst(s) of SB Equities Inc (“SBE”), it belongs to SBE; and (iii) if it is a report written by the analyst(s) of Morgans Financial Limited (“Morgans”), it belongs to Morgans. This report is distributed by CIMB and in respect of sections of the report relating to (i), (ii) and/or (iii) aforesaid, it is distributed pursuant to an arrangement between John Keells, SBE and Morgans respectively and none of the aforesaid parties is an affiliate of CIMB. This report is not directed to, or intended for distribution to or use by, any person or entity who is a citizen or resident of or located in any locality, state, country or other jurisdiction where such distribution, publication, availability or use would be contrary to law or regulation. By accepting this report, the recipient hereof represents and warrants that he is entitled to receive such report in accordance with the restrictions set forth below and agrees to be bound by the limitations contained herein (including the “Restrictions on Distributions” set out below). Any failure to comply with these limitations may constitute a violation of law. This publication is being supplied to you strictly on the basis that it will remain confidential. No part of this report may be (i) copied, photocopied, duplicated, stored or reproduced in any form by any means or (ii) redistributed or passed on, directly or indirectly, to any other person in whole or in part, for any purpose without the prior written consent of CIMB. The information contained in this research report is prepared from data believed to be correct and reliable at the time of issue of this report. CIMB, John Keells, SBE and/or Morgans, as the case may be, may or may not issue regular reports on the subject matter of this report at any frequency and may cease to do so or change the periodicity of reports at any time. None of CIMB, John Keells, SBE or Morgans is under any obligation to update this report in the event of a material change to the information contained in this report. None of CIMB, John Keells, SBE or Morgans has any and none of them will accept any, obligation to (i) check or ensure that the contents of this report remain current, reliable or relevant, (ii) ensure that the content of this report constitutes all the information a prospective investor may require, (iii) ensure the adequacy, accuracy, completeness, reliability or fairness of any views, opinions and information, and accordingly, CIMB, John Keells, SBE and Morgans and their respective affiliates and related persons (and their respective directors, associates, connected persons and/or employees) shall not be liable in any manner whatsoever for any consequences (including but not limited to any direct, indirect or consequential losses, loss of profits and damages) of any reliance thereon or usage thereof. In particular, CIMB, John Keells, SBE and Morgans disclaim all responsibility and liability for the views and opinions set out in this report. Unless otherwise specified, this report is based upon reasonable sources. Such sources will, unless otherwise specified, for market data, be market data and prices available from the main stock exchange or market where the relevant security is listed, or, where appropriate, any other market. Information on the accounts and business of company(ies) will generally be based on published statements of the company(ies), information disseminated by regulatory information services, other publicly available information and information resulting from our research. Whilst every effort is made to ensure that statements of facts made in this report are accurate, all estimates, projections, forecasts, expressions of opinion and other subjective judgments contained in this report are based on assumptions considered to be reasonable as of the date of the document in which they are contained and must not be construed as a representation that the matters referred to therein will occur. Past performance is not a reliable indicator of future performance. The value of investments may go down as well as up and those investing may, depending on the investments in question, lose more than the initial investment. No report shall constitute an offer or an invitation by or on behalf of CIMB, John Keells, SBE or Morgans or their respective affiliates to any person to buy or sell any investments. CIMB, John Keells, SBE and/or Morgans and/or their respective affiliates and related companies, their directors, associates, connected parties and/or employees may own or have positions in securities of the company(ies) covered in this research report or any securities related thereto and may from time to time add to or dispose of, or may be materially interested in, any such securities. Further, CIMB, John Keells, SBE and/or Morgans and/or their respective affiliates and related companies do and seek to do business with the company(ies) covered in this research report and may from time to time act as market maker or have assumed an underwriting commitment in securities of such company(ies), may sell them to or buy them from customers on a principal basis and may also perform or seek to perform significant investment banking, advisory, underwriting or placement services for or relating to such company(ies) as well as solicit such investment, advisory or other services from any entity mentioned in this report. CIMB, John Keells, SBE and/or Morgans and/or their respective affiliates may enter into an agreement with the company(ies) covered in this report relating to the production of research reports. CIMB, John Keells, SBE and/or Morgans may disclose the contents of this report to the company(ies) covered by it and may have amended the contents of this report following such disclosure. The analyst responsible for the production of this report hereby certifies that the views expressed herein accurately and exclusively reflect his or her personal views and opinions about any and all of the issuers or securities analysed in this report and were prepared independently and autonomously. No part of the compensation of the analyst(s) was, is, or will be directly or indirectly related to the inclusion of specific recommendations(s) or view(s) in this report. The analyst(s) who prepared this research report are prohibited from receiving any compensation, incentive or bonus based on specific investment banking transactions or for providing a specific recommendation for, or view of, a particular company. Information barriers and other arrangements may be established where necessary to prevent conflicts of interests arising. However, the analyst(s) may receive compensation that is based on his/their coverage of company(ies) in the performance of his/their duties or the performance of his/their recommendations and the research personnel involved in the preparation of this report may also participate in the solicitation of the businesses as described above. In reviewing this research report, an investor should be aware that any or all of the foregoing, among other things, may give rise to real or potential conflicts of interest. Additional information is, subject to the duties of confidentiality, available on request. The term “John Keells Stock Brokers” shall, unless the context otherwise requires, mean each of John Keells Stock Brokers and its affiliates, subsidiaries and related companies. The term “SB Equities Inc.” shall, unless the context otherwise requires, mean each of SB Equities Inc. and its affiliates, subsidiaries and related companies. The term “Morgans Financial Limited” shall, unless the context otherwise requires, mean each of Morgans Financial Limited and its affiliates, subsidiaries and related companies. The term “CIMB” shall denote, where appropriate, the relevant entity distributing or disseminating the report in the particular jurisdiction referenced below, or, in every other case, CIMB Group Holdings Berhad ("CIMBGH") and its affiliates, subsidiaries and related companies.
8
12
Asia Pacific Daily│Equity research│September 22, 2017
Country CIMB Entity Regulated by Hong Kong CIMB Securities Limited Securities and Futures Commission Hong Kong India CIMB Securities (India) Private Limited Securities and Exchange Board of India (SEBI) Indonesia PT CIMB Securities Indonesia Financial Services Authority of Indonesia Malaysia CIMB Investment Bank Berhad Securities Commission Malaysia Singapore CIMB Research Pte. Ltd. Monetary Authority of Singapore South Korea CIMB Securities Limited, Korea Branch Financial Services Commission and Financial Supervisory Service Thailand CIMB Securities (Thailand) Co. Ltd. Securities and Exchange Commission Thailand
Information in this report is a summary derived from individual research reports. As such, readers are directed to the individual research report or note to review the individual Research Analyst’s full analysis of the subject company. Important disclosures relating to the companies that are the subject of research reports published by CIMB, John Keells, SBE or Morgans, as the case may be, and the proprietary position by each of them and shareholdings of its Research Analysts’ who prepared the report in the securities of the company(s) are available in the individual research report. This report does not purport to contain all the information that a prospective investor may require. CIMB, John Keells, SBE and Morgans and their respective affiliates do not make any guarantee, representation or warranty, express or implied, as to the adequacy, accuracy, completeness, reliability or fairness of any such information and opinion contained in this report. None of CIMB, John Keells, SBE, Morgans and their respective affiliates and related persons shall be liable in any manner whatsoever for any consequences (including but not limited to any direct, indirect or consequential losses, loss of profits and damages) of any reliance thereon or usage thereof. This report is general in nature and has been prepared for information purposes only. It is intended for circulation amongst CIMB and its affiliates’ clients generally and does not have regard to the specific investment objectives, financial situation and the particular needs of any specific person who may receive this report. The information and opinions in this report are not and should not be construed or considered as an offer, recommendation or solicitation to buy or sell the subject securities, related investments or other financial instruments or any derivative instrument, or any rights pertaining thereto. Investors are advised to make their own independent evaluation of the information contained in this research report, consider their own individual investment objectives, financial situation and particular needs and consult their own professional and financial advisers as to the legal, business, financial, tax and other aspects before participating in any transaction in respect of the securities of company(ies) covered in this research report. The securities of such company(ies) may not be eligible for sale in all jurisdictions or to all categories of investors. Australia : The distribution of this report is not an offer to buy or sell to any person within or outside Australia or a solicitation to any person within or outside of Australia to buy or sell any instrument described herein. This report is being issued outside Australia to a limited number of institutional investors and may not be provided to any person other than the original recipient and may not be reproduced or used for any other purposes. Canada: This research report has not been prepared in accordance with the disclosure requirements of Dealer Member Rule 3400 – Research Restrictions and Disclosure Requirements of the Investment Industry Regulatory Organization of Canada. For any research report distributed by CIBC, further disclosures related to CIBC conflicts of interest can be found at https://researchcentral.cibcwm.com . China: For the purpose of this report, the People’s Republic of China (“PRC”) does not include the Hong Kong Special Administrative Region, the Macau Special Administrative Region or Taiwan. The distributor of this report has not been approved or licensed by the China Securities Regulatory Commission or any other relevant regulatory authority or governmental agency in the PRC. This report contains only marketing information. The distribution of this report is not an offer to buy or sell to any person within or outside PRC or a solicitation to any person within or outside of PRC to buy or sell any instruments described herein. This report is being issued outside the PRC to a limited number of institutional investors and may not be provided to any person other than the original recipient and may not be reproduced or used for any other purpose. France: Only qualified investors within the meaning of French law shall have access to this report. This report shall not be considered as an offer to subscribe to, or used in connection with, any offer for subscription or sale or marketing or direct or indirect distribution of financial instruments and it is not intended as a solicitation for the purchase of any financial instrument. Germany: This report is only directed at persons who are professional investors as defined in sec 31a(2) of the German Securities Trading Act (WpHG). This publication constitutes research of a non-binding nature on the market situation and the investment instruments cited here at the time of the publication of the information. The current prices/yields in this issue are based upon closing prices from Bloomberg as of the day preceding publication. Please note that neither the German Federal Financial Supervisory Agency (BaFin), nor any other supervisory authority exercises any control over the content of this report. Hong Kong: This report is issued and distributed in Hong Kong by CIMB Securities Limited (“CHK”) which is licensed in Hong Kong by the Securities and Futures Commission for Type 1 (dealing in securities), Type 4 (advising on securities) and Type 6 (advising on corporate finance) activities. Any investors wishing to purchase or otherwise deal in the securities covered in this report should contact the Head of Sales at CIMB Securities Limited. The views and opinions in this research report are of CIMB, John Keells, SBE or Morgans, as the case may be, as of the date hereof and are subject to change. If the Financial Services and Markets Act of the United Kingdom or the rules of the Financial Conduct Authority apply to a recipient, our obligations owed to such recipient therein are unaffected. CHK has no obligation to update its opinion or the information in this research report. This publication is strictly confidential and is for private circulation only to clients of CHK. India: This report is issued and distributed in India by CIMB Securities (India) Private Limited (”CIMB India") which is registered with SEBI as a stock-broker under the Securities and Exchange Board of India (Stock Brokers and Sub-Brokers) Regulations, 1992, the Securities and Exchange Board of India (Research Analyst) Regulations, 2014 (SEBI Registration Number INH000000669) and in accordance with the provisions of Regulation 4 (g) of the Securities and Exchange Board of India (Investment Advisers) Regulations, 2013, CIMB India is not required to seek registration with SEBI as an Investment Adviser. The research analysts, strategists or economists principally responsible for the preparation of this research report are segregated from equity stock broking and merchant banking of CIMB India and they have received compensation based upon various factors, including quality, accuracy and value of research, firm profitability or revenues, client feedback and competitive factors. Research analysts', strategists' or economists' compensation is not linked to investment banking or capital markets transactions performed or proposed to be performed by CIMB India or its affiliates.”
9
13
Asia Pacific Daily│Equity research│September 22, 2017
Indonesia: This report is issued and distributed by PT CIMB Securities Indonesia (“CIMBI”). The views and opinions in this research report are our own as of the date hereof and are subject to change. If the Financial Services and Markets Act of the United Kingdom or the rules of the Financial Conduct Authority apply to a recipient, our obligations owed to such recipient therein are unaffected. CIMBI has no obligation to update its opinion or the information in this research report. Neither this report nor any copy hereof may be distributed in Indonesia or to any Indonesian citizens wherever they are domiciled or to Indonesian residents except in compliance with applicable Indonesian capital market laws and regulations. This research report is not an offer of securities in Indonesia. The securities referred to in this research report have not been registered with the Financial Services Authority (Otoritas Jasa Keuangan) pursuant to relevant capital market laws and regulations, and may not be offered or sold within the territory of the Republic of Indonesia or to Indonesian citizens through a public offering or in circumstances which constitute an offer within the meaning of the Indonesian capital market law and regulations. Ireland: CIMB is not an investment firm authorised in the Republic of Ireland and no part of this document should be construed as CIMB acting as, or otherwise claiming or representing to be, an investment firm authorised in the Republic of Ireland. Malaysia: This report is issued and distributed by CIMB Investment Bank Berhad (“CIMB”) solely for the benefit of and for the exclusive use of our clients. If the Financial Services and Markets Act of the United Kingdom or the rules of the Financial Conduct Authority apply to a recipient, our obligations owed to such recipient therein are unaffected. CIMB has no obligation to update, revise or reaffirm its opinion or the information in this research reports after the date of this report. New Zealand: In New Zealand, this report is for distribution only to persons who are wholesale clients pursuant to section 5C of the Financial Advisers Act 2008. Singapore: This report is issued and distributed by CIMB Research Pte Ltd (“CIMBR”). CIMBR is a financial adviser licensed under the Financial Advisers Act, Cap 110 (“FAA”) for advising on investment products, by issuing or promulgating research analyses or research reports, whether in electronic, print or other form. Accordingly CIMBR is a subject to the applicable rules under the FAA unless it is able to avail itself to any prescribed exemptions. Recipients of this report are to contact CIMB Research Pte Ltd, 50 Raffles Place, #19-00 Singapore Land Tower, Singapore in respect of any matters arising from, or in connection with this report. CIMBR has no obligation to update its opinion or the information in this research report. This publication is strictly confidential and is for private circulation only. If you have not been sent this report by CIMBR directly, you may not rely, use or disclose to anyone else this report or its contents. If the recipient of this research report is not an accredited investor, expert investor or institutional investor, CIMBR accepts legal responsibility for the contents of the report without any disclaimer limiting or otherwise curtailing such legal responsibility. If the recipient is an accredited investor, expert investor or institutional investor, the recipient is deemed to acknowledge that CIMBR is exempt from certain requirements under the FAA and its attendant regulations, and as such, is exempt from complying with the following : (a) Section 25 of the FAA (obligation to disclose product information); (b) Section 27 (duty not to make recommendation with respect to any investment product without having a reasonable basis where you may be reasonably expected to rely on the recommendation) of the FAA; (c) MAS Notice on Information to Clients and Product Information Disclosure [Notice No. FAA-N03]; (d) MAS Notice on Recommendation on Investment Products [Notice No. FAA-N16]; (e) Section 36 (obligation on disclosure of interest in securities), and (f) any other laws, regulations, notices, directive, guidelines, circulars and practice notes which are relates to the above, to the extent permitted by applicable laws, as may be amended from time to time, and any other laws, regulations, notices, directive, guidelines, circulars, and practice notes as we may notify you from time to time. In addition, the recipient who is an accredited investor, expert investor or institutional investor acknowledges that a CIMBR is exempt from Section 27 of the FAA, the recipient will also not be able to file a civil claim against CIMBR for any loss or damage arising from the recipient’s reliance on any recommendation made by CIMBR which would otherwise be a right that is available to the recipient under Section 27 of the FAA, the recipient will also not be able to file a civil claim against CIMBR for any loss or damage arising from the recipient’s reliance on any recommendation made by CIMBR which would otherwise be a right that is available to the recipient under Section 27 of the FAA. South Korea: This report is issued and distributed in South Korea by CIMB Securities Limited, Korea Branch (“CIMB Korea”) which is licensed as a cash equity broker, and regulated by the Financial Services Commission and Financial Supervisory Service of Korea. In South Korea, this report is for distribution only to professional investors under Article 9(5) of the Financial Investment Services and Capital Market Act of Korea (“FSCMA”). Spain: This document is a research report and it is addressed to institutional investors only. The research report is of a general nature and not personalised and does not constitute investment advice so, as the case may be, the recipient must seek proper advice before adopting any investment decision. This document does not constitute a public offering of securities. CIMB is not registered with the Spanish Comision Nacional del Mercado de Valores to provide investment services. Sweden: This report contains only marketing information and has not been approved by the Swedish Financial Supervisory Authority. The distribution of this report is not an offer to sell to any person in Sweden or a solicitation to any person in Sweden to buy any instruments described herein and may not be forwarded to the public in Sweden. Switzerland: This report has not been prepared in accordance with the recognized self-regulatory minimal standards for research reports of banks issued by the Swiss Bankers’ Association (Directives on the Independence of Financial Research). Thailand: This report is issued and distributed by CIMB Securities (Thailand) Company Limited (“CIMBS”) based upon sources believed to be reliable (but their accuracy, completeness or correctness is not guaranteed). The statements or expressions of opinion herein were arrived at after due and careful consideration for use as information for investment. Such opinions are subject to change without notice and CIMBS has no obligation to update its opinion or the information in this research report. If the Financial Services and Markets Act of the United Kingdom or the rules of the Financial Conduct Authority apply to a recipient, our obligations owed to such recipient are unaffected. CIMB Securities (Thailand) Co., Ltd. may act or acts as Market Maker, and issuer and offerer of Derivative Warrants and Structured Note which may have the following securities as its underlying securities. Investors should carefully read and study the details of the derivative warrants in the prospectus before making investment decisions.
10
14
Asia Pacific Daily│Equity research│September 22, 2017
AAV, ADVANC, AMATA, ANAN, AOT, AP, BA, BANPU, BBL, BCH, BCP, BCPG, BDMS, BEAUTY, BEC, BEM, BJC, BH, BIG, BLA, BLAND, BPP, BTS, CBG, CENTEL, CHG, CK, CKP, COM7, CPALL, CPF, CPN, DELTA, DTAC, EA, EGCO, EPG, GFPT, GLOBAL, GLOW, GPSC, GUNKUL, HMPRO, INTUCH, IRPC, ITD, IVL, KBANK, KCE, KKP, KTB, KTC, LH, LHBANK, LPN, MAJOR, MALEE, MEGA, MINT, MONO, MTLS, PLANB, PSH, PTL, PTG, PTT, PTTEP, PTTGC, QH, RATCH, ROBINS, S, SAWAD, SCB, SCC, SCCC, SIRI, SPALI, SPRC, STEC, STPI, SUPER, TASCO, TCAP, THAI, THANI, THCOM, TISCO, TKN, TMB, TOP, TPIPL, TRUE, TTA, TU, TVO, UNIQ, VGI, WHA, WORK. Corporate Governance Report: The disclosure of the survey result of the Thai Institute of Directors Association (“IOD”) regarding corporate governance is made pursuant to the policy of the Office of the Securities and Exchange Commission. The survey of the IOD is based on the information of a company listed on the Stock Exchange of Thailand and the Market for Alternative Investment disclosed to the public and able to be accessed by a general public investor. The result, therefore, is from the perspective of a third party. It is not an evaluation of operation and is not based on inside information. The survey result is as of the date appearing in the Corporate Governance Report of Thai Listed Companies. As a result, the survey result may be changed after that date. CIMBS does not confirm nor certify the accuracy of such survey result.
Score Range: 90 - 100 80 - 89 70 - 79 Below 70 or No Survey Result Description: Excellent Very Good Good N/A
United Arab Emirates: The distributor of this report has not been approved or licensed by the UAE Central Bank or any other relevant licensing authorities or governmental agencies in the United Arab Emirates. This report is strictly private and confidential and has not been reviewed by, deposited or registered with UAE Central Bank or any other licensing authority or governmental agencies in the United Arab Emirates. This report is being issued outside the United Arab Emirates to a limited number of institutional investors and must not be provided to any person other than the original recipient and may not be reproduced or used for any other purpose. Further, the information contained in this report is not intended to lead to the sale of investments under any subscription agreement or the conclusion of any other contract of whatsoever nature within the territory of the United Arab Emirates. United Kingdom: In the United Kingdom and European Economic Area, this report is being disseminated by CIMB Securities (UK) Limited (“CIMB UK”). CIMB UK is authorized and regulated by the Financial Conduct Authority and its registered office is at 27 Knightsbridge, London, SW1X7YB. Unless specified to the contrary, this report has been issued and approved for distribution in the U.K. and the EEA by CIMB UK. Investment research issued by CIMB UK has been prepared in accordance with CIMB Group’s policies for managing conflicts of interest arising as a result of publication and distribution of investment research. This report is for distribution only to, and is solely directed at, selected persons on the basis that those persons: (a) are eligible counterparties and professional clients of CIMB UK; (b) have professional experience in matters relating to investments falling within Article 19(5) of the Financial Services and Markets Act 2000 (Financial Promotion) Order 2005 (as amended, the “Order”), (c) fall within Article 49(2)(a) to (d) (“high net worth companies, unincorporated associations etc”) of the Order; (d) are outside the United Kingdom subject to relevant regulation in each jurisdiction, or (e) are persons to whom an invitation or inducement to engage in investment activity (within the meaning of section 21 of the Financial Services and Markets Act 2000) in connection with any investments to which this report relates may otherwise lawfully be communicated or caused to be communicated (all such persons together being referred to as “relevant persons”). This report is directed only at relevant persons and must not be acted on or relied on by persons who are not relevant persons. Any investment or investment activity to which this report relates is available only to relevant persons and will be engaged in only with relevant persons. Where this report is labelled as non-independent, it does not provide an impartial or objective assessment of the subject matter and does not constitute independent “investment research” under the applicable rules of the Financial Conduct Authority in the UK. Consequently, any such non-independent report will not have been prepared in accordance with legal requirements designed to promote the independence of investment research and will not subject to any prohibition on dealing ahead of the dissemination of investment research. Any such non-independent report must be considered as a marketing communication. United States: This research report is distributed in the United States of America by CIMB Securities (USA) Inc, a U.S. registered broker-dealer and a related company of CIMB Research Pte Ltd, CIMB Investment Bank Berhad, PT CIMB Securities Indonesia, CIMB Securities (Thailand) Co. Ltd, CIMB Securities Limited, CIMB Securities (India) Private Limited, and is distributed solely to persons who qualify as “U.S. Institutional Investors” as defined in Rule 15a-6 under the Securities and Exchange Act of 1934. This communication is only for Institutional Investors whose ordinary business activities involve investing in shares, bonds, and associated securities and/or derivative securities and who have professional experience in such investments. Any person who is not a U.S. Institutional Investor or Major Institutional Investor must not rely on this communication. The delivery of this research report to any person in the United States of America is not a recommendation to effect any transactions in the securities discussed herein, or an endorsement of any opinion expressed herein. CIMB Securities (USA) Inc, is a FINRA/SIPC member and takes responsibility for the content of this report. For further information or to place an order in any of the above-mentioned securities please contact a registered representative of CIMB Securities (USA) Inc. Other jurisdictions: In any other jurisdictions, except if otherwise restricted by laws or regulations, this report is only for distribution to professional, institutional or sophisticated investors as defined in the laws and regulations of such jurisdictions.
Corporate Governance Report of Thai Listed Companies (CGR). CG Rating by the Thai Institute of Directors Association (Thai IOD) in 2016, Anti-Corruption 2016 AAV – Very Good, n/a, ADVANC – Very Good, Certified, AEONTS – Good, n/a, AMATA – Excellent, Declared, ANAN – Very Good, Declared, AOT – Excellent, Declared, AP – Very Good, Declared, ASK – Very Good, Declared, ASP – Very Good, Certified, BANPU – Very Good, Certified, BAY – Excellent, Certified, BBL – Very Good, Certified, BCH – not available, Declared, BCP - Excellent, Certified, BEM – Very Good, n/a, BDMS – Very Good, n/a, BEAUTY – Good, Declared, BEC - Good, n/a, BH - Good, Declared, BIGC - Excellent, Declared, BJC – Good, n/a, BJCHI – Good, Declared, BLA – Very Good, Certified, BPP – not available, n/a, BR - Good, n/a, BTS - Excellent, Certified, CBG – Good, n/a, CCET – not available, n/a, CENTEL – Very Good, Certified, CHG – Very Good, n/a, CK – Excellent, n/a, COL – Very Good, Declared, CPALL – not available, Declared, CPF – Excellent, Declared, CPN - Excellent, Certified, DELTA - Excellent, Declared, DEMCO – Excellent, Certified, DIF – not available, n/a, DTAC – Excellent, Certified, EA – Very Good, Declared, ECL – Good, Certified, EGCO - Excellent, Certified, EPG – Good, n/a, GFPT - Excellent, Declared, GGC – not available, n/a, GLOBAL – Very Good, Declared, GLOW – Very Good, Certified,
11
15

Asia Pacific Daily│Equity research│September 22, 2017
GPSC – Excellent, Declared, GRAMMY - Excellent, n/a, GUNKUL – Very Good, Declared, HANA - Excellent, Certified, HMPRO - Excellent, Declared, ICHI – Very Good, Declared, III – not available, n/a, INTUCH - Excellent, Certified, IRPC – Excellent, Certified, ITD – Good, n/a, IVL - Excellent, Certified, JAS – not available, Declared, JASIF – not available, n/a, JUBILE – Good, Declared, KAMART – not available, n/a, KBANK - Excellent, Certified, KCE - Excellent, Certified, KGI – Good, Certified, KKP – Excellent, Certified, KSL – Very Good, Declared, KTB - Excellent, Certified, KTC – Excellent, Certified, LH - Very Good, n/a, LPN – Excellent, Declared, M – Very Good, Declared, MACO – Very Good, n/a, MAJOR - Good, n/a, MAKRO – Good, Declared, MALEE – Very Good, Declared, MBKET – Very Good, Certified, MC – Very Good, Declared, MCOT – Excellent, Declared, MEGA – Very Good, Declared, MINT - Excellent, Certified, MTLS – Very Good, Declared, NYT – Excellent, n/a, OISHI – Very Good, n/a, PLANB – Very Good, Declared, PLAT – Good, Declared, PSH – not available, n/a, PSL - Excellent, Certified, PTT - Excellent, Certified, PTTEP - Excellent, Certified, PTTGC - Excellent, Certified, QH – Excellent, Declared, RATCH – Excellent, Certified, ROBINS – Very Good, Declared, RS – Very Good, n/a, SAMART - Excellent, n/a, SAPPE - Good, n/a, SAT – Excellent, Certified, SAWAD – Good, n/a, SC – Excellent, Declared, SCB - Excellent, Certified, SCBLIF – not available, n/a, SCC – Excellent, Certified, SCN – Good, Declared, SCCC - Excellent, Declared, SIM - Excellent, n/a, SIRI - Good, n/a, SPA - Good, n/a, SPALI - Excellent, Declared, SPRC – Very Good, Declared, STA – Very Good, Declared, STEC – Excellent, n/a, SVI – Excellent, Certified, TASCO – Very Good, Declared, TCAP – Excellent, Certified, THAI – Very Good, Declared, THANI – Very Good, Certified, THCOM – Excellent, Certified, THRE – Very Good, Certified, THREL – Very Good, Certified, TICON – Very Good, Declared, TIPCO – Very Good, Certified, TISCO - Excellent, Certified, TK – Very Good, n/a, TKN – Good, n/a, TMB - Excellent, Certified, TNR – not available, n/a, TOP - Excellent, Certified, TPCH – Good, n/a, TPIPP – not available, n/a, TRUE – Very Good, Declared, TTW – Very Good, Declared, TU – Excellent, Declared, TVO – Very Good, Declared UNIQ – not available, Declared, VGI – Excellent, Declared, WHA – not available, Declared, WHART – not available, n/a, WORK – not available, n/a. Companies participating in Thailand’s Private Sector Collective Action Coalition Against Corruption programme (Thai CAC) under Thai Institute of Directors (as of October 28, 2016) are categorized into: - Companies that have declared their intention to join CAC, and - Companies certified by CAC
CIMB Recommendation Framework Stock Ratings Definition: Add The stock’s total return is expected to exceed 10% over the next 12 months. Hold The stock’s total return is expected to be between 0% and positive 10% over the next 12 months. Reduce The stock’s total return is expected to fall below 0% or more over the next 12 months. The total expected return of a stock is defined as the sum of the: (i) percentage difference between the target price and the current price and (ii) the forward net dividend yields of the stock. Stock price targets have an investment horizon of 12 months.
Sector Ratings Definition: Overweight An Overweight rating means stocks in the sector have, on a market cap-weighted basis, a positive absolute recommendation. Neutral A Neutral rating means stocks in the sector have, on a market cap-weighted basis, a neutral absolute recommendation. Underweight An Underweight rating means stocks in the sector have, on a market cap-weighted basis, a negative absolute recommendation.
Country Ratings Definition: Overweight An Overweight rating means investors should be positioned with an above-market weight in this country relative to benchmark. Neutral A Neutral rating means investors should be positioned with a neutral weight in this country relative to benchmark. Underweight An Underweight rating means investors should be positioned with a below-market weight in this country relative to benchmark.
12
16