Embed Size (px)
Citation preview

Equity Update
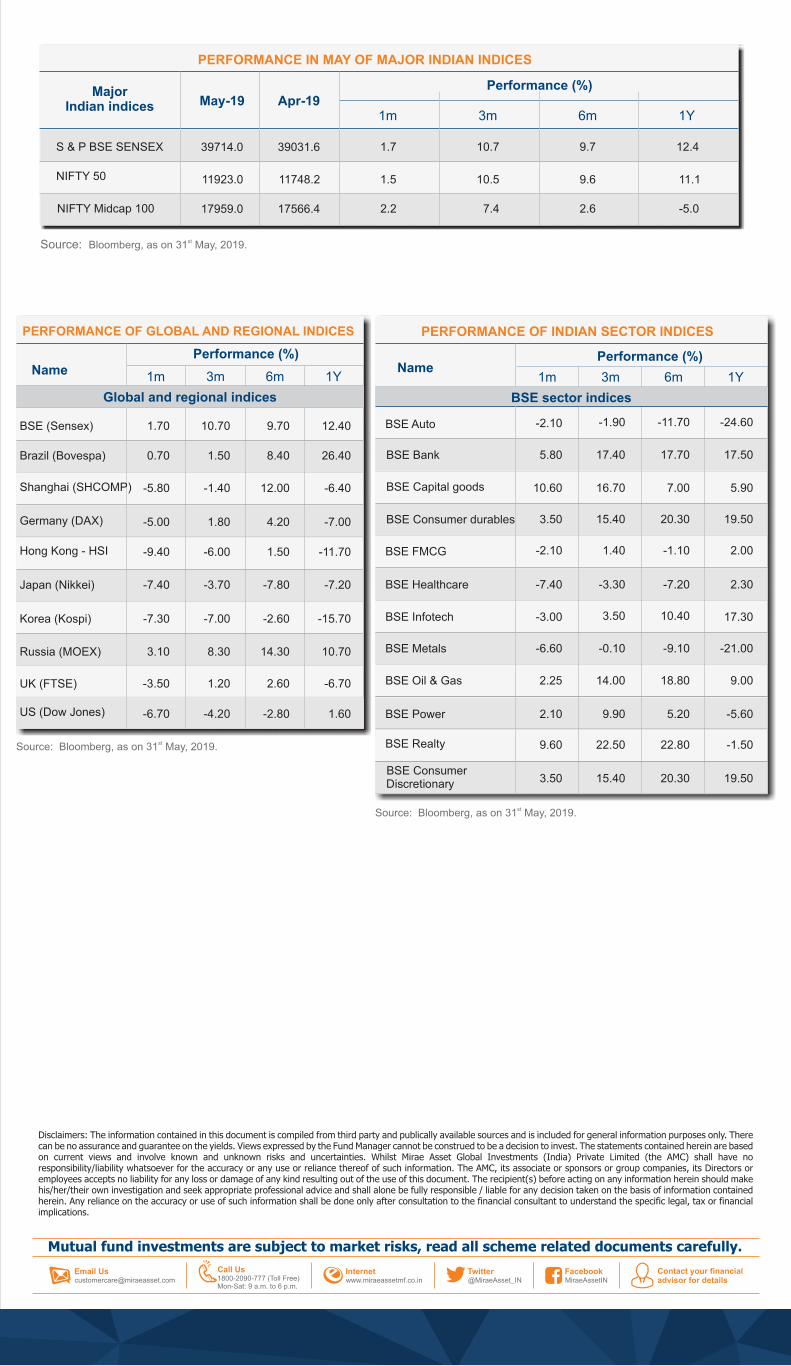
The BSE-30 Index and Nifty-50 Index gained
1.7% and 1.5% amid volatile sessions (both
+10% CYTD). BSE Midcap and BSE Small cap
gained 1.4% and 1.7% respectively. Global
markets were weak in May – S&P 500 and Euro
Stoxx 50 declined by 6.6% (+10% CYTD) and
6.7% (+9% CYTD) respectively, and MSCI
Emerging Markets index declined 7.5% (+3%
CYTD) during the month.
At the beginning of the month, sentiment
remained fragile with escalation in US-China trade
war. However, the BSE-30 Index touched an all-
time high with exit polls predicting victory for BJP.
Then, eventually BJP-led NDA government came
in to power, with BJP alone securing 303 seats.
On the sectoral front, BSE Capital Goods and BSE Realty indices outperformed rising 10.6% and 9.6% respectively, while BSE Healthcare and BSE Metals declined most, down by 7.4% and 6.6% respectively.
Global MacrosThe US 10 year bond yield contracted by 38 bps
and was quoting at 2.12% on May 31st. The dollar
index was at 97.8 at the end of May, 30 bps higher
over April.
Brent crude reversed its upward trend and
declined by 12.4% in May, quoting at
USD62.9/bbl on May 31st.
Sea-saw of US-China trade negotiations
hovering on global growth: The US-China
trade tensions re-escalated in May, with trade
negotiations breaking down and tariffs raised by
both sides. On 10 May, the US government
announced tariff increase from 10% to 25% on
about USD200b of Chinese goods. Three days
later on 13 May, China announced retaliatory
tariffs on about USD60b of US imports, with the
tariff rates to be raised from the current 5%-10%
range to 5%-25%, effective 1 June. In the
meantime, global manufacturing PMI for April
dropped to 50.3, its lowest level since Jun'16.
Domestic MacrosInflation: (a) CPI inflation hardened to 2.92% in
April from 2.86% in March led by food prices, (b) WPI
inflation moderated to 3.07% in April from 3.18% in
March, primarily due to a moderation in fuel and
manufacturing inflation
Currency: The Indian Rupee ended May broadly flat
at INR69.7/USD vs INR69.6/USD on April 30th.
Growth: March IIP growth came in at -0.1%, as
against +0.1% in February, primarily led by slowdown
in the manufacturing segment.
Trade Deficit: Trade deficit in April was USD15.3b
(v/s USD10.9b in March 2019), at a 5-month high
primarily led by contraction in the non-oil exports and
an increase in non-oil imports.
Regulatory, policy and market develop-ments
Decisive Electoral Mandate: The National
Democratic Alliance (NDA) has won the 17th Lok
Sabha elections with a thumping two thirds majority.
The BJP won its highest-ever tally of 303 seats in the
2019 general election, surpassing the 282 benchmark
set in the previous elections and also comfortably
topping the halfway mark of 272. This is
unprecedented, as it is the first time since 1971 that
an incumbent Prime Minister with majority is voted
back with an even bigger majority. This decisive
mandate reinforces optimisms of stability, decisive
leadership, and continuity in reforms and policy
agenda. Also, by 2020, the BJP and its allies should
also have a majority in the upper house, making
legislative change easier.
Weak GDP print in 4QFY19: 4QFY19 GDP growth fell more than expected to 5.8%YY, lowest since 4QFY14. This was led by a sharp slowdown in investment, whose contribution to GDP growth fell to 1.1pp in 4Q. Real GVA growth fell to 5.7%YY led by weakness in industry and agriculture. In annual terms, FY19 GDP also fell to five-year low of 6.8%YY. Overall the weak 4Q GDP print corroborates the trend from high frequency indicators of a material slowdown in economic activity. Equity trading trends: FIIs net bought equities worth USD1.3b and DIIs bought equities worth USD753m during May. For calendar year 2019, FIIs bought equities worth USD11b and DIIs sold USD1.6b.Fy19 fiscal deficit contained at 3.4%: The government managed to meet the fiscal deficit target of 3.4% in FY2019. Even though gross tax revenues fell short of FY2019RE by INR1.7t, the shortfall was made up for by expenditure cuts of INR1.1t.GST revenues: May 2019 GST collections stood at INR1t (+6.7% YoY), however still run below the required runrate of INR1.13t.
4QFY19 result summary
Financials led growth in 4QFY19: 4QFY19 net
profits of the Nifty-50 Index increased 16.5% YoY.
Domestic Cyclicals continued driving earnings growth
for the second consecutive quarter, led by Financials.
Sectoral trends in 4QFY19 Auto: In 4QFY19,
auto demand (similar to past two quarters) was
impacted by (a) weak buying sentiment in rural areas,
(b) liquidity crunch and (c) a high base. While most
OEMs have slashed their growth guidance for FY20,
demand is likely to be driven by BS-VI-related pre-buy
in 2HFY20.
May 2019
Source: stBloomberg, as on 31 May, 2019.
Telecom: Telecom delivered its seventh consecutive quarter of loss. Minimum ARPU plans by incumbents helped ARPU up 18-20% QoQ (for incumbents), though at the cost of subscriber churn.
Utilities: Electricity generation increased just 1.5%
YoY in 4QFY19. The tepid generation (demand) was
partly on account of an extended winter in certain
regions of the country. Lower demand along higher
coal offtake though has improved the coal supply
situation at power plants.
Market OutlookExpect policy initiatives to continue amidst
near term challenges: Finally, the most discussed
and awaited event (elections) is over. And the focus is
back to business. We believe, the historic win for the
incumbent was the best case outcome. Hence, the
reform agenda will be on the guided path. The policy
continuity will prevail, which will act as a impetus for
the earnings growth revival. The recent economic
slowdown, which the country has witnessed led by
liquidity and many other factors is the key problem for
government to be addressed. As mentioned earlier,
this slowdown is a temporary phase and we are on a
very strong footing from long term perspective. Going
forward, we will await for the key policy reforms to be
undertaken by the government like – direct tax code,
focus on exports, job creation, building hard and soft
infrastructure. However, given the tight fiscal
situation, it will be challenging for the government to
stimulate the economy.
Trade war escalates, lower crude a silver lining for India:
On the global front, trade war discussions are behaving like sea-saw. Last month, it seemed things are improving, however they have suddenly turned other way. With the recent escalation in the situation, this has led to fear of economic slowdown on the global front. Moderation of crude price is a silver lining for India, in the interim. As mentioned earlier, 2HFY20 is expected to be significantly better led by host of factors including policy initiatives of the new government, expected rate cut by the RBI, moderate inflation scenario and favourable base.
Key things to watch out for: Apart from usual macroeconomic parameters and corporate earnings trend, key things to watch out for includes (a) monsoon trends, (b) improvement of liquidity in the system, (c) improvement in the high frequency data and (d) policy initiatives of the new government.
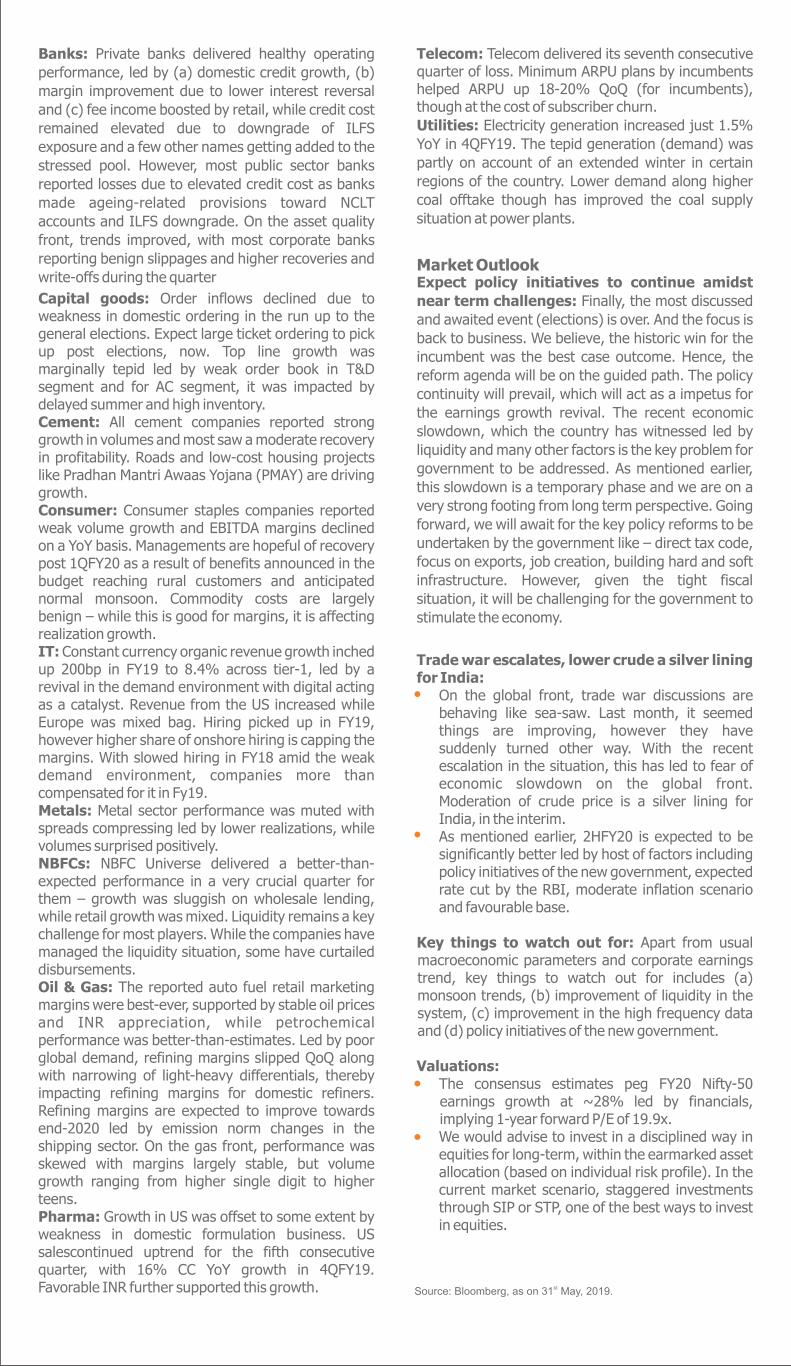
Valuations: The consensus estimates peg FY20 Nifty-50 earnings growth at ~28% led by financials, implying 1-year forward P/E of 19.9x. We would advise to invest in a disciplined way in equities for long-term, within the earmarked asset allocation (based on individual risk profile). In the current market scenario, staggered investments through SIP or STP, one of the best ways to invest in equities.
Source: stBloomberg, as on 31 May, 2019.
Banks: Private banks delivered healthy operating
performance, led by (a) domestic credit growth, (b)
margin improvement due to lower interest reversal
and (c) fee income boosted by retail, while credit cost
remained elevated due to downgrade of ILFS
exposure and a few other names getting added to the
stressed pool. However, most public sector banks
reported losses due to elevated credit cost as banks
made ageing-related provisions toward NCLT
accounts and ILFS downgrade. On the asset quality
front, trends improved, with most corporate banks
reporting benign slippages and higher recoveries and
write-offs during the quarter
Capital goods: Order inflows declined due to weakness in domestic ordering in the run up to the general elections. Expect large ticket ordering to pick up post elections, now. Top line growth was marginally tepid led by weak order book in T&D segment and for AC segment, it was impacted by delayed summer and high inventory. Cement: All cement companies reported strong growth in volumes and most saw a moderate recovery in profitability. Roads and low-cost housing projects like Pradhan Mantri Awaas Yojana (PMAY) are driving growth.Consumer: Consumer staples companies reported weak volume growth and EBITDA margins declined on a YoY basis. Managements are hopeful of recovery post 1QFY20 as a result of benefits announced in the budget reaching rural customers and anticipated normal monsoon. Commodity costs are largely benign – while this is good for margins, it is affecting realization growth.IT: Constant currency organic revenue growth inched up 200bp in FY19 to 8.4% across tier-1, led by a revival in the demand environment with digital acting as a catalyst. Revenue from the US increased while Europe was mixed bag. Hiring picked up in FY19, however higher share of onshore hiring is capping the margins. With slowed hiring in FY18 amid the weak demand environment, companies more than compensated for it in Fy19. Metals: Metal sector performance was muted with spreads compressing led by lower realizations, while volumes surprised positively. NBFCs: NBFC Universe delivered a better-than-expected performance in a very crucial quarter for them – growth was sluggish on wholesale lending, while retail growth was mixed. Liquidity remains a key challenge for most players. While the companies have managed the liquidity situation, some have curtailed disbursements. Oil & Gas: The reported auto fuel retail marketing margins were best-ever, supported by stable oil prices and INR appreciation, while petrochemical performance was better-than-estimates. Led by poor global demand, refining margins slipped QoQ along with narrowing of light-heavy differentials, thereby impacting refining margins for domestic refiners. Refining margins are expected to improve towards end-2020 led by emission norm changes in the shipping sector. On the gas front, performance was skewed with margins largely stable, but volume growth ranging from higher single digit to higher teens. Pharma: Growth in US was offset to some extent by weakness in domestic formulation business. US salescontinued uptrend for the fifth consecutive quarter, with 16% CC YoY growth in 4QFY19. Favorable INR further supported this growth.
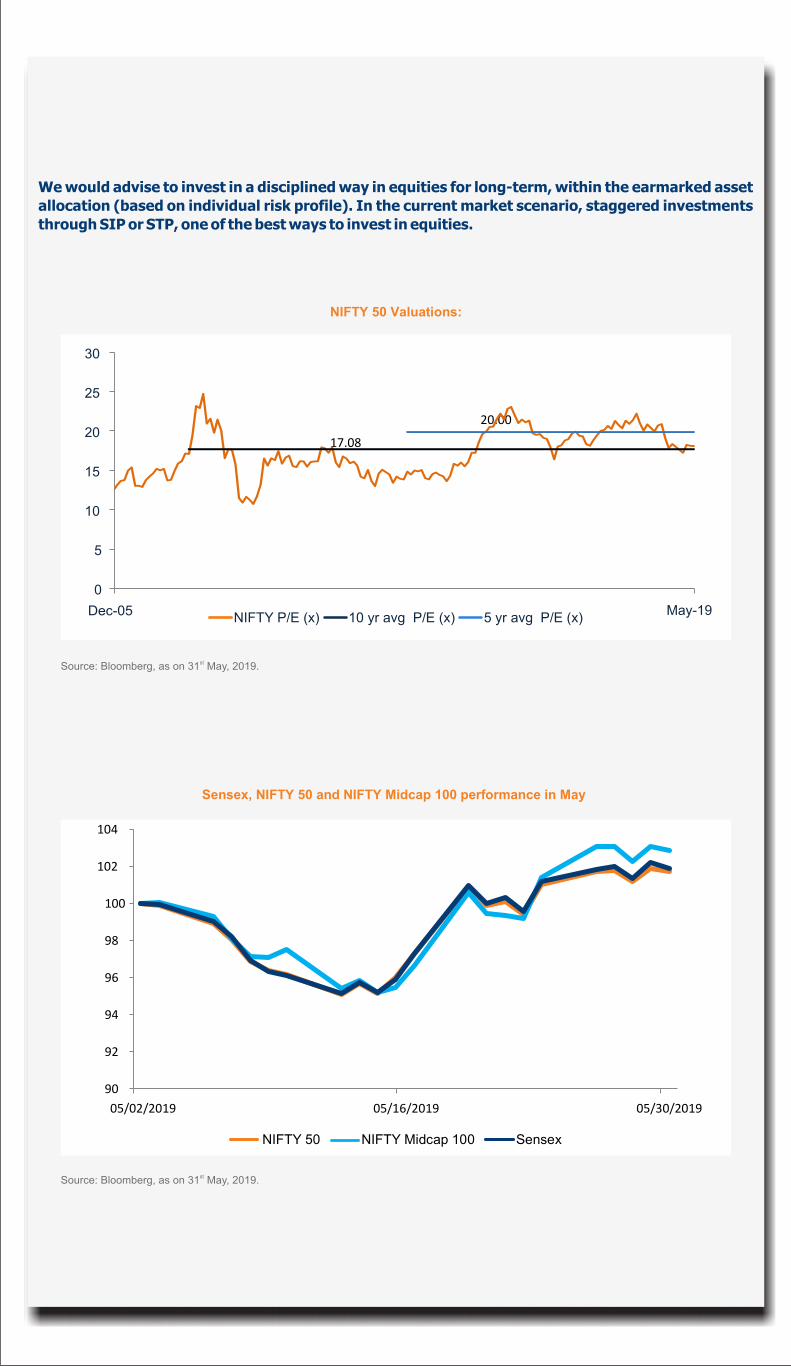
We would advise to invest in a disciplined way in equities for long-term, within the earmarked asset
allocation (based on individual risk profile). In the current market scenario, staggered investments
through SIP or STP, one of the best ways to invest in equities.
Source: Bloomberg, as on st 31 May, 2019.
NIFTY 50 Valuations:
Sensex, NIFTY 50 and NIFTY Midcap 100 performance in May
Source: stBloomberg, as on 31 May, 2019. *Index values have been rebased to 100 as on . st31 March, 2019
0
5
10
15
20
25
30
Dec-05 May-19NIFTY P/E (x) 10 yr avg P/E (x) 5 yr avg P/E (x)
20.00
17.08
NIFTY 50 NIFTY Midcap 100 Sensex
90
92
94
96
98
100
102
104
05/02/2019 05/16/2019 05/30/2019
Source: Bloomberg, as on st 31 May, 2019.
Disclaimers: The information contained in this document is compiled from third party and publically available sources and is included for general information purposes only. There can be no assurance and guarantee on the yields. Views expressed by the Fund Manager cannot be construed to be a decision to invest. The statements contained herein are based on current views and involve known and unknown risks and uncertainties. Whilst Mirae Asset Global Investments (India) Private Limited (the AMC) shall have no responsibility/liability whatsoever for the accuracy or any use or reliance thereof of such information. The AMC, its associate or sponsors or group companies, its Directors or employees accepts no liability for any loss or damage of any kind resulting out of the use of this document. The recipient(s) before acting on any information herein should make his/her/their own investigation and seek appropriate professional advice and shall alone be fully responsible / liable for any decision taken on the basis of information contained herein. Any reliance on the accuracy or use of such information shall be done only after consultation to the financial consultant to understand the specific legal, tax or financial implications.
BSE (Sensex)
US (Dow Jones)
Japan (Nikkei)
Korea (Kospi)
Brazil (Bovespa)
Germany (DAX)
UK (FTSE)
Shanghai (SHCOMP)
Russia (MOEX)
1.70
0.70
-5.80
-5.00
-9.40
-7.40
-7.30
3.10
-3.50
-6.70
10.70
1.50
-1.40
1.80
-6.00
-3.70
-7.00
8.30
1.20
-4.20
9.70
8.40
12.00
4.20
1.50
-7.80
-2.60
14.30
2.60
-2.80
12.40
26.40
-6.40
-7.00
-11.70
-7.20
-15.70
10.70
-6.70
1.60
Source: st Bloomberg, as on 31 May, 2019.
Hong Kong - HSI
Source: st Bloomberg, as on 31 May, 2019.
BSE Consumer durables
2.25
-6.60
-2.10
-2.10
-7.40
2.10
-3.00
9.60
10.60
3.50
5.80
3.50
-0.10
1.40
-1.90
-3.30
9.90
3.50
22.50
14.00
16.70
15.40
17.40
15.40
-9.10
-1.10
-11.70
-7.20
5.20
10.40
22.80
18.80
7.00
20.30
17.70
20.30
-21.00
2.00
-24.60
2.30
-5.60
17.30
-1.50
9.00
5.90
19.50
17.50
19.50BSE ConsumerDiscretionary
Source: st Bloomberg, as on 31 May, 2019.
Apr-19May-19
1.7
1.5
2.2
10.7
10.5
7.4
9.7
9.6
2.6
12.4
11.1
-5.0
PERFORMANCE IN MAY OF MAJOR INDIAN INDICES
39714.0
11923.0
17959.0
39031.6
11748.2
17566.4NIFTY Midcap 100
BSE Bank
BSE Capital goods