Embed Size (px)
Citation preview
Welcome To EquityFeed
Prepared by William Cheung for EquityFeed Corp. Copyright©2013
2
Congratulations and Thank You for subscribing to EquityFeed.
At EquityFeed, we realize that the best trades start by being able to find them.
By subscribing to our Ultra-Powerful EquityFeed platform with Real Time Scanner and complete Alert Management, you no longer need to hunt through hundreds or even
thousands of thumbnail charts just to find a few symbols which may questionably meet your criteria.
Instead, our EquityFeed platform can be configured to alert you to symbols which exclusively meet your exacting criteria; this is called “Letting the Best Trades Find You”.
This Users Guide will assist you in getting started, setting up and personalizing your
EquityFeed platform so that you can return to your original intention… Trading.
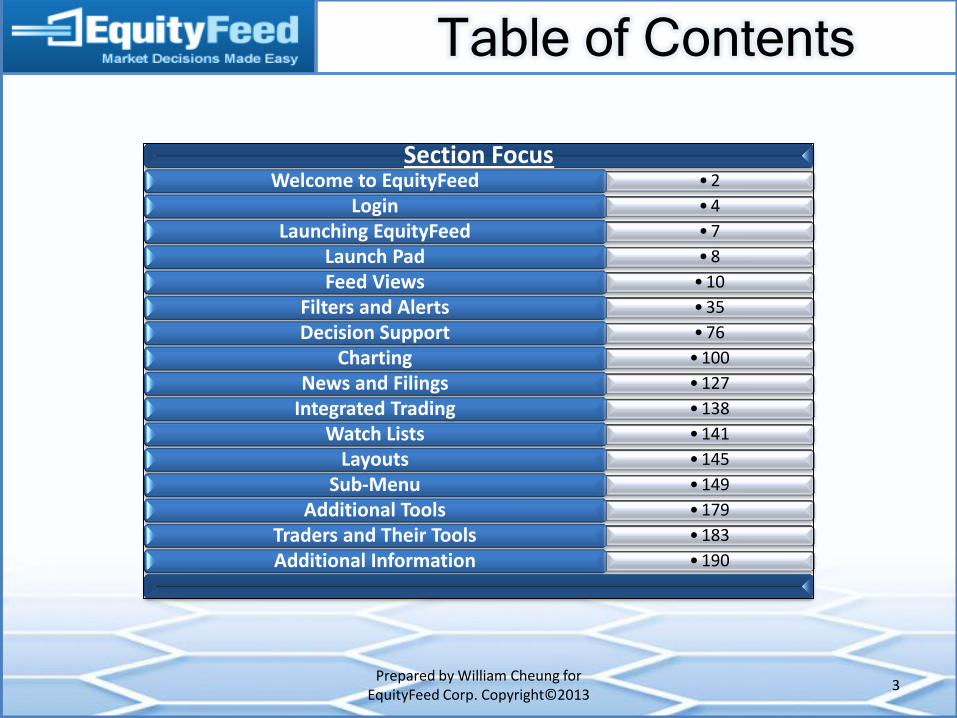
Table of Contents
Prepared by William Cheung for EquityFeed Corp. Copyright©2013
3
Section Focus • 2 Welcome to EquityFeed • 4 Login • 7 Launching EquityFeed • 8 Launch Pad
• 10 Feed Views • 35 Filters and Alerts • 76 Decision Support
• 100 Charting • 127 News and Filings • 138 Integrated Trading • 141 Watch Lists • 145 Layouts • 149 Sub-Menu • 179 Additional Tools • 183 Traders and Their Tools • 190 Additional Information
Section Focus
Prepared by William Cheung for EquityFeed Corp. Copyright©2013
4
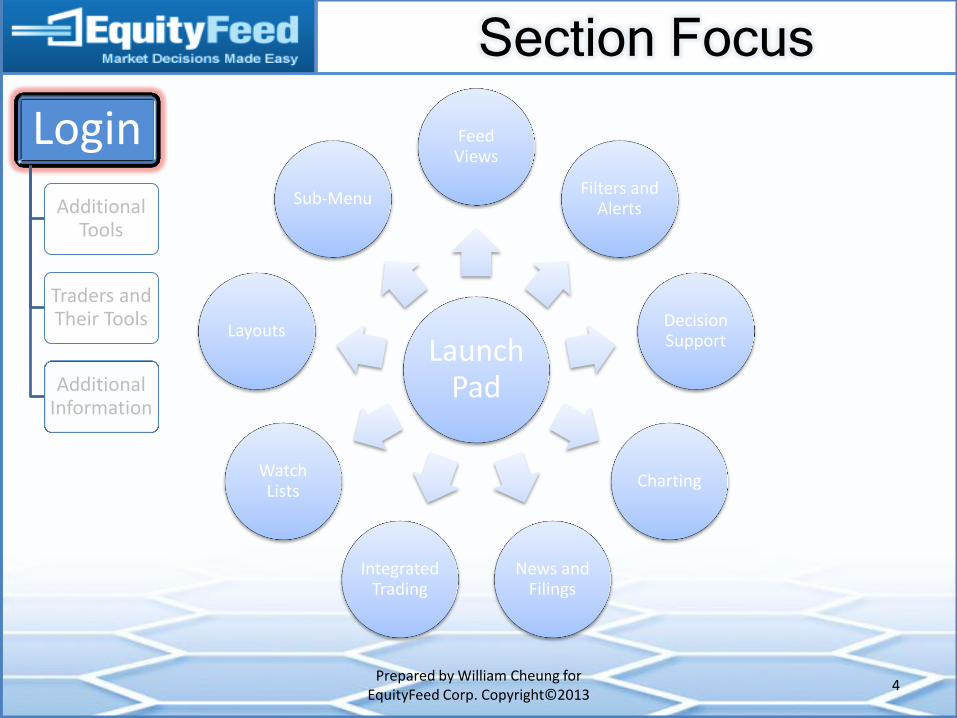
Launch Pad
Feed Views
Filters and Alerts
Decision Support
Charting
News and Filings
Integrated Trading
Watch Lists
Layouts
Sub-Menu
Login
Additional Tools
Traders and Their Tools
Additional Information
Logging Into EquityFeed
Prepared by William Cheung for EquityFeed Corp. Copyright©2013
5
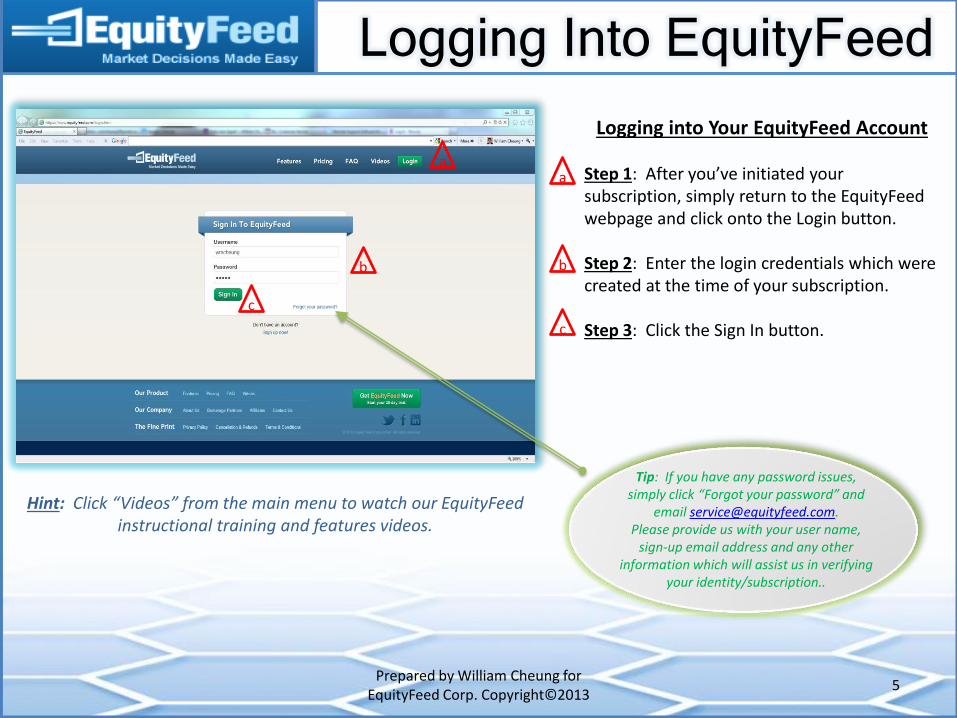
Logging into Your EquityFeed Account Step 1: After you’ve initiated your subscription, simply return to the EquityFeed webpage and click onto the Login button. Step 2: Enter the login credentials which were created at the time of your subscription. Step 3: Click the Sign In button.
Hint: Click “Videos” from the main menu to watch our EquityFeed instructional training and features videos.
Tip: If you have any password issues, simply click “Forgot your password” and
email [email protected]. Please provide us with your user name,
sign-up email address and any other information which will assist us in verifying
your identity/subscription..
c
c
b b
a a
Account Portal
Prepared by William Cheung for EquityFeed Corp. Copyright©2013
6
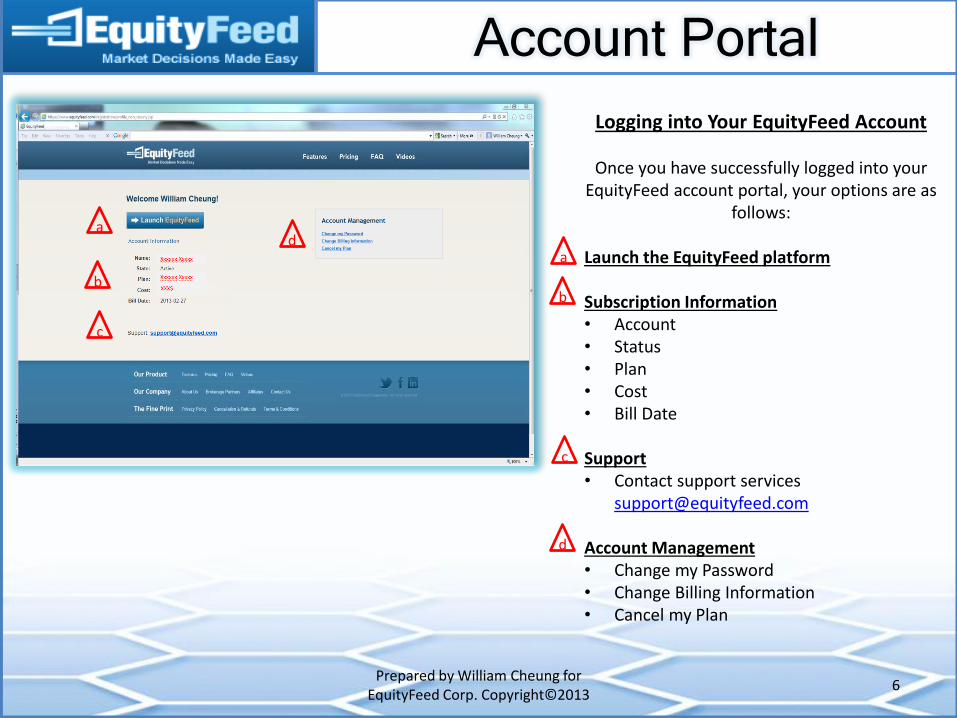
Logging into Your EquityFeed Account
Once you have successfully logged into your EquityFeed account portal, your options are as
follows: Launch the EquityFeed platform
Subscription Information • Account • Status • Plan • Cost • Bill Date
Support • Contact support services
Account Management • Change my Password • Change Billing Information • Cancel my Plan
a d
b
a
b
c
c
d
Launching EquityFeed
Prepared by William Cheung for EquityFeed Corp. Copyright©2013
7
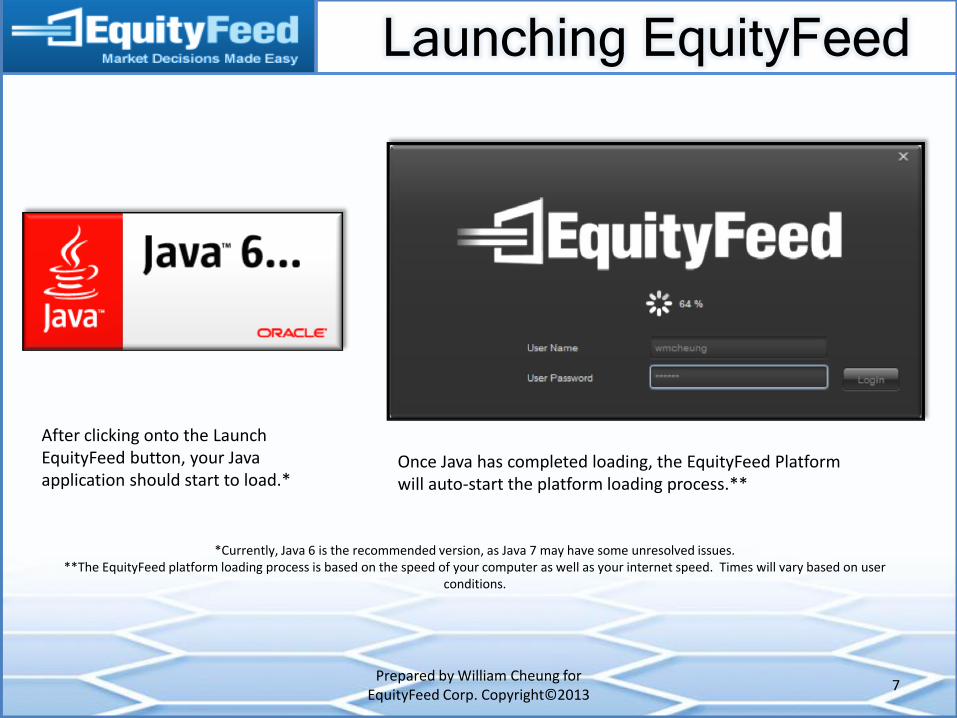
After clicking onto the Launch EquityFeed button, your Java application should start to load.*
*Currently, Java 6 is the recommended version, as Java 7 may have some unresolved issues. **The EquityFeed platform loading process is based on the speed of your computer as well as your internet speed. Times will vary based on user
conditions.
Once Java has completed loading, the EquityFeed Platform will auto-start the platform loading process.**
Section Focus
Prepared by William Cheung for EquityFeed Corp. Copyright©2013
8
Launch Pad
Feed Views
Filters and Alerts
Decision Support
Charting
News and Filings
Integrated Trading
Watch Lists
Layouts
Sub-Menu
Login
Additional Tools
Traders and Their Tools
Additional Information
Launch Pad
Prepared by William Cheung for EquityFeed Corp. Copyright©2013
9
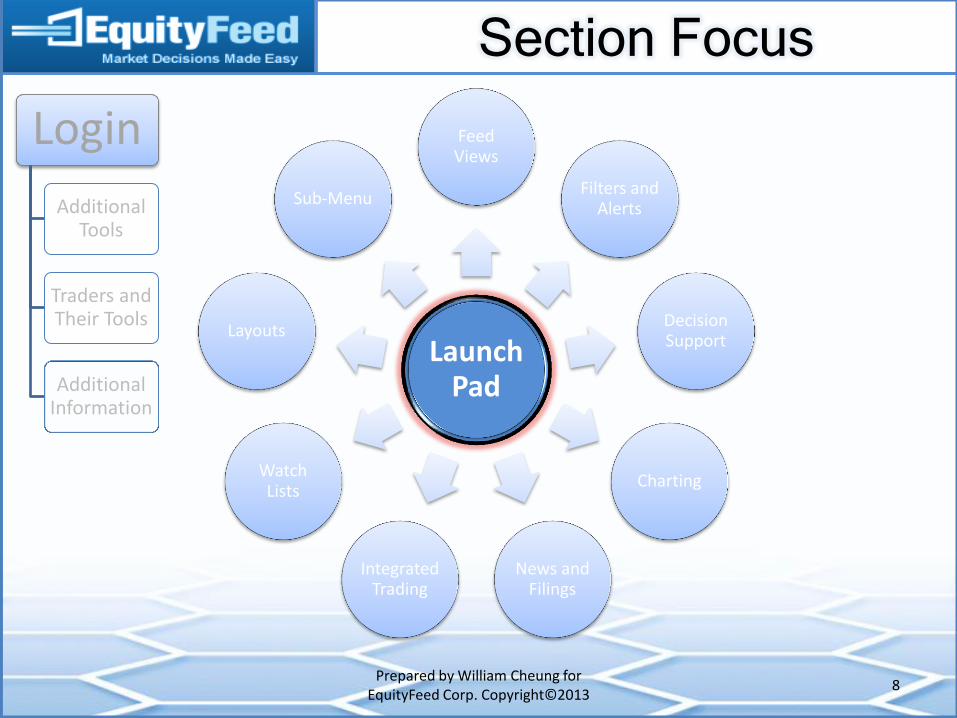
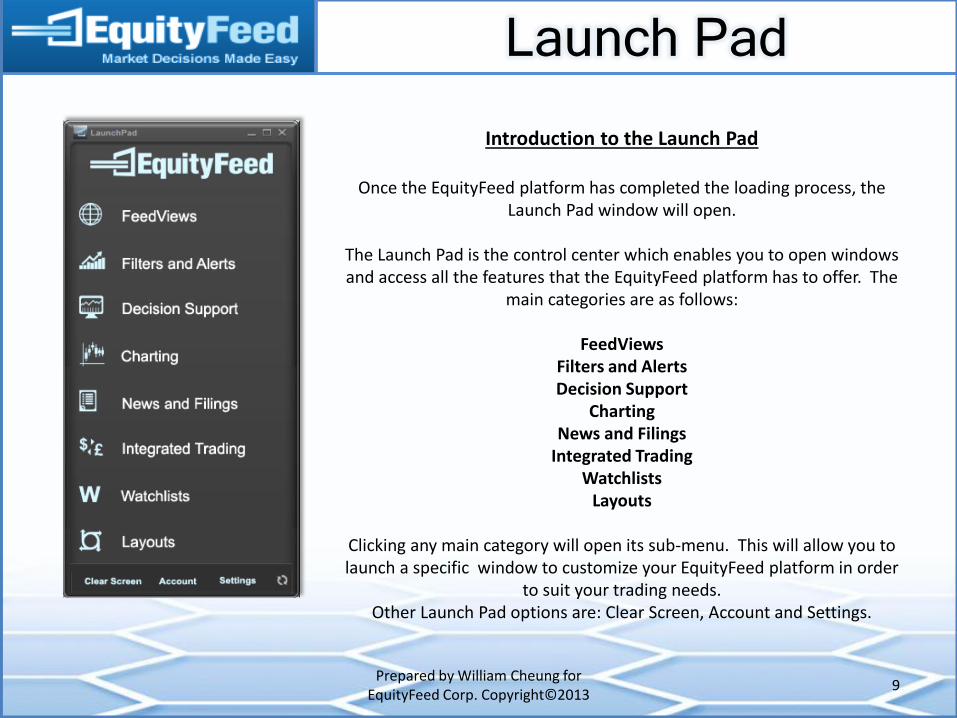
Introduction to the Launch Pad
Once the EquityFeed platform has completed the loading process, the Launch Pad window will open.
The Launch Pad is the control center which enables you to open windows and access all the features that the EquityFeed platform has to offer. The
main categories are as follows:
FeedViews Filters and Alerts Decision Support
Charting News and Filings
Integrated Trading Watchlists
Layouts
Clicking any main category will open its sub-menu. This will allow you to launch a specific window to customize your EquityFeed platform in order
to suit your trading needs. Other Launch Pad options are: Clear Screen, Account and Settings.
Section Focus
Prepared by William Cheung for EquityFeed Corp. Copyright©2013
10
Launch Pad
Feed Views
Filters and Alerts
Decision Support
Charting
News and Filings
Integrated Trading
Watch Lists
Layouts
Sub-Menu
Login
Additional Tools
Traders and Their Tools
Additional Information
FeedViews
Prepared by William Cheung for EquityFeed Corp. Copyright©2013
11
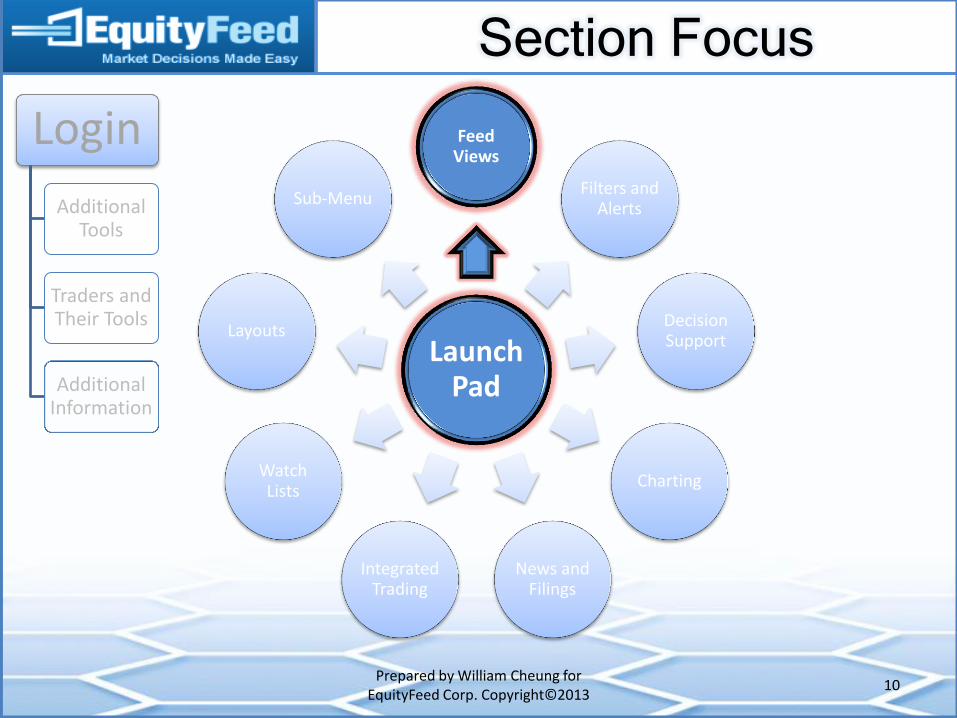
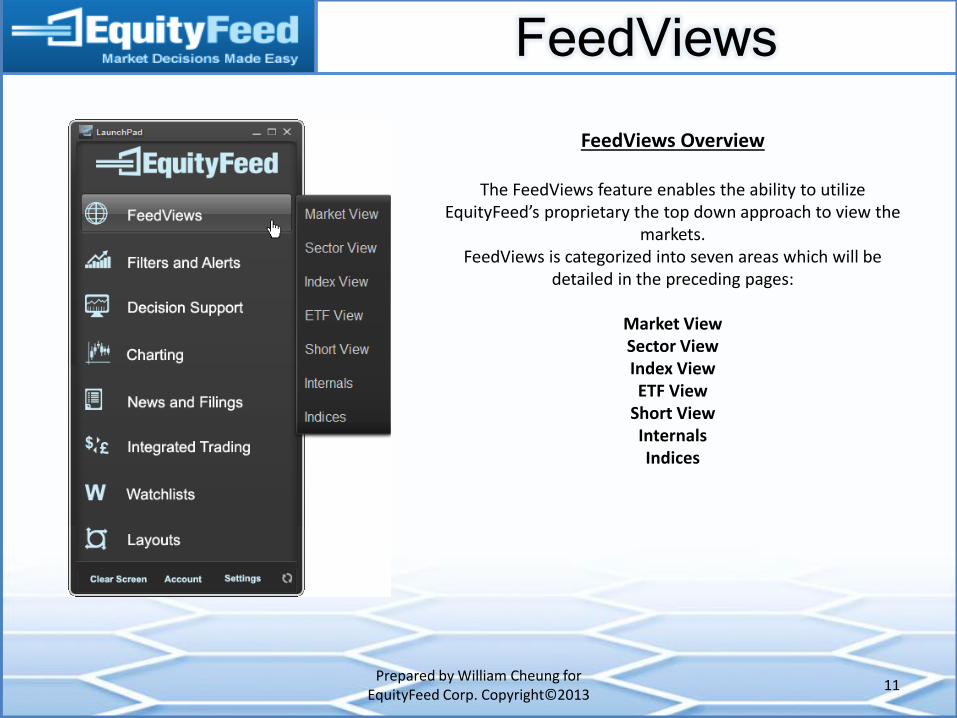
FeedViews Overview
The FeedViews feature enables the ability to utilize EquityFeed’s proprietary the top down approach to view the
markets. FeedViews is categorized into seven areas which will be
detailed in the preceding pages:
Market View Sector View Index View ETF View
Short View Internals Indices
FeedViews
Prepared by William Cheung for EquityFeed Corp. Copyright©2013
12
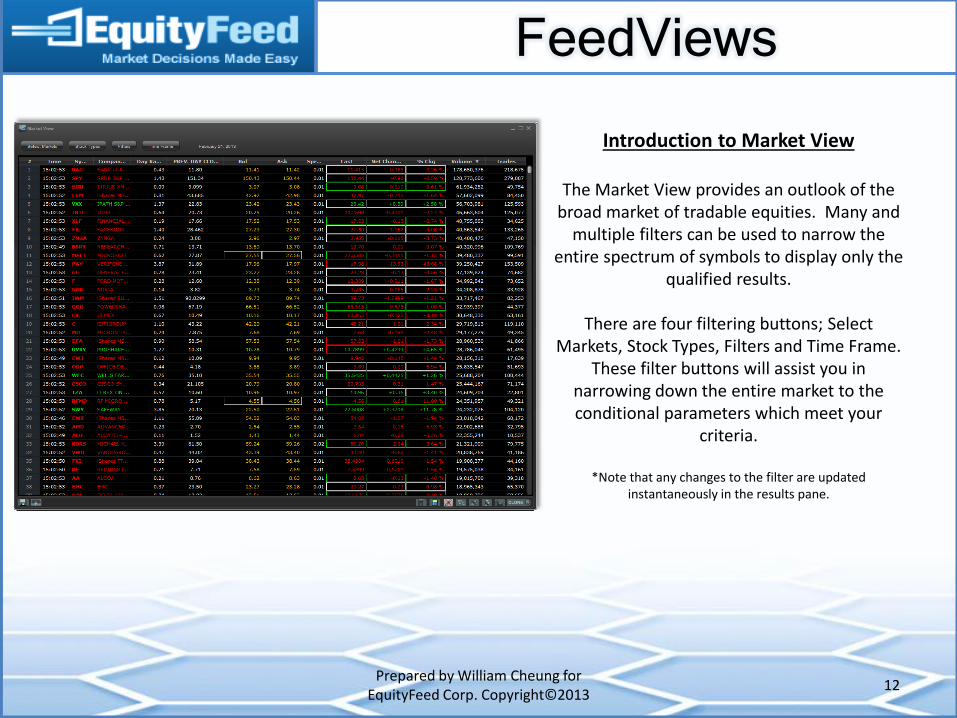
Introduction to Market View
The Market View provides an outlook of the broad market of tradable equities. Many and
multiple filters can be used to narrow the entire spectrum of symbols to display only the
qualified results.
There are four filtering buttons; Select Markets, Stock Types, Filters and Time Frame.
These filter buttons will assist you in narrowing down the entire market to the conditional parameters which meet your
criteria.
*Note that any changes to the filter are updated instantaneously in the results pane.
FeedViews
Prepared by William Cheung for EquityFeed Corp. Copyright©2013
13
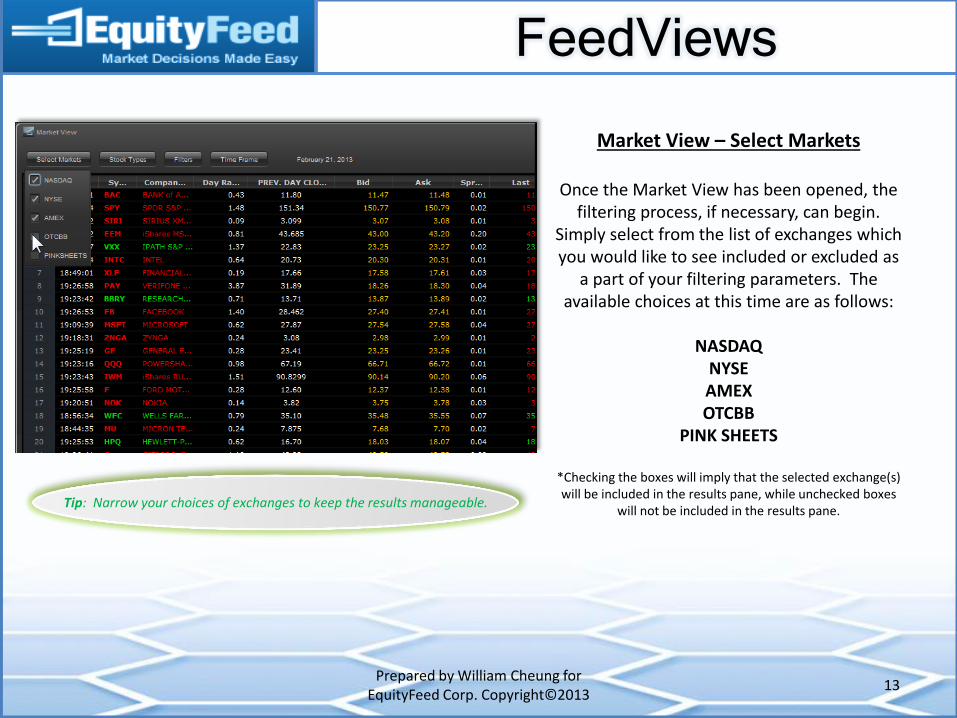
Market View – Select Markets
Once the Market View has been opened, the filtering process, if necessary, can begin.
Simply select from the list of exchanges which you would like to see included or excluded as
a part of your filtering parameters. The available choices at this time are as follows:
NASDAQ
NYSE AMEX OTCBB
PINK SHEETS
*Checking the boxes will imply that the selected exchange(s) will be included in the results pane, while unchecked boxes
will not be included in the results pane. Tip: Narrow your choices of exchanges to keep the results manageable.
FeedViews
Prepared by William Cheung for EquityFeed Corp. Copyright©2013
14
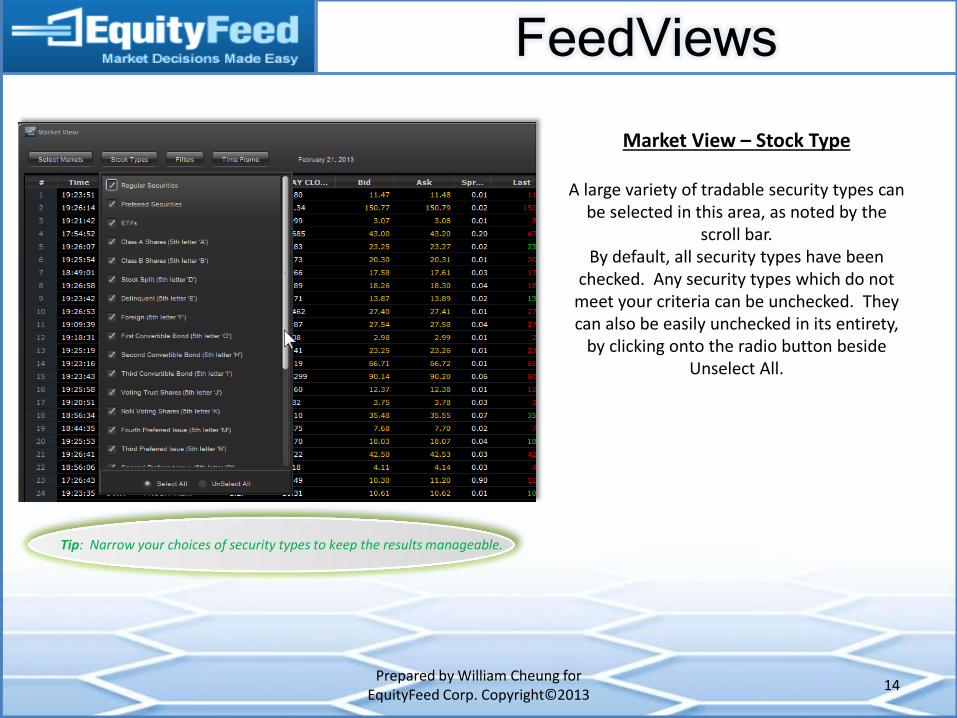
Market View – Stock Type
A large variety of tradable security types can be selected in this area, as noted by the
scroll bar. By default, all security types have been
checked. Any security types which do not meet your criteria can be unchecked. They can also be easily unchecked in its entirety,
by clicking onto the radio button beside Unselect All.
Tip: Narrow your choices of security types to keep the results manageable.
FeedViews
Prepared by William Cheung for EquityFeed Corp. Copyright©2013
15
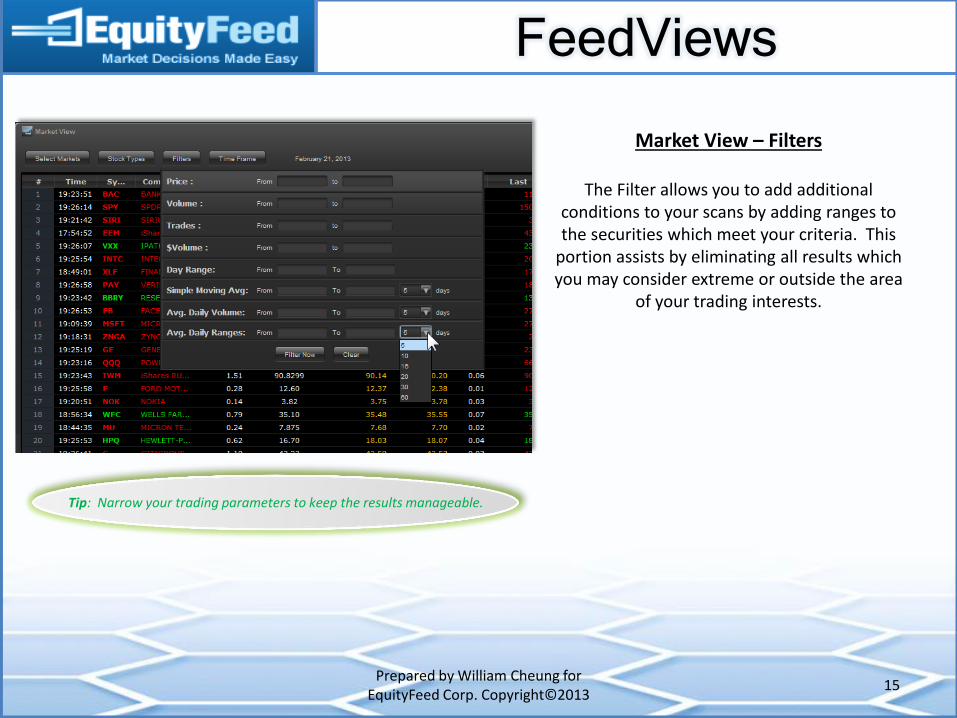
Market View – Filters
The Filter allows you to add additional conditions to your scans by adding ranges to the securities which meet your criteria. This
portion assists by eliminating all results which you may consider extreme or outside the area
of your trading interests.
Tip: Narrow your trading parameters to keep the results manageable.
FeedViews
Prepared by William Cheung for EquityFeed Corp. Copyright©2013
16
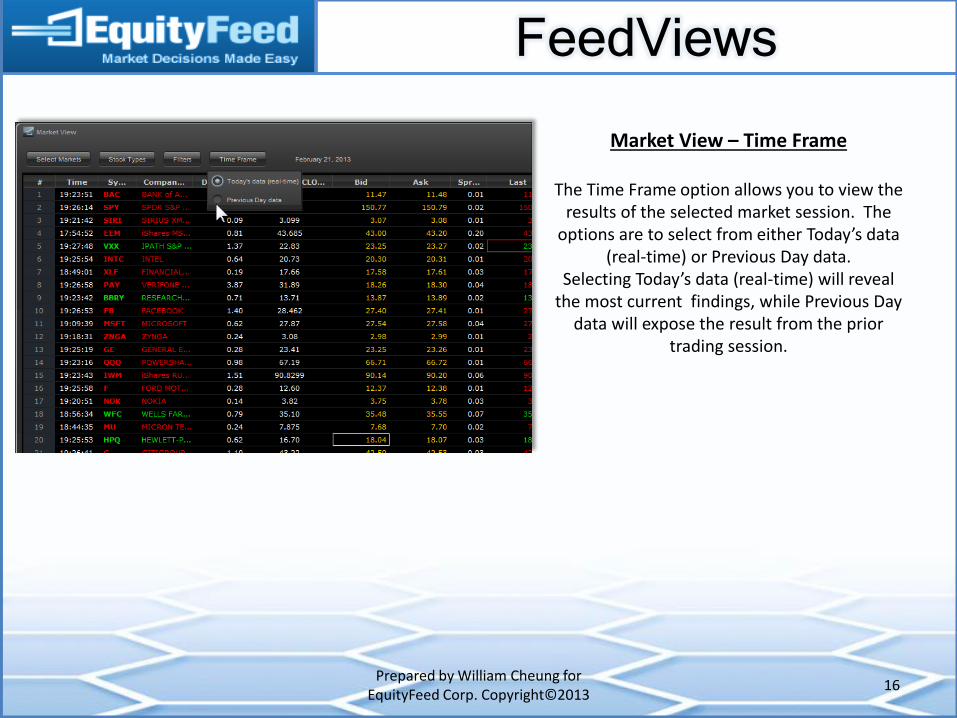
Market View – Time Frame
The Time Frame option allows you to view the results of the selected market session. The
options are to select from either Today’s data (real-time) or Previous Day data.
Selecting Today’s data (real-time) will reveal the most current findings, while Previous Day
data will expose the result from the prior trading session.
FeedViews
Prepared by William Cheung for EquityFeed Corp. Copyright©2013
17
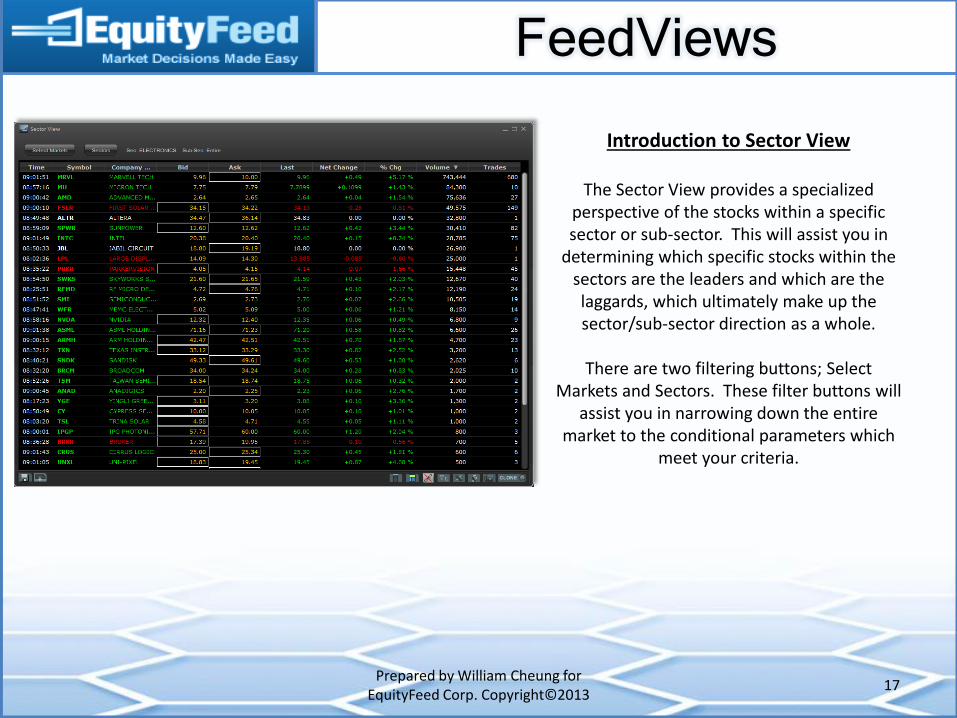
Introduction to Sector View
The Sector View provides a specialized perspective of the stocks within a specific sector or sub-sector. This will assist you in
determining which specific stocks within the sectors are the leaders and which are the laggards, which ultimately make up the sector/sub-sector direction as a whole.
There are two filtering buttons; Select
Markets and Sectors. These filter buttons will assist you in narrowing down the entire
market to the conditional parameters which meet your criteria.
FeedViews
Prepared by William Cheung for EquityFeed Corp. Copyright©2013
18
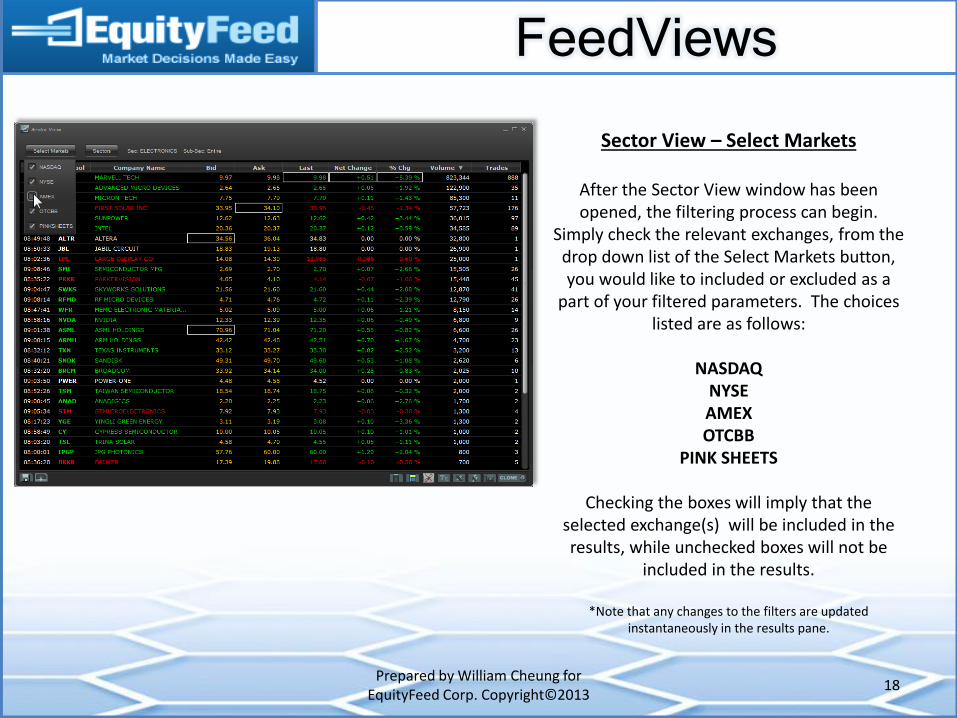
Sector View – Select Markets
After the Sector View window has been opened, the filtering process can begin.
Simply check the relevant exchanges, from the drop down list of the Select Markets button, you would like to included or excluded as a
part of your filtered parameters. The choices listed are as follows:
NASDAQ
NYSE AMEX OTCBB
PINK SHEETS
Checking the boxes will imply that the selected exchange(s) will be included in the results, while unchecked boxes will not be
included in the results.
*Note that any changes to the filters are updated instantaneously in the results pane.
FeedViews
Prepared by William Cheung for EquityFeed Corp. Copyright©2013
19
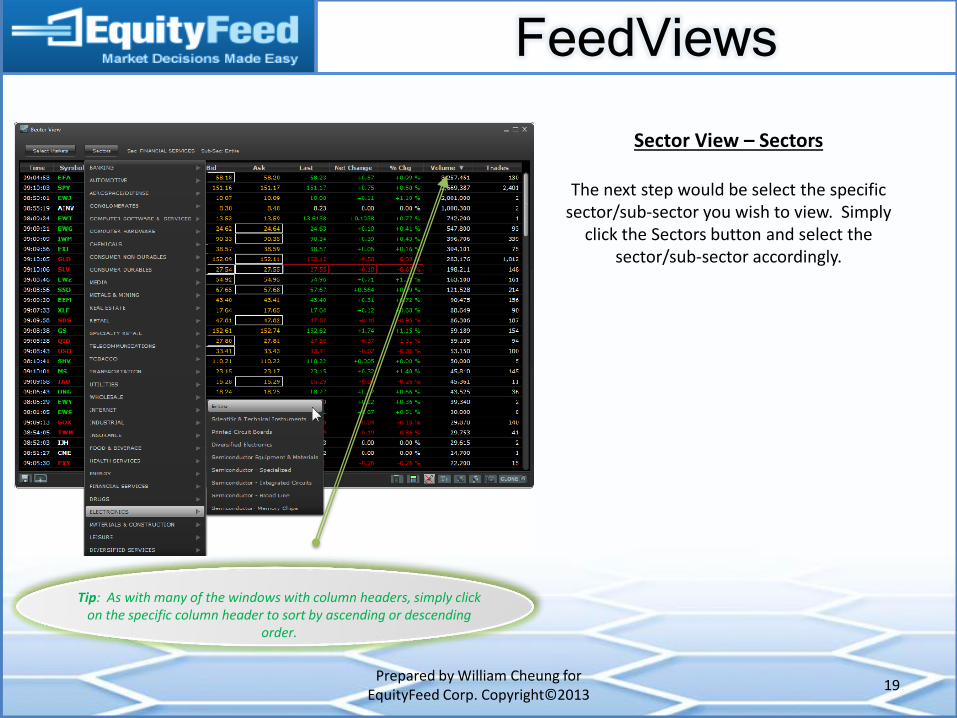
Sector View – Sectors
The next step would be select the specific sector/sub-sector you wish to view. Simply
click the Sectors button and select the sector/sub-sector accordingly.
Tip: As with many of the windows with column headers, simply click on the specific column header to sort by ascending or descending
order.
FeedViews
Prepared by William Cheung for EquityFeed Corp. Copyright©2013
20
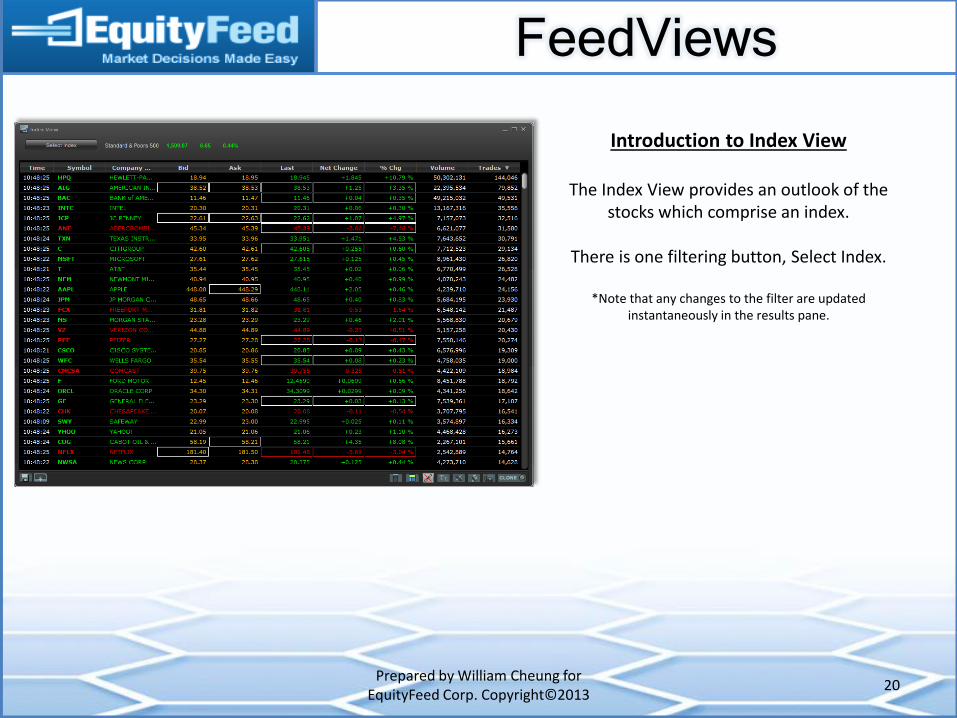
Introduction to Index View
The Index View provides an outlook of the stocks which comprise an index.
There is one filtering button, Select Index.
*Note that any changes to the filter are updated
instantaneously in the results pane.
FeedViews
Prepared by William Cheung for EquityFeed Corp. Copyright©2013
21
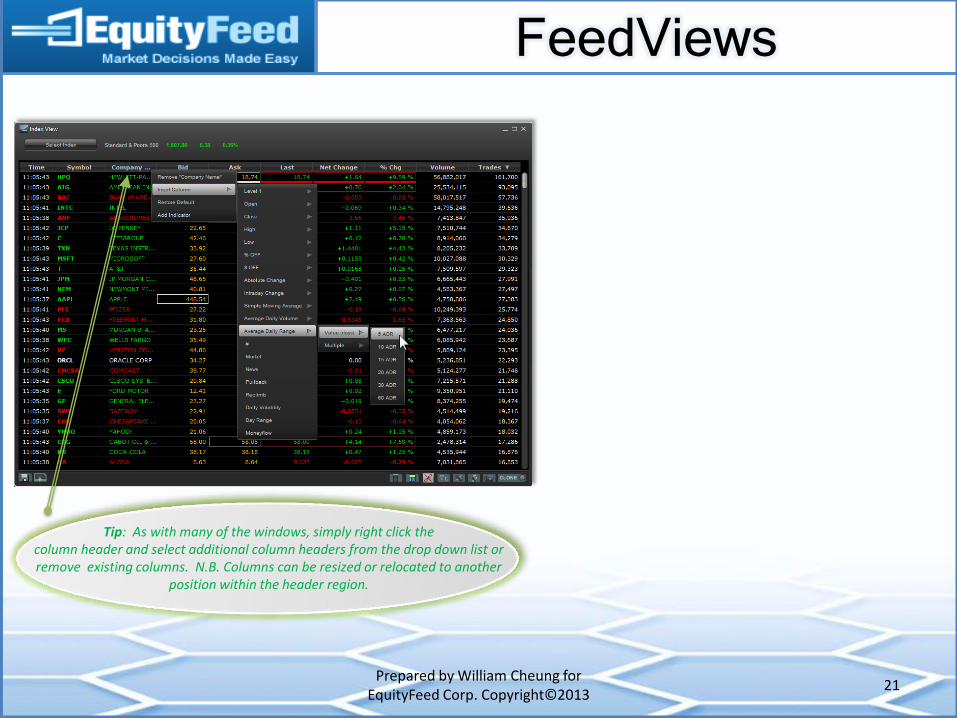
Tip: As with many of the windows, simply right click the column header and select additional column headers from the drop down list or remove existing columns. N.B. Columns can be resized or relocated to another
position within the header region.
FeedViews
Prepared by William Cheung for EquityFeed Corp. Copyright©2013
22
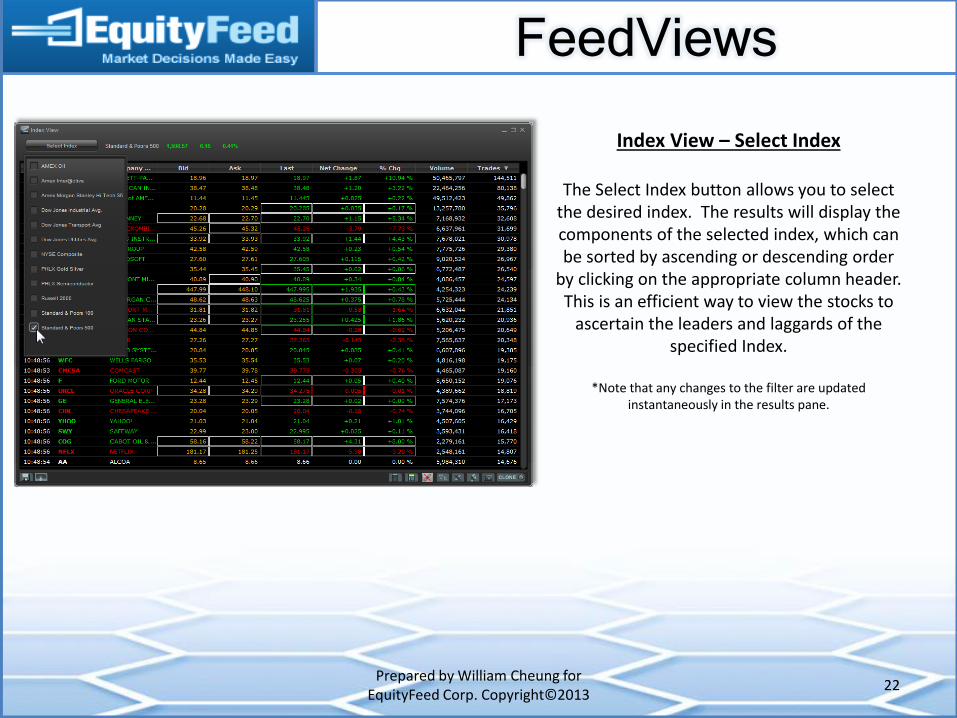
Index View – Select Index
The Select Index button allows you to select the desired index. The results will display the components of the selected index, which can be sorted by ascending or descending order
by clicking on the appropriate column header. This is an efficient way to view the stocks to
ascertain the leaders and laggards of the specified Index.
*Note that any changes to the filter are updated
instantaneously in the results pane.
FeedViews
Prepared by William Cheung for EquityFeed Corp. Copyright©2013
23
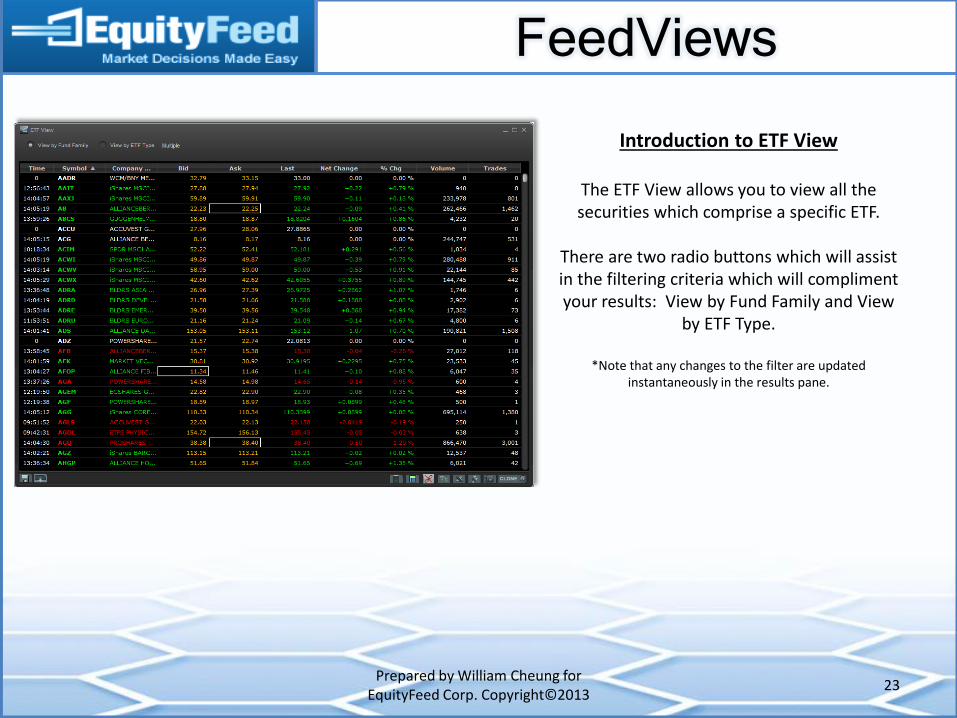
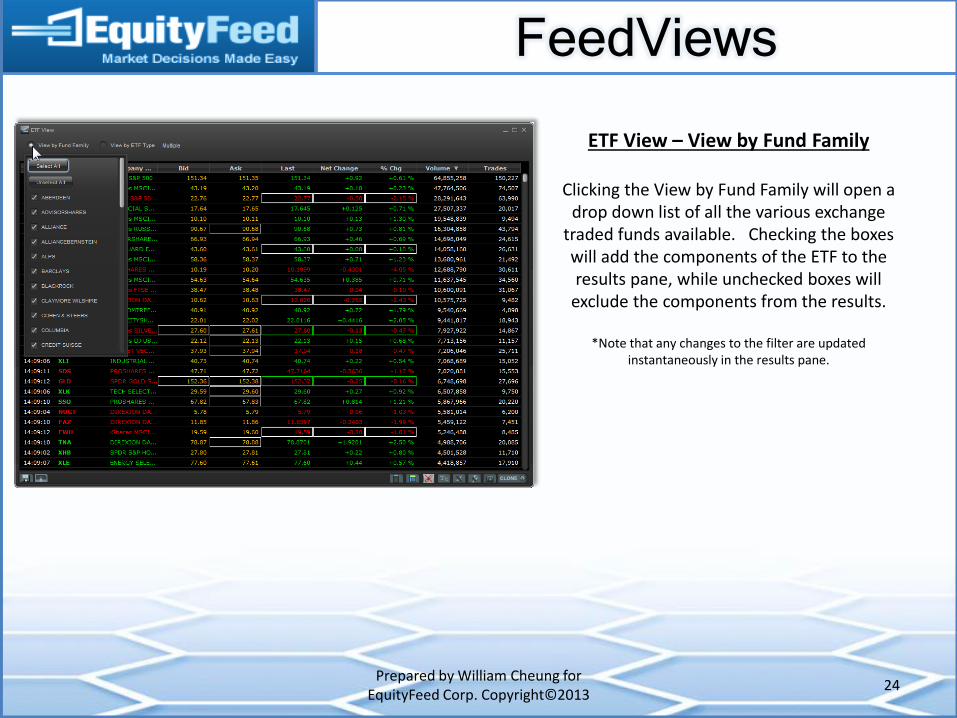
Introduction to ETF View
The ETF View allows you to view all the securities which comprise a specific ETF.
There are two radio buttons which will assist in the filtering criteria which will compliment your results: View by Fund Family and View
by ETF Type.
*Note that any changes to the filter are updated instantaneously in the results pane.
FeedViews
Prepared by William Cheung for EquityFeed Corp. Copyright©2013
24
ETF View – View by Fund Family
Clicking the View by Fund Family will open a drop down list of all the various exchange
traded funds available. Checking the boxes will add the components of the ETF to the results pane, while unchecked boxes will
exclude the components from the results.
*Note that any changes to the filter are updated instantaneously in the results pane.
FeedViews
Prepared by William Cheung for EquityFeed Corp. Copyright©2013
25
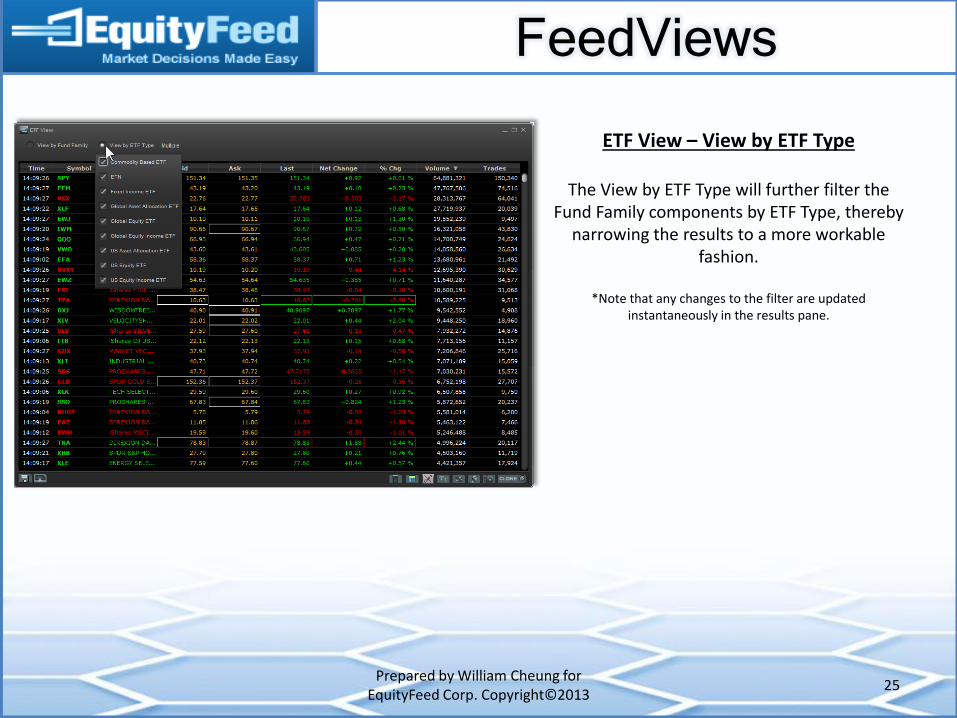
ETF View – View by ETF Type
The View by ETF Type will further filter the Fund Family components by ETF Type, thereby
narrowing the results to a more workable fashion.
*Note that any changes to the filter are updated
instantaneously in the results pane.
FeedViews
Prepared by William Cheung for EquityFeed Corp. Copyright©2013
26
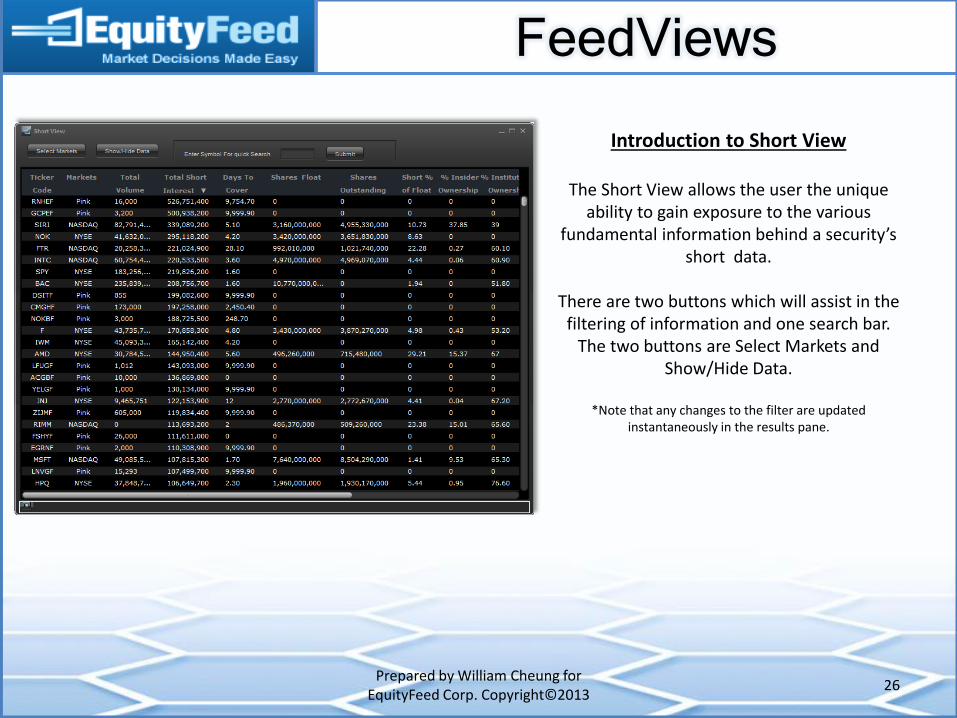
Introduction to Short View
The Short View allows the user the unique ability to gain exposure to the various
fundamental information behind a security’s short data.
There are two buttons which will assist in the
filtering of information and one search bar. The two buttons are Select Markets and
Show/Hide Data.
*Note that any changes to the filter are updated instantaneously in the results pane.
FeedViews
Prepared by William Cheung for EquityFeed Corp. Copyright©2013
27
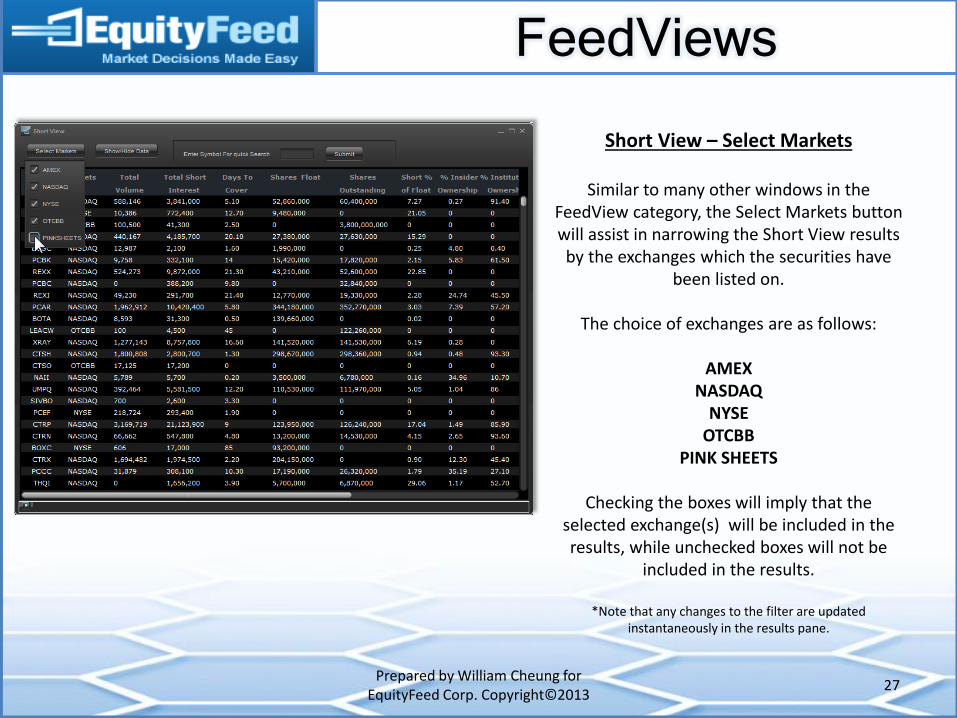
Short View – Select Markets
Similar to many other windows in the FeedView category, the Select Markets button will assist in narrowing the Short View results by the exchanges which the securities have
been listed on.
The choice of exchanges are as follows:
AMEX NASDAQ
NYSE OTCBB
PINK SHEETS
Checking the boxes will imply that the selected exchange(s) will be included in the results, while unchecked boxes will not be
included in the results.
*Note that any changes to the filter are updated instantaneously in the results pane.
FeedViews
Prepared by William Cheung for EquityFeed Corp. Copyright©2013
28
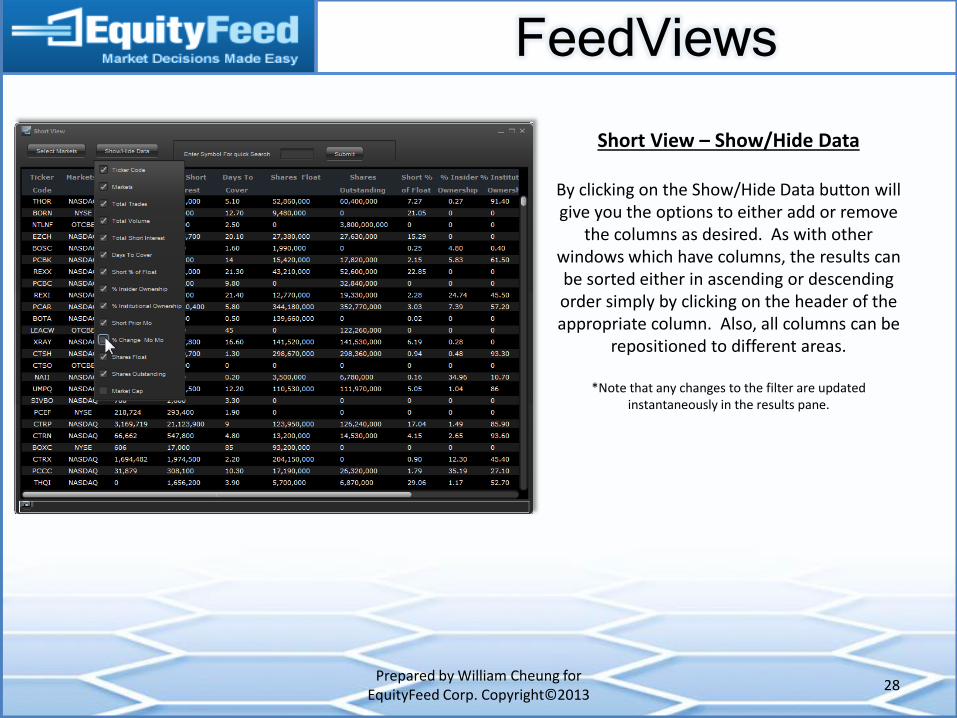
Short View – Show/Hide Data
By clicking on the Show/Hide Data button will give you the options to either add or remove
the columns as desired. As with other windows which have columns, the results can be sorted either in ascending or descending order simply by clicking on the header of the appropriate column. Also, all columns can be
repositioned to different areas.
*Note that any changes to the filter are updated instantaneously in the results pane.
FeedViews
Prepared by William Cheung for EquityFeed Corp. Copyright©2013
29
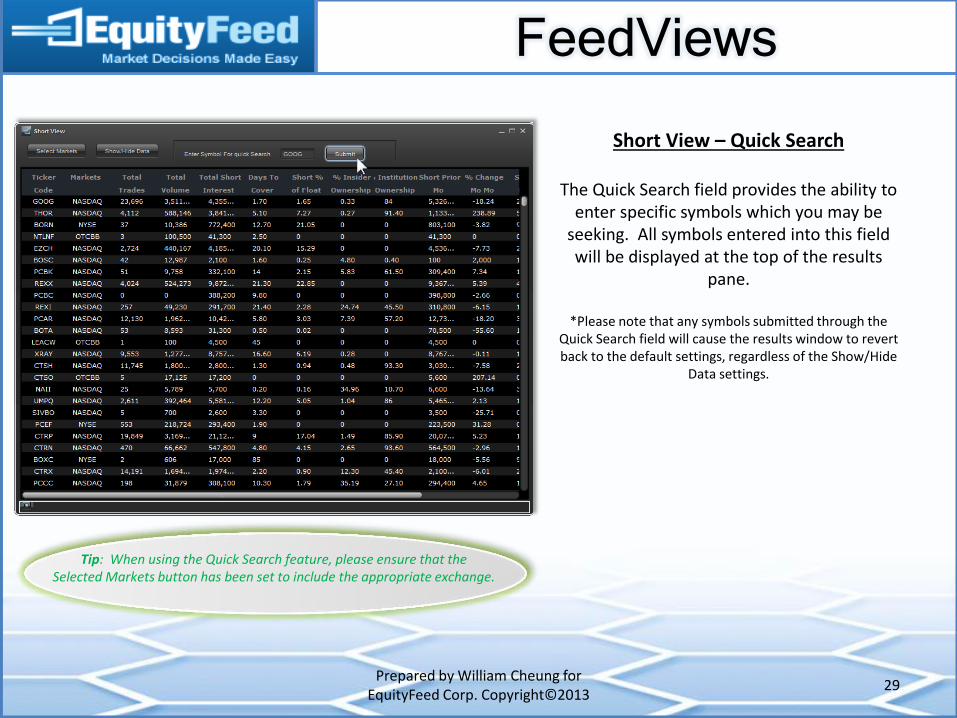
Short View – Quick Search
The Quick Search field provides the ability to enter specific symbols which you may be
seeking. All symbols entered into this field will be displayed at the top of the results
pane.
*Please note that any symbols submitted through the Quick Search field will cause the results window to revert back to the default settings, regardless of the Show/Hide
Data settings.
Tip: When using the Quick Search feature, please ensure that the Selected Markets button has been set to include the appropriate exchange.
FeedViews
Prepared by William Cheung for EquityFeed Corp. Copyright©2013
30
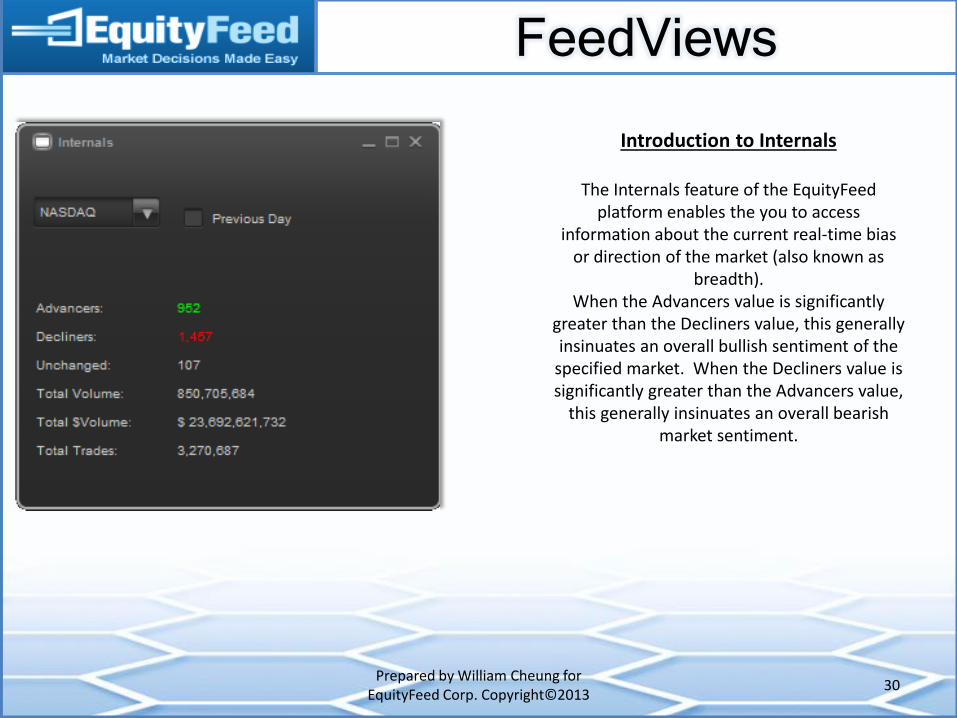
Introduction to Internals
The Internals feature of the EquityFeed platform enables the you to access
information about the current real-time bias or direction of the market (also known as
breadth). When the Advancers value is significantly
greater than the Decliners value, this generally insinuates an overall bullish sentiment of the
specified market. When the Decliners value is significantly greater than the Advancers value,
this generally insinuates an overall bearish market sentiment.
FeedViews
Prepared by William Cheung for EquityFeed Corp. Copyright©2013
31
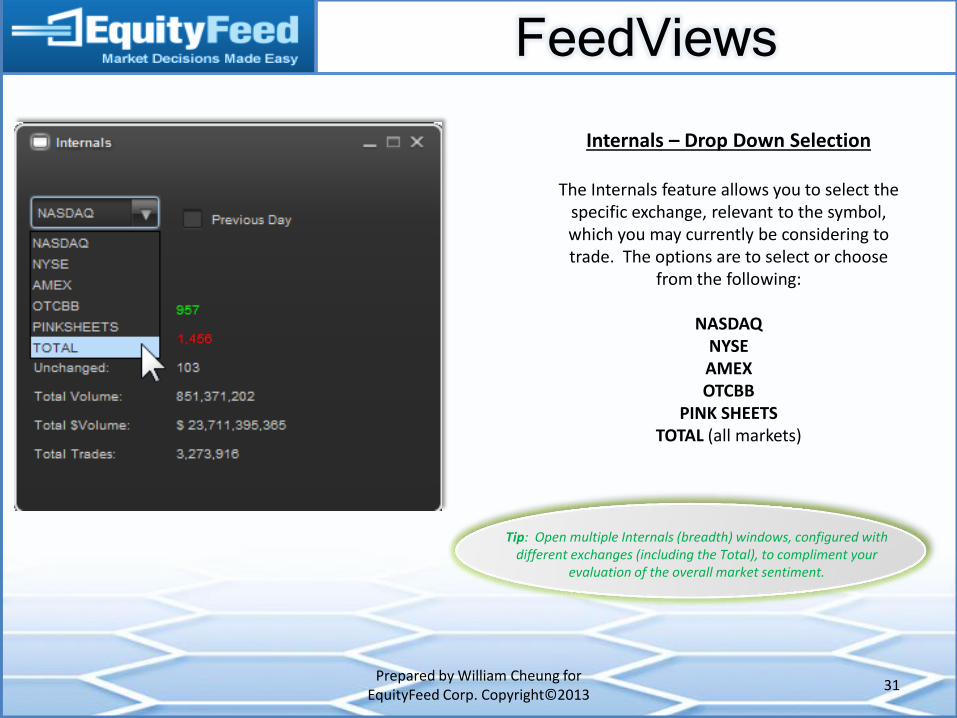
Internals – Drop Down Selection
The Internals feature allows you to select the specific exchange, relevant to the symbol, which you may currently be considering to trade. The options are to select or choose
from the following:
NASDAQ NYSE AMEX OTCBB
PINK SHEETS TOTAL (all markets)
Tip: Open multiple Internals (breadth) windows, configured with different exchanges (including the Total), to compliment your
evaluation of the overall market sentiment.
FeedViews
Prepared by William Cheung for EquityFeed Corp. Copyright©2013
32
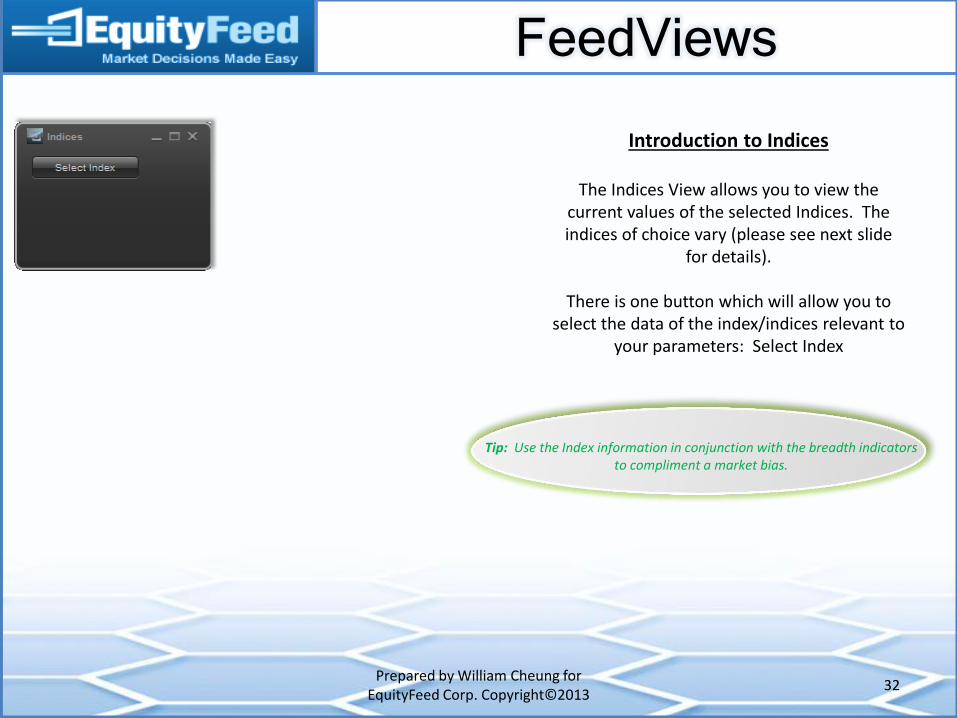
Introduction to Indices
The Indices View allows you to view the current values of the selected Indices. The indices of choice vary (please see next slide
for details).
There is one button which will allow you to select the data of the index/indices relevant to
your parameters: Select Index
Tip: Use the Index information in conjunction with the breadth indicators to compliment a market bias.
FeedViews
Prepared by William Cheung for EquityFeed Corp. Copyright©2013
33
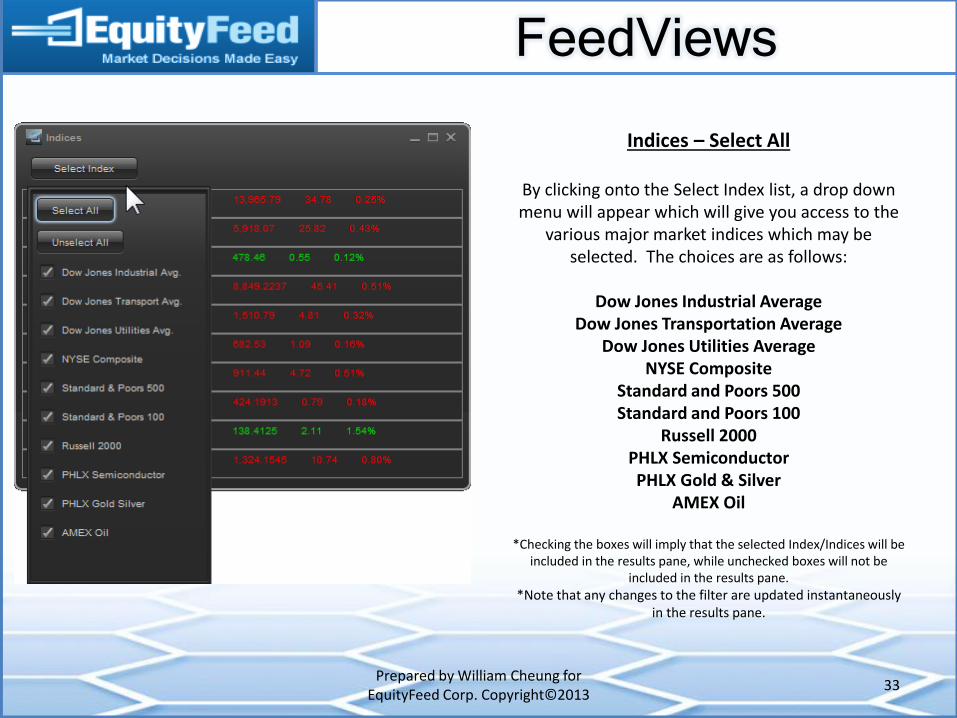
Indices – Select All
By clicking onto the Select Index list, a drop down menu will appear which will give you access to the
various major market indices which may be selected. The choices are as follows:
Dow Jones Industrial Average
Dow Jones Transportation Average Dow Jones Utilities Average
NYSE Composite Standard and Poors 500 Standard and Poors 100
Russell 2000 PHLX Semiconductor PHLX Gold & Silver
AMEX Oil
*Checking the boxes will imply that the selected Index/Indices will be included in the results pane, while unchecked boxes will not be
included in the results pane. *Note that any changes to the filter are updated instantaneously
in the results pane.
FeedViews
Prepared by William Cheung for EquityFeed Corp. Copyright©2013
34
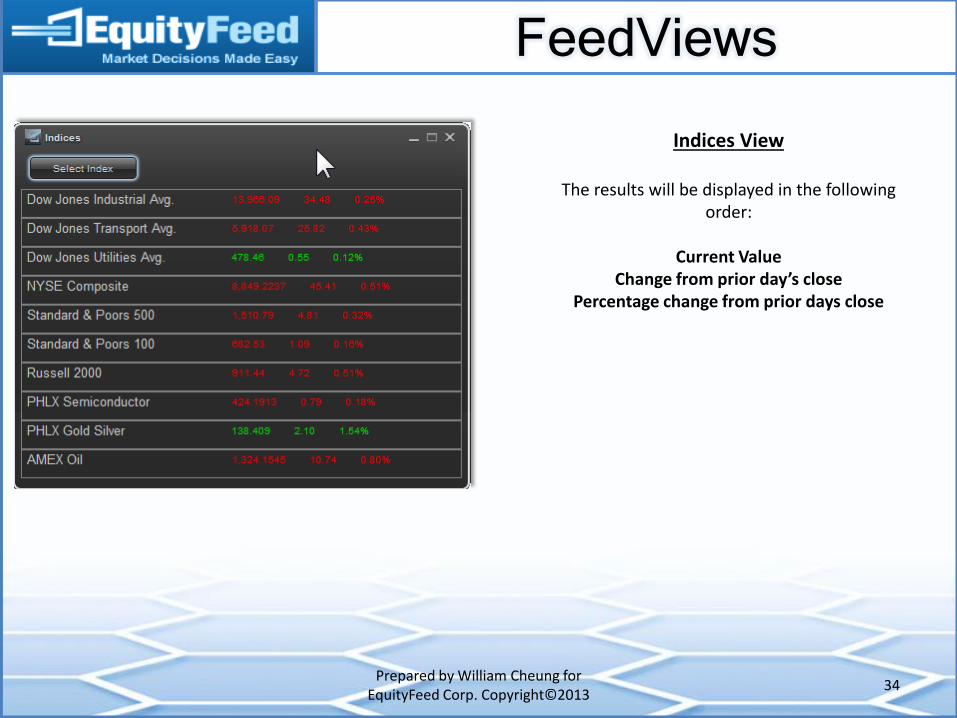
Indices View
The results will be displayed in the following order:
Current Value
Change from prior day’s close Percentage change from prior days close
Section Focus
Prepared by William Cheung for EquityFeed Corp. Copyright©2013
35
Launch Pad
Feed Views
Filters and Alerts
Decision Support
Charting
News and Filings
Integrated Trading
Watch Lists
Layouts
Sub-Menu
Login
Additional Tools
Traders and Their Tools
Additional Information
Filters and Alerts
Prepared by William Cheung for EquityFeed Corp. Copyright©2013
36
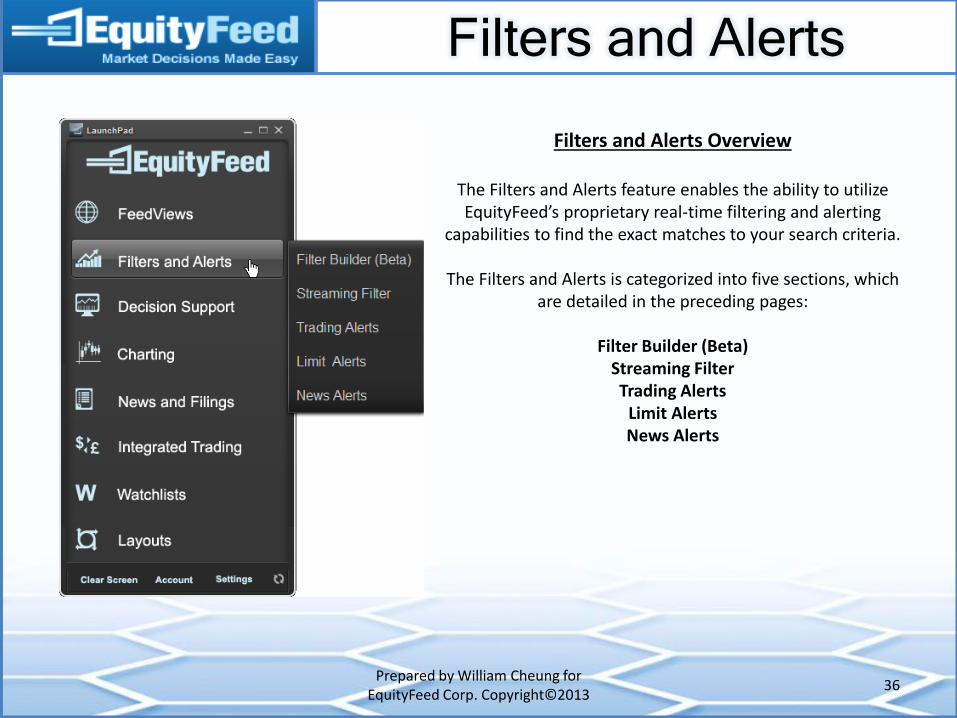
Filters and Alerts Overview
The Filters and Alerts feature enables the ability to utilize EquityFeed’s proprietary real-time filtering and alerting
capabilities to find the exact matches to your search criteria.
The Filters and Alerts is categorized into five sections, which are detailed in the preceding pages:
Filter Builder (Beta)
Streaming Filter Trading Alerts
Limit Alerts News Alerts
Filters and Alerts
Prepared by William Cheung for EquityFeed Corp. Copyright©2013
37
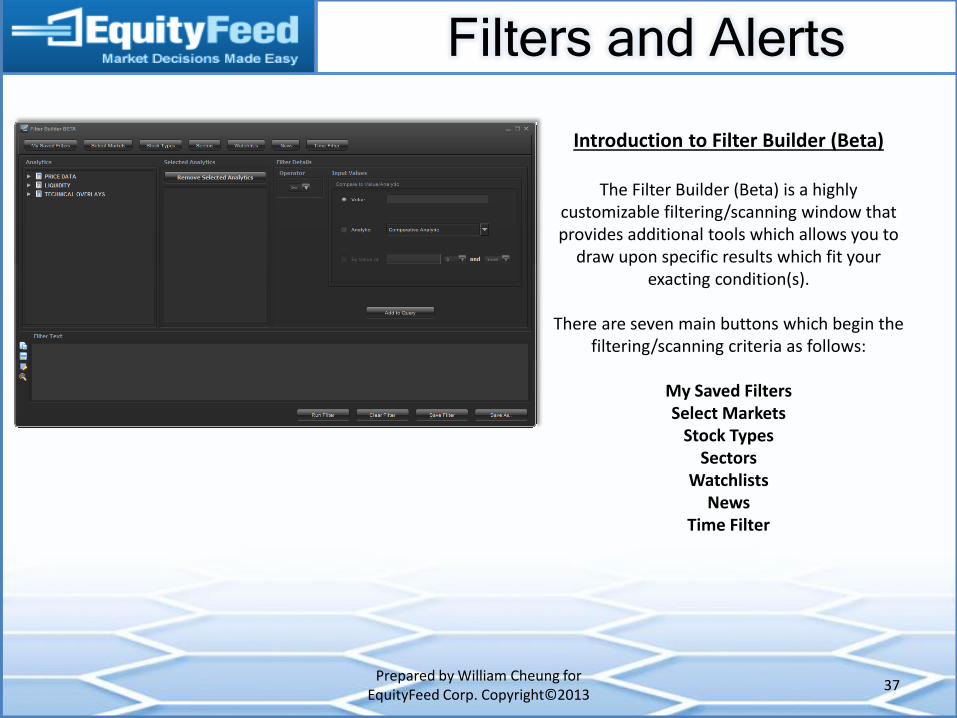
Introduction to Filter Builder (Beta)
The Filter Builder (Beta) is a highly customizable filtering/scanning window that provides additional tools which allows you to
draw upon specific results which fit your exacting condition(s).
There are seven main buttons which begin the
filtering/scanning criteria as follows:
My Saved Filters Select Markets
Stock Types Sectors
Watchlists News
Time Filter
Filters and Alerts
Prepared by William Cheung for EquityFeed Corp. Copyright©2013
38
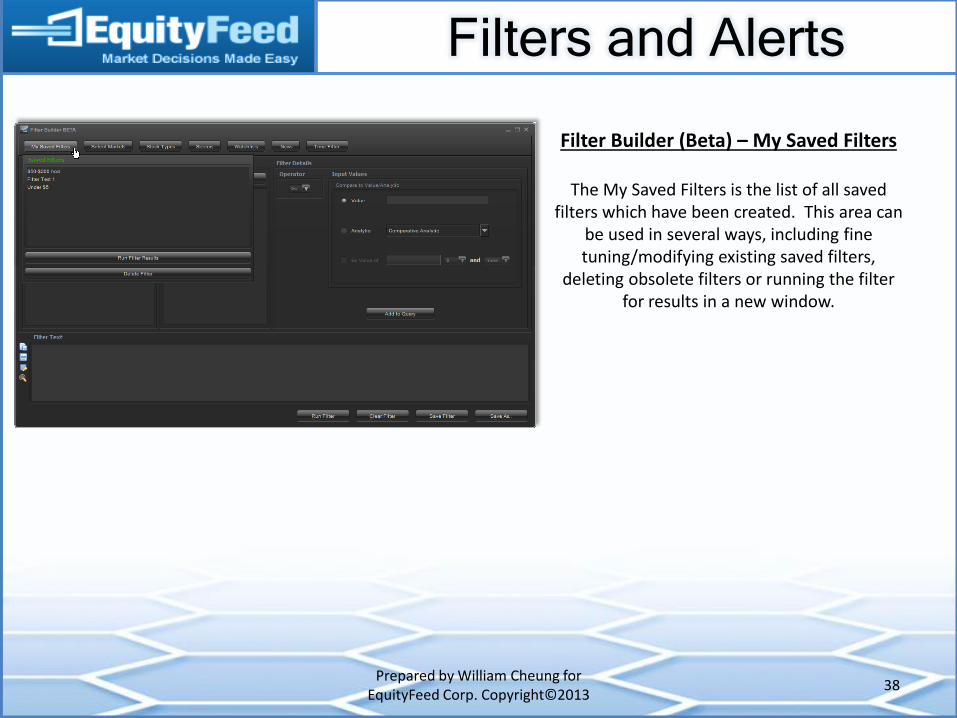
Filter Builder (Beta) – My Saved Filters
The My Saved Filters is the list of all saved filters which have been created. This area can
be used in several ways, including fine tuning/modifying existing saved filters,
deleting obsolete filters or running the filter for results in a new window.
Filters and Alerts
Prepared by William Cheung for EquityFeed Corp. Copyright©2013
39
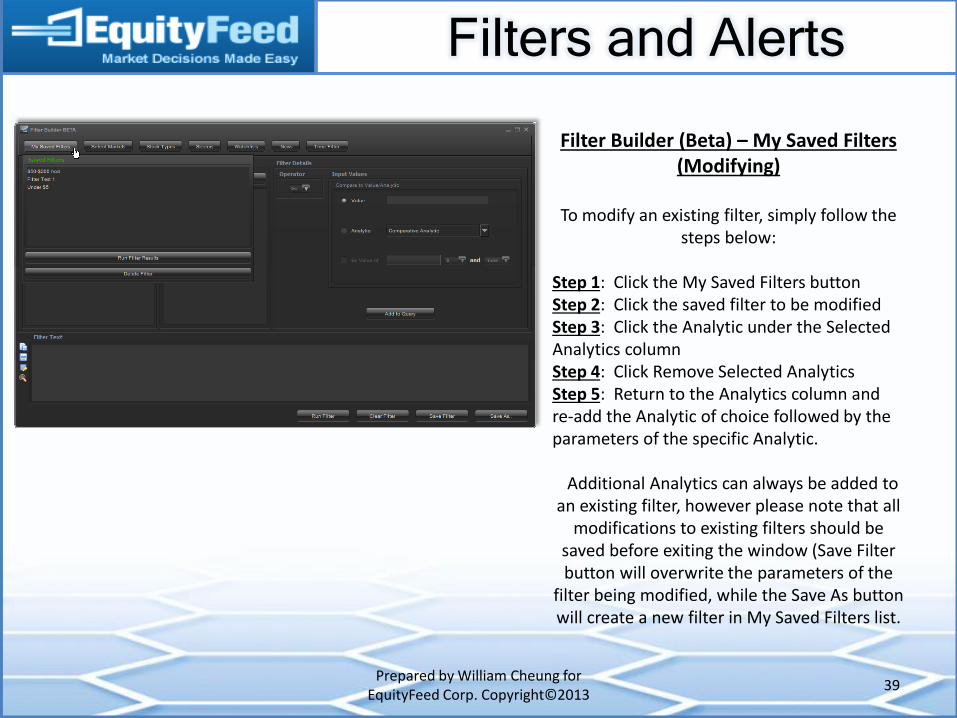
Filter Builder (Beta) – My Saved Filters (Modifying)
To modify an existing filter, simply follow the
steps below:
Step 1: Click the My Saved Filters button Step 2: Click the saved filter to be modified Step 3: Click the Analytic under the Selected Analytics column Step 4: Click Remove Selected Analytics Step 5: Return to the Analytics column and re-add the Analytic of choice followed by the parameters of the specific Analytic.
Additional Analytics can always be added to an existing filter, however please note that all
modifications to existing filters should be saved before exiting the window (Save Filter button will overwrite the parameters of the
filter being modified, while the Save As button will create a new filter in My Saved Filters list.
Filters and Alerts
Prepared by William Cheung for EquityFeed Corp. Copyright©2013
40
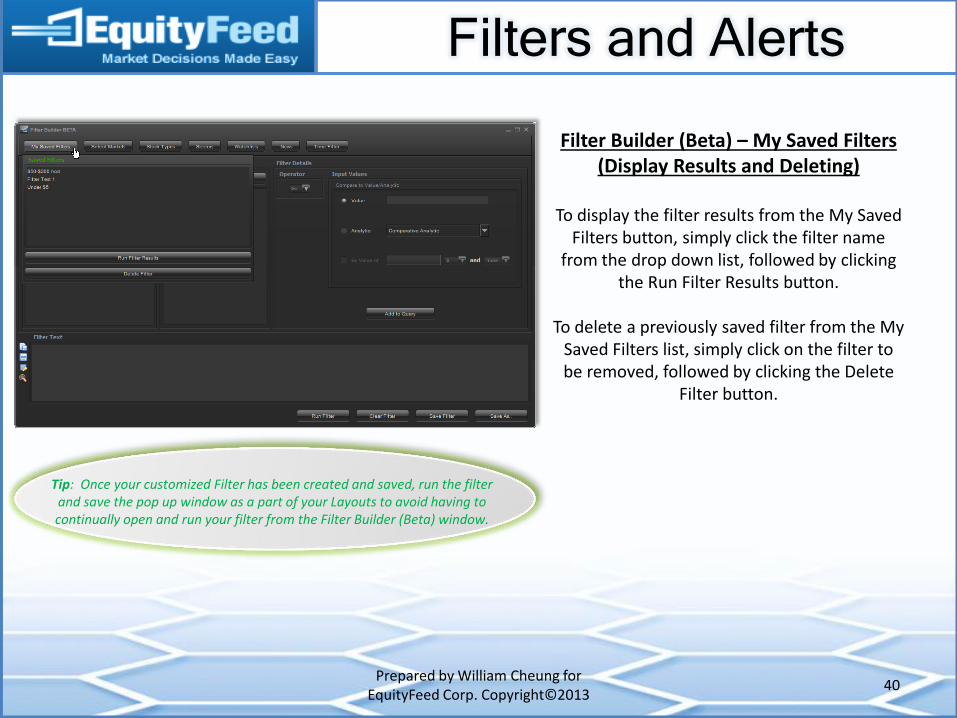
Filter Builder (Beta) – My Saved Filters (Display Results and Deleting)
To display the filter results from the My Saved
Filters button, simply click the filter name from the drop down list, followed by clicking
the Run Filter Results button.
To delete a previously saved filter from the My Saved Filters list, simply click on the filter to be removed, followed by clicking the Delete
Filter button.
Tip: Once your customized Filter has been created and saved, run the filter and save the pop up window as a part of your Layouts to avoid having to continually open and run your filter from the Filter Builder (Beta) window.
Filters and Alerts
Prepared by William Cheung for EquityFeed Corp. Copyright©2013
41
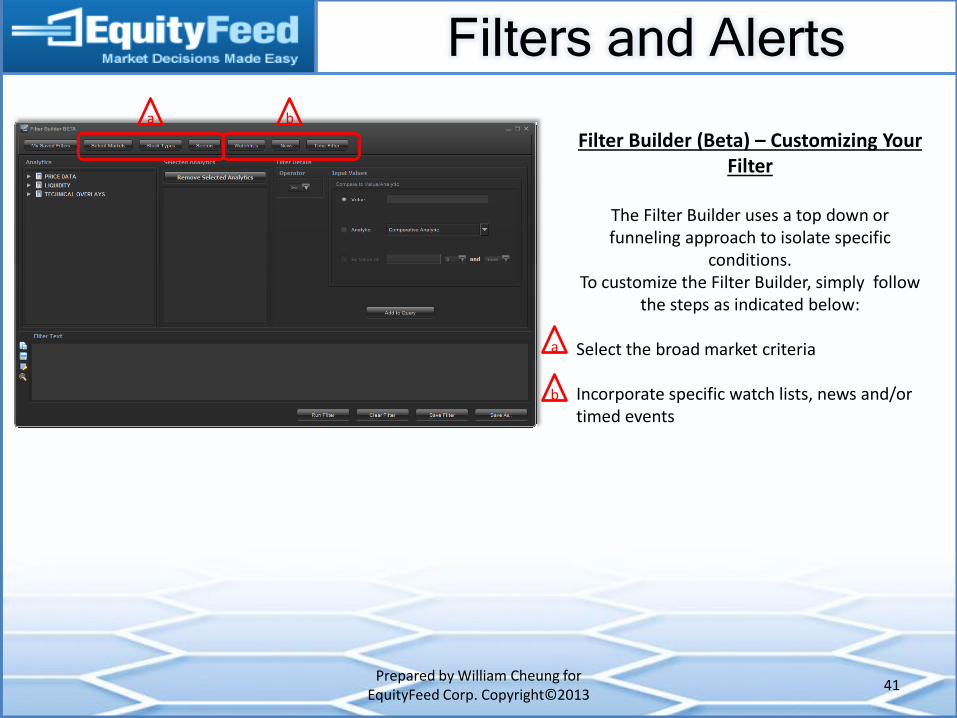
Filter Builder (Beta) – Customizing Your Filter
The Filter Builder uses a top down or funneling approach to isolate specific
conditions. To customize the Filter Builder, simply follow
the steps as indicated below:
Select the broad market criteria Incorporate specific watch lists, news and/or timed events
a
a
b
b

Filters and Alerts
Prepared by William Cheung for EquityFeed Corp. Copyright©2013
42
Filter Builder (Beta) – Select Markets
Once the Select Markets has been opened, the filter creation process can begin. Simply select from the list of exchanges which you would like to see included or excluded as a
part of your filtering parameters. The available choices at this time are as follows:
NASDAQ
NYSE AMEX OTCBB
PINK SHEETS
*Checking the boxes will imply that the selected exchange(s) will be included in the results window, while unchecked boxes
will not be included in the results window.
Filters and Alerts
Prepared by William Cheung for EquityFeed Corp. Copyright©2013
43
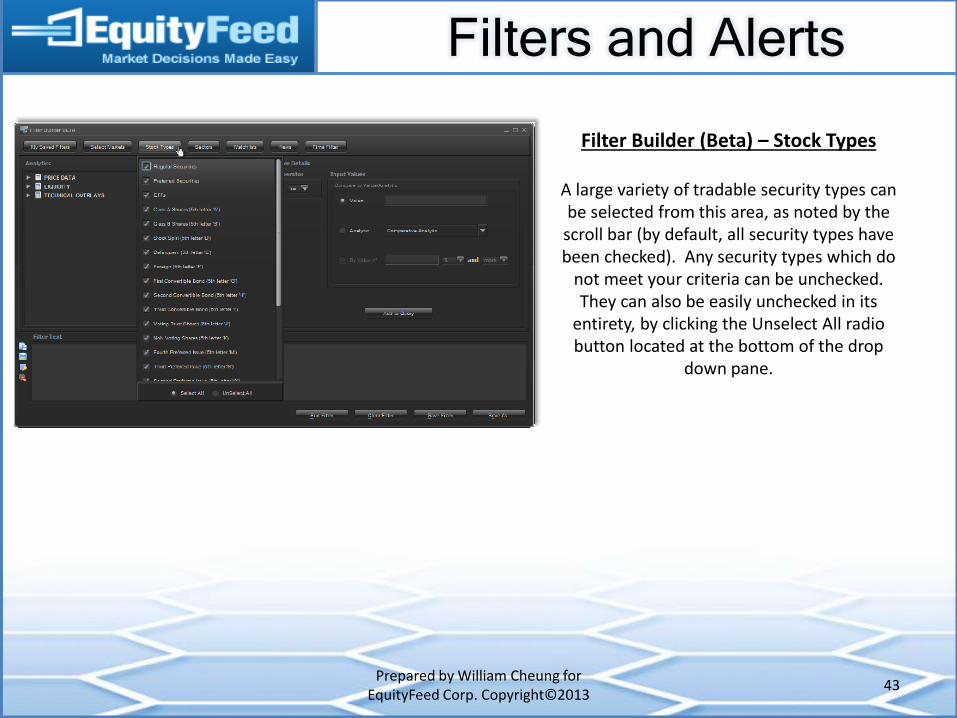
Filter Builder (Beta) – Stock Types
A large variety of tradable security types can be selected from this area, as noted by the scroll bar (by default, all security types have been checked). Any security types which do
not meet your criteria can be unchecked. They can also be easily unchecked in its
entirety, by clicking the Unselect All radio button located at the bottom of the drop
down pane.
Filters and Alerts
Prepared by William Cheung for EquityFeed Corp. Copyright©2013
44
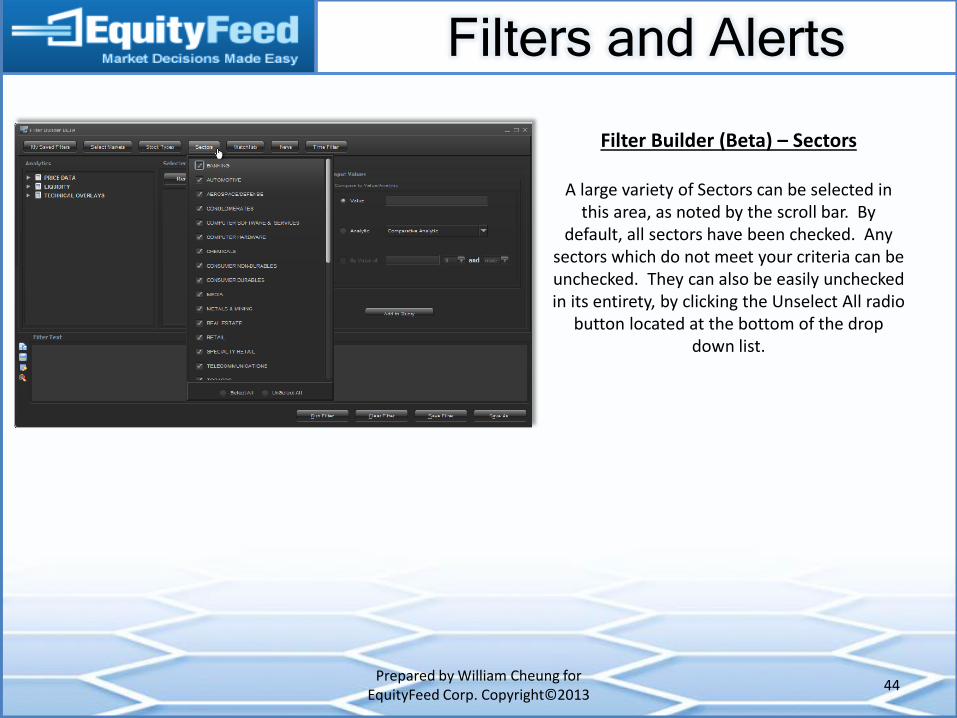
Filter Builder (Beta) – Sectors
A large variety of Sectors can be selected in this area, as noted by the scroll bar. By
default, all sectors have been checked. Any sectors which do not meet your criteria can be unchecked. They can also be easily unchecked in its entirety, by clicking the Unselect All radio
button located at the bottom of the drop down list.
Filters and Alerts
Prepared by William Cheung for EquityFeed Corp. Copyright©2013
45
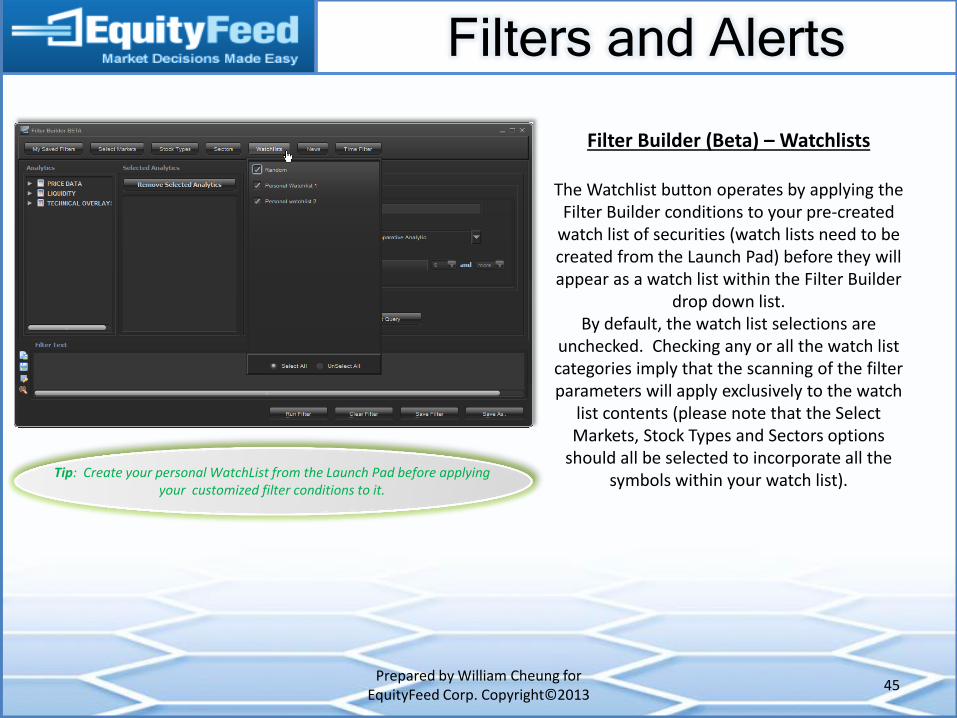
Filter Builder (Beta) – Watchlists
The Watchlist button operates by applying the Filter Builder conditions to your pre-created
watch list of securities (watch lists need to be created from the Launch Pad) before they will appear as a watch list within the Filter Builder
drop down list. By default, the watch list selections are
unchecked. Checking any or all the watch list categories imply that the scanning of the filter parameters will apply exclusively to the watch
list contents (please note that the Select Markets, Stock Types and Sectors options
should all be selected to incorporate all the symbols within your watch list). Tip: Create your personal WatchList from the Launch Pad before applying
your customized filter conditions to it.
Filters and Alerts
Prepared by William Cheung for EquityFeed Corp. Copyright©2013
46
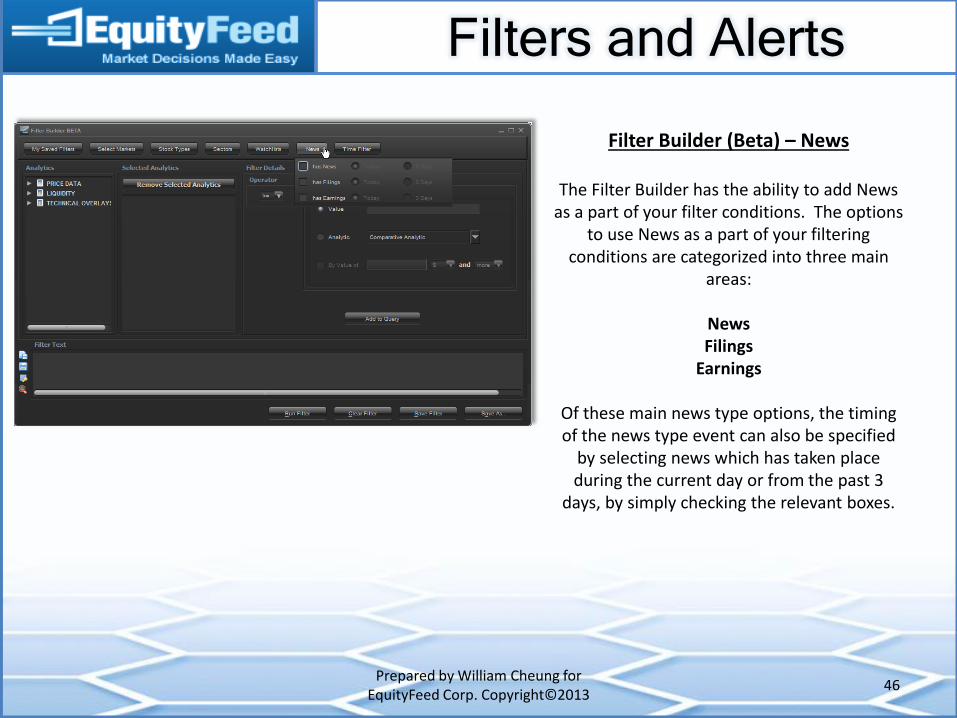
Filter Builder (Beta) – News
The Filter Builder has the ability to add News as a part of your filter conditions. The options
to use News as a part of your filtering conditions are categorized into three main
areas:
News Filings
Earnings
Of these main news type options, the timing of the news type event can also be specified
by selecting news which has taken place during the current day or from the past 3
days, by simply checking the relevant boxes.
Filters and Alerts
Prepared by William Cheung for EquityFeed Corp. Copyright©2013
47
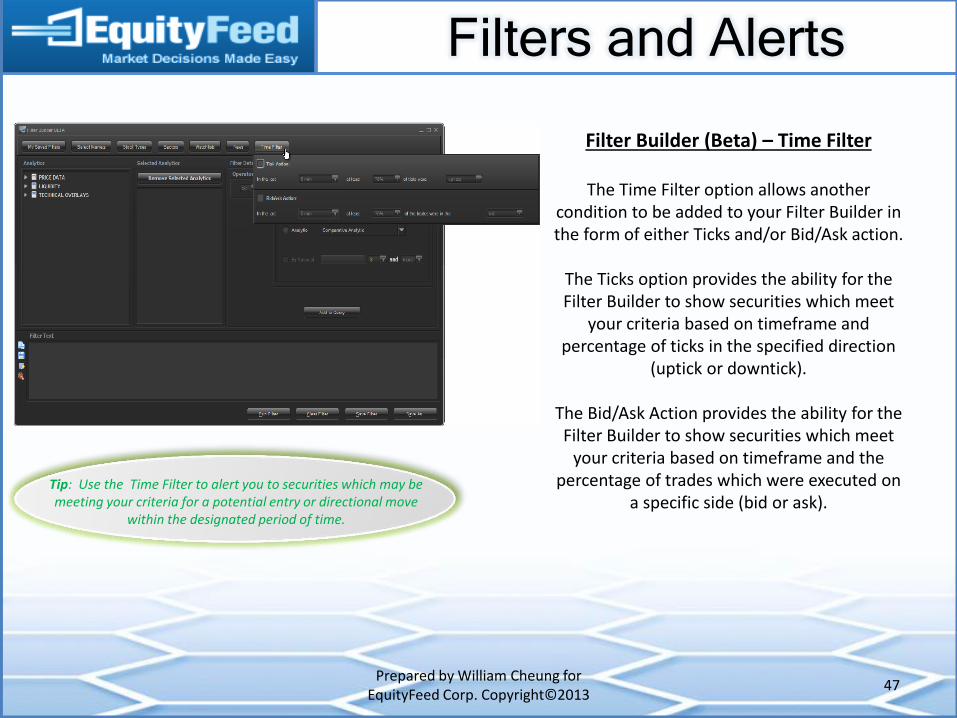
Filter Builder (Beta) – Time Filter
The Time Filter option allows another condition to be added to your Filter Builder in the form of either Ticks and/or Bid/Ask action.
The Ticks option provides the ability for the Filter Builder to show securities which meet
your criteria based on timeframe and percentage of ticks in the specified direction
(uptick or downtick).
The Bid/Ask Action provides the ability for the Filter Builder to show securities which meet
your criteria based on timeframe and the percentage of trades which were executed on
a specific side (bid or ask). Tip: Use the Time Filter to alert you to securities which may be meeting your criteria for a potential entry or directional move
within the designated period of time.
Filters and Alerts
Prepared by William Cheung for EquityFeed Corp. Copyright©2013
48
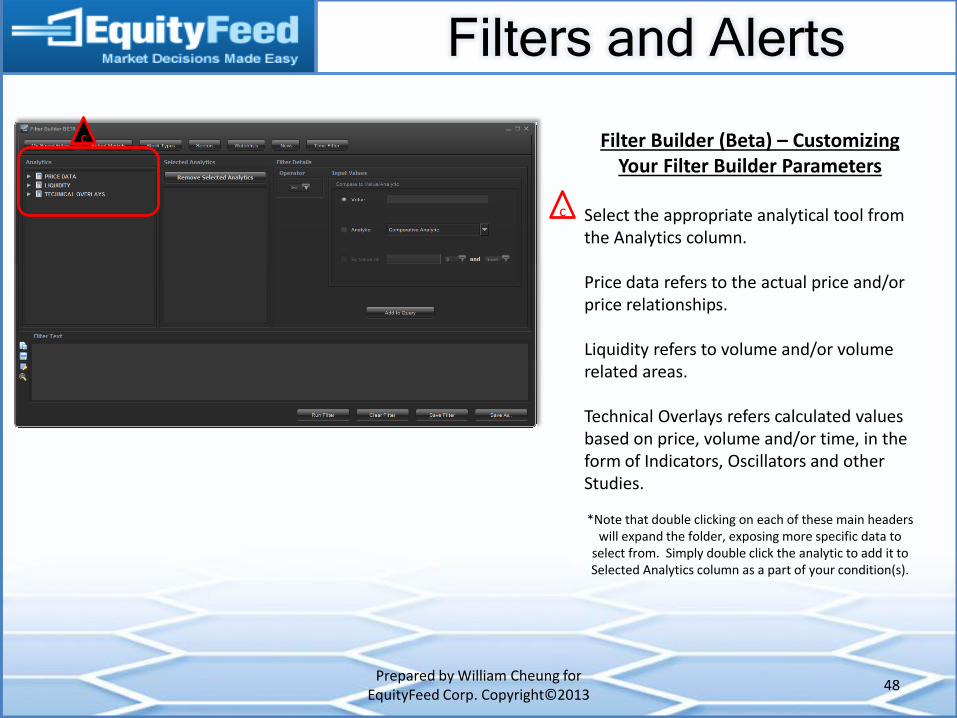
Filter Builder (Beta) – Customizing Your Filter Builder Parameters
Select the appropriate analytical tool from the Analytics column. Price data refers to the actual price and/or price relationships. Liquidity refers to volume and/or volume related areas. Technical Overlays refers calculated values based on price, volume and/or time, in the form of Indicators, Oscillators and other Studies.
*Note that double clicking on each of these main headers
will expand the folder, exposing more specific data to select from. Simply double click the analytic to add it to Selected Analytics column as a part of your condition(s).
c
c
Filters and Alerts
Prepared by William Cheung for EquityFeed Corp. Copyright©2013
49
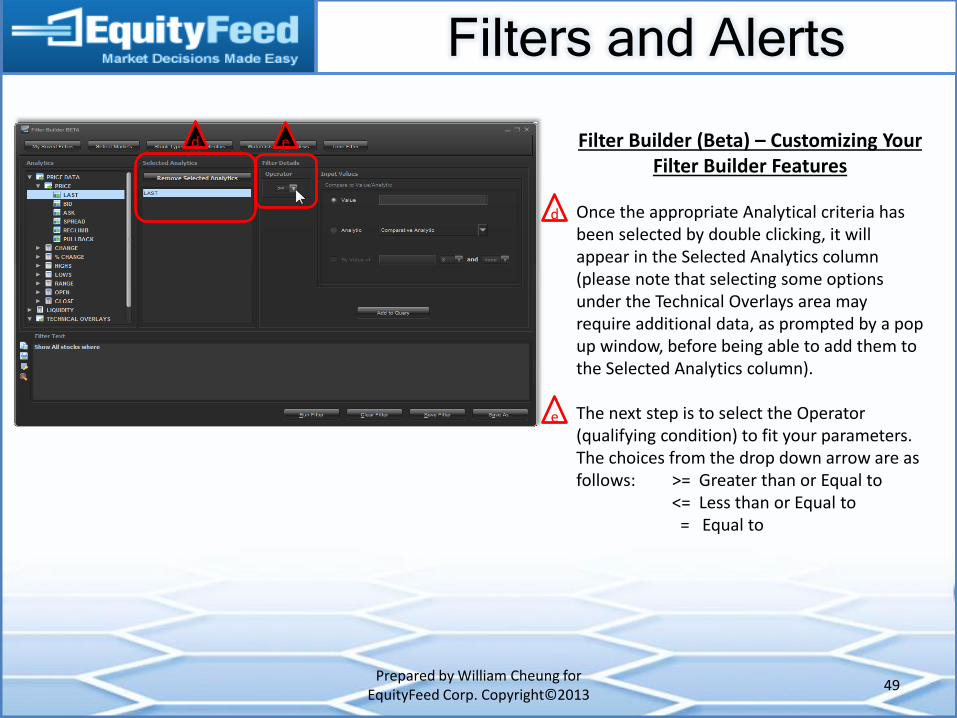
Filter Builder (Beta) – Customizing Your Filter Builder Features
Once the appropriate Analytical criteria has been selected by double clicking, it will appear in the Selected Analytics column (please note that selecting some options under the Technical Overlays area may require additional data, as prompted by a pop up window, before being able to add them to the Selected Analytics column). The next step is to select the Operator (qualifying condition) to fit your parameters. The choices from the drop down arrow are as follows: >= Greater than or Equal to <= Less than or Equal to = Equal to
d
d
e
e
Filters and Alerts
Prepared by William Cheung for EquityFeed Corp. Copyright©2013
50
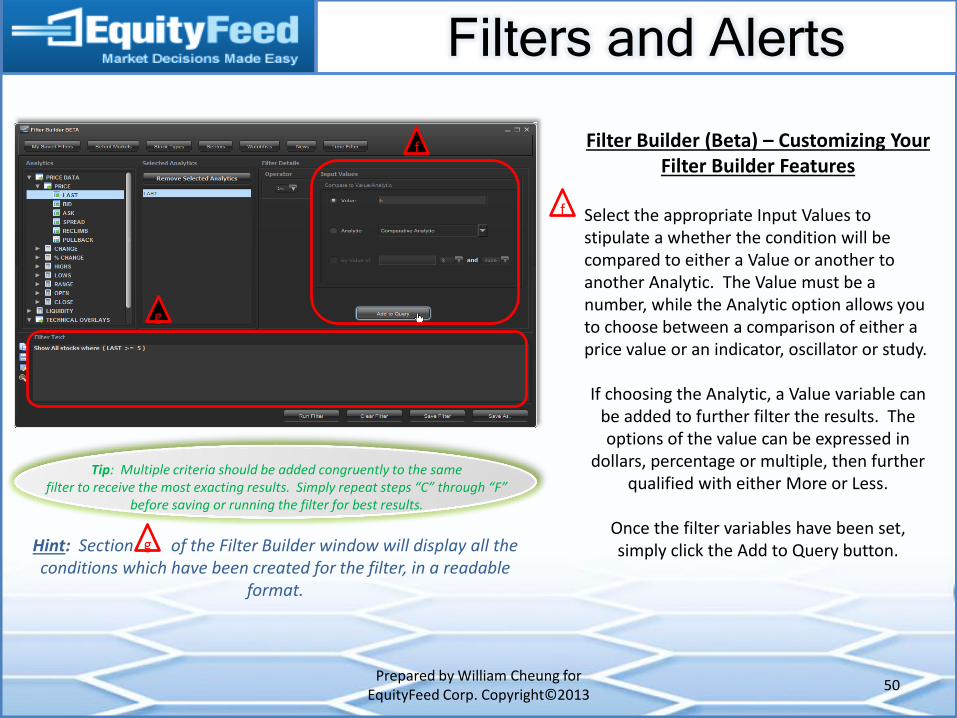
Filter Builder (Beta) – Customizing Your Filter Builder Features
Select the appropriate Input Values to stipulate a whether the condition will be compared to either a Value or another to another Analytic. The Value must be a number, while the Analytic option allows you to choose between a comparison of either a price value or an indicator, oscillator or study.
If choosing the Analytic, a Value variable can
be added to further filter the results. The options of the value can be expressed in
dollars, percentage or multiple, then further qualified with either More or Less.
Once the filter variables have been set, simply click the Add to Query button.
f
f
g
g Hint: Section of the Filter Builder window will display all the conditions which have been created for the filter, in a readable
format.
Tip: Multiple criteria should be added congruently to the same filter to receive the most exacting results. Simply repeat steps “C” through “F”
before saving or running the filter for best results.
Filters and Alerts
Prepared by William Cheung for EquityFeed Corp. Copyright©2013
51
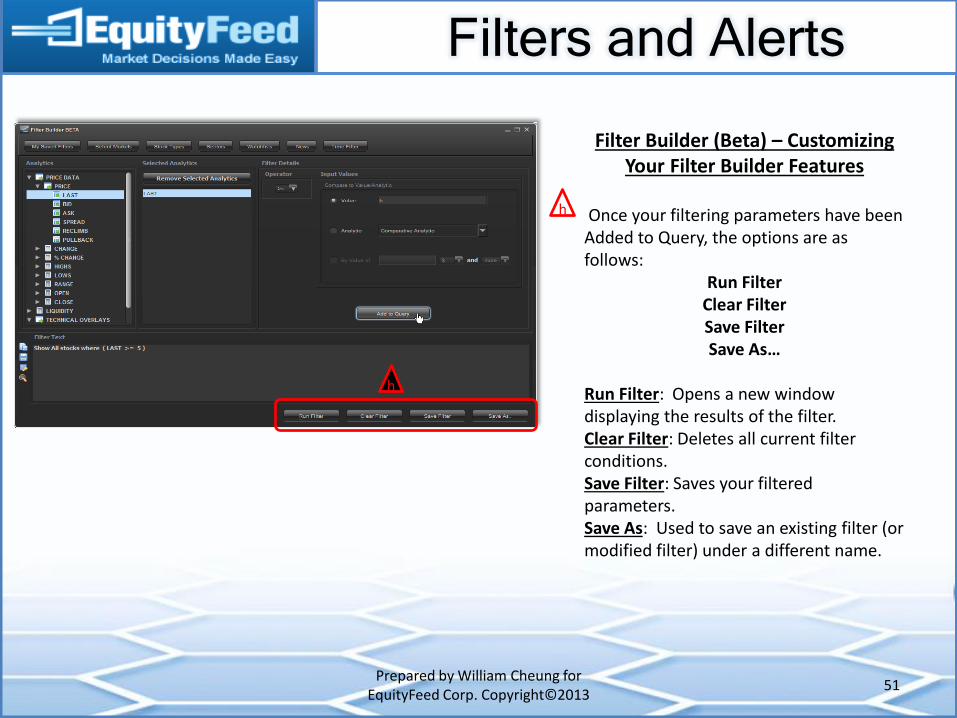
Filter Builder (Beta) – Customizing Your Filter Builder Features
Once your filtering parameters have been Added to Query, the options are as follows:
Run Filter Clear Filter Save Filter Save As…
Run Filter: Opens a new window displaying the results of the filter. Clear Filter: Deletes all current filter conditions. Save Filter: Saves your filtered parameters. Save As: Used to save an existing filter (or modified filter) under a different name.
h
h
Filters and Alerts
Prepared by William Cheung for EquityFeed Corp. Copyright©2013
52
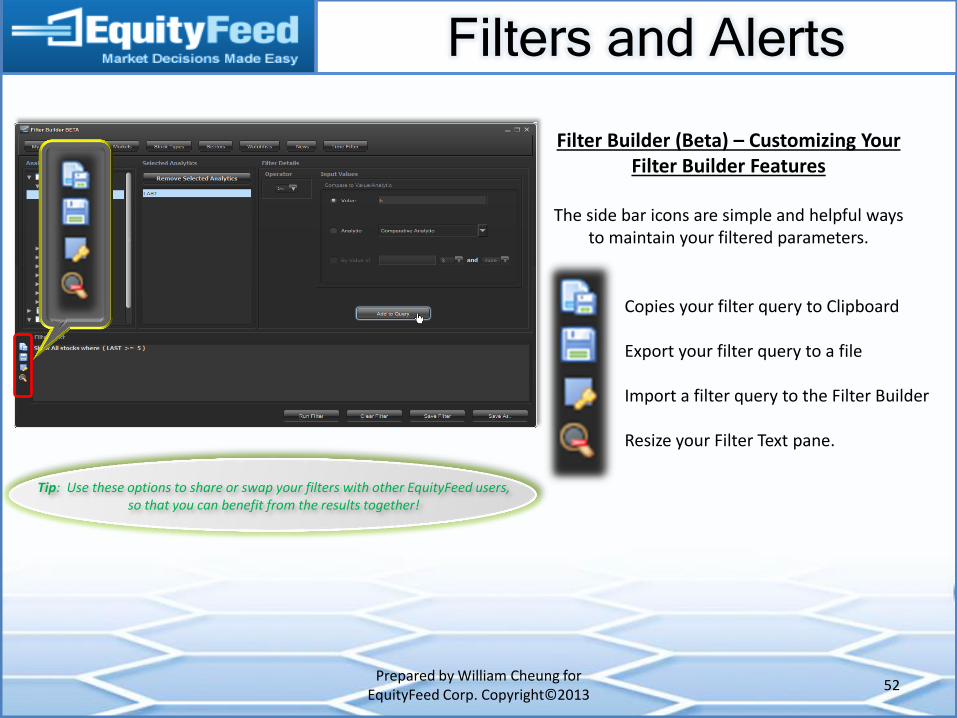
Filter Builder (Beta) – Customizing Your Filter Builder Features
The side bar icons are simple and helpful ways
to maintain your filtered parameters.
Tip: Use these options to share or swap your filters with other EquityFeed users, so that you can benefit from the results together!
Copies your filter query to Clipboard Export your filter query to a file Import a filter query to the Filter Builder Resize your Filter Text pane.
Filters and Alerts
Prepared by William Cheung for EquityFeed Corp. Copyright©2013
53
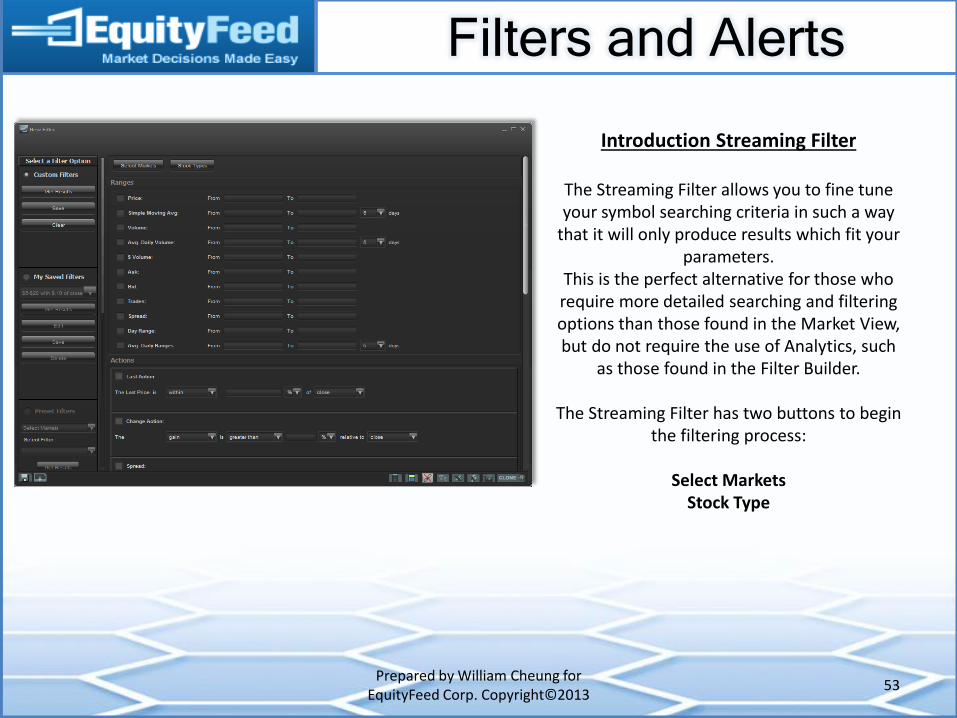
Introduction Streaming Filter
The Streaming Filter allows you to fine tune your symbol searching criteria in such a way
that it will only produce results which fit your parameters.
This is the perfect alternative for those who require more detailed searching and filtering options than those found in the Market View, but do not require the use of Analytics, such
as those found in the Filter Builder.
The Streaming Filter has two buttons to begin the filtering process:
Select Markets
Stock Type
Filters and Alerts
Prepared by William Cheung for EquityFeed Corp. Copyright©2013
54
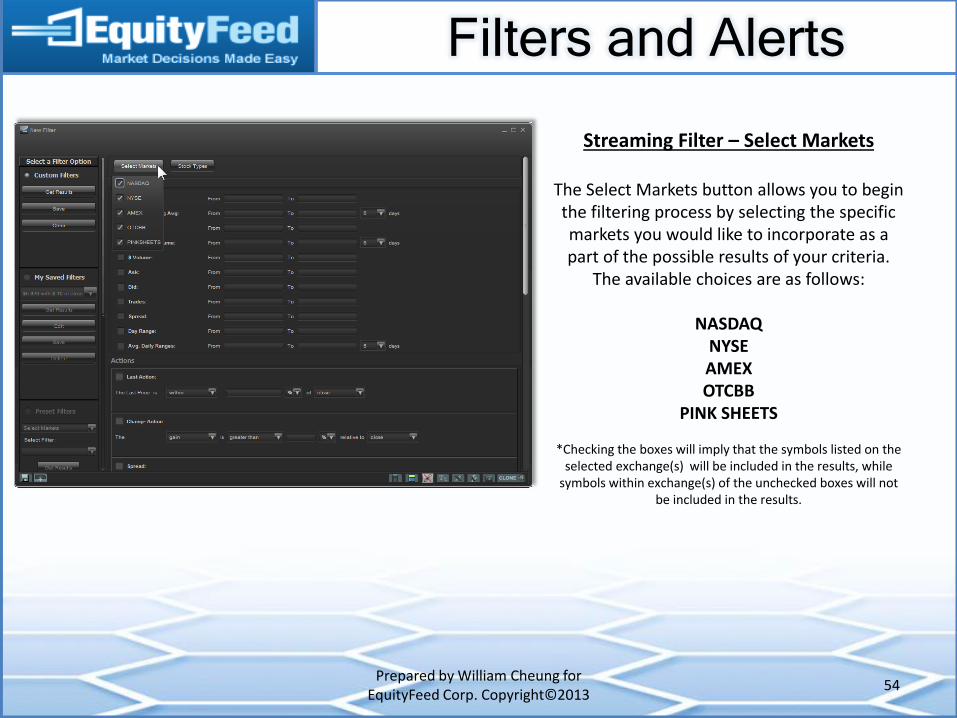
Streaming Filter – Select Markets
The Select Markets button allows you to begin the filtering process by selecting the specific markets you would like to incorporate as a part of the possible results of your criteria.
The available choices are as follows:
NASDAQ NYSE AMEX OTCBB
PINK SHEETS
*Checking the boxes will imply that the symbols listed on the selected exchange(s) will be included in the results, while
symbols within exchange(s) of the unchecked boxes will not be included in the results.
Filters and Alerts
Prepared by William Cheung for EquityFeed Corp. Copyright©2013
55
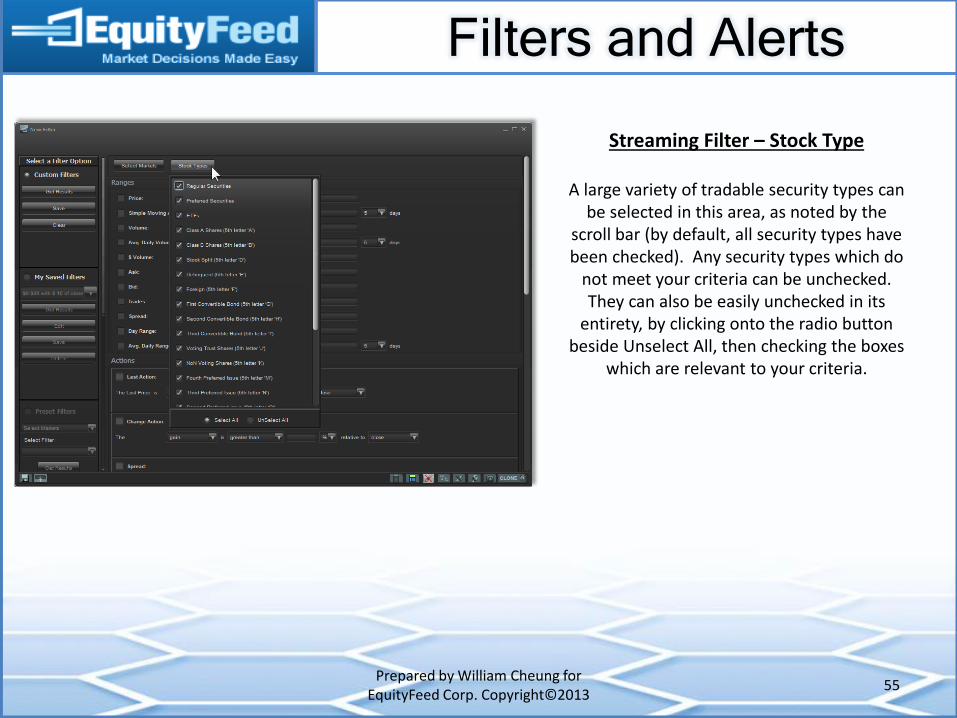
Streaming Filter – Stock Type
A large variety of tradable security types can be selected in this area, as noted by the
scroll bar (by default, all security types have been checked). Any security types which do
not meet your criteria can be unchecked. They can also be easily unchecked in its
entirety, by clicking onto the radio button beside Unselect All, then checking the boxes
which are relevant to your criteria.
Filters and Alerts
Prepared by William Cheung for EquityFeed Corp. Copyright©2013
56
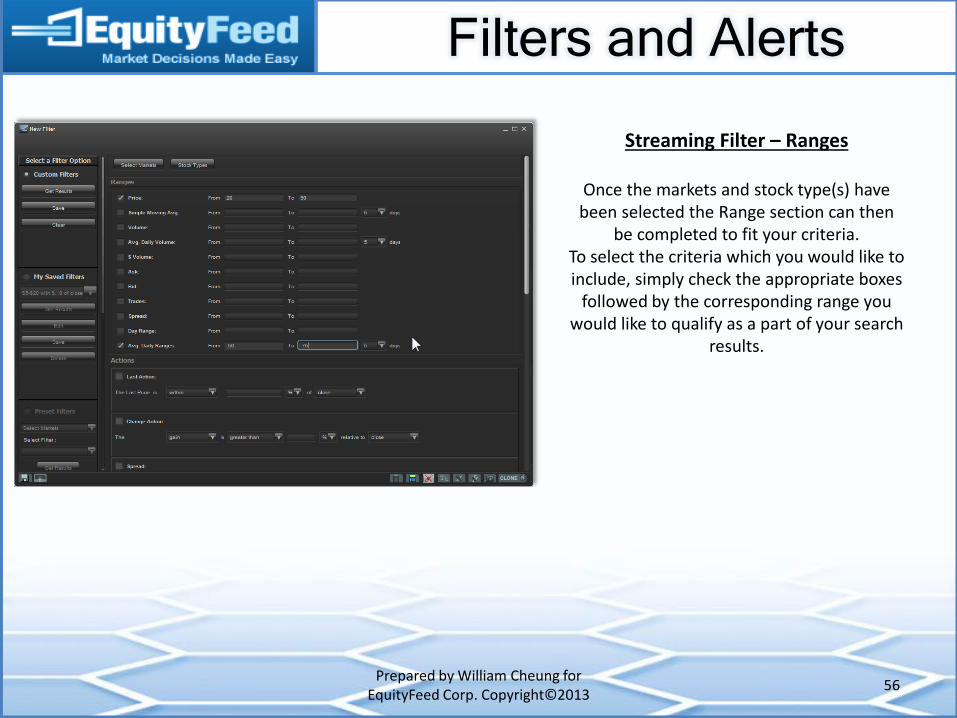
Streaming Filter – Ranges
Once the markets and stock type(s) have been selected the Range section can then
be completed to fit your criteria. To select the criteria which you would like to include, simply check the appropriate boxes
followed by the corresponding range you would like to qualify as a part of your search
results.
Filters and Alerts
Prepared by William Cheung for EquityFeed Corp. Copyright©2013
57
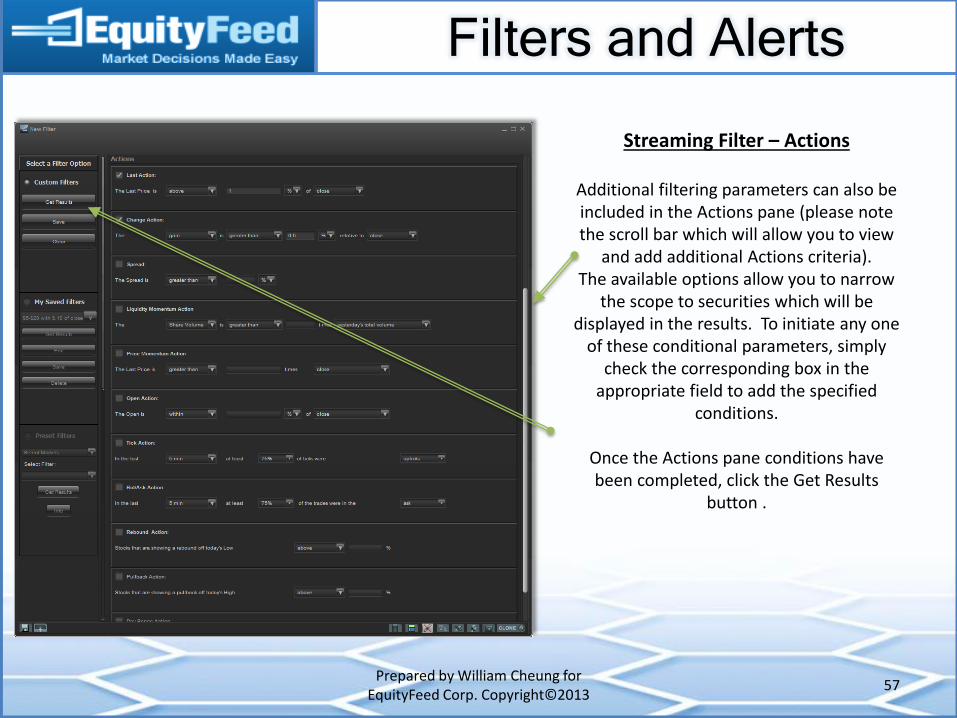
Streaming Filter – Actions
Additional filtering parameters can also be included in the Actions pane (please note the scroll bar which will allow you to view
and add additional Actions criteria). The available options allow you to narrow
the scope to securities which will be displayed in the results. To initiate any one
of these conditional parameters, simply check the corresponding box in the
appropriate field to add the specified conditions.
Once the Actions pane conditions have been completed, click the Get Results
button .
Filters and Alerts
Prepared by William Cheung for EquityFeed Corp. Copyright©2013
58
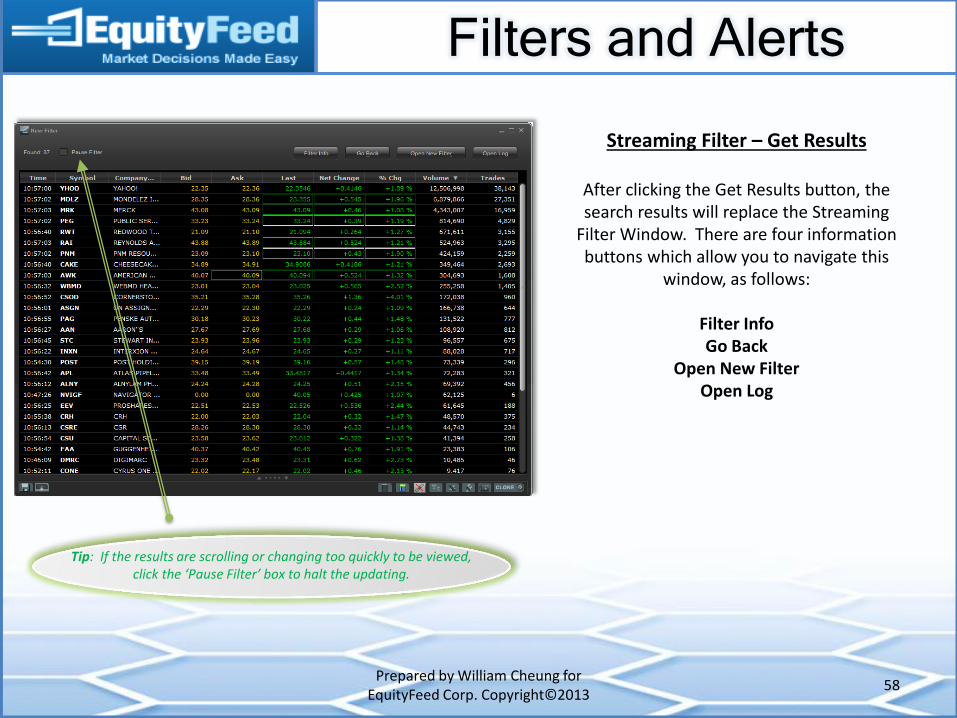
Streaming Filter – Get Results
After clicking the Get Results button, the search results will replace the Streaming
Filter Window. There are four information buttons which allow you to navigate this
window, as follows:
Filter Info Go Back
Open New Filter Open Log
Tip: If the results are scrolling or changing too quickly to be viewed, click the ‘Pause Filter’ box to halt the updating.
Filters and Alerts
Prepared by William Cheung for EquityFeed Corp. Copyright©2013
59
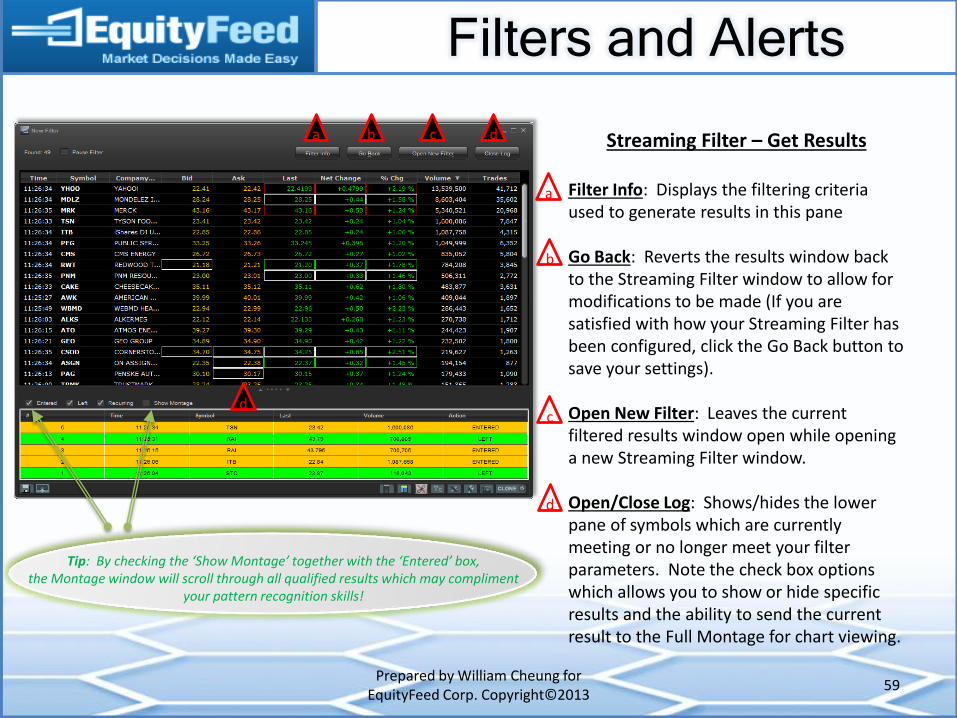
Streaming Filter – Get Results
Filter Info: Displays the filtering criteria used to generate results in this pane Go Back: Reverts the results window back to the Streaming Filter window to allow for modifications to be made (If you are satisfied with how your Streaming Filter has been configured, click the Go Back button to save your settings). Open New Filter: Leaves the current filtered results window open while opening a new Streaming Filter window. Open/Close Log: Shows/hides the lower pane of symbols which are currently meeting or no longer meet your filter parameters. Note the check box options which allows you to show or hide specific results and the ability to send the current result to the Full Montage for chart viewing.
a
a b
b
c
c
d
d
d
Tip: By checking the ‘Show Montage’ together with the ‘Entered’ box, the Montage window will scroll through all qualified results which may compliment
your pattern recognition skills!
Filters and Alerts
Prepared by William Cheung for EquityFeed Corp. Copyright©2013
60
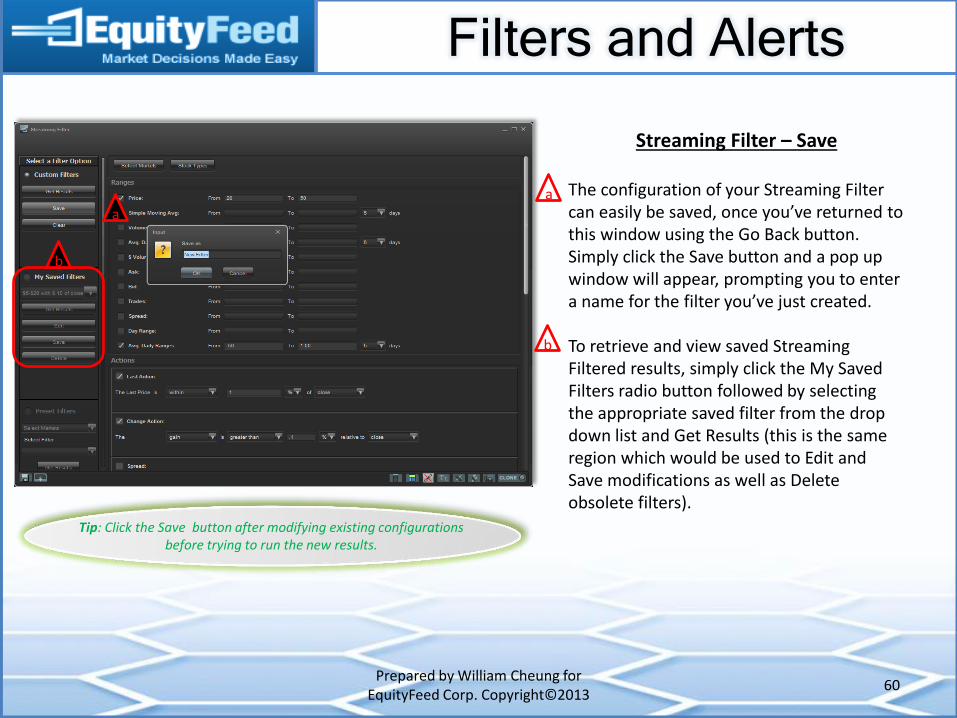
Streaming Filter – Save
The configuration of your Streaming Filter can easily be saved, once you’ve returned to this window using the Go Back button. Simply click the Save button and a pop up window will appear, prompting you to enter a name for the filter you’ve just created. To retrieve and view saved Streaming Filtered results, simply click the My Saved Filters radio button followed by selecting the appropriate saved filter from the drop down list and Get Results (this is the same region which would be used to Edit and Save modifications as well as Delete obsolete filters).
a
a
b
b
Tip: Click the Save button after modifying existing configurations before trying to run the new results.

Filters and Alerts
Prepared by William Cheung for EquityFeed Corp. Copyright©2013
61
Introduction to Trading Alerts
The Trading Alerts feature is another method that can be used to find securities which meet
your trading style. The purpose of Trading Alerts is to provide a display of symbols which meet or exceed new price/volume ranges and/or block
trades. There are six filtering buttons:
Select Markets Stock Types Alert Types
Filters Settings
Watchlist
These filtering buttons will assist you in narrowing down the entire market to the
conditional parameters which meet your criteria.
*Note that any changes to the filter are updated instantaneously in the results pane.
Filters and Alerts
Prepared by William Cheung for EquityFeed Corp. Copyright©2013
62
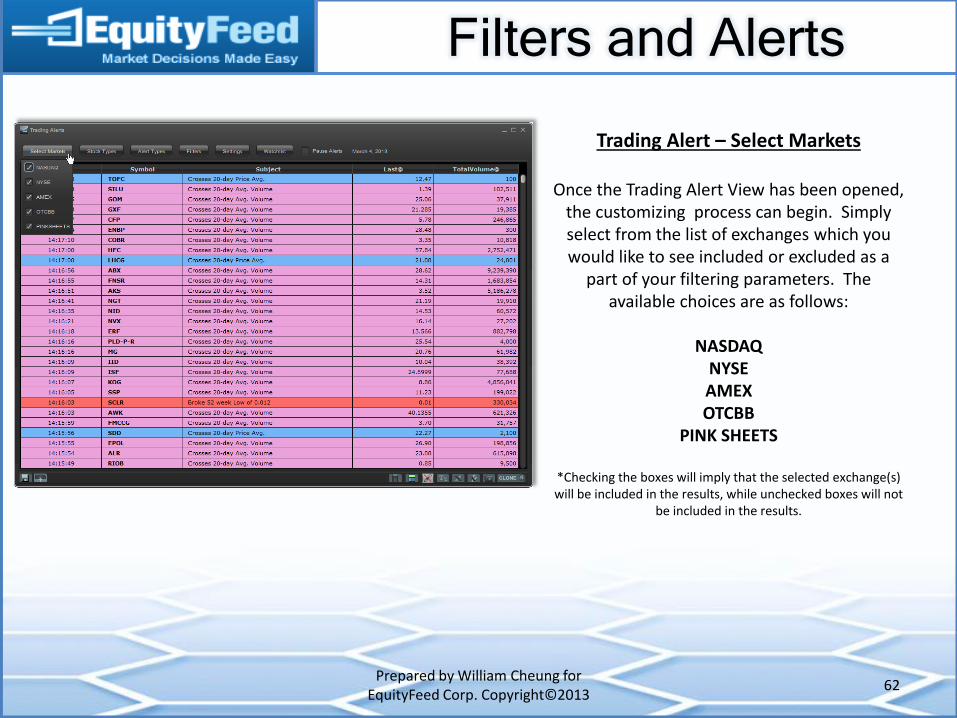
Trading Alert – Select Markets
Once the Trading Alert View has been opened, the customizing process can begin. Simply select from the list of exchanges which you would like to see included or excluded as a
part of your filtering parameters. The available choices are as follows:
NASDAQ
NYSE AMEX OTCBB
PINK SHEETS
*Checking the boxes will imply that the selected exchange(s) will be included in the results, while unchecked boxes will not
be included in the results.
Filters and Alerts
Prepared by William Cheung for EquityFeed Corp. Copyright©2013
63
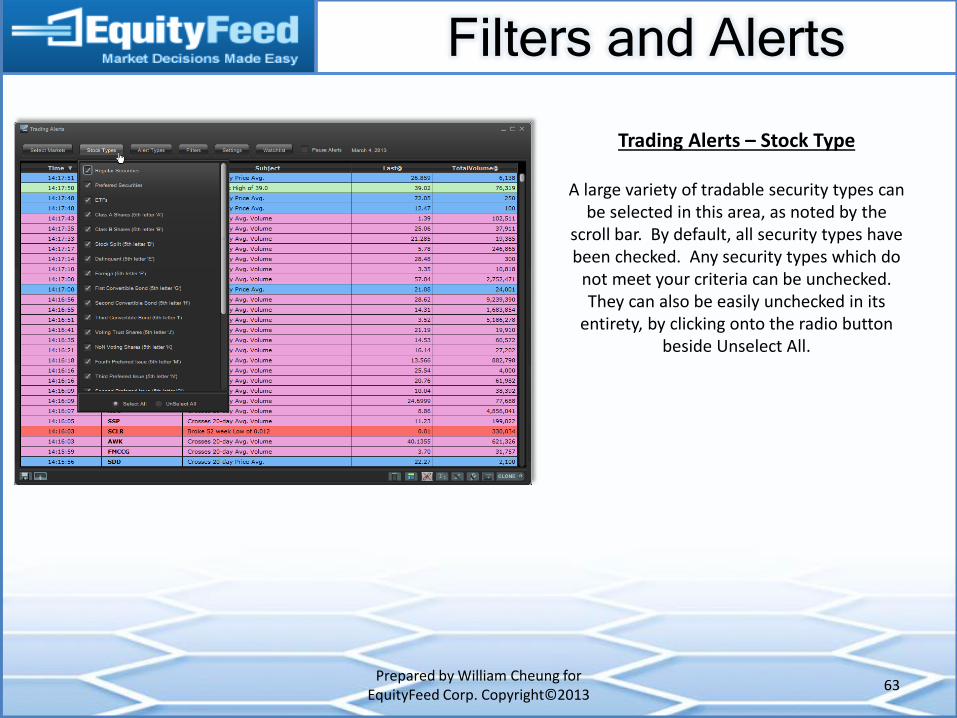
Trading Alerts – Stock Type
A large variety of tradable security types can be selected in this area, as noted by the
scroll bar. By default, all security types have been checked. Any security types which do
not meet your criteria can be unchecked. They can also be easily unchecked in its
entirety, by clicking onto the radio button beside Unselect All.
Filters and Alerts
Prepared by William Cheung for EquityFeed Corp. Copyright©2013
64
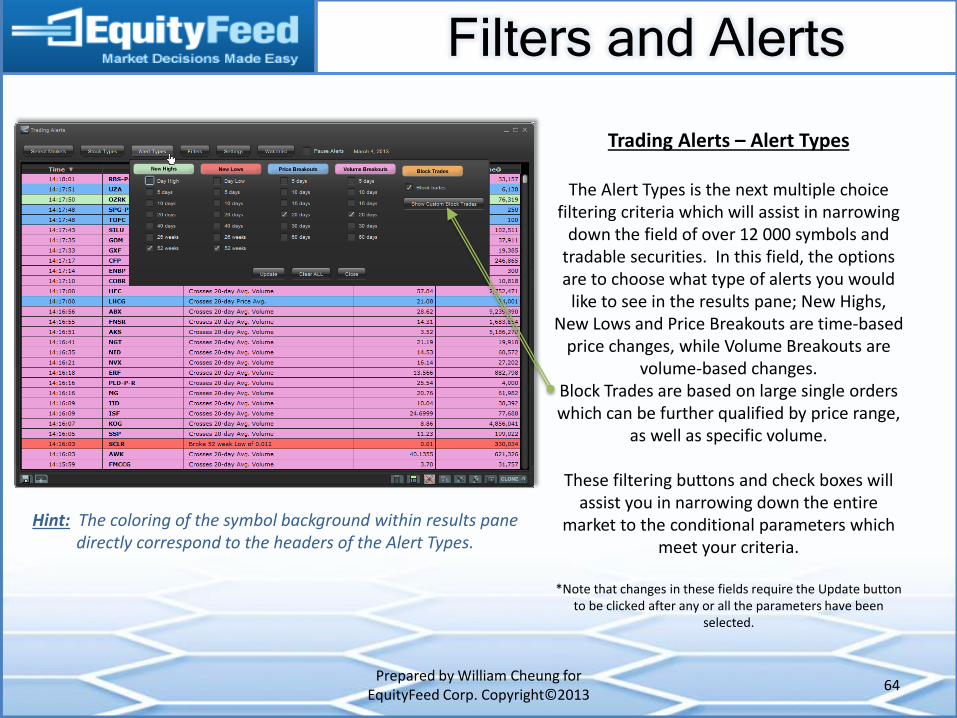
Trading Alerts – Alert Types
The Alert Types is the next multiple choice filtering criteria which will assist in narrowing
down the field of over 12 000 symbols and tradable securities. In this field, the options are to choose what type of alerts you would
like to see in the results pane; New Highs, New Lows and Price Breakouts are time-based
price changes, while Volume Breakouts are volume-based changes.
Block Trades are based on large single orders which can be further qualified by price range,
as well as specific volume.
These filtering buttons and check boxes will assist you in narrowing down the entire
market to the conditional parameters which meet your criteria.
*Note that changes in these fields require the Update button
to be clicked after any or all the parameters have been selected.
Hint: The coloring of the symbol background within results pane directly correspond to the headers of the Alert Types.
Filters and Alerts
Prepared by William Cheung for EquityFeed Corp. Copyright©2013
65
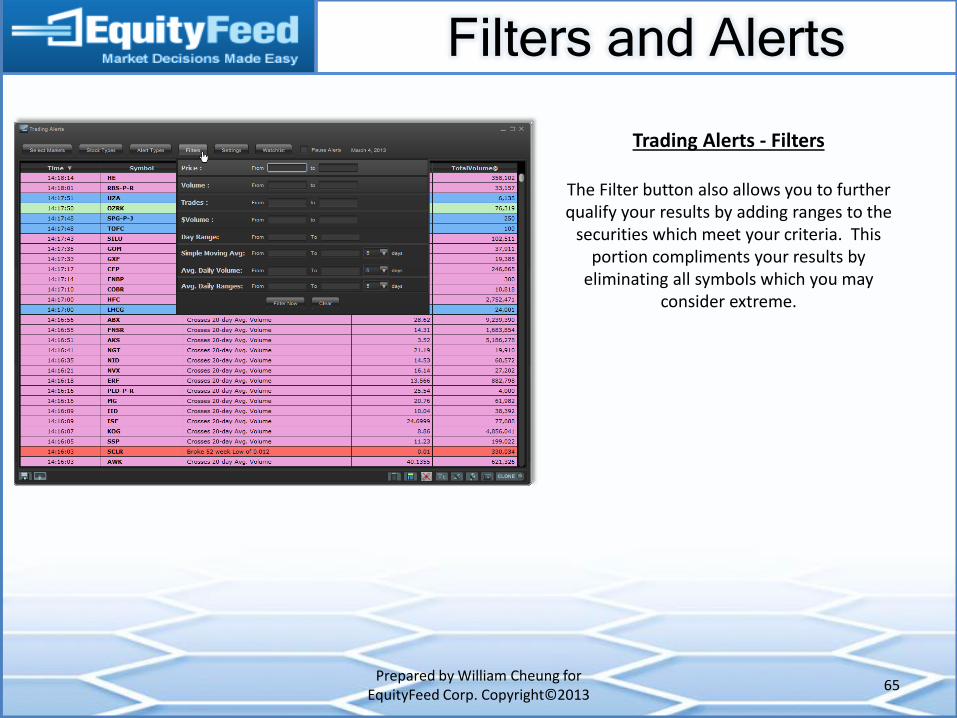
Trading Alerts - Filters
The Filter button also allows you to further qualify your results by adding ranges to the
securities which meet your criteria. This portion compliments your results by
eliminating all symbols which you may consider extreme.

Filters and Alerts
Prepared by William Cheung for EquityFeed Corp. Copyright©2013
66
Trading Alerts - Settings
The Settings option allows additional customization of the result presented. The
Settings options are as follows:
Load all Alerts from 9:30 A.M.: Reloads all results from the current trading day.
Short Alerts Description: Shortens or abbreviates Subject description of the Alert.
Show Recurring HIGHS: Symbols continually making new highs are marked with a * prior to the description.
Show Recurring LOWS: Symbols continually making new lows are marked with a * prior to the description.
For Watchlists Only: Utilizes only symbols within the Watchlist of checked boxes (note that these symbols must be accommodated in the Select Markets and Stock Types in order for results to be visible.
Tip: If selecting ‘For Watchlist Only’, there must be a selection made within the Watchlist section. If no selection has been made within the Watchlist, the Trading Alerts filter will revert to seeking symbols which fit the general filter parameters.
Filters and Alerts
Prepared by William Cheung for EquityFeed Corp. Copyright©2013
67
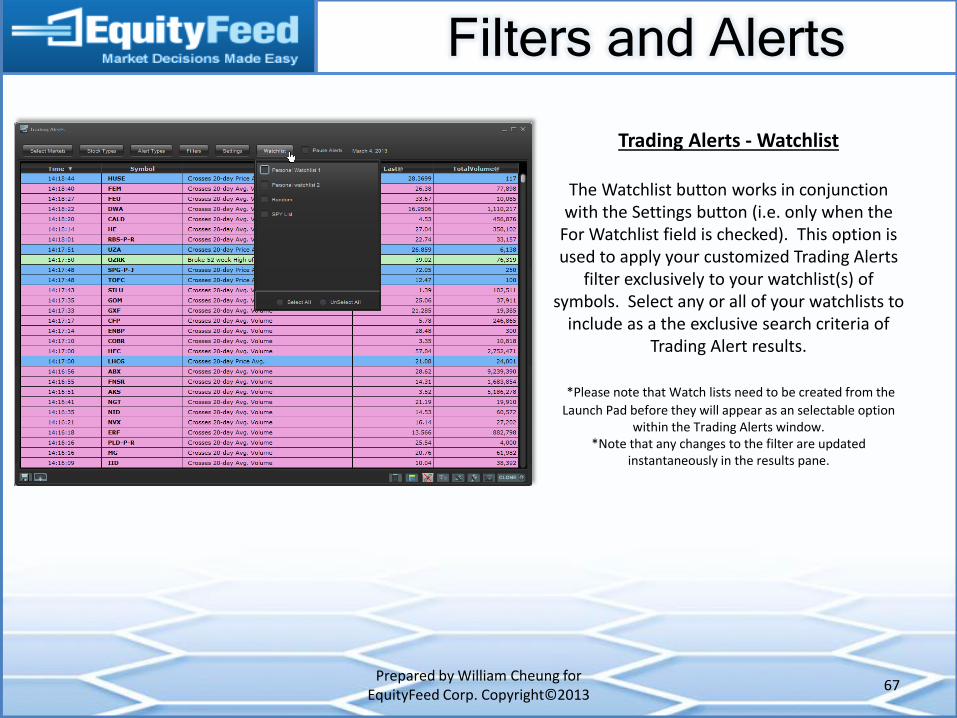
Trading Alerts - Watchlist
The Watchlist button works in conjunction with the Settings button (i.e. only when the
For Watchlist field is checked). This option is used to apply your customized Trading Alerts
filter exclusively to your watchlist(s) of symbols. Select any or all of your watchlists to
include as a the exclusive search criteria of Trading Alert results.
*Please note that Watch lists need to be created from the
Launch Pad before they will appear as an selectable option within the Trading Alerts window.
*Note that any changes to the filter are updated instantaneously in the results pane.
Filters and Alerts
Prepared by William Cheung for EquityFeed Corp. Copyright©2013
68
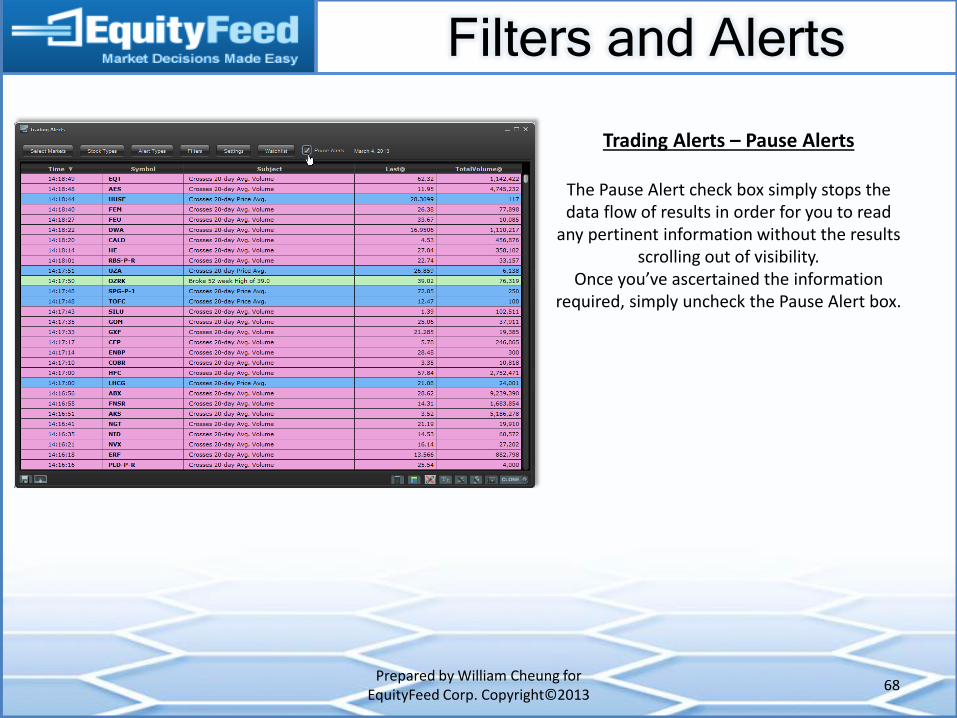
Trading Alerts – Pause Alerts
The Pause Alert check box simply stops the data flow of results in order for you to read
any pertinent information without the results scrolling out of visibility.
Once you’ve ascertained the information required, simply uncheck the Pause Alert box.
Filters and Alerts
Prepared by William Cheung for EquityFeed Corp. Copyright©2013
69
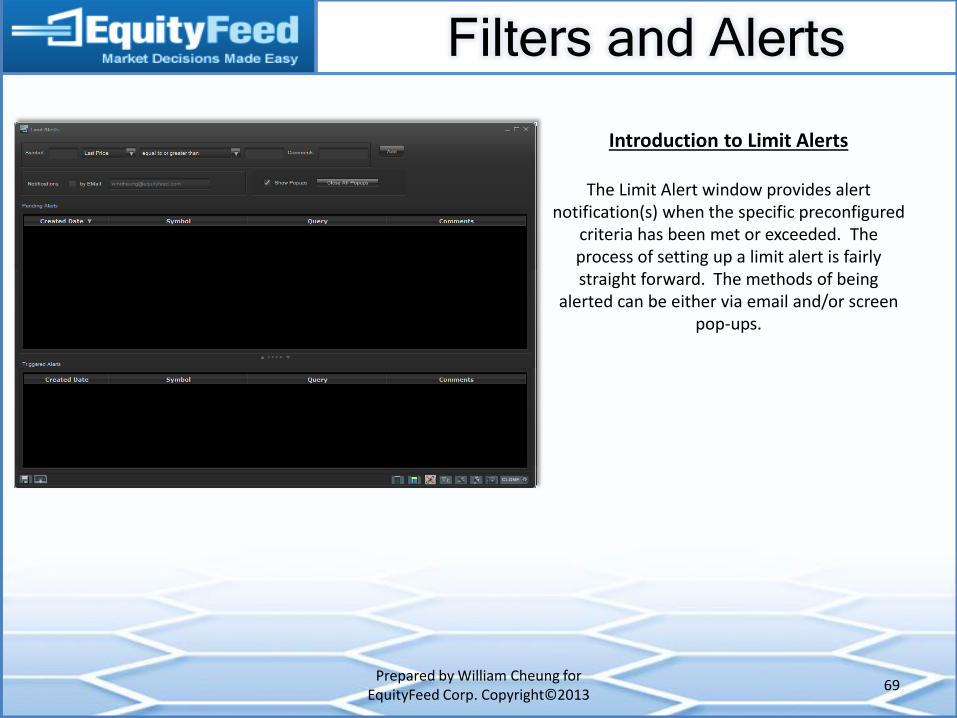
Introduction to Limit Alerts
The Limit Alert window provides alert notification(s) when the specific preconfigured
criteria has been met or exceeded. The process of setting up a limit alert is fairly straight forward. The methods of being
alerted can be either via email and/or screen pop-ups.
Filters and Alerts
Prepared by William Cheung for EquityFeed Corp. Copyright©2013
70
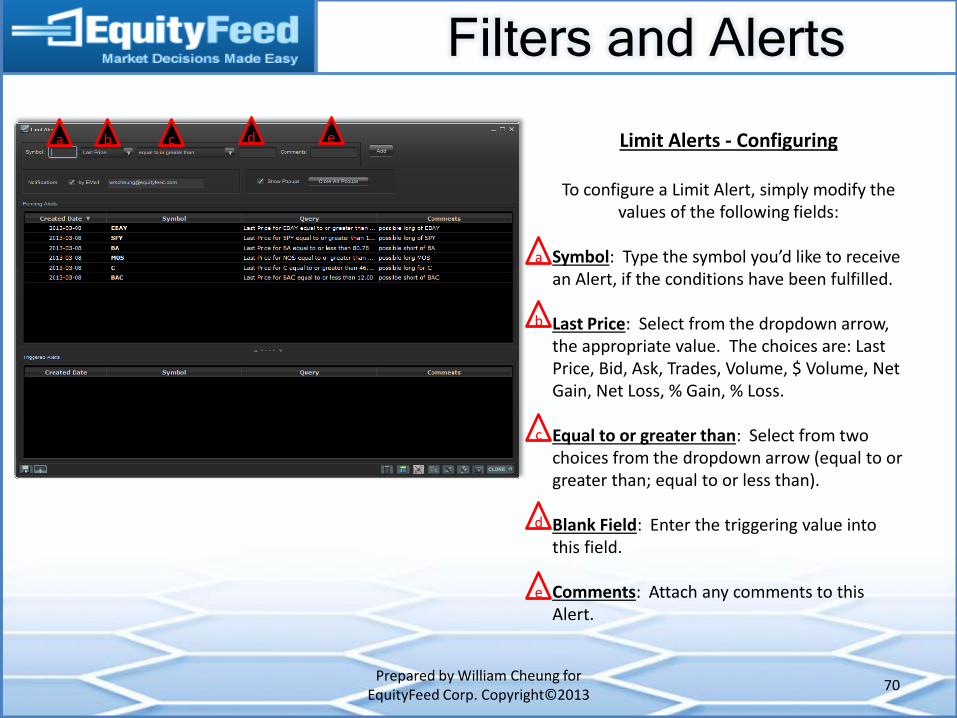
Limit Alerts - Configuring
To configure a Limit Alert, simply modify the values of the following fields:
Symbol: Type the symbol you’d like to receive an Alert, if the conditions have been fulfilled. Last Price: Select from the dropdown arrow, the appropriate value. The choices are: Last Price, Bid, Ask, Trades, Volume, $ Volume, Net Gain, Net Loss, % Gain, % Loss. Equal to or greater than: Select from two choices from the dropdown arrow (equal to or greater than; equal to or less than). Blank Field: Enter the triggering value into this field. Comments: Attach any comments to this Alert.
a
a
b
b
c
c
d
d
e
e
Filters and Alerts
Prepared by William Cheung for EquityFeed Corp. Copyright©2013
71
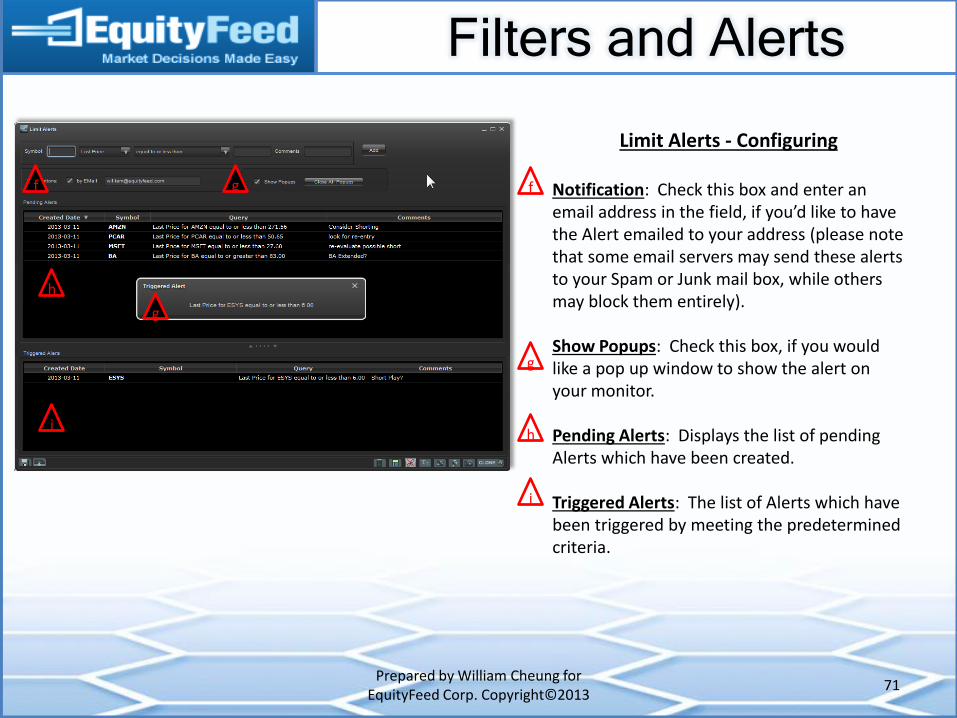
Limit Alerts - Configuring
Notification: Check this box and enter an email address in the field, if you’d like to have the Alert emailed to your address (please note that some email servers may send these alerts to your Spam or Junk mail box, while others may block them entirely). Show Popups: Check this box, if you would like a pop up window to show the alert on your monitor. Pending Alerts: Displays the list of pending Alerts which have been created. Triggered Alerts: The list of Alerts which have been triggered by meeting the predetermined criteria.
f f
g
g
h
h
i
i
g
Filters and Alerts
Prepared by William Cheung for EquityFeed Corp. Copyright©2013
72
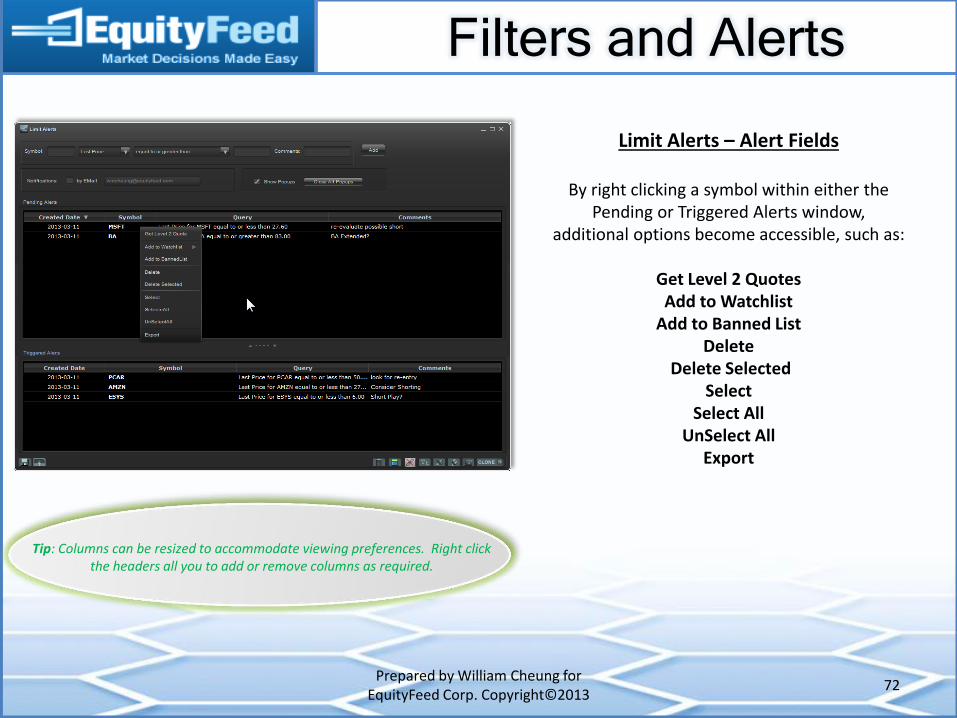
Limit Alerts – Alert Fields
By right clicking a symbol within either the Pending or Triggered Alerts window,
additional options become accessible, such as:
Get Level 2 Quotes Add to Watchlist
Add to Banned List Delete
Delete Selected Select
Select All UnSelect All
Export
Tip: Columns can be resized to accommodate viewing preferences. Right click the headers all you to add or remove columns as required.
Filters and Alerts
Prepared by William Cheung for EquityFeed Corp. Copyright©2013
73
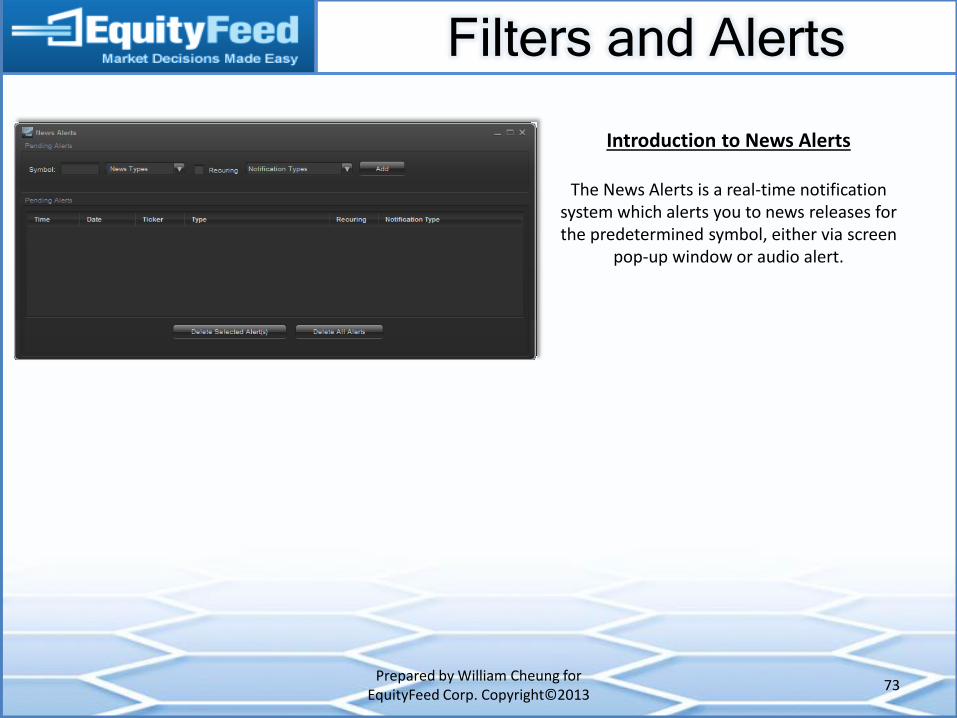
Introduction to News Alerts
The News Alerts is a real-time notification system which alerts you to news releases for the predetermined symbol, either via screen
pop-up window or audio alert.
Filters and Alerts
Prepared by William Cheung for EquityFeed Corp. Copyright©2013
74
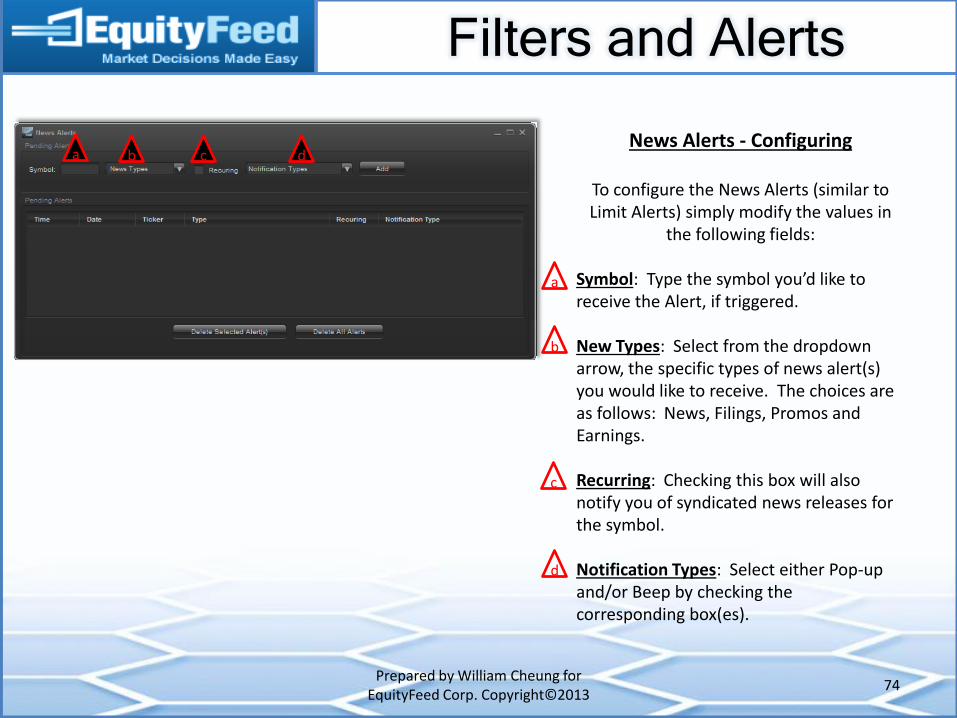
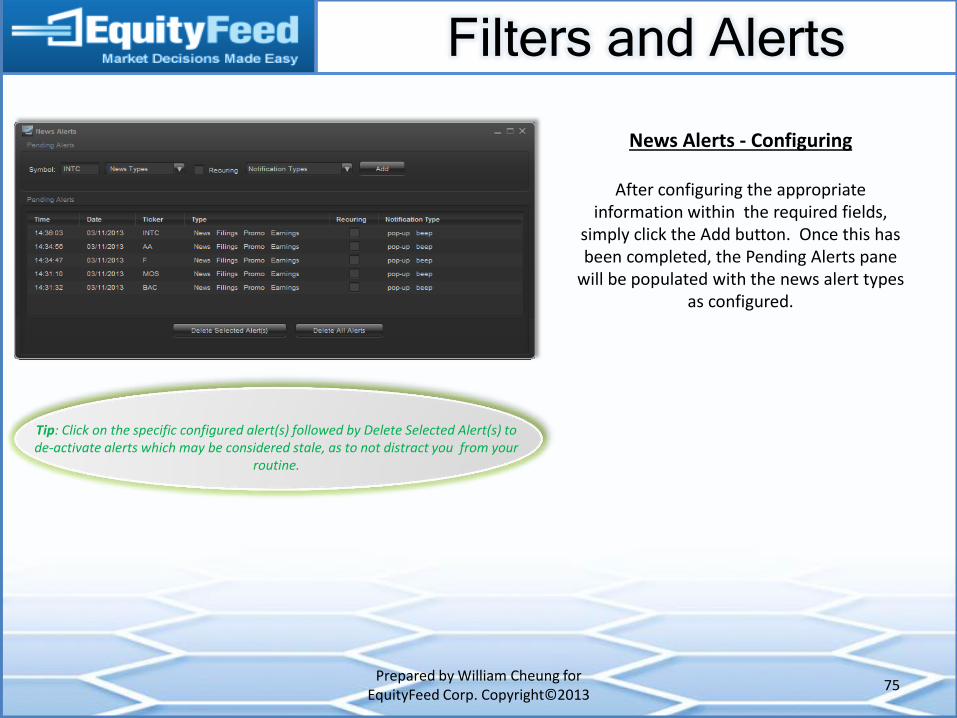
News Alerts - Configuring
To configure the News Alerts (similar to Limit Alerts) simply modify the values in
the following fields:
Symbol: Type the symbol you’d like to receive the Alert, if triggered. New Types: Select from the dropdown arrow, the specific types of news alert(s) you would like to receive. The choices are as follows: News, Filings, Promos and Earnings.
Recurring: Checking this box will also notify you of syndicated news releases for the symbol. Notification Types: Select either Pop-up and/or Beep by checking the corresponding box(es).
a b c d
b
c
d
a
Filters and Alerts
Prepared by William Cheung for EquityFeed Corp. Copyright©2013
75
News Alerts - Configuring
After configuring the appropriate information within the required fields,
simply click the Add button. Once this has been completed, the Pending Alerts pane
will be populated with the news alert types as configured.
Tip: Click on the specific configured alert(s) followed by Delete Selected Alert(s) to de-activate alerts which may be considered stale, as to not distract you from your
routine.
Section Focus
Prepared by William Cheung for EquityFeed Corp. Copyright©2013
76
Launch Pad
Feed Views
Filters and Alerts
Decision Support
Charting
News and Filings
Integrated Trading
Watch Lists
Layouts
Sub-Menu
Login
Additional Tools
Traders and Their Tools
Additional Information
Decision Support
Prepared by William Cheung for EquityFeed Corp. Copyright©2013
77
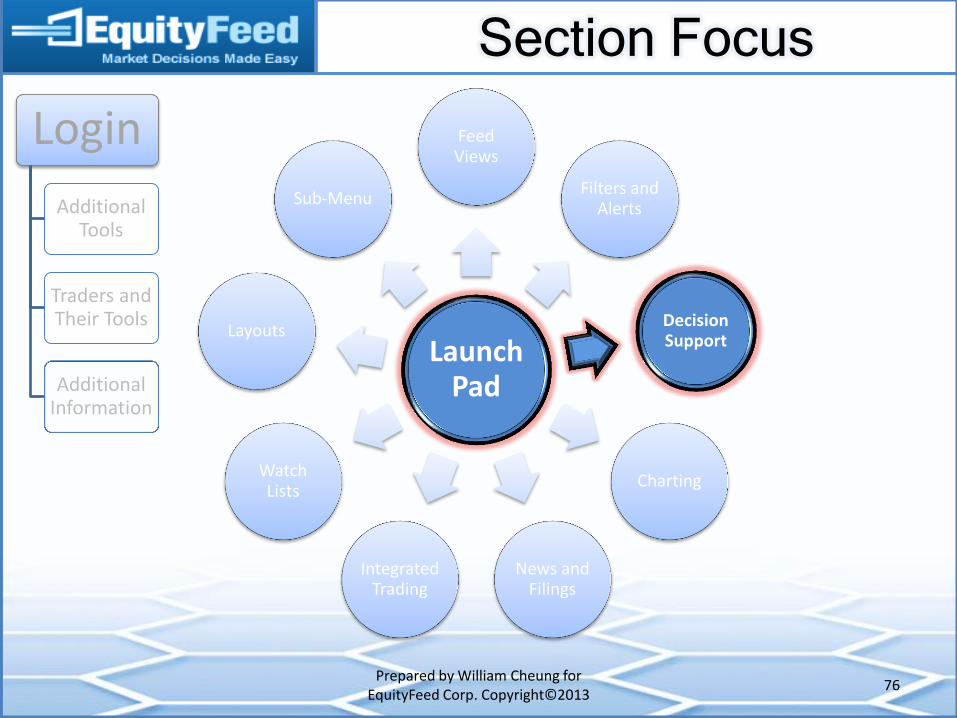
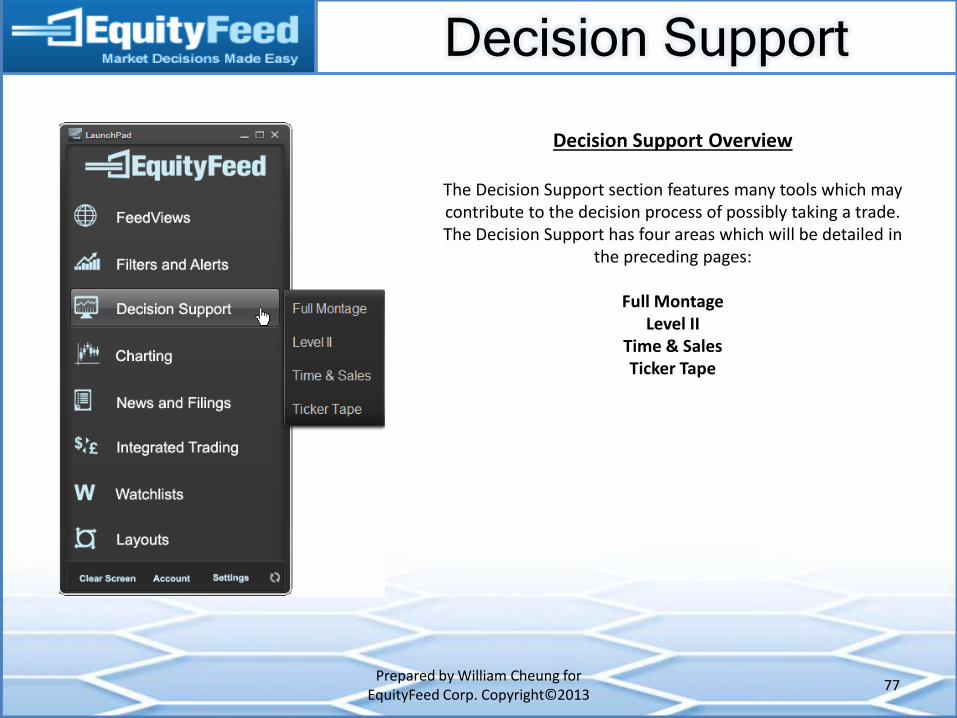
Decision Support Overview
The Decision Support section features many tools which may contribute to the decision process of possibly taking a trade. The Decision Support has four areas which will be detailed in
the preceding pages:
Full Montage Level II
Time & Sales Ticker Tape
Decision Support
Prepared by William Cheung for EquityFeed Corp. Copyright©2013
78
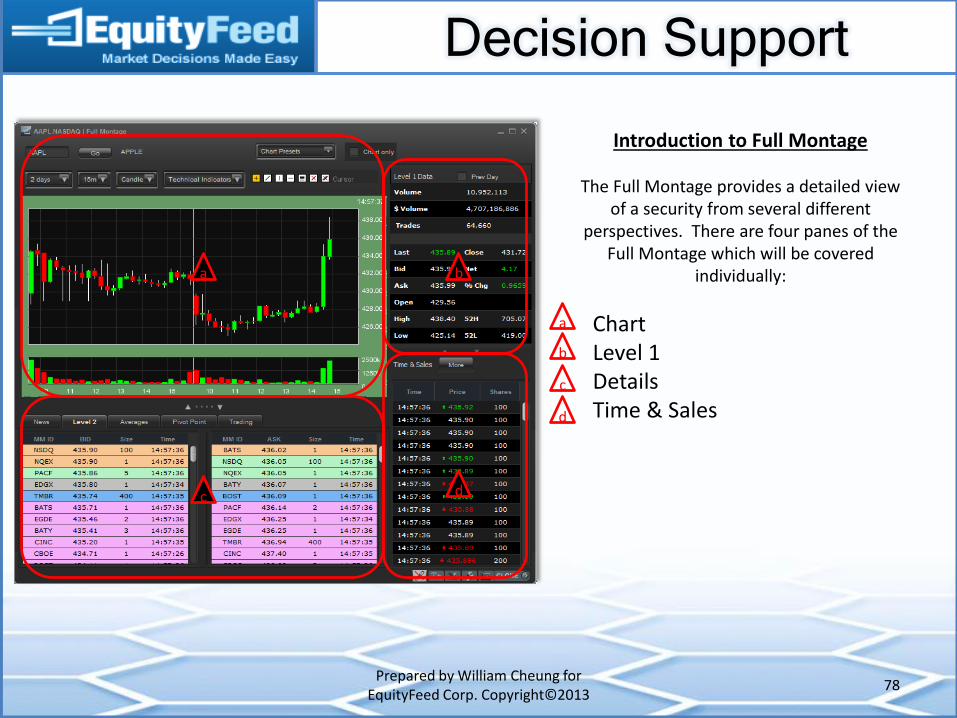
Introduction to Full Montage
The Full Montage provides a detailed view of a security from several different
perspectives. There are four panes of the Full Montage which will be covered
individually:
Chart Level 1 Details Time & Sales
a
a
b
b
c
c d
d
Decision Support
Prepared by William Cheung for EquityFeed Corp. Copyright©2013
79
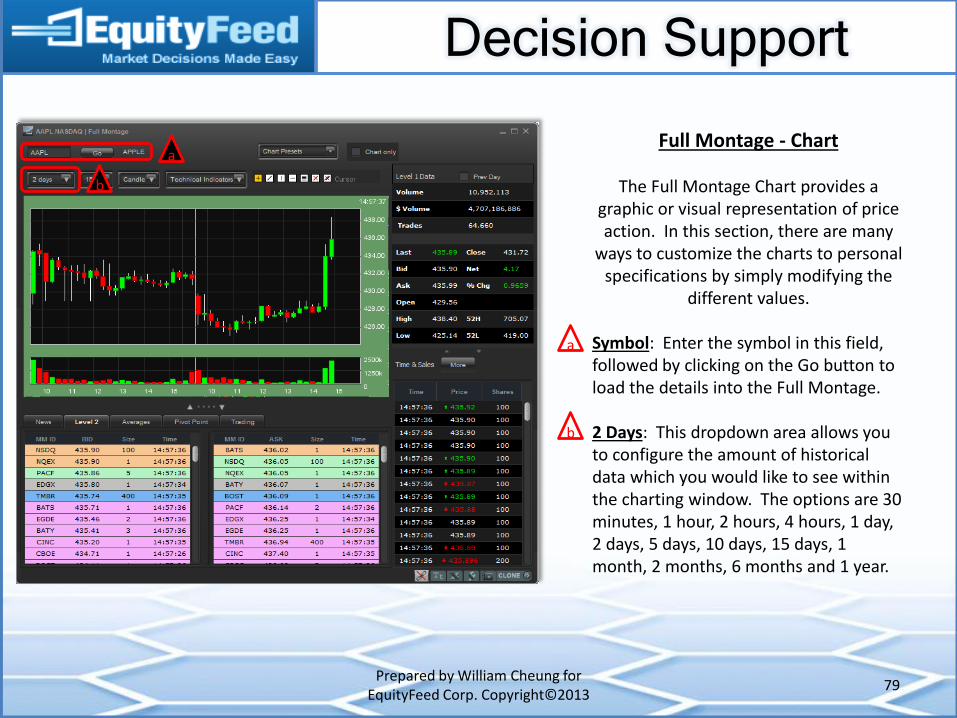
Full Montage - Chart
The Full Montage Chart provides a graphic or visual representation of price action. In this section, there are many
ways to customize the charts to personal specifications by simply modifying the
different values.
Symbol: Enter the symbol in this field, followed by clicking on the Go button to load the details into the Full Montage. 2 Days: This dropdown area allows you to configure the amount of historical data which you would like to see within the charting window. The options are 30 minutes, 1 hour, 2 hours, 4 hours, 1 day, 2 days, 5 days, 10 days, 15 days, 1 month, 2 months, 6 months and 1 year.
a
a
b
b

Decision Support
Prepared by William Cheung for EquityFeed Corp. Copyright©2013
80
Full Montage - Charts
1d: This field allows you to enter the value for time in intervals (1m, 2m, 5m, 15m, 30m or 1d), as represented by each bar in the chart. Note that this area should be coordinated with the prior button to have presentable and legible information. Line: This dropdown area allows you to select the representation type of each bar. The options are Line, Bar and Candle. Technical Indicators: This dropdown field allows you to apply a wide variety of indicators, oscillators and studies to the chart. The additional options for the selected study can be either default values or customized values.
c
c
d
d
e
e
Decision Support
Prepared by William Cheung for EquityFeed Corp. Copyright©2013
81
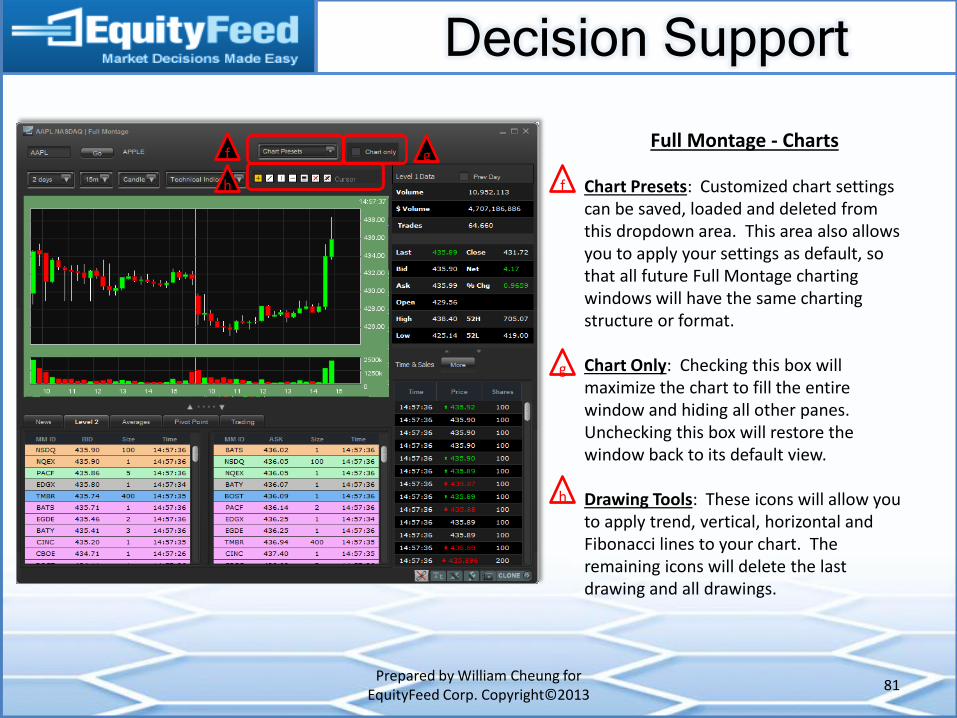
Full Montage - Charts
Chart Presets: Customized chart settings can be saved, loaded and deleted from this dropdown area. This area also allows you to apply your settings as default, so that all future Full Montage charting windows will have the same charting structure or format. Chart Only: Checking this box will maximize the chart to fill the entire window and hiding all other panes. Unchecking this box will restore the window back to its default view. Drawing Tools: These icons will allow you to apply trend, vertical, horizontal and Fibonacci lines to your chart. The remaining icons will delete the last drawing and all drawings.
f
f
g
g
h
h
Decision Support
Prepared by William Cheung for EquityFeed Corp. Copyright©2013
82
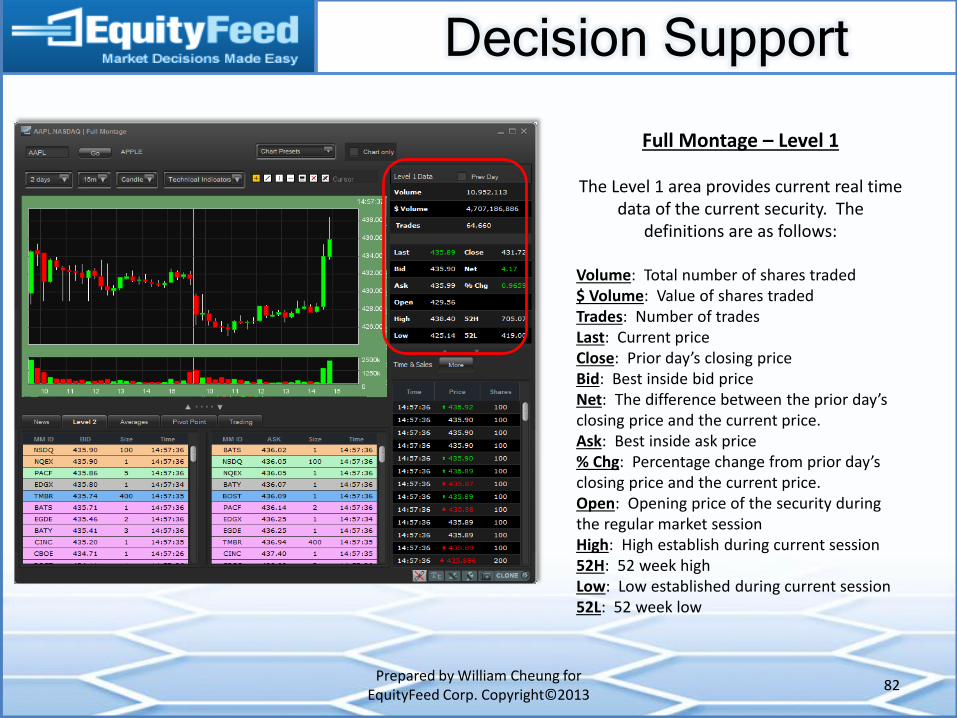
Full Montage – Level 1
The Level 1 area provides current real time data of the current security. The
definitions are as follows:
Volume: Total number of shares traded $ Volume: Value of shares traded Trades: Number of trades Last: Current price Close: Prior day’s closing price Bid: Best inside bid price Net: The difference between the prior day’s closing price and the current price. Ask: Best inside ask price % Chg: Percentage change from prior day’s closing price and the current price. Open: Opening price of the security during the regular market session High: High establish during current session 52H: 52 week high Low: Low established during current session 52L: 52 week low
Decision Support
Prepared by William Cheung for EquityFeed Corp. Copyright©2013
83
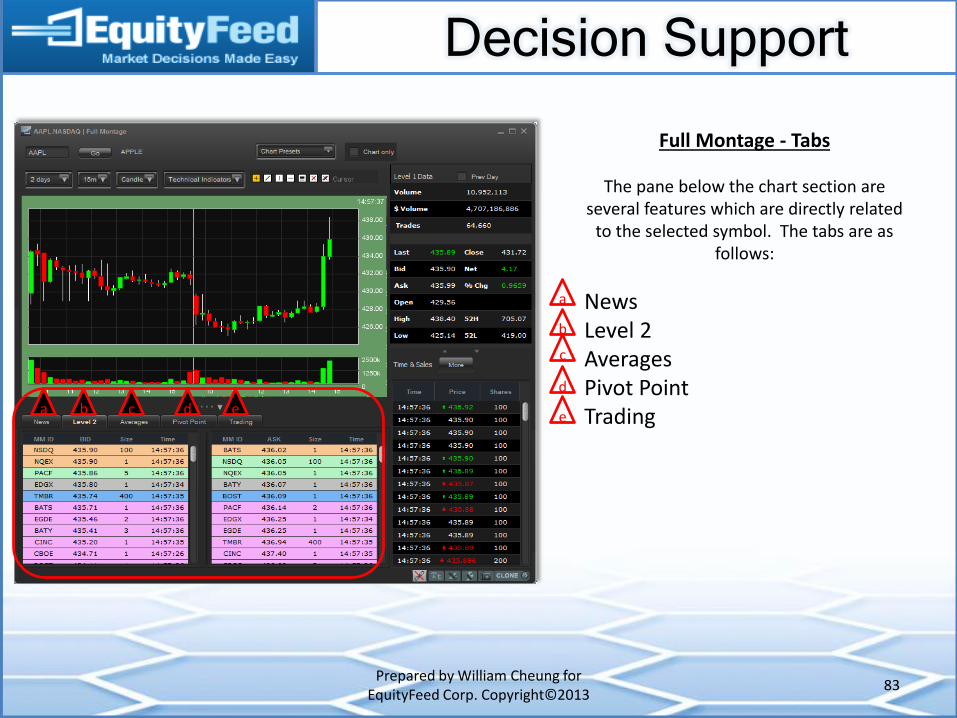
Full Montage - Tabs
The pane below the chart section are several features which are directly related
to the selected symbol. The tabs are as follows:
News Level 2 Averages Pivot Point Trading
a
a
b
b
c
c d
d
e e
Decision Support
Prepared by William Cheung for EquityFeed Corp. Copyright©2013
84
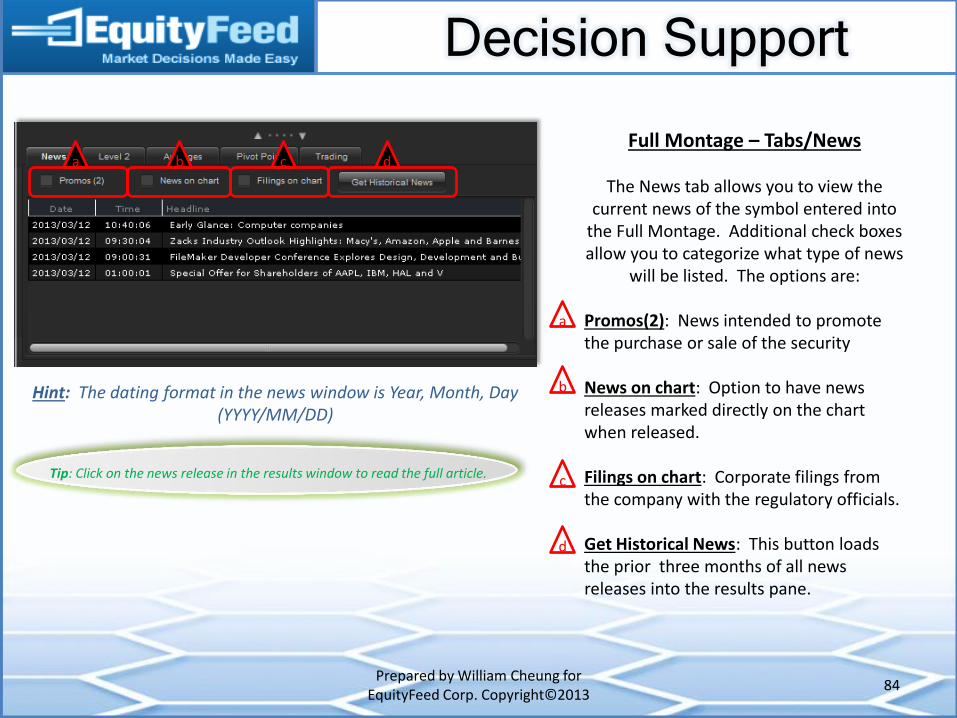
Full Montage – Tabs/News
The News tab allows you to view the current news of the symbol entered into
the Full Montage. Additional check boxes allow you to categorize what type of news
will be listed. The options are:
Promos(2): News intended to promote the purchase or sale of the security News on chart: Option to have news releases marked directly on the chart when released. Filings on chart: Corporate filings from the company with the regulatory officials. Get Historical News: This button loads the prior three months of all news releases into the results pane.
a
a
b
b
c
c d
d
Hint: The dating format in the news window is Year, Month, Day (YYYY/MM/DD)
Tip: Click on the news release in the results window to read the full article.

Decision Support
Prepared by William Cheung for EquityFeed Corp. Copyright©2013
85
Full Montage – Tabs/News
The News on Chart and Filings on Chart, if selected will be marked on the chart with
small yellow circles at the time of its release. Placing the pointer on these
yellow circles will open a preview pane of the news release.
Notice the yellow circle on the side of the chart which notates news which occurred
during pre/post market session.
*This feature is best viewed on a Line chart.
Tip: Windows with this feature, allow for the resizing of panes. Simply drag and drop as required.
Decision Support
Prepared by William Cheung for EquityFeed Corp. Copyright©2013
86
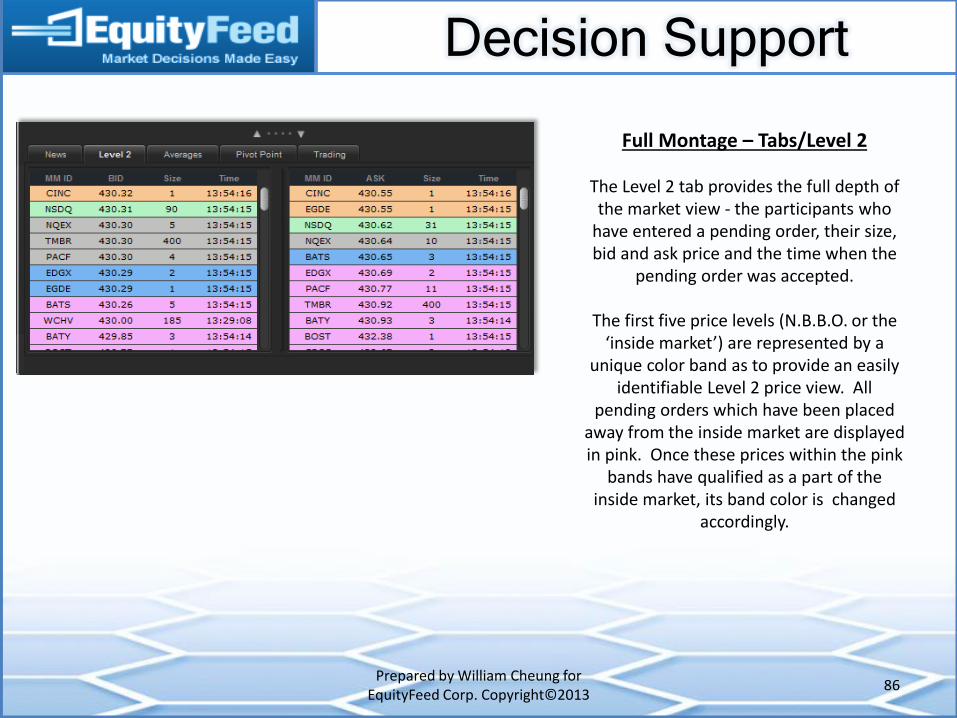
Full Montage – Tabs/Level 2
The Level 2 tab provides the full depth of the market view - the participants who
have entered a pending order, their size, bid and ask price and the time when the
pending order was accepted.
The first five price levels (N.B.B.O. or the ‘inside market’) are represented by a
unique color band as to provide an easily identifiable Level 2 price view. All
pending orders which have been placed away from the inside market are displayed in pink. Once these prices within the pink
bands have qualified as a part of the inside market, its band color is changed
accordingly.
Decision Support
Prepared by William Cheung for EquityFeed Corp. Copyright©2013
87
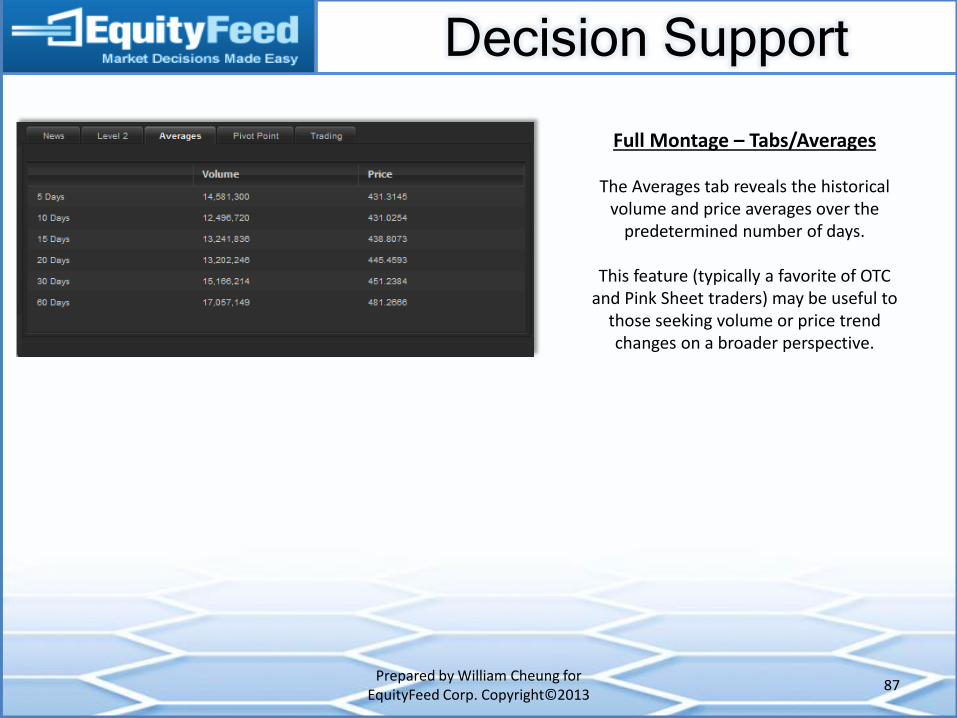
Full Montage – Tabs/Averages
The Averages tab reveals the historical volume and price averages over the
predetermined number of days.
This feature (typically a favorite of OTC and Pink Sheet traders) may be useful to
those seeking volume or price trend changes on a broader perspective.
Decision Support
Prepared by William Cheung for EquityFeed Corp. Copyright©2013
88
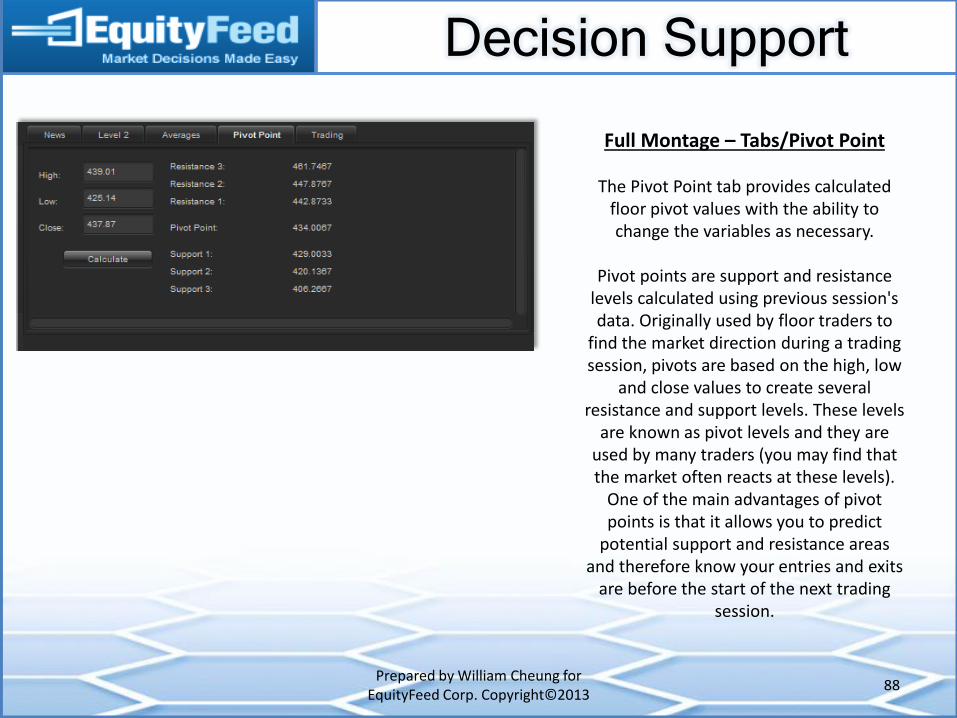
Full Montage – Tabs/Pivot Point
The Pivot Point tab provides calculated floor pivot values with the ability to change the variables as necessary.
Pivot points are support and resistance
levels calculated using previous session's data. Originally used by floor traders to
find the market direction during a trading session, pivots are based on the high, low
and close values to create several resistance and support levels. These levels
are known as pivot levels and they are used by many traders (you may find that the market often reacts at these levels).
One of the main advantages of pivot points is that it allows you to predict
potential support and resistance areas and therefore know your entries and exits
are before the start of the next trading session.

Decision Support
Prepared by William Cheung for EquityFeed Corp. Copyright©2013
89
Full Montage – Tabs/Trading
The Trading tab allows for users to conveniently trade directly from the
EquityFeed platform* as opposed to their broker’s platform. In this tab, the various
fields are as follows:
Action: Buy, Sell, Buy to Cover, Sell Short. Qty: The amount of share to execute. Type: Market, Limit, Stop Market, Stop Limit, Trailing Stop %, Trailing Stop $. Time in Force: GTC- Good Till Canceled, Day + Extended, GTC+ Extended. Confirm Order: Sends order to exchange.
a b c
d
e
a
b
c
d
*Please see section Integrated Trading > Trade Connect for a list of brokerage accounts which can be linked to the EquityFeed platform.
More brokerages will be added soon.
e
Decision Support
Prepared by William Cheung for EquityFeed Corp. Copyright©2013
90
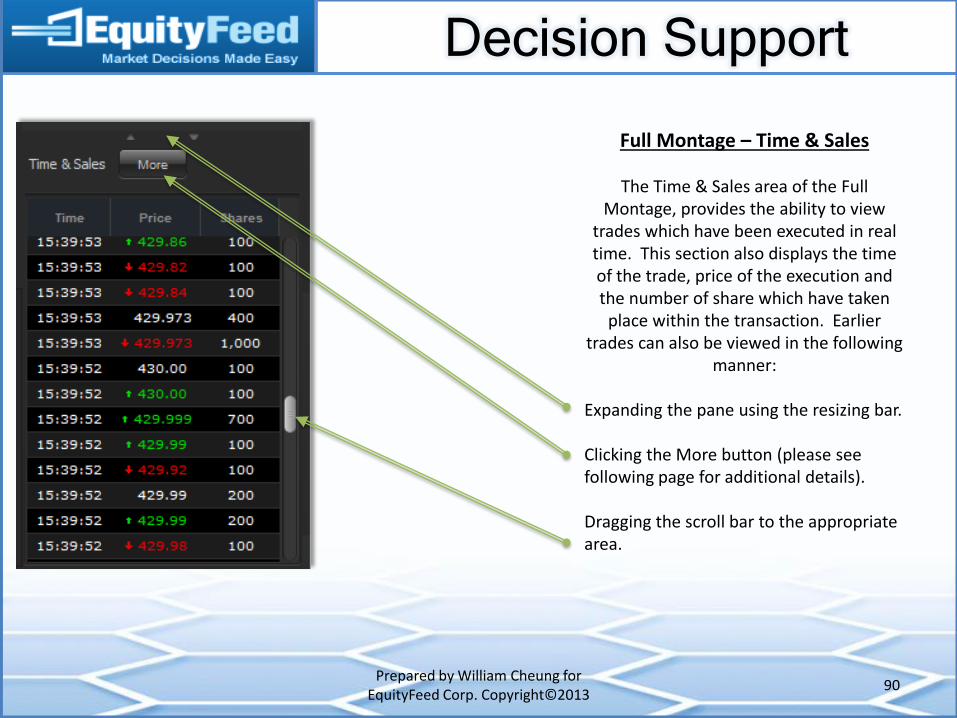
Full Montage – Time & Sales
The Time & Sales area of the Full Montage, provides the ability to view
trades which have been executed in real time. This section also displays the time of the trade, price of the execution and the number of share which have taken
place within the transaction. Earlier trades can also be viewed in the following
manner:
Expanding the pane using the resizing bar. Clicking the More button (please see following page for additional details). Dragging the scroll bar to the appropriate area.
Decision Support
Prepared by William Cheung for EquityFeed Corp. Copyright©2013
91
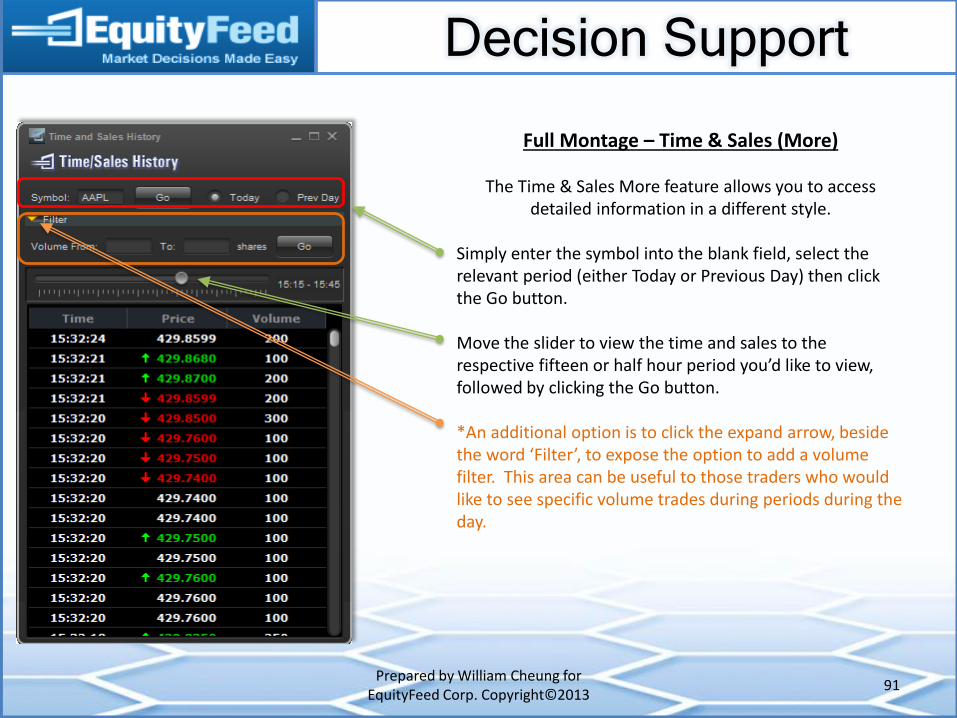
Full Montage – Time & Sales (More)
The Time & Sales More feature allows you to access detailed information in a different style.
Simply enter the symbol into the blank field, select the relevant period (either Today or Previous Day) then click the Go button.
Move the slider to view the time and sales to the respective fifteen or half hour period you’d like to view, followed by clicking the Go button. *An additional option is to click the expand arrow, beside the word ‘Filter’, to expose the option to add a volume filter. This area can be useful to those traders who would like to see specific volume trades during periods during the day.
Decision Support
Prepared by William Cheung for EquityFeed Corp. Copyright©2013
92
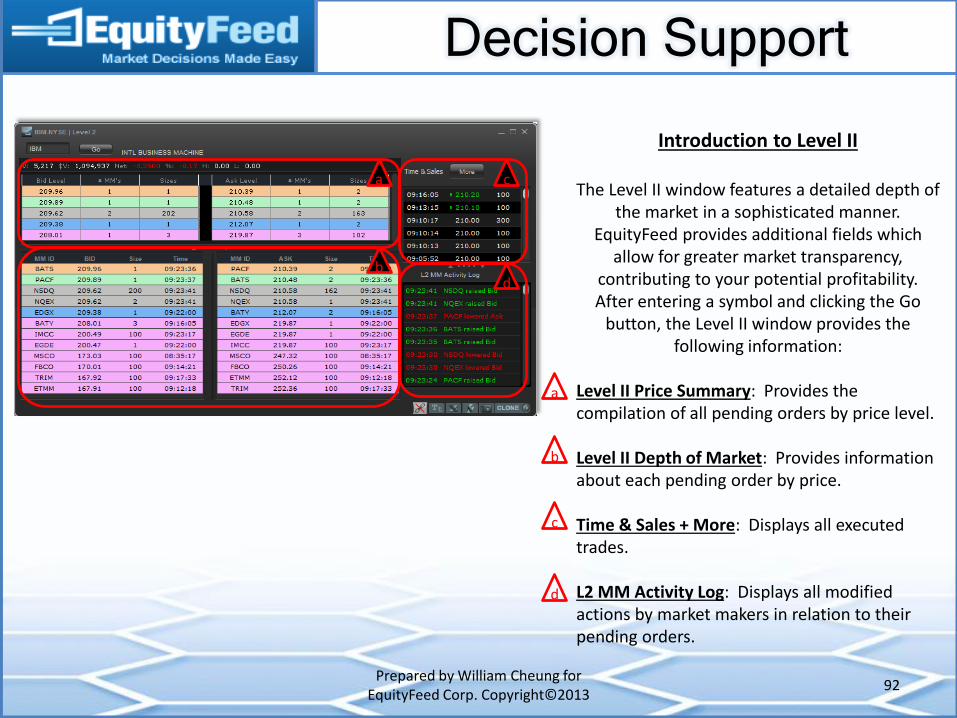
Introduction to Level II
The Level II window features a detailed depth of the market in a sophisticated manner.
EquityFeed provides additional fields which allow for greater market transparency,
contributing to your potential profitability. After entering a symbol and clicking the Go
button, the Level II window provides the following information:
Level II Price Summary: Provides the compilation of all pending orders by price level. Level II Depth of Market: Provides information about each pending order by price. Time & Sales + More: Displays all executed trades. L2 MM Activity Log: Displays all modified actions by market makers in relation to their pending orders.
a
b
c
d
a
b
c
d
Decision Support
Prepared by William Cheung for EquityFeed Corp. Copyright©2013
93
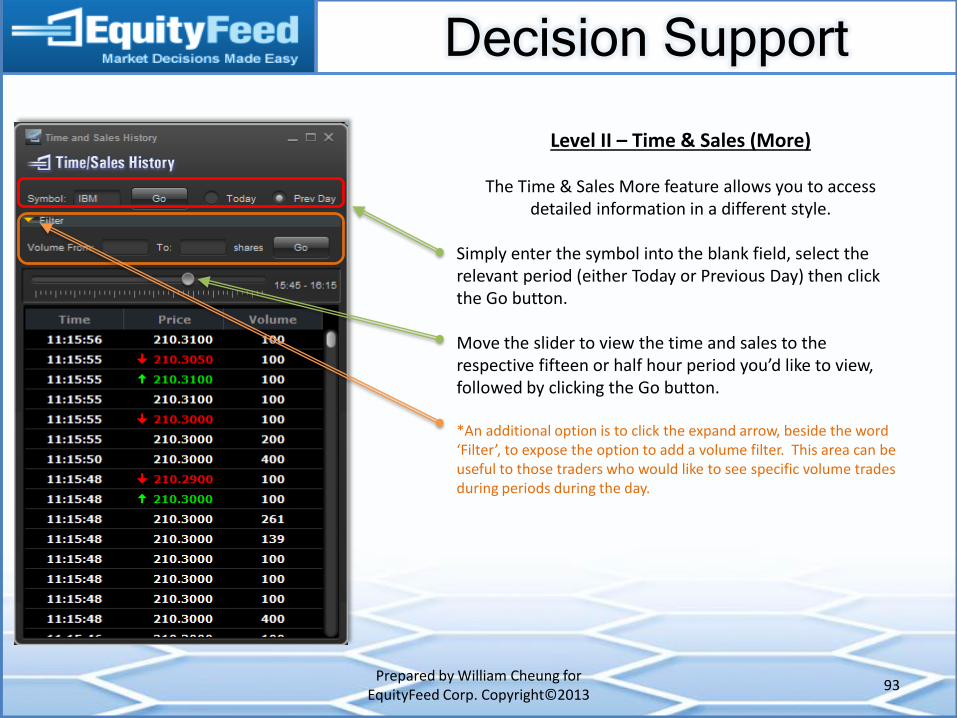
Level II – Time & Sales (More)
The Time & Sales More feature allows you to access detailed information in a different style.
Simply enter the symbol into the blank field, select the relevant period (either Today or Previous Day) then click the Go button.
Move the slider to view the time and sales to the respective fifteen or half hour period you’d like to view, followed by clicking the Go button. *An additional option is to click the expand arrow, beside the word ‘Filter’, to expose the option to add a volume filter. This area can be useful to those traders who would like to see specific volume trades during periods during the day.
Decision Support
Prepared by William Cheung for EquityFeed Corp. Copyright©2013
94
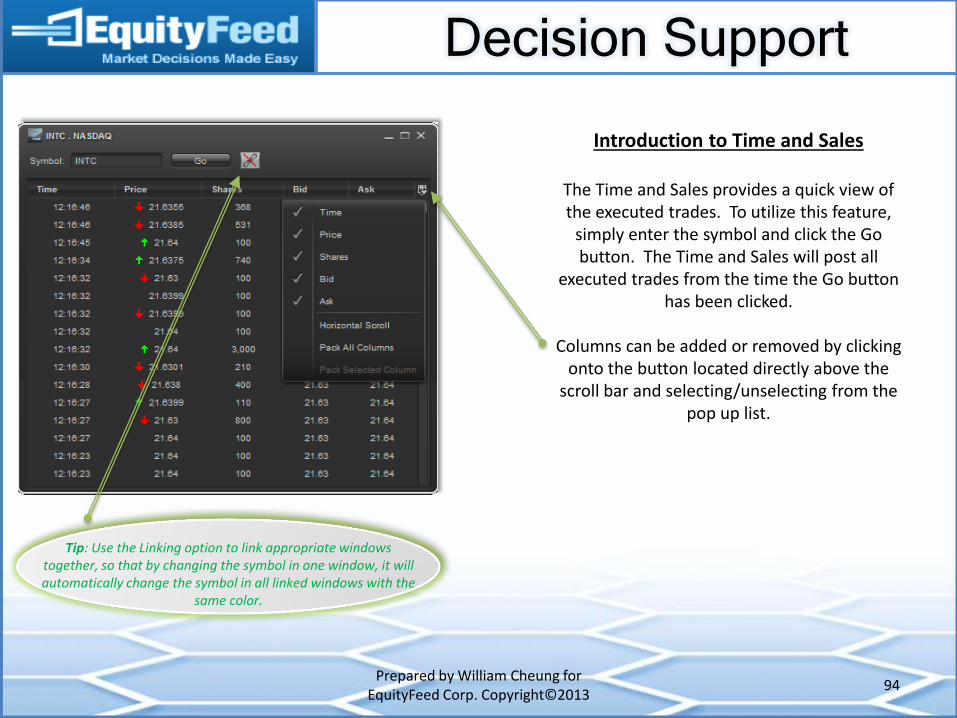
Introduction to Time and Sales
The Time and Sales provides a quick view of the executed trades. To utilize this feature,
simply enter the symbol and click the Go button. The Time and Sales will post all
executed trades from the time the Go button has been clicked.
Columns can be added or removed by clicking
onto the button located directly above the scroll bar and selecting/unselecting from the
pop up list.
Tip: Use the Linking option to link appropriate windows together, so that by changing the symbol in one window, it will automatically change the symbol in all linked windows with the
same color.
Decision Support
Prepared by William Cheung for EquityFeed Corp. Copyright©2013
95
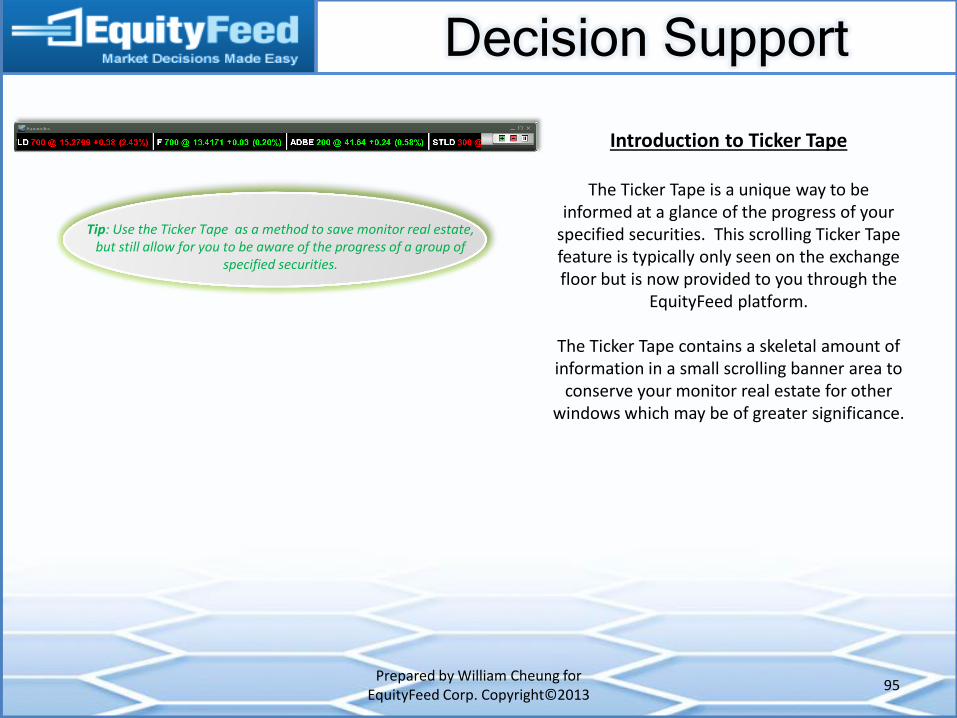
Introduction to Ticker Tape
The Ticker Tape is a unique way to be informed at a glance of the progress of your
specified securities. This scrolling Ticker Tape feature is typically only seen on the exchange floor but is now provided to you through the
EquityFeed platform.
The Ticker Tape contains a skeletal amount of information in a small scrolling banner area to
conserve your monitor real estate for other windows which may be of greater significance.
Tip: Use the Ticker Tape as a method to save monitor real estate, but still allow for you to be aware of the progress of a group of
specified securities.
Decision Support
Prepared by William Cheung for EquityFeed Corp. Copyright©2013
96
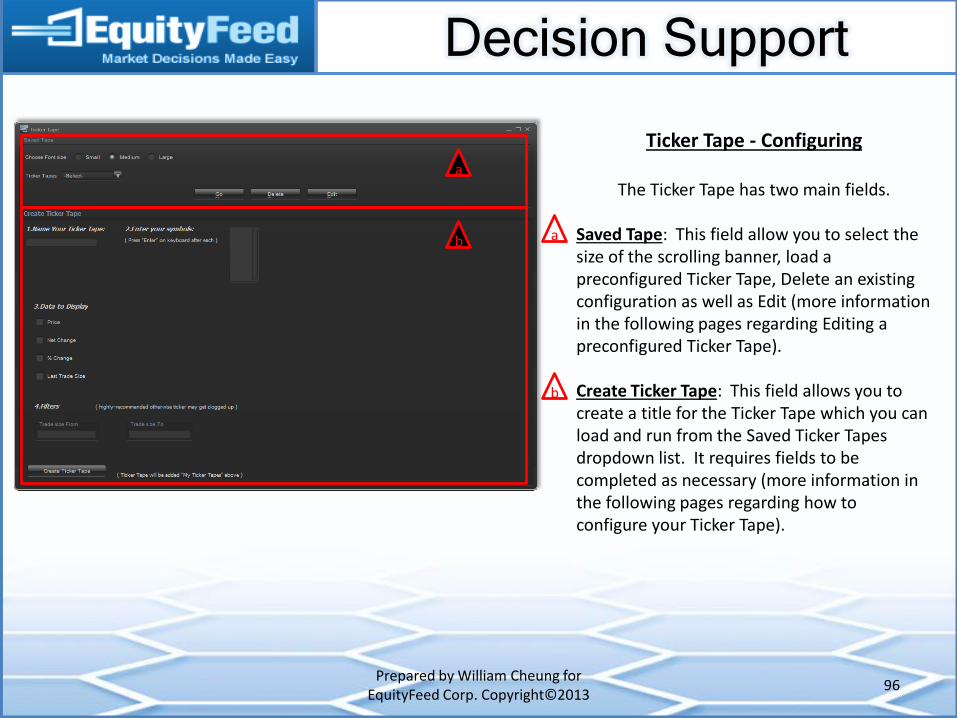
Ticker Tape - Configuring
The Ticker Tape has two main fields.
Saved Tape: This field allow you to select the size of the scrolling banner, load a preconfigured Ticker Tape, Delete an existing configuration as well as Edit (more information in the following pages regarding Editing a preconfigured Ticker Tape). Create Ticker Tape: This field allows you to create a title for the Ticker Tape which you can load and run from the Saved Ticker Tapes dropdown list. It requires fields to be completed as necessary (more information in the following pages regarding how to configure your Ticker Tape).
a
b a
b
Decision Support
Prepared by William Cheung for EquityFeed Corp. Copyright©2013
97
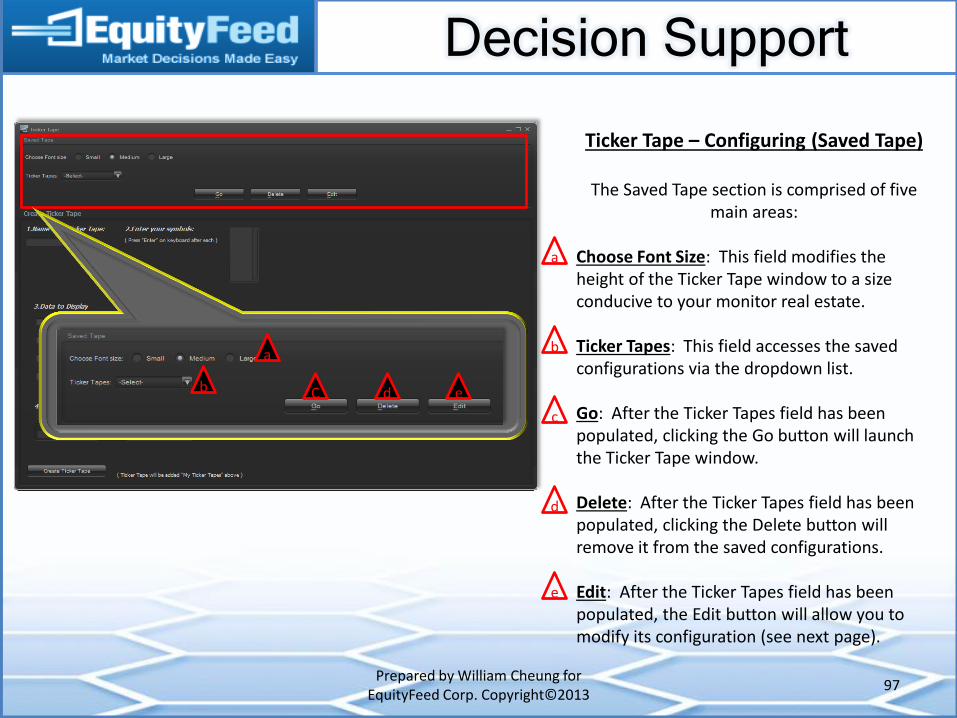
Ticker Tape – Configuring (Saved Tape)
The Saved Tape section is comprised of five main areas:
Choose Font Size: This field modifies the height of the Ticker Tape window to a size conducive to your monitor real estate. Ticker Tapes: This field accesses the saved configurations via the dropdown list. Go: After the Ticker Tapes field has been populated, clicking the Go button will launch the Ticker Tape window. Delete: After the Ticker Tapes field has been populated, clicking the Delete button will remove it from the saved configurations. Edit: After the Ticker Tapes field has been populated, the Edit button will allow you to modify its configuration (see next page).
a
b a
b C d e
c
d
e
Decision Support
Prepared by William Cheung for EquityFeed Corp. Copyright©2013
98
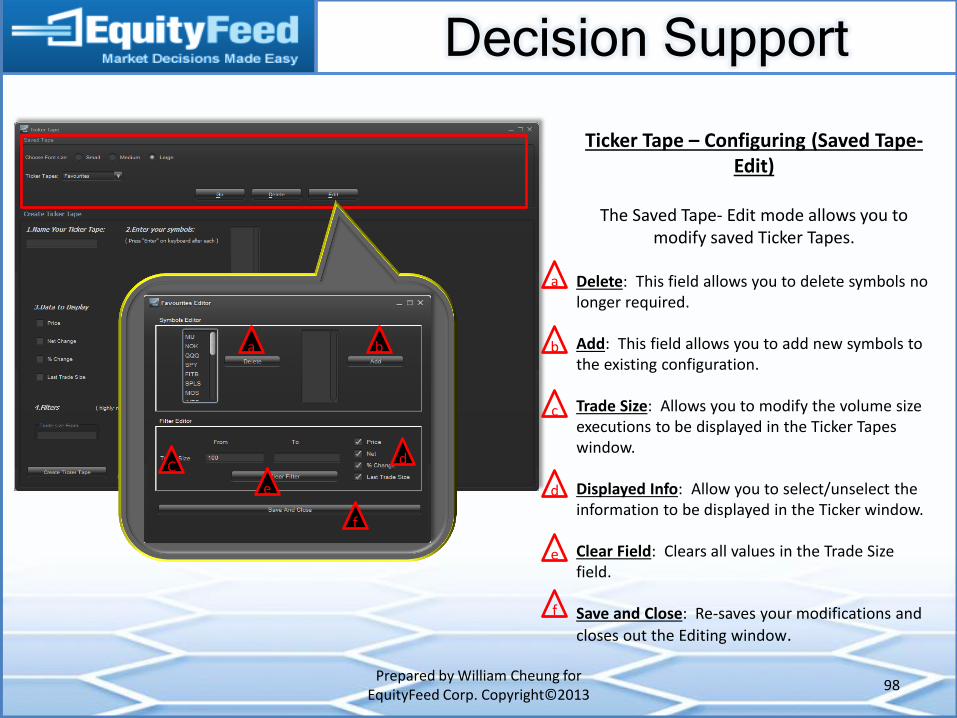
Ticker Tape – Configuring (Saved Tape- Edit)
The Saved Tape- Edit mode allows you to
modify saved Ticker Tapes.
Delete: This field allows you to delete symbols no longer required. Add: This field allows you to add new symbols to the existing configuration. Trade Size: Allows you to modify the volume size executions to be displayed in the Ticker Tapes window. Displayed Info: Allow you to select/unselect the information to be displayed in the Ticker window. Clear Field: Clears all values in the Trade Size field. Save and Close: Re-saves your modifications and
closes out the Editing window.
a
b
c
d
e
b a
C d
e
f
f
Decision Support
Prepared by William Cheung for EquityFeed Corp. Copyright©2013
99
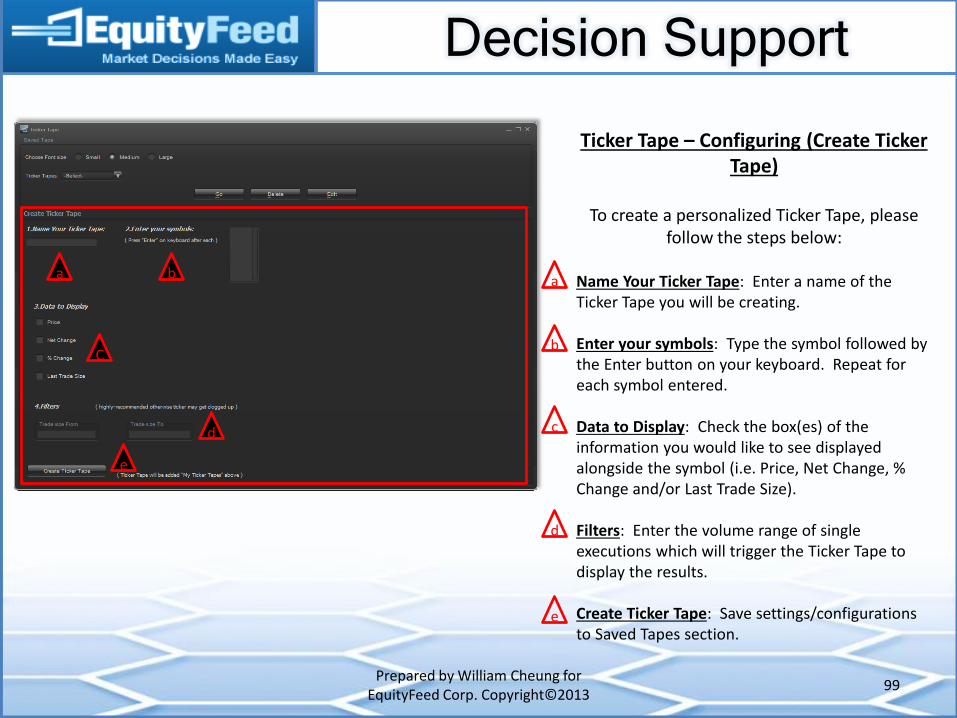
Ticker Tape – Configuring (Create Ticker Tape)
To create a personalized Ticker Tape, please
follow the steps below:
Name Your Ticker Tape: Enter a name of the Ticker Tape you will be creating. Enter your symbols: Type the symbol followed by the Enter button on your keyboard. Repeat for each symbol entered. Data to Display: Check the box(es) of the information you would like to see displayed alongside the symbol (i.e. Price, Net Change, % Change and/or Last Trade Size). Filters: Enter the volume range of single executions which will trigger the Ticker Tape to display the results. Create Ticker Tape: Save settings/configurations to Saved Tapes section.
a b a
b C
d
e
e
d
c
Section Focus
Prepared by William Cheung for EquityFeed Corp. Copyright©2013
100
Launch Pad
Feed Views
Filters and Alerts
Decision Support
Charting
News and Filings
Integrated Trading
Watch Lists
Layouts
Sub-Menu
Login
Additional Tools
Traders and Their Tools
Additional Information
Charting
Prepared by William Cheung for EquityFeed Corp. Copyright©2013
101
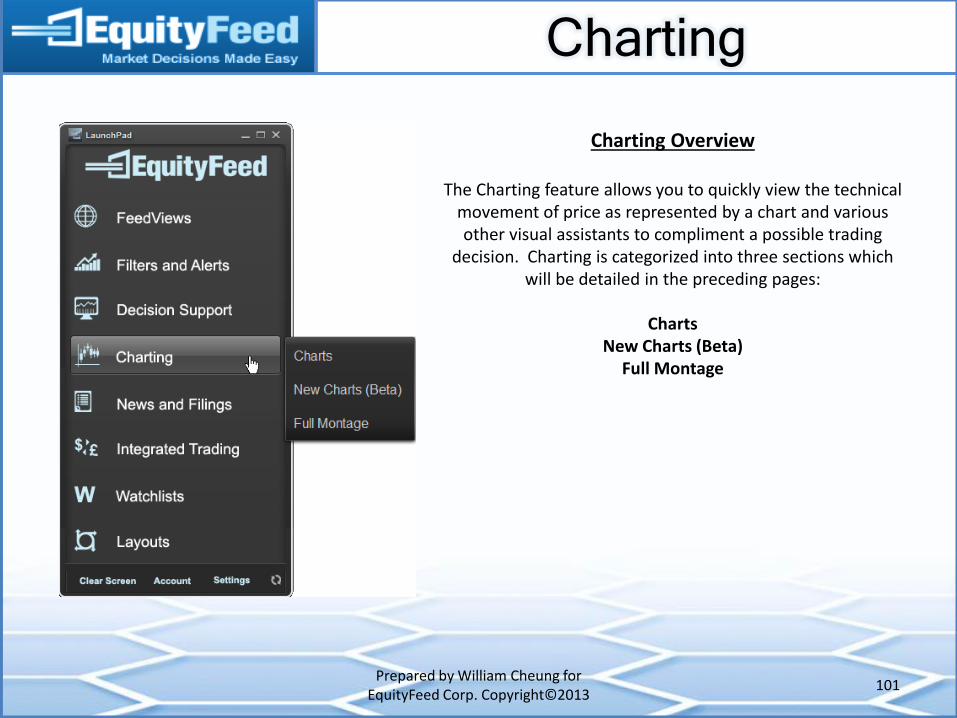
Charting Overview
The Charting feature allows you to quickly view the technical movement of price as represented by a chart and various other visual assistants to compliment a possible trading
decision. Charting is categorized into three sections which will be detailed in the preceding pages:
Charts
New Charts (Beta) Full Montage
Charting
Prepared by William Cheung for EquityFeed Corp. Copyright©2013
102
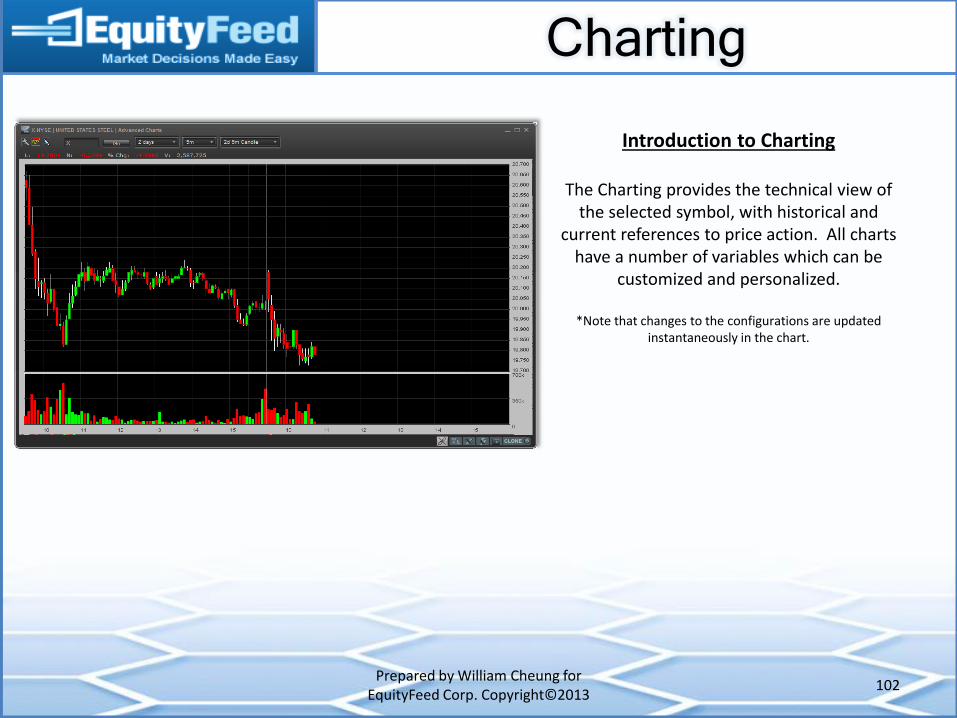
Introduction to Charting
The Charting provides the technical view of the selected symbol, with historical and
current references to price action. All charts have a number of variables which can be
customized and personalized.
*Note that changes to the configurations are updated instantaneously in the chart.
Charting
Prepared by William Cheung for EquityFeed Corp. Copyright©2013
103
Charting - Charts
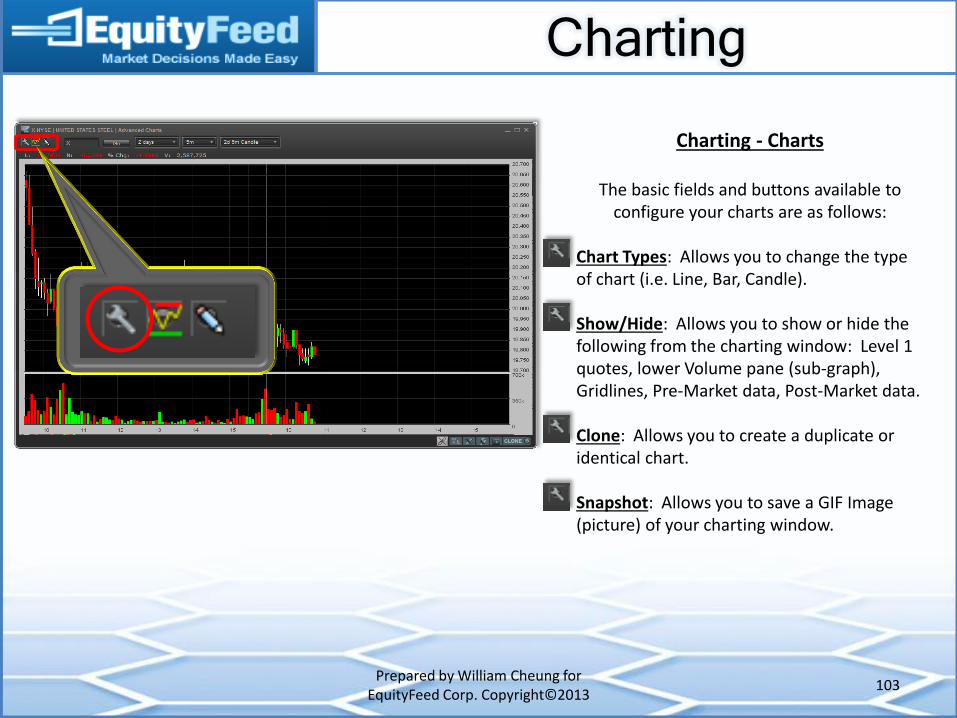
The basic fields and buttons available to configure your charts are as follows:
Chart Types: Allows you to change the type of chart (i.e. Line, Bar, Candle). Show/Hide: Allows you to show or hide the following from the charting window: Level 1 quotes, lower Volume pane (sub-graph), Gridlines, Pre-Market data, Post-Market data. Clone: Allows you to create a duplicate or identical chart. Snapshot: Allows you to save a GIF Image (picture) of your charting window.
Charting
Prepared by William Cheung for EquityFeed Corp. Copyright©2013
104
Charting - Charts
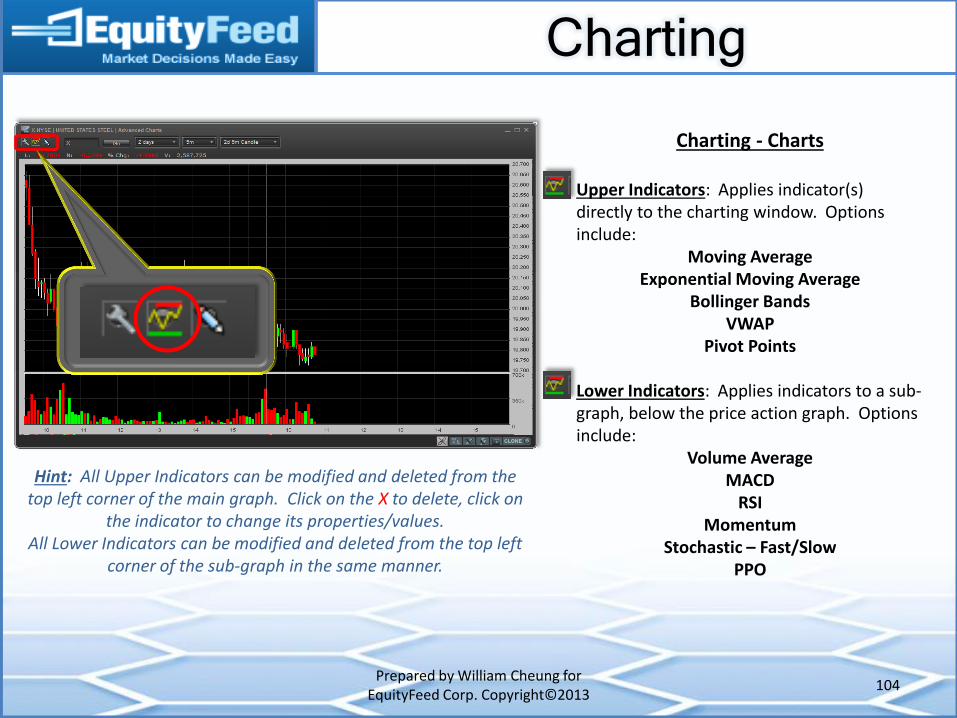
Upper Indicators: Applies indicator(s) directly to the charting window. Options include:
Moving Average Exponential Moving Average
Bollinger Bands VWAP
Pivot Points Lower Indicators: Applies indicators to a sub-graph, below the price action graph. Options include:
Volume Average MACD
RSI Momentum
Stochastic – Fast/Slow PPO
Hint: All Upper Indicators can be modified and deleted from the top left corner of the main graph. Click on the X to delete, click on
the indicator to change its properties/values. All Lower Indicators can be modified and deleted from the top left
corner of the sub-graph in the same manner.
Charting
Prepared by William Cheung for EquityFeed Corp. Copyright©2013
105
Charting - Charts
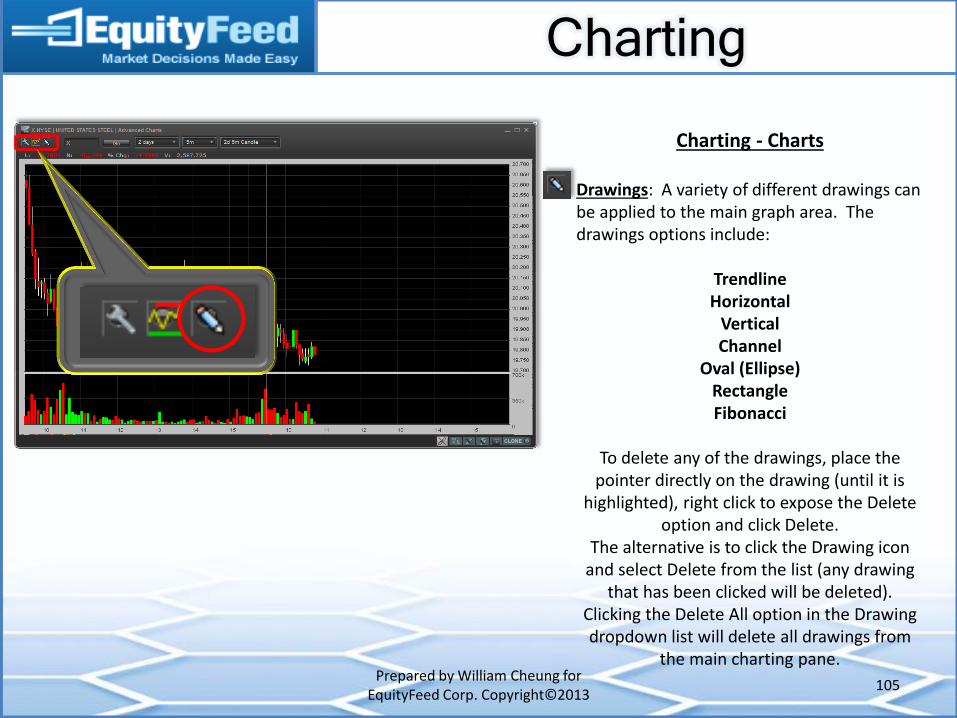
Drawings: A variety of different drawings can be applied to the main graph area. The drawings options include:
Trendline Horizontal
Vertical Channel
Oval (Ellipse) Rectangle Fibonacci
To delete any of the drawings, place the
pointer directly on the drawing (until it is highlighted), right click to expose the Delete
option and click Delete. The alternative is to click the Drawing icon
and select Delete from the list (any drawing that has been clicked will be deleted).
Clicking the Delete All option in the Drawing dropdown list will delete all drawings from
the main charting pane.
Charting
Prepared by William Cheung for EquityFeed Corp. Copyright©2013
106
Charting - Charts
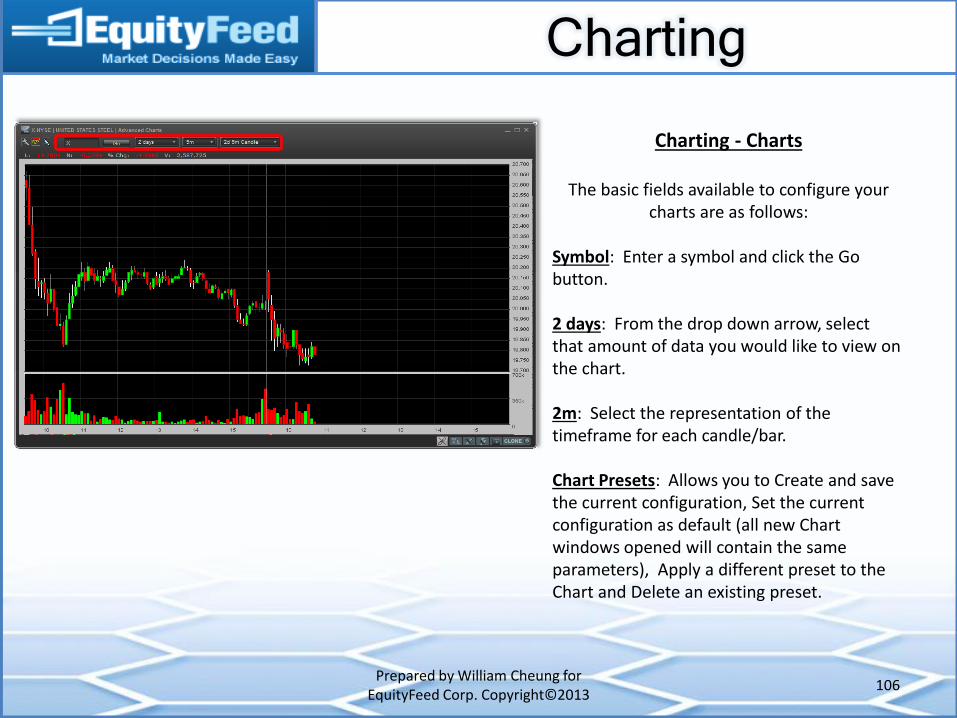
The basic fields available to configure your charts are as follows:
Symbol: Enter a symbol and click the Go button. 2 days: From the drop down arrow, select that amount of data you would like to view on the chart. 2m: Select the representation of the timeframe for each candle/bar. Chart Presets: Allows you to Create and save the current configuration, Set the current configuration as default (all new Chart windows opened will contain the same parameters), Apply a different preset to the Chart and Delete an existing preset.
Charting
Prepared by William Cheung for EquityFeed Corp. Copyright©2013
107
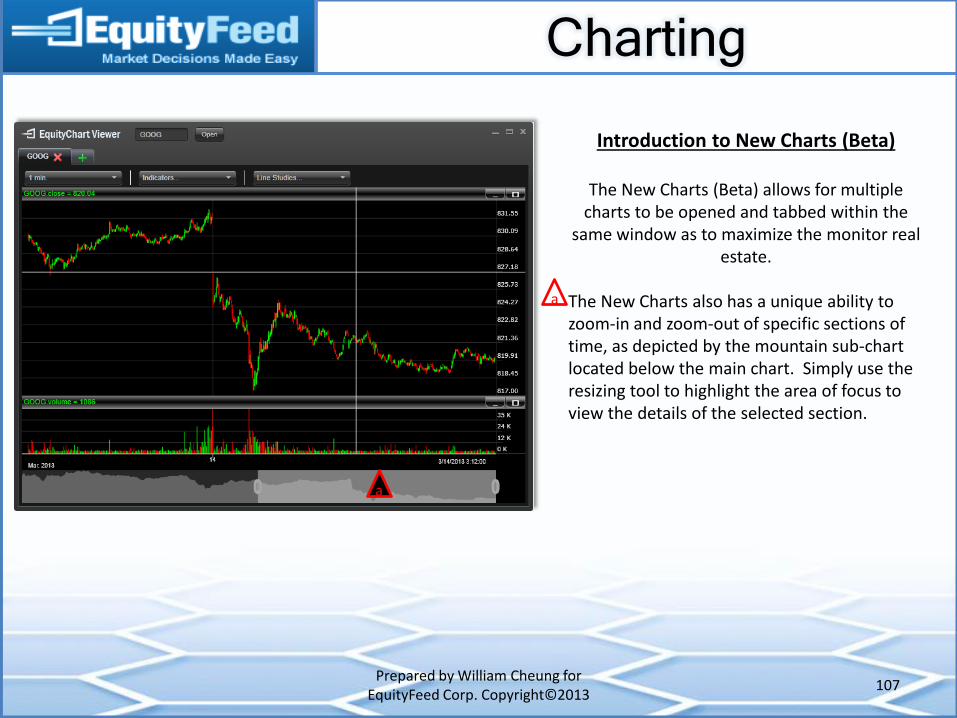
Introduction to New Charts (Beta)
The New Charts (Beta) allows for multiple charts to be opened and tabbed within the
same window as to maximize the monitor real estate.
The New Charts also has a unique ability to zoom-in and zoom-out of specific sections of time, as depicted by the mountain sub-chart located below the main chart. Simply use the resizing tool to highlight the area of focus to view the details of the selected section.
a
a
Charting
Prepared by William Cheung for EquityFeed Corp. Copyright©2013
108
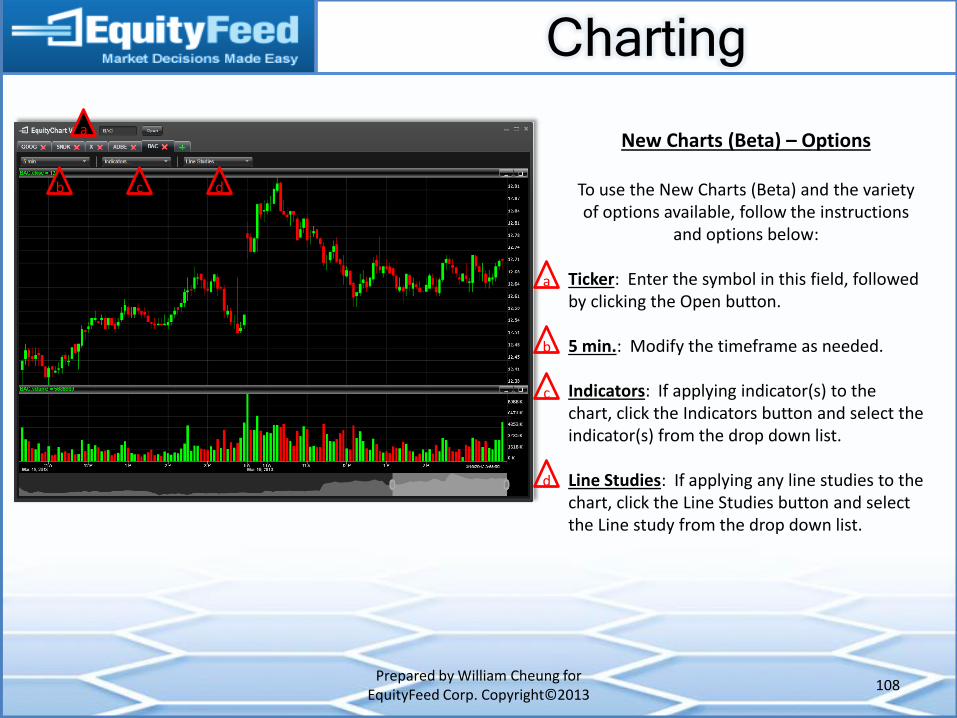
New Charts (Beta) – Options
To use the New Charts (Beta) and the variety of options available, follow the instructions
and options below:
Ticker: Enter the symbol in this field, followed by clicking the Open button. 5 min.: Modify the timeframe as needed. Indicators: If applying indicator(s) to the chart, click the Indicators button and select the indicator(s) from the drop down list. Line Studies: If applying any line studies to the chart, click the Line Studies button and select the Line study from the drop down list.
a
a
b c d
b
c
d
Charting
Prepared by William Cheung for EquityFeed Corp. Copyright©2013
109
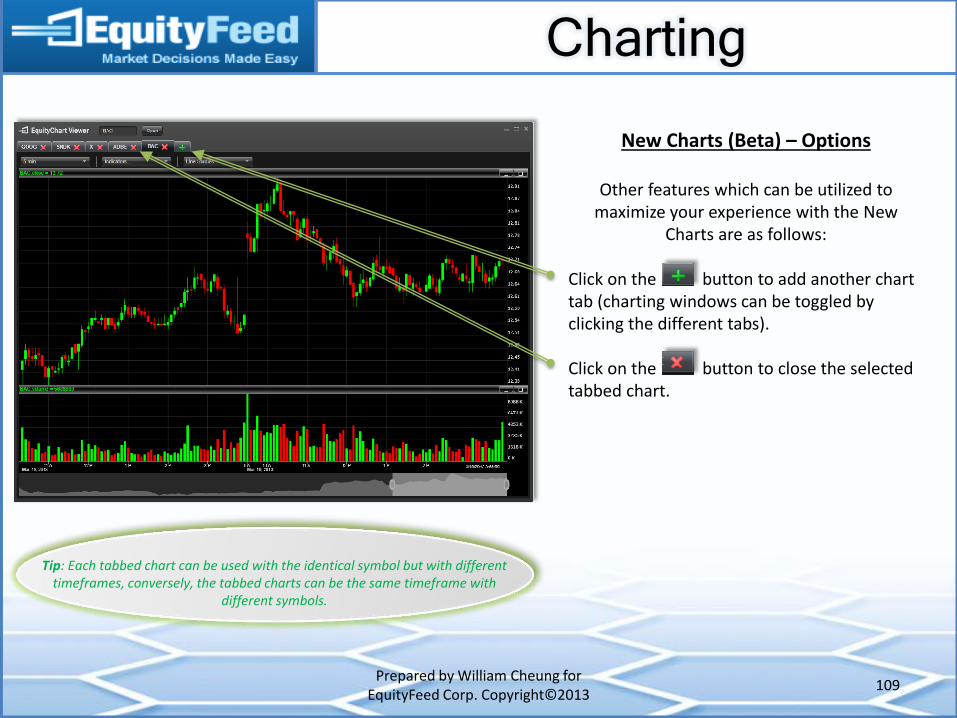
New Charts (Beta) – Options
Other features which can be utilized to maximize your experience with the New
Charts are as follows:
Click on the button to add another chart tab (charting windows can be toggled by clicking the different tabs). Click on the button to close the selected tabbed chart.
Tip: Each tabbed chart can be used with the identical symbol but with different timeframes, conversely, the tabbed charts can be the same timeframe with
different symbols.

Charting
Prepared by William Cheung for EquityFeed Corp. Copyright©2013
110
New Charts (Beta) - Indicators
After selecting an indicator to apply to the tabbed chart, a pop-up window will appear so
that the parameters can be customized.
Adjust the values/parameters to preference followed by clicking the OK button.
Charting
Prepared by William Cheung for EquityFeed Corp. Copyright©2013
111
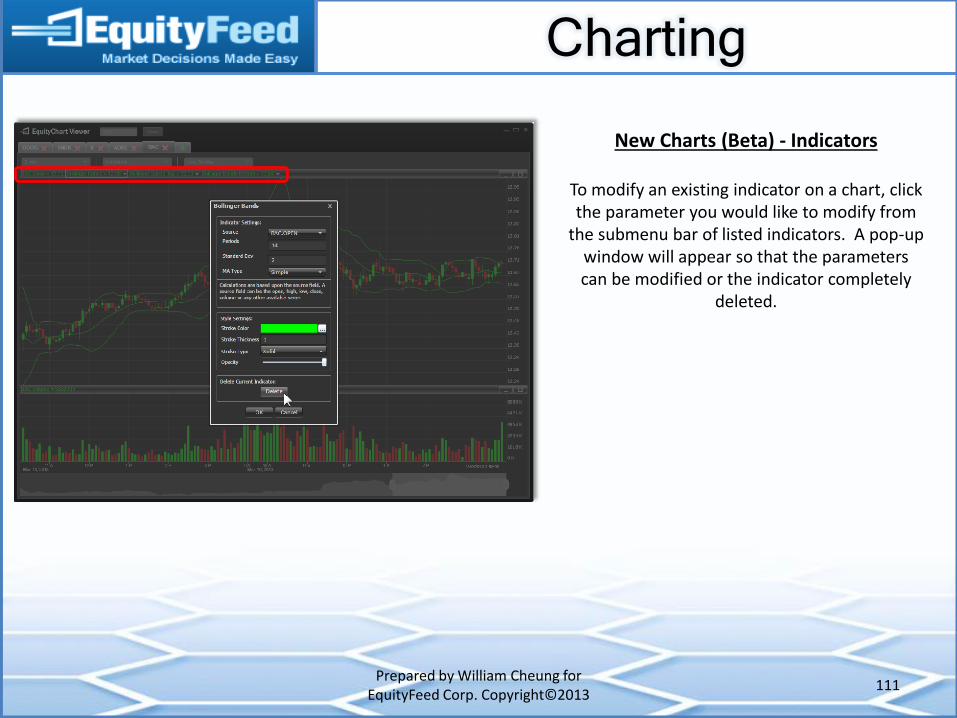
New Charts (Beta) - Indicators
To modify an existing indicator on a chart, click the parameter you would like to modify from
the submenu bar of listed indicators. A pop-up window will appear so that the parameters can be modified or the indicator completely
deleted.
Charting
Prepared by William Cheung for EquityFeed Corp. Copyright©2013
112
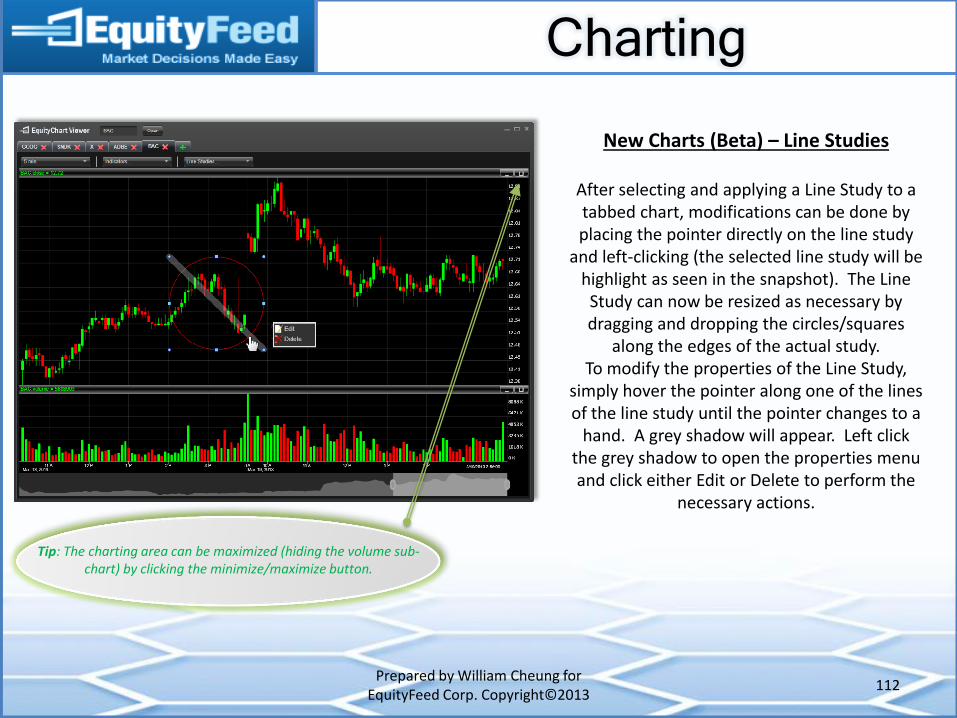
New Charts (Beta) – Line Studies
After selecting and applying a Line Study to a tabbed chart, modifications can be done by placing the pointer directly on the line study
and left-clicking (the selected line study will be highlight as seen in the snapshot). The Line
Study can now be resized as necessary by dragging and dropping the circles/squares
along the edges of the actual study. To modify the properties of the Line Study,
simply hover the pointer along one of the lines of the line study until the pointer changes to a
hand. A grey shadow will appear. Left click the grey shadow to open the properties menu and click either Edit or Delete to perform the
necessary actions.
Tip: The charting area can be maximized (hiding the volume sub-chart) by clicking the minimize/maximize button.
Charting
Prepared by William Cheung for EquityFeed Corp. Copyright©2013
113
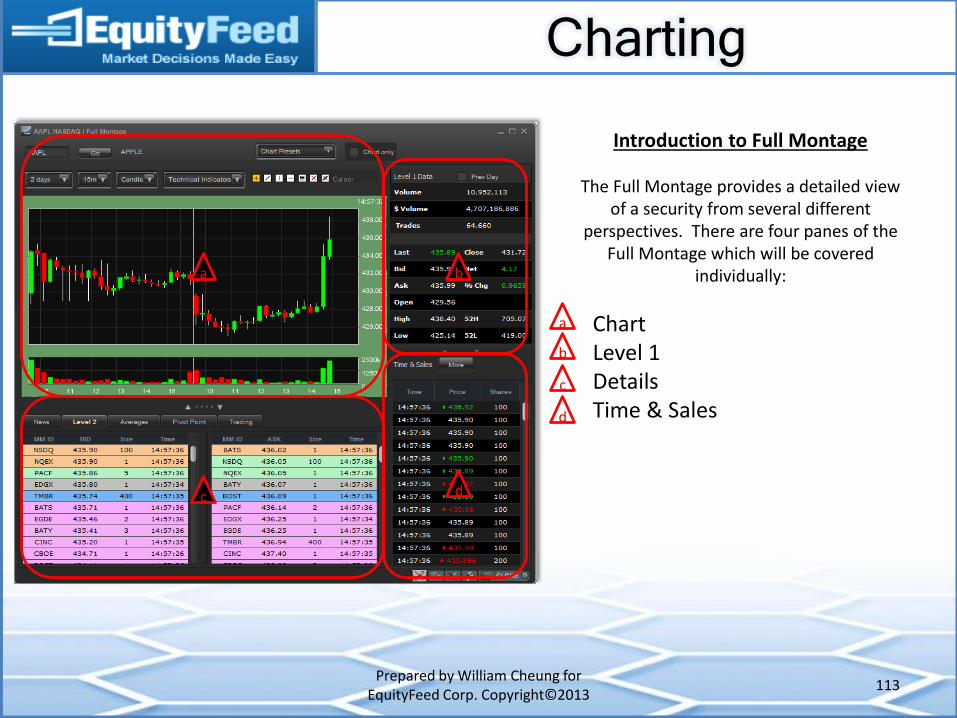
Introduction to Full Montage
The Full Montage provides a detailed view of a security from several different
perspectives. There are four panes of the Full Montage which will be covered
individually:
Chart Level 1 Details Time & Sales
a
a
b
b
c
c d
d
Charting
Prepared by William Cheung for EquityFeed Corp. Copyright©2013
114
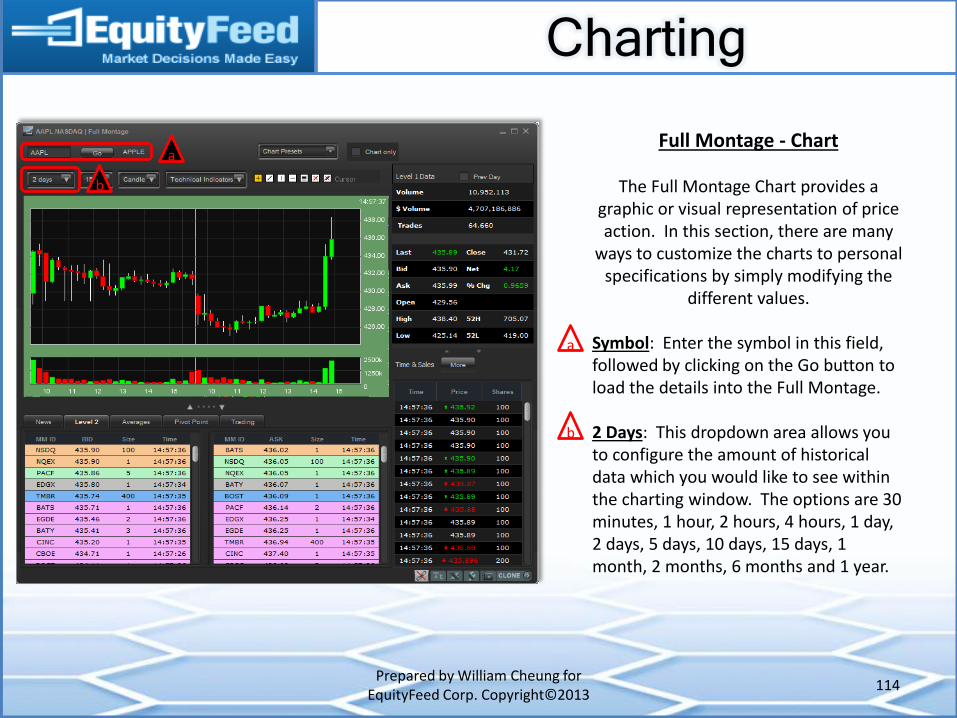
Full Montage - Chart
The Full Montage Chart provides a graphic or visual representation of price action. In this section, there are many
ways to customize the charts to personal specifications by simply modifying the
different values.
Symbol: Enter the symbol in this field, followed by clicking on the Go button to load the details into the Full Montage. 2 Days: This dropdown area allows you to configure the amount of historical data which you would like to see within the charting window. The options are 30 minutes, 1 hour, 2 hours, 4 hours, 1 day, 2 days, 5 days, 10 days, 15 days, 1 month, 2 months, 6 months and 1 year.
a
a
b
b
Charting
Prepared by William Cheung for EquityFeed Corp. Copyright©2013
115
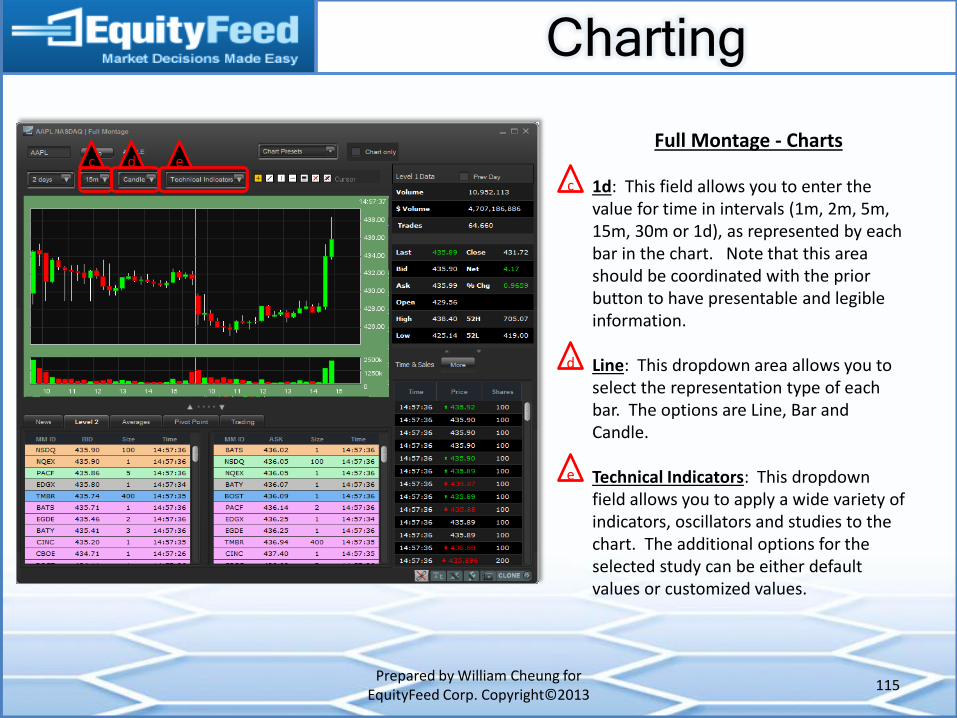
Full Montage - Charts
1d: This field allows you to enter the value for time in intervals (1m, 2m, 5m, 15m, 30m or 1d), as represented by each bar in the chart. Note that this area should be coordinated with the prior button to have presentable and legible information. Line: This dropdown area allows you to select the representation type of each bar. The options are Line, Bar and Candle. Technical Indicators: This dropdown field allows you to apply a wide variety of indicators, oscillators and studies to the chart. The additional options for the selected study can be either default values or customized values.
c
c
d
d
e
e
Charting
Prepared by William Cheung for EquityFeed Corp. Copyright©2013
116
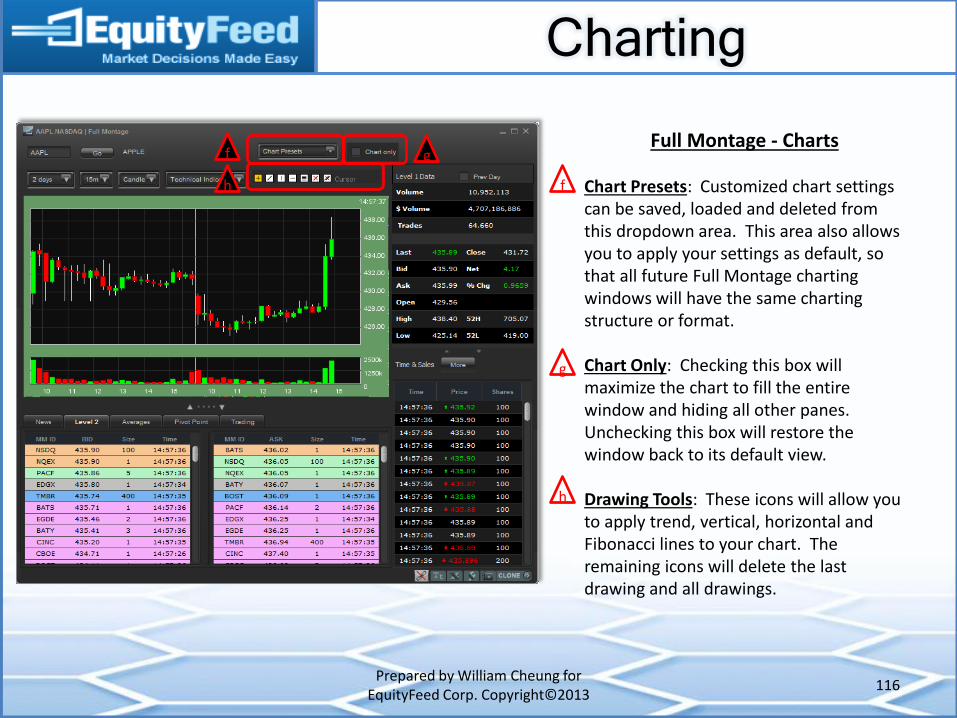
Full Montage - Charts
Chart Presets: Customized chart settings can be saved, loaded and deleted from this dropdown area. This area also allows you to apply your settings as default, so that all future Full Montage charting windows will have the same charting structure or format. Chart Only: Checking this box will maximize the chart to fill the entire window and hiding all other panes. Unchecking this box will restore the window back to its default view. Drawing Tools: These icons will allow you to apply trend, vertical, horizontal and Fibonacci lines to your chart. The remaining icons will delete the last drawing and all drawings.
f
f
g
g
h
h

Charting
Prepared by William Cheung for EquityFeed Corp. Copyright©2013
117
Full Montage – Level 1
The Level 1 area provides current real time data of the current security. The
definitions are as follows:
Volume: Total number of shares traded $ Volume: Value of shares traded Trades: Number of trades Last: Current price Close: Prior day’s closing price Bid: Best inside bid price Net: The difference between the prior day’s closing price and the current price. Ask: Best inside ask price % Chg: Percentage change from prior day’s closing price and the current price. Open: Opening price of the security during the regular market session High: High establish during current session 52H: 52 week high Low: Low established during current session 52L: 52 week low
Charting
Prepared by William Cheung for EquityFeed Corp. Copyright©2013
118
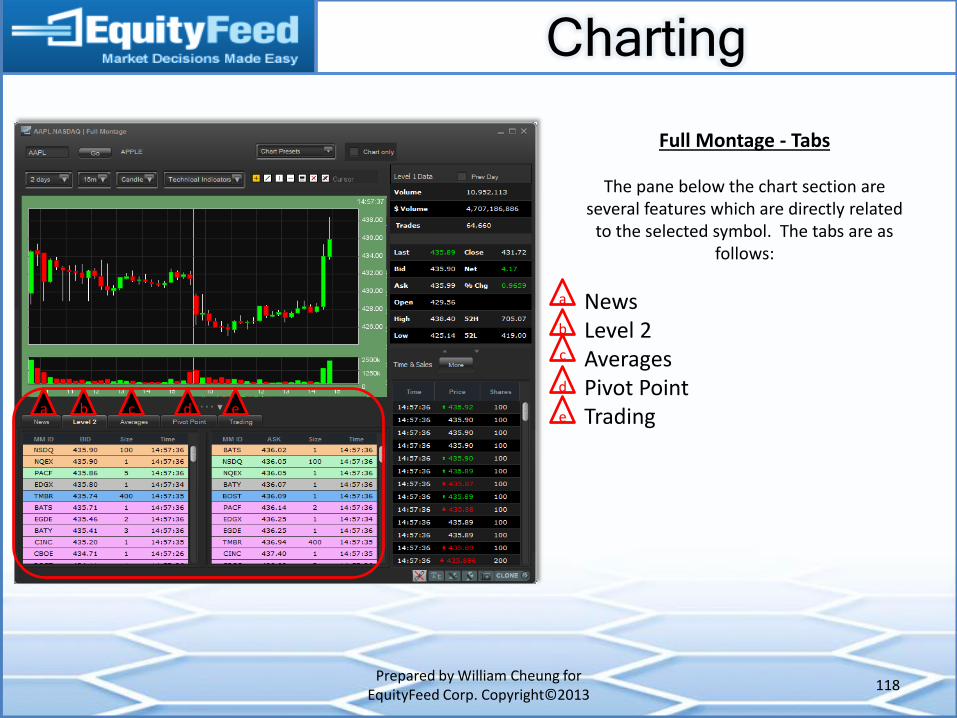
Full Montage - Tabs
The pane below the chart section are several features which are directly related
to the selected symbol. The tabs are as follows:
News Level 2 Averages Pivot Point Trading
a
a
b
b
c
c d
d
e e
Charting
Prepared by William Cheung for EquityFeed Corp. Copyright©2013
119
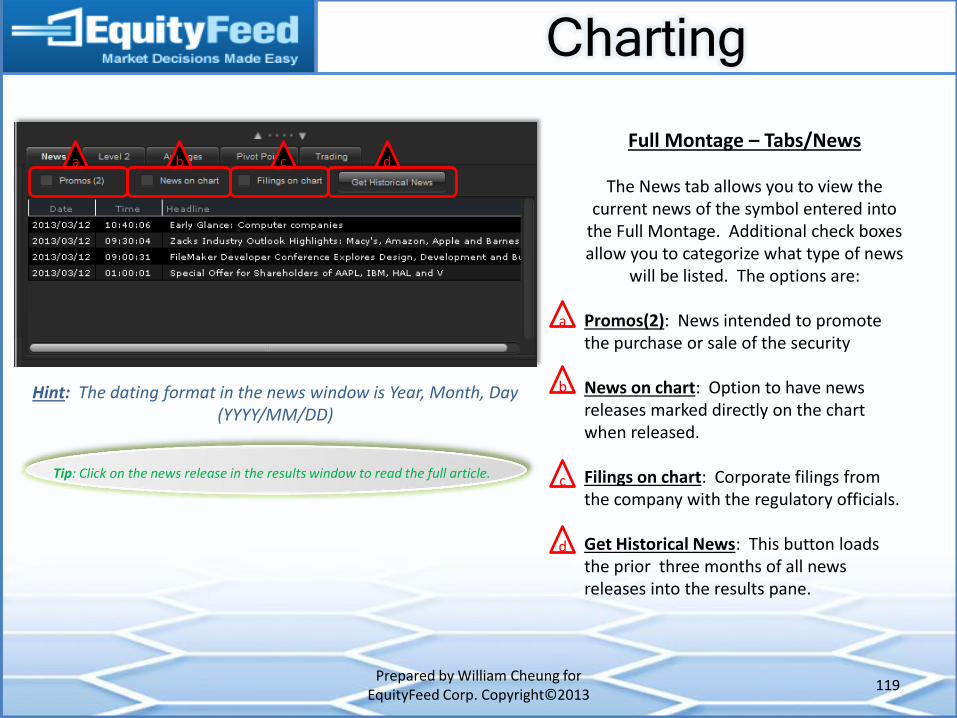
Full Montage – Tabs/News
The News tab allows you to view the current news of the symbol entered into
the Full Montage. Additional check boxes allow you to categorize what type of news
will be listed. The options are:
Promos(2): News intended to promote the purchase or sale of the security News on chart: Option to have news releases marked directly on the chart when released. Filings on chart: Corporate filings from the company with the regulatory officials. Get Historical News: This button loads the prior three months of all news releases into the results pane.
a
a
b
b
c
c d
d
Hint: The dating format in the news window is Year, Month, Day (YYYY/MM/DD)
Tip: Click on the news release in the results window to read the full article.
Charting
Prepared by William Cheung for EquityFeed Corp. Copyright©2013
120
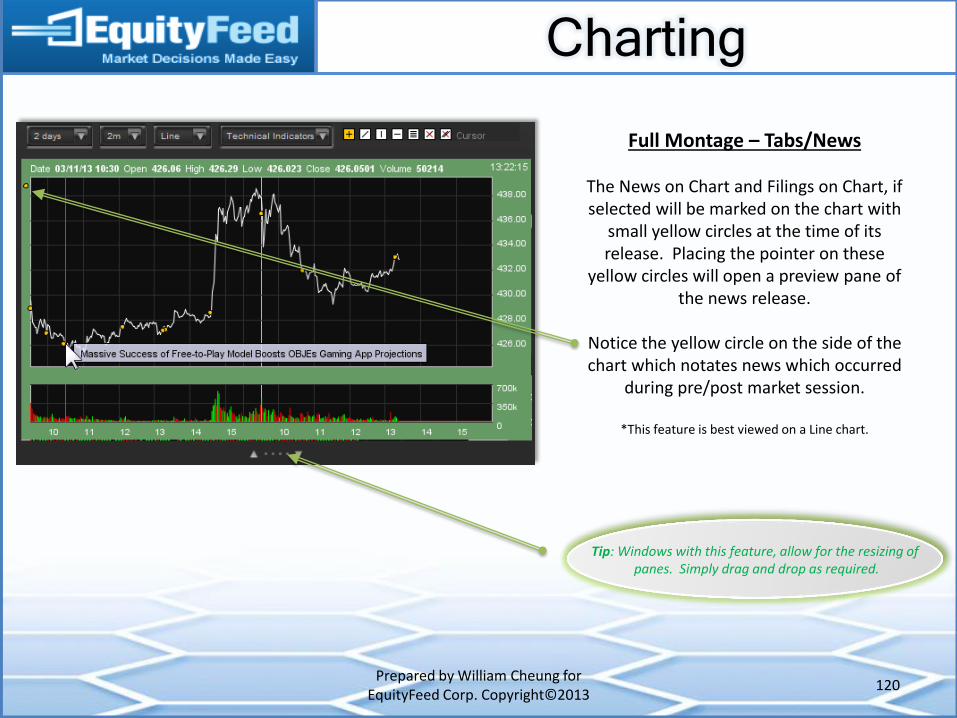
Full Montage – Tabs/News
The News on Chart and Filings on Chart, if selected will be marked on the chart with
small yellow circles at the time of its release. Placing the pointer on these
yellow circles will open a preview pane of the news release.
Notice the yellow circle on the side of the chart which notates news which occurred
during pre/post market session.
*This feature is best viewed on a Line chart.
Tip: Windows with this feature, allow for the resizing of panes. Simply drag and drop as required.
Charting
Prepared by William Cheung for EquityFeed Corp. Copyright©2013
121
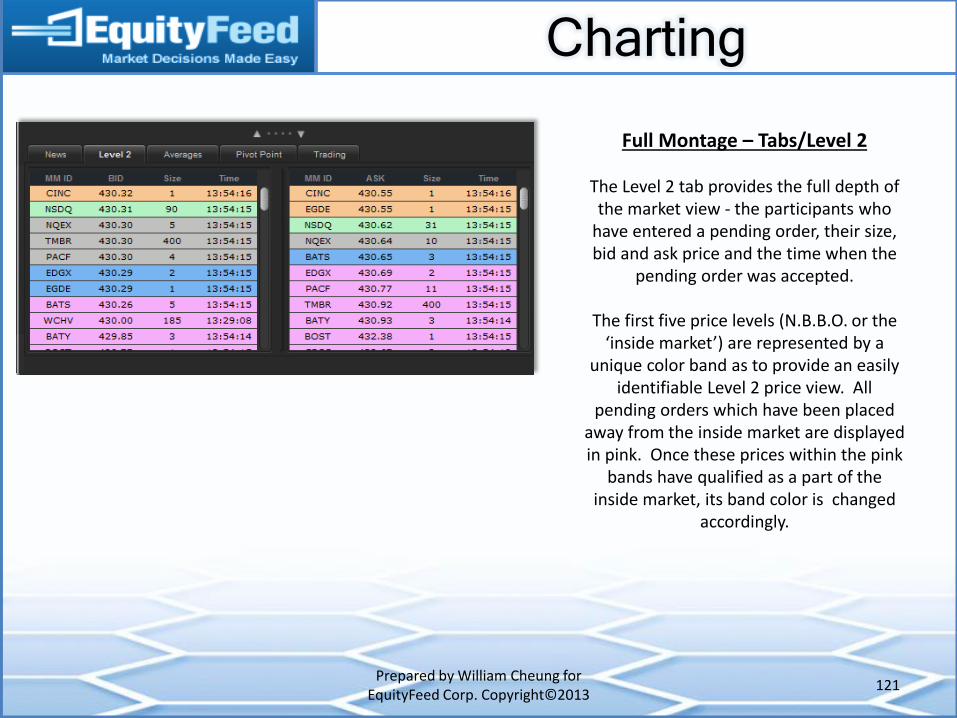
Full Montage – Tabs/Level 2
The Level 2 tab provides the full depth of the market view - the participants who
have entered a pending order, their size, bid and ask price and the time when the
pending order was accepted.
The first five price levels (N.B.B.O. or the ‘inside market’) are represented by a
unique color band as to provide an easily identifiable Level 2 price view. All
pending orders which have been placed away from the inside market are displayed in pink. Once these prices within the pink
bands have qualified as a part of the inside market, its band color is changed
accordingly.
Charting
Prepared by William Cheung for EquityFeed Corp. Copyright©2013
122
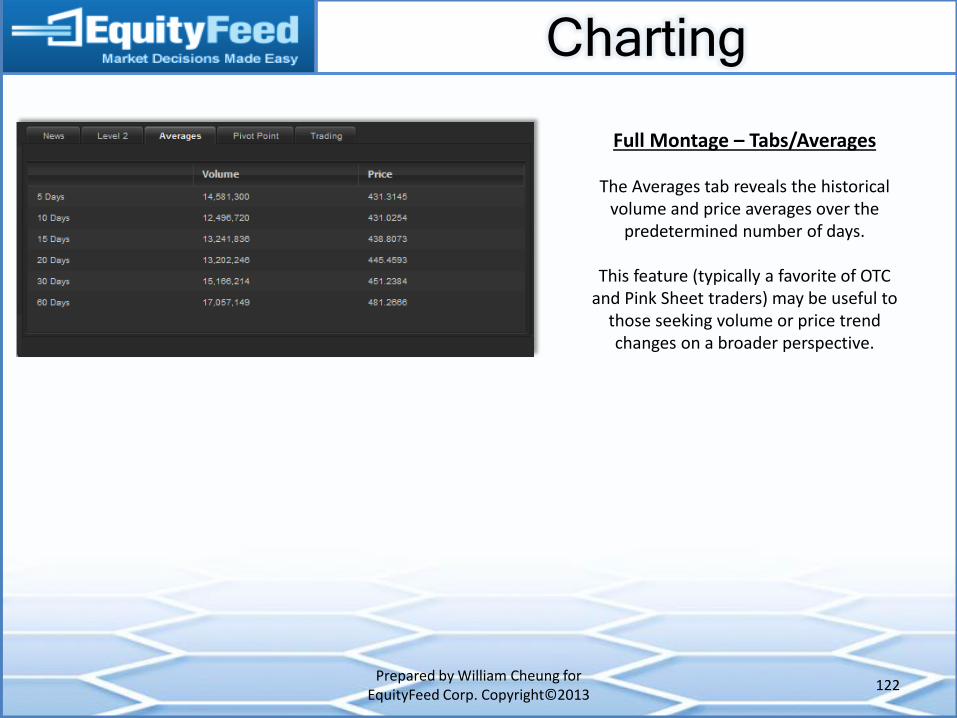
Full Montage – Tabs/Averages
The Averages tab reveals the historical volume and price averages over the
predetermined number of days.
This feature (typically a favorite of OTC and Pink Sheet traders) may be useful to
those seeking volume or price trend changes on a broader perspective.
Charting
Prepared by William Cheung for EquityFeed Corp. Copyright©2013
123
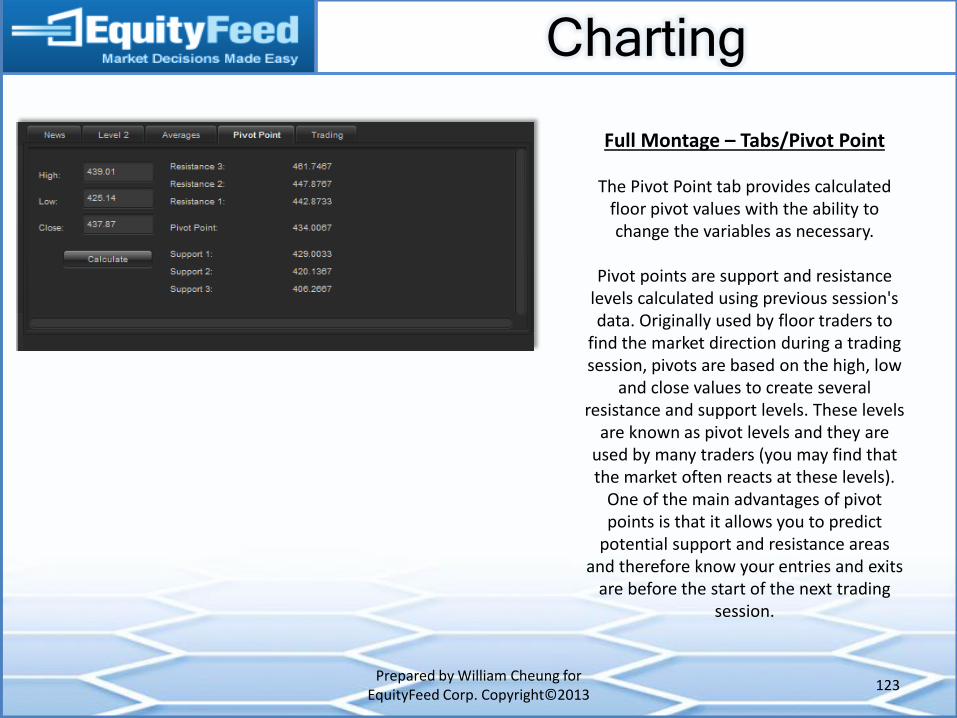
Full Montage – Tabs/Pivot Point
The Pivot Point tab provides calculated floor pivot values with the ability to change the variables as necessary.
Pivot points are support and resistance
levels calculated using previous session's data. Originally used by floor traders to
find the market direction during a trading session, pivots are based on the high, low
and close values to create several resistance and support levels. These levels
are known as pivot levels and they are used by many traders (you may find that the market often reacts at these levels).
One of the main advantages of pivot points is that it allows you to predict
potential support and resistance areas and therefore know your entries and exits
are before the start of the next trading session.
Charting
Prepared by William Cheung for EquityFeed Corp. Copyright©2013
124
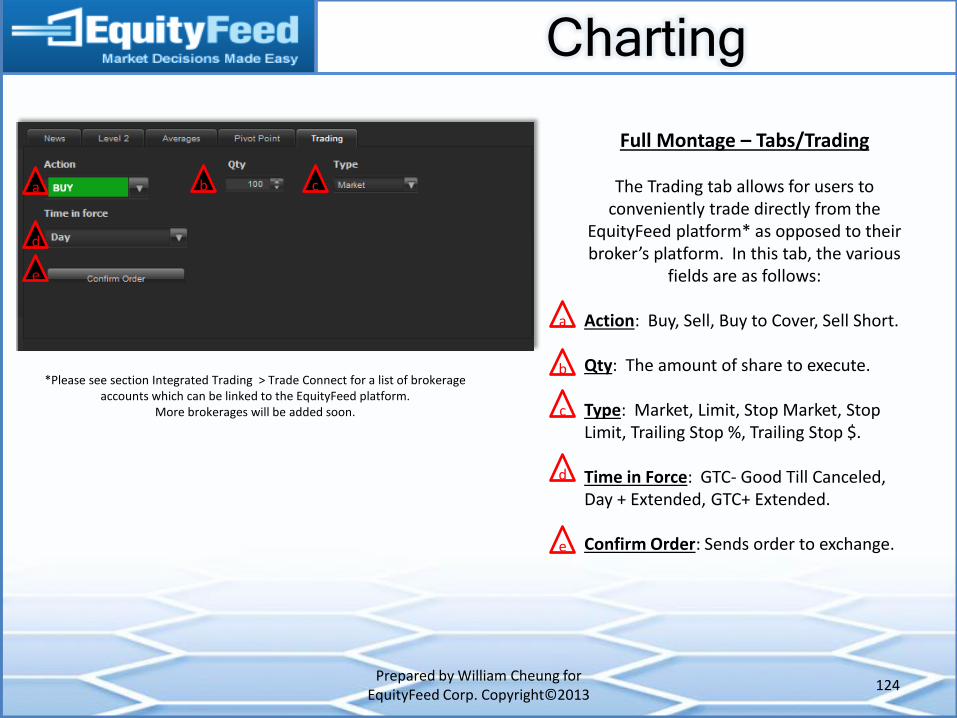
Full Montage – Tabs/Trading
The Trading tab allows for users to conveniently trade directly from the
EquityFeed platform* as opposed to their broker’s platform. In this tab, the various
fields are as follows:
Action: Buy, Sell, Buy to Cover, Sell Short. Qty: The amount of share to execute. Type: Market, Limit, Stop Market, Stop Limit, Trailing Stop %, Trailing Stop $. Time in Force: GTC- Good Till Canceled, Day + Extended, GTC+ Extended. Confirm Order: Sends order to exchange.
a b c
d
e
a
b
c
d
*Please see section Integrated Trading > Trade Connect for a list of brokerage accounts which can be linked to the EquityFeed platform.
More brokerages will be added soon.
e
Charting
Prepared by William Cheung for EquityFeed Corp. Copyright©2013
125
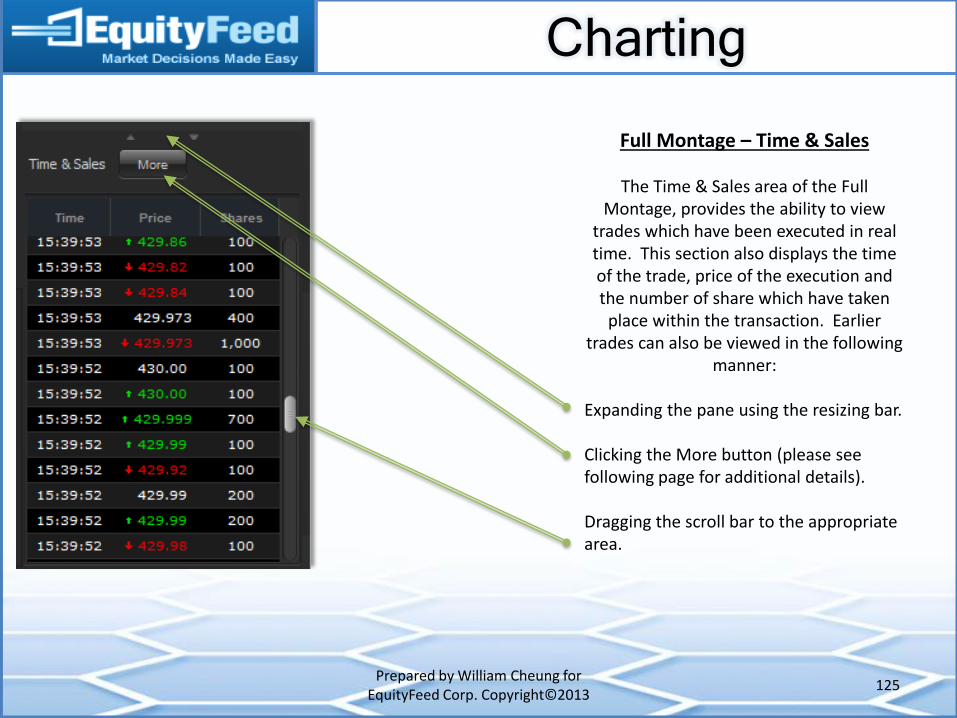
Full Montage – Time & Sales
The Time & Sales area of the Full Montage, provides the ability to view
trades which have been executed in real time. This section also displays the time of the trade, price of the execution and the number of share which have taken
place within the transaction. Earlier trades can also be viewed in the following
manner:
Expanding the pane using the resizing bar. Clicking the More button (please see following page for additional details). Dragging the scroll bar to the appropriate area.

Charting
Prepared by William Cheung for EquityFeed Corp. Copyright©2013
126
Full Montage – Time & Sales (More)
The Time & Sales More feature allows you to access detailed information in a different style.
Simply enter the symbol into the blank field, select the relevant period (either Today or Previous Day) then click the Go button.
Move the slider to view the time and sales to the respective fifteen or half hour period you’d like to view, followed by clicking the Go button. *An additional option is to click the expand arrow, beside the word ‘Filter’, to expose the option to add a volume filter. This area can be useful to those traders who would like to see specific volume trades during periods during the day.
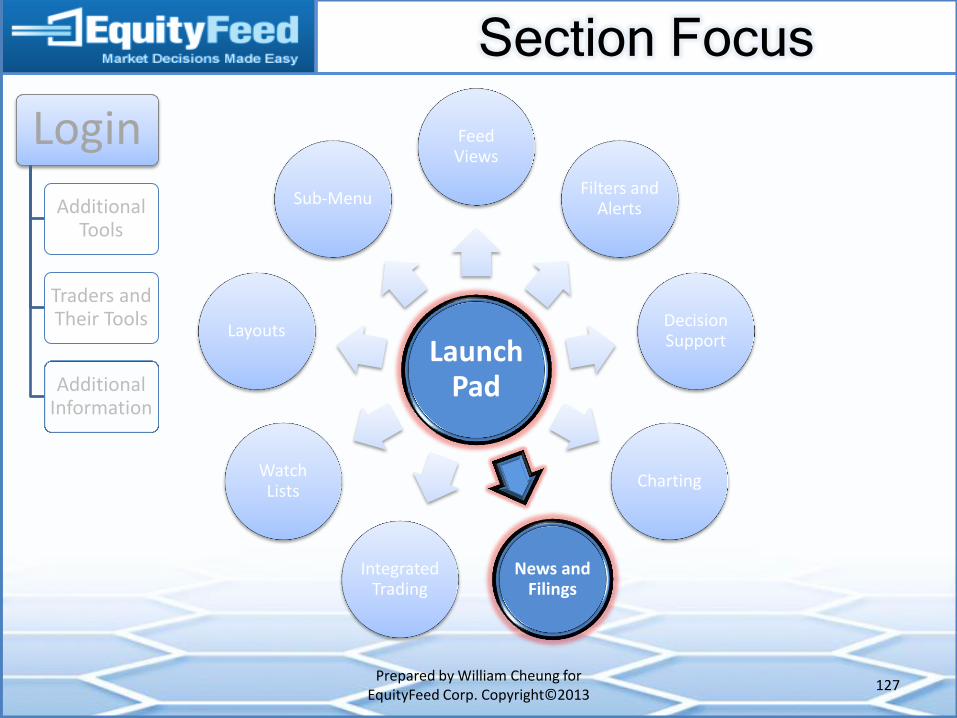
Section Focus
Prepared by William Cheung for EquityFeed Corp. Copyright©2013
127
Launch Pad
Feed Views
Filters and Alerts
Decision Support
Charting
News and Filings
Integrated Trading
Watch Lists
Layouts
Sub-Menu
Login
Additional Tools
Traders and Their Tools
Additional Information
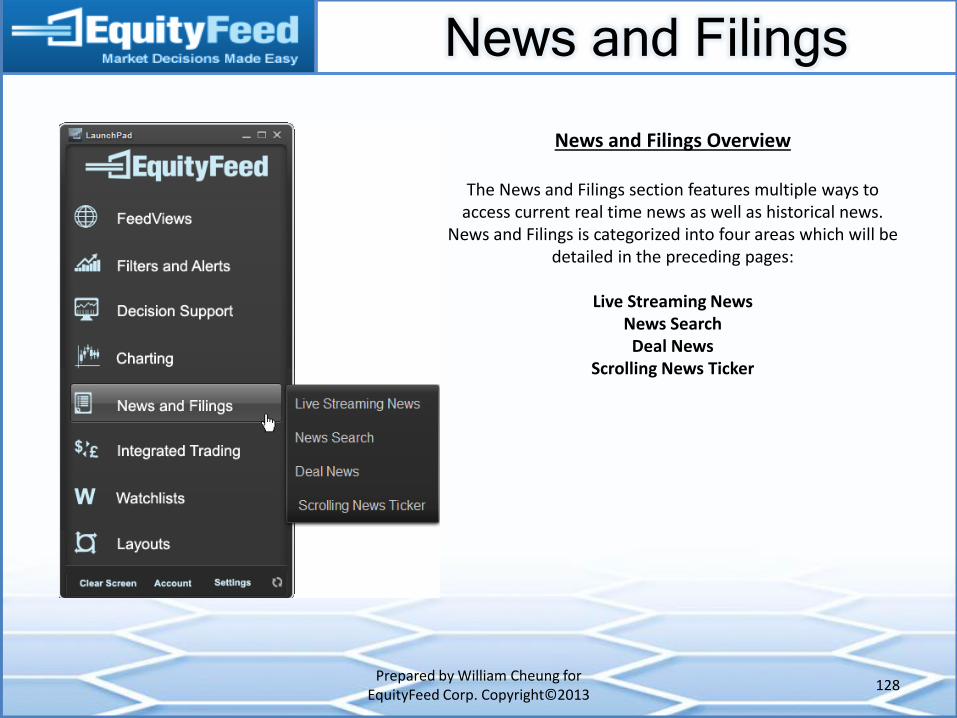
News and Filings
Prepared by William Cheung for EquityFeed Corp. Copyright©2013
128
News and Filings Overview
The News and Filings section features multiple ways to access current real time news as well as historical news.
News and Filings is categorized into four areas which will be detailed in the preceding pages:
Live Streaming News
News Search Deal News
Scrolling News Ticker
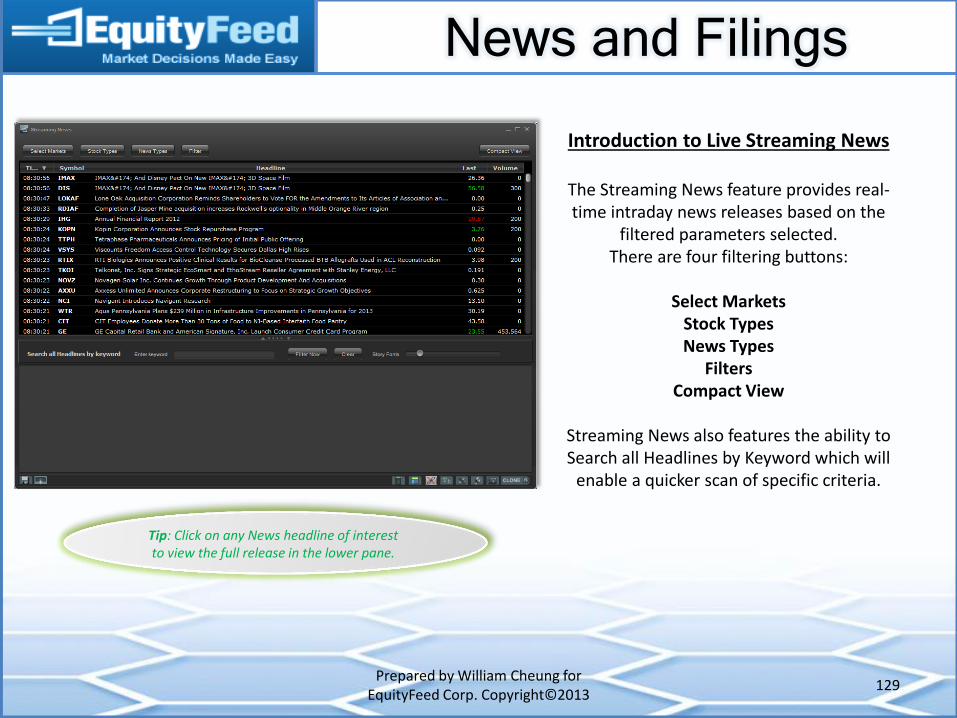
News and Filings
Prepared by William Cheung for EquityFeed Corp. Copyright©2013
129
Introduction to Live Streaming News
The Streaming News feature provides real-time intraday news releases based on the
filtered parameters selected. There are four filtering buttons:
Select Markets
Stock Types News Types
Filters Compact View
Streaming News also features the ability to Search all Headlines by Keyword which will
enable a quicker scan of specific criteria.
Tip: Click on any News headline of interest to view the full release in the lower pane.

News and Filings
Prepared by William Cheung for EquityFeed Corp. Copyright©2013
130
Live Streaming News – Filtering Options
The Streaming News buttons allow for the filtering of news releases which specifically
meet your criteria before posting to the results window. The filtering buttons which open a
dropdown list, are as follows:
Select Markets: Check (or uncheck) the markets which are relevant to your trading criteria. Stock Types: Check (or uncheck) the stock types which are relevant to your trading criteria. News Types: Select the news types which are relevant to your trading criteria. Filter: Enter any relevant information to narrow the search results to fit your trading criteria.
Tip: Click on any Form headline of interest to view the Form hyperlink in the lower pane and the full details in a browser
pop up window.
a
a
b c d
b
c
d
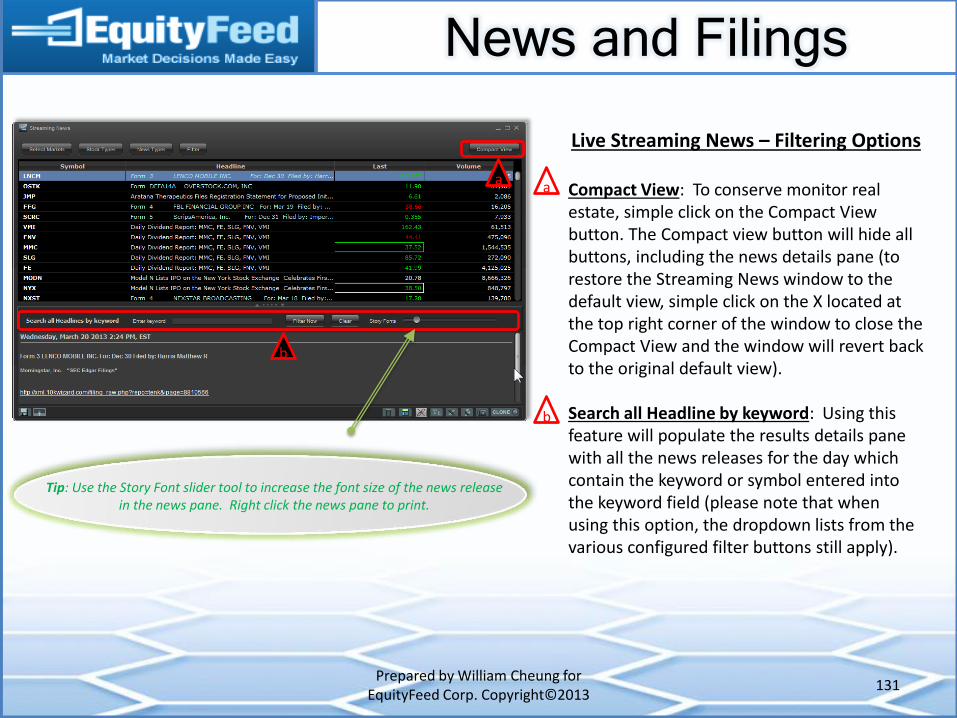
News and Filings
Prepared by William Cheung for EquityFeed Corp. Copyright©2013
131
Live Streaming News – Filtering Options
Compact View: To conserve monitor real estate, simple click on the Compact View button. The Compact view button will hide all buttons, including the news details pane (to restore the Streaming News window to the default view, simple click on the X located at the top right corner of the window to close the Compact View and the window will revert back to the original default view). Search all Headline by keyword: Using this feature will populate the results details pane with all the news releases for the day which contain the keyword or symbol entered into the keyword field (please note that when using this option, the dropdown lists from the various configured filter buttons still apply).
a a
b
b
Tip: Use the Story Font slider tool to increase the font size of the news release in the news pane. Right click the news pane to print.
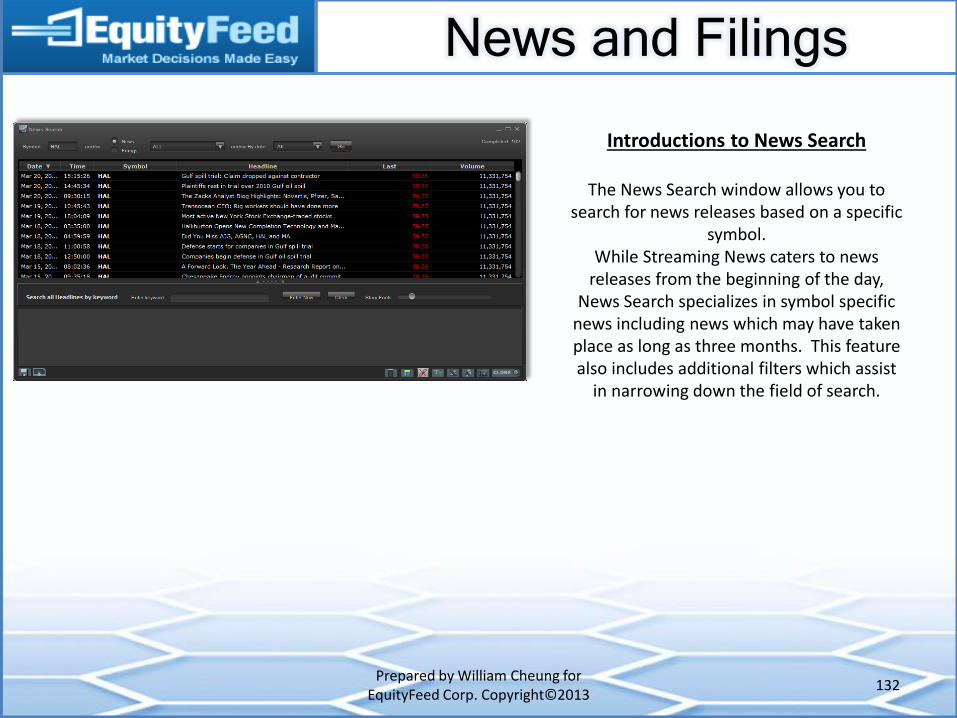
News and Filings
Prepared by William Cheung for EquityFeed Corp. Copyright©2013
132
Introductions to News Search
The News Search window allows you to search for news releases based on a specific
symbol. While Streaming News caters to news
releases from the beginning of the day, News Search specializes in symbol specific
news including news which may have taken place as long as three months. This feature also includes additional filters which assist
in narrowing down the field of search.
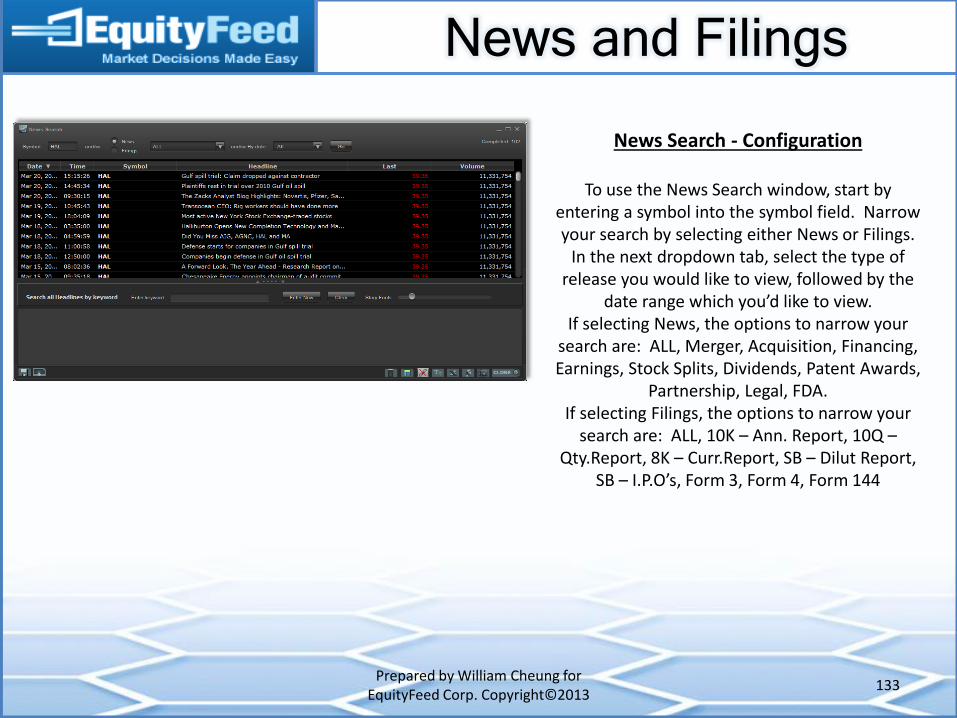
News and Filings
Prepared by William Cheung for EquityFeed Corp. Copyright©2013
133
News Search - Configuration
To use the News Search window, start by entering a symbol into the symbol field. Narrow your search by selecting either News or Filings.
In the next dropdown tab, select the type of release you would like to view, followed by the
date range which you’d like to view. If selecting News, the options to narrow your
search are: ALL, Merger, Acquisition, Financing, Earnings, Stock Splits, Dividends, Patent Awards,
Partnership, Legal, FDA. If selecting Filings, the options to narrow your
search are: ALL, 10K – Ann. Report, 10Q – Qty.Report, 8K – Curr.Report, SB – Dilut Report,
SB – I.P.O’s, Form 3, Form 4, Form 144
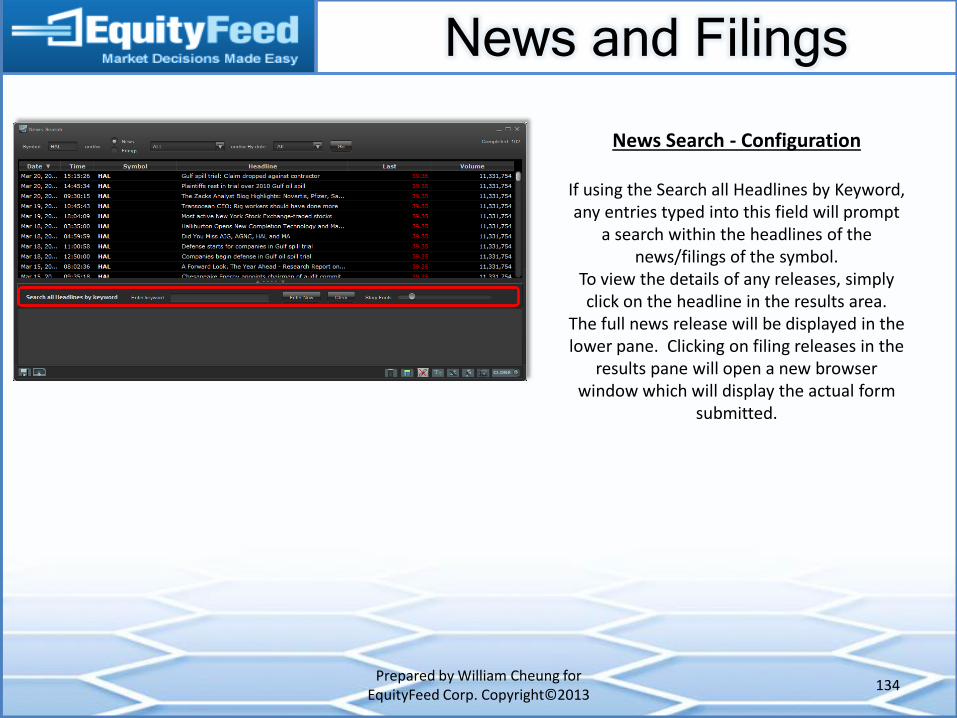
News and Filings
Prepared by William Cheung for EquityFeed Corp. Copyright©2013
134
News Search - Configuration
If using the Search all Headlines by Keyword, any entries typed into this field will prompt
a search within the headlines of the news/filings of the symbol.
To view the details of any releases, simply click on the headline in the results area.
The full news release will be displayed in the lower pane. Clicking on filing releases in the
results pane will open a new browser window which will display the actual form
submitted.
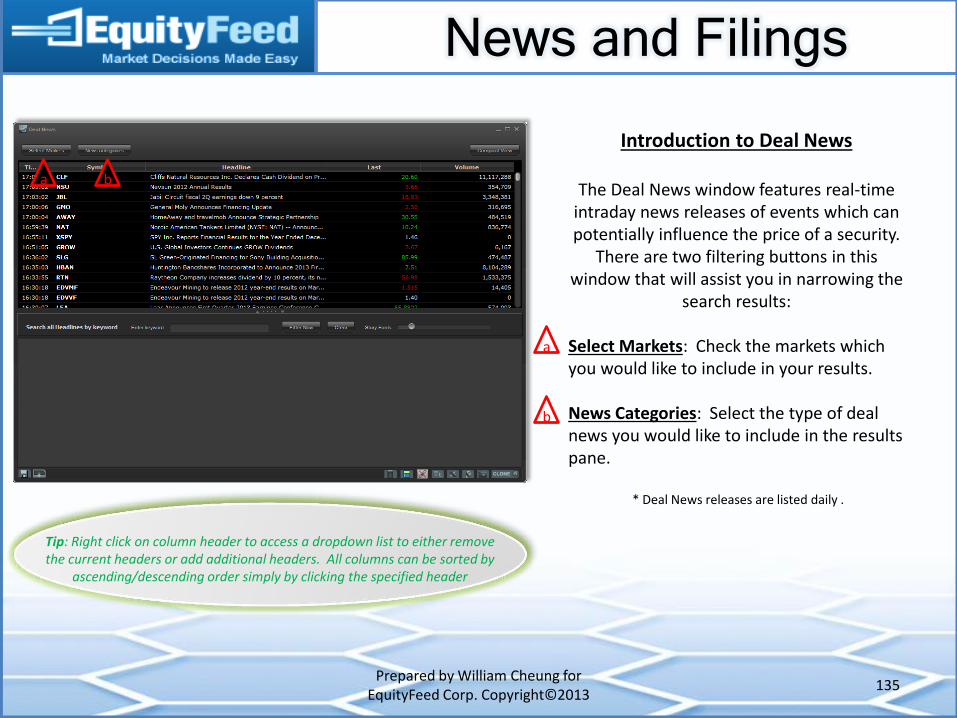
News and Filings
Prepared by William Cheung for EquityFeed Corp. Copyright©2013
135
Introduction to Deal News
The Deal News window features real-time intraday news releases of events which can potentially influence the price of a security.
There are two filtering buttons in this window that will assist you in narrowing the
search results:
Select Markets: Check the markets which you would like to include in your results. News Categories: Select the type of deal news you would like to include in the results pane.
* Deal News releases are listed daily .
b a
Tip: Right click on column header to access a dropdown list to either remove the current headers or add additional headers. All columns can be sorted by
ascending/descending order simply by clicking the specified header
a
b
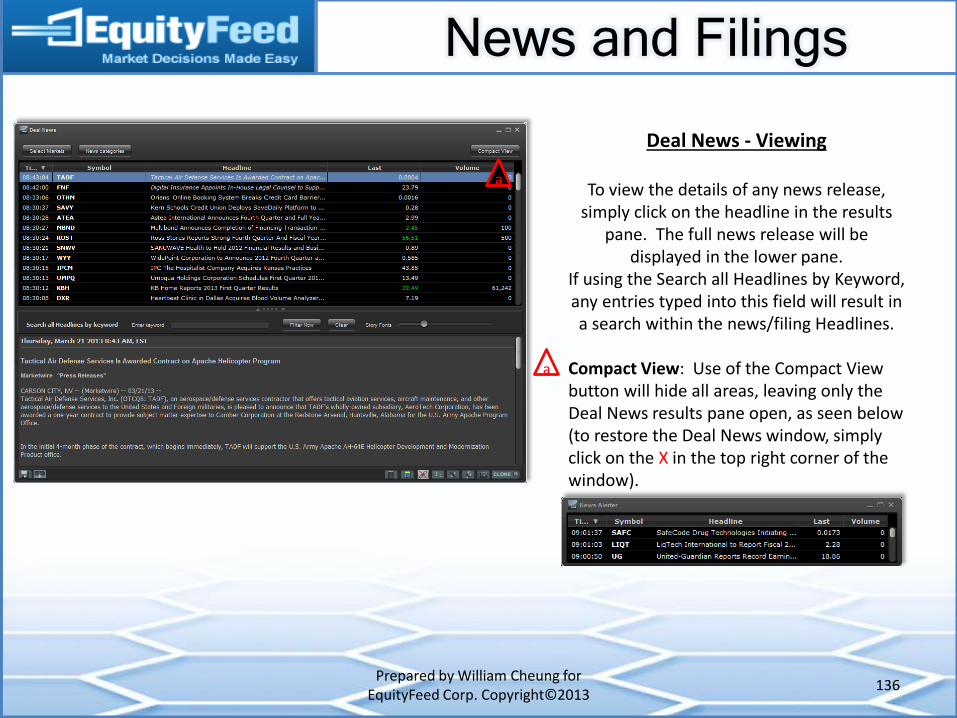
News and Filings
Prepared by William Cheung for EquityFeed Corp. Copyright©2013
136
Deal News - Viewing
To view the details of any news release, simply click on the headline in the results
pane. The full news release will be displayed in the lower pane.
If using the Search all Headlines by Keyword, any entries typed into this field will result in a search within the news/filing Headlines.
Compact View: Use of the Compact View button will hide all areas, leaving only the Deal News results pane open, as seen below (to restore the Deal News window, simply click on the X in the top right corner of the window).
a
a
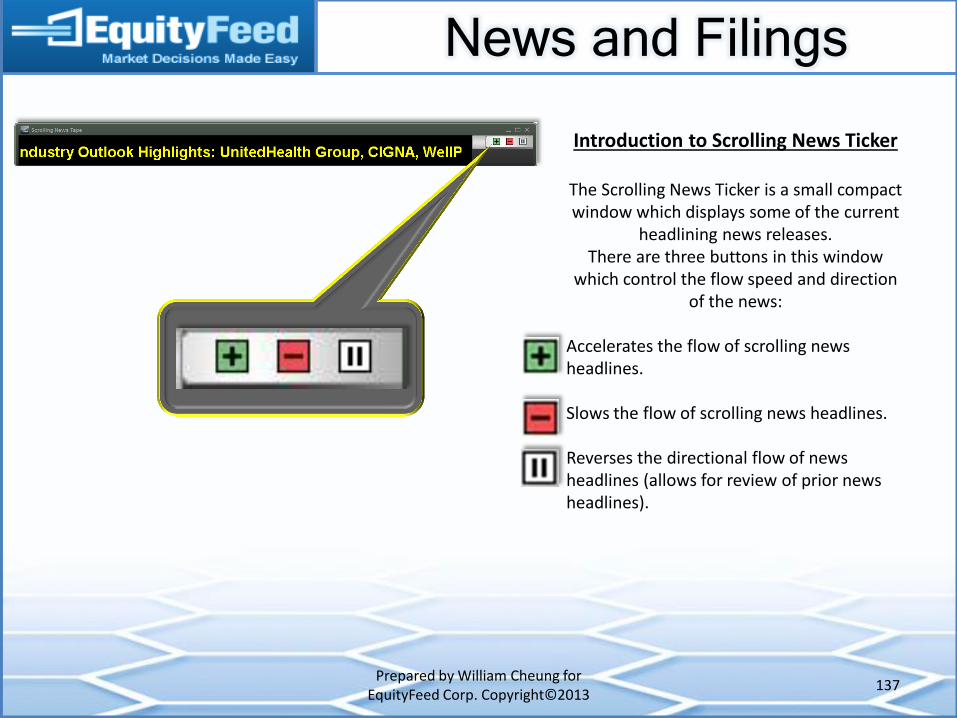
News and Filings
Prepared by William Cheung for EquityFeed Corp. Copyright©2013
137
Introduction to Scrolling News Ticker
The Scrolling News Ticker is a small compact window which displays some of the current
headlining news releases. There are three buttons in this window
which control the flow speed and direction of the news:
Accelerates the flow of scrolling news headlines. Slows the flow of scrolling news headlines. Reverses the directional flow of news headlines (allows for review of prior news headlines).
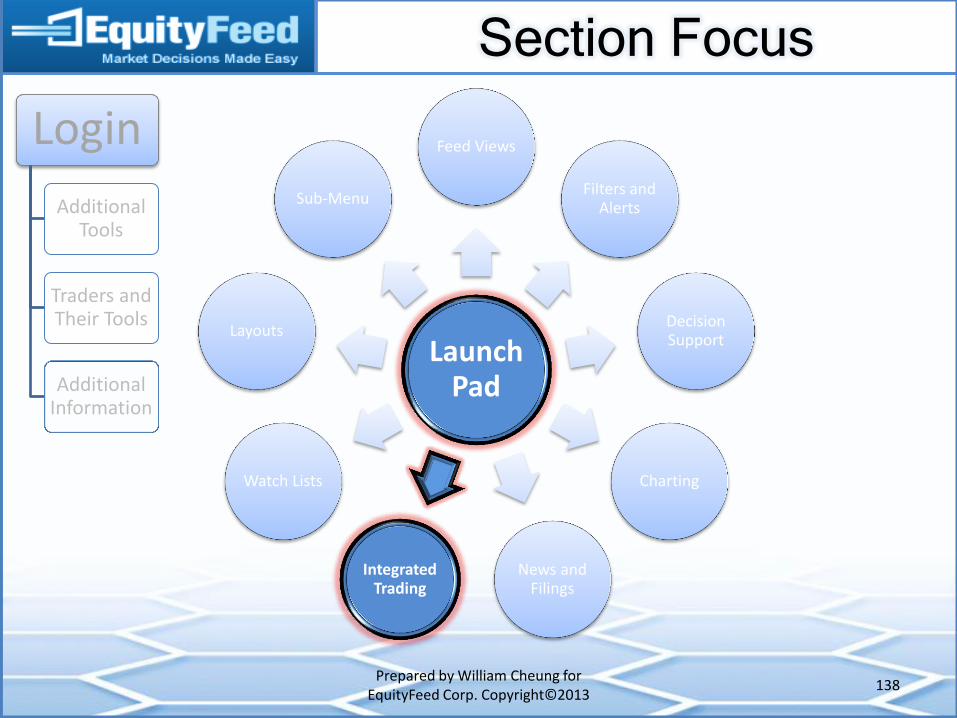
Section Focus
Prepared by William Cheung for EquityFeed Corp. Copyright©2013
138
Launch Pad
Feed Views
Filters and Alerts
Decision Support
Charting
News and Filings
Integrated Trading
Watch Lists
Layouts
Sub-Menu
Login
Additional Tools
Traders and Their Tools
Additional Information
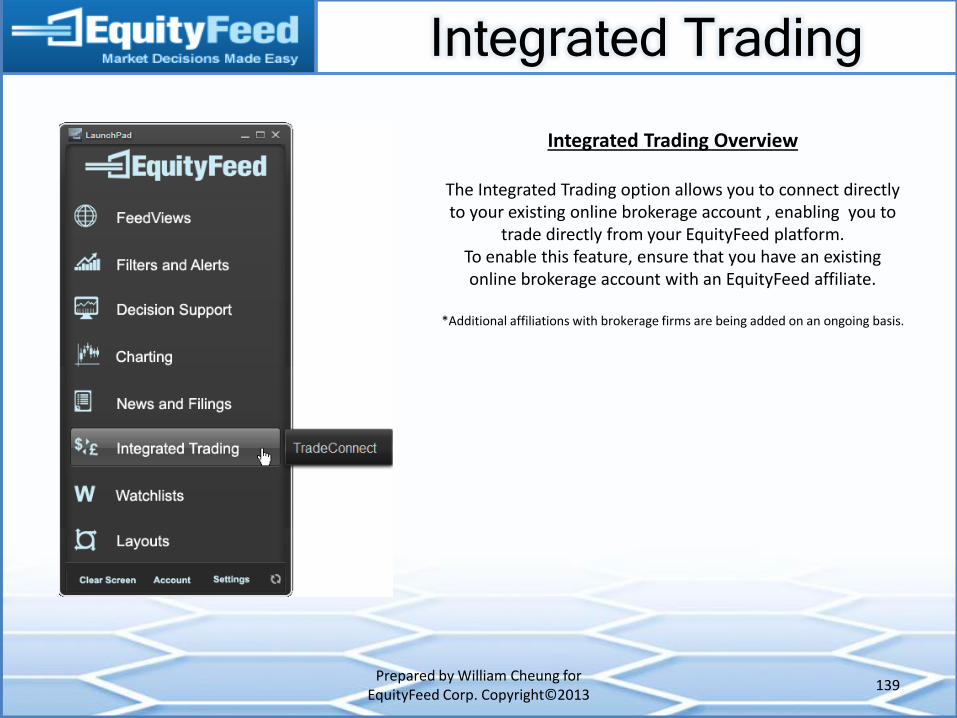
Integrated Trading
Prepared by William Cheung for EquityFeed Corp. Copyright©2013
139
Integrated Trading Overview
The Integrated Trading option allows you to connect directly to your existing online brokerage account , enabling you to
trade directly from your EquityFeed platform. To enable this feature, ensure that you have an existing online brokerage account with an EquityFeed affiliate.
*Additional affiliations with brokerage firms are being added on an ongoing basis.
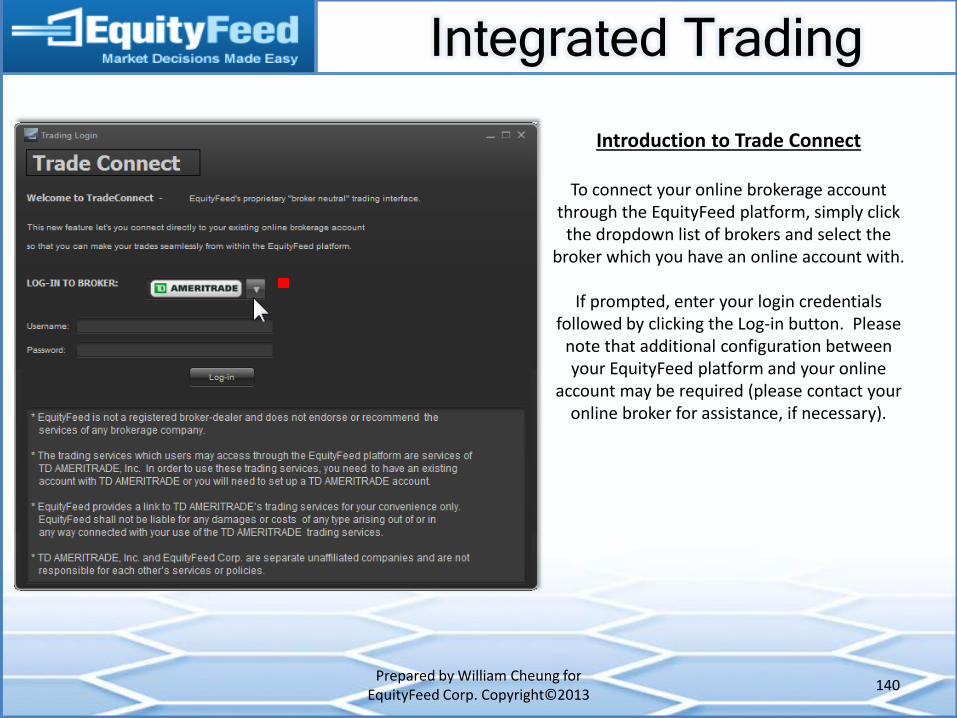
Integrated Trading
Prepared by William Cheung for EquityFeed Corp. Copyright©2013
140
Introduction to Trade Connect
To connect your online brokerage account through the EquityFeed platform, simply click
the dropdown list of brokers and select the broker which you have an online account with.
If prompted, enter your login credentials
followed by clicking the Log-in button. Please note that additional configuration between your EquityFeed platform and your online
account may be required (please contact your online broker for assistance, if necessary).
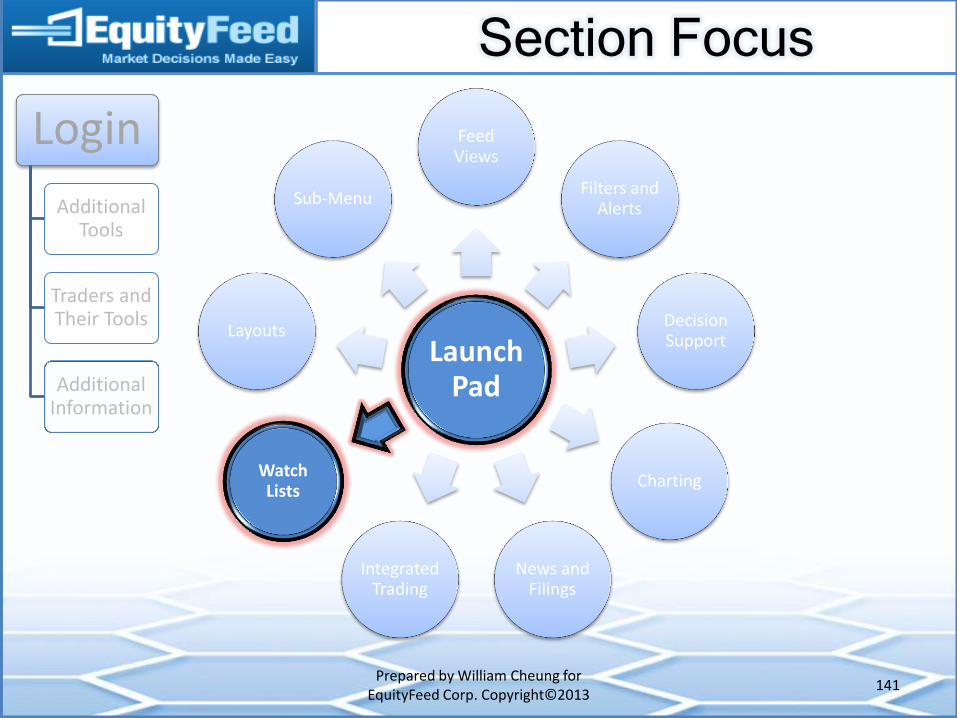
Section Focus
Prepared by William Cheung for EquityFeed Corp. Copyright©2013
141
Launch Pad
Feed Views
Filters and Alerts
Decision Support
Charting
News and Filings
Integrated Trading
Watch Lists
Layouts
Sub-Menu
Login
Additional Tools
Traders and Their Tools
Additional Information
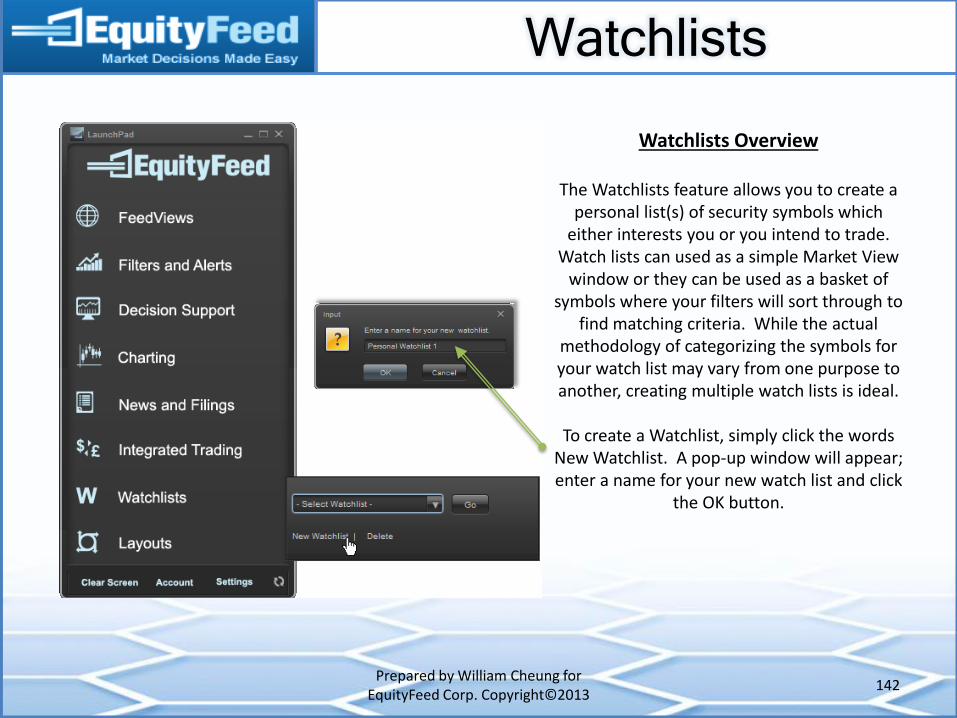
Watchlists
Prepared by William Cheung for EquityFeed Corp. Copyright©2013
142
Watchlists Overview
The Watchlists feature allows you to create a personal list(s) of security symbols which
either interests you or you intend to trade. Watch lists can used as a simple Market View
window or they can be used as a basket of symbols where your filters will sort through to
find matching criteria. While the actual methodology of categorizing the symbols for your watch list may vary from one purpose to another, creating multiple watch lists is ideal.
To create a Watchlist, simply click the words
New Watchlist. A pop-up window will appear; enter a name for your new watch list and click
the OK button.
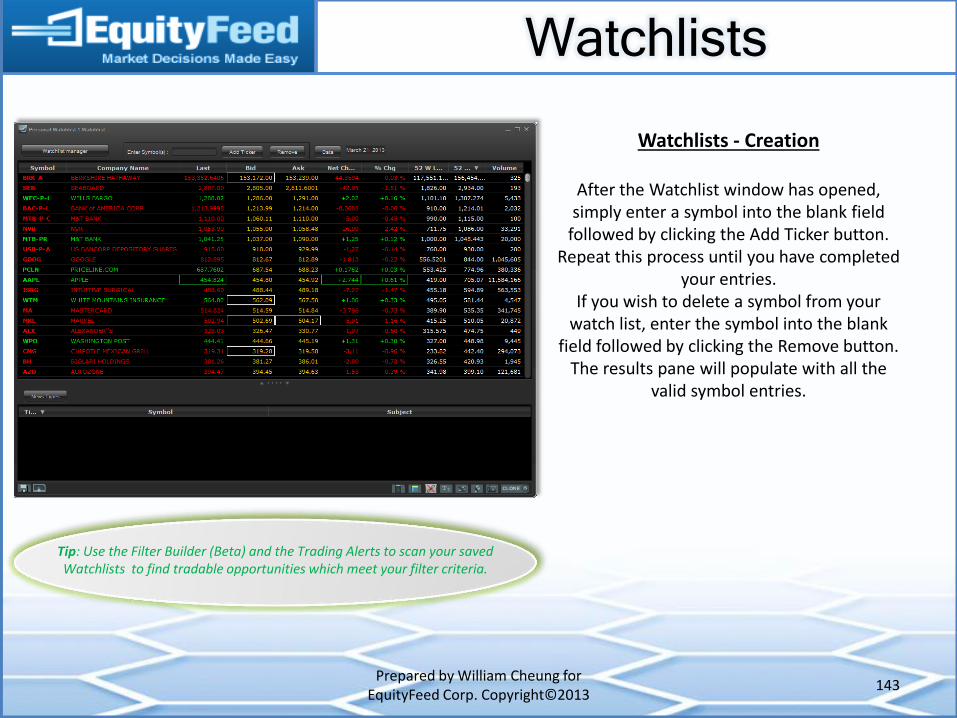
Watchlists
Prepared by William Cheung for EquityFeed Corp. Copyright©2013
143
Watchlists - Creation
After the Watchlist window has opened, simply enter a symbol into the blank field
followed by clicking the Add Ticker button. Repeat this process until you have completed
your entries. If you wish to delete a symbol from your
watch list, enter the symbol into the blank field followed by clicking the Remove button.
The results pane will populate with all the valid symbol entries.
Tip: Use the Filter Builder (Beta) and the Trading Alerts to scan your saved Watchlists to find tradable opportunities which meet your filter criteria.
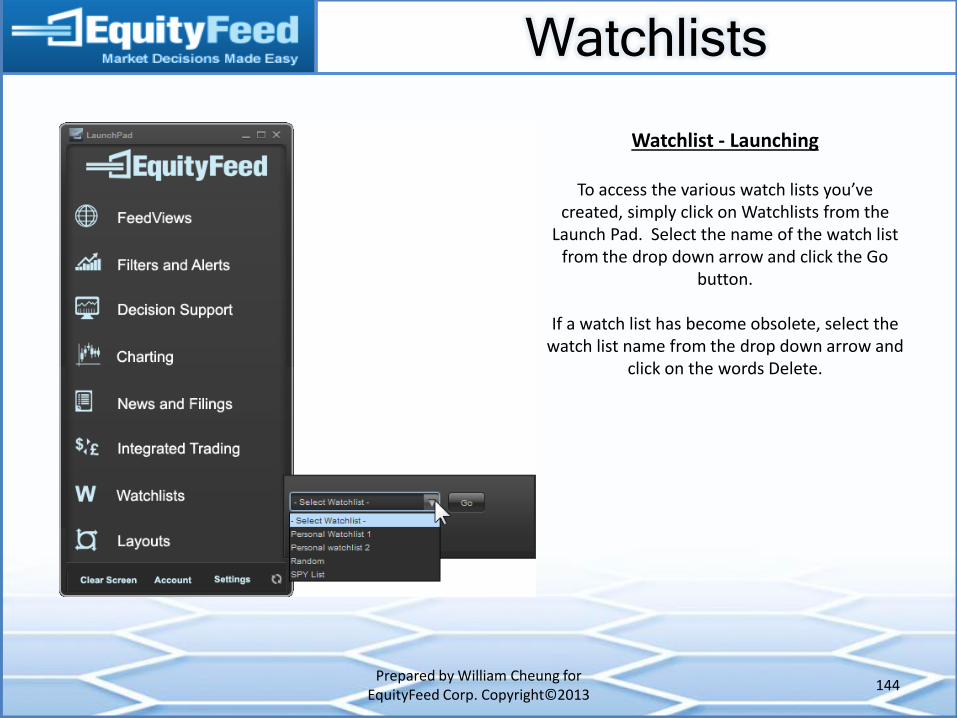
Watchlists
Prepared by William Cheung for EquityFeed Corp. Copyright©2013
144
Watchlist - Launching
To access the various watch lists you’ve created, simply click on Watchlists from the
Launch Pad. Select the name of the watch list from the drop down arrow and click the Go
button.
If a watch list has become obsolete, select the watch list name from the drop down arrow and
click on the words Delete.
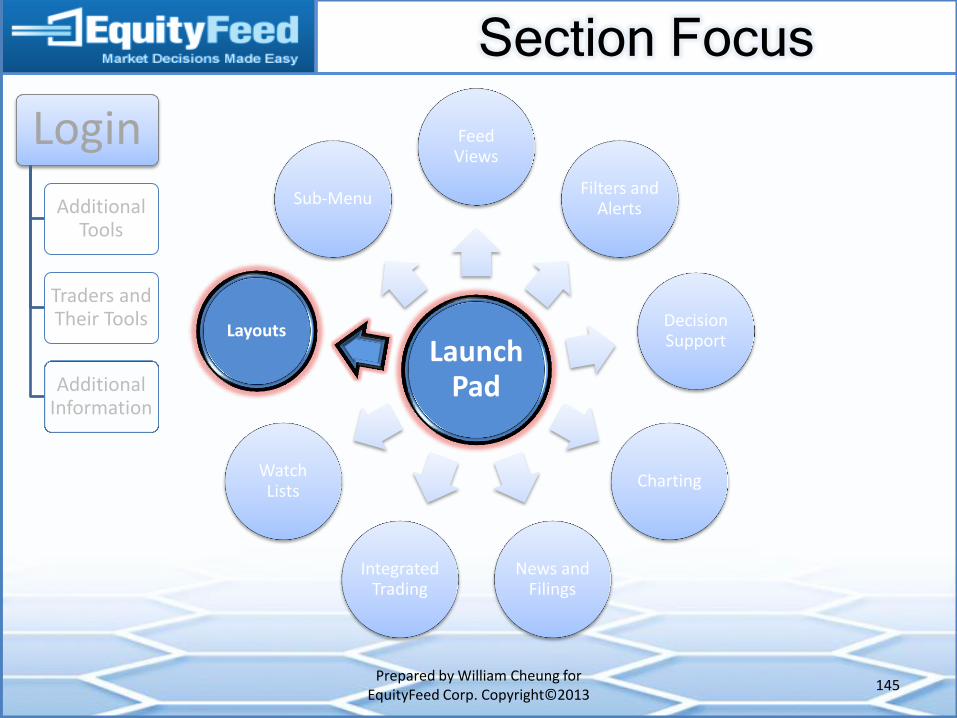
Section Focus
Prepared by William Cheung for EquityFeed Corp. Copyright©2013
145
Launch Pad
Feed Views
Filters and Alerts
Decision Support
Charting
News and Filings
Integrated Trading
Watch Lists
Layouts
Sub-Menu
Login
Additional Tools
Traders and Their Tools
Additional Information
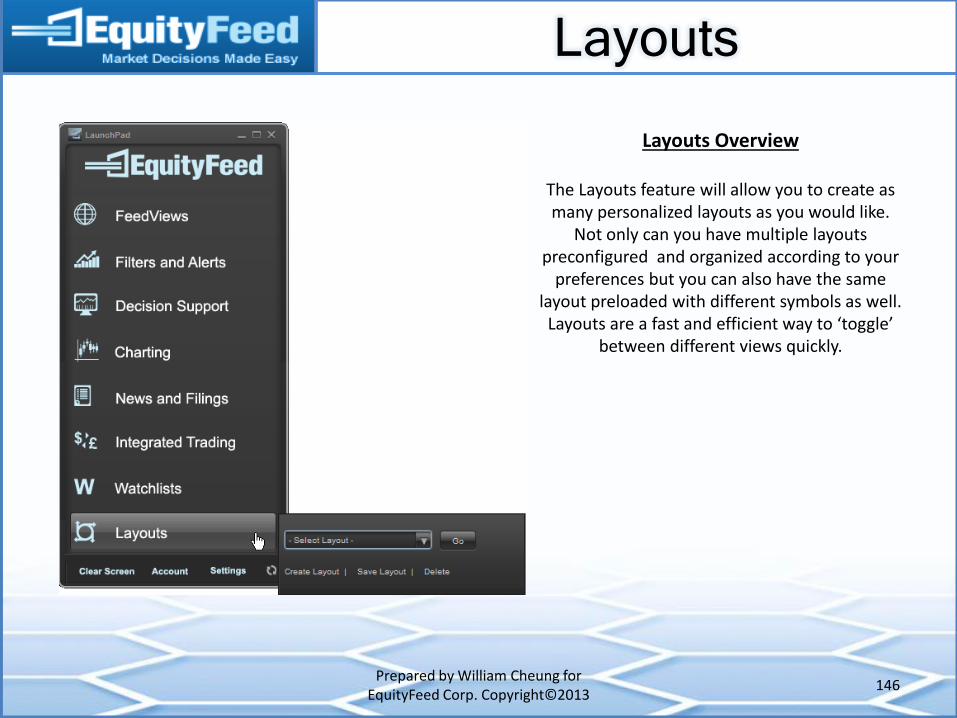
Layouts
Prepared by William Cheung for EquityFeed Corp. Copyright©2013
146
Layouts Overview
The Layouts feature will allow you to create as many personalized layouts as you would like.
Not only can you have multiple layouts preconfigured and organized according to your
preferences but you can also have the same layout preloaded with different symbols as well.
Layouts are a fast and efficient way to ‘toggle’ between different views quickly.
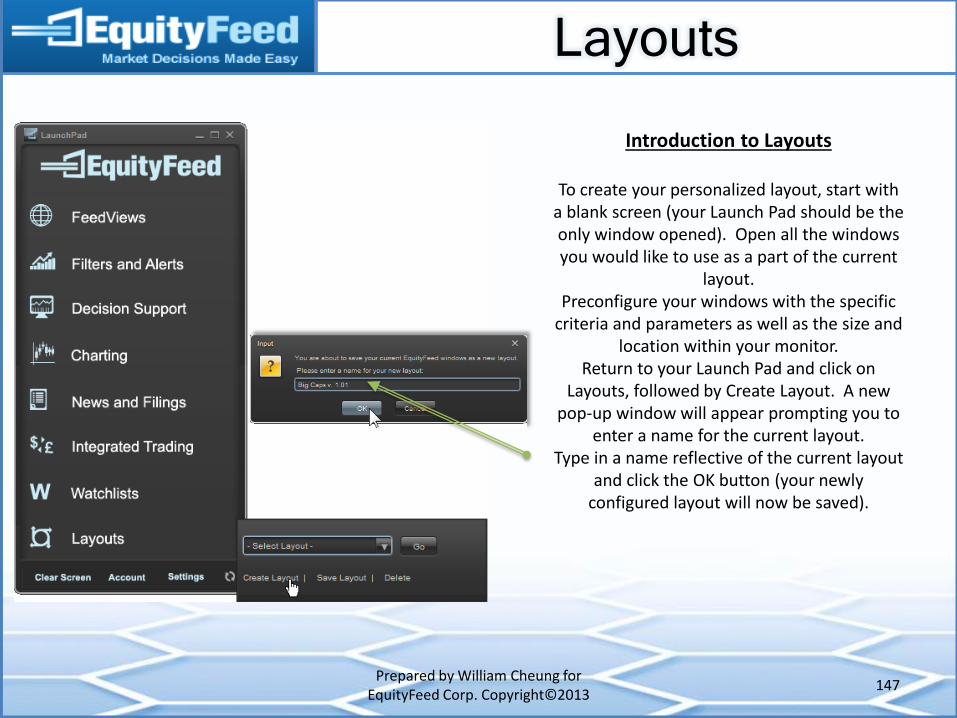
Layouts
Prepared by William Cheung for EquityFeed Corp. Copyright©2013
147
Introduction to Layouts
To create your personalized layout, start with a blank screen (your Launch Pad should be the only window opened). Open all the windows you would like to use as a part of the current
layout. Preconfigure your windows with the specific
criteria and parameters as well as the size and location within your monitor.
Return to your Launch Pad and click on Layouts, followed by Create Layout. A new
pop-up window will appear prompting you to enter a name for the current layout.
Type in a name reflective of the current layout and click the OK button (your newly
configured layout will now be saved).
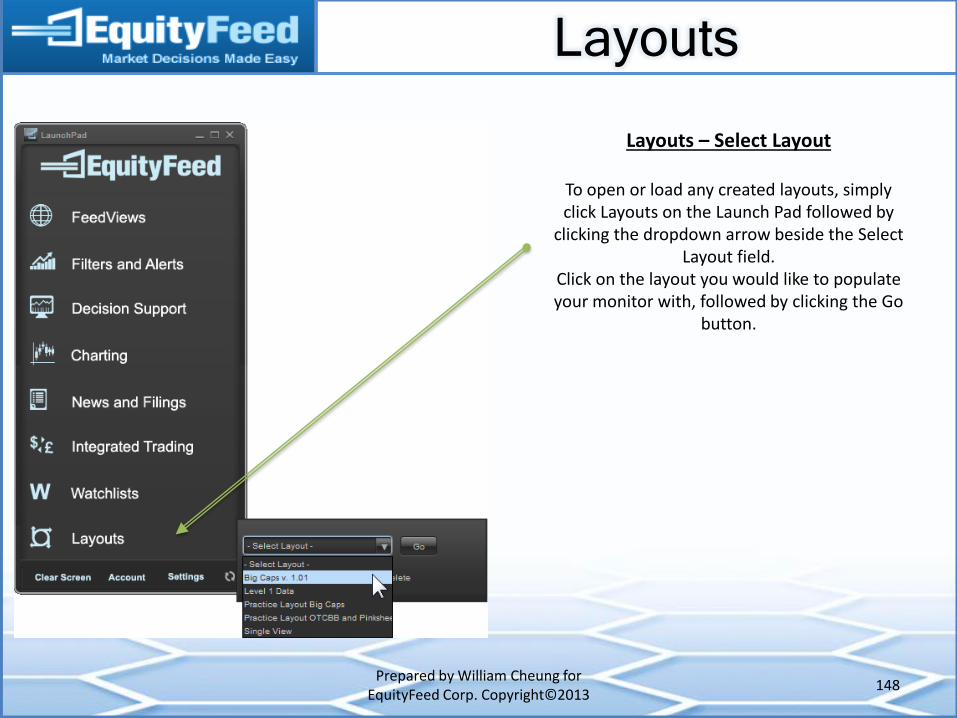
Layouts
Prepared by William Cheung for EquityFeed Corp. Copyright©2013
148
Layouts – Select Layout
To open or load any created layouts, simply click Layouts on the Launch Pad followed by
clicking the dropdown arrow beside the Select Layout field.
Click on the layout you would like to populate your monitor with, followed by clicking the Go
button.
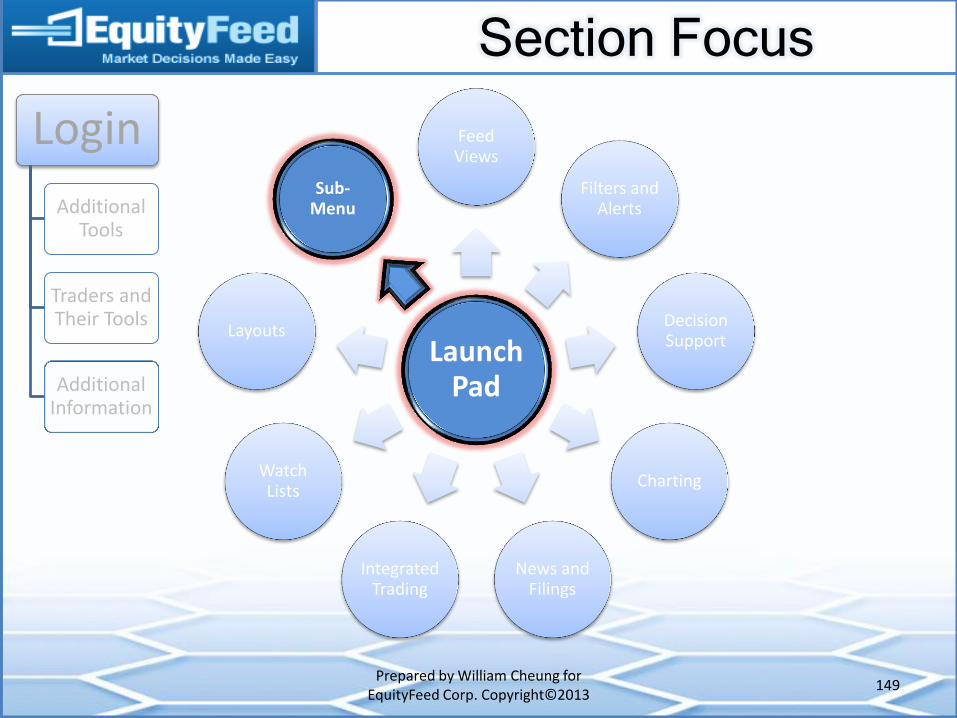
Section Focus
Prepared by William Cheung for EquityFeed Corp. Copyright©2013
149
Launch Pad
Feed Views
Filters and Alerts
Decision Support
Charting
News and Filings
Integrated Trading
Watch Lists
Layouts
Sub-Menu
Login
Additional Tools
Traders and Their Tools
Additional Information
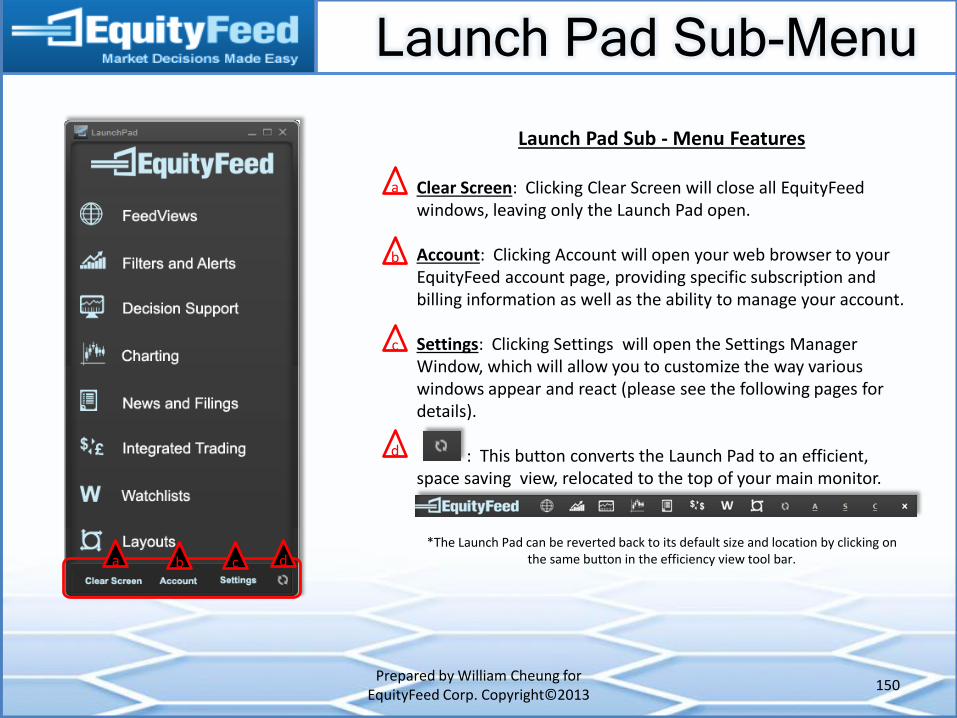
Launch Pad Sub-Menu
Prepared by William Cheung for EquityFeed Corp. Copyright©2013
150
Launch Pad Sub - Menu Features
Clear Screen: Clicking Clear Screen will close all EquityFeed windows, leaving only the Launch Pad open. Account: Clicking Account will open your web browser to your EquityFeed account page, providing specific subscription and billing information as well as the ability to manage your account. Settings: Clicking Settings will open the Settings Manager Window, which will allow you to customize the way various windows appear and react (please see the following pages for details). : This button converts the Launch Pad to an efficient, space saving view, relocated to the top of your main monitor.
*The Launch Pad can be reverted back to its default size and location by clicking on the same button in the efficiency view tool bar. a b c d
b
c
d
a
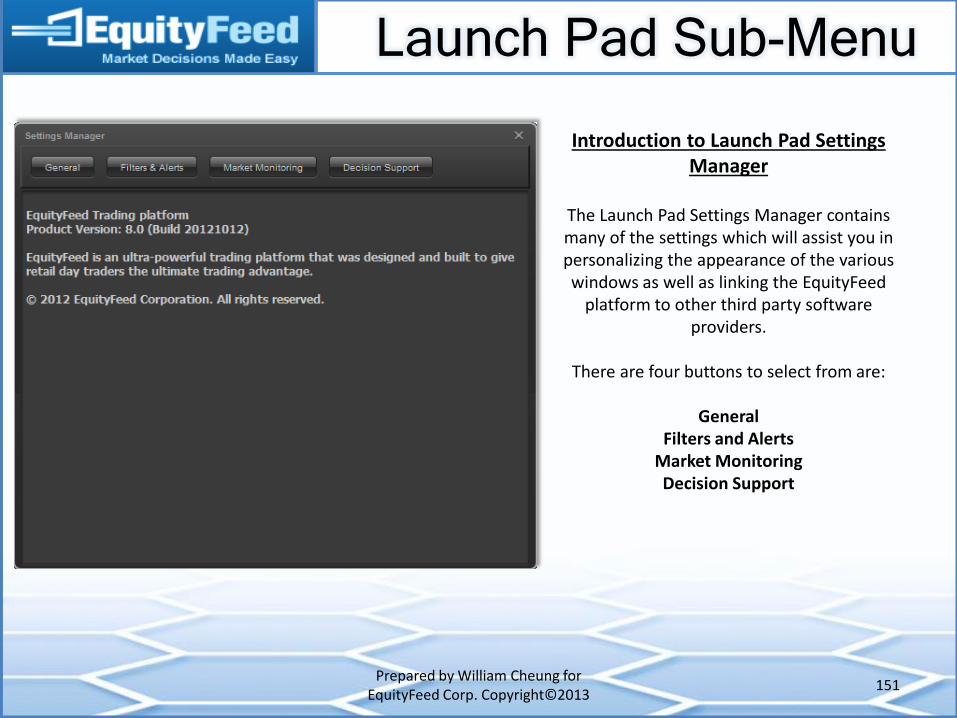
Launch Pad Sub-Menu
Prepared by William Cheung for EquityFeed Corp. Copyright©2013
151
Introduction to Launch Pad Settings Manager
The Launch Pad Settings Manager contains many of the settings which will assist you in personalizing the appearance of the various windows as well as linking the EquityFeed
platform to other third party software providers.
There are four buttons to select from are:
General
Filters and Alerts Market Monitoring Decision Support

Launch Pad Sub-Menu
Prepared by William Cheung for EquityFeed Corp. Copyright©2013
152
Launch Pad Settings Manager - General
The General button provides access to configure the parameters of your platform.
The four items which can be selected from the
drop down list are as follows:
System 3rd Party
Look and Feel Banned List
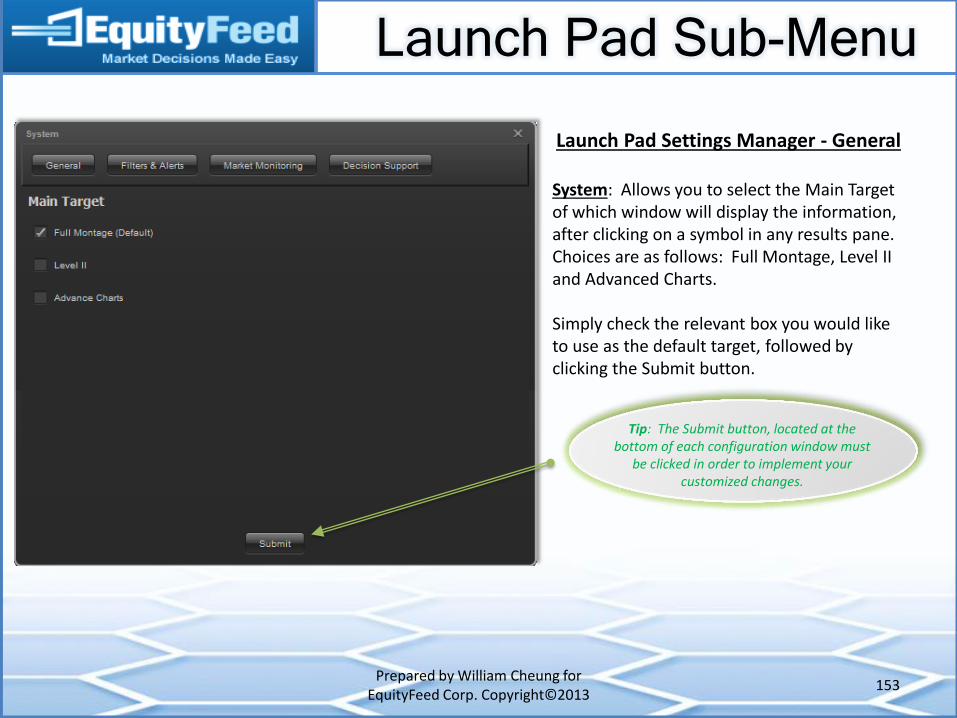
Launch Pad Sub-Menu
Prepared by William Cheung for EquityFeed Corp. Copyright©2013
153
Launch Pad Settings Manager - General
System: Allows you to select the Main Target of which window will display the information, after clicking on a symbol in any results pane. Choices are as follows: Full Montage, Level II and Advanced Charts. Simply check the relevant box you would like to use as the default target, followed by clicking the Submit button.
Tip: The Submit button, located at the bottom of each configuration window must
be clicked in order to implement your customized changes.

Launch Pad Sub-Menu
Prepared by William Cheung for EquityFeed Corp. Copyright©2013
154
Launch Pad Settings Manager - General
3rd Party: Allows you to export the EquityFeed quotes to the selected third party software provider. Choices include EquityFeed, LightSpeed, Real Tick and Sterling. Check the box(es) beside the 3rd party software provider you would like to export the quotes to, followed by clicking the Submit button. *Please note that assistance with integrating the EquityFeed data feed to a 3rd party software provider, should be sought
from the support services of the relevant company (i.e. LightSpeed, Real Tick and/or Sterling support services).
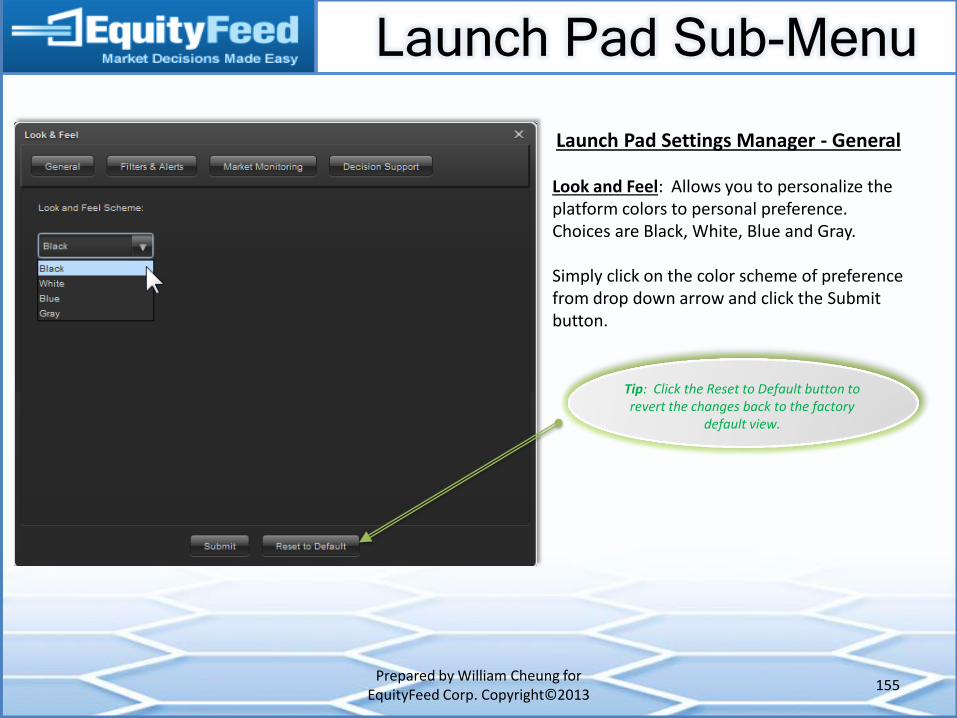
Launch Pad Sub-Menu
Prepared by William Cheung for EquityFeed Corp. Copyright©2013
155
Launch Pad Settings Manager - General
Look and Feel: Allows you to personalize the platform colors to personal preference. Choices are Black, White, Blue and Gray. Simply click on the color scheme of preference from drop down arrow and click the Submit button.
Tip: Click the Reset to Default button to revert the changes back to the factory
default view.
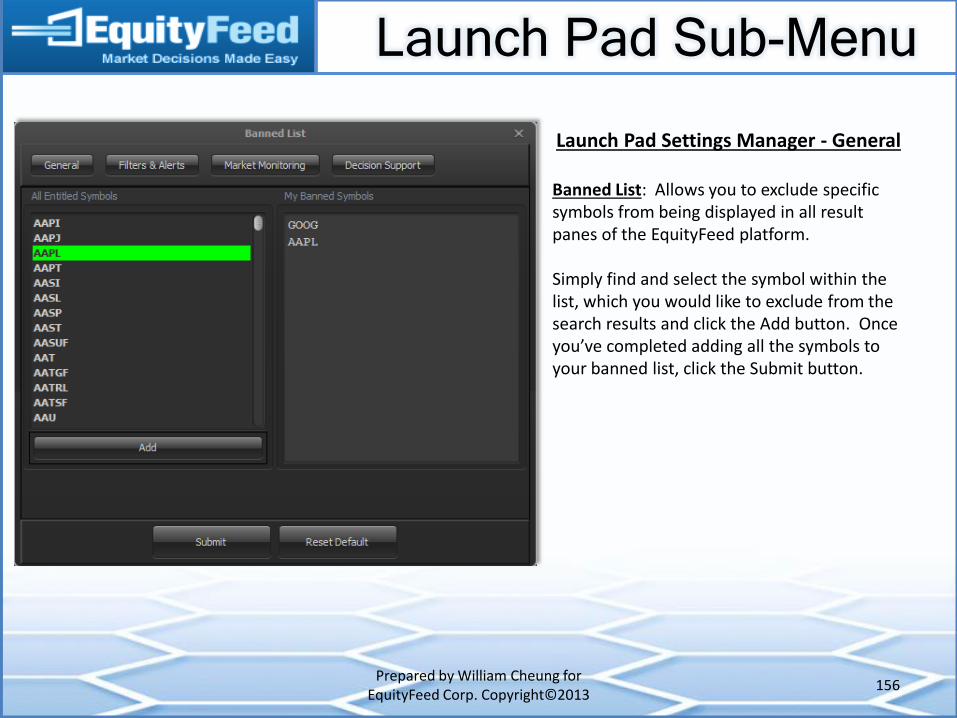
Launch Pad Sub-Menu
Prepared by William Cheung for EquityFeed Corp. Copyright©2013
156
Launch Pad Settings Manager - General
Banned List: Allows you to exclude specific symbols from being displayed in all result panes of the EquityFeed platform. Simply find and select the symbol within the list, which you would like to exclude from the search results and click the Add button. Once you’ve completed adding all the symbols to your banned list, click the Submit button.
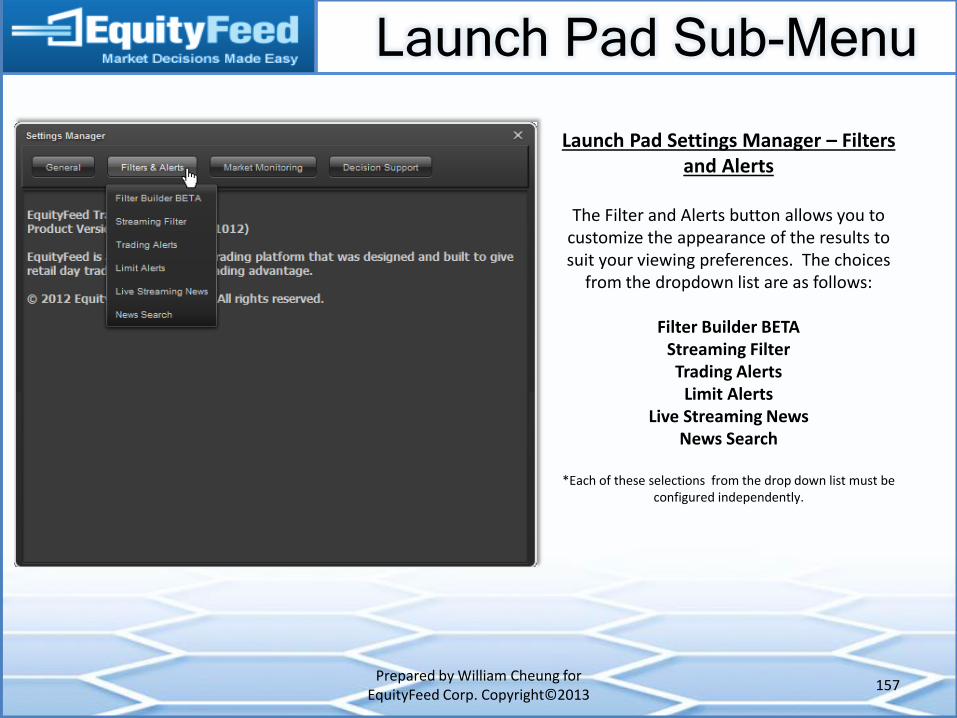
Launch Pad Sub-Menu
Prepared by William Cheung for EquityFeed Corp. Copyright©2013
157
Launch Pad Settings Manager – Filters and Alerts
The Filter and Alerts button allows you to
customize the appearance of the results to suit your viewing preferences. The choices
from the dropdown list are as follows:
Filter Builder BETA Streaming Filter Trading Alerts
Limit Alerts Live Streaming News
News Search
*Each of these selections from the drop down list must be configured independently.
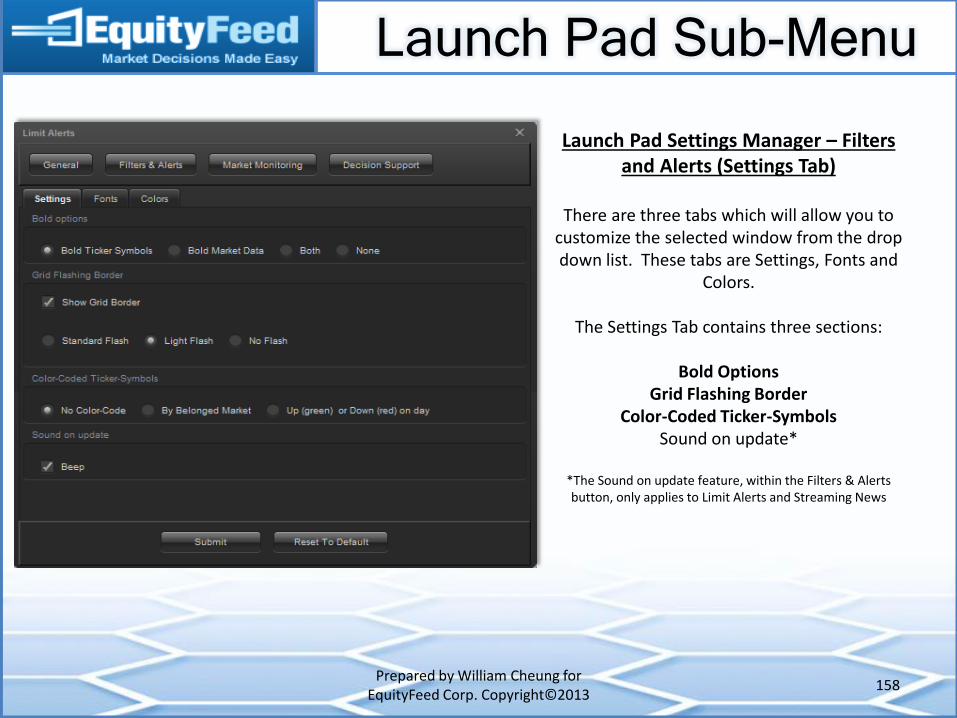
Launch Pad Sub-Menu
Prepared by William Cheung for EquityFeed Corp. Copyright©2013
158
Launch Pad Settings Manager – Filters and Alerts (Settings Tab)
There are three tabs which will allow you to
customize the selected window from the drop down list. These tabs are Settings, Fonts and
Colors.
The Settings Tab contains three sections:
Bold Options Grid Flashing Border
Color-Coded Ticker-Symbols Sound on update*
*The Sound on update feature, within the Filters & Alerts button, only applies to Limit Alerts and Streaming News

Launch Pad Sub-Menu
Prepared by William Cheung for EquityFeed Corp. Copyright©2013
159
Launch Pad Settings Manager – Filters and Alerts (Settings Tab)
Bold Options: Allows you to set the boldness of the font to stand out from other text. The options are to Bold Ticker Symbol, Bold Market Data, bold Both the Ticker Symbol and Market Data or None (no bolding). Grid Flashing Border: Allows you to Show the Grid Border around each field. If this box has been selected, additional options are available to enhance the visibility of the grid with Standard Flash, Light Flash or No Flash. Color-Coded Ticker-Symbols: Allows you to color code the symbols, if preferred. The options are to have No Color-Code, By Belonged Market or Up (green) or Down (red) on the day.

Launch Pad Sub-Menu
Prepared by William Cheung for EquityFeed Corp. Copyright©2013
160
Launch Pad Settings Manager – Filters and Alerts (Fonts Tab)
Font Style: Allows you to modify the font type. The options are Arial, Verdana and Sans Serif. Font Size: Allows you to modify the size of the fonts within the cell grids. Options range from extra-small (X-small) to extra-large (X-large). Cell Padding: Allows you to buffer the amount of space around the text for preferred viewing. Options range from extra-small (X-small) to extra-large (X-large).

Launch Pad Sub-Menu
Prepared by William Cheung for EquityFeed Corp. Copyright©2013
161
Launch Pad Settings Manager – Filters and Alerts (Colors Tab)
Table Color: Allows you to modify the background color within the results pane. The options are Light and Dark. Table Style: Allows you to modify the result rows with either one consistent color or alternating dark/light colors. The options are Single tone for one consistent color or Two tone for alternating dark/light colors.
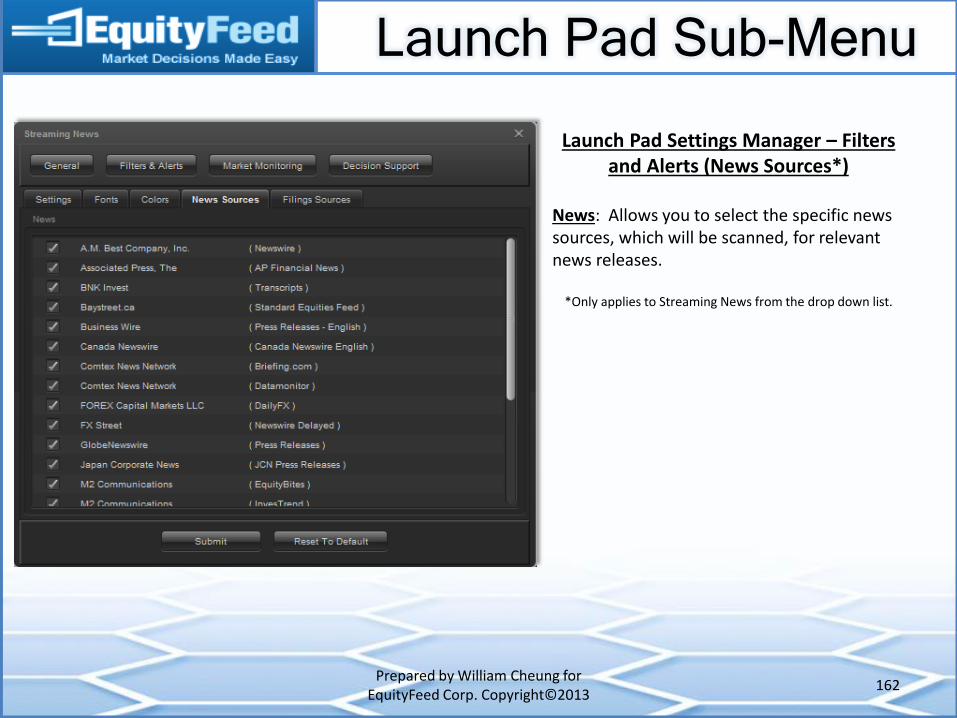
Launch Pad Sub-Menu
Prepared by William Cheung for EquityFeed Corp. Copyright©2013
162
Launch Pad Settings Manager – Filters and Alerts (News Sources*)
News: Allows you to select the specific news sources, which will be scanned, for relevant news releases.
*Only applies to Streaming News from the drop down list.

Launch Pad Sub-Menu
Prepared by William Cheung for EquityFeed Corp. Copyright©2013
163
Launch Pad Settings Manager – Filters and Alerts (Filings Sources*)
SEC Filings: Allows you to select the specific filings sources, which will be scanned for relevant filings releases.
*Only applies to Streaming News from the drop down list.

Launch Pad Sub-Menu
Prepared by William Cheung for EquityFeed Corp. Copyright©2013
164
Launch Pad Settings Manager – Market Monitoring
The Market Monitoring button allows you to
customize the appearance of the results to suit your viewing preferences. The choices
from the dropdown list are as follows:
Market View Sector View Index View ETF View
*Each of these selections from the drop down list must be
configured independently.

Launch Pad Sub-Menu
Prepared by William Cheung for EquityFeed Corp. Copyright©2013
165
Launch Pad Settings Manager – Market Monitoring (Settings Tab)
There are three tabs which will allow you to personalize the selected window(s) from the
drop down list. These tabs are Settings, Fonts and Colors.
The Settings Tab contain three sections:
Bold Options
Grid Flashing Border Color-Coded Ticker-Symbols
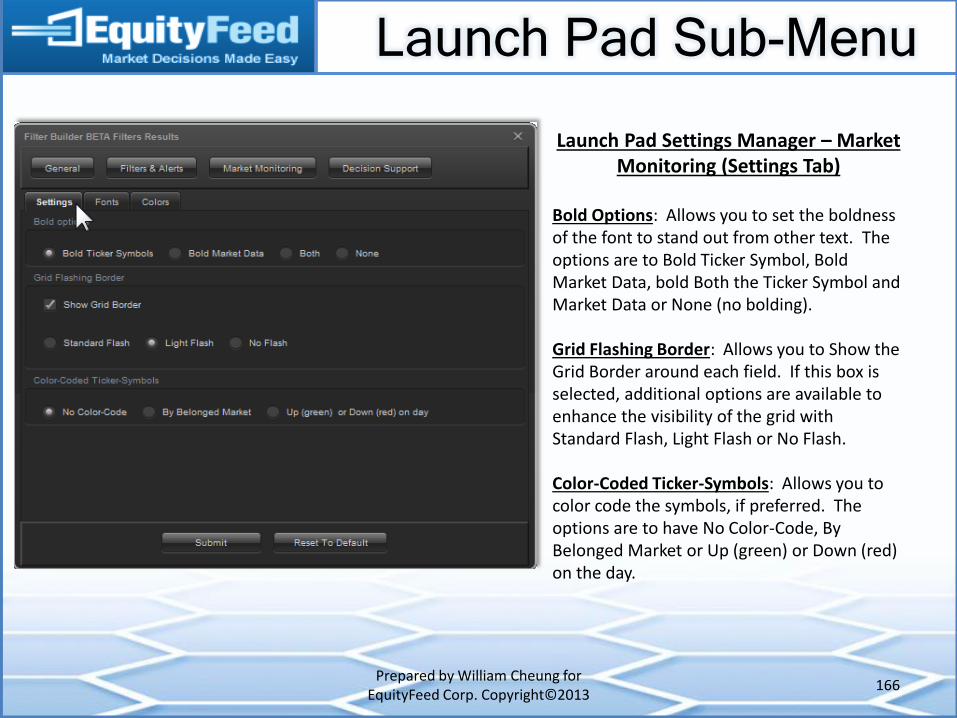
Launch Pad Sub-Menu
Prepared by William Cheung for EquityFeed Corp. Copyright©2013
166
Launch Pad Settings Manager – Market Monitoring (Settings Tab)
Bold Options: Allows you to set the boldness of the font to stand out from other text. The options are to Bold Ticker Symbol, Bold Market Data, bold Both the Ticker Symbol and Market Data or None (no bolding). Grid Flashing Border: Allows you to Show the Grid Border around each field. If this box is selected, additional options are available to enhance the visibility of the grid with Standard Flash, Light Flash or No Flash. Color-Coded Ticker-Symbols: Allows you to color code the symbols, if preferred. The options are to have No Color-Code, By Belonged Market or Up (green) or Down (red) on the day.

Launch Pad Sub-Menu
Prepared by William Cheung for EquityFeed Corp. Copyright©2013
167
Launch Pad Settings Manager – Market Monitoring (Fonts Tab)
Font Style: Allows you to modify the font type. The options are Arial, Verdana and Sans Serif. Font Size: Allows you to modify the size of the fonts within the cell grid. Options range from extra-small (X-small) to extra-large (X-large). Cell Padding: Allows you to buffer the amount of space around the text for preferred viewing. Options range from extra-small (X-small) to extra-large (X-large).

Launch Pad Sub-Menu
Prepared by William Cheung for EquityFeed Corp. Copyright©2013
168
Launch Pad Settings Manager – Market Monitoring (Colors Tab)
Table Color: Allows you to modify the background color of the results pane. The options are Light and Dark. Table Style: Allows you to modify the result rows with either one consistent color or alternating dark/light colors. The options are Single tone for one consistent color or Two tone for alternating dark/light colors.
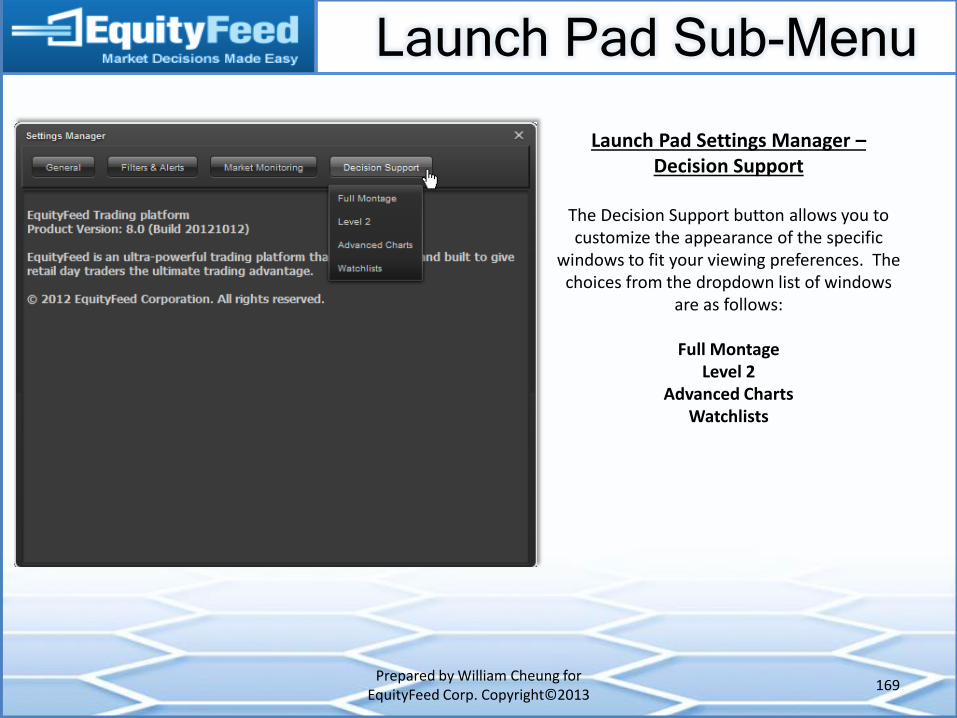
Launch Pad Sub-Menu
Prepared by William Cheung for EquityFeed Corp. Copyright©2013
169
Launch Pad Settings Manager – Decision Support
The Decision Support button allows you to customize the appearance of the specific
windows to fit your viewing preferences. The choices from the dropdown list of windows
are as follows:
Full Montage Level 2
Advanced Charts Watchlists
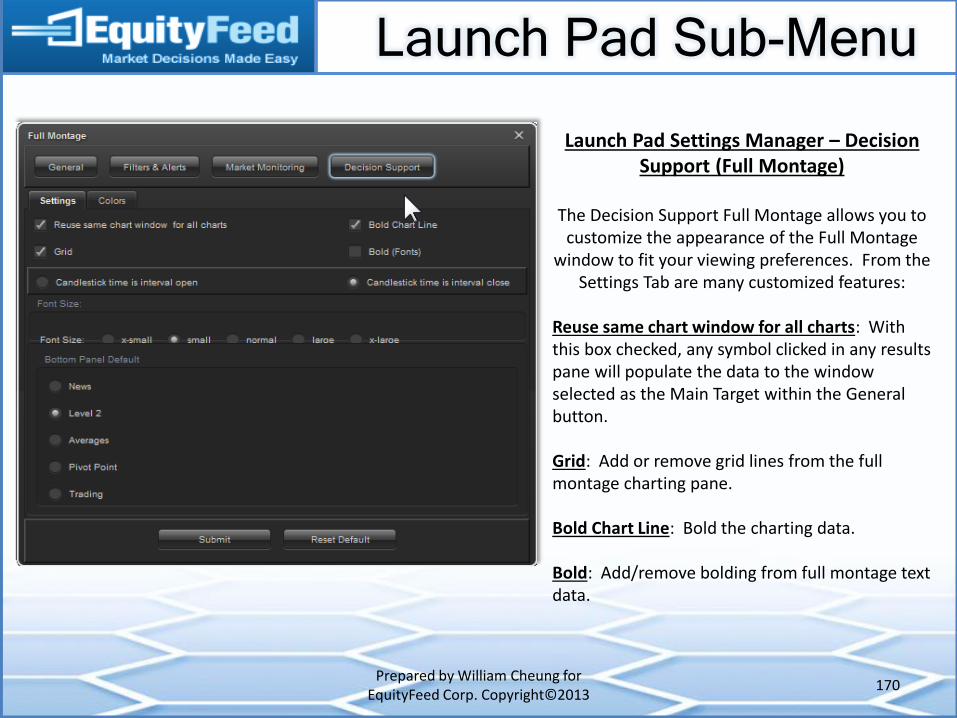
Launch Pad Sub-Menu
Prepared by William Cheung for EquityFeed Corp. Copyright©2013
170
Launch Pad Settings Manager – Decision Support (Full Montage)
The Decision Support Full Montage allows you to
customize the appearance of the Full Montage window to fit your viewing preferences. From the
Settings Tab are many customized features:
Reuse same chart window for all charts: With this box checked, any symbol clicked in any results pane will populate the data to the window selected as the Main Target within the General button. Grid: Add or remove grid lines from the full montage charting pane. Bold Chart Line: Bold the charting data. Bold: Add/remove bolding from full montage text data.
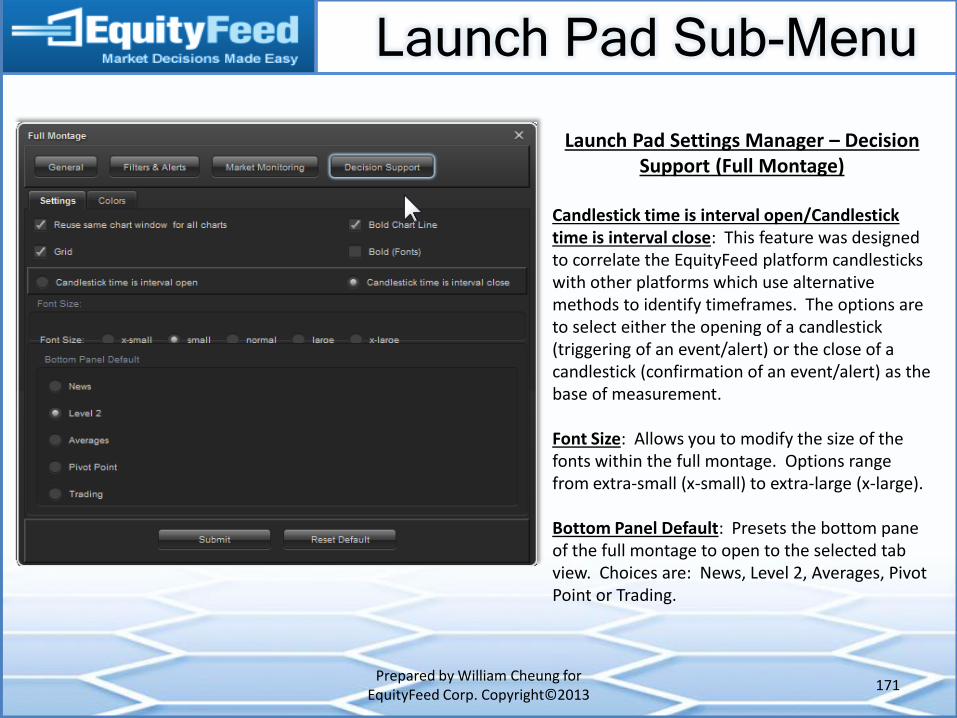
Launch Pad Sub-Menu
Prepared by William Cheung for EquityFeed Corp. Copyright©2013
171
Launch Pad Settings Manager – Decision Support (Full Montage)
Candlestick time is interval open/Candlestick time is interval close: This feature was designed to correlate the EquityFeed platform candlesticks with other platforms which use alternative methods to identify timeframes. The options are to select either the opening of a candlestick (triggering of an event/alert) or the close of a candlestick (confirmation of an event/alert) as the base of measurement. Font Size: Allows you to modify the size of the fonts within the full montage. Options range from extra-small (x-small) to extra-large (x-large). Bottom Panel Default: Presets the bottom pane of the full montage to open to the selected tab view. Choices are: News, Level 2, Averages, Pivot Point or Trading.
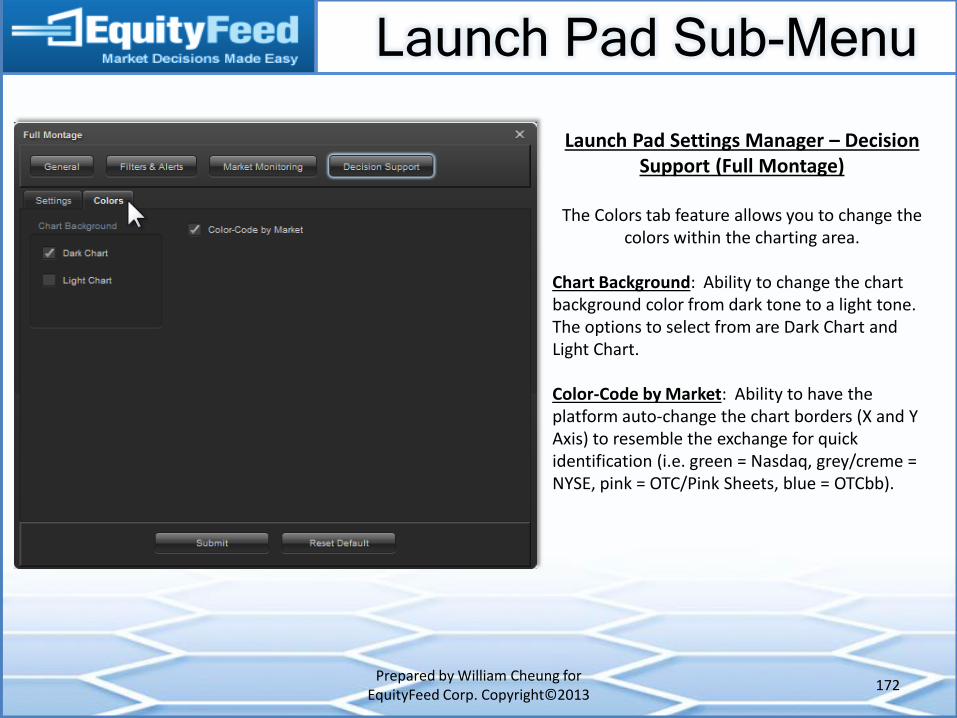
Launch Pad Sub-Menu
Prepared by William Cheung for EquityFeed Corp. Copyright©2013
172
Launch Pad Settings Manager – Decision Support (Full Montage)
The Colors tab feature allows you to change the
colors within the charting area. Chart Background: Ability to change the chart background color from dark tone to a light tone. The options to select from are Dark Chart and Light Chart. Color-Code by Market: Ability to have the platform auto-change the chart borders (X and Y Axis) to resemble the exchange for quick identification (i.e. green = Nasdaq, grey/creme = NYSE, pink = OTC/Pink Sheets, blue = OTCbb).
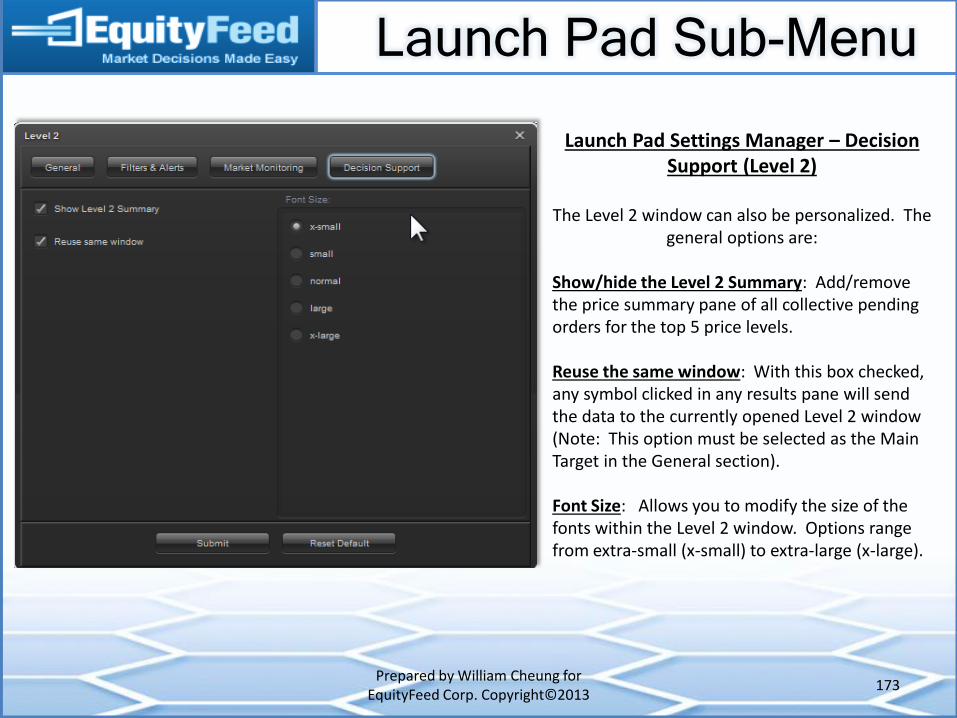
Launch Pad Sub-Menu
Prepared by William Cheung for EquityFeed Corp. Copyright©2013
173
Launch Pad Settings Manager – Decision Support (Level 2)
The Level 2 window can also be personalized. The
general options are: Show/hide the Level 2 Summary: Add/remove the price summary pane of all collective pending orders for the top 5 price levels. Reuse the same window: With this box checked, any symbol clicked in any results pane will send the data to the currently opened Level 2 window (Note: This option must be selected as the Main Target in the General section). Font Size: Allows you to modify the size of the fonts within the Level 2 window. Options range from extra-small (x-small) to extra-large (x-large).
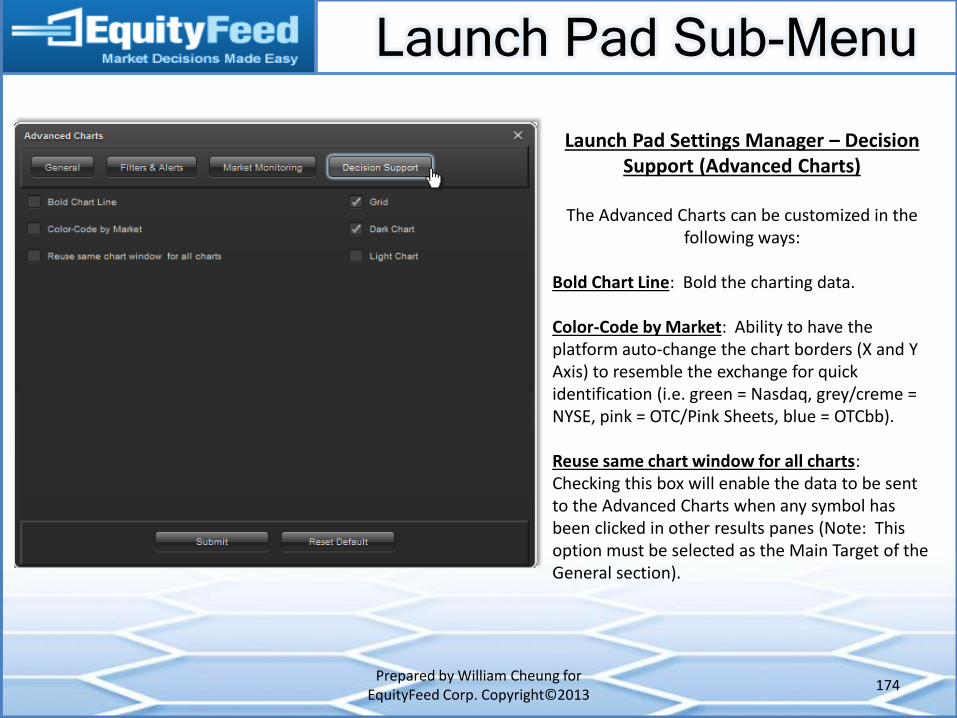
Launch Pad Sub-Menu
Prepared by William Cheung for EquityFeed Corp. Copyright©2013
174
Launch Pad Settings Manager – Decision Support (Advanced Charts)
The Advanced Charts can be customized in the
following ways: Bold Chart Line: Bold the charting data. Color-Code by Market: Ability to have the platform auto-change the chart borders (X and Y Axis) to resemble the exchange for quick identification (i.e. green = Nasdaq, grey/creme = NYSE, pink = OTC/Pink Sheets, blue = OTCbb). Reuse same chart window for all charts: Checking this box will enable the data to be sent to the Advanced Charts when any symbol has been clicked in other results panes (Note: This option must be selected as the Main Target of the General section).
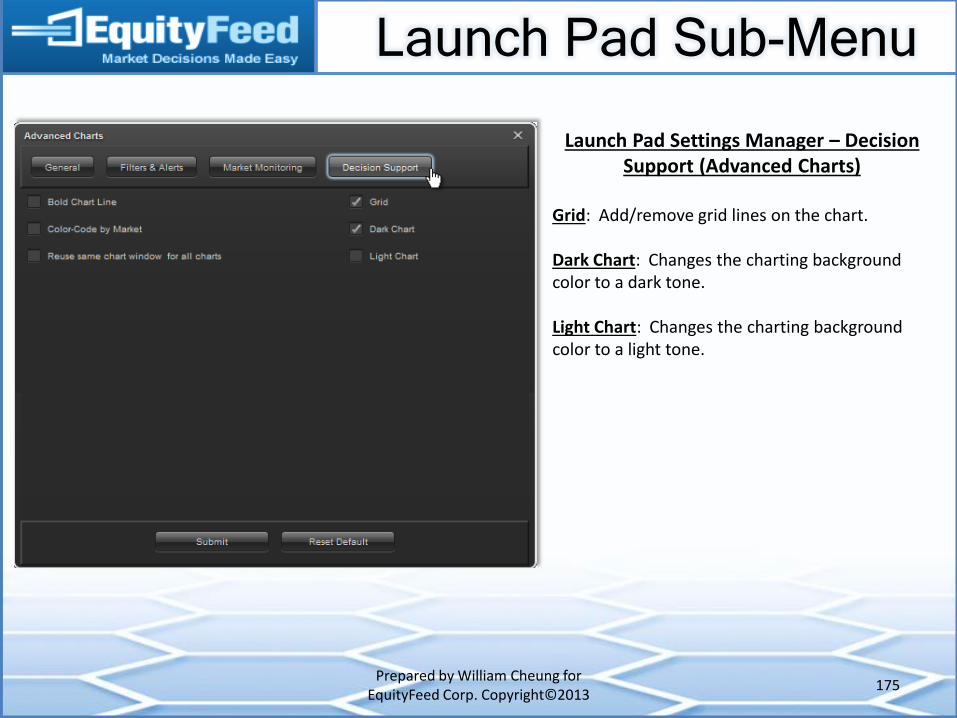
Launch Pad Sub-Menu
Prepared by William Cheung for EquityFeed Corp. Copyright©2013
175
Launch Pad Settings Manager – Decision Support (Advanced Charts)
Grid: Add/remove grid lines on the chart. Dark Chart: Changes the charting background color to a dark tone. Light Chart: Changes the charting background color to a light tone.
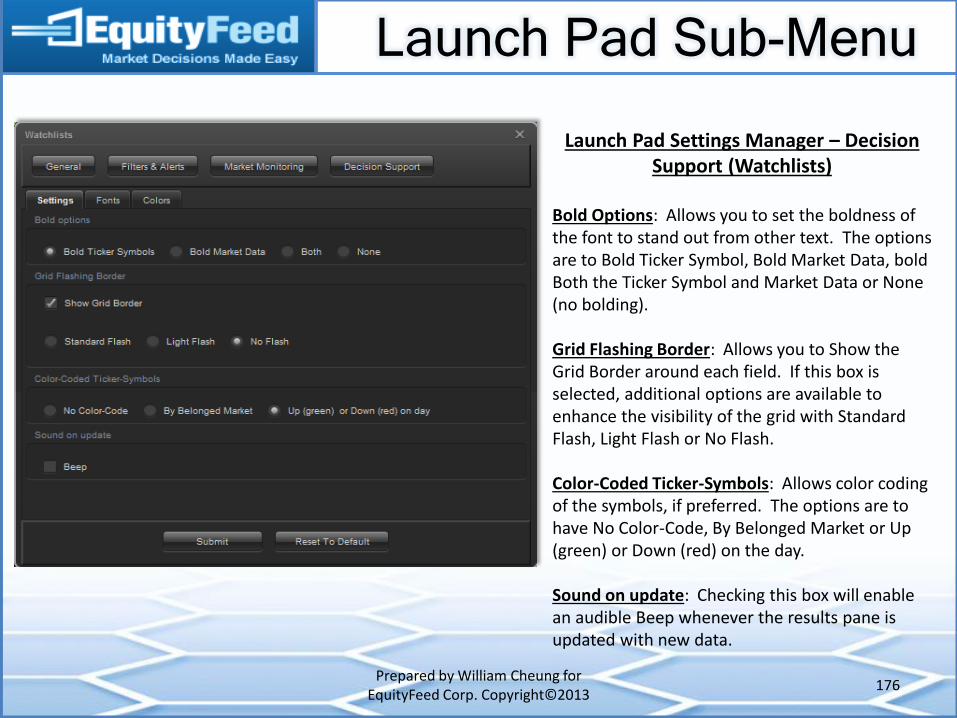
Launch Pad Sub-Menu
Prepared by William Cheung for EquityFeed Corp. Copyright©2013
176
Launch Pad Settings Manager – Decision Support (Watchlists)
Bold Options: Allows you to set the boldness of the font to stand out from other text. The options are to Bold Ticker Symbol, Bold Market Data, bold Both the Ticker Symbol and Market Data or None (no bolding). Grid Flashing Border: Allows you to Show the Grid Border around each field. If this box is selected, additional options are available to enhance the visibility of the grid with Standard Flash, Light Flash or No Flash. Color-Coded Ticker-Symbols: Allows color coding of the symbols, if preferred. The options are to have No Color-Code, By Belonged Market or Up (green) or Down (red) on the day. Sound on update: Checking this box will enable an audible Beep whenever the results pane is updated with new data.

Launch Pad Sub-Menu
Prepared by William Cheung for EquityFeed Corp. Copyright©2013
177
Launch Pad Settings Manager – Decision Support (Watchlists)
Font Style: Allows you to modify the font type. The options are Arial, Verdana and Sans Serif. Font Size: Allows you to modify the size of the fonts within the cell grid. Options range from extra-small (X-small) to extra-large (X-large). Cell Padding: Allows you to buffer the amount of space around the text for preferred viewing. Options range from extra-small (X-small) to extra-large (X-large).

Launch Pad Sub-Menu
Prepared by William Cheung for EquityFeed Corp. Copyright©2013
178
Launch Pad Settings Manager – Decision Support (Watchlists)
Table Color: Allows you to modify the background color of the results pane. The options are Light and Dark. Table Style: Allows you to modify the result rows with either one consistent color or alternating dark/light colors. The options are Single tone for one consistent color or Two tone for alternating dark/light colors.
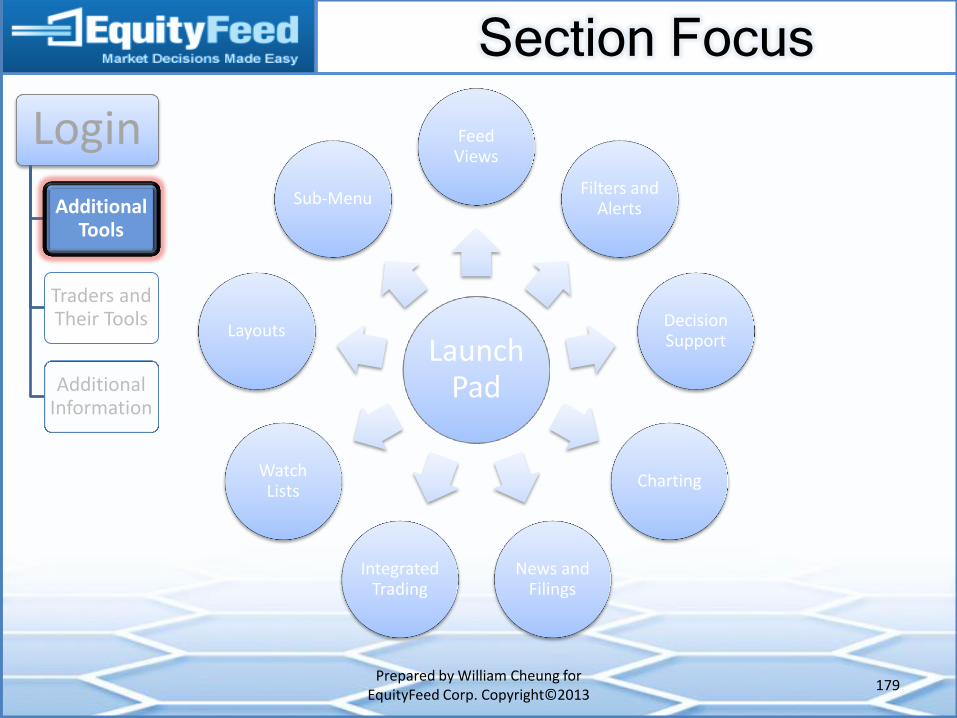
Section Focus
Prepared by William Cheung for EquityFeed Corp. Copyright©2013
179
Launch Pad
Feed Views
Filters and Alerts
Decision Support
Charting
News and Filings
Integrated Trading
Watch Lists
Layouts
Sub-Menu
Login
Additional Tools
Traders and Their Tools
Additional Information
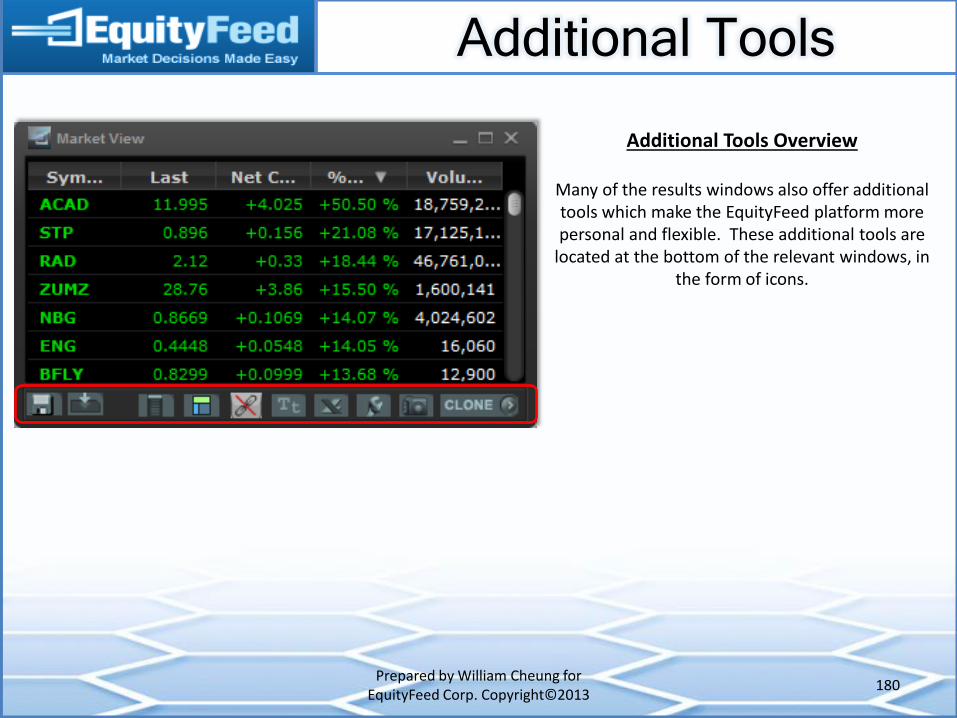
Additional Tools
Prepared by William Cheung for EquityFeed Corp. Copyright©2013
180
Additional Tools Overview
Many of the results windows also offer additional tools which make the EquityFeed platform more personal and flexible. These additional tools are
located at the bottom of the relevant windows, in the form of icons.
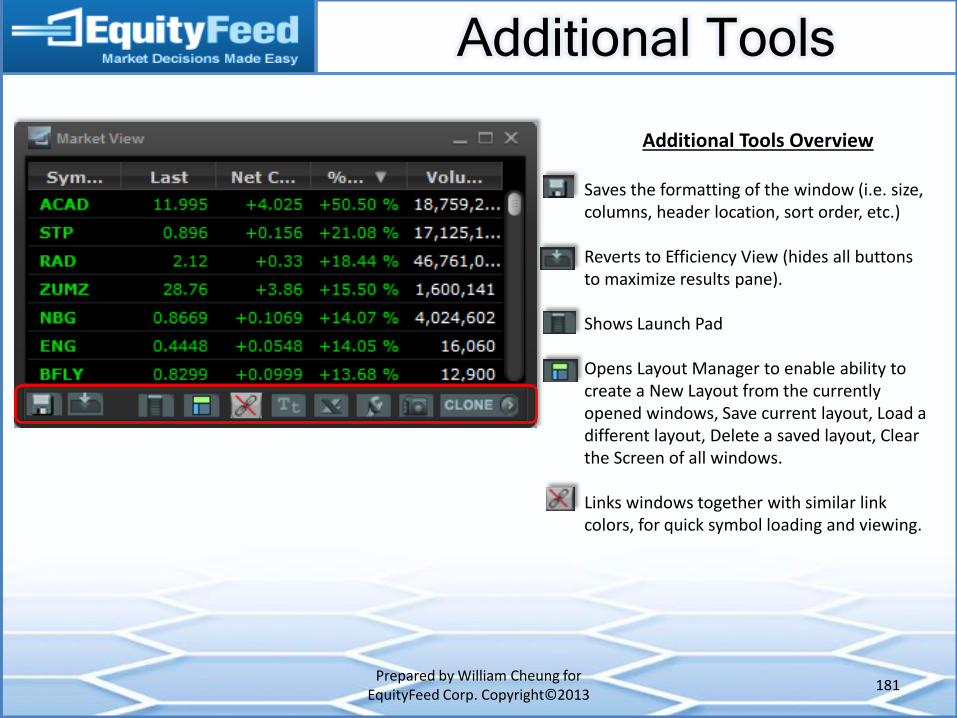
Additional Tools
Prepared by William Cheung for EquityFeed Corp. Copyright©2013
181
Additional Tools Overview
Saves the formatting of the window (i.e. size, columns, header location, sort order, etc.) Reverts to Efficiency View (hides all buttons to maximize results pane). Shows Launch Pad Opens Layout Manager to enable ability to create a New Layout from the currently opened windows, Save current layout, Load a different layout, Delete a saved layout, Clear the Screen of all windows. Links windows together with similar link colors, for quick symbol loading and viewing.
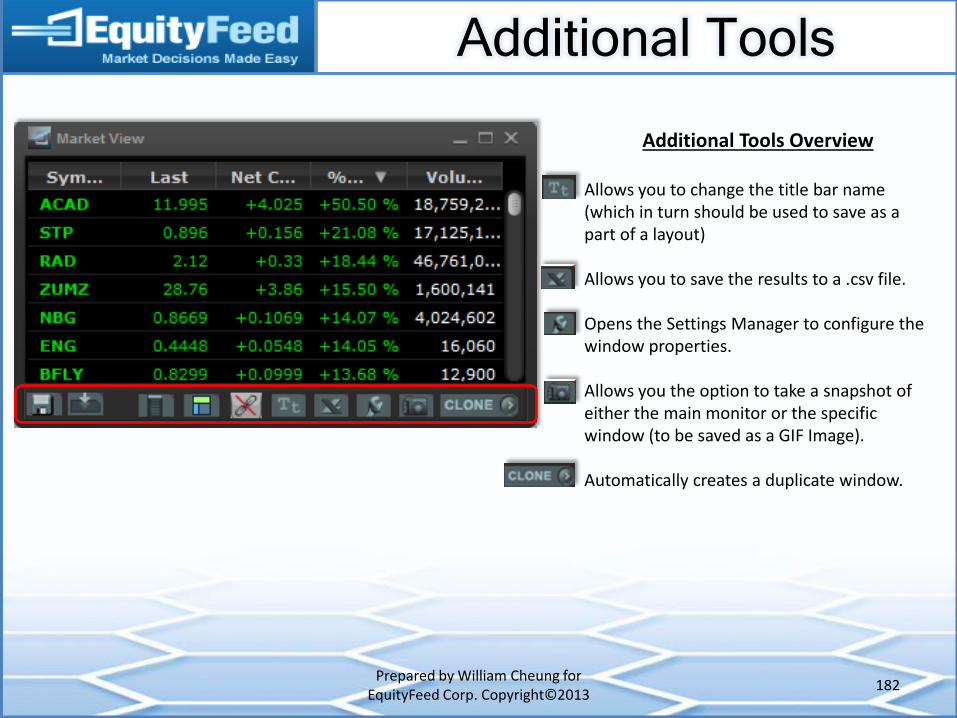
Additional Tools
Prepared by William Cheung for EquityFeed Corp. Copyright©2013
182
Additional Tools Overview
Allows you to change the title bar name (which in turn should be used to save as a part of a layout) Allows you to save the results to a .csv file. Opens the Settings Manager to configure the window properties. Allows you the option to take a snapshot of either the main monitor or the specific window (to be saved as a GIF Image). Automatically creates a duplicate window.
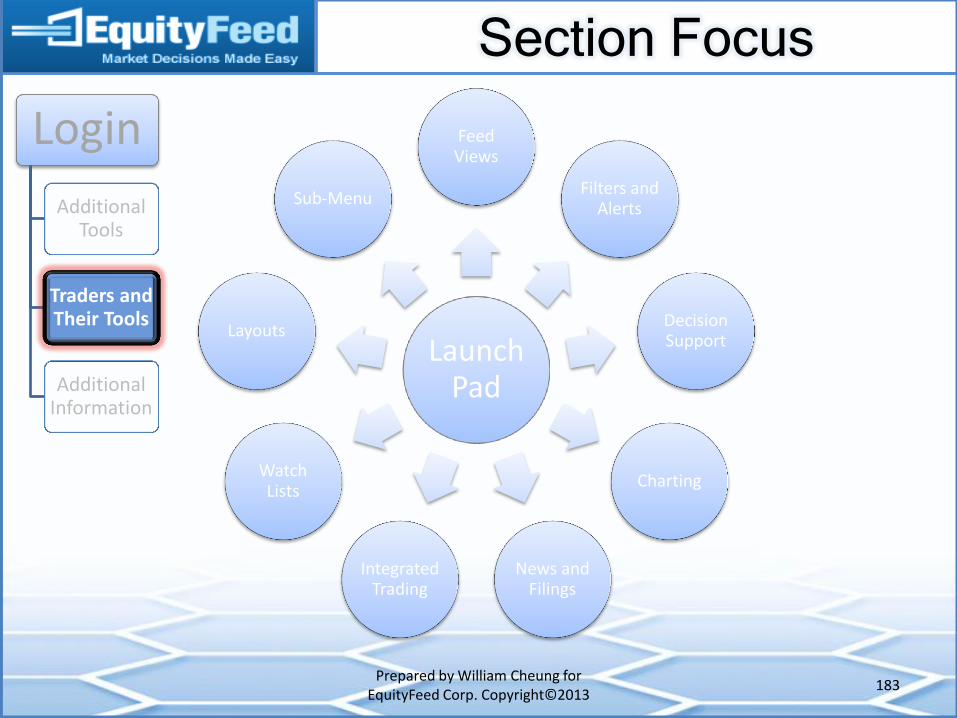
Section Focus
Prepared by William Cheung for EquityFeed Corp. Copyright©2013
183
Launch Pad
Feed Views
Filters and Alerts
Decision Support
Charting
News and Filings
Integrated Trading
Watch Lists
Layouts
Sub-Menu
Login
Additional Tools
Traders and Their Tools
Additional Information
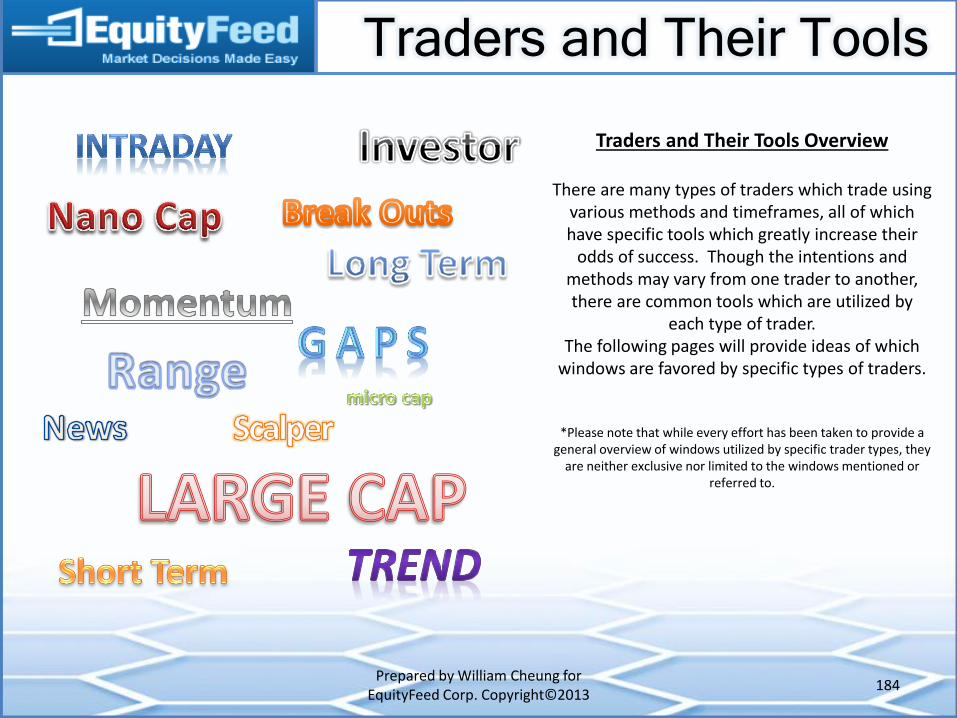
Traders and Their Tools
Prepared by William Cheung for EquityFeed Corp. Copyright©2013
184
Traders and Their Tools Overview
There are many types of traders which trade using various methods and timeframes, all of which have specific tools which greatly increase their
odds of success. Though the intentions and methods may vary from one trader to another, there are common tools which are utilized by
each type of trader. The following pages will provide ideas of which
windows are favored by specific types of traders.
*Please note that while every effort has been taken to provide a general overview of windows utilized by specific trader types, they
are neither exclusive nor limited to the windows mentioned or referred to.
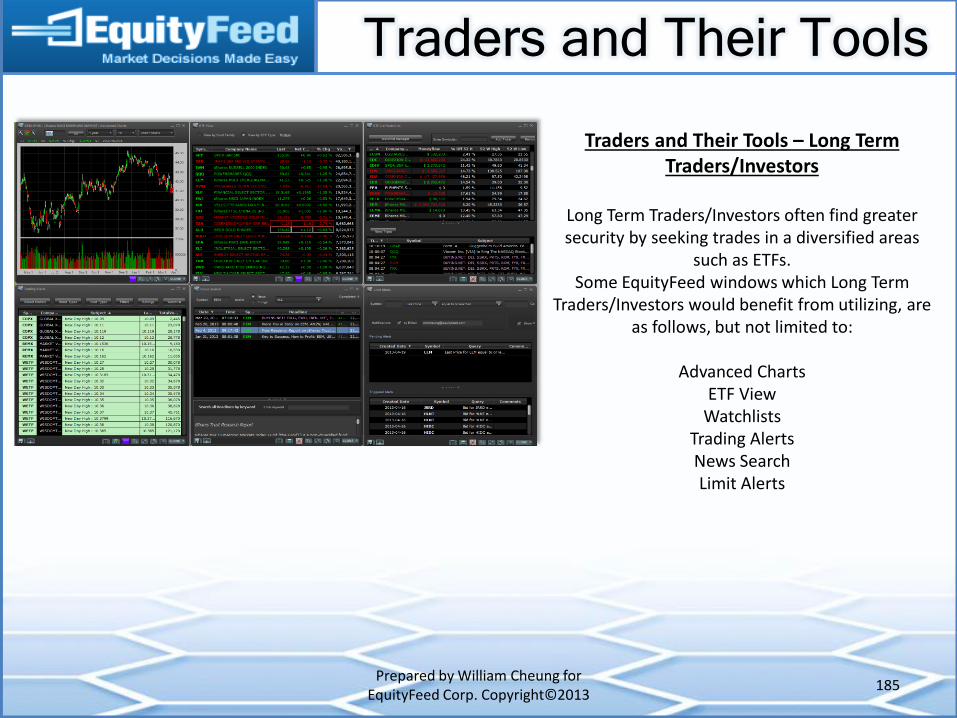
Traders and Their Tools
Prepared by William Cheung for EquityFeed Corp. Copyright©2013
185
Traders and Their Tools – Long Term Traders/Investors
Long Term Traders/Investors often find greater security by seeking trades in a diversified areas
such as ETFs. Some EquityFeed windows which Long Term
Traders/Investors would benefit from utilizing, are as follows, but not limited to:
Advanced Charts
ETF View Watchlists
Trading Alerts News Search Limit Alerts
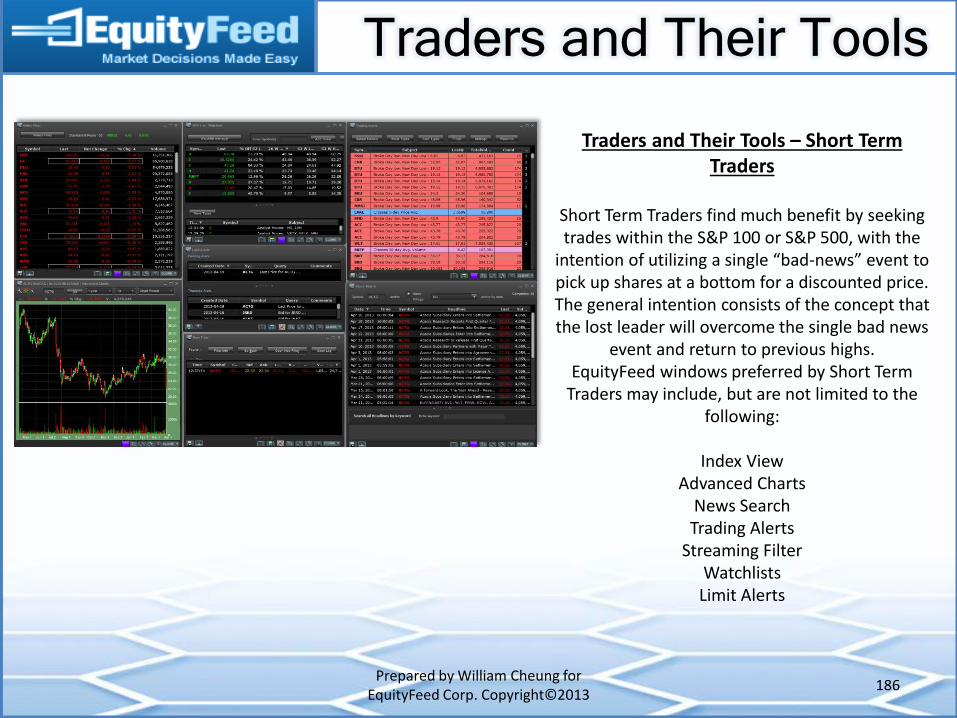
Traders and Their Tools
Prepared by William Cheung for EquityFeed Corp. Copyright©2013
186
Traders and Their Tools – Short Term Traders
Short Term Traders find much benefit by seeking trades within the S&P 100 or S&P 500, with the
intention of utilizing a single “bad-news” event to pick up shares at a bottom for a discounted price. The general intention consists of the concept that the lost leader will overcome the single bad news
event and return to previous highs. EquityFeed windows preferred by Short Term
Traders may include, but are not limited to the following:
Index View
Advanced Charts News Search Trading Alerts
Streaming Filter Watchlists
Limit Alerts
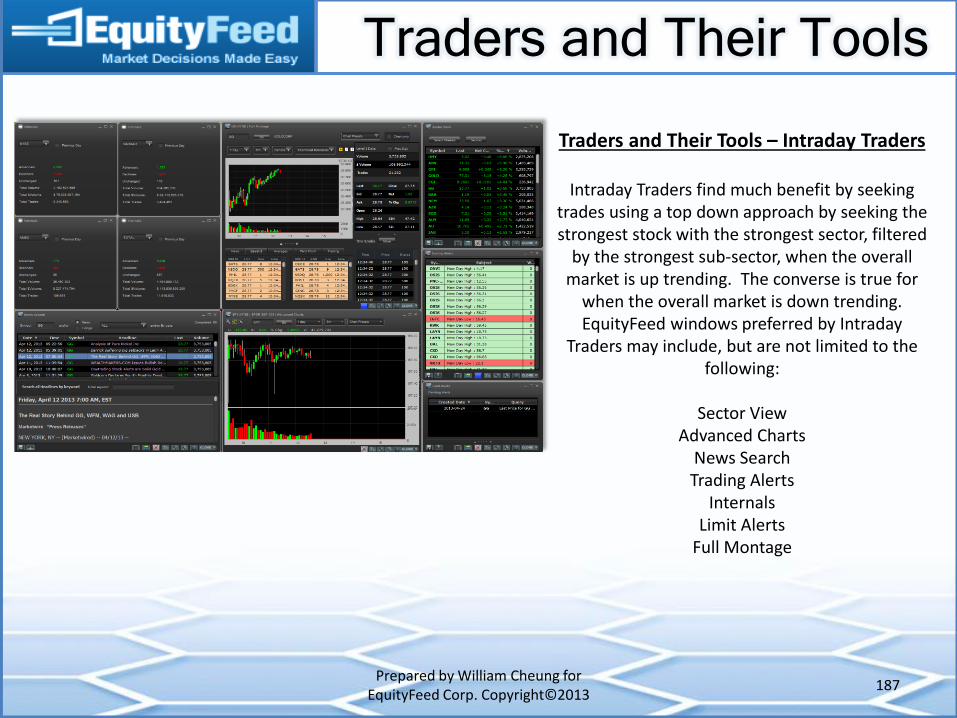
Traders and Their Tools
Prepared by William Cheung for EquityFeed Corp. Copyright©2013
187
Traders and Their Tools – Intraday Traders
Intraday Traders find much benefit by seeking trades using a top down approach by seeking the strongest stock with the strongest sector, filtered
by the strongest sub-sector, when the overall market is up trending. The converse is true for
when the overall market is down trending. EquityFeed windows preferred by Intraday
Traders may include, but are not limited to the following:
Sector View
Advanced Charts News Search Trading Alerts
Internals Limit Alerts
Full Montage
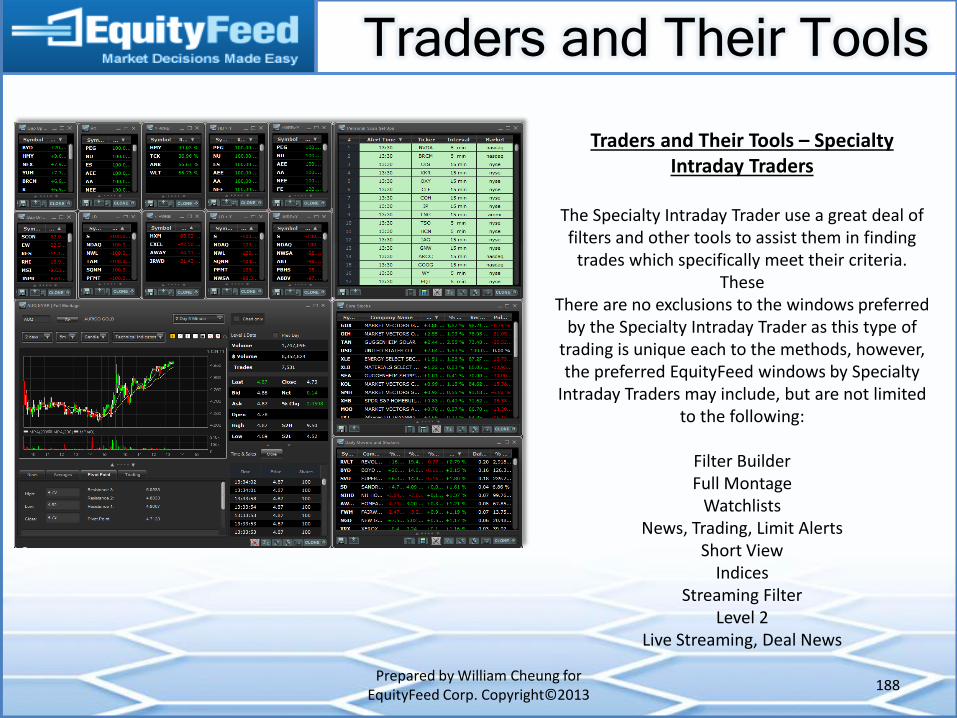
Traders and Their Tools
Prepared by William Cheung for EquityFeed Corp. Copyright©2013
188
Traders and Their Tools – Specialty Intraday Traders
The Specialty Intraday Trader use a great deal of filters and other tools to assist them in finding
trades which specifically meet their criteria. These
There are no exclusions to the windows preferred by the Specialty Intraday Trader as this type of
trading is unique each to the methods, however, the preferred EquityFeed windows by Specialty
Intraday Traders may include, but are not limited to the following:
Filter Builder Full Montage
Watchlists News, Trading, Limit Alerts
Short View Indices
Streaming Filter Level 2
Live Streaming, Deal News
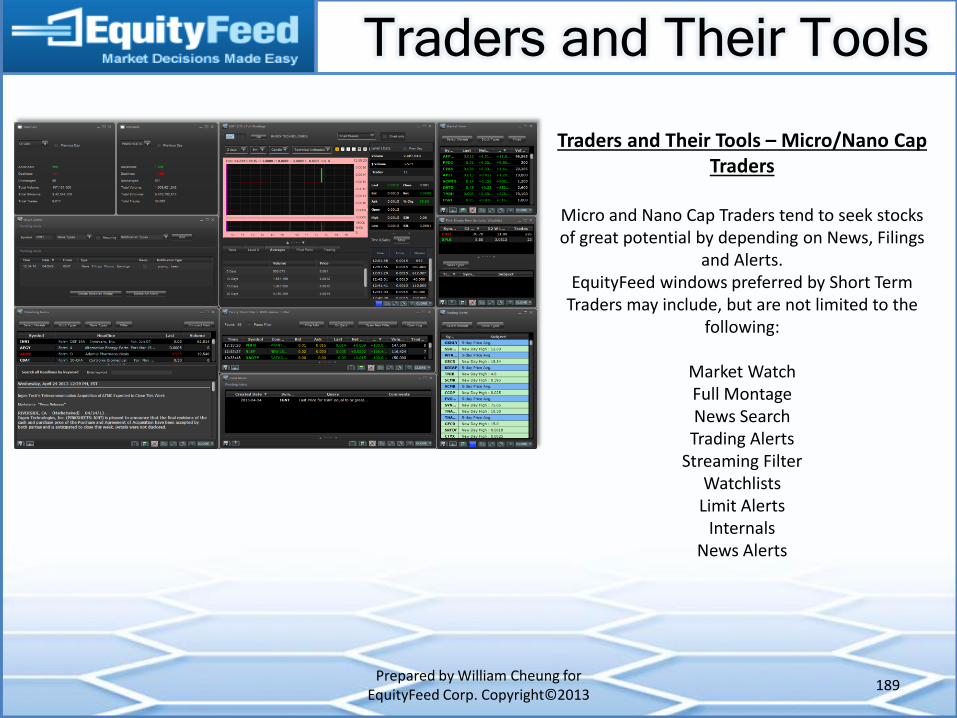
Traders and Their Tools
Prepared by William Cheung for EquityFeed Corp. Copyright©2013
189
Traders and Their Tools – Micro/Nano Cap Traders
Micro and Nano Cap Traders tend to seek stocks of great potential by depending on News, Filings
and Alerts. EquityFeed windows preferred by Short Term
Traders may include, but are not limited to the following:
Market Watch Full Montage News Search Trading Alerts
Streaming Filter Watchlists
Limit Alerts Internals
News Alerts
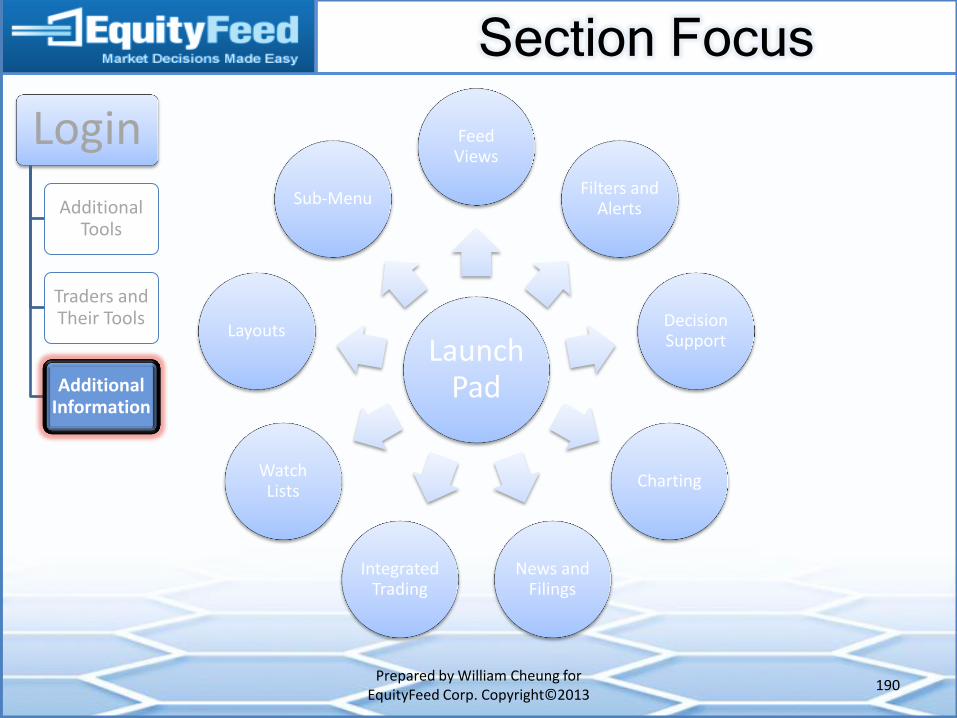
Section Focus
Prepared by William Cheung for EquityFeed Corp. Copyright©2013
190
Launch Pad
Feed Views
Filters and Alerts
Decision Support
Charting
News and Filings
Integrated Trading
Watch Lists
Layouts
Sub-Menu
Login
Additional Tools
Traders and Their Tools
Additional Information
Additional Information
Prepared by William Cheung for EquityFeed Corp. Copyright©2013
191
Conclusion
We hope this User Guide will compliment your use of the most powerful scanning, filtering and alerting software tool in the industry – the EquityFeed Platform.
May it serve you well in your market awareness and mastery, as well as your trading profits.
While every effort will be taken to continually update this User Guide at appropriate intervals, please feel free to email any questions or suggestions to
Thank you for choosing EquityFeed for all your data feed needs!