Embed Size (px)
Citation preview
63
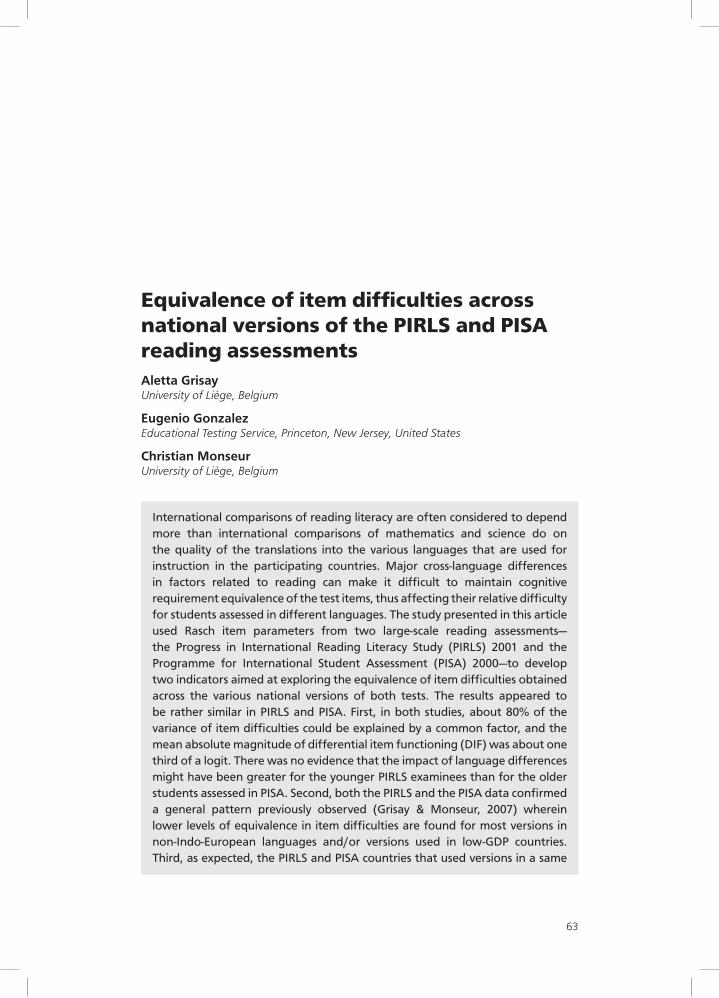
Equivalence of item difficulties across national versions of the PIRLs and PIsA reading assessmentsAletta GrisayUniversity of Liège, Belgium
eugenio GonzalezEducational Testing Service, Princeton, New Jersey, United States
Christian monseurUniversity of Liège, Belgium
International comparisons of reading literacy are often considered to depend more than international comparisons of mathematics and science do on the quality of the translations into the various languages that are used for instruction in the participating countries. Major cross-language differences in factors related to reading can make it difficult to maintain cognitive requirement equivalence of the test items, thus affecting their relative difficulty for students assessed in different languages. The study presented in this article used Rasch item parameters from two large-scale reading assessments—the Progress in International Reading Literacy Study (PIRLS) 2001 and the Programme for International Student Assessment (PISA) 2000—to develop two indicators aimed at exploring the equivalence of item difficulties obtained across the various national versions of both tests. The results appeared to be rather similar in PIRLS and PISA. First, in both studies, about 80% of the variance of item difficulties could be explained by a common factor, and the mean absolute magnitude of differential item functioning (DIF) was about one third of a logit. There was no evidence that the impact of language differences might have been greater for the younger PIRLS examinees than for the older students assessed in PISA. Second, both the PIRLS and the PISA data confirmed a general pattern previously observed (Grisay & Monseur, 2007) wherein lower levels of equivalence in item difficulties are found for most versions in non-Indo-European languages and/or versions used in low-GDP countries. Third, as expected, the PIRLS and PISA countries that used versions in a same
64
IERI MONOGRAPH SERIES: ISSUES AND METHODOLOGIES IN LARGE-SCALE ASSESSMENTS
language (either the English source version or a common version developed co-operatively by several countries sharing the same language) typically obtained more equivalent item difficulties than countries using versions in different languages. The “cost” of translation, in terms of equivalence, could be tentatively assessed by comparing the values of the indicators obtained in the various regions of a single English-speaking country (Australia) to other relevant groups of countries. Finally, it was observed that equivalence issues mainly concerned individual items rather than the sets of items associated with particular reading passages—a finding which does not confirm the common criticism that the selection of passages is a major source of bias in international reading assessments.
INTRoDuCTIoN AND BACKGRouND To THe STuDYSince the International Association for the Evaluation of Educational Achievement (IEA) began conducting its activities in the 1960s, various commentators have expressed concern about whether reading assessments that use translated instruments in countries with diverse cultures can be considered comparable. In the report of the findings of the first IEA Reading Comprehension Study (Thorndike, 1973), the author commented that while reading could probably be considered a less curriculum-oriented domain than mathematics and science, cultural and linguistic differences were likely to pose a greater threat to the equivalence of reading assessments:
In the field of reading, there seems to be much more consensus [than in other subject areas] as to the objectives of instruction. Each country would accept without question, we believe, the proposition that it is desirable that children learn to read with complete comprehension materials of a variety of styles and contents and to read them at a relatively rapid rate. The particular emphasis on different types of reading materials—expository as opposed to literary, prose as opposed to poetry, etc.—might vary to some extent from country to country and from school to school within a country, but there would be general agreement that children should be able to get meaning efficiently from written material of various styles and content areas. On the other hand, the preparation of genuinely equivalent tests in reading, where the essence of the task involves very intimately the language of a particular country, would seem to present very serious difficulties. (p. 14)
Interestingly, the group of researchers who conducted the IEA Six Subject Study considered that splitting mother language achievement into two components (reading comprehension and understanding literature) would be a more appropriate method than including both aspects in a single reading literacy assessment, as has been the case in more recent assessments such as the IEA Reading Literacy Study (RLS), IEA Progress in Reading Literacy Study (PIRLS), and the Organisation for Economic Co-operation and Development (OECD) Programme for International Student Assessment (PISA). One of the reasons the researchers gave when debating this matter was that literature is a particularly risky domain because “… aesthetic nuances of style seemed difficult to preserve from one language to another,” whereas reading comprehension
65
EQUIVALENCE OF ITEM DIFFICULTIES ACROSS NATIONAL VERSIONS OF READING ASSESSMENTS
allows one “to focus upon the cognitive content of the passage, and to forego most efforts to get at any appraisal of style, feeling, tone, or literary techniques” (Thorndike, 1973, p. 19).
Accordingly, the reading comprehension material of the first IEA/RCS study was mainly composed of expository prose passages, with the student primarily expected to understand the information conveyed by the text, and it comprised only items that would be classified as “locate information” and “interpret” in the PISA 2000 reading framework. In contrast, it was anticipated that the students’ patterns of response would be culturally variable in the IEA/Literature study, which comprised six literary passages, with items that mainly assessed dimensions defined in PISA as “reflect on the content of the text” and “reflect on the form of the text.”
In both these early IEA studies, the researchers conducted detailed analyses on all items that showed unusual statistics in specific countries (e.g., when one or more of the distractors used in a multiple-choice item attracted a significantly higher or lesser proportion of respondents in one or more countries than in other countries). The authors also checked if the instruments had approximately the same spread of item difficulties in each country and about the same alpha reliability.
In discussing the psychometric properties of the reading comprehension test, Thorndike (1973) concluded that there was a “slight tendency for the reliabilities to be higher in the English-speaking countries” (p. 54). He attributed this outcome to the fact that “the basic and editorial work on the items was done on the English language version” (p. 54) and that only some of the materials had been field-trialled in each of the other languages. In his view, however, “the tests functioned relatively satisfactorily in translation” (p. 55), except in two countries—India and Iran. There, the reliabilities were much lower, and, for too many items, the percentage of correct answers did not fall above the chance level, possibly because of the low performance of the Indian and Iranian students, or because of translation or cultural problems.
In the literature study, and contrary to the test-developers’ expectations, the test items appeared to have rather similar psychometric characteristics in most countries (i.e., the items with low discrimination in English countries also tended to show poor discrimination in other languages), and to be less sensitive than anticipated to curricular or cultural differences (Purves, 1973). In this respect, the items functioned much like the items comprising the reading comprehension instrument. In fact, the correlation between the literature and the reading comprehension scores was extremely high in all countries, as was the case in PISA 2000 for the correlations between the “reflect” scale scores and the other reading scale scores. Moreover, the researchers found no clear correlation between the levels of proficiency of students relative to groups of literature items measuring particular aspects of their response to a text (e.g., test items related to readers’ perception of text style) and the dominant “patterns of response to literature” in their countries (e.g., teachers’ emphasis on text style), as measured by the students’ and the teachers’ questionnaire instruments.
66
IERI MONOGRAPH SERIES: ISSUES AND METHODOLOGIES IN LARGE-SCALE ASSESSMENTS
Two decades after the Six Subject Study, Rasch analyses were conducted for the first time in an international reading assessment, namely, the IEA Reading Literacy Study (Elley, 1992), in order to identify and drop items with differential item functioning (DIF). Half of the items initially developed survived the field trial phase, and a few additional ones were deleted during the main study phase. As a further check, the national difficulties of the items (expressed as percentages of correct answers) were plotted against the international difficulties for each country. The mean rank order correlation of item difficulties was 0.92 for Population A (9-year-old students) and 0.91 for Population B (14-year-old students). The results of these analyses led Elley (1992) to draw this conclusion:
While some minor features may still be found to exist which a few observers would perceive as lending a cultural bias, the statistics reveal that students in each country did in fact respond in a similar fashion to the items, allowing for differences in ability. Moreover, the items did behave in similar fashion in each country. … The reader can have reasonable confidence that the test results were as comparable across countries as in any standardised test within a single country. (p. 97)
However, this inference was perhaps overly optimistic. In both populations, the rank correlations between national and international item difficulties tended to be slightly higher in the English-speaking and most of the European countries than in the Asian and developing countries. The lowest coefficients were observed for Population B in the Philippines (0.84), Hong Kong (0.82), Botswana (0.77), and Thailand (0.74), suggesting that the assessment instrument behaved differently in Western than in other cultures.
In the OECD PISA study, the equivalence of item difficulties across national versions (expressed as Rasch difficulty estimates) was explored for the three domains assessed: reading (Grisay & Monseur, 2007) and science and mathematics (Grisay, de Jong, Gebhardt, Berezner, & Halleux-Monseur, 2007). The indicators of equivalence used in these two studies were the commonalities obtained from principal component analyses, in which the item difficulty estimates were used as observations and the various versions were used as variables. The variance in item difficulties explained by the main factor tended to be higher in mathematics (91% of the total variance) than in reading (82%) and science (79%). The commonalities tended to be lower in all three domains for versions translated into non-Indo-European languages (particularly Asian and Middle-East languages) as well as for national versions used in the developing countries.
In a more recent study on the equivalence of item difficulties of the PISA 2006 science assessment across the participating countries, Monseur and Halleux (2009) used the mean absolute deviations of national from international item difficulties as an indicator of the global amount of DIF in each national version. Because the PISA 2006 database contains a relatively large number of countries that used more than one national language in the assessment, the authors were able to use this subset of countries in an analysis of variance (ANOVA) model, in order to disentangle the components of variance of the global indicator into the following: a main effect
67
EQUIVALENCE OF ITEM DIFFICULTIES ACROSS NATIONAL VERSIONS OF READING ASSESSMENTS
due to countries’ cultural and curricular differences, a main effect due to language differences between the versions used in multilingual countries, a main effect due to possible differences in the functioning of the various test units used in the assessment (stimuli and accompanying questions), and the related interaction effects.
Given the similarities in the results from these different studies, it seemed of interest to expand the analysis by comparing the equivalence of item difficulties in a same domain (reading), but this time using data from students at the primary and secondary levels. The databases from PIRLS 2001 and PISA 2000 were retained. PIRLS 2001 sampled from a population defined as students attending the fourth year of primary education in each participating country, a point at which most students are 9 or 10 years old and are expected to have acquired relatively fluent reading abilities, and so are less dependent on their initial learning of decoding skills. PISA 2000 sampled from an age population, defined as 15-year-old students, in an attempt to measure students’ reading proficiency at a time when, in most countries, students are reaching the end of their compulsory schooling.
The two assessments differed somewhat as regards the types of texts used. PIRLS included mainly continuous literary and informative texts, while PISA included both continuous prose (both literary and informative) and non-continuous documents. The processes measured (retrieving information, inferring, interpreting and integrating information, and evaluating the content and the language) were relatively similar, as was the proportion of items presented in multiple-choice and open-ended formats. A total of 43 countries participated in PISA 2000; 35 participated in PIRLS 2001. The two sets of participating countries differed significantly, with a majority of industrialized, high-GDP countries in PISA, and only a minority of developing countries. By contrast, the participation in PIRLS was more equally balanced between industrialized and developing countries.
In this study, two indicators were developed to explore the equivalence of the reading assessment instruments employed respectively in PIRLS 2001 and PISA 2000: an indicator of commonality of item difficulty (i.e., the proportion of variance in national parameters that can be explained by the international dimension in each national version), and an indicator of global magnitude of DIF (i.e., the mean absolute value of the difference between national and international parameters, expressed in logits).1 Although these two indicators are highly correlated (about 0.90 in both studies), they are not identical. In particular, the indicator of global magnitude of DIF includes information on the dispersion of DIF in each country—information that is not included in the commonality indicator.
1 The item response theory (IRT) models used in the PISA and PIRLS international analyses were, respectively, a Rasch model and a three-parameters model. To obtain comparable estimations of the item difficulties in both studies, the PIRLS data were reanalyzed using a Rasch model.
68
IERI MONOGRAPH SERIES: ISSUES AND METHODOLOGIES IN LARGE-SCALE ASSESSMENTS
ANAlYSeS, FINDINGS, AND INTeRPReTATIoNS
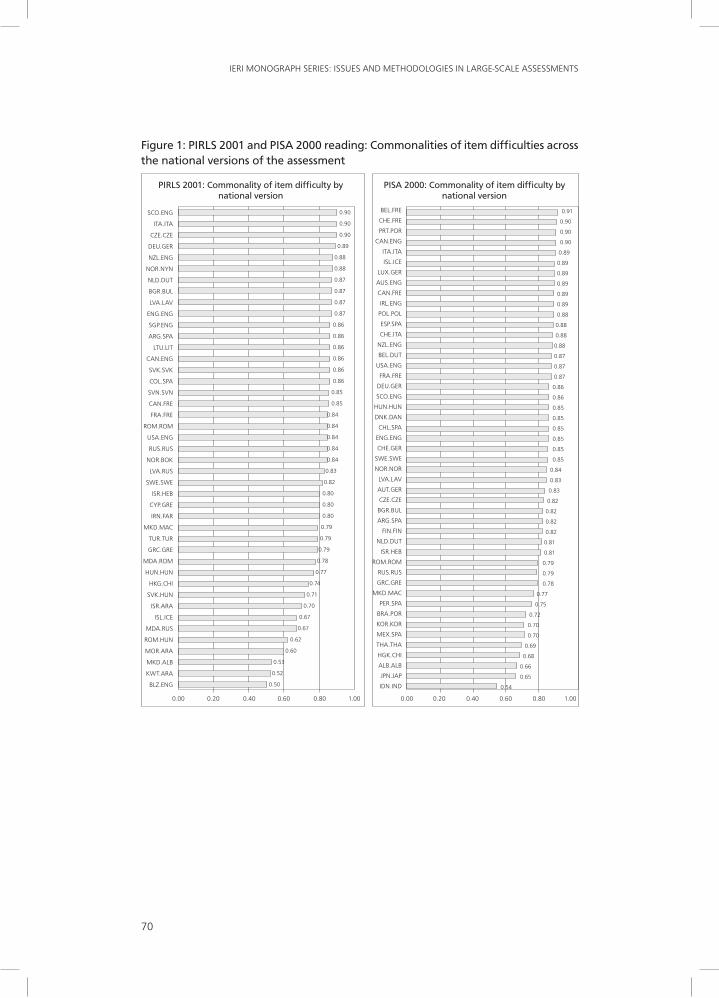
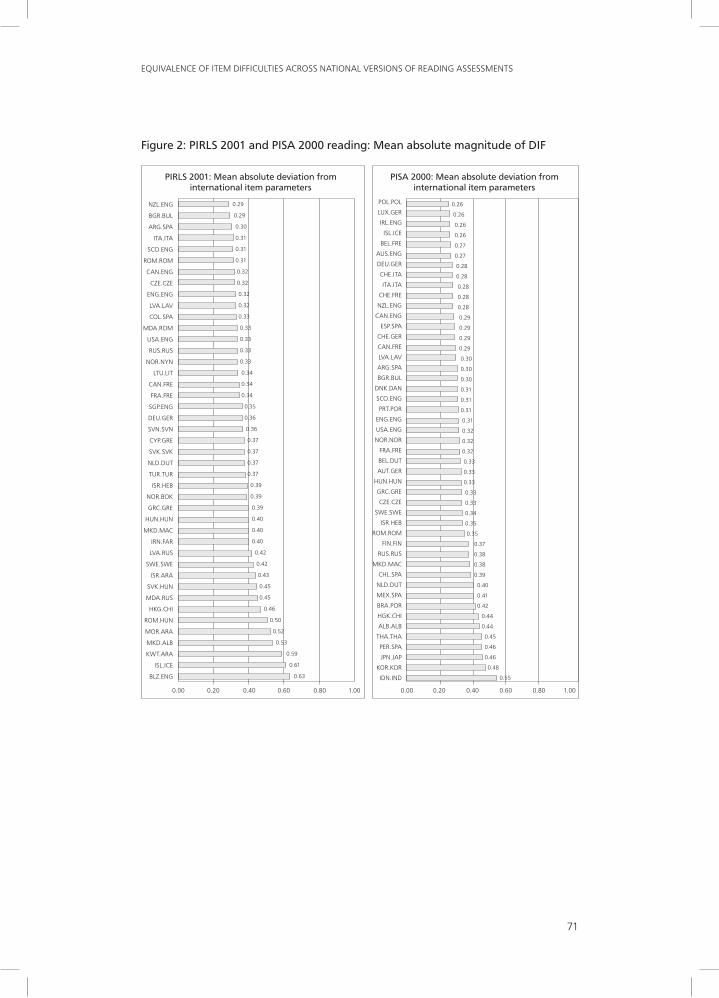
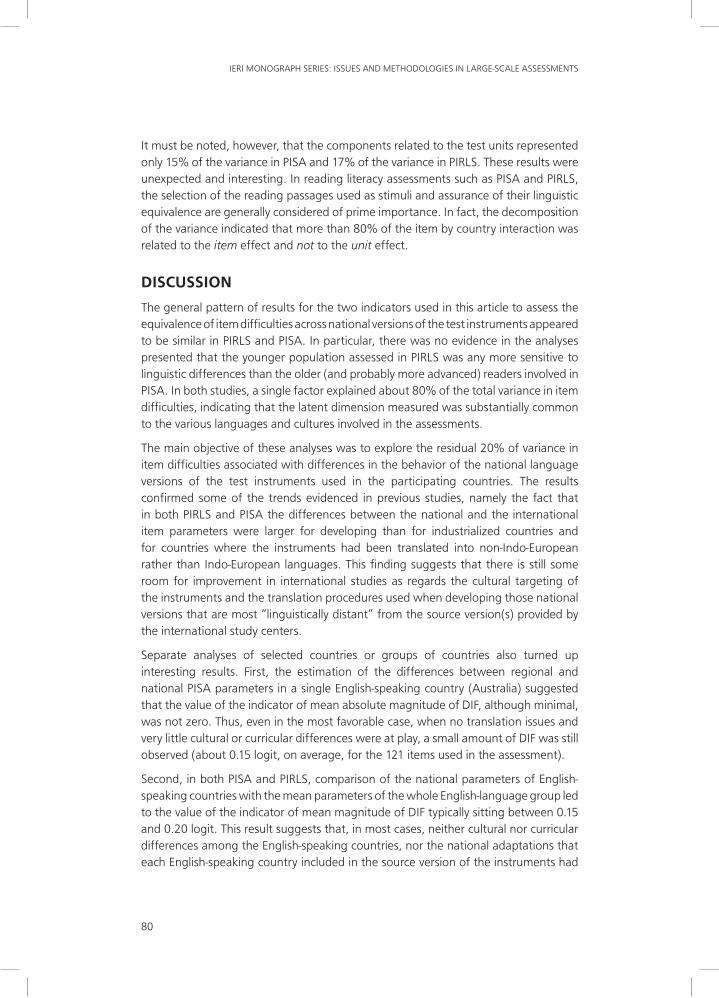
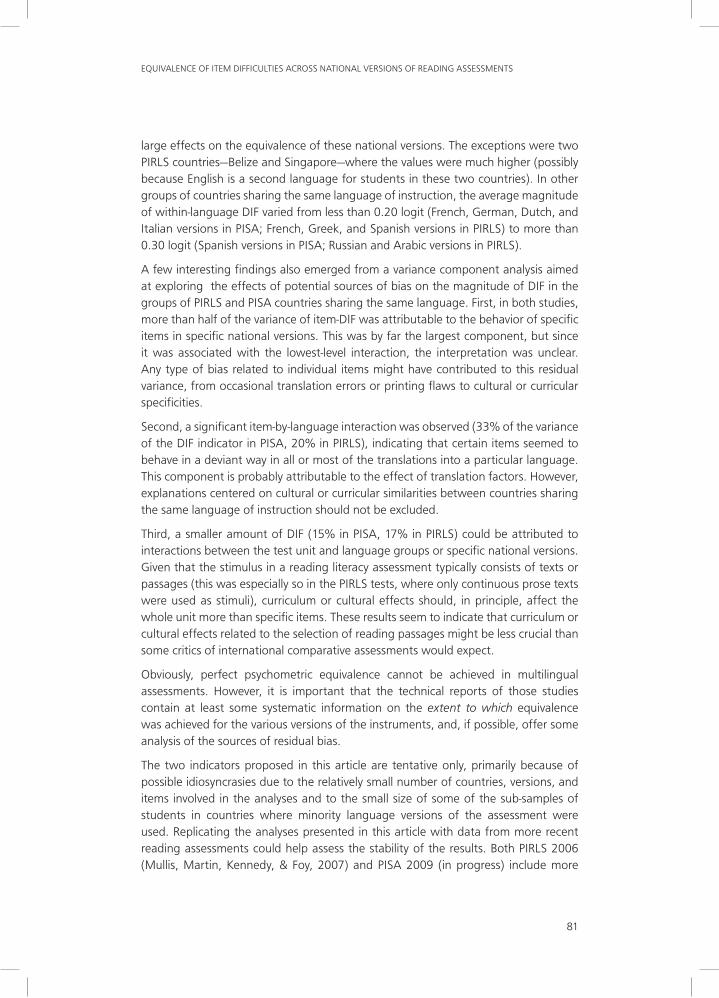
Commonalities and Global Amount of DIF in the National Versions of the PIRlS 2001 and PISA 2000 Reading TestsThese analyses were based on all items that were available for all national versions in all PIRLS or PISA participating countries. Items with missing data at the national level were dropped and the national item parameters were recentered to mean of zero. The PIRLS dataset thus contained 96 items, common to 43 national versions in 35 countries. The PISA dataset contained 121 items, common to 47 versions in 43 countries.2 The indicators obtained are presented in Figures 1 and 2.3
Several similarities can be observed between PIRLS and PISA in Figures 1 and 2, even though the populations used and the sets of countries participating in the two studies4 differed considerably:
1. In both studies, the mean commonality was about 80% of the total variance in item difficulties (79.4% in PIRLS, 81.9% in PISA). The mean absolute magnitude of DIF was 0.388 logit in PIRLS and 0.334 logit in PISA, suggesting that the average level of equivalence obtained in the studies was rather similar.
2. However, in both studies, there were at least some national versions with clearly concerning values for these two indicators (e.g., commonalities less than 70%, or mean absolute value of DIF greater than 0.500 logit).
3. As can be seen in Table 2, in both studies, the commonalities were lower and the mean absolute magnitude of DIF was higher for versions translated into non-Indo-European languages.5
4. In both studies, the commonalities tended to be lower and the mean absolute magnitude of DIF tended to be higher for the versions used in developing countries than for the versions used in industrialized countries. In Table 3, the mean values of the indicators are presented for two groups of countries in each study: the 10 participating countries with the highest GDP, and the 10 countries with the lowest GDP.
2 Liechtenstein was dropped from the PISA analyses because the number of students assessed was too low.Similarly, some of the minority versions used in certain PISA countries for a too small number of students (e.g., the German version used in Belgium) were ignored.
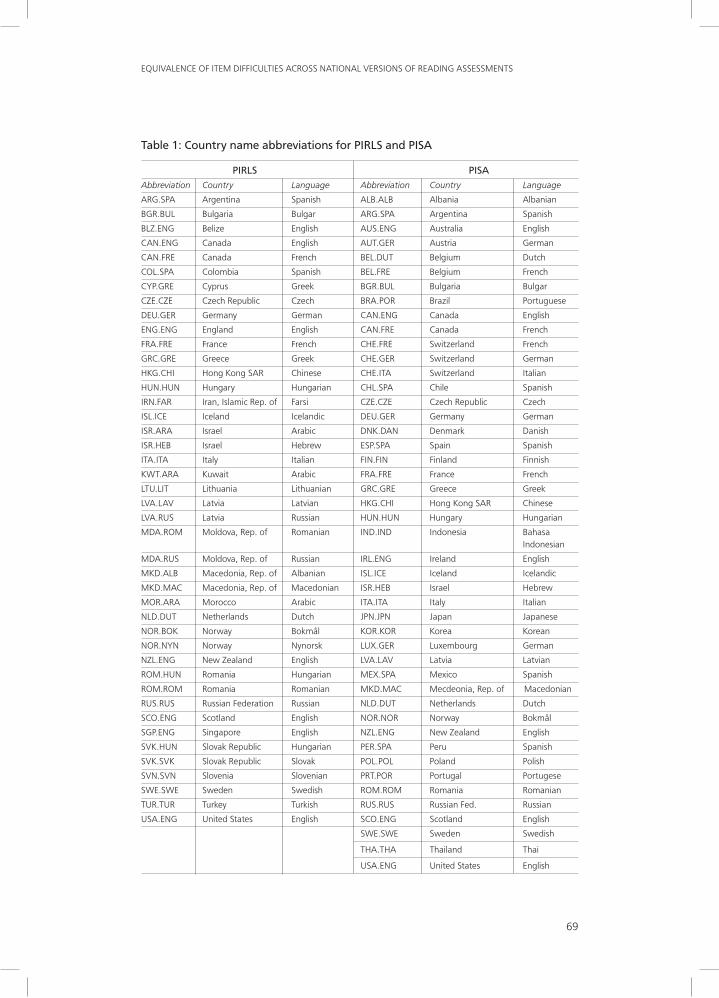
3 The names of the national versions appear as abbreviations in Figures 1 and 2 (e.g., CAN.ENG: Canada, English version; CAN.FRE: Canada, French version). A complete list of these abbreviations is provided in Table 1.
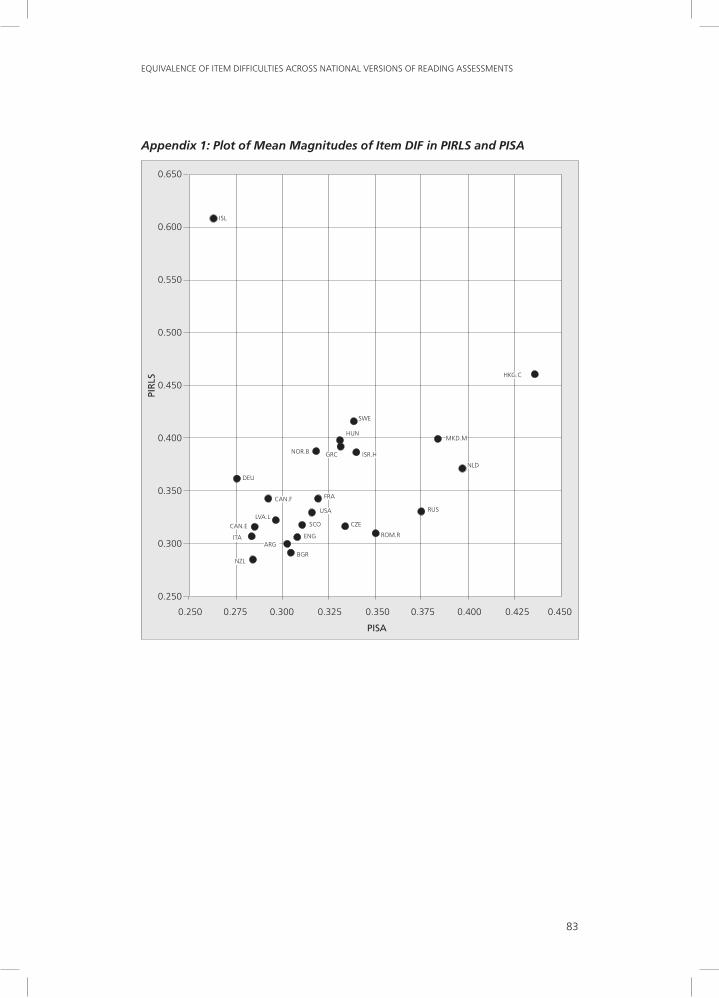
4 A total of 24 national versions using the same language in the same country was used in both studies. In Appendix 1, a plot of the mean magnitude of DIF for PISA and PIRLS for those 24 versions has been presented. With the exception of Iceland, where both the commonality and the magnitude of DIF pointed at a much lower level of equivalence in PIRLS than in PISA, the results appeared to be reasonably consistent across the two studies. When excluding Iceland, the correlation of PIRLS and PISA mean magnitudes of DIF was 0.642.
5 Non-Indo-European languages used in PIRLS and PISA include Arabic, Bahasa Indonesian, Chinese, Finnish, Hebrew, Hungarian, Japanese, Korean, and Turkish.
69
EQUIVALENCE OF ITEM DIFFICULTIES ACROSS NATIONAL VERSIONS OF READING ASSESSMENTS
Table 1: Country name abbreviations for PIRLS and PISA
PIRLS PISAAbbreviation Country Language Abbreviation Country Language
ARG.SPA Argentina Spanish ALB.ALB Albania Albanian
BGR.BUL Bulgaria Bulgar ARG.SPA Argentina Spanish
BLZ.ENG Belize English AUS.ENG Australia English
CAN.ENG Canada English AUT.GER Austria German
CAN.FRE Canada French BEL.DUT Belgium Dutch
COL.SPA Colombia Spanish BEL.FRE Belgium French
CYP.GRE Cyprus Greek BGR.BUL Bulgaria Bulgar
CZE.CZE Czech Republic Czech BRA.POR Brazil Portuguese
DEU.GER Germany German CAN.ENG Canada English
ENG.ENG England English CAN.FRE Canada French
FRA.FRE France French CHE.FRE Switzerland French
GRC.GRE Greece Greek CHE.GER Switzerland German
HKG.CHI Hong Kong SAR Chinese CHE.ITA Switzerland Italian
HUN.HUN Hungary Hungarian CHL.SPA Chile Spanish
IRN.FAR Iran, Islamic Rep. of Farsi CZE.CZE Czech Republic Czech
ISL.ICE Iceland Icelandic DEU.GER Germany German
ISR.ARA Israel Arabic DNK.DAN Denmark Danish
ISR.HEB Israel Hebrew ESP.SPA Spain Spanish
ITA.ITA Italy Italian FIN.FIN Finland Finnish
KWT.ARA Kuwait Arabic FRA.FRE France French
LTU.LIT Lithuania Lithuanian GRC.GRE Greece Greek
LVA.LAV Latvia Latvian HKG.CHI Hong Kong SAR Chinese
LVA.RUS Latvia Russian HUN.HUN Hungary Hungarian
MDA.ROM Moldova, Rep. of Romanian IND.IND Indonesia Bahasa Indonesian
MDA.RUS Moldova, Rep. of Russian IRL.ENG Ireland English
MKD.ALB Macedonia, Rep. of Albanian ISL.ICE Iceland Icelandic
MKD.MAC Macedonia, Rep. of Macedonian ISR.HEB Israel Hebrew
MOR.ARA Morocco Arabic ITA.ITA Italy Italian
NLD.DUT Netherlands Dutch JPN.JPN Japan Japanese
NOR.BOK Norway Bokmål KOR.KOR Korea Korean
NOR.NYN Norway Nynorsk LUX.GER Luxembourg German
NZL.ENG New Zealand English LVA.LAV Latvia Latvian
ROM.HUN Romania Hungarian MEX.SPA Mexico Spanish
ROM.ROM Romania Romanian MKD.MAC Mecdeonia, Rep. of Macedonian
RUS.RUS Russian Federation Russian NLD.DUT Netherlands Dutch
SCO.ENG Scotland English NOR.NOR Norway Bokmål
SGP.ENG Singapore English NZL.ENG New Zealand English
SVK.HUN Slovak Republic Hungarian PER.SPA Peru Spanish
SVK.SVK Slovak Republic Slovak POL.POL Poland Polish
SVN.SVN Slovenia Slovenian PRT.POR Portugal Portugese
SWE.SWE Sweden Swedish ROM.ROM Romania Romanian
TUR.TUR Turkey Turkish RUS.RUS Russian Fed. Russian
USA.ENG United States English SCO.ENG Scotland English
SWE.SWE Sweden Swedish
THA.THA Thailand Thai
USA.ENG United States English
70
IERI MONOGRAPH SERIES: ISSUES AND METHODOLOGIES IN LARGE-SCALE ASSESSMENTS
SCO.ENG
ITA.ITA
CZE.CZE
DEU.GER
NZL.ENG
NOR.NYN
NLD.DUT
BGR.BUL
LVA.LAV
ENG.ENG
SGP.ENG
ARG.SPA
LTU.LIT
CAN.ENG
SVK.SVK
COL.SPA
SVN.SVN
CAN.FRE
FRA.FRE
ROM.ROM
USA.ENG
RUS.RUS
NOR.BOK
LVA.RUS
SWE.SWE
ISR.HEB
CYP.GRE
IRN.FAR
MKD.MAC
TUR.TUR
GRC.GRE
MDA.ROM
HUN.HUN
HKG.CHI
SVK.HUN
ISR.ARA
ISL.ICE
MDA.RUS
ROM.HUN
MOR.ARA
MKD.ALB
KWT.ARA
BLZ.ENG
0.90
0.90
0.90
0.89
0.88
0.88
0.87
0.87
0.87
0.87
0.86
0.86
0.86
0.86
0.86
0.86
0.85
0.85
0.84
0.84
0.84
0.84
0.84
0.83
0.82
0.80
0.80
0.80
0.79
0.79
0.79
0.78
0.77
0.74
0.71
0.70
0.67
0.67
0.62
0.60
0.53
0.52
0.50
0.00 0.20 0.40 0.60 0.80 1.00
PIRLS 2001: Commonality of item difficulty bynational version
PISA 2000: Commonality of item difficulty by national version
0.00 0.20 0.40 0.60 0.80 1.00
BEL.FRE
CHE.FRE
PRT.POR
CAN.ENG
ITA.ITA
ISL.ICE
LUX.GER
AUS.ENG
CAN.FRE
IRL.ENG
POL.POL
ESP.SPA
CHE.ITA
NZL.ENG
BEL.DUT
USA.ENG
FRA.FRE
DEU.GER
SCO.ENG
HUN.HUN
DNK.DAN
CHL.SPA
ENG.ENG
CHE.GER
SWE.SWE
NOR.NOR
LVA.LAV
AUT.GER
CZE.CZE
BGR.BUL
ARG.SPA
FIN.FIN
NLD.DUT
ISR.HEB
ROM.ROM
RUS.RUS
GRC.GRE
MKD.MAC
PER.SPA
BRA.POR
KOR.KOR
MEX.SPA
THA.THA
HGK.CHI
ALB.ALB
JPN.JAP
IDN.IND
0.91
0.90
0.90
0.90
0.89
0.89
0.89
0.89
0.89
0.89
0.88
0.88
0.88
0.88
0.87
0.87
0.87
0.86
0.86
0.85
0.85
0.85
0.85
0.85
0.85
0.84
0.83
0.83
0.82
0.82
0.82
0.82
0.81
0.81
0.79
0.79
0.78
0.77
0.75
0.72
0.70
0.70
0.69
0.68
0.66
0.65
0.54
Figure 1: PIRLS 2001 and PISA 2000 reading: Commonalities of item difficulties across the national versions of the assessment
71
EQUIVALENCE OF ITEM DIFFICULTIES ACROSS NATIONAL VERSIONS OF READING ASSESSMENTS
Figure 2: PIRLS 2001 and PISA 2000 reading: Mean absolute magnitude of DIF
NZL.ENG
BGR.BUL
ARG.SPA
ITA.ITA
SCO.ENG
ROM.ROM
CAN.ENG
CZE.CZE
ENG.ENG
LVA.LAV
COL.SPA
MDA.ROM
USA.ENG
RUS.RUS
NOR.NYN
LTU.LIT
CAN.FRE
FRA.FRE
SGP.ENG
DEU.GER
SVN.SVN
CYP.GRE
SVK.SVK
NLD.DUT
TUR.TUR
ISR.HEB
NOR.BOK
GRC.GRE
HUN.HUN
MKD.MAC
IRN.FAR
LVA.RUS
SWE.SWE
ISR.ARA
SVK.HUN
MDA.RUS
HKG.CHI
ROM.HUN
MOR.ARA
MKD.ALB
KWT.ARA
ISL.ICE
BLZ.ENG
0.00 0.20 0.40 0.60 0.80 1.00
PIRLS 2001: Mean absolute deviation from international item parameters
PISA 2000: Mean absolute deviation from international item parameters
0.00 0.20 0.40 0.60 0.80 1.00
POL.POL
LUX.GER
IRL.ENG
ISL.ICE
BEL.FRE
AUS.ENG
DEU.GER
CHE.ITA
ITA.ITA
CHE.FRE
NZL.ENG
CAN.ENG
ESP.SPA
CHE.GER
CAN.FRE
LVA.LAV
ARG.SPA
BGR.BUL
DNK.DAN
SCO.ENG
PRT.POR
ENG.ENG
USA.ENG
NOR.NOR
FRA.FRE
BEL.DUT
AUT.GER
HUN.HUN
GRC.GRE
CZE.CZE
SWE.SWE
ISR.HEB
ROM.ROM
FIN.FIN
RUS.RUS
MKD.MAC
CHL.SPA
NLD.DUT
MEX.SPA
BRA.POR
HGK.CHI
ALB.ALB
THA.THA
PER.SPA
JPN.JAP
KOR.KOR
IDN.IND
0.26
0.26
0.26
0.26
0.27
0.27
0.28
0.28
0.28
0.28
0.28
0.29
0.29
0.29
0.29
0.30
0.30
0.30
0.31
0.31
0.31
0.31
0.32
0.32
0.32
0.33
0.33
0.33
0.33
0.33
0.34
0.35
0.35
0.37
0.38
0.38
0.39
0.40
0.41
0.42
0.44
0.44
0.45
0.46
0.46
0.48
0.55
0.29
0.29
0.30
0.31
0.31
0.31
0.32
0.32
0.32
0.32
0.33
0.33
0.33
0.33
0.33
0.34
0.34
0.34
0.35
0.36
0.36
0.37
0.37
0.37
0.37
0.39
0.39
0.39
0.40
0.40
0.40
0.42
0.42
0.43
0.45
0.45
0.46
0.50
0.52
0.53
0.59
0.61
0.63
72
IERI MONOGRAPH SERIES: ISSUES AND METHODOLOGIES IN LARGE-SCALE ASSESSMENTS
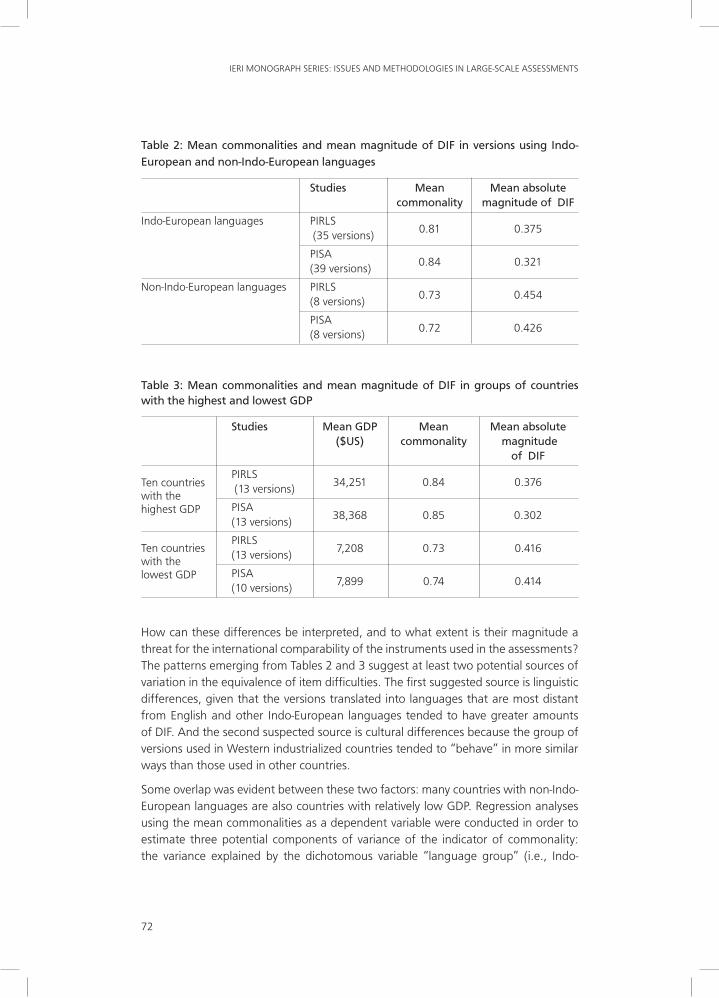
Table 2: Mean commonalities and mean magnitude of DIF in versions using Indo-European and non-Indo-European languages
Studies Mean Mean absolute commonality magnitude of DIF
Indo-European languages PIRLS (35 versions)
0.81 0.375
PISA (39 versions)
0.84 0.321
Non-Indo-European languages PIRLS (8 versions)
0.73 0.454
PISA (8 versions)
0.72 0.426
Table 3: Mean commonalities and mean magnitude of DIF in groups of countries with the highest and lowest GDP
Studies Mean GDP Mean Mean absolute ($US) commonality magnitude of DIF
PIRLS (13 versions)
34,251 0.84 0.376
PISA (13 versions)
38,368 0.85 0.302
PIRLS (13 versions)
7,208 0.73 0.416
PISA (10 versions)
7,899 0.74 0.414
How can these differences be interpreted, and to what extent is their magnitude a threat for the international comparability of the instruments used in the assessments? The patterns emerging from Tables 2 and 3 suggest at least two potential sources of variation in the equivalence of item difficulties. The first suggested source is linguistic differences, given that the versions translated into languages that are most distant from English and other Indo-European languages tended to have greater amounts of DIF. And the second suspected source is cultural differences because the group of versions used in Western industrialized countries tended to “behave” in more similar ways than those used in other countries.
Some overlap was evident between these two factors: many countries with non-Indo-European languages are also countries with relatively low GDP. Regression analyses using the mean commonalities as a dependent variable were conducted in order to estimate three potential components of variance of the indicator of commonality: the variance explained by the dichotomous variable “language group” (i.e., Indo-
Ten countries with the lowest GDP
Ten countries with the highest GDP
73
EQUIVALENCE OF ITEM DIFFICULTIES ACROSS NATIONAL VERSIONS OF READING ASSESSMENTS
European versus non-Indo-European language) after controlling for GDP; the variance explained by GDP after controlling for language group; and the variance explained jointly by both variables.
In PIRLS, a total of 33% of the variance in commonalities could be explained by the countries’ GDP and the dichotomous variable “language group.” Of this percentage, about 10% was unique variance explained by GDP, 18% was unique variance explained by “language group,” and 5% was variance jointly explained by both predictors. In PISA, the total variance explained was higher (54%), of which 24% was uniquely explained by “language group,” 23% was uniquely explained by GDP, and 7% was jointly explained by both predictors. Similar results were obtained when using the mean magnitude of DIF as the dependent variable. These findings confirmed that, despite the overlap, both the language group and the GDP had statistically significant unique effects on the equivalence of item difficulties.
Other possible sources of variation in equivalence could be the following:
1. Differences in the amount of error variance, particularly for versions used to assess linguistic minorities, which were often administered to small sub-samples of students. Because all item parameter estimates used in the analyses were subject to errors (particularly those due to sampling variance), the values presented in Figures 1 and 2 can be considered as estimations of the minimum value of commonalities and of the maximum value of magnitude of DIF. It must be noted, however, that adding the sample size as a predictor in the regressions described above increased the variance explained to a marginal extent only—less than 1.5% in both studies.
2. Differences in the reading curriculum taught to the students.
3. Uneven quality of the translations.
To further explore these issues, some other analyses were conducted.
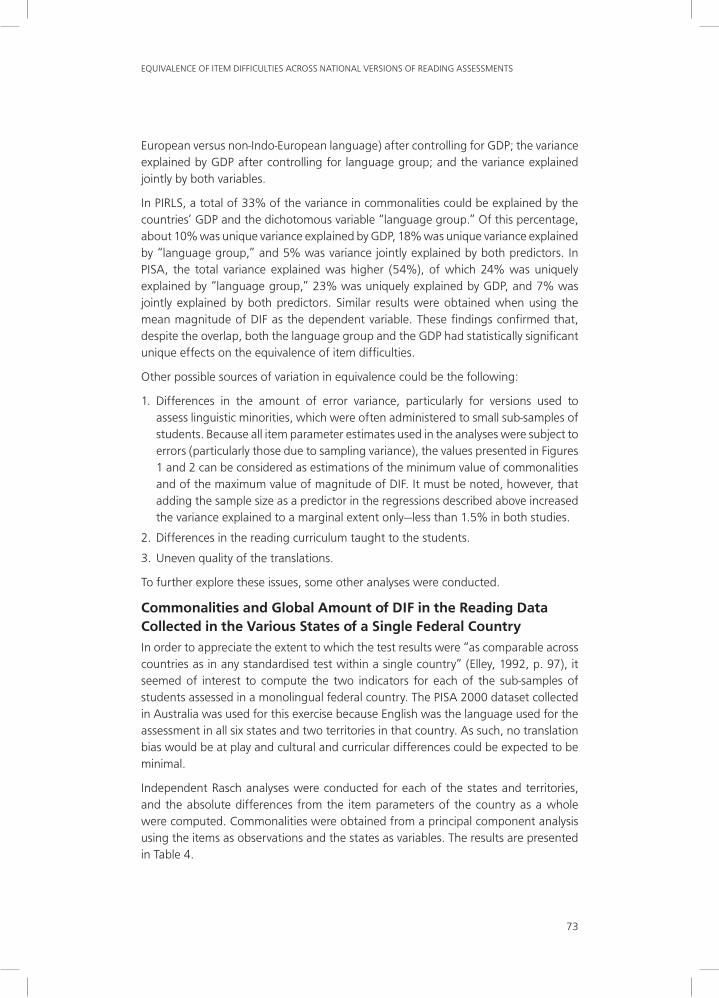
Commonalities and Global Amount of DIF in the Reading Data Collected in the Various States of a Single Federal CountryIn order to appreciate the extent to which the test results were “as comparable across countries as in any standardised test within a single country” (Elley, 1992, p. 97), it seemed of interest to compute the two indicators for each of the sub-samples of students assessed in a monolingual federal country. The PISA 2000 dataset collected in Australia was used for this exercise because English was the language used for the assessment in all six states and two territories in that country. As such, no translation bias would be at play and cultural and curricular differences could be expected to be minimal.
Independent Rasch analyses were conducted for each of the states and territories, and the absolute differences from the item parameters of the country as a whole were computed. Commonalities were obtained from a principal component analysis using the items as observations and the states as variables. The results are presented in Table 4.
74
IERI MONOGRAPH SERIES: ISSUES AND METHODOLOGIES IN LARGE-SCALE ASSESSMENTS
Table 4: PISA 2000: Mean commonalities and mean absolute amount of DIF in Australia’s states and territories
States and territories Mean commonality Mean absolute magnitude of DIF
ST1 0.96 0.160
ST2 0.97 0.142
ST3 0.97 0.139
ST4 0.97 0.149
ST5 0.95 0.177
ST6 0.97 0.142
ST7 0.96 0.165
ST8 0.93 0.212
As expected, the differences were small: most of them were probably due to some technical instability related to the small size of the sub-samples, or to some within-country cultural variation (for example, State 8 had a larger proportion of schools attended by Aboriginal students than did schools in the other states). These results suggest that, in PISA, if all versions used by the participating countries had been as equivalent as was the source version across the various regions in Australia, the average commonality in Figure 1 would probably be around 95% rather than 82% of the variance in item difficulties, and the average magnitude of DIF in Figure 3 would be around 0.15 logit rather than 0.34. In terms of equivalence, these findings give a rough estimation of the “cost” associated with the fact that PISA was not a national but an international assessment, and that it included countries with many different languages and with very diverse cultures and curricula.
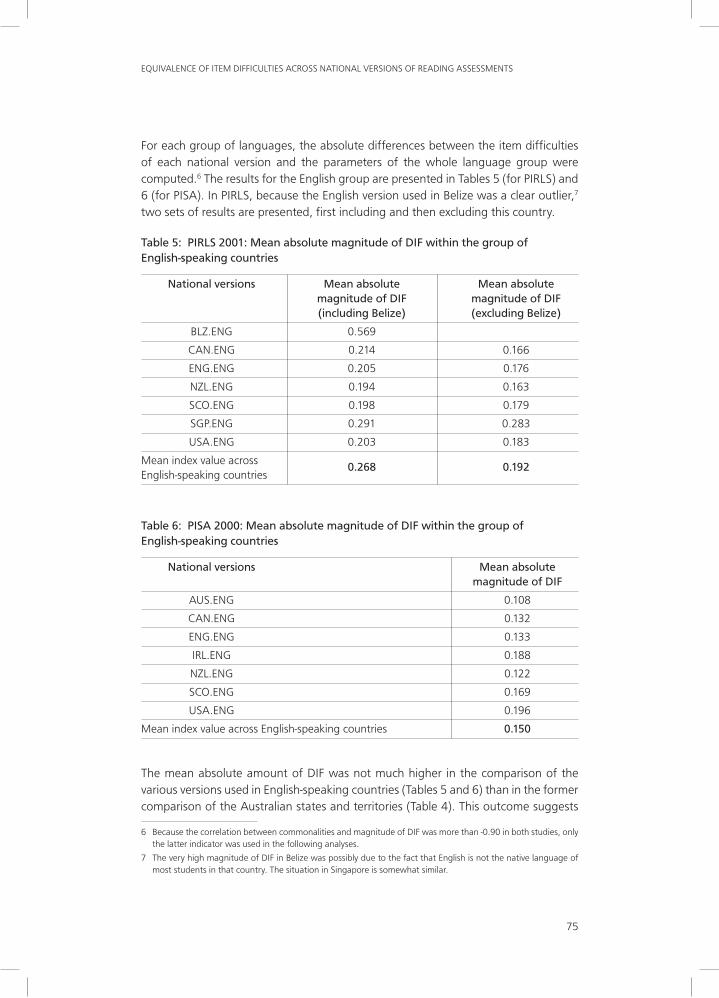
Commonalities and Global Amount of DIF in the National Versions of Different Countries using the Same language of InstructionIn both PIRLS and PISA, several countries shared the language of instruction. One would therefore expect smaller differences in the item difficulties within the groups of versions in a specific language than across different languages, not only because of the common language itself but also because countries using the same language often have historical, cultural, and even curricular similarities. The level of DIF can also be expected to be lower when all countries with a given language use a common version, and somewhat higher when countries use independent translations.
All English-speaking countries participating in the assessments used the source version provided by the PISA International Study Center and by the PIRLS International Study Center, and they included in it some national adaptations. In PISA, a second source version was also provided in French for use by French-speaking countries. As regards other common languages, some countries developed co-operatively a common translation, and then included some national adaptations; others borrowed for their linguistic minorities a version developed by another country; and still others preferred to use their own independent translations.
75
EQUIVALENCE OF ITEM DIFFICULTIES ACROSS NATIONAL VERSIONS OF READING ASSESSMENTS
For each group of languages, the absolute differences between the item difficulties of each national version and the parameters of the whole language group were computed.6 The results for the English group are presented in Tables 5 (for PIRLS) and 6 (for PISA). In PIRLS, because the English version used in Belize was a clear outlier,7 two sets of results are presented, first including and then excluding this country.
Table 5: PIRLS 2001: Mean absolute magnitude of DIF within the group of English-speaking countries
National versions Mean absolute Mean absolute magnitude of DIF magnitude of DIF (including Belize) (excluding Belize)
BLZ.ENG 0.569
CAN.ENG 0.214 0.166
ENG.ENG 0.205 0.176
NZL.ENG 0.194 0.163
SCO.ENG 0.198 0.179
SGP.ENG 0.291 0.283
USA.ENG 0.203 0.183
Mean index value across 0.268 0.192
English-speaking countries
Table 6: PISA 2000: Mean absolute magnitude of DIF within the group of English-speaking countries
National versions Mean absolute magnitude of DIF
AUS.ENG 0.108
CAN.ENG 0.132
ENG.ENG 0.133
IRL.ENG 0.188
NZL.ENG 0.122
SCO.ENG 0.169
USA.ENG 0.196
Mean index value across English-speaking countries 0.150
The mean absolute amount of DIF was not much higher in the comparison of the various versions used in English-speaking countries (Tables 5 and 6) than in the former comparison of the Australian states and territories (Table 4). This outcome suggests
6 Because the correlation between commonalities and magnitude of DIF was more than -0.90 in both studies, only the latter indicator was used in the following analyses.
7 The very high magnitude of DIF in Belize was possibly due to the fact that English is not the native language of most students in that country. The situation in Singapore is somewhat similar.
76
IERI MONOGRAPH SERIES: ISSUES AND METHODOLOGIES IN LARGE-SCALE ASSESSMENTS
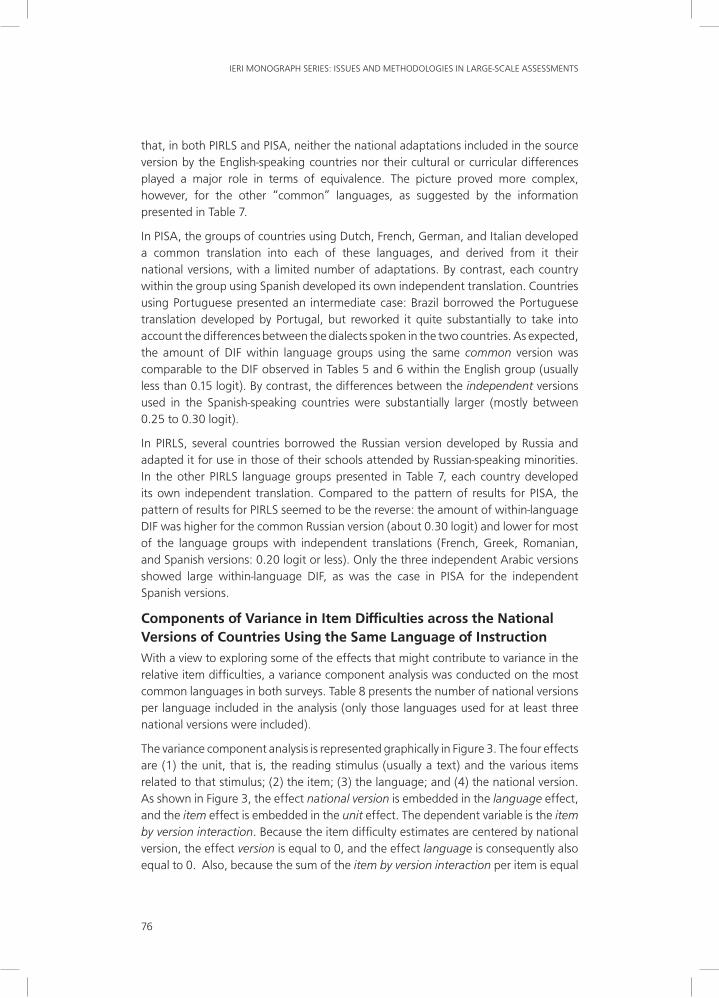
that, in both PIRLS and PISA, neither the national adaptations included in the source version by the English-speaking countries nor their cultural or curricular differences played a major role in terms of equivalence. The picture proved more complex, however, for the other “common” languages, as suggested by the information presented in Table 7.
In PISA, the groups of countries using Dutch, French, German, and Italian developed a common translation into each of these languages, and derived from it their national versions, with a limited number of adaptations. By contrast, each country within the group using Spanish developed its own independent translation. Countries using Portuguese presented an intermediate case: Brazil borrowed the Portuguese translation developed by Portugal, but reworked it quite substantially to take into account the differences between the dialects spoken in the two countries. As expected, the amount of DIF within language groups using the same common version was comparable to the DIF observed in Tables 5 and 6 within the English group (usually less than 0.15 logit). By contrast, the differences between the independent versions used in the Spanish-speaking countries were substantially larger (mostly between 0.25 to 0.30 logit).
In PIRLS, several countries borrowed the Russian version developed by Russia and adapted it for use in those of their schools attended by Russian-speaking minorities. In the other PIRLS language groups presented in Table 7, each country developed its own independent translation. Compared to the pattern of results for PISA, the pattern of results for PIRLS seemed to be the reverse: the amount of within-language DIF was higher for the common Russian version (about 0.30 logit) and lower for most of the language groups with independent translations (French, Greek, Romanian, and Spanish versions: 0.20 logit or less). Only the three independent Arabic versions showed large within-language DIF, as was the case in PISA for the independent Spanish versions.
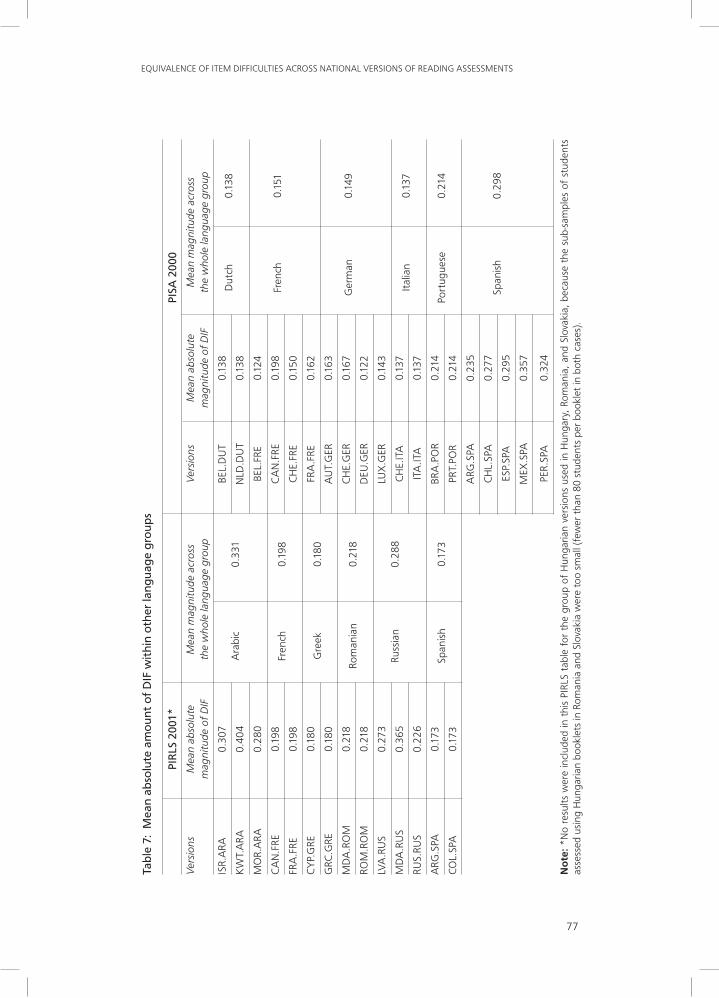
Components of Variance in Item Difficulties across the National Versions of Countries using the Same language of InstructionWith a view to exploring some of the effects that might contribute to variance in the relative item difficulties, a variance component analysis was conducted on the most common languages in both surveys. Table 8 presents the number of national versions per language included in the analysis (only those languages used for at least three national versions were included).
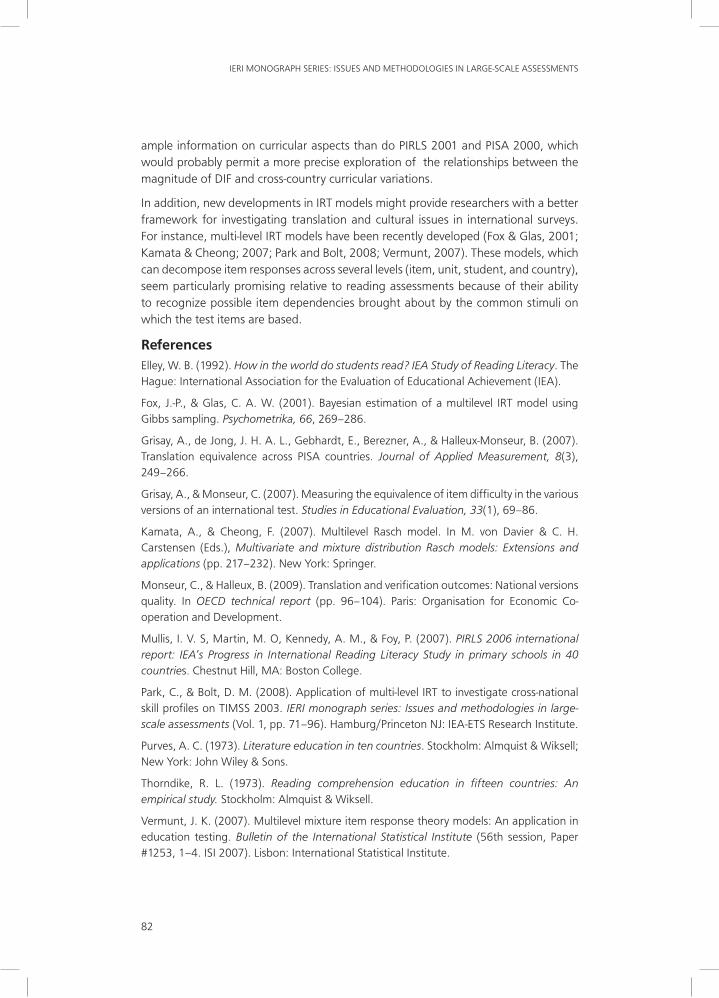
The variance component analysis is represented graphically in Figure 3. The four effects are (1) the unit, that is, the reading stimulus (usually a text) and the various items related to that stimulus; (2) the item; (3) the language; and (4) the national version. As shown in Figure 3, the effect national version is embedded in the language effect, and the item effect is embedded in the unit effect. The dependent variable is the item by version interaction. Because the item difficulty estimates are centered by national version, the effect version is equal to 0, and the effect language is consequently also equal to 0. Also, because the sum of the item by version interaction per item is equal
77
EQUIVALENCE OF ITEM DIFFICULTIES ACROSS NATIONAL VERSIONS OF READING ASSESSMENTS
Tab
le 7
: M
ean
ab
solu
te a
mo
unt
of
DIF
wit
hin
oth
er la
ngu
age
gro
ups
PIR
LS 2
001*
PISA
200
0
Vers
ions
Mea
n ab
solu
te
Mea
n m
agni
tude
acr
oss
Vers
ions
M
ean
abso
lute
M
ean
mag
nitu
de a
cros
s
mag
nitu
de o
f D
IF
the
who
le la
ngua
ge g
roup
mag
nitu
de o
f D
IF
the
who
le la
ngua
ge g
roup
ISR.
ARA
0.30
7 A
rabi
c 0.
331
BEL.
DU
T 0.
138
Dut
ch
0.13
8K
WT.
ARA
0.
404
NLD
.DU
T 0.
138
MO
R.A
RA
0.28
0
BE
L.FR
E 0.
124
Fren
ch
0.15
1C
AN
.FRE
0.19
8 Fr
ench
0.
198
CA
N.F
RE
0.19
8
FRA
.FRE
0.19
8
C
HE.
FRE
0.15
0
CY
P.G
RE
0.
180
Gre
ek
0.18
0 FR
A.F
RE
0.16
2
GRC
.GRE
0.
180
AU
T.G
ER
0.16
3
Ger
man
0.
149
MD
A.R
OM
0.
218
Rom
ania
n 0.
218
CH
E.G
ER
0.16
7
ROM
.RO
M
0.21
8
D
EU.G
ER
0.12
2
LVA
.RU
S
0.27
3 Ru
ssia
n 0.
288
LUX
.GER
0.
143
MD
A.R
US
0.
365
CH
E.IT
A
0.13
7 It
alia
n 0.
137
RUS.
RUS
0.
226
ITA
.ITA
0.
137
ARG
.SPA
0.
173
Span
ish
0.17
3 BR
A.P
OR
0.21
4 Po
rtug
uese
0.
214
COL.
SPA
0.17
3
PR
T.PO
R 0.
214
A
RG.S
PA
0.23
5
Span
ish
0.
298
C
HL.
SPA
0.
277
ES
P.SP
A
0.29
5
M
EX.S
PA
0.35
7
PE
R.SP
A
0.32
4
No
te: *
No
resu
lts w
ere
incl
uded
in t
his
PIRL
S ta
ble
for
the
grou
p of
Hun
garia
n ve
rsio
ns u
sed
in H
unga
ry, R
oman
ia, a
nd S
lova
kia,
bec
ause
the
sub
-sam
ples
of
stud
ents
as
sess
ed u
sing
Hun
garia
n bo
okle
ts in
Rom
ania
and
Slo
vaki
a w
ere
too
smal
l (fe
wer
tha
n 80
stu
dent
s pe
r bo
okle
t in
bot
h ca
ses)
.
78
IERI MONOGRAPH SERIES: ISSUES AND METHODOLOGIES IN LARGE-SCALE ASSESSMENTS
to 0, the effect item is null, as is the unit effect; the areas corresponding to these main effects are shaded in the figure.
Table 8: PIRLS 2001 and PISA 2000: Number of national versions included in the variance components analysis per language
PIRLS PISA
Arabic 3 English 7
English 7 French 4
Russian 3 German 4
Spanish 5
The four non-shaded areas in Figure 3 correspond to the four interaction components that are of interest in this analysis:
1. The area labeled 1 corresponds to the interaction between the language and the unit effects. A large variance component for this interaction might reflect translation problems in the reading passage used as stimulus for the groups of countries sharing a common version of the materials in a given language. Cultural or curriculum effects could also be at play in this component of variance because students using the same language of instruction in various countries might be more familiar than students elsewhere with certain authors and/or certain types of text.
2. The area labeled 2 represents the interaction between a national version and the unit. This area might also reflect possible translation errors in the stimulus used for the unit for a particular version. It might furthermore reflect some curriculum specificity in that country.
3. The area labeled 3 represents the interaction between a language and an item. This component probably reflects a translation error for a particular item in one of the source or shared versions. It might also have occurred because of students using specific languages being more familiar than students using other languages with some item formats or reading processes.
Figure 3: Variance component analysis of item-DIF in national versions using a same language
Language
Version
Unit
Item
1
1
2 4 3
79
EQUIVALENCE OF ITEM DIFFICULTIES ACROSS NATIONAL VERSIONS OF READING ASSESSMENTS
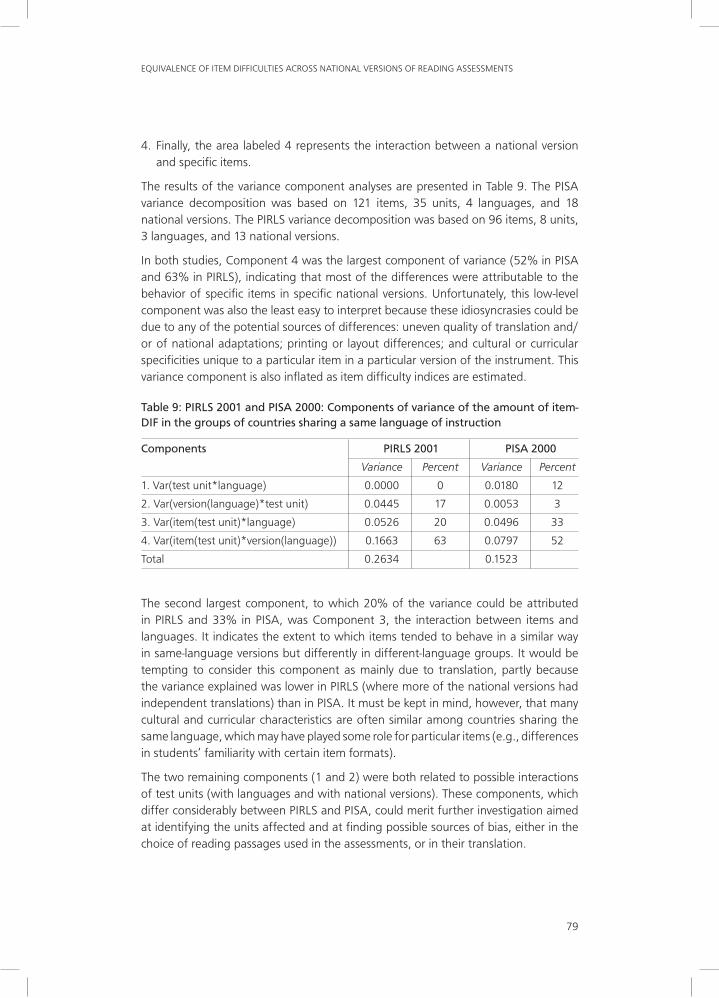
4. Finally, the area labeled 4 represents the interaction between a national version and specific items.
The results of the variance component analyses are presented in Table 9. The PISA variance decomposition was based on 121 items, 35 units, 4 languages, and 18 national versions. The PIRLS variance decomposition was based on 96 items, 8 units, 3 languages, and 13 national versions.
In both studies, Component 4 was the largest component of variance (52% in PISA and 63% in PIRLS), indicating that most of the differences were attributable to the behavior of specific items in specific national versions. Unfortunately, this low-level component was also the least easy to interpret because these idiosyncrasies could be due to any of the potential sources of differences: uneven quality of translation and/or of national adaptations; printing or layout differences; and cultural or curricular specificities unique to a particular item in a particular version of the instrument. This variance component is also inflated as item difficulty indices are estimated.
Table 9: PIRLS 2001 and PISA 2000: Components of variance of the amount of item-DIF in the groups of countries sharing a same language of instruction
Components PIRLS 2001 PISA 2000
Variance Percent Variance Percent
1. Var(test unit*language) 0.0000 0 0.0180 12
2. Var(version(language)*test unit) 0.0445 17 0.0053 3
3. Var(item(test unit)*language) 0.0526 20 0.0496 33
4. Var(item(test unit)*version(language)) 0.1663 63 0.0797 52
Total 0.2634 0.1523
The second largest component, to which 20% of the variance could be attributed in PIRLS and 33% in PISA, was Component 3, the interaction between items and languages. It indicates the extent to which items tended to behave in a similar way in same-language versions but differently in different-language groups. It would be tempting to consider this component as mainly due to translation, partly because the variance explained was lower in PIRLS (where more of the national versions had independent translations) than in PISA. It must be kept in mind, however, that many cultural and curricular characteristics are often similar among countries sharing the same language, which may have played some role for particular items (e.g., differences in students’ familiarity with certain item formats).
The two remaining components (1 and 2) were both related to possible interactions of test units (with languages and with national versions). These components, which differ considerably between PIRLS and PISA, could merit further investigation aimed at identifying the units affected and at finding possible sources of bias, either in the choice of reading passages used in the assessments, or in their translation.
80
IERI MONOGRAPH SERIES: ISSUES AND METHODOLOGIES IN LARGE-SCALE ASSESSMENTS
It must be noted, however, that the components related to the test units represented only 15% of the variance in PISA and 17% of the variance in PIRLS. These results were unexpected and interesting. In reading literacy assessments such as PISA and PIRLS, the selection of the reading passages used as stimuli and assurance of their linguistic equivalence are generally considered of prime importance. In fact, the decomposition of the variance indicated that more than 80% of the item by country interaction was related to the item effect and not to the unit effect.
DISCuSSIoN
The general pattern of results for the two indicators used in this article to assess the equivalence of item difficulties across national versions of the test instruments appeared to be similar in PIRLS and PISA. In particular, there was no evidence in the analyses presented that the younger population assessed in PIRLS was any more sensitive to linguistic differences than the older (and probably more advanced) readers involved in PISA. In both studies, a single factor explained about 80% of the total variance in item difficulties, indicating that the latent dimension measured was substantially common to the various languages and cultures involved in the assessments.
The main objective of these analyses was to explore the residual 20% of variance in item difficulties associated with differences in the behavior of the national language versions of the test instruments used in the participating countries. The results confirmed some of the trends evidenced in previous studies, namely the fact that in both PIRLS and PISA the differences between the national and the international item parameters were larger for developing than for industrialized countries and for countries where the instruments had been translated into non-Indo-European rather than Indo-European languages. This finding suggests that there is still some room for improvement in international studies as regards the cultural targeting of the instruments and the translation procedures used when developing those national versions that are most “linguistically distant” from the source version(s) provided by the international study centers.
Separate analyses of selected countries or groups of countries also turned up interesting results. First, the estimation of the differences between regional and national PISA parameters in a single English-speaking country (Australia) suggested that the value of the indicator of mean absolute magnitude of DIF, although minimal, was not zero. Thus, even in the most favorable case, when no translation issues and very little cultural or curricular differences were at play, a small amount of DIF was still observed (about 0.15 logit, on average, for the 121 items used in the assessment).
Second, in both PISA and PIRLS, comparison of the national parameters of English-speaking countries with the mean parameters of the whole English-language group led to the value of the indicator of mean magnitude of DIF typically sitting between 0.15 and 0.20 logit. This result suggests that, in most cases, neither cultural nor curricular differences among the English-speaking countries, nor the national adaptations that each English-speaking country included in the source version of the instruments had
81
EQUIVALENCE OF ITEM DIFFICULTIES ACROSS NATIONAL VERSIONS OF READING ASSESSMENTS
large effects on the equivalence of these national versions. The exceptions were two PIRLS countries—Belize and Singapore—where the values were much higher (possibly because English is a second language for students in these two countries). In other groups of countries sharing the same language of instruction, the average magnitude of within-language DIF varied from less than 0.20 logit (French, German, Dutch, and Italian versions in PISA; French, Greek, and Spanish versions in PIRLS) to more than 0.30 logit (Spanish versions in PISA; Russian and Arabic versions in PIRLS).
A few interesting findings also emerged from a variance component analysis aimed at exploring the effects of potential sources of bias on the magnitude of DIF in the groups of PIRLS and PISA countries sharing the same language. First, in both studies, more than half of the variance of item-DIF was attributable to the behavior of specific items in specific national versions. This was by far the largest component, but since it was associated with the lowest-level interaction, the interpretation was unclear. Any type of bias related to individual items might have contributed to this residual variance, from occasional translation errors or printing flaws to cultural or curricular specificities.
Second, a significant item-by-language interaction was observed (33% of the variance of the DIF indicator in PISA, 20% in PIRLS), indicating that certain items seemed to behave in a deviant way in all or most of the translations into a particular language. This component is probably attributable to the effect of translation factors. However, explanations centered on cultural or curricular similarities between countries sharing the same language of instruction should not be excluded.
Third, a smaller amount of DIF (15% in PISA, 17% in PIRLS) could be attributed to interactions between the test unit and language groups or specific national versions. Given that the stimulus in a reading literacy assessment typically consists of texts or passages (this was especially so in the PIRLS tests, where only continuous prose texts were used as stimuli), curriculum or cultural effects should, in principle, affect the whole unit more than specific items. These results seem to indicate that curriculum or cultural effects related to the selection of reading passages might be less crucial than some critics of international comparative assessments would expect.
Obviously, perfect psychometric equivalence cannot be achieved in multilingual assessments. However, it is important that the technical reports of those studies contain at least some systematic information on the extent to which equivalence was achieved for the various versions of the instruments, and, if possible, offer some analysis of the sources of residual bias.
The two indicators proposed in this article are tentative only, primarily because of possible idiosyncrasies due to the relatively small number of countries, versions, and items involved in the analyses and to the small size of some of the sub-samples of students in countries where minority language versions of the assessment were used. Replicating the analyses presented in this article with data from more recent reading assessments could help assess the stability of the results. Both PIRLS 2006 (Mullis, Martin, Kennedy, & Foy, 2007) and PISA 2009 (in progress) include more
82
IERI MONOGRAPH SERIES: ISSUES AND METHODOLOGIES IN LARGE-SCALE ASSESSMENTS
ample information on curricular aspects than do PIRLS 2001 and PISA 2000, which would probably permit a more precise exploration of the relationships between the magnitude of DIF and cross-country curricular variations.
In addition, new developments in IRT models might provide researchers with a better framework for investigating translation and cultural issues in international surveys. For instance, multi-level IRT models have been recently developed (Fox & Glas, 2001; Kamata & Cheong; 2007; Park and Bolt, 2008; Vermunt, 2007). These models, which can decompose item responses across several levels (item, unit, student, and country), seem particularly promising relative to reading assessments because of their ability to recognize possible item dependencies brought about by the common stimuli on which the test items are based.
ReferencesElley, W. B. (1992). How in the world do students read? IEA Study of Reading Literacy. The Hague: International Association for the Evaluation of Educational Achievement (IEA).
Fox, J.-P., & Glas, C. A. W. (2001). Bayesian estimation of a multilevel IRT model using Gibbs sampling. Psychometrika, 66, 269–286.
Grisay, A., de Jong, J. H. A. L., Gebhardt, E., Berezner, A., & Halleux-Monseur, B. (2007). Translation equivalence across PISA countries. Journal of Applied Measurement, 8(3), 249–266.
Grisay, A., & Monseur, C. (2007). Measuring the equivalence of item difficulty in the various versions of an international test. Studies in Educational Evaluation, 33(1), 69–86.
Kamata, A., & Cheong, F. (2007). Multilevel Rasch model. In M. von Davier & C. H. Carstensen (Eds.), Multivariate and mixture distribution Rasch models: Extensions and applications (pp. 217–232). New York: Springer.
Monseur, C., & Halleux, B. (2009). Translation and verification outcomes: National versions quality. In OECD technical report (pp. 96–104). Paris: Organisation for Economic Co-operation and Development.
Mullis, I. V. S, Martin, M. O, Kennedy, A. M., & Foy, P. (2007). PIRLS 2006 international report: IEA’s Progress in International Reading Literacy Study in primary schools in 40 countries. Chestnut Hill, MA: Boston College.
Park, C., & Bolt, D. M. (2008). Application of multi-level IRT to investigate cross-national skill profiles on TIMSS 2003. IERI monograph series: Issues and methodologies in large-scale assessments (Vol. 1, pp. 71–96). Hamburg/Princeton NJ: IEA-ETS Research Institute.
Purves, A. C. (1973). Literature education in ten countries. Stockholm: Almquist & Wiksell; New York: John Wiley & Sons.
Thorndike, R. L. (1973). Reading comprehension education in fifteen countries: An empirical study. Stockholm: Almquist & Wiksell.
Vermunt, J. K. (2007). Multilevel mixture item response theory models: An application in education testing. Bulletin of the International Statistical Institute (56th session, Paper #1253, 1–4. ISI 2007). Lisbon: International Statistical Institute.
83
EQUIVALENCE OF ITEM DIFFICULTIES ACROSS NATIONAL VERSIONS OF READING ASSESSMENTS
Appendix 1: Plot of Mean Magnitudes of Item DIF in PIRLS and PISA
0.650
0.600
0.550
0.500
0.450
0.400
0.350
0.300
0.250
ISL
HKG.C
CZE
ROM.R
RUS
GRC ISR.H
HUN
SWE
NLD
MKD.M
NOR.B
ITA
CAN.ELVA.L
ARG
NZLBGR
ENG
SCO
USA
FRACAN.F
DEU
0.250 0.275 0.300 0.325 0.350 0.375 0.400 0.425 0.450
PISA
PIR
LS

84
IERI MONOGRAPH SERIES: ISSUES AND METHODOLOGIES IN LARGE-SCALE ASSESSMENTS