Embed Size (px)
Citation preview
BioPharm International, 2015
Equivalence Testing for Comparability Thomas A. Little PhD 1/2/2015 President Thomas A. Little Consulting 12401 N Wildflower Lane Highland, UT 84003 1-925-285-1847 [email protected] Background Understanding the influence of change events on product performance is a necessity and of paramount importance to routine drug development, transfer and validation. Guidance for Industry Comparability Protocols (1) discusses the need and considerations for assessing any product or process change that may impact safety or efficacy of a drug product or drug substance. Areas to consider may include:
1. Changes to the manufacturing process
2. Changes to the analytical procedure or analytical method
3. Changes in manufacturing equipment
4. Changes in location or manufacturing facilities
5. Changes to container closure systems
6. Changes in materials, concentrations and/or formulation
7. Changes in process analytical technology (PAT) or process controls
8. Any change that may influence safety or efficacy of the product
Hypothesis Testing Generally a comparability protocol includes an analytical method(s), a study design, a representative data set and associated acceptance criteria. The defined protocol is used to demonstrate comparability. There are typically two types of data analysis techniques that are used 1) statistical significance and 2) practical significance or equivalence. In the case of statistical significance the differences are always considered to be zero. In the case of practical significance they are not considered to be zero; however, they are considered to be practically so small they are considered to be practically zero. Often testing using statistical significance (zero change) may result in the detection of real differences that are not practically meaningful and do not identify practically meaningful differences in the product. USP 1033 (2) indicates the preference for equivalence testing over significance testing.
“This is a standard statistical approach used to demonstrate conformance to expectation and is called an equivalence test. It should not be confused with the practice of performing a significance test, such as a t-test, which seeks to establish a difference from some target value (e.g., 0% relative bias). A significance test associated with a P value > 0.05 (equivalent to a confidence interval that includes the target value for the parameter) indicates that there is insufficient evidence to conclude that the parameter is different from the target value. This is not the same as concluding that the parameter conforms to its target value. The study design may have too few replicates, or the validation data may be too variable to discover a meaningful difference from target. Additionally, a significance test may detect a small deviation from target that is practically insignificant.”
Equivalence Testing Equivalence testing is used when one wants assurance that the means do not differ by too much. In other words, the means are practically equivalent. A threshold difference acceptance criteria is set by the analyst for each parameter under test. The means are considered equivalent if the difference in the two groups is significantly lower than the upper practical limit and significantly higher than the lower practical limit. Typically a two one-sided t-test (TOST) is used to demonstrate equivalence once the acceptance criteria has been defined. Setting Acceptance Criteria for an Equivalence Test There are also three different groups of response parameters that will be used; 1) two-sided specifications (USL and LSL), 2) one-sided upper specification limit only or one-sided lower specification limit only and 3) no specification limits possibly just a target or set point. Practical differences should be viewed relative to a target, tolerance or as a function of design margin (Q6B, 4). Acceptance criteria should be risk based (Q9, 3), higher risks should allow only small practical differences and conversely lower risks should allow larger practical differences. Scientific knowledge, product experience and clinical relevance should be evaluated when justifying the risk. Another consideration is the potential influence on process capability (parts per million (PPM) failure rate) and/or out of specification (OOS) rates. For example if the product shifted by 10%, 15% or 20% etc. what will be the likely difference in OOS rates. Z-scores and area under the curve can be used to estimate the impact to PPM rates. A best practice is to always assess the OOS impact of the difference detected. The following risk based acceptance criteria are not absolutes; however, they are typical risk based acceptance criteria:
Case 1. Two Sided Specification Limits, % of Tolerance (USL-LSL) High Risk Medium Risk Low Risk 5-10% 11-25% 26-50% Case 2. One Sided Limits, % of Design Margin (xbar-LSL or USL-xbar) High Risk Medium Risk Low Risk 5-10% 11-25% 26-50% Case 3. No Specification Limits, % of Mean or Design Target (xbar) High Risk Medium Risk Low Risk 5-10% 11-25% 26-50%
USP 1033 also agrees with a risk based approach and the impact to OOS rates, it states:
“The validation target acceptance criteria should be chosen to minimize the risks inherent in making decisions from bioassay measurements and to be reasonable in terms of the capability of the art. When there is an existing product specification, acceptance criteria
can be justified on the basis of the risk that measurements may fall outside of the product specification.”
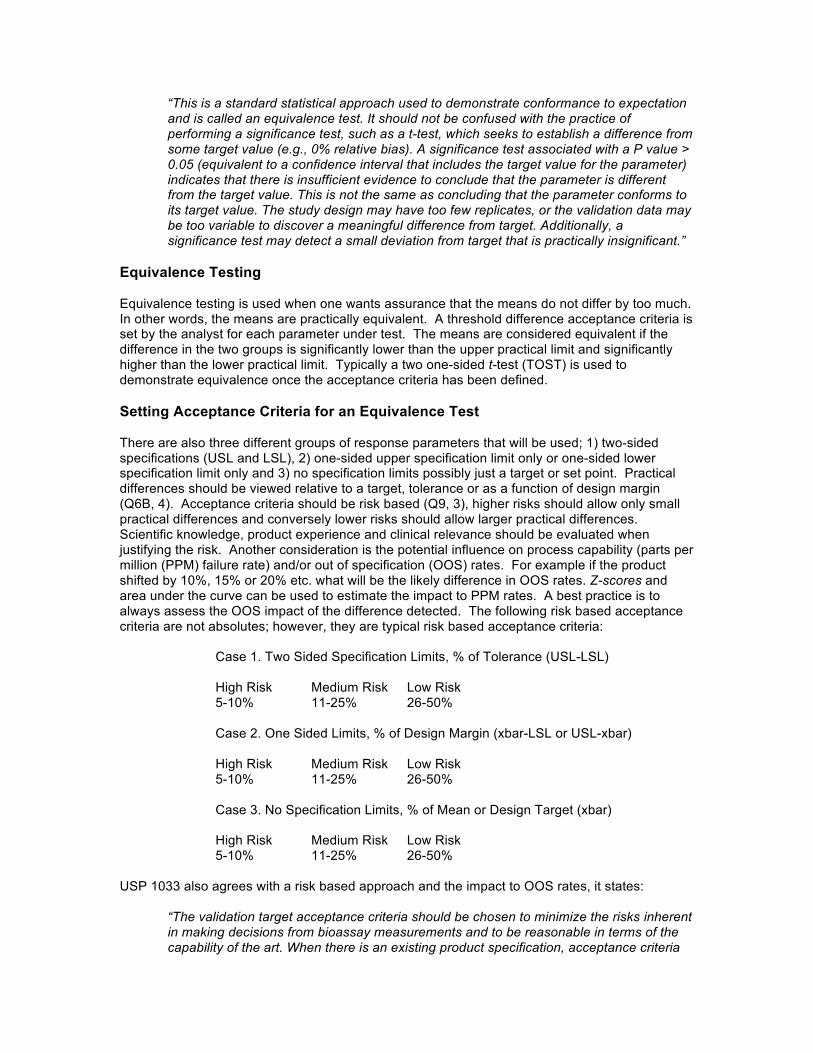
Conducting an Equivalence Test The two one-sided t-tests (TOST, Figure 1.0) approach to equivalence is commonly used to demonstrate comparability. The two one-sided t-tests are constructed and if both tests reject the null hypotheses then there is no practical difference and thus they are considered comparable for that parameter. The mean is considered to be within the equivalence window where there is no practical difference in performance. In cases where there are only one-sided tests such as impurities and/or purity the acceptance criteria may not be a uniform distance from zero as the risk is not the same for lower impurities than baseline versus higher impurities than baseline. Equivalence is not just a window test to see if the difference is in the window, it includes key sources of variation such as the analytical and process error to assure it is significantly within the window. The difference must be significantly higher than the lower practical limit and significantly lower than the upper practical limit. Inside the window but not significantly within the window may indicate excessive variation and or insufficient sample size or power to detect the difference. Confidence intervals are also a best practice (Figure 2.0) and should be included in any equivalence test report.
Figure 1.0 Two One-Sided t-Test
Figure 2.0 One-Sided Confidence Intervals
Application of Equivalence Tests to Study Designs Anytime a statistical test is used an equivalence alternative may be possible or even preferred. The following are study designs where equivalence testing is an option:
1. Comparison to a reference standard or target 2. Comparison between two groups 3. Comparison between n groups 4. Repeated measures or paired t-tests
Figure 1 Two One Sided t-test Illustration for Cases One and Four
5. Multiple factor equivalence testing 6. Comparison of slopes for stability 7. Comparison of intercepts 8. Comparisons of curve parameters (linear or sigmoidal)
For the purposes of this paper one example will be presented, 1) comparison to reference or standard. The logic is very similar for each study design.
Equivalence Testing Comparing Performance to a Standard
The following is the procedure conducting an equivalence tests to a standard.
1. Select the standard to be used in the comparison and assure the standard value is known.
2. Determine the upper and lower practical limits where deviations are considered to be practically zero. Make sure to consider risk and the three types of groups when setting practical limits. Risk is medium for pH so a difference of 15% of tolerance was selected. Upper specification limit is a pH of 8 and lower specification limit is 7 so the lower practical limit (LPL) = -0.15 and the upper practical limit (UPL) is 0.15.
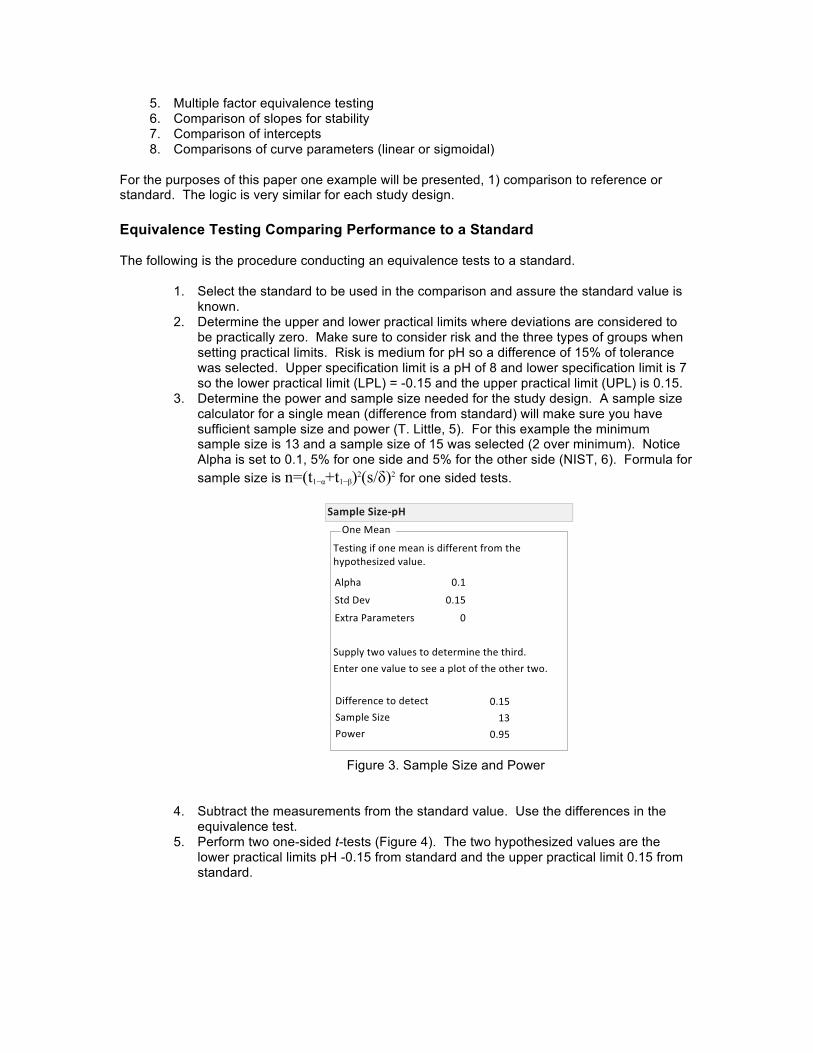
3. Determine the power and sample size needed for the study design. A sample size calculator for a single mean (difference from standard) will make sure you have sufficient sample size and power (T. Little, 5). For this example the minimum sample size is 13 and a sample size of 15 was selected (2 over minimum). Notice Alpha is set to 0.1, 5% for one side and 5% for the other side (NIST, 6). Formula for sample size is n=(t1−α+t1−β)2(s/δ)2 for one sided tests.
Figure 3. Sample Size and Power
4. Subtract the measurements from the standard value. Use the differences in the equivalence test.
5. Perform two one-sided t-tests (Figure 4). The two hypothesized values are the lower practical limits pH -0.15 from standard and the upper practical limit 0.15 from standard.
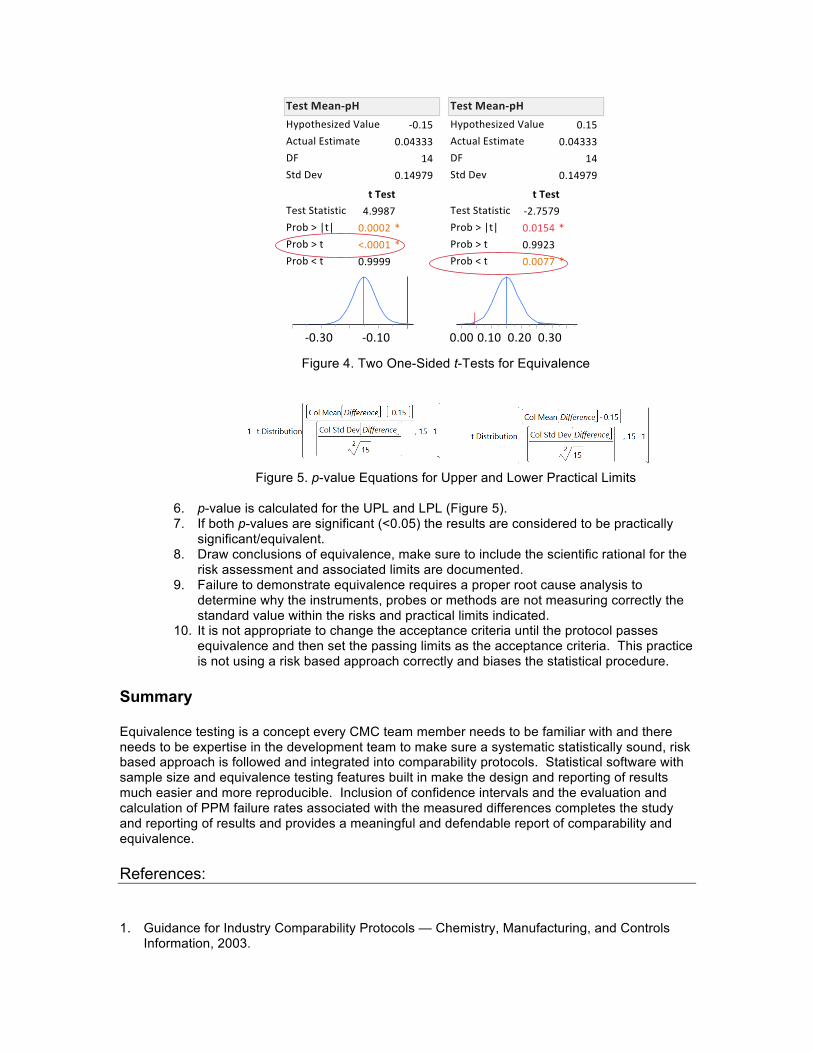
Figure 4. Two One-Sided t-Tests for Equivalence
Figure 5. p-value Equations for Upper and Lower Practical Limits
6. p-value is calculated for the UPL and LPL (Figure 5). 7. If both p-values are significant (<0.05) the results are considered to be practically
significant/equivalent. 8. Draw conclusions of equivalence, make sure to include the scientific rational for the
risk assessment and associated limits are documented. 9. Failure to demonstrate equivalence requires a proper root cause analysis to
determine why the instruments, probes or methods are not measuring correctly the standard value within the risks and practical limits indicated.
10. It is not appropriate to change the acceptance criteria until the protocol passes equivalence and then set the passing limits as the acceptance criteria. This practice is not using a risk based approach correctly and biases the statistical procedure.
Summary Equivalence testing is a concept every CMC team member needs to be familiar with and there needs to be expertise in the development team to make sure a systematic statistically sound, risk based approach is followed and integrated into comparability protocols. Statistical software with sample size and equivalence testing features built in make the design and reporting of results much easier and more reproducible. Inclusion of confidence intervals and the evaluation and calculation of PPM failure rates associated with the measured differences completes the study and reporting of results and provides a meaningful and defendable report of comparability and equivalence. References: 1. Guidance for Industry Comparability Protocols — Chemistry, Manufacturing, and Controls
Information, 2003.

2. USP 1033 Biological Assay Validation, 2010. 3. ICH Q9, Quality Risk Management 4. ICH Q6B Specifications: Test Procedures and Acceptance Criteria for
Biotechnological/Biological Products 5. T. Little, Developing Representative Sampling Plans for Development, Problem Solving, and
Validation, Biopharm International, November 2014. 6. NIST, http://www.itl.nist.gov/div898/handbook/prc/section2/prc222.htm