Embed Size (px)
Citation preview
ERASMUS+ BAROMETER 2014 Survey Final Results
By Gregoris A. Makrides
With the cooperation of the European Commission
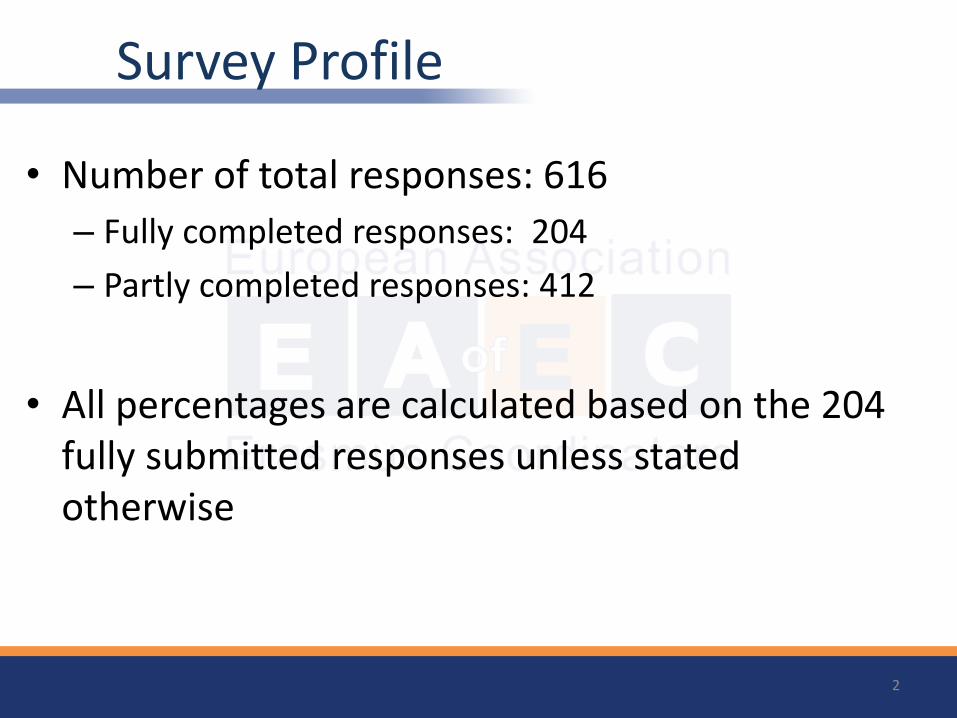
Survey Profile
• Number of total responses: 616
– Fully completed responses: 204
– Partly completed responses: 412
• All percentages are calculated based on the 204 fully submitted responses unless stated otherwise
2

Survey Demographics
• Data From 31 Different Countries – Ireland, Slovenia, Netherlands, Austria, Luxemburg, FYROM: 1 University / country
– Hungary, Italy, Malta: 2 Universities / country
– Turkey, Portugal, Denmark, Norway: 3 Universities / country
– Latvia, United Kingdom: 4 Universities / country
– Lithuania, Estonia, Greece: 5 Universities / country
– Czech Republic, Romania, France: 7 Universities / country
– Bulgaria, Slovakia, Sweden, Cyprus: 8 Universities / country
– Belgium: 9 Universities / country
– Finland, Poland: 10 Universities / country
– Croatia: 12 Universities / country
– Germany: 13 Universities / country
– Spain: 48 Universities / country
3
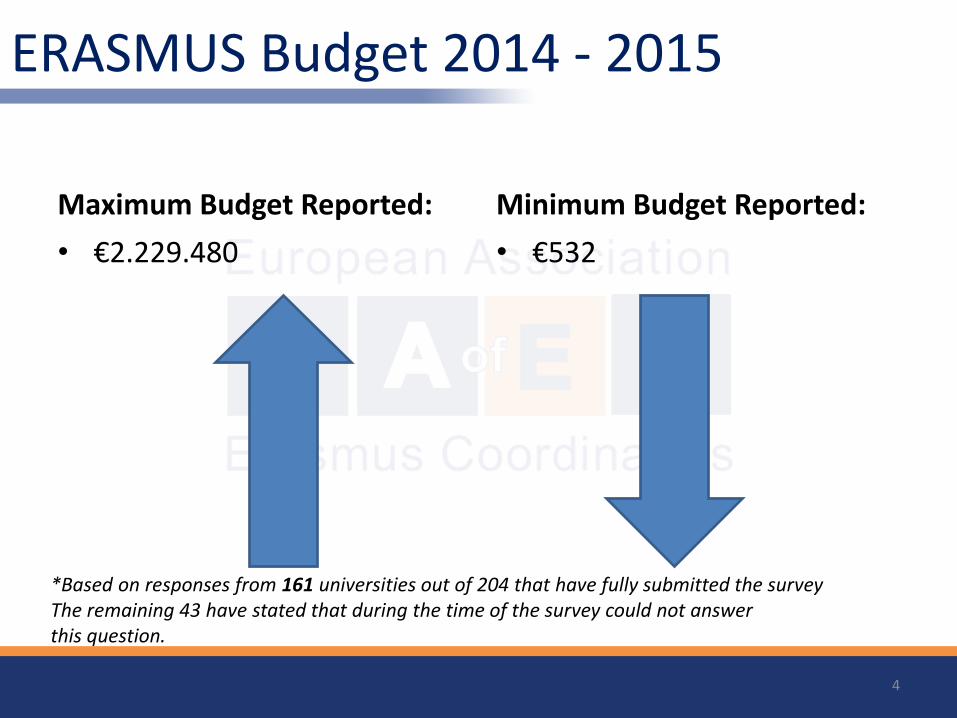
ERASMUS Budget 2014 - 2015
Maximum Budget Reported:
• €2.229.480
Minimum Budget Reported:
• €532
4
*Based on responses from 161 universities out of 204 that have fully submitted the survey The remaining 43 have stated that during the time of the survey could not answer this question.
ERASMUS+ MOBILITY BETWEEN PROGRAMME COUNTRIES
SELECTED QUESTIONS: PART A
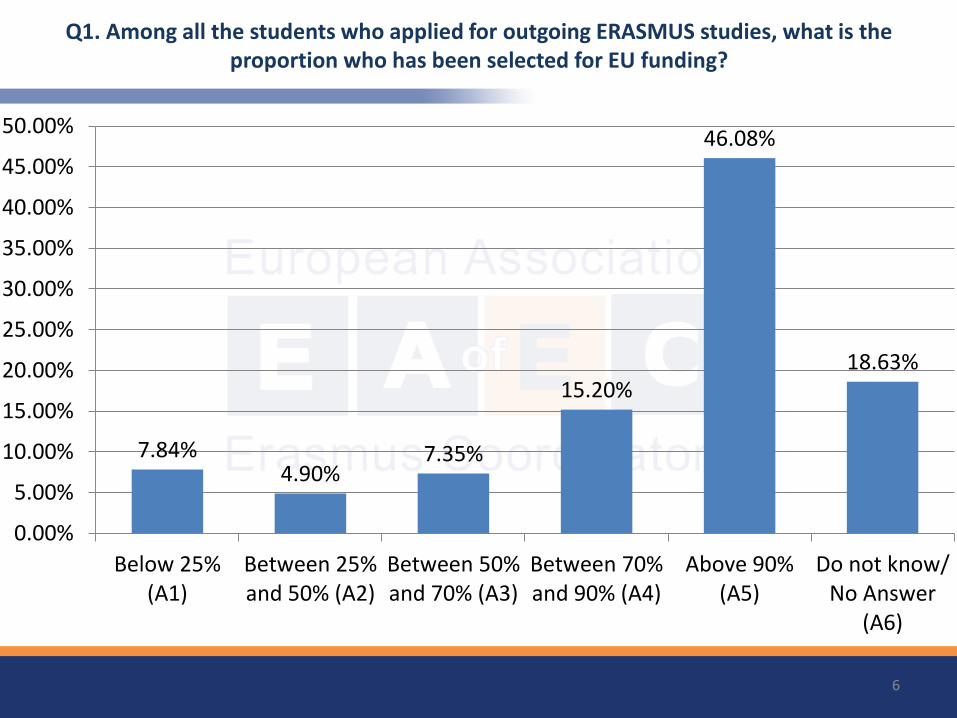
Q1. Among all the students who applied for outgoing ERASMUS studies, what is the proportion who has been selected for EU funding?
6
7.84% 4.90%
7.35%
15.20%
46.08%
18.63%
0.00%
5.00%
10.00%
15.00%
20.00%
25.00%
30.00%
35.00%
40.00%
45.00%
50.00%
Below 25%(A1)
Between 25%and 50% (A2)
Between 50%and 70% (A3)
Between 70%and 90% (A4)
Above 90%(A5)
Do not know/No Answer
(A6)
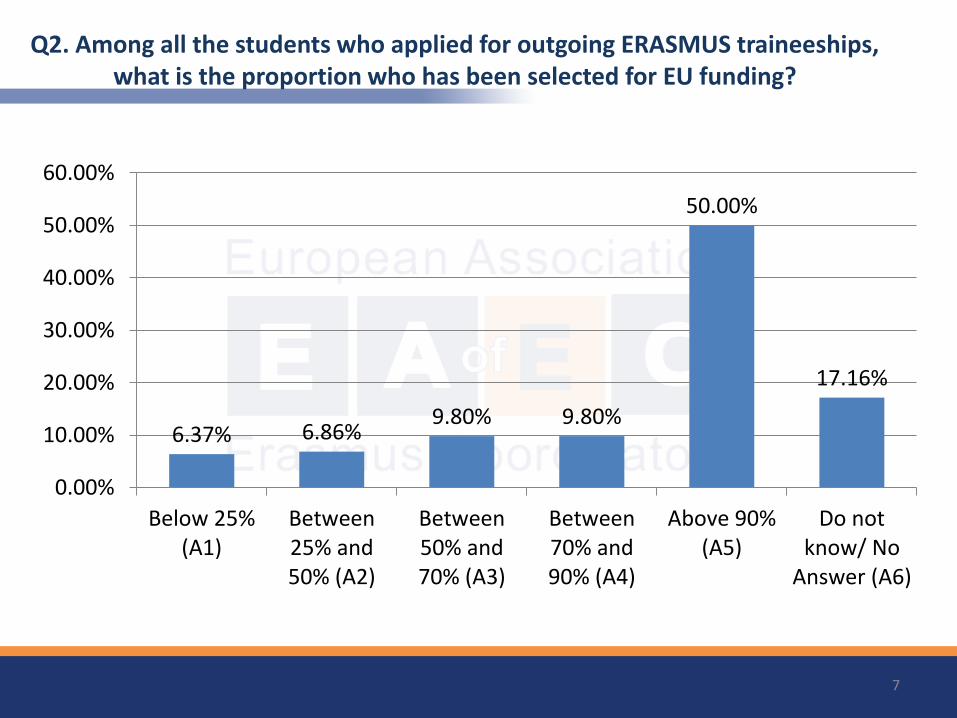
Q2. Among all the students who applied for outgoing ERASMUS traineeships, what is the proportion who has been selected for EU funding?
7
6.37% 6.86% 9.80% 9.80%
50.00%
17.16%
0.00%
10.00%
20.00%
30.00%
40.00%
50.00%
60.00%
Below 25%(A1)
Between25% and50% (A2)
Between50% and70% (A3)
Between70% and90% (A4)
Above 90%(A5)
Do notknow/ No
Answer (A6)
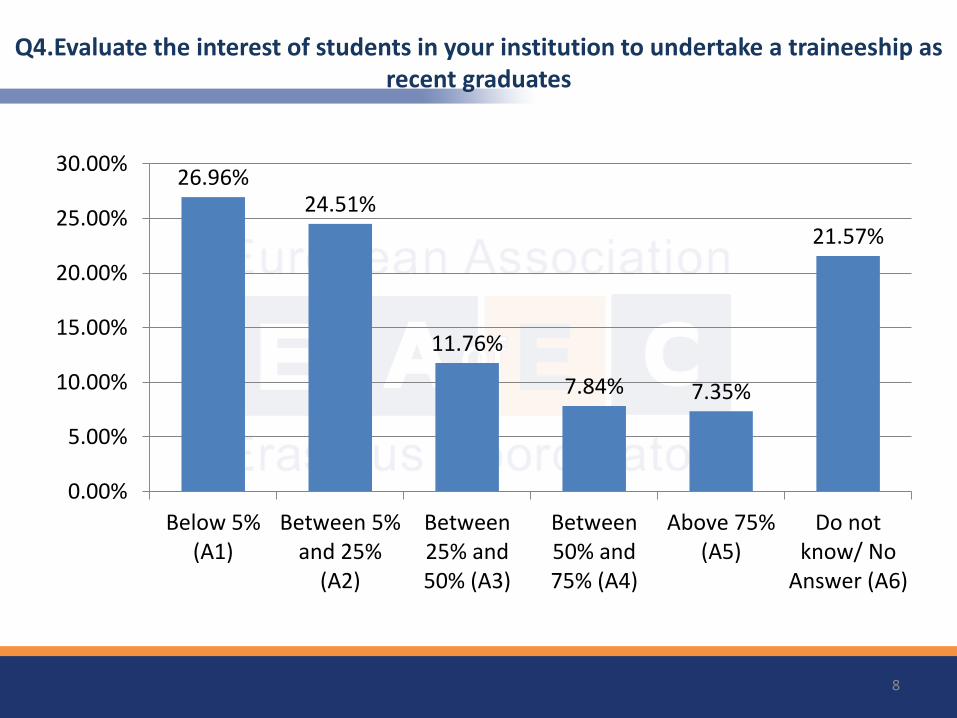
Q4.Evaluate the interest of students in your institution to undertake a traineeship as recent graduates
8
26.96% 24.51%
11.76%
7.84% 7.35%
21.57%
Below 5%(A1)
Between 5%and 25%
(A2)
Between25% and50% (A3)
Between50% and75% (A4)
Above 75%(A5)
Do notknow/ No
Answer (A6)
0.00%
5.00%
10.00%
15.00%
20.00%
25.00%
30.00%
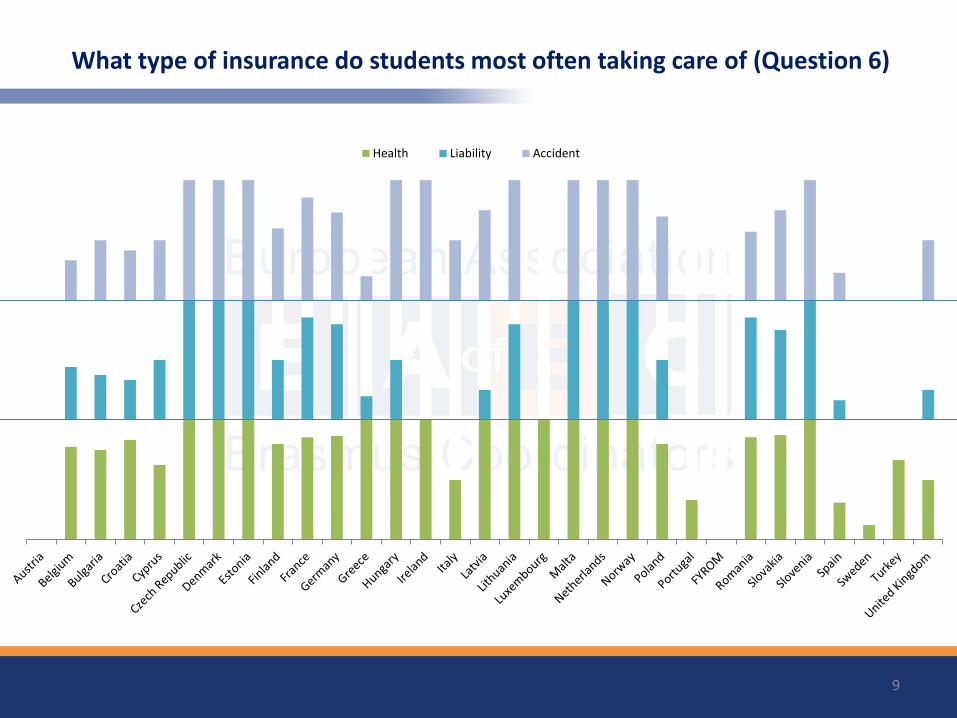
What type of insurance do students most often taking care of (Question 6)
9
Health Liability Accident
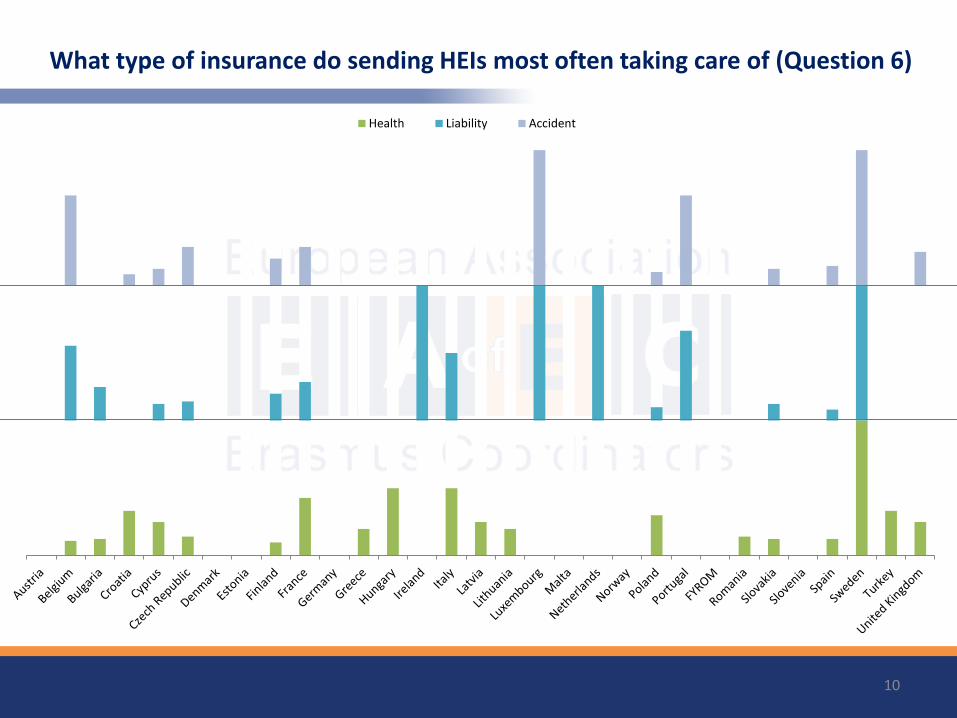
What type of insurance do sending HEIs most often taking care of (Question 6)
10
Health Liability Accident
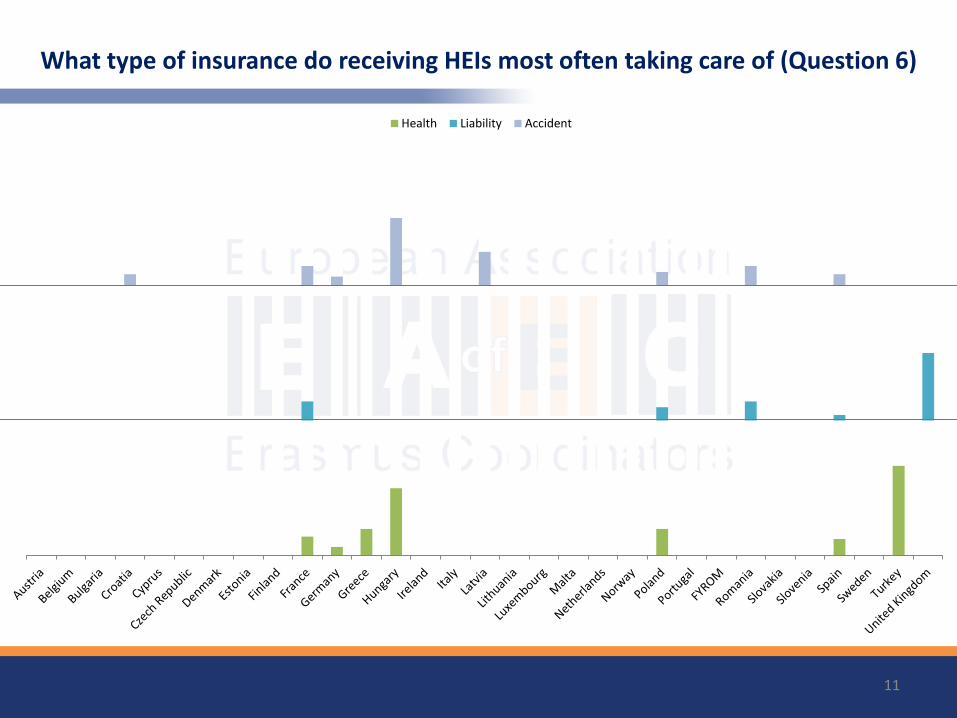
What type of insurance do receiving HEIs most often taking care of (Question 6)
11
Health Liability Accident
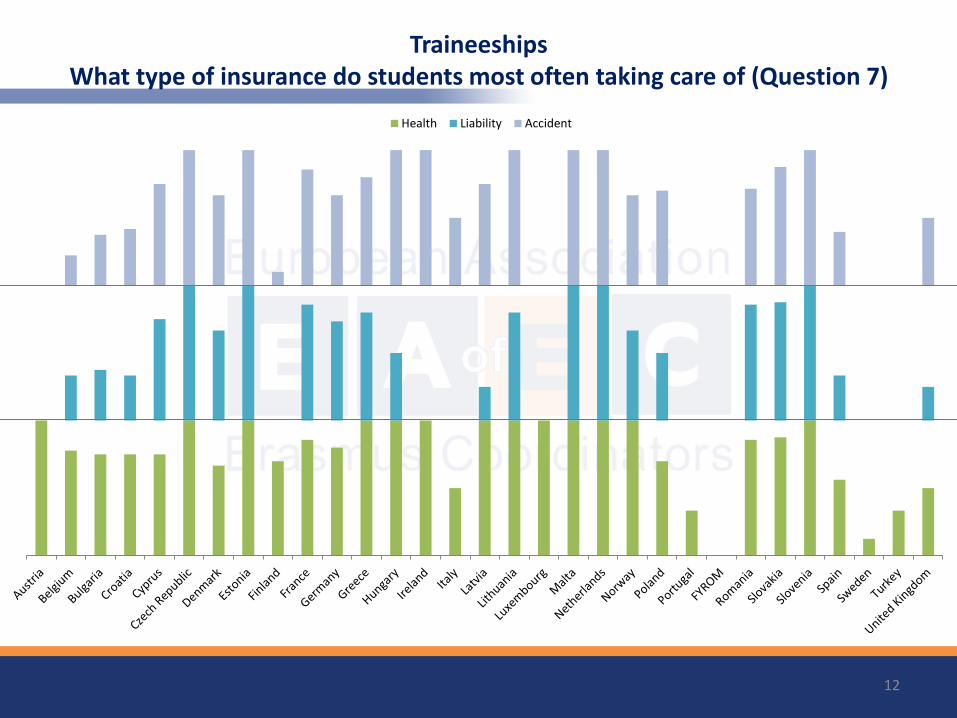
Traineeships What type of insurance do students most often taking care of (Question 7)
12
Health Liability Accident
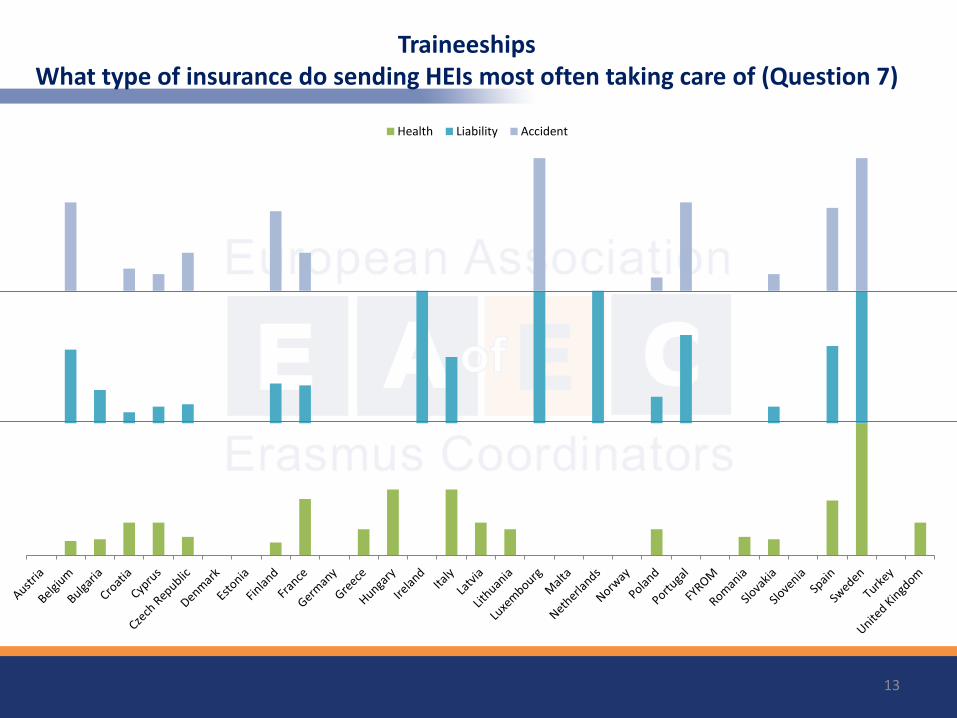
Traineeships What type of insurance do sending HEIs most often taking care of (Question 7)
13
Health Liability Accident
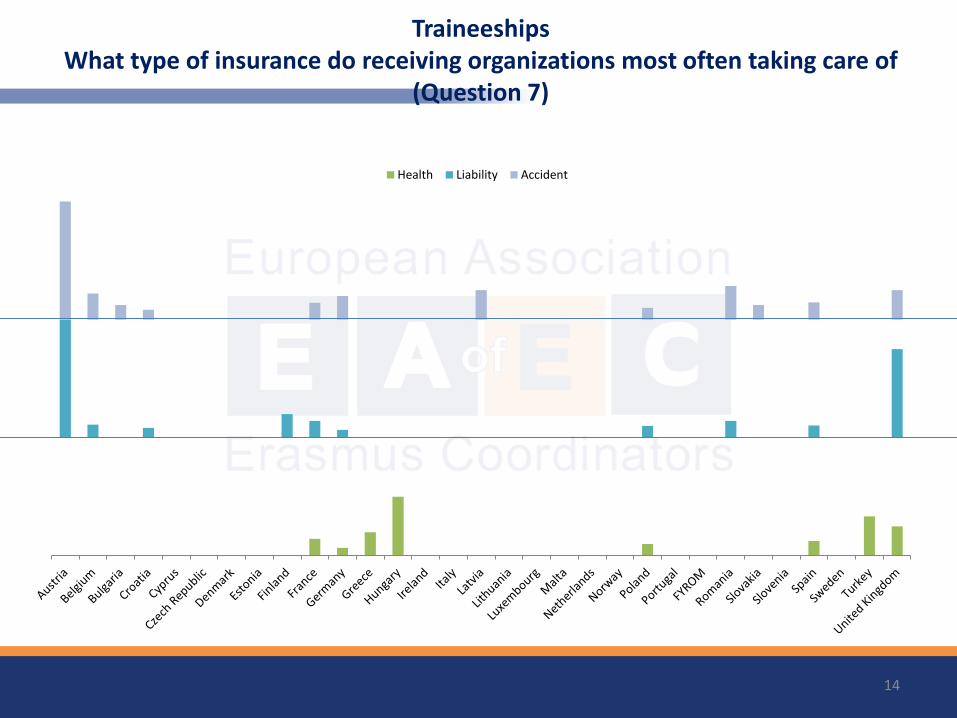
Traineeships What type of insurance do receiving organizations most often taking care of
(Question 7)
14
Health Liability Accident

Q8.To which extent is the Mobility Tool adapted to your needs in terms of monitoring your mobilities?
15
9.31%
30.39%
20.59%
16.18%
14.22%
9.31%
Adapted very well (A1)
Adapted reasonably well (A2)
Somewhat adapted (A3)
Slightly adapted (A4)
Not adapted at all (A5)
Do not know/ No Answer (A6)
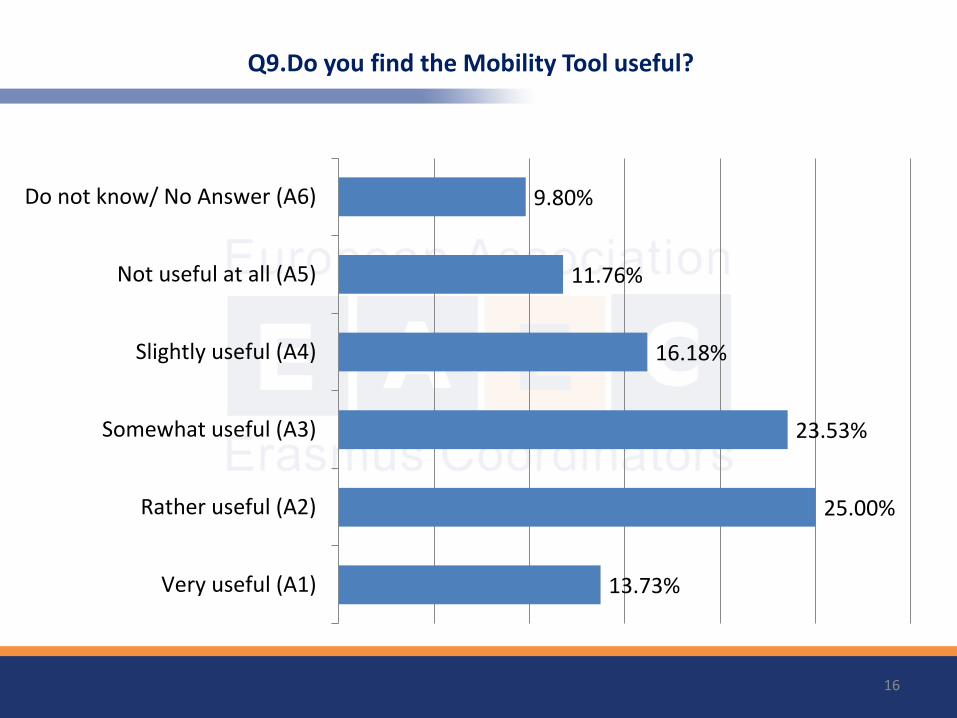
Q9.Do you find the Mobility Tool useful?
16
13.73%
25.00%
23.53%
16.18%
11.76%
9.80%
Very useful (A1)
Rather useful (A2)
Somewhat useful (A3)
Slightly useful (A4)
Not useful at all (A5)
Do not know/ No Answer (A6)
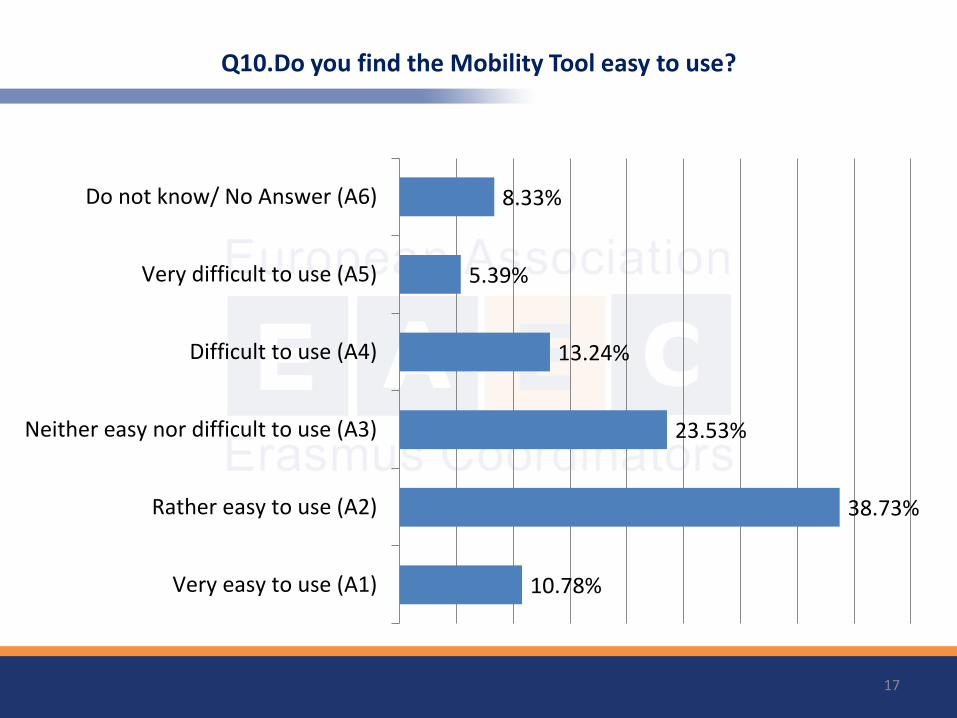
Q10.Do you find the Mobility Tool easy to use?
17
10.78%
38.73%
23.53%
13.24%
5.39%
8.33%
Very easy to use (A1)
Rather easy to use (A2)
Neither easy nor difficult to use (A3)
Difficult to use (A4)
Very difficult to use (A5)
Do not know/ No Answer (A6)
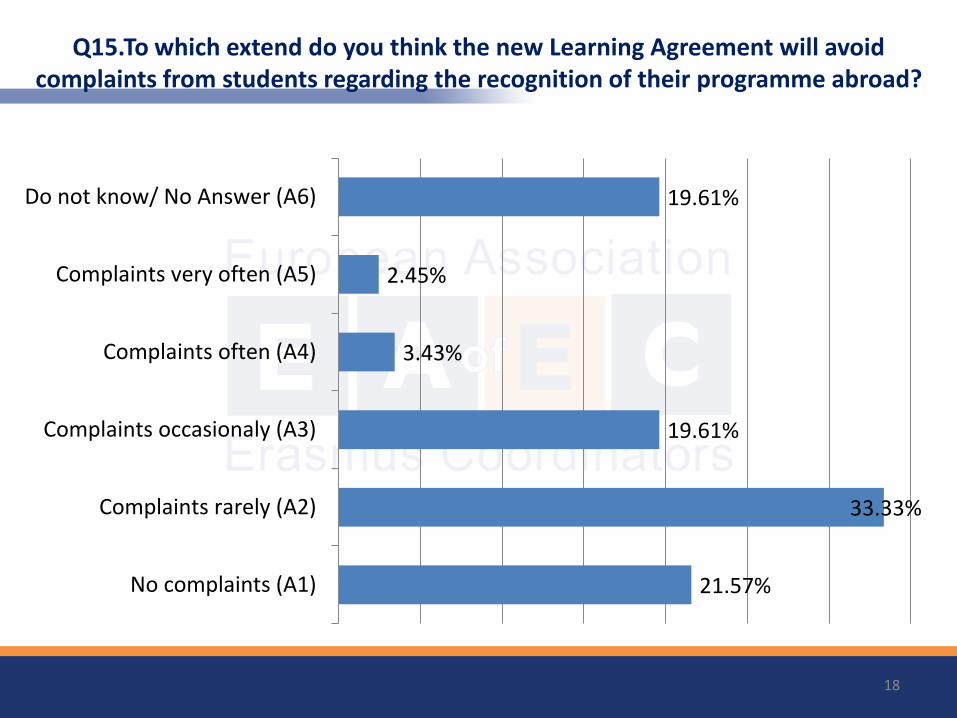
Q15.To which extend do you think the new Learning Agreement will avoid complaints from students regarding the recognition of their programme abroad?
18
21.57%
33.33%
19.61%
3.43%
2.45%
19.61%
No complaints (A1)
Complaints rarely (A2)
Complaints occasionaly (A3)
Complaints often (A4)
Complaints very often (A5)
Do not know/ No Answer (A6)
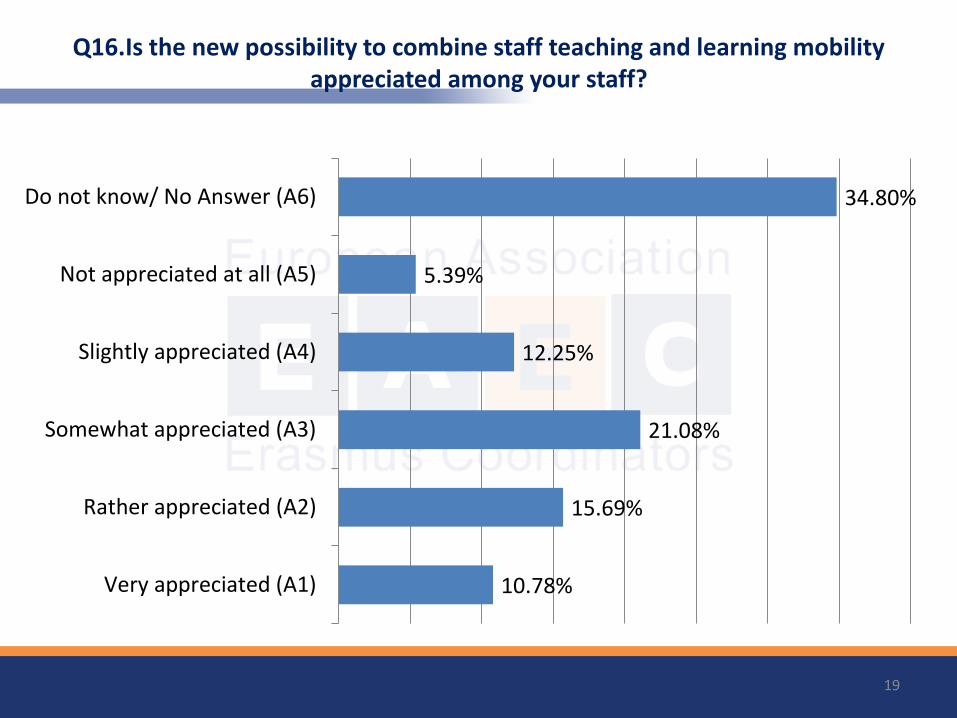
Q16.Is the new possibility to combine staff teaching and learning mobility appreciated among your staff?
19
10.78%
15.69%
21.08%
12.25%
5.39%
34.80%
Very appreciated (A1)
Rather appreciated (A2)
Somewhat appreciated (A3)
Slightly appreciated (A4)
Not appreciated at all (A5)
Do not know/ No Answer (A6)
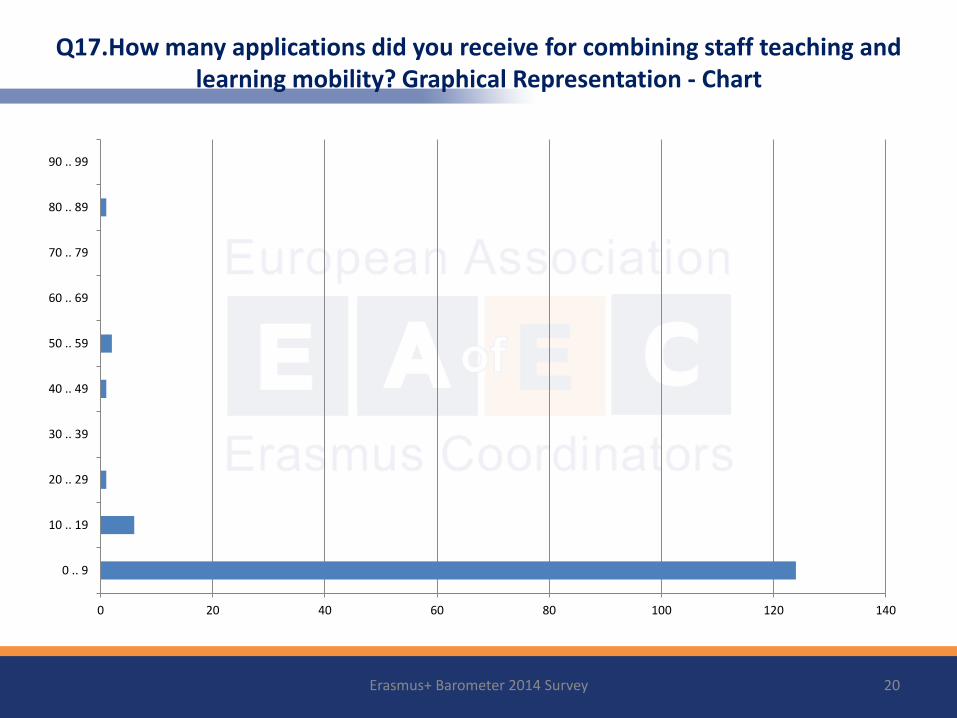
Q17.How many applications did you receive for combining staff teaching and learning mobility? Graphical Representation - Chart
Erasmus+ Barometer 2014 Survey 20
0 20 40 60 80 100 120 140
0 .. 9
10 .. 19
20 .. 29
30 .. 39
40 .. 49
50 .. 59
60 .. 69
70 .. 79
80 .. 89
90 .. 99
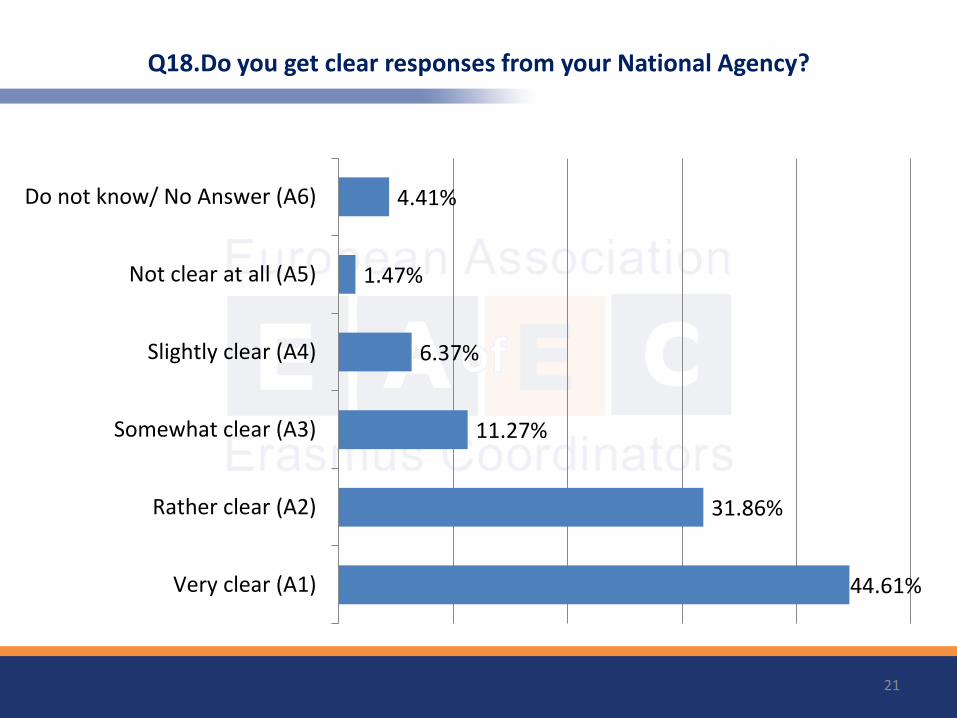
Q18.Do you get clear responses from your National Agency?
21
44.61%
31.86%
11.27%
6.37%
1.47%
4.41%
Very clear (A1)
Rather clear (A2)
Somewhat clear (A3)
Slightly clear (A4)
Not clear at all (A5)
Do not know/ No Answer (A6)
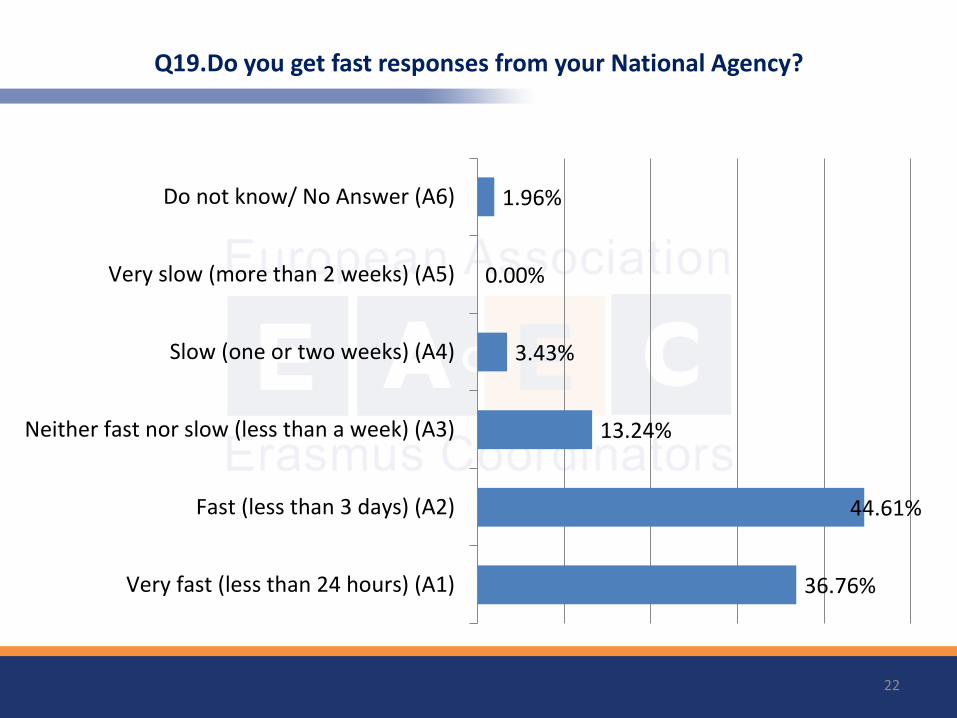
Q19.Do you get fast responses from your National Agency?
22
36.76%
44.61%
13.24%
3.43%
0.00%
1.96%
Very fast (less than 24 hours) (A1)
Fast (less than 3 days) (A2)
Neither fast nor slow (less than a week) (A3)
Slow (one or two weeks) (A4)
Very slow (more than 2 weeks) (A5)
Do not know/ No Answer (A6)
ERASMUS + INTERNATIONAL
QUESTIONS: PART B
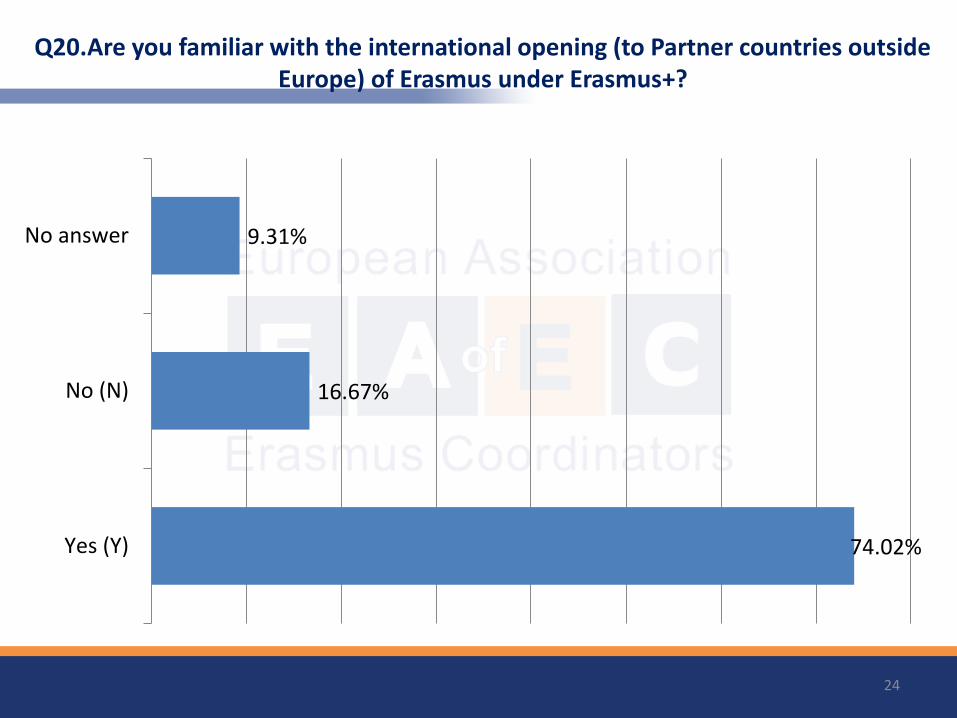
Q20.Are you familiar with the international opening (to Partner countries outside Europe) of Erasmus under Erasmus+?
24
74.02%
16.67%
9.31%
Yes (Y)
No (N)
No answer
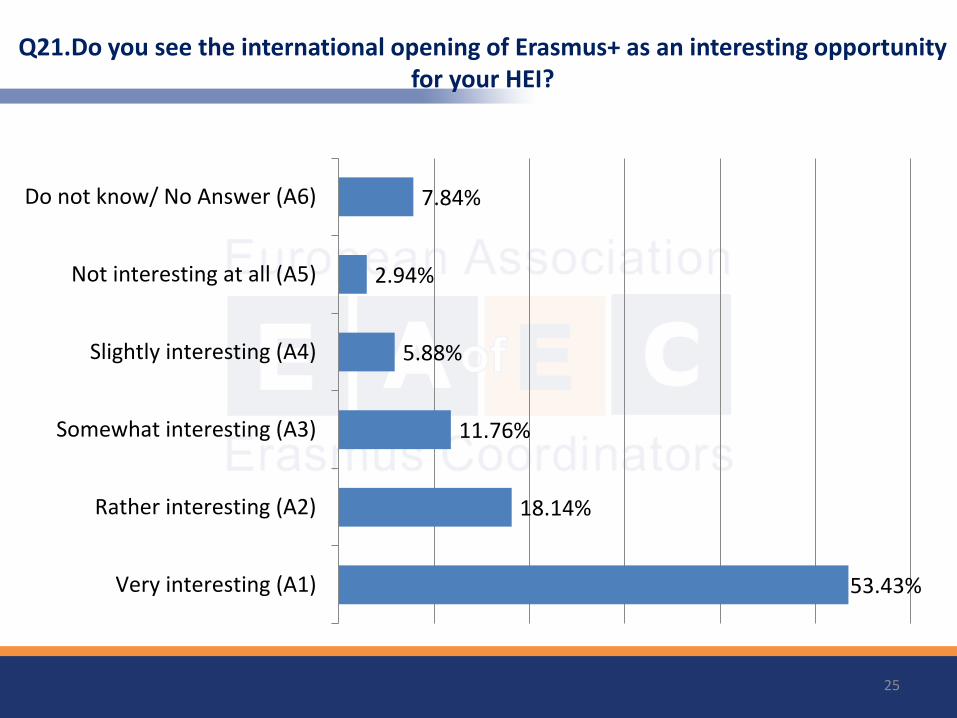
Q21.Do you see the international opening of Erasmus+ as an interesting opportunity for your HEI?
25
53.43%
18.14%
11.76%
5.88%
2.94%
7.84%
Very interesting (A1)
Rather interesting (A2)
Somewhat interesting (A3)
Slightly interesting (A4)
Not interesting at all (A5)
Do not know/ No Answer (A6)
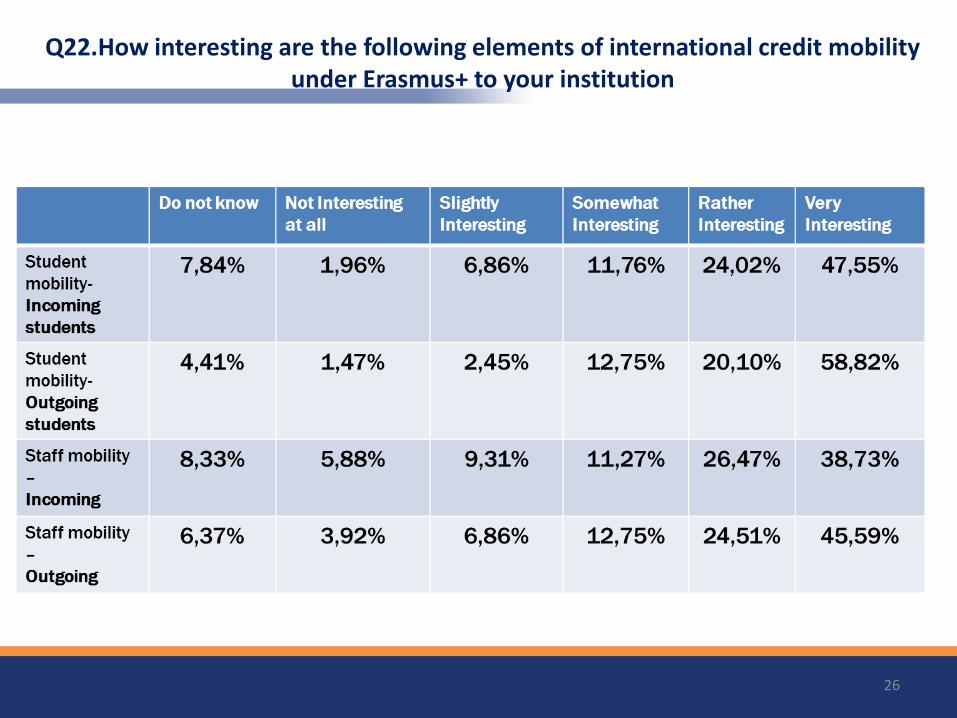
Q22.How interesting are the following elements of international credit mobility under Erasmus+ to your institution
26
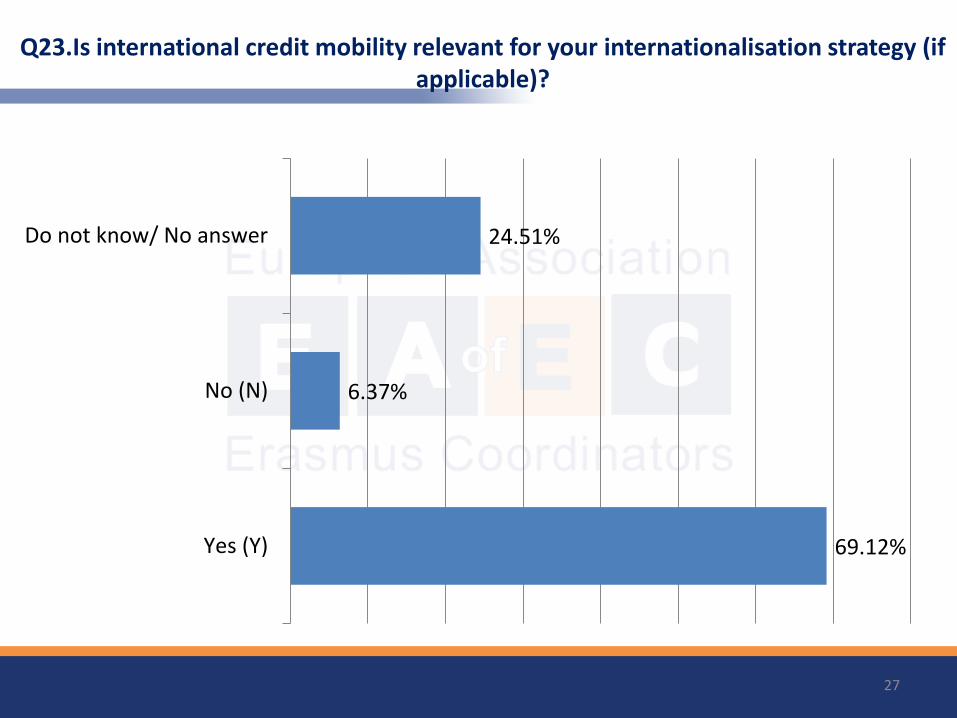
Q23.Is international credit mobility relevant for your internationalisation strategy (if applicable)?
27
69.12%
6.37%
24.51%
Yes (Y)
No (N)
Do not know/ No answer
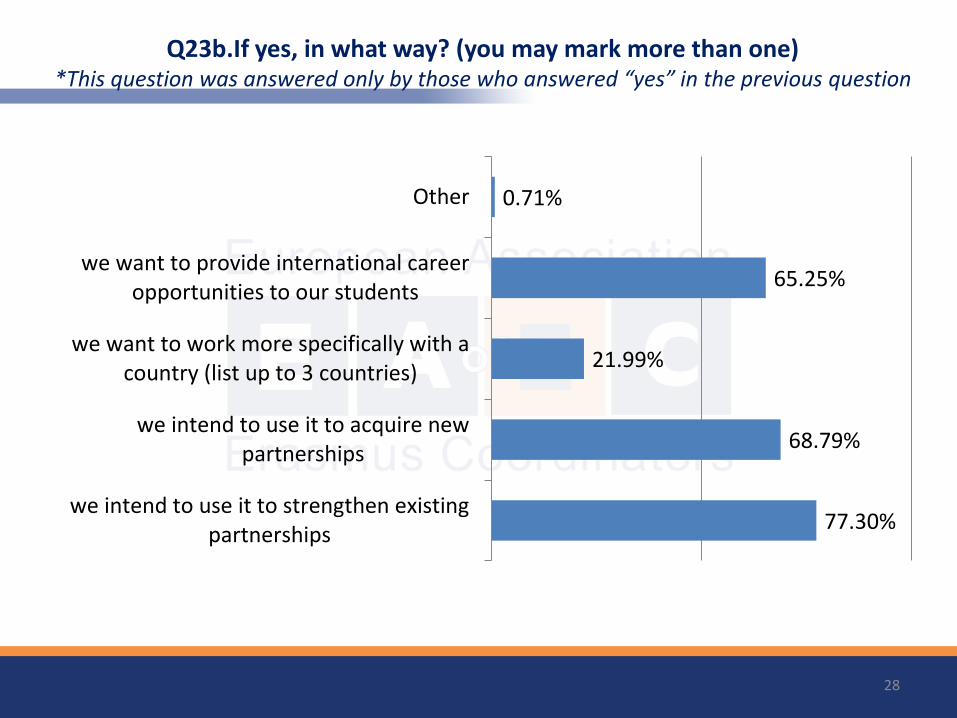
Q23b.If yes, in what way? (you may mark more than one) *This question was answered only by those who answered “yes” in the previous question
28
77.30%
68.79%
21.99%
65.25%
0.71%
we intend to use it to strengthen existingpartnerships
we intend to use it to acquire newpartnerships
we want to work more specifically with acountry (list up to 3 countries)
we want to provide international careeropportunities to our students
Other
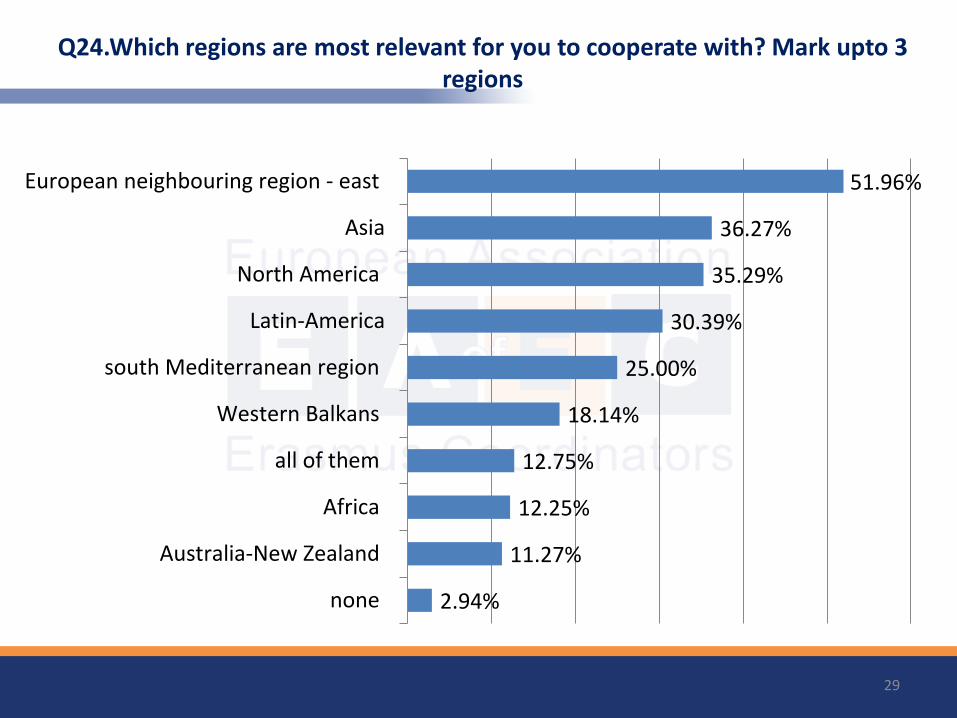
Q24.Which regions are most relevant for you to cooperate with? Mark upto 3 regions
29
2.94%
11.27%
12.25%
12.75%
18.14%
25.00%
30.39%
35.29%
36.27%
51.96%
none
Australia-New Zealand
Africa
all of them
Western Balkans
south Mediterranean region
Latin-America
North America
Asia
European neighbouring region - east
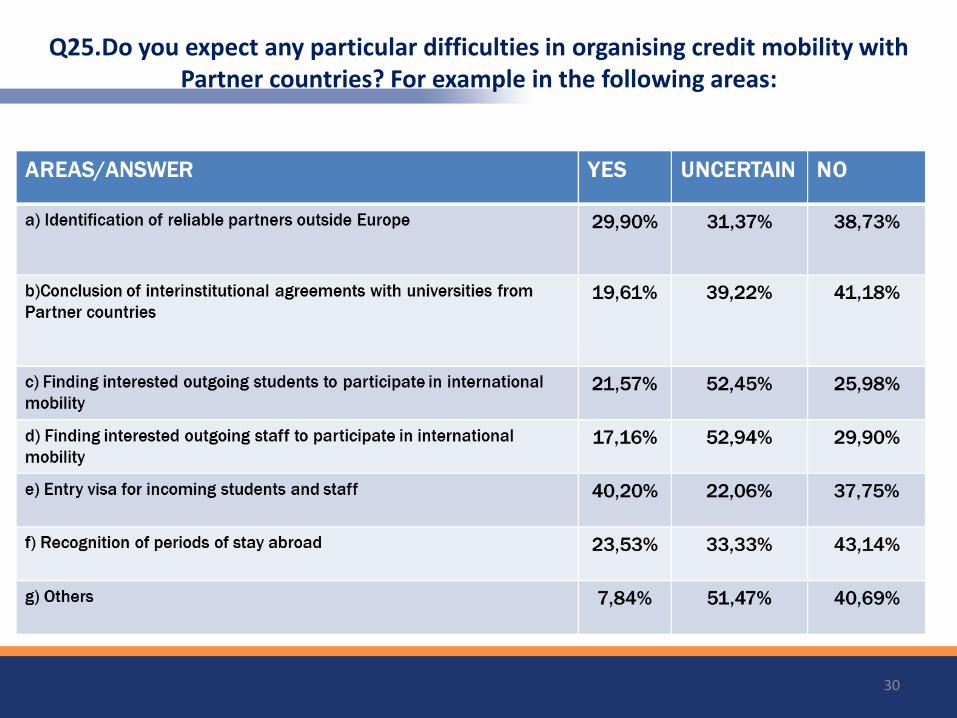
Q25.Do you expect any particular difficulties in organising credit mobility with Partner countries? For example in the following areas:
30
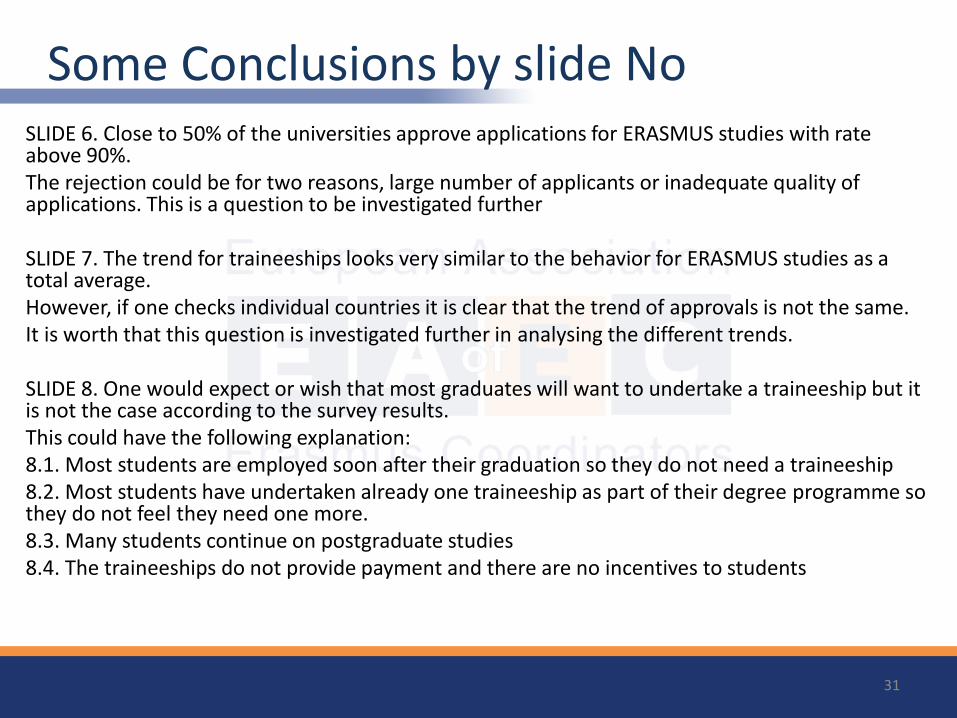
Some Conclusions by slide No SLIDE 6. Close to 50% of the universities approve applications for ERASMUS studies with rate above 90%. The rejection could be for two reasons, large number of applicants or inadequate quality of applications. This is a question to be investigated further SLIDE 7. The trend for traineeships looks very similar to the behavior for ERASMUS studies as a total average. However, if one checks individual countries it is clear that the trend of approvals is not the same. It is worth that this question is investigated further in analysing the different trends. SLIDE 8. One would expect or wish that most graduates will want to undertake a traineeship but it is not the case according to the survey results. This could have the following explanation: 8.1. Most students are employed soon after their graduation so they do not need a traineeship 8.2. Most students have undertaken already one traineeship as part of their degree programme so they do not feel they need one more. 8.3. Many students continue on postgraduate studies 8.4. The traineeships do not provide payment and there are no incentives to students
31
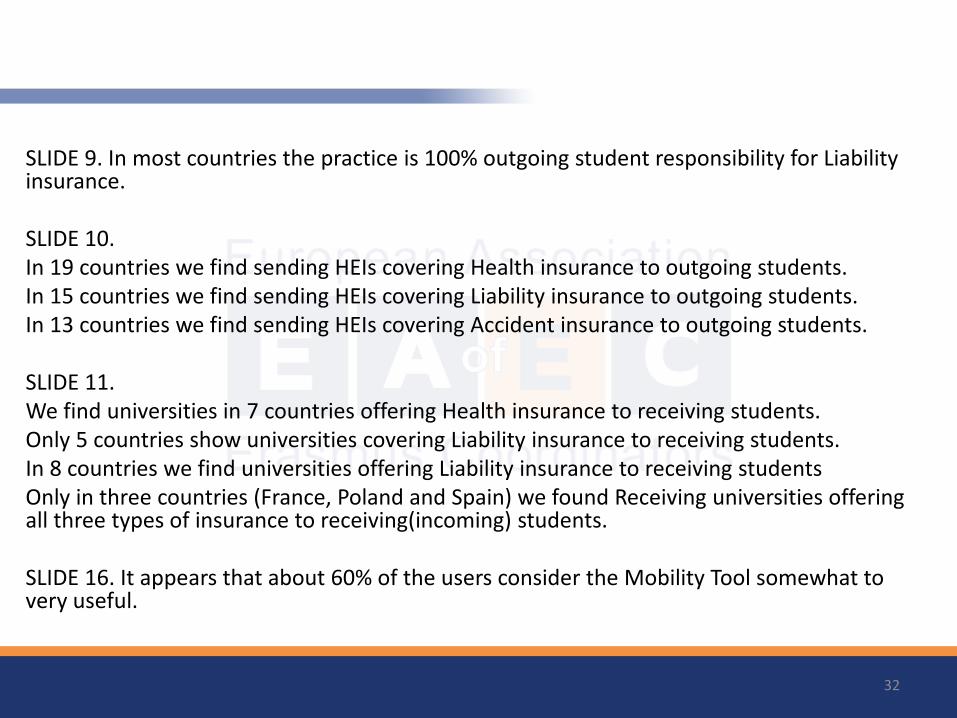
SLIDE 9. In most countries the practice is 100% outgoing student responsibility for Liability insurance. SLIDE 10. In 19 countries we find sending HEIs covering Health insurance to outgoing students. In 15 countries we find sending HEIs covering Liability insurance to outgoing students. In 13 countries we find sending HEIs covering Accident insurance to outgoing students. SLIDE 11. We find universities in 7 countries offering Health insurance to receiving students. Only 5 countries show universities covering Liability insurance to receiving students. In 8 countries we find universities offering Liability insurance to receiving students Only in three countries (France, Poland and Spain) we found Receiving universities offering all three types of insurance to receiving(incoming) students. SLIDE 16. It appears that about 60% of the users consider the Mobility Tool somewhat to very useful.
32
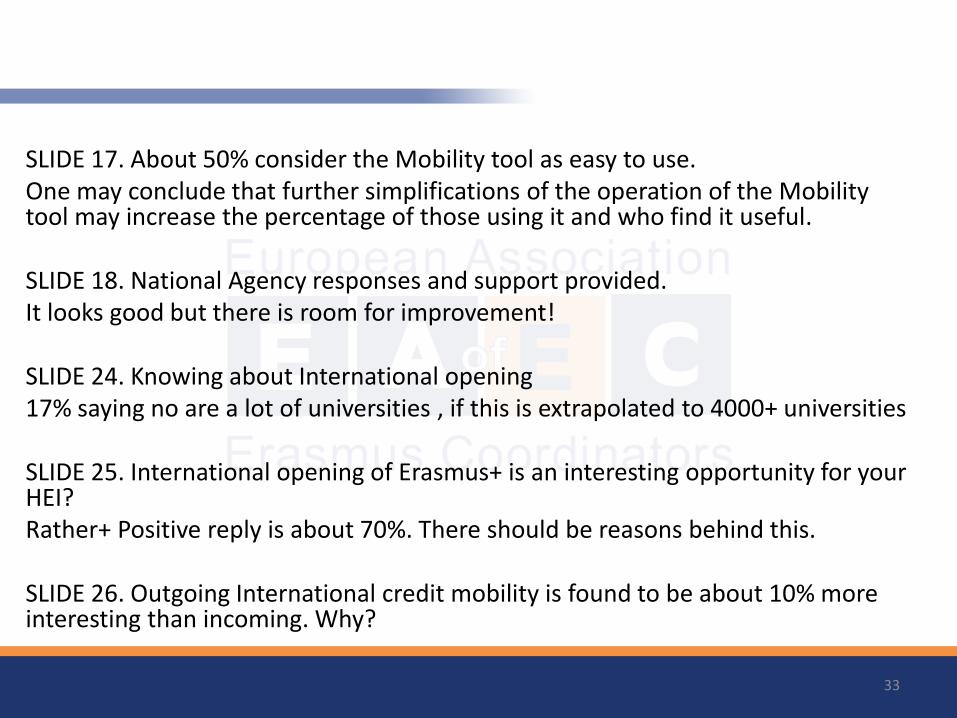
SLIDE 17. About 50% consider the Mobility tool as easy to use. One may conclude that further simplifications of the operation of the Mobility tool may increase the percentage of those using it and who find it useful. SLIDE 18. National Agency responses and support provided. It looks good but there is room for improvement! SLIDE 24. Knowing about International opening 17% saying no are a lot of universities , if this is extrapolated to 4000+ universities SLIDE 25. International opening of Erasmus+ is an interesting opportunity for your HEI? Rather+ Positive reply is about 70%. There should be reasons behind this. SLIDE 26. Outgoing International credit mobility is found to be about 10% more interesting than incoming. Why?
33
Thank you for your attention
END OF PRESENTATION


![Barometer [2006]](https://img.pdfslide.net/doc/110x75/577d35011a28ab3a6b8f584c/barometer-2006.jpg)