Embed Size (px)
Citation preview
ERD
C/CE
RL T
R-11
-14
DoD Corrosion Prevention and Control Program
In Situ Corrosion and Heat Loss Assessment of Two Nonstandard Underground Heat Distribution System Piping Designs Final Report on Project F07-AR01
Cons
truc
tion
Engi
neer
ing
Res
earc
h La
bora
tory
Alfred D. Beitelman, Charles P. Marsh, Douglas Neale, Vernon Meyer, John Taylor, David Butler, Forest Mandan, Lawrence Clark, and Thomas A. Carlson
June 2011
Approved for public release; distribution is unlimited.

Department of Defense Corrosion Prevention and Control Program
ERDC/CERL TR-11-14 June 2011
In Situ Corrosion and Heat Loss Assessment of Two Nonstandard Underground Heat Distribution System Piping Designs Final Report on CPC Project F07-AR01
Alfred D. Beitelman and Charles P. Marsh, and Thomas A. Carlson Construction Engineering Research Laboratory U.S. Army Engineer Research and Development Center 2902 Newmark Drive Champaign, IL 61822
Douglas Neale, Vernon Meyer, John Taylor, David Butler, Forest Mandan, and Lawrence Clark Mandaree Enterprise Corporation 812 Park Drive Warner Robins, GA 31088
Final report Approved for public release; distribution is unlimited.
Prepared for Office of the Secretary of Defense (OUSD(AT&L)) 3090 Defense Pentagon Washington, DC 20301-3090
Under Military Interdepartmental Purchase Request MIPR7CCORB1019, dated 21 November 2006.
ERDC/CERL TR-11-14 ii
Abstract: The objective of this project was to assess the performance of nonstandard underground heat distribution system (UHDS) designs being implemented at various Department of Defense (DoD) installations. These systems incorporate nonmetallic cladding and alternative insulation mate-rials that are advertised to improve energy conservation and corrosion re-sistance, but they deviate from established guide specifications for UHDS. The ongoing reliable operation of UHDS on military installations is mis-sion-critical, and service interruptions can have adverse and extended negative mission impacts.
This report documents the assessment of two similar nonstandard UHDS piping system designs — one at Fort Carson, CO, and one at Fort Stewart, GA. The study consisted of environmental corrosivity tests, air pressure tests, visible inspection of excavated sections, and heat loss evaluation us-ing two methods. Deficiencies in design, installation, and accessibility for maintenance were recorded, and significantly degraded sections were doc-umented. Recommendations for addressing site-specific deficiencies are offered, and supporting technical discussions are provided. Overall, it is advised that these systems not be recommended or allowed in guide speci-fications and criteria.
DISCLAIMER: The contents of this report are not to be used for advertising, publication, or promotional purposes. Citation of trade names does not constitute an official endorsement or approval of the use of such commercial products. All product names and trademarks cited are the property of their respective owners. The findings of this report are not to be construed as an official Department of the Army position unless so designated by other authorized documents. DESTROY THIS REPORT WHEN NO LONGER NEEDED. DO NOT RETURN IT TO THE ORIGINATOR.
ERDC/CERL TR-11-14 iii
Table of Contents List of Figures and Tables............................................................................................................................. v
Preface ......................................................................................................................................................... viii
Executive Summary ..................................................................................................................................... ix
Unit Conversion Factors ...............................................................................................................................x
1 Introduction ............................................................................................................................................ 1 1.1 Problem statement ........................................................................................................ 1 1.2 Objective ........................................................................................................................ 3 1.3 Approach ........................................................................................................................ 3
2 Technical Investigation ........................................................................................................................ 5 2.1 Conduit terminology ...................................................................................................... 5 2.2 Description of the installed nonstandard conduit systems......................................... 5
2.2.1 Fort Carson UHDS ....................................................................................................... 6 2.2.2 Fort Stewart UHDS ...................................................................................................... 8
2.3 Air pressure tests ........................................................................................................... 9 2.4 Close interval survey (CIS) ........................................................................................... 11 2.5 Soil resistivity tests ...................................................................................................... 12 2.6 Excavation for visual inspection .................................................................................. 13 2.7 Heat loss tests ............................................................................................................. 14
2.7.1 ASHRAE heat-loss calculation method .................................................................... 14 2.7.2 Thermal flux sensors method ................................................................................... 14
3 Discussion ............................................................................................................................................ 15 3.1 Metrics ......................................................................................................................... 15 3.2 Fort Carson results ...................................................................................................... 15
3.2.1 Air pressure tests ...................................................................................................... 15 3.2.2 CIS and soil resistivity tests ...................................................................................... 23 3.2.3 Visual inspection excavations .................................................................................. 26 3.2.4 Heat loss studies ....................................................................................................... 43 3.2.5 Discussion of Fort Carson findings .......................................................................... 50
3.3 Fort Stewart results ..................................................................................................... 57 3.3.1 Air pressure test results ............................................................................................ 57 3.3.2 CIS and soil resistivity test results ............................................................................ 61 3.3.3 Visual inspection excavations .................................................................................. 63 3.3.4 Heat loss studies ....................................................................................................... 75 3.3.5 Discussion of Fort Stewart findings ......................................................................... 81
3.4 Lessons learned .......................................................................................................... 92 3.4.1 Site selection ............................................................................................................. 92 3.4.2 Technology installation ............................................................................................. 93
ERDC/CERL TR-11-14 iv
3.4.3 Pressure test program execution ............................................................................. 93
4 Economic Summary ............................................................................................................................ 95 4.1 Assumptions ................................................................................................................ 95 4.2 Projected ROI ............................................................................................................... 95
4.2.1 Costs .......................................................................................................................... 96 4.2.2 ROI calculation .......................................................................................................... 97
5 Conclusions and Recommendations .............................................................................................. 98 5.1 Conclusions .................................................................................................................. 98 5.2 Recommendations ...................................................................................................... 98
5.2.1 Applicability ............................................................................................................... 99 5.2.2 Implementation ......................................................................................................... 99
Appendix A: Project Management Plans for CPC Project F07-AR01*
Appendix B: Thermacor Duo-Therm 505 and Perma-Pipe HTHW Conduit Specifications .......... B1
.............................................A1
Appendix C: Air Pressure Testing Method ............................................................................................ C1
Appendix D: Close Internal Survey (CIS) Procedure ............................................................................ D1
Appendix E: ASHRAE Heat Loss Calculation Method .......................................................................... E1
Appendix F: Consolidated Phase I Drawings for Forts Carson and Stewart ................................... F1
Appendix G: Consolidated Phase II and III Drawings for Forts Carson and Stewart .................... G1
Appendix H: Consolidated Phase I Manhole and Pressure Test Data for Forts Carson and Stewart ......................................................................................................................................... H1
Appendix I: Consolidated Phase II and III Manhole and Pressure Test Data for Forts Carson and Stewart ............................................................................................................................. I1
Appendix J: Consolidated Close Interval Survey Data for Forts Carson and Stewart ....................J1
Appendix K: Consolidated ASHRAE Soil Test Reports for Forts Carson and Stewart .................. K1
Report Documentation Page
* All appendices are collected in a supplement to the main report.
ERDC/CERL TR-11-14 v
List of Figures and Tables
Figures
Figure 1. Diagram of alternate UHDS conduit section. ............................................................................. 5 Figure 2. Fort Carson manhole top construction. ...................................................................................... 7 Figure 3. Typical Fort Carson manhole and conduit installation showing conduit pressure testing hoses in place. ................................................................................................................................... 7 Figure 4. Typical Fort Stewart flush, open-grate valve pit construction (red hoses for pressurization tests visible). ......................................................................................................................... 9 Figure 5. Typical Fort Stewart conduit construction (red hoses for pressurization tests visible). ............................................................................................................................................................. 9 Figure 6. Detail of pressurization test equipment. .................................................................................. 11 Figure 7. CIS test procedure. ....................................................................................................................... 12 Figure 8. Fort Carson Phase I pressure test results in schematic form. .............................................. 17 Figure 9. Fort Carson South Loop pressure test summary and legend for Figure 10. ....................... 18 Figure 10a. Fort Carson south loop pressure test results in schematic form (network continues from bottom of Figure 10a to top of Figure 10b, and so on). .............................................. 19 Figure 11. North Loop excavation site 1. .................................................................................................. 27 Figure 12. Site 1 excavation, facing south. ............................................................................................... 28 Figure 13. Site 1 excavation with heat flux instrumentation. ................................................................. 29 Figure 14. Site 2 schematic. ....................................................................................................................... 29 Figure 15. Excavation site 2, facing north. ............................................................................................... 31 Figure 16. Excavation site 2 showing heat flux instrumentation. .......................................................... 31 Figure 17. Site 3 schematic diagram. ........................................................................................................ 32 Figure 18. Site 3 elbow inspection showing defects, facing northeast. ............................................... 33 Figure 19. Conduit outer casing showing backhoe puncture and erosion at site 3. .......................... 34 Figure 20. Cut in splice boot at site 3. ....................................................................................................... 34 Figure 21. Elbow repair at site 3. ............................................................................................................... 35 Figure 22. Site 4 schematic. ....................................................................................................................... 36 Figure 23. Site 4 excavation, facing southeast. ....................................................................................... 37 Figure 24. Site 4 excavation with heat flux instrumentation. ................................................................. 38 Figure 25. Excavation site 5 schematic. ................................................................................................... 38 Figure 26. Site 5 excavation, facing southeast. ....................................................................................... 40 Figure 27. Site 5 excavation with heat flux instrumentation. ................................................................. 40 Figure 28. Excavation site 6 schematic. ................................................................................................... 41 Figure 29. Site 6 excavation, facing west. ................................................................................................ 42 Figure 30. Site 6 excavation, detail of conduit and elbow. ..................................................................... 43 Figure 31. Heat flux sensor layout. ............................................................................................................ 46
ERDC/CERL TR-11-14 vi
Figure 32. Excavation site 5, heat flux sensor installation. .................................................................... 46 Figure 33. Excavation site 5, detail of heat flux sensor installation. ..................................................... 47 Figure 34. Heat flux sensor installation burial. ........................................................................................ 47 Figure 35. Fort Stewart South Loop pressure test results in schematic form. .................................... 59 Figure 36. Site 1 excavation with installed instrumentation, facing north, showing damage to outer jacket occurring during excavation (see arrow). ........................................................................ 65 Figure 37. Detail of damaged HDPE casing on excavation return conduit at site 1............................ 66 Figure 38. Sprayed polyurethane foam installation before trimming (replacement for damaged original foam). ............................................................................................................................. 66 Figure 39. Silicone sealant applied to cut after spray foam trim. ......................................................... 67 Figure 40. Shrink fit overlay patch installation. ........................................................................................ 67 Figure 41. Site 2 excavation for elbow detail inspection. ........................................................................ 69 Figure 42. HDPE casing flaws in supply elbow. ........................................................................................ 69 Figure 43. Jacket defect repair showing black silicone sealant. ........................................................... 70 Figure 44. Site 3 excavation with installed instrumentation, facing west. ........................................... 71 Figure 45. Site 3 excavation showing cement-like conduit of unknown origin directly beneath south UHDS supply line. .............................................................................................................. 72 Figure 46. Site 4 excavation (looking south toward Bldg. 646). ............................................................ 74 Figure 47. Branch to Bldg. 649 (upper left). ............................................................................................. 74 Figure 48. Backfilling site 4 excavation facing south to Building 646 from VP-16/17). .................... 75 Figure 49. Heat flux sensor layout. ............................................................................................................ 77 Figure 50. Heat flux sensor installation at site 3. .................................................................................... 78 Figure 51. Heat flux sensor installation close-up. .................................................................................... 78 Figure 52. Heat flux sensor installation burial showing steam rising from failed isolation valve at VP-23 in background. .................................................................................................................... 79 Figure 53. Water accumulation in valve pit due to clogged pump inlet. .............................................. 84 Figure 54. Steam issuing from failed isolation valve in VP-23. .............................................................. 84 Figure 55. Main trunk carrier pipe in VP-23 fully exposed due to conduit failure. .............................. 85
Tables
Table 1. Fort Carson North Loop CIS results summary. .......................................................................... 24 Table 2. Fort Carson soil resistivity test result summary. ....................................................................... 25 Table 3. ASHRAE site heat flux calculations. ............................................................................................ 44 Table 4. Heat flux measurements from excavation sites. ...................................................................... 45 Table 5. Site 1 heat flux measurements. .................................................................................................. 48 Table 6. Site 2 heat flux measurements. .................................................................................................. 48 Table 7. Site 4 heat flux measurements. .................................................................................................. 49 Table 8. Site 5 heat flux measurements. .................................................................................................. 49 Table 9. Fort Stewart North Loop pressure test summary. .................................................................... 60 Table 10. Fort Stewart close interval survey test result summary. ........................................................ 61 Table 11. Fort Stewart Wenner 4-pin test result summary. .................................................................... 62

ERDC/CERL TR-11-14 vii
Table 12. Fort Stewart soil box test result summary. .............................................................................. 63 Table 13. Fort Stewart conduit heat-loss comparison. ........................................................................... 76 Table 14. Excavation site 1 heat flux sensor measurements. ............................................................... 79 Table 15. Excavation site 3 heat flux sensor measurements. ............................................................... 80 Table 16. Excavation site 4 heat flux sensor measurements. ............................................................... 80
ERDC/CERL TR-11-14 viii
Preface
This investigation was performed for the Office of the Secretary of Defense under the Department of Defense Corrosion Prevention and Control Pro-gram, Project F07-AR01, “Corrosion Condition and Performance Assess-ment of Heat Distribution System Piping at Fort Stewart, GA”; Military Interdepartmental Purchase Request MIPR7CCORB1019, dated 21 No-vember 2006. The proponent was the US Army Office of the Assistant Chief of Staff for Installation Management (ACSIM) and the stakeholder was the US Army Installation Management Command (IMCOM). The technical monitors were Daniel J. Dunmire (OUSD(AT&L)), Bernie Rodri-guez (IMPW-E), and Valerie D. Hines (DAIM-ODF).
The work was performed by the Materials and Structures Branch (CF-M) of the Facilities Division (CF), Construction Engineering Research Labora-tory – Engineer Research and Development Center (ERDC-CERL). The ERDC-CERL Project Managers were Dr. Charles P. Marsh and Alfred D. Beitelman (CEERD-CF-M). A portion of this work was performed by, or under the supervision of, Mandaree Enterprise Corporation, Warner Rob-ins, GA 31088. At the time this report was prepared, the Chief of the ERDC-CERL Materials and Structures Branch was Vicki L. Van Blaricum (CEERD-CF-M), the Chief of the Facilities Division was L. Michael Golish, (CEERD-CF), and the Technical Director for Installations was Martin J. Savoie (CEERD-CV-ZT). The Deputy Director of ERDC-CERL was Dr. Kirankumar Topudurti and the Director was Dr. Ilker Adiguzel.
The Commander and Executive Director of the U.S. Army Engineer Re-search and Development Center was COL Kevin J. Wilson and the Director was Dr. Jeffery P. Holland.
ERDC/CERL TR-11-14 ix
Executive Summary
The objective of this project was to perform a representative and statisti-cally significant corrosion and thermal performance assessment of the in-stalled Fort Stewart heat distribution system (HDS) network to determine its condition after at least 3 years in service. The system was also evaluated for design, quality of construction, physical condition and maintenance procedures in parallel with detailed corrosion and thermal measurements.
The corrosion evaluation focused on potential interaction between the conduit system and the soil in which it is buried. A close interval survey (CIS) was conducted to ascertain the level of corrosive activity on the un-derground high-temperature hot water delivery piping system. Additional resistivity and composition measurements were made at strategically se-lected sites to document soil parameters at Fort Stewart. Finally, a sub-stantial portion of the conduit system was pressure-tested for pneumatic integrity. In these tests, the sealed annular volume between the hot water carrier pipe and the surrounding steel casing was pressurized at 15 psig and monitored for 2 hours to determine whether the conduit piping sys-tem is protected from ground water infiltration and its degrading impacts. Pressurization tests also included inspection of the drains and vents asso-ciated with the casing annulus for ground water accumulation.
The contract requirements for this project also included the evaluation of underground HDS thermal performance at Fort Stewart. First, the system manufacturer’s published heat loss data were compared with heat losses predicted by an ASHRAE-accepted analysis method using identical soil/thermal properties. Second, heat losses were also calculated with the ASHRAE method using the published conduit material properties and ac-tual soil thermal conductivity properties, moisture content, and tempera-tures measured at designated Fort Stewart test sites. Third, an array of heat flux sensors was bonded to the external jacket of both the supply and return conduits at four excavation/inspection sites separate from the ASHRAE sites. After inspection of the conduits and installation of the sen-sors at these sites, the conduits were reburied and the soil was allowed to equilibrate for 2 months before direct heat flux measurements were rec-orded.
ERDC/CERL TR-11-14 x
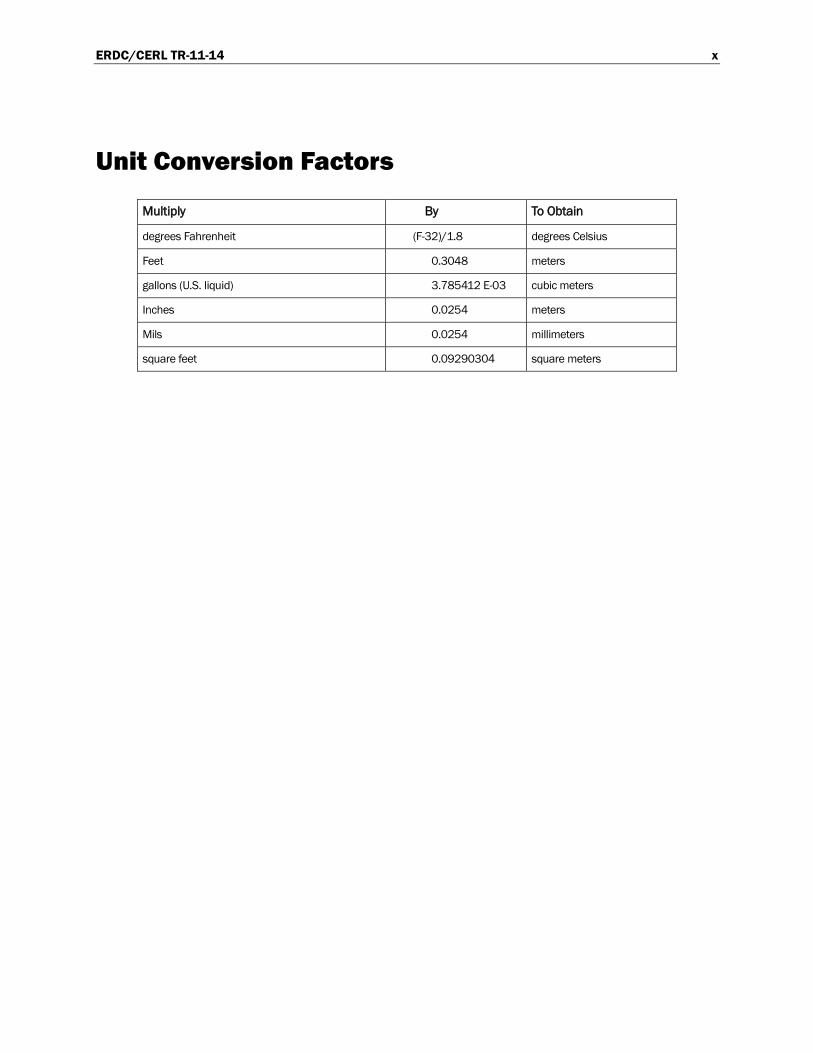
Unit Conversion Factors
Multiply By To Obtain
degrees Fahrenheit (F-32)/1.8 degrees Celsius
Feet 0.3048 meters
gallons (U.S. liquid) 3.785412 E-03 cubic meters
Inches 0.0254 meters
Mils 0.0254 millimeters
square feet 0.09290304 square meters
ERDC/CERL TR-11-14 1
1 Introduction
1.1 Problem statement
Unified Facilities Guide Specifications (UFGS) are the principal source of requirements and criteria used throughout the Department of Defense (DoD) for the design, construction, maintenance, and rehabilitation of fa-cilities on U.S. military installations. UFGS-33 61 13, Pre-Engineered Un-derground Heat Distribution System (April 2008), is the current design guidance for drainable-dryable-testable (DDT) high-temperature hot wa-ter (HTHW) underground heat distribution systems (UHDS). UFGS-33 61 13 describes a double-walled conduit design that meets the following crite-ria:
• a steel carrier pipe for the transport of the heat-transfer medium • a layer of high-temperature thermal insulation to fully sheath the carri-
er pipe • an exterior 0.25 in. thick steel casing to protect the thermal insulation
and carrier pipe from the environment, with interior air space of not less than 1 inch separating the inner wall of the casing from the outer surface of the thermal insulation
• a fusion-bonded epoxy or urethane elastomeric coating on the steel casing for corrosion protection
• a cathodic protection (CP) system for corrosion prevention and control.
This design was the product of an extensive multi-year investigation into frequent HDS failures shortly after World War II. Sponsored by the Na-tional Academy of Sciences, this investigation produced a series of tech-nical reports by the Building Research Advisory Board and, in 1961, the first Corps of Engineers Guide Specification (CEGS) for buried HDS com-ponents (CEGS 02695, Underground Heat Distribution Systems). This guide specification defined the DDT UHDS design partially described in this text. A later DoD criteria document, Unified Facility Guide Specifica-tion (UFGS) 33 61 13, Pre-Engineered Underground Heat Distribution System (as revised), describes a variety of design alternatives that meet CEGS 02695 and other requirements for DoD UHDS.
In recent decades, the private sector has implemented many additional UHDS applications that were based on the concepts, designs, and engi-
ERDC/CERL TR-11-14 2
neering judgment of their developers without reference to UFGS 33 61 13. Some of these systems are purported by their manufacturers to offer lower life-cycle costs to the owner through improved corrosion resistance and reduced heat loss. Some vendors claim success for their designs over many years of experience at various non-Federal sites. However, serious perfor-mance problems for some of these systems are not uncommon if certain components are incompatible with others or if they underperform due to unforeseen soil or operational conditions. A number of such non-standard applications (i.e., not fully complying with all requirements of UFGS 33 61 13) have been installed at U.S. Army installations in recent years. Consid-ering that the installed cost of a UHDS may equal or exceed $1.5 million per mile, the Army has authorized an independent evaluation of installed applications to assess the performance of these alternate UHDS designs to date. The potential risks and costs of premature failure and ongoing ener-gy loss in excess of design specifications requires systematic performance evaluation.
This report documents the assessment of two similar nonstandard UHDS piping system designs — one at Fort Carson, CO, and one at Fort Stewart, GA. These locations were selected because they both are representative applications and are the oldest such systems in service on Army installa-tions. See Appendix A*
The UHDS conduit designs implemented at Forts Carson and Stewart de-viate from UFGS-33 61 13 in several significant ways (see Appendix B). The layer of high-temperature thermal insulation that sheathes the steel carrier pipe is thinner than designs prescribed in the UFGS. Although an annular air space separates the insulation from the secondary steel casing, as specified, that casing is thinner than required by UFGS-33 61 13. Also, this nonstandard casing is wrapped with medium-temperature polyure-thane foam insulation, and the entire assembly is encased within a non-metallic exterior jacket. The composition of the outer jacket varies with manufacturer, typically either high-density polyethylene (HDPE) or fiber-glass-reinforced plastic (FRP). Finally, neither of the subject systems is protected by a CP system, as required by UFGS-33 61 13. In theory, CP would not be needed for a nonmetallic outer jacket, and it may not be needed for any internal steel pipes assuming that the outer jacket reliably prevents water ingress. There is no basis in Army criteria documents to
for the project management plans.
* The appendices are too large to be included with the main text, so they are collected in a separate
volume.
ERDC/CERL TR-11-14 3
support that assumption, however, so the lack of CP must be viewed as a significant deviation from DoD standards despite the intent of these alter-nate HDS designs.
These nonstandard piping designs were assessed in concurrent investiga-tions at both Army installations under separate contracts for the DoD Cor-rosion Prevention and Control (CPC) Program. Local representatives of the piping suppliers were notified of this work and invited to observe, but not participate, in the investigations.
1.2 Objective
The objective of this work was to perform corrosion condition and thermal performance assessments of UHDS multi-walled conduit systems that in-corporate corrosion-resistant nonmetallic jacketing and other features not specified in UFGS-33 61 13, as installed and operating at Forts Carson and Stewart.
1.3 Approach
The two UHDS conduit systems were assessed for ongoing performance and integrity using the following methods:
1. Air pressure testing of the piping system’s annular air space at 15 pounds per square inch gage (psig) to detect pressure leaks that indi-cate breaks in the system and may imply both water intrusion to the system and wet insulation.
2. The soil resistivity was evaluated using the copper-copper sulfate refer-ence electrode method described in NACE Standard Practice (SP) 0169-2007, Control of External Corrosion on Underground or Sub-merged Metallic Piping Systems (NACE International 2007).
3. Close-interval surveys (CIS) were conducted along representative runs of the UHDS conduit to detect any electrical currents that would indi-cate the presence of corrosion cells.
4. Thermal performance was evaluated using both an accepted analytical method published by the American Society of Heating, Refrigerating, and Air-Conditioning Engineers (ASHRAE 2004) and by direct meas-urement using sensors affixed to excavated sections of in-place con-duit.
5. Direct visual inspection for corrosion damage was performed on sec-tions of conduit that were exposed in preparation for mounting the
ERDC/CERL TR-11-14 4
thermal sensors that were used to measure for heat loss as noted in item 4.
In addition, system drains and vents at valve pits, building entrances, and representative intermediate sites were inspected to check for the presence of steam or standing water in the annular insulation spaces.
Details on each portion of the study are provided in the main text.
ERDC/CERL TR-11-14 5
2 Technical Investigation
2.1 Conduit terminology
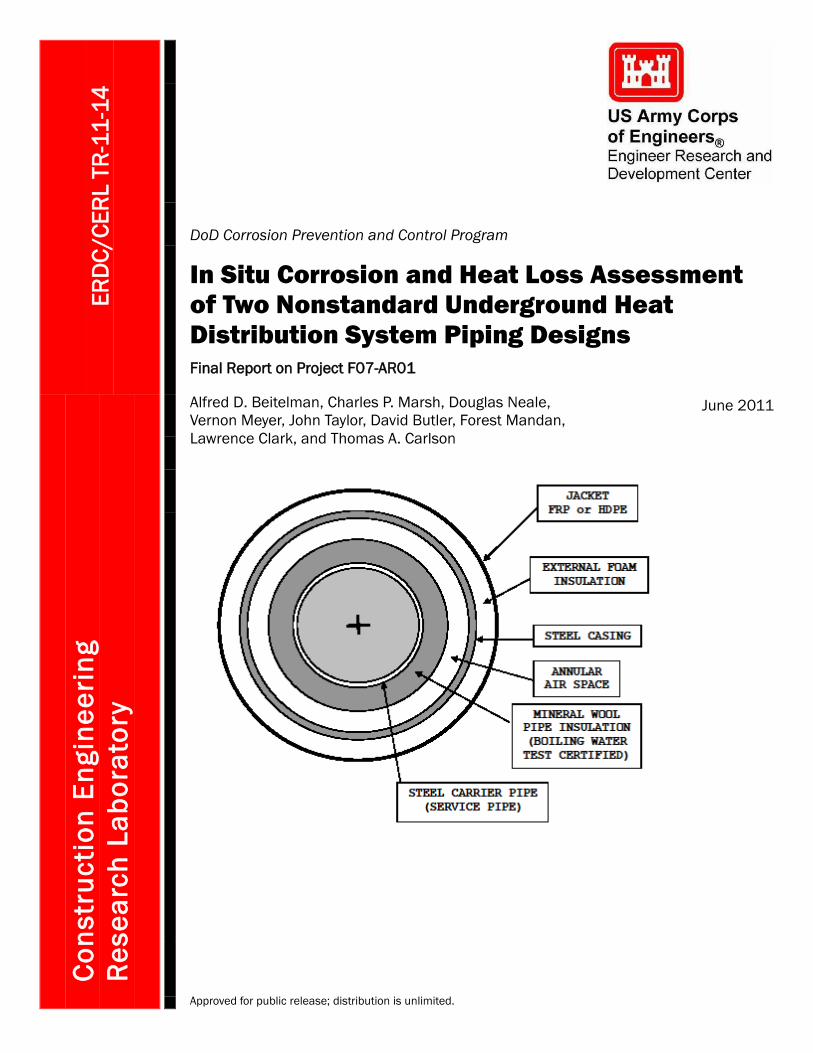
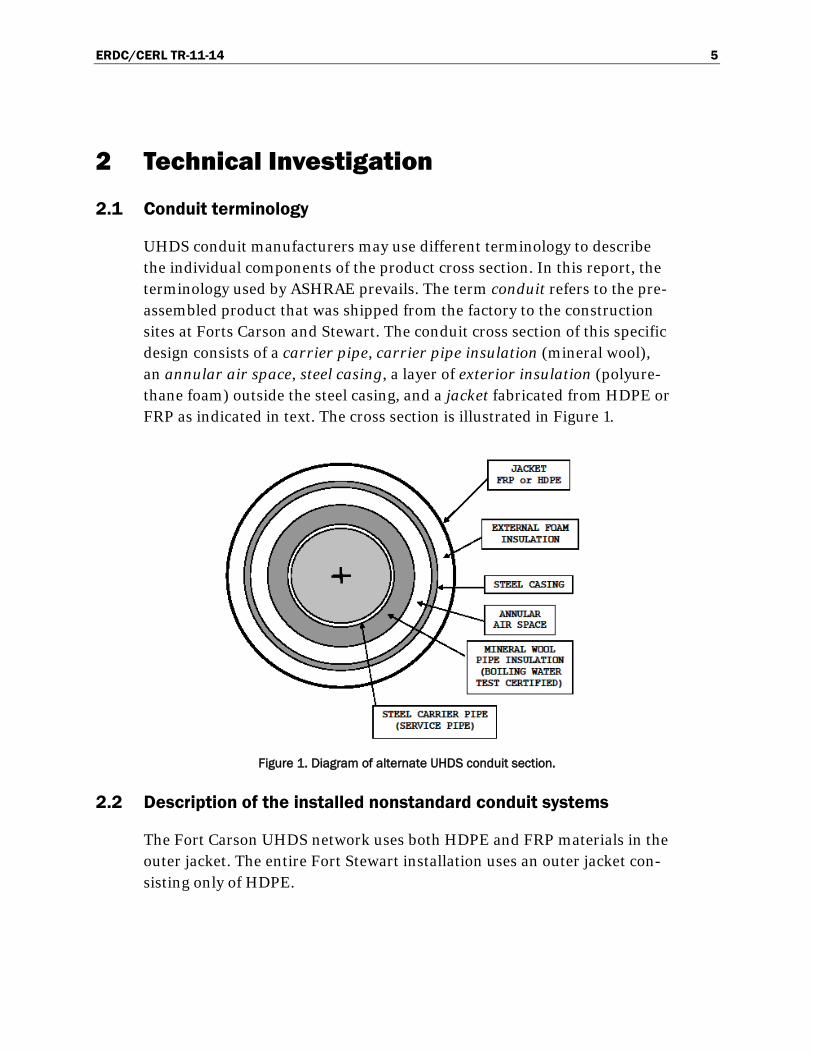
UHDS conduit manufacturers may use different terminology to describe the individual components of the product cross section. In this report, the terminology used by ASHRAE prevails. The term conduit refers to the pre-assembled product that was shipped from the factory to the construction sites at Forts Carson and Stewart. The conduit cross section of this specific design consists of a carrier pipe, carrier pipe insulation (mineral wool), an annular air space, steel casing, a layer of exterior insulation (polyure-thane foam) outside the steel casing, and a jacket fabricated from HDPE or FRP as indicated in text. The cross section is illustrated in Figure 1.
Figure 1. Diagram of alternate UHDS conduit section.
2.2 Description of the installed nonstandard conduit systems
The Fort Carson UHDS network uses both HDPE and FRP materials in the outer jacket. The entire Fort Stewart installation uses an outer jacket con-sisting only of HDPE.
ERDC/CERL TR-11-14 6
2.2.1 Fort Carson UHDS
Both types of conduit systems were installed at Fort Carson in three phas-es over a period of 2 years starting in 2000.
The Phase I loop, called the north loop, uses a nonmetallic FRP outer jack-et. It comprises 14 manhole pits and approximately 3 miles of buried pip-ing starting at the central plant and servicing buildings to the north of it. Main trunk line carrier pipe sizes (all nominal inner diameter measure-ments) range from 12 in. at the plant down to 6 in. at the northern ex-treme. The lateral building branch carriers range from 1 – 3-in. depending on required service capacity. Building feeders branch from the main trunk lines in the manhole pits. Because the Phase I UHDS was the first installed and has been in operation the longest (approximately 5 years), this portion of the Fort Carson network received the most comprehensive evaluation in this investigation.
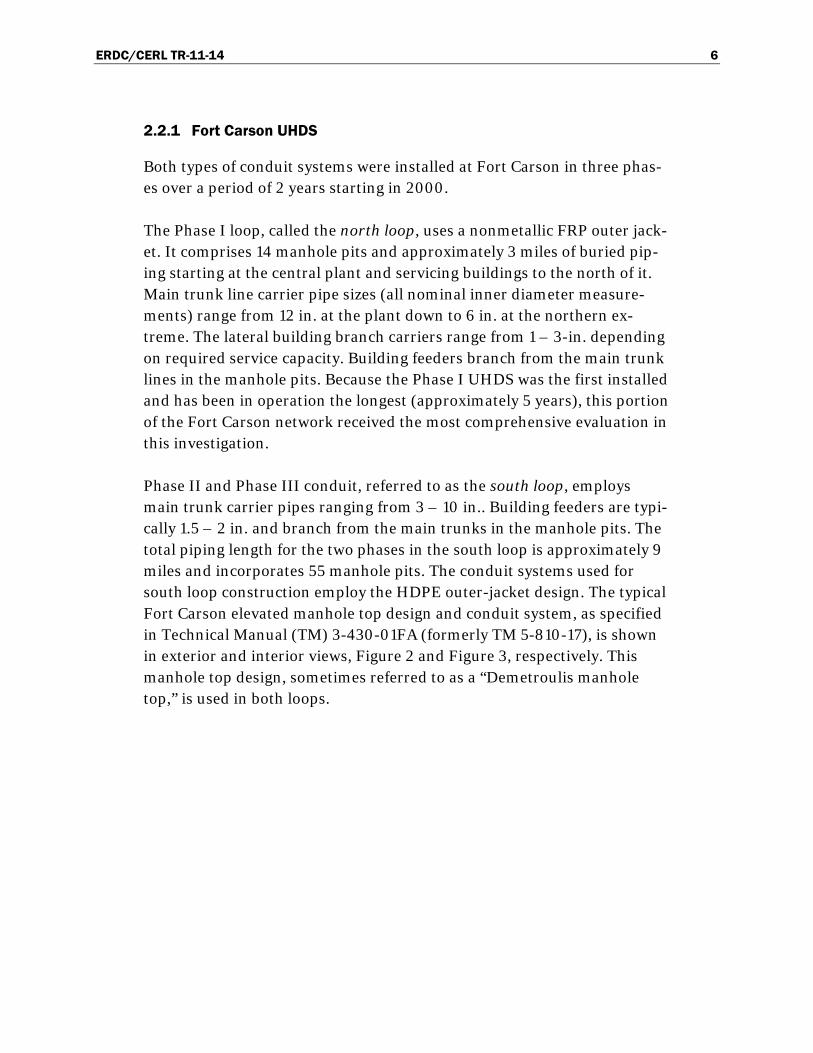
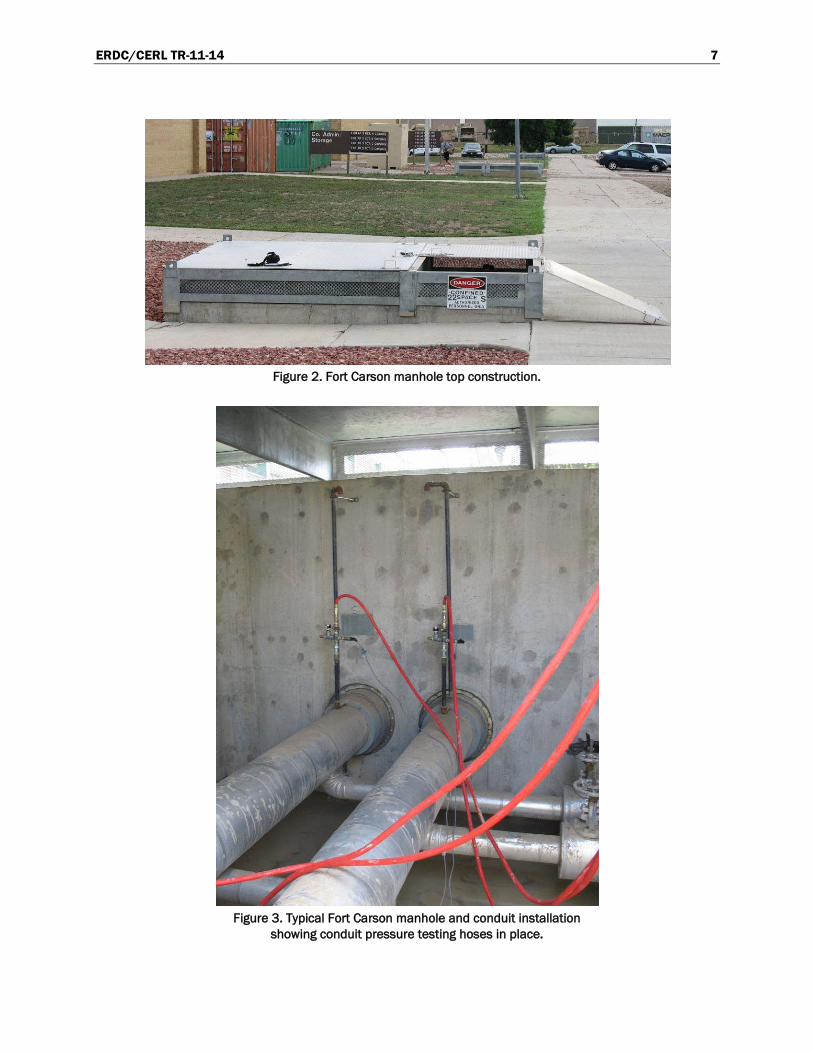
Phase II and Phase III conduit, referred to as the south loop, employs main trunk carrier pipes ranging from 3 – 10 in.. Building feeders are typi-cally 1.5 – 2 in. and branch from the main trunks in the manhole pits. The total piping length for the two phases in the south loop is approximately 9 miles and incorporates 55 manhole pits. The conduit systems used for south loop construction employ the HDPE outer-jacket design. The typical Fort Carson elevated manhole top design and conduit system, as specified in Technical Manual (TM) 3-430-01FA (formerly TM 5-810-17), is shown in exterior and interior views, Figure 2 and Figure 3, respectively. This manhole top design, sometimes referred to as a “Demetroulis manhole top,” is used in both loops.
ERDC/CERL TR-11-14 7
Figure 2. Fort Carson manhole top construction.
Figure 3. Typical Fort Carson manhole and conduit installation
showing conduit pressure testing hoses in place.
ERDC/CERL TR-11-14 8
The hot water boilers at Fort Carson are fueled with natural gas. The hot water supply temperature is normally 350 °F, and the return temperature is normally 275 °F.
2.2.2 Fort Stewart UHDS
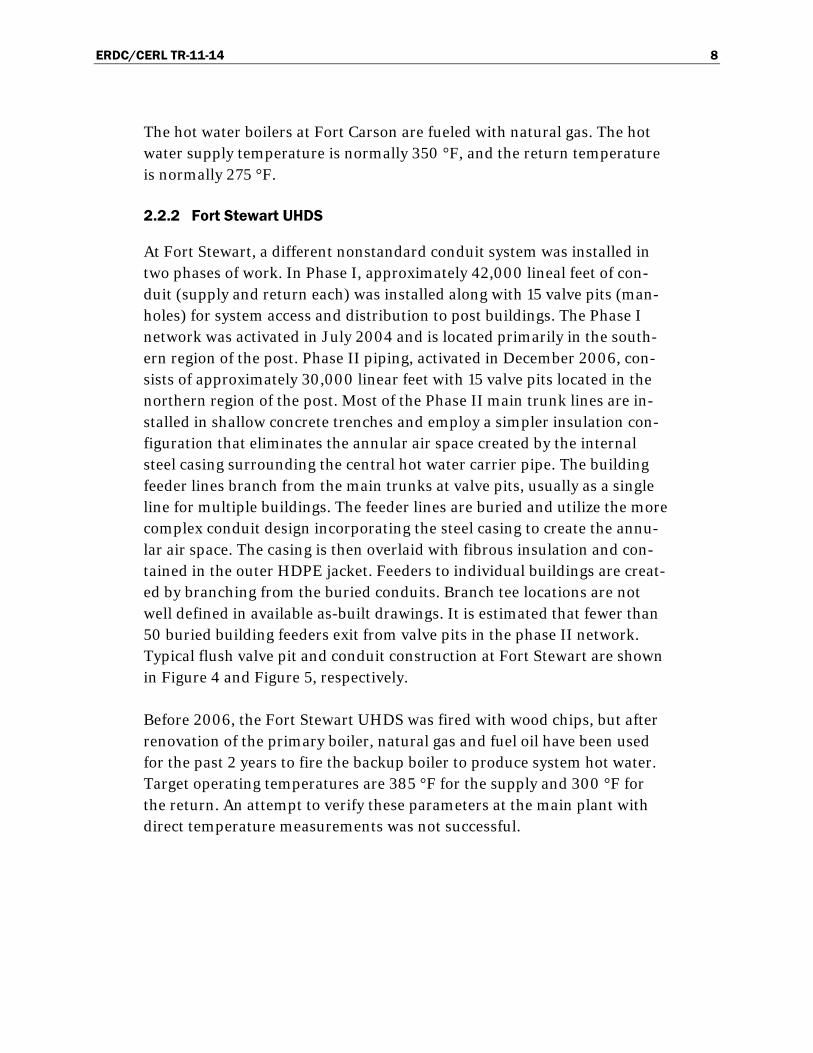
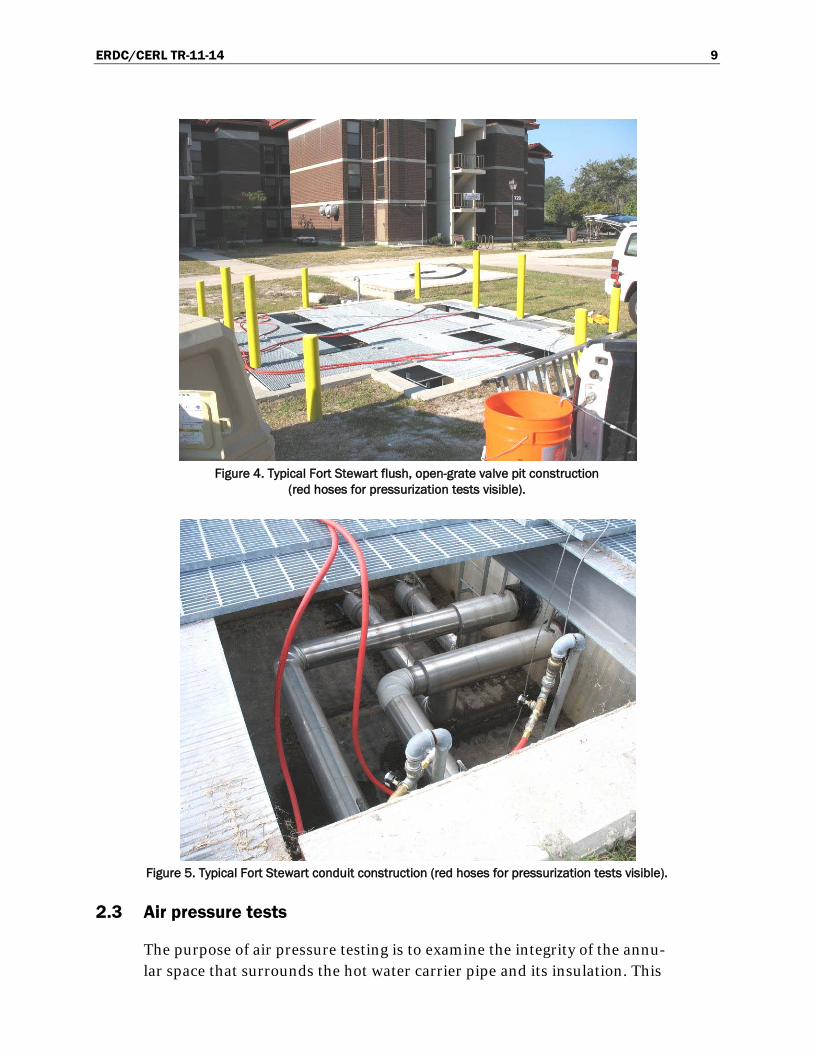
At Fort Stewart, a different nonstandard conduit system was installed in two phases of work. In Phase I, approximately 42,000 lineal feet of con-duit (supply and return each) was installed along with 15 valve pits (man-holes) for system access and distribution to post buildings. The Phase I network was activated in July 2004 and is located primarily in the south-ern region of the post. Phase II piping, activated in December 2006, con-sists of approximately 30,000 linear feet with 15 valve pits located in the northern region of the post. Most of the Phase II main trunk lines are in-stalled in shallow concrete trenches and employ a simpler insulation con-figuration that eliminates the annular air space created by the internal steel casing surrounding the central hot water carrier pipe. The building feeder lines branch from the main trunks at valve pits, usually as a single line for multiple buildings. The feeder lines are buried and utilize the more complex conduit design incorporating the steel casing to create the annu-lar air space. The casing is then overlaid with fibrous insulation and con-tained in the outer HDPE jacket. Feeders to individual buildings are creat-ed by branching from the buried conduits. Branch tee locations are not well defined in available as-built drawings. It is estimated that fewer than 50 buried building feeders exit from valve pits in the phase II network. Typical flush valve pit and conduit construction at Fort Stewart are shown in Figure 4 and Figure 5, respectively.
Before 2006, the Fort Stewart UHDS was fired with wood chips, but after renovation of the primary boiler, natural gas and fuel oil have been used for the past 2 years to fire the backup boiler to produce system hot water. Target operating temperatures are 385 °F for the supply and 300 °F for the return. An attempt to verify these parameters at the main plant with direct temperature measurements was not successful.
ERDC/CERL TR-11-14 9
Figure 4. Typical Fort Stewart flush, open-grate valve pit construction
(red hoses for pressurization tests visible).
Figure 5. Typical Fort Stewart conduit construction (red hoses for pressurization tests visible).
2.3 Air pressure tests
The purpose of air pressure testing is to examine the integrity of the annu-lar space that surrounds the hot water carrier pipe and its insulation. This
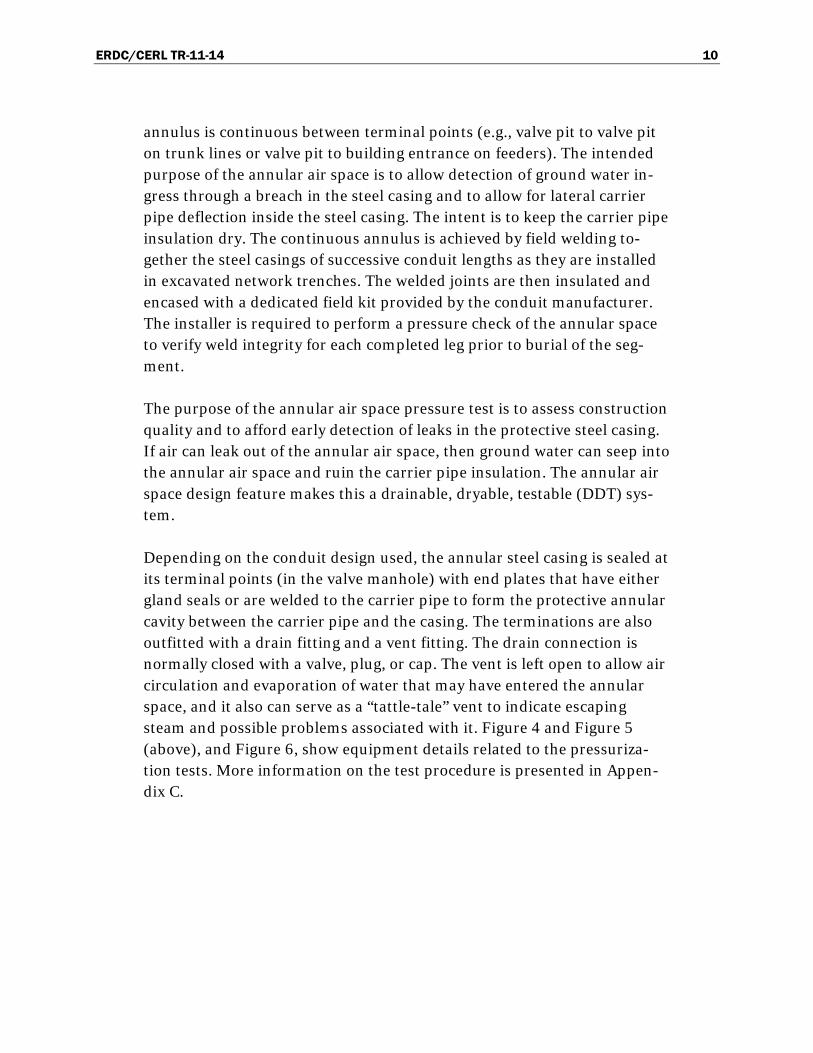
ERDC/CERL TR-11-14 10
annulus is continuous between terminal points (e.g., valve pit to valve pit on trunk lines or valve pit to building entrance on feeders). The intended purpose of the annular air space is to allow detection of ground water in-gress through a breach in the steel casing and to allow for lateral carrier pipe deflection inside the steel casing. The intent is to keep the carrier pipe insulation dry. The continuous annulus is achieved by field welding to-gether the steel casings of successive conduit lengths as they are installed in excavated network trenches. The welded joints are then insulated and encased with a dedicated field kit provided by the conduit manufacturer. The installer is required to perform a pressure check of the annular space to verify weld integrity for each completed leg prior to burial of the seg-ment.
The purpose of the annular air space pressure test is to assess construction quality and to afford early detection of leaks in the protective steel casing. If air can leak out of the annular air space, then ground water can seep into the annular air space and ruin the carrier pipe insulation. The annular air space design feature makes this a drainable, dryable, testable (DDT) sys-tem.
Depending on the conduit design used, the annular steel casing is sealed at its terminal points (in the valve manhole) with end plates that have either gland seals or are welded to the carrier pipe to form the protective annular cavity between the carrier pipe and the casing. The terminations are also outfitted with a drain fitting and a vent fitting. The drain connection is normally closed with a valve, plug, or cap. The vent is left open to allow air circulation and evaporation of water that may have entered the annular space, and it also can serve as a “tattle-tale” vent to indicate escaping steam and possible problems associated with it. Figure 4 and Figure 5 (above), and Figure 6, show equipment details related to the pressuriza-tion tests. More information on the test procedure is presented in Appen-dix C.
ERDC/CERL TR-11-14 11
Figure 6. Detail of pressurization test equipment.
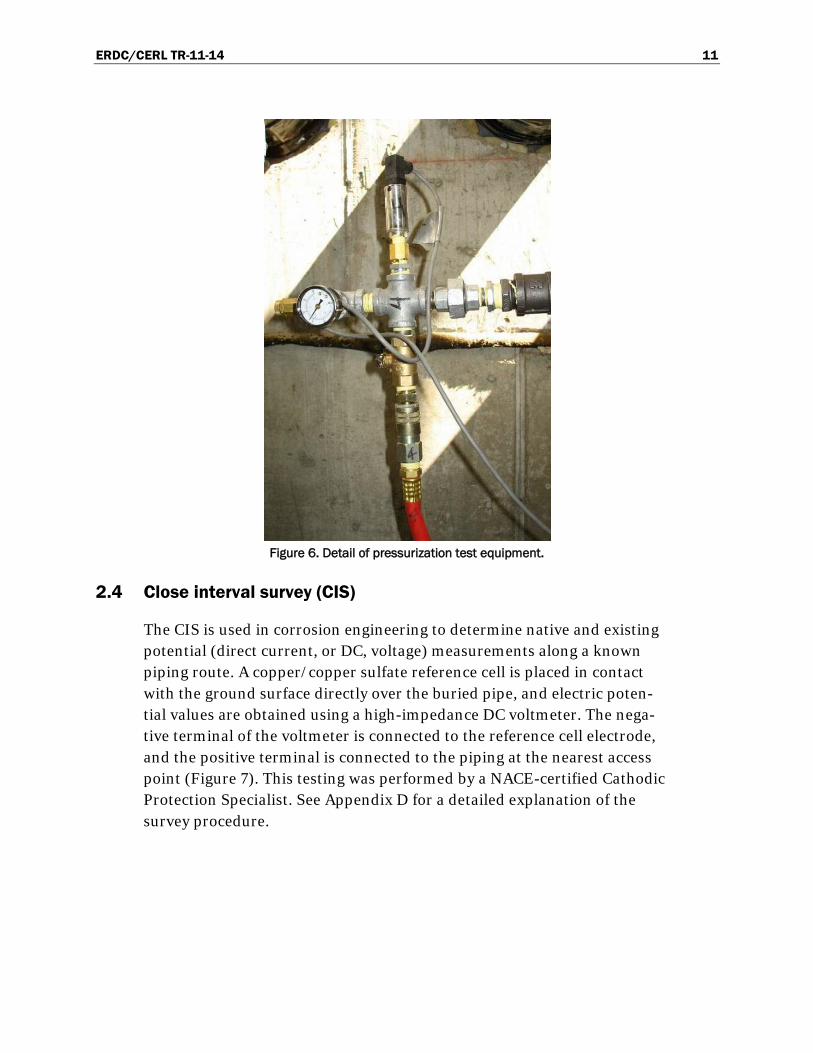
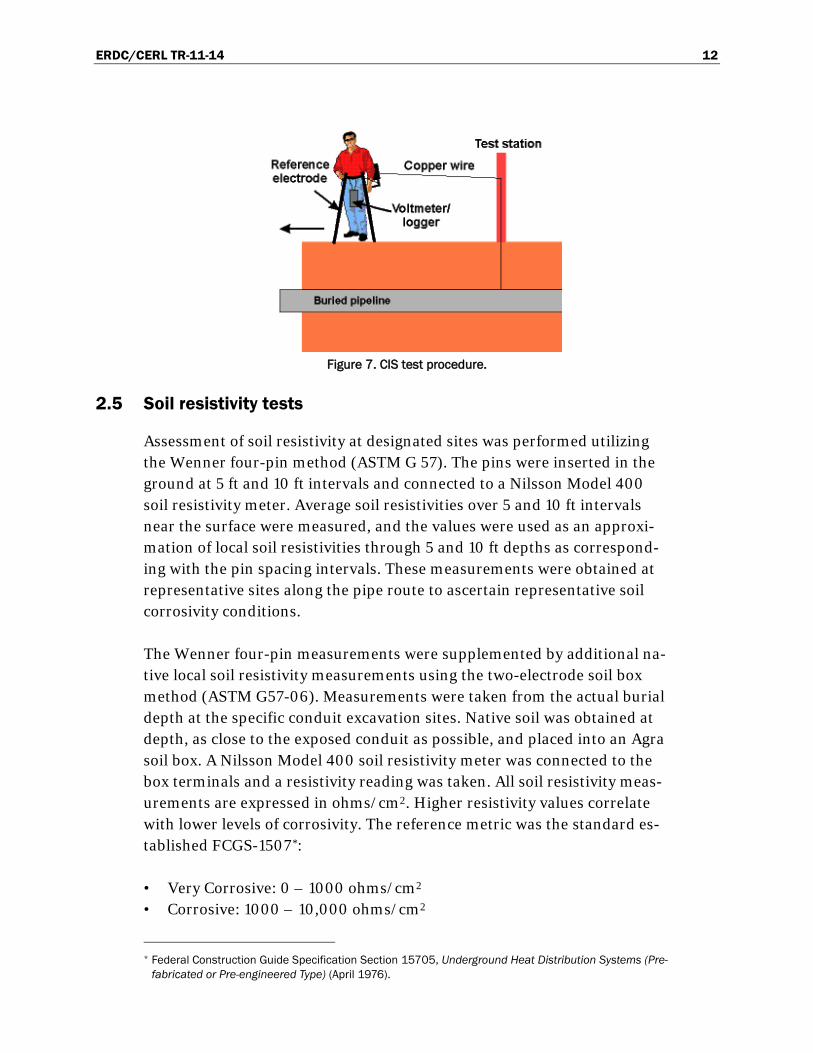
2.4 Close interval survey (CIS)
The CIS is used in corrosion engineering to determine native and existing potential (direct current, or DC, voltage) measurements along a known piping route. A copper/copper sulfate reference cell is placed in contact with the ground surface directly over the buried pipe, and electric poten-tial values are obtained using a high-impedance DC voltmeter. The nega-tive terminal of the voltmeter is connected to the reference cell electrode, and the positive terminal is connected to the piping at the nearest access point (Figure 7). This testing was performed by a NACE-certified Cathodic Protection Specialist. See Appendix D for a detailed explanation of the survey procedure.
ERDC/CERL TR-11-14 12
Figure 7. CIS test procedure.
2.5 Soil resistivity tests
Assessment of soil resistivity at designated sites was performed utilizing the Wenner four-pin method (ASTM G 57). The pins were inserted in the ground at 5 ft and 10 ft intervals and connected to a Nilsson Model 400 soil resistivity meter. Average soil resistivities over 5 and 10 ft intervals near the surface were measured, and the values were used as an approxi-mation of local soil resistivities through 5 and 10 ft depths as correspond-ing with the pin spacing intervals. These measurements were obtained at representative sites along the pipe route to ascertain representative soil corrosivity conditions.
The Wenner four-pin measurements were supplemented by additional na-tive local soil resistivity measurements using the two-electrode soil box method (ASTM G57-06). Measurements were taken from the actual burial depth at the specific conduit excavation sites. Native soil was obtained at depth, as close to the exposed conduit as possible, and placed into an Agra soil box. A Nilsson Model 400 soil resistivity meter was connected to the box terminals and a resistivity reading was taken. All soil resistivity meas-urements are expressed in ohms/cm2. Higher resistivity values correlate with lower levels of corrosivity. The reference metric was the standard es-tablished FCGS-1507*
• Very Corrosive: 0 – 1000 ohms/cm2
:
• Corrosive: 1000 – 10,000 ohms/cm2
* Federal Construction Guide Specification Section 15705, Underground Heat Distribution Systems (Pre-
fabricated or Pre-engineered Type) (April 1976).
ERDC/CERL TR-11-14 13
• Progressively Less Corrosive: 10,000 ohms/cm2 and higher.
In this project, the soil box measurements were obtained in real time from samples taken at the actual excavation sites when open.
2.6 Excavation for visual inspection
A number of excavation sites were designated at each installation for pur-poses of visual inspection and documentation of conduit physical condi-tion. In addition to exposing straight sections of conduit, the site of a 90-degree elbow also was excavated. Representative excavation sites were se-lected by project personnel in cooperation with the installation point of contact. The main selection criterion was that the site be highly likely to represent the overall condition of the straight sections and reveal system performance at typical points of deterioration such as elbows, tees, an-chors, and field joint closures. Where possible, sites were selected to re-flect the most challenging soil environments in order to sample the areas of highest stress on the conduit. When the inspections were completed, each excavation was backfilled in a manner intended to return the site as closely as possible to its pre-excavation condition.
Documentation of each excavation included
• location • piping type • conduit size • spacing • estimated carrier pipe temperature • photographs • outer jacket condition • notes on wear, abrasion, or other damage • backfill immediately in contact with the pipe along with inclusions • burial depth • native soil type at burial depth • native soil resistivity • any other pertinent observations as determined.
ERDC/CERL TR-11-14 14
2.7 Heat loss tests
2.7.1 ASHRAE heat-loss calculation method
The ASHRAE calculation method and its application for this project are detailed in Appendix E, including information about the analysis software. Quantitative evaluations of piping heat loss were conducted using the standardized and widely accepted ASHRAE heat loss method (2004 ASHRAE Handbook, “HVAC Systems and Equipment,” Chapter 11). This method includes direct measurements of native soil properties (moisture content and soil type) adjacent to the conduit from core samples and a re-mote soil temperature measurement that is outside of the heat-affected zone of the conduit. Soil property test results for Fort Stewart are docu-mented in Appendix K.
2.7.2 Thermal flux sensors method
As an additional heat-loss test intended to supplement the results of the ASHRAE test, thermal flux sensors (thermopiles) were bonded directly to the outer jacket of the UHDS conduit. The flux sensors incorporate a sepa-rate thermocouple element to measure conduit surface temperature as well as heat flow. This direct measurement technique was conducted in conjunction with the designated excavation sites that are separate and dis-tinct from the ASHRAE sites which are conducted at “undisturbed” loca-tions and entail no excavation other than obtaining soil core samples. Af-ter conduit inspection and sensor installation, each excavation site was restored to original condition and the soil was allowed to stabilize for two months prior to data acquisition with the UHDS in full operation. Core sampling and soil analyses were conducted for Fort Stewart by the Arrowood Environmental Group of Savannah, GA, a certified laboratory specializing in geotechnical work.
ERDC/CERL TR-11-14 15
3 Discussion
3.1 Metrics
This project was to evaluate a new technology used commercially and nev-er evaluated by the government. The following metrics served as the refer-ence standards and procedures for this work:
• Unified Facilities Guide Specification (UFGS) 33 61 13, Pre-Engineered Underground Heat Distribution System (April 2006)
• Unified Facilities Criteria (UFC) 3-430-01FA (formerly TM 5-810-17), Heating and Cooling Distribution Systems (25 July 2003)
• Federal Construction Guide Specification Section 15705, Underground Heat Distribution Systems (Prefabricated or Pre-engineered Type) (April 1976)
• ASTM G 57, Standard Test Method For Field Measurement of Soil Re-sistivity Using the Wenner Four-Electrode Method
• ASHRAE Heat Loss Method, 2004 ASHRAE Handbook, Chapter 11, “HVAC Systems and Equipment.”
3.2 Fort Carson results
3.2.1 Air pressure tests
It was determined that pressurizing each segment of the Fort Carson HDS conduit to exactly 15.0 psig as a starting point was not a practical field pro-cedure. Initial pressures typically ranged up to 16 psig. To provide a uni-form evaluation criterion for all segments tested, a 10% pressure drop over the 2 hour test period was established as the pass/fail threshold used in this report. This criterion is in accordance with and derived from the scope of work (SOW) in which the criterion was a 1.5 psi drop assuming an initial pressurization value of 15 psig.
It is further noted for purposes of future testing and evaluation of the sys-tem that the approach defined in the SOW does not account for volume differences that result from varying segment lengths and conduit sizes en-countered in the network construction. An leak in a short segment of a small conduit may be identical, in terms of volume lost with a leak in a long segment of a large conduit, but the result may be a failure in the short segment and a pass in the larger segment. For a fully uniform comparison
ERDC/CERL TR-11-14 16
of pneumatic integrity, segments should be evaluated on the basis of per-centage pressure loss normalized to a defined reference volume.
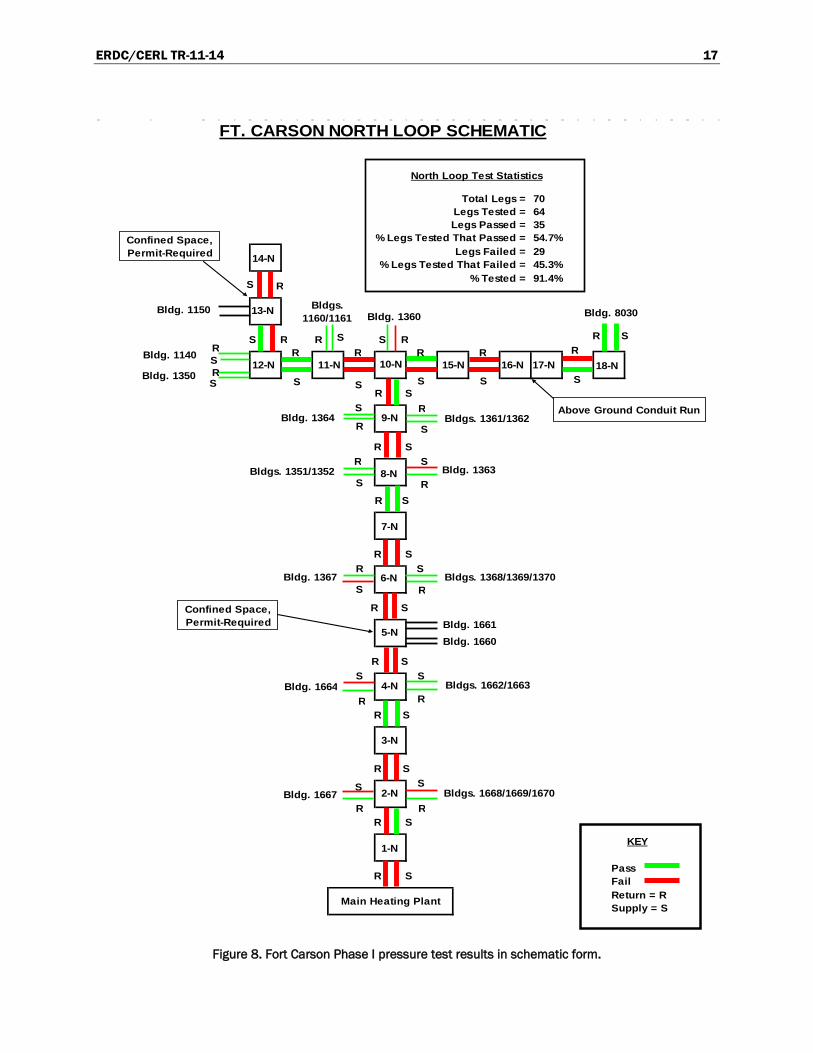
3.2.1.1 North Loop (Phase I)
The Fort Carson North Loop HDS was constructed using the Perma-Pipe Multitherm-500 conduit system (Appendix B), which uses an FRP outer jacket. As-built drawings of the North Loop are included in Appendix F. Differences between these drawings and the actual construction details were observed during the course of this work. The UHDS configuration and details presented in this report are based on actual observations made during testing and inspection.
North Loop pressure test results, showing a pass/fail indication, are illus-trated on a schematic drawing in Figure 8. In accordance with the re-quirements of the SOW and authority of the designated HDS expert, 91.4% of the North Loop was tested to provide a statistical evaluation of system integrity with respect to pressurization performance. As shown in Figure 8, a failure rate of 45.3% was determined for the North Loop. Detailed valve-pit and conduit segment test data and observations are included in Appendix H.
ERDC/CERL TR-11-14 17
Figure 8. Fort Carson Phase I pressure test results in schematic form.
FT. CARSON NORTH LOOP SCHEMATIC
North Loop Test Statistics
Total Legs = Legs Tested = Legs Passed =
% Legs Tested That Passed = Legs Failed =
% Legs Tested That Failed = % Tested =
KEY
PassFailReturn = RSupply = S
91.4%45.3%
70643554.7%29
1-N
2-N
3-N
4-N
5-N
6-N
7-N
8-N
9-N
10-N 15-N 16-N 17-N 18-N11-N12-N
13-N
14-N
Main Heating Plant
Bldg. 1661Bldg. 1660
R S
S
S
S
S
S
S
S
S
SS S S
S
SS
S
S
S S
S
S
S
S
S
S
SS
SS
RR R
R
RR R
R
R
R
R
R
R
R
R
R
R
RR
RRRR
R
RR R R
RR
R
Bldgs. 1668/1669/1670Bldg. 1667
Bldg. 1664 Bldgs. 1662/1663
Bldg. 1367 Bldgs. 1368/1369/1370
Bldg. 1363Bldgs. 1351/1352
Bldg. 1364 Bldgs. 1361/1362
Bldg. 8030Bldg. 1360Bldgs.
1160/1161Bldg. 1150
Bldg. 1140
Bldg. 1350S
S
Confined Space, Permit-Required
Confined Space, Permit-Required
Above Ground Conduit Run
ERDC/CERL TR-11-14 18
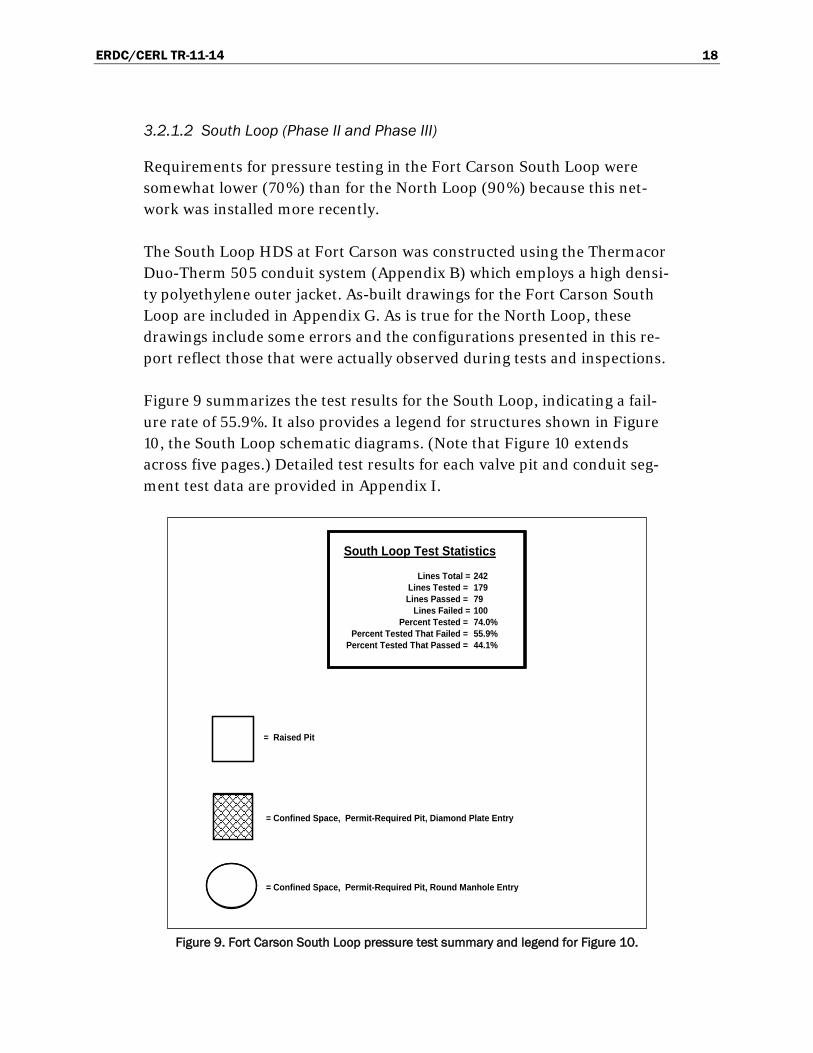
3.2.1.2 South Loop (Phase II and Phase III)
Requirements for pressure testing in the Fort Carson South Loop were somewhat lower (70%) than for the North Loop (90%) because this net-work was installed more recently.
The South Loop HDS at Fort Carson was constructed using the Thermacor Duo-Therm 505 conduit system (Appendix B) which employs a high densi-ty polyethylene outer jacket. As-built drawings for the Fort Carson South Loop are included in Appendix G. As is true for the North Loop, these drawings include some errors and the configurations presented in this re-port reflect those that were actually observed during tests and inspections.
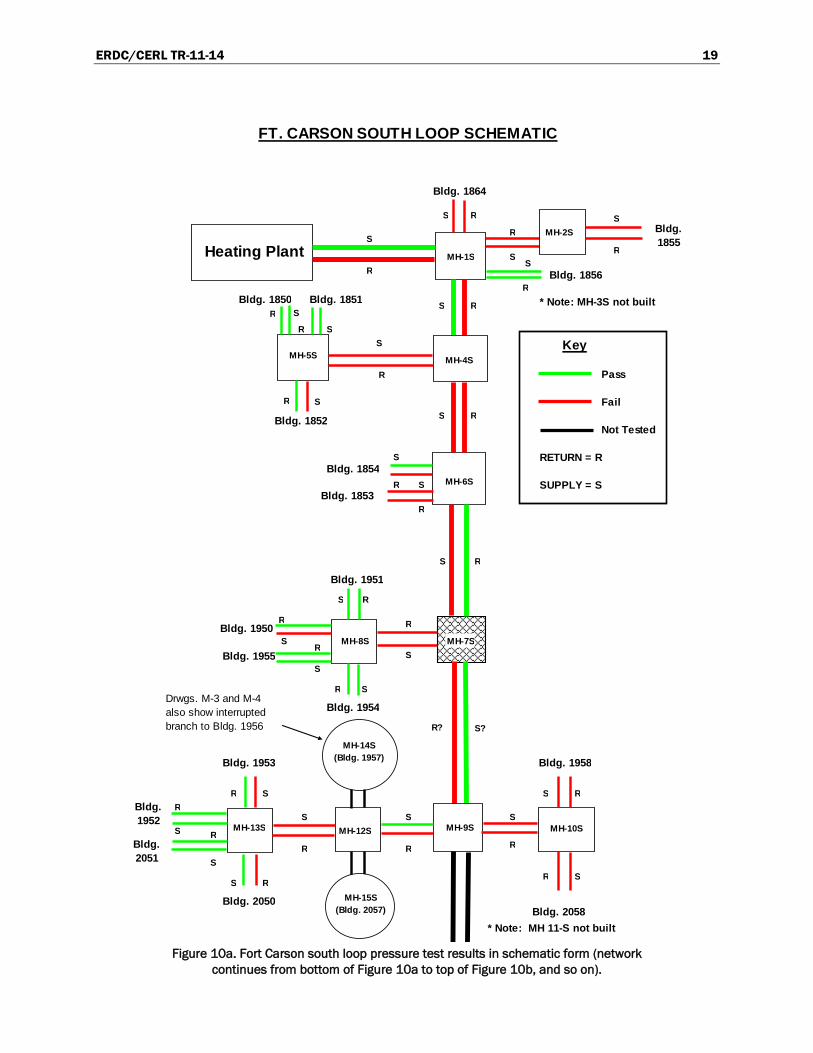
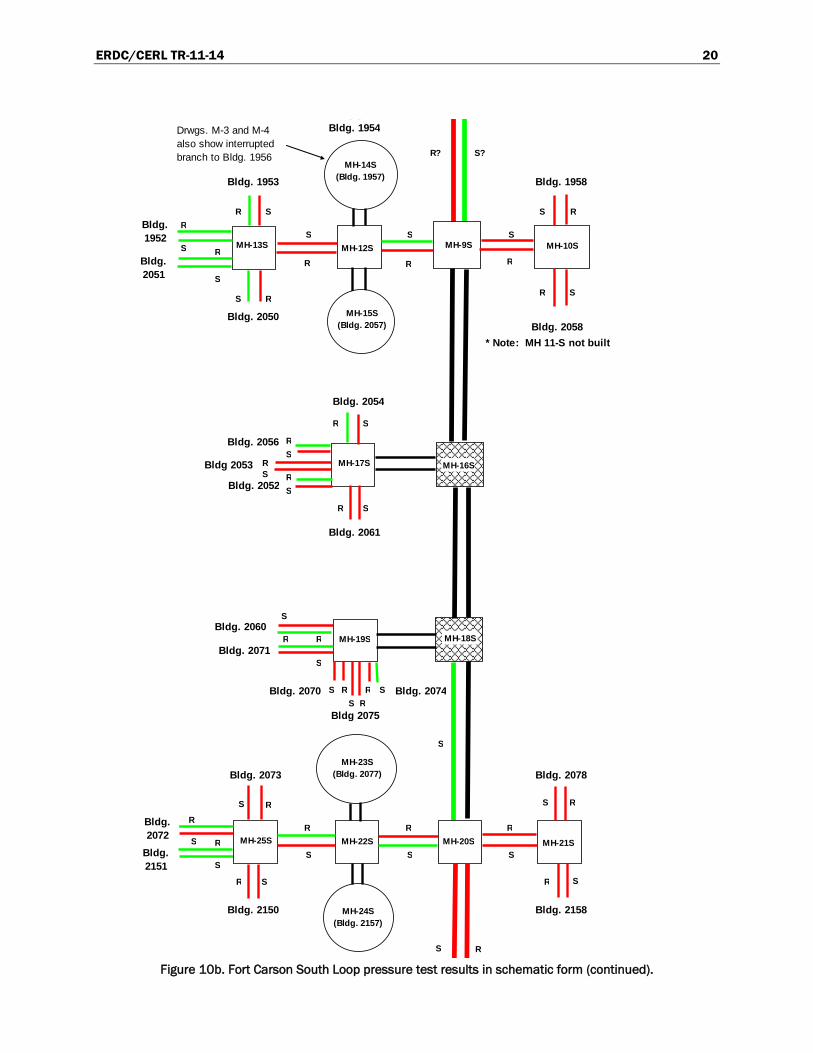
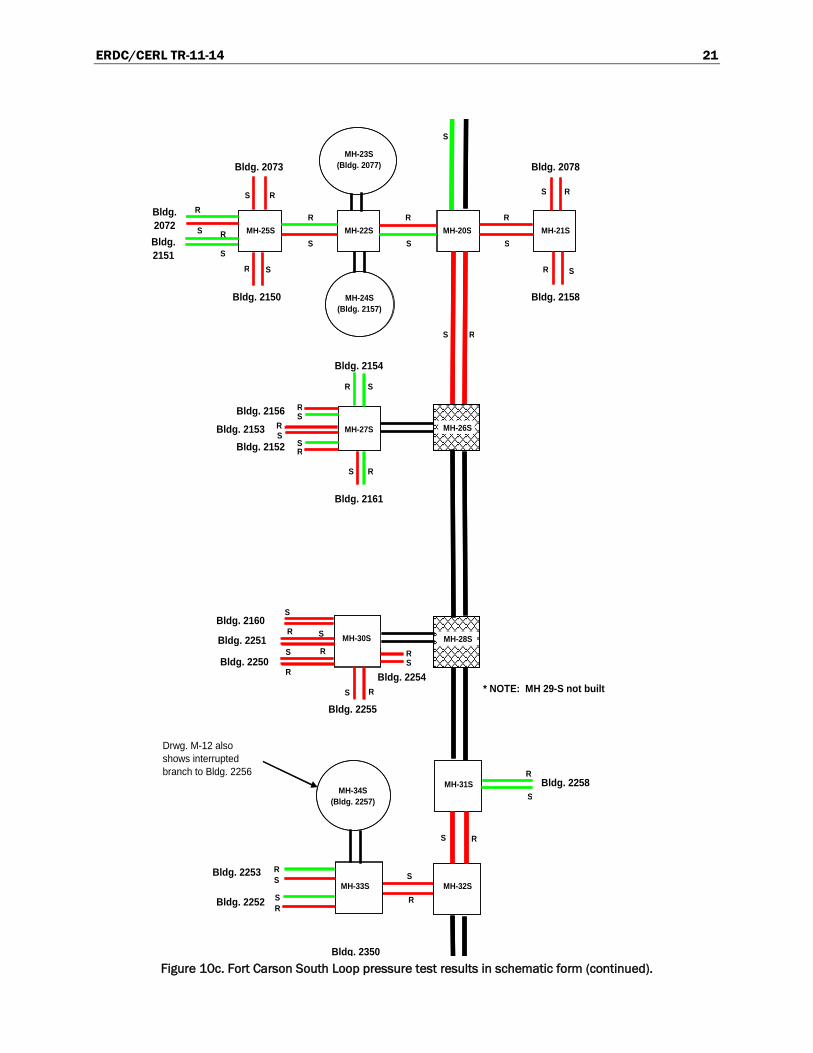
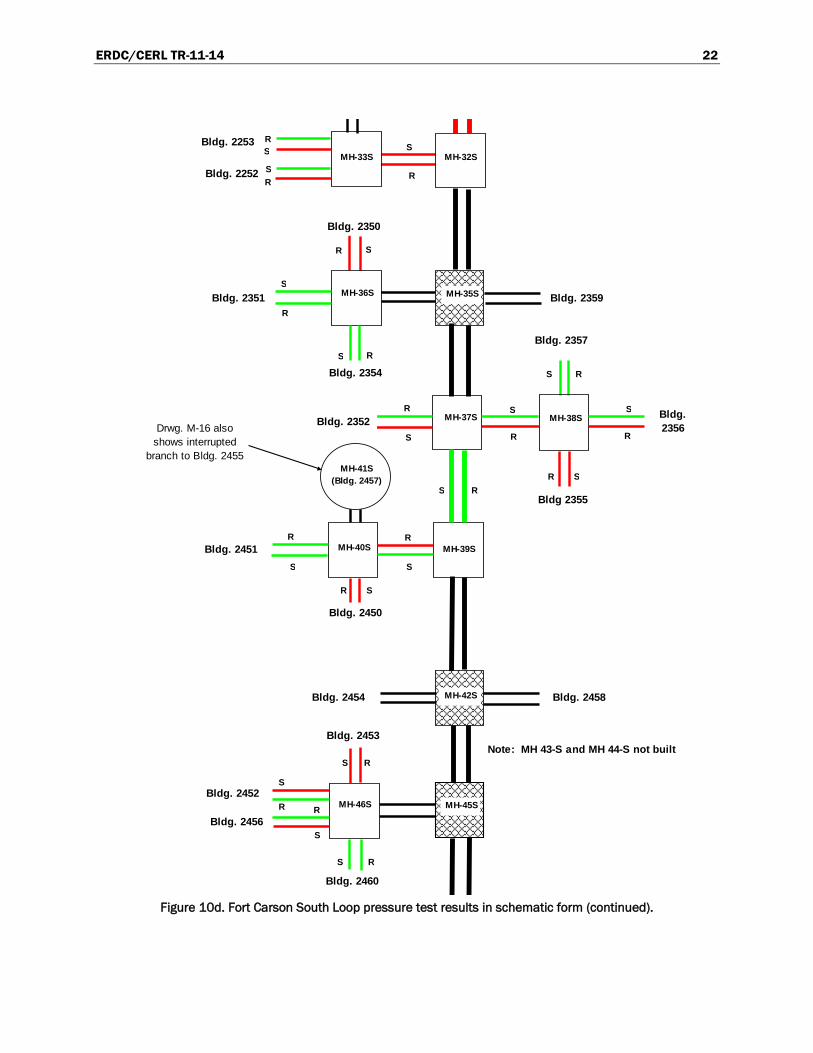
Figure 9 summarizes the test results for the South Loop, indicating a fail-ure rate of 55.9%. It also provides a legend for structures shown in Figure 10, the South Loop schematic diagrams. (Note that Figure 10 extends across five pages.) Detailed test results for each valve pit and conduit seg-ment test data are provided in Appendix I.
Figure 9. Fort Carson South Loop pressure test summary and legend for Figure 10.
South Loop Test Statistics
Lines Total = 242Lines Tested = 179Lines Passed = 79
Lines Failed = 100Percent Tested = 74.0%
Percent Tested That Failed = 55.9%Percent Tested That Passed = 44.1%
= Raised Pit
= Confined Space, Permit-Required Pit, Diamond Plate Entry
= Confined Space, Permit-Required Pit, Round Manhole Entry
ERDC/CERL TR-11-14 19
Figure 10a. Fort Carson south loop pressure test results in schematic form (network
continues from bottom of Figure 10a to top of Figure 10b, and so on).
FT. CARSON SOUTH LOOP SCHEMATIC
Bldg. 1864
* Note: MH-3S not built
Key
Pass
Fail
Not Tested
RETURN = R
SUPPLY = S
* Note: MH 11-S not built
MH-1S
MH-2S Bldg. 1855
MH-4SMH-5S
Bldg. 1850 Bldg. 1851
Bldg. 1852
MH-6SBldg. 1853
Bldg. 1854
MH-7SMH-8S
7-S
Bldg. 1955
Bldg. 1954
Bldg. 1950
Bldg. 1951
MH-9S MH-10SMH-12SMH-13S
MH-14S(Bldg. 1957)
MH-15S(Bldg. 2057)
Bldg. 1958
Bldg. 2058
Bldg. 1953
Bldg. 1952
Bldg. 2051
Bldg. 2050
Heating Plant Bldg. 1856
Drwgs. M-3 and M-4 also show interrupted branch to Bldg. 1956
R
S
S
S
S
S
SS
S
SS
S
S
S
S
S
S
S
S?
S
S
S
SS
S
S
S
S
R
S
R
R
R
RR
R
R
R
R
R
R
R
R
R
R
S
R
R?
R
R
R
RR
RR
R
R
R
ERDC/CERL TR-11-14 20
Figure 10b. Fort Carson South Loop pressure test results in schematic form (continued).
* Note: MH 11-S not built
7-S
Bldg. 1954
MH-9S MH-10SMH-12SMH-13S
MH-14S(Bldg. 1957)
MH-15S(Bldg. 2057)
Bldg. 1958
Bldg. 2058
Bldg. 1953
Bldg. 1952
Bldg. 2051
Bldg. 2050
MH-16SMH-17S
Bldg. 2052
Bldg. 2061
Bldg 2053
Bldg. 2056
Bldg. 2054
MH-18SMH-19S
Bldg. 2074
Bldg. 2060
19-S
Bldg. 2071
Bldg. 2070
Bldg 2075
MH-20S MH-21S
MH-23S (Bldg. 2077)
MH-24S(Bldg. 2157)
MH-22SMH-25S
Bldg. 2078
Bldg. 2158
Bldg. 2073
Bldg. 2150
Bldg. 2151
Bldg. 2072
Drwgs. M-3 and M-4 also show interrupted branch to Bldg. 1956 S?
S
S
S
SS
S
S
S
S
R?
R
R
R
RR
RR
R
R
R
R
RR
R
R R
RR
R
R
R
RRR
RR
R
R
R
S
S
S
S
S
S
S
SS
S
S
S
S
SSS
S
S
S
S
S
ERDC/CERL TR-11-14 21
Figure 10c. Fort Carson South Loop pressure test results in schematic form (continued).
* NOTE: MH 29-S not built
19-SMH-20S MH-21S
MH-23S (Bldg. 2077)
MH-24S(Bldg. 2157)
MH-22SMH-25S
Bldg. 2078
Bldg. 2158
Bldg. 2073
Bldg. 2150
Bldg. 2151
Bldg. 2072
MH-27S
Bldg. 2154
Bldg. 2153
Bldg. 2156MH-26S
Bldg. 2152
Bldg. 2161
MH-30S MH-28S
Bldg. 2250
Bldg. 2255
Bldg. 2251
Bldg. 2254
Bldg. 2160
MH-31S Bldg. 2258
2258
MH-33S MH-32S
MH-34S (Bldg. 2257)
Bldg. 2252
Bldg. 2253
Bldg. 2350
Drwg. M-12 also shows interrupted branch to Bldg. 2256
R
R
RRR
RR
R
R
R
R
R
R
R
R
S
S
S
SSS
S
S
S
S
S
S
S
SS
S
S
S
S
S
S
S
S
SS
S RR
R
R
R
R
R
R
R
R
ERDC/CERL TR-11-14 22
Figure 10d. Fort Carson South Loop pressure test results in schematic form (continued).
Note: MH 43-S and MH 44-S not built
MH-33S MH-32S
Bldg. 2357
Bldg. 2252
Bldg. 2253
MH-36S
Bldg. 2354
Bldg. 2351
Bldg. 2350
MH-35S Bldg. 2359
Bldg. 2356
Bldg 2355
Bldg. 2352 MH-37S MH-38S
MH-39SBldg. 2451 MH-40S
37-S
Bldg. 2450
MH-41S(Bldg. 2457)
Bldg. 2458Bldg. 2454 MH-42S
MH-45S
Bldg. 2456MH-46S
Bldg. 2452
Bldg. 2453
Bldg. 2460
Drwg. M-16 also shows interrupted
branch to Bldg. 2455
SS
S
S
S
S
S
S
S
S
SS
S
S
S
R
R R
R
R
R
R
R
R
R
R
R
RR
R
R
R R
RS
S
S
S
ERDC/CERL TR-11-14 23
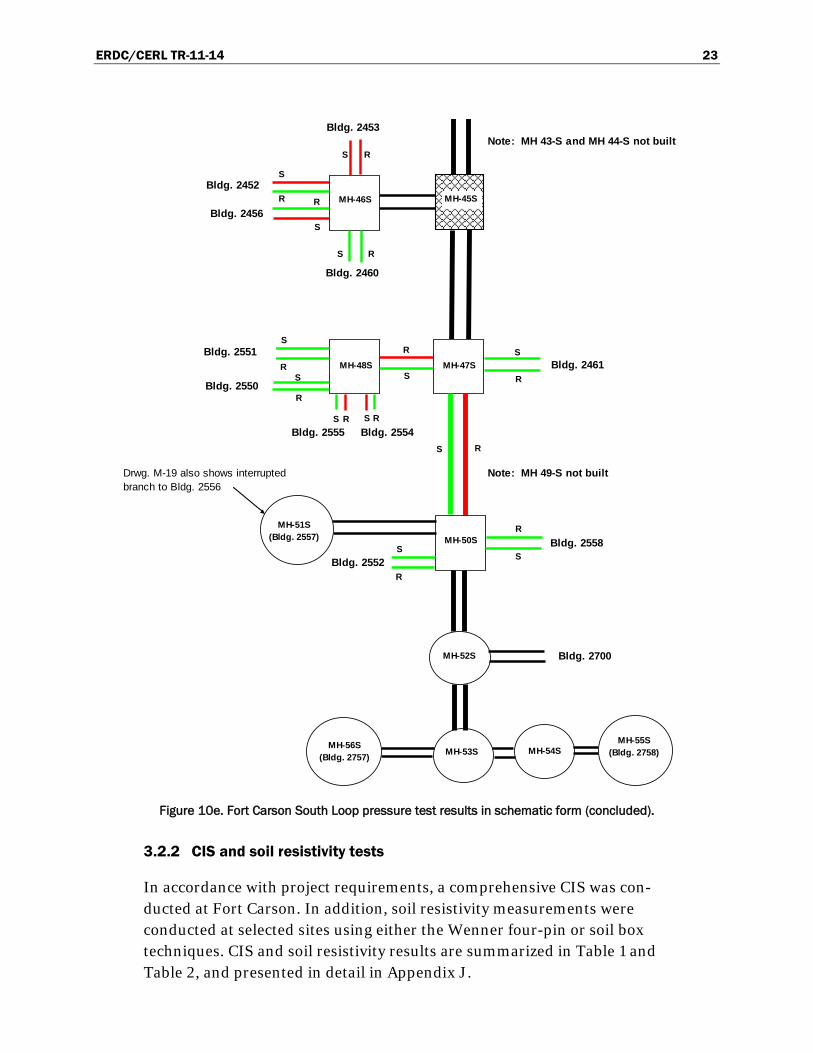
Figure 10e. Fort Carson South Loop pressure test results in schematic form (concluded).
3.2.2 CIS and soil resistivity tests
In accordance with project requirements, a comprehensive CIS was con-ducted at Fort Carson. In addition, soil resistivity measurements were conducted at selected sites using either the Wenner four-pin or soil box techniques. CIS and soil resistivity results are summarized in Table 1 and Table 2, and presented in detail in Appendix J.
Note: MH 43-S and MH 44-S not built
Drwg. M-19 also shows interrupted Note: MH 49-S not builtbranch to Bldg. 2556
MH-45SBldg. 2456
MH-46SBldg. 2452
Bldg. 2453
Bldg. 2460
MH-48S MH-47S
Bldg. 2550
Bldg. 2461Bldg. 2551
Bldg. 2555 Bldg. 2554
Bldg. 2558MH-50S
Bldg. 2552
MH-51S (Bldg. 2557)
MH-52S Bldg. 2700
MH-53SMH-56S
(Bldg. 2757)MH-54S
MH-55S (Bldg. 2758)
R
R R
R
R
R
R R
R
R
R
R
R
SS
S
S
S
SS
S
S
S
S
S
S
ERDC/CERL TR-11-14 24
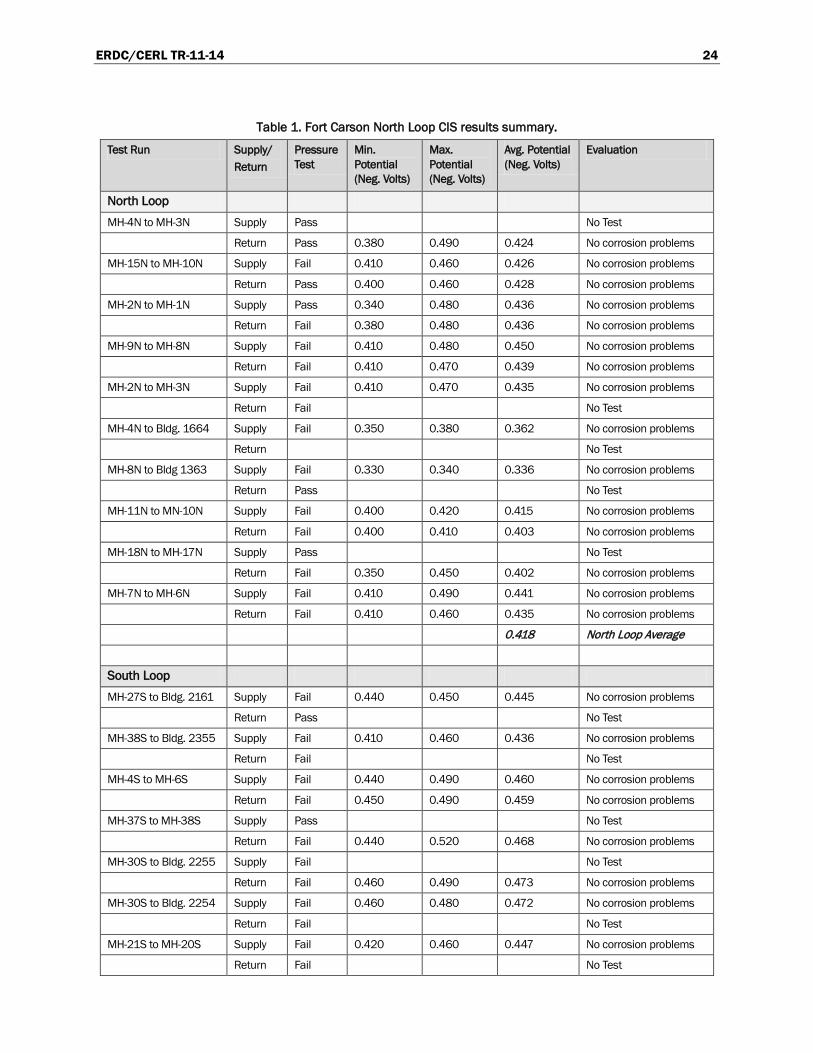
Table 1. Fort Carson North Loop CIS results summary.
Test Run Supply/ Return
Pressure Test
Min. Potential (Neg. Volts)
Max. Potential (Neg. Volts)
Avg. Potential (Neg. Volts)
Evaluation
North Loop MH-4N to MH-3N Supply Pass No Test
Return Pass 0.380 0.490 0.424 No corrosion problems
MH-15N to MH-10N Supply Fail 0.410 0.460 0.426 No corrosion problems
Return Pass 0.400 0.460 0.428 No corrosion problems
MH-2N to MH-1N Supply Pass 0.340 0.480 0.436 No corrosion problems
Return Fail 0.380 0.480 0.436 No corrosion problems
MH-9N to MH-8N Supply Fail 0.410 0.480 0.450 No corrosion problems
Return Fail 0.410 0.470 0.439 No corrosion problems
MH-2N to MH-3N Supply Fail 0.410 0.470 0.435 No corrosion problems
Return Fail No Test
MH-4N to Bldg. 1664 Supply Fail 0.350 0.380 0.362 No corrosion problems
Return No Test
MH-8N to Bldg 1363 Supply Fail 0.330 0.340 0.336 No corrosion problems
Return Pass No Test
MH-11N to MN-10N Supply Fail 0.400 0.420 0.415 No corrosion problems
Return Fail 0.400 0.410 0.403 No corrosion problems
MH-18N to MH-17N Supply Pass No Test
Return Fail 0.350 0.450 0.402 No corrosion problems
MH-7N to MH-6N Supply Fail 0.410 0.490 0.441 No corrosion problems
Return Fail 0.410 0.460 0.435 No corrosion problems
0.418 North Loop Average
South Loop MH-27S to Bldg. 2161 Supply Fail 0.440 0.450 0.445 No corrosion problems
Return Pass No Test
MH-38S to Bldg. 2355 Supply Fail 0.410 0.460 0.436 No corrosion problems
Return Fail No Test
MH-4S to MH-6S Supply Fail 0.440 0.490 0.460 No corrosion problems
Return Fail 0.450 0.490 0.459 No corrosion problems
MH-37S to MH-38S Supply Pass No Test
Return Fail 0.440 0.520 0.468 No corrosion problems
MH-30S to Bldg. 2255 Supply Fail No Test
Return Fail 0.460 0.490 0.473 No corrosion problems
MH-30S to Bldg. 2254 Supply Fail 0.460 0.480 0.472 No corrosion problems
Return Fail No Test
MH-21S to MH-20S Supply Fail 0.420 0.460 0.447 No corrosion problems
Return Fail No Test
ERDC/CERL TR-11-14 25
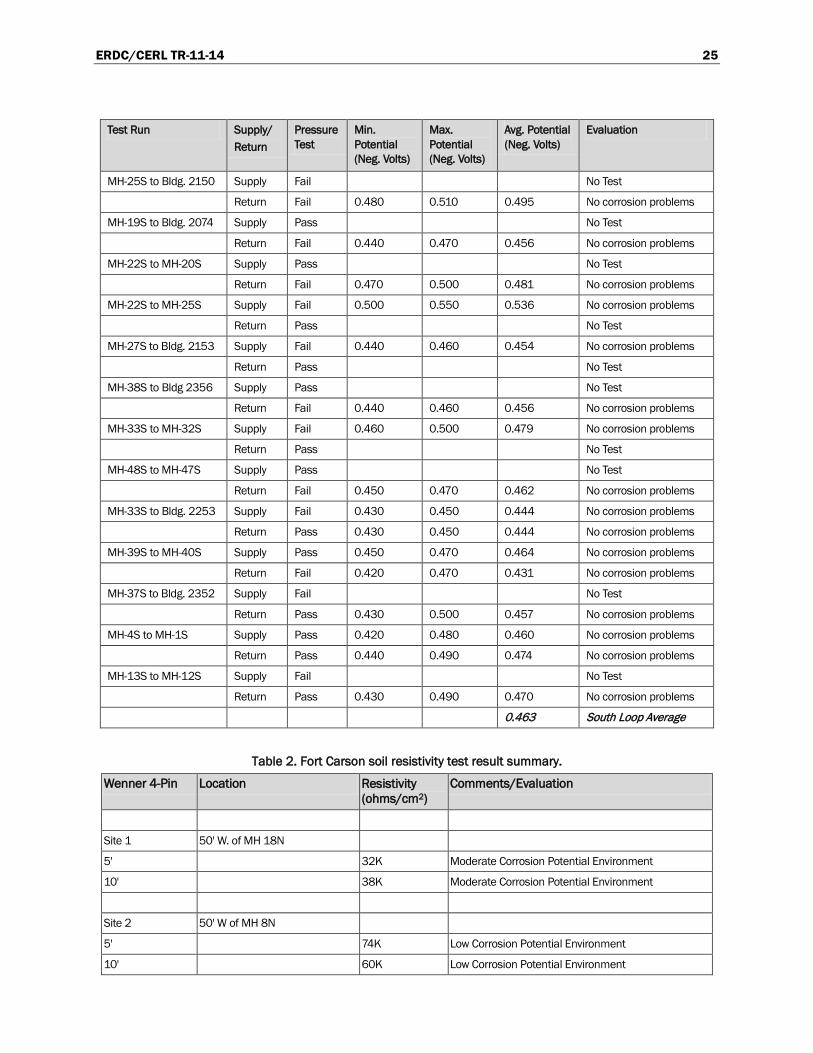
Test Run Supply/ Return
Pressure Test
Min. Potential (Neg. Volts)
Max. Potential (Neg. Volts)
Avg. Potential (Neg. Volts)
Evaluation
MH-25S to Bldg. 2150 Supply Fail No Test
Return Fail 0.480 0.510 0.495 No corrosion problems
MH-19S to Bldg. 2074 Supply Pass No Test
Return Fail 0.440 0.470 0.456 No corrosion problems
MH-22S to MH-20S Supply Pass No Test
Return Fail 0.470 0.500 0.481 No corrosion problems
MH-22S to MH-25S Supply Fail 0.500 0.550 0.536 No corrosion problems
Return Pass No Test
MH-27S to Bldg. 2153 Supply Fail 0.440 0.460 0.454 No corrosion problems
Return Pass No Test
MH-38S to Bldg 2356 Supply Pass No Test
Return Fail 0.440 0.460 0.456 No corrosion problems
MH-33S to MH-32S Supply Fail 0.460 0.500 0.479 No corrosion problems
Return Pass No Test
MH-48S to MH-47S Supply Pass No Test
Return Fail 0.450 0.470 0.462 No corrosion problems
MH-33S to Bldg. 2253 Supply Fail 0.430 0.450 0.444 No corrosion problems
Return Pass 0.430 0.450 0.444 No corrosion problems
MH-39S to MH-40S Supply Pass 0.450 0.470 0.464 No corrosion problems
Return Fail 0.420 0.470 0.431 No corrosion problems
MH-37S to Bldg. 2352 Supply Fail No Test
Return Pass 0.430 0.500 0.457 No corrosion problems
MH-4S to MH-1S Supply Pass 0.420 0.480 0.460 No corrosion problems
Return Pass 0.440 0.490 0.474 No corrosion problems
MH-13S to MH-12S Supply Fail No Test
Return Pass 0.430 0.490 0.470 No corrosion problems
0.463 South Loop Average
Table 2. Fort Carson soil resistivity test result summary.
Wenner 4-Pin Location Resistivity (ohms/cm2)
Comments/Evaluation
Site 1 50' W. of MH 18N
5' 32K Moderate Corrosion Potential Environment
10' 38K Moderate Corrosion Potential Environment
Site 2 50' W of MH 8N
5' 74K Low Corrosion Potential Environment
10' 60K Low Corrosion Potential Environment
ERDC/CERL TR-11-14 26
Wenner 4-Pin Location Resistivity (ohms/cm2)
Comments/Evaluation
Site 3 100' SW of MH 4N
5' 170K Very Low Corrosion Potential Environment
10' 74K Low Corrosion Potential Environment
Site 4 50' W of MH 6S
5' 78K Low Corrosion Potential Environment
10' 64K Low Corrosion Potential Environment
Site 5 100' SW of MH 30S
5' 65K Low Corrosion Potential Environment
10' 94K Low Corrosion Potential Environment
Site 6 150" W of MH 50S
5' 365K Very Low Corrosion Potential Environment
10' 166K Very Low Corrosion Potential Environment
Soil Box Location Resistivity (ohms/cm2)
Comments/Evaluation
Excavation Site 1 S. of MH-9N 2K Corrosive Environment
Excavation Site 2 S. of MH-4N 2.7K Corrosive Environment
Excavation Site 3 N. of MH-2N 2.3K Elbow Inspection Site/Corrosive Environment
Excavation Site 4 W. of MH-8S 10.7K Corrosive Environment
Excavation Site 5 W. of MH-13S 20K Moderate-Corrosive to Corrosive Environment
Excavation Site 6 W. of MH-39S 2K Elbow Inspection Site/Corrosive Environment
3.2.3 Visual inspection excavations
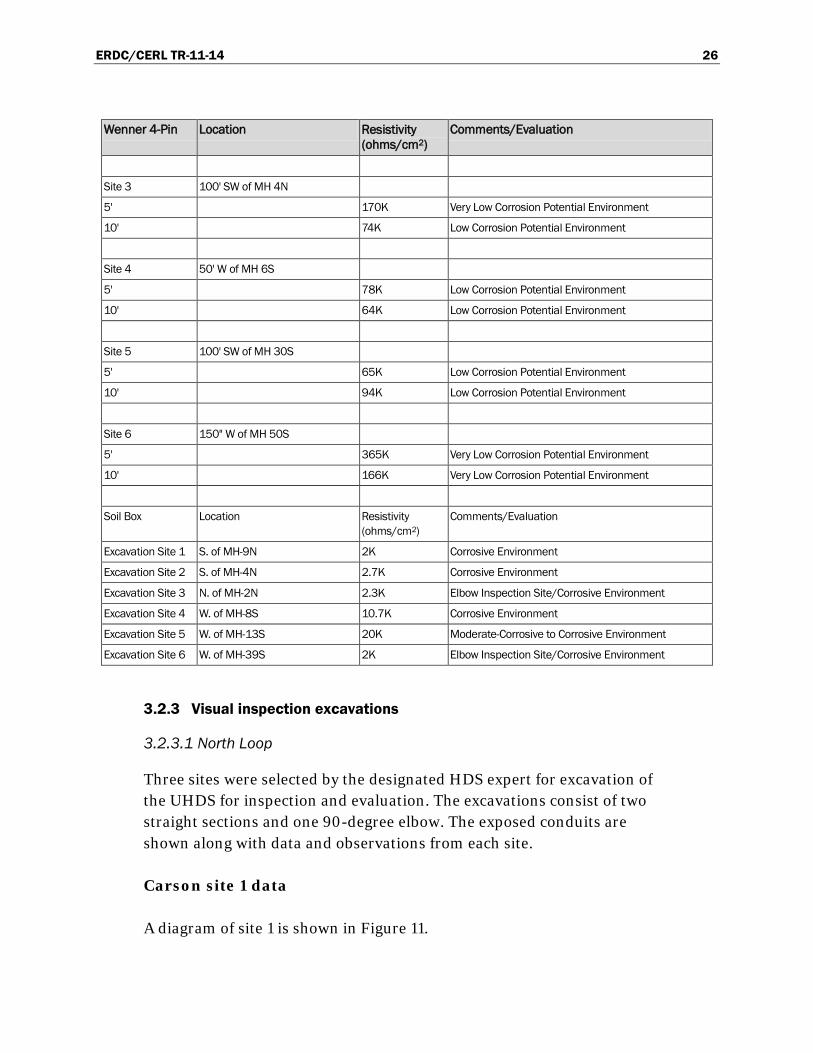
3.2.3.1 North Loop
Three sites were selected by the designated HDS expert for excavation of the UHDS for inspection and evaluation. The excavations consist of two straight sections and one 90-degree elbow. The exposed conduits are shown along with data and observations from each site.
Carson site 1 data
A diagram of site 1 is shown in Figure 11.
ERDC/CERL TR-11-14 27
Figure 11. North Loop excavation site 1.
1. Site Location: North Loop. Approximately 35 feet south of MH- 9N, 30 feet west of Bldg. 1362. Vanguard ICT as-built Ref. Sheet No. M-8
2. Conduit Size: Supply (East) – 57.75” Circ. (18.4” Dia.); 8” HTWS per Ref. Sheet No. M-8; Return (West) – 56.00” Circ. (17.8” Dia.); 8” HTWS per Ref. Sheet No. M-8
3. Note: Casing circ. for both conduits measures 50.25” (16” dia.). Con-duit and casing dimensions agree with Perma-Pipe “Multi-Therm 500” nominal specs for 8” carrier with 2.5” cellular glass insulation
4. Conduit Temperature: Supply and Return – Slightly warm to touch when first exposed, temperature dropped quickly to ambient after ex-posure.
5. Outer Jacket Condition: Supply – Good; Return – Good 6. Damage Observation (Abrasion, wear, damage, workmanship): No sig-
nificant damage, wear or abrasion; construction workmanship is good. 7. Nature of “Select Backfill”: Pea gravel and native earth used for backfill
after system installation. 8. Inclusions, if any: Small-medium rocks, occasional construction debris 9. Depth of Burial: 62” below grade to conduit top. 10. Conduit Separation: 20” centerline to centerline
Excavation Site 1NOT TO SCALE N
PIT9-N
Bldg. 1362
37' 9"
31'49'
Fire Lane
20" (Centerline to Centerline)
ERDC/CERL TR-11-14 28
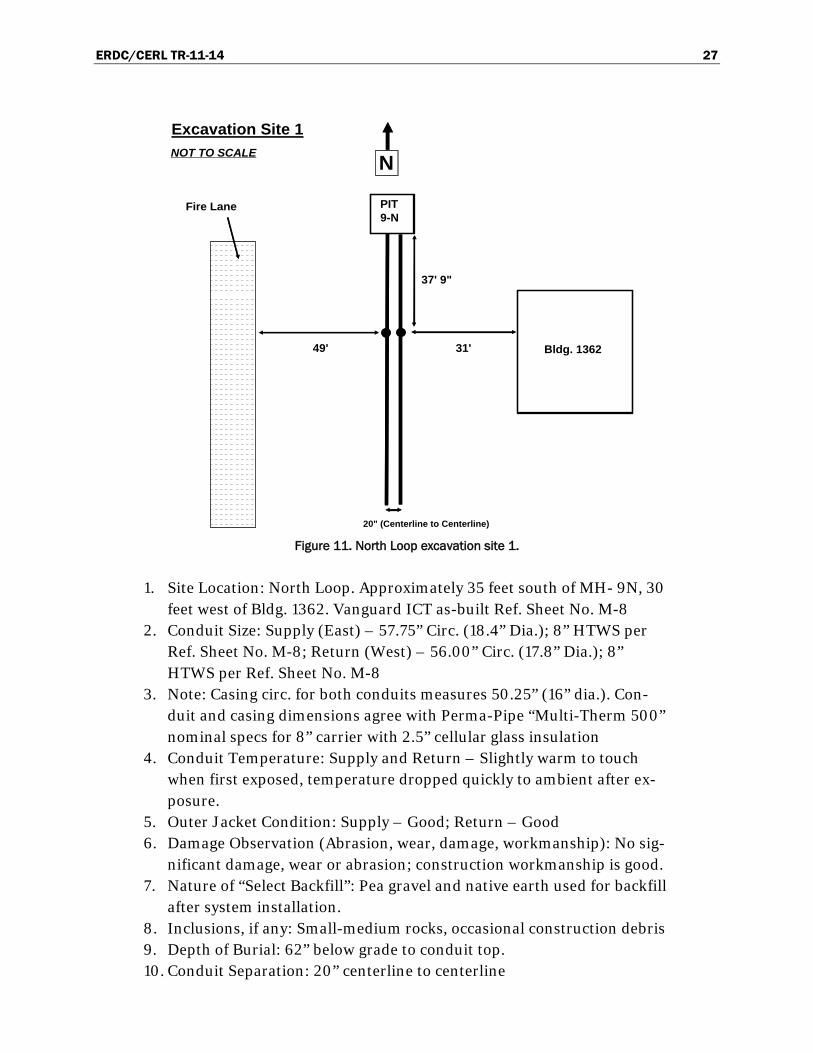
11. Native soil type at burial depth (@ASHRAE Site 1): a. Claystone b. Grain: Fine c. Consistency: Hard d. Moisture: Moderate-High e. Clay: High f. Plasticity: Moderate-High g. Color: Brown
12. Soil Resistivity at burial depth: 2,000. ohms/cm2 13. Photo Documentation: See Figure 12 and Figure 13 below. 14. Any other data that would influence the system: None
Figure 12. Site 1 excavation, facing south.
ERDC/CERL TR-11-14 29
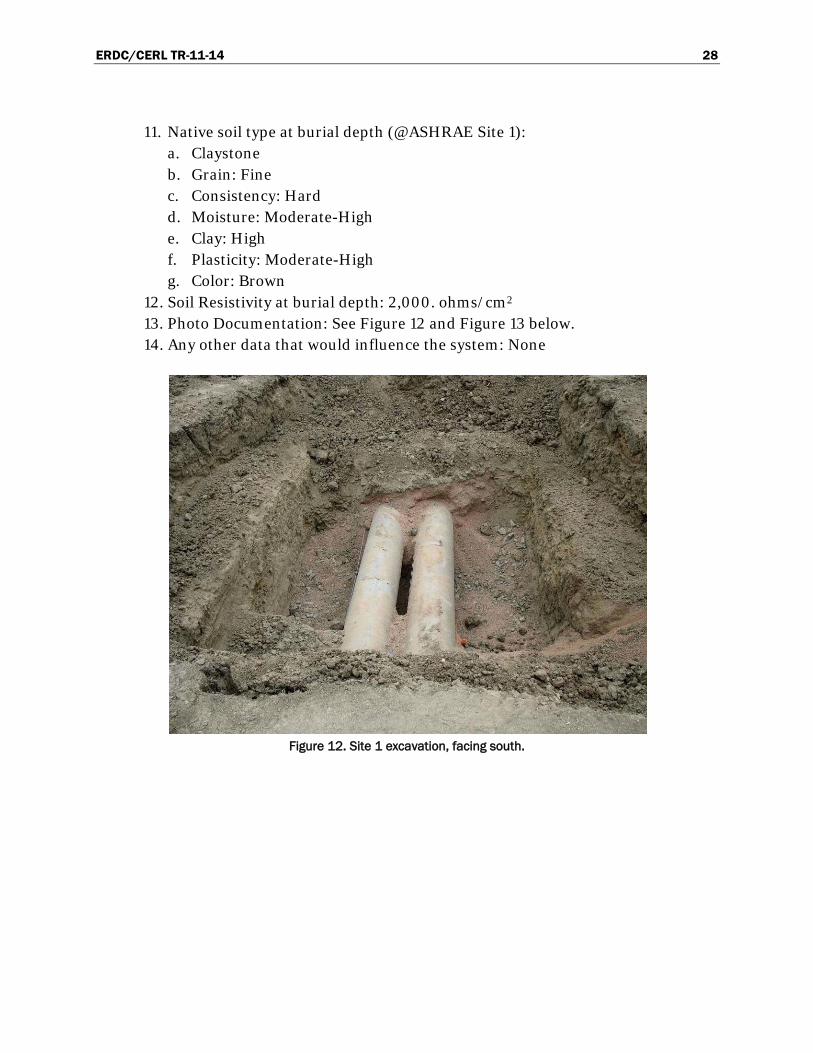
Figure 13. Site 1 excavation with heat flux instrumentation.
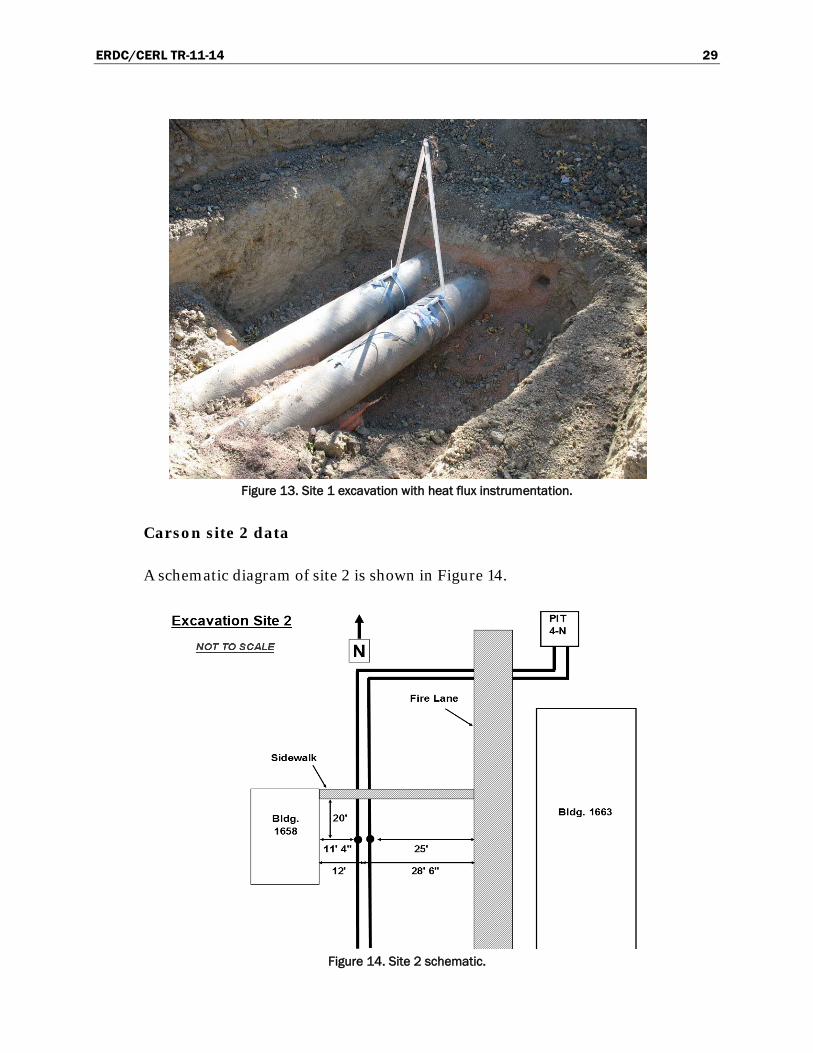
Carson site 2 data
A schematic diagram of site 2 is shown in Figure 14.
Figure 14. Site 2 schematic.
ERDC/CERL TR-11-14 30
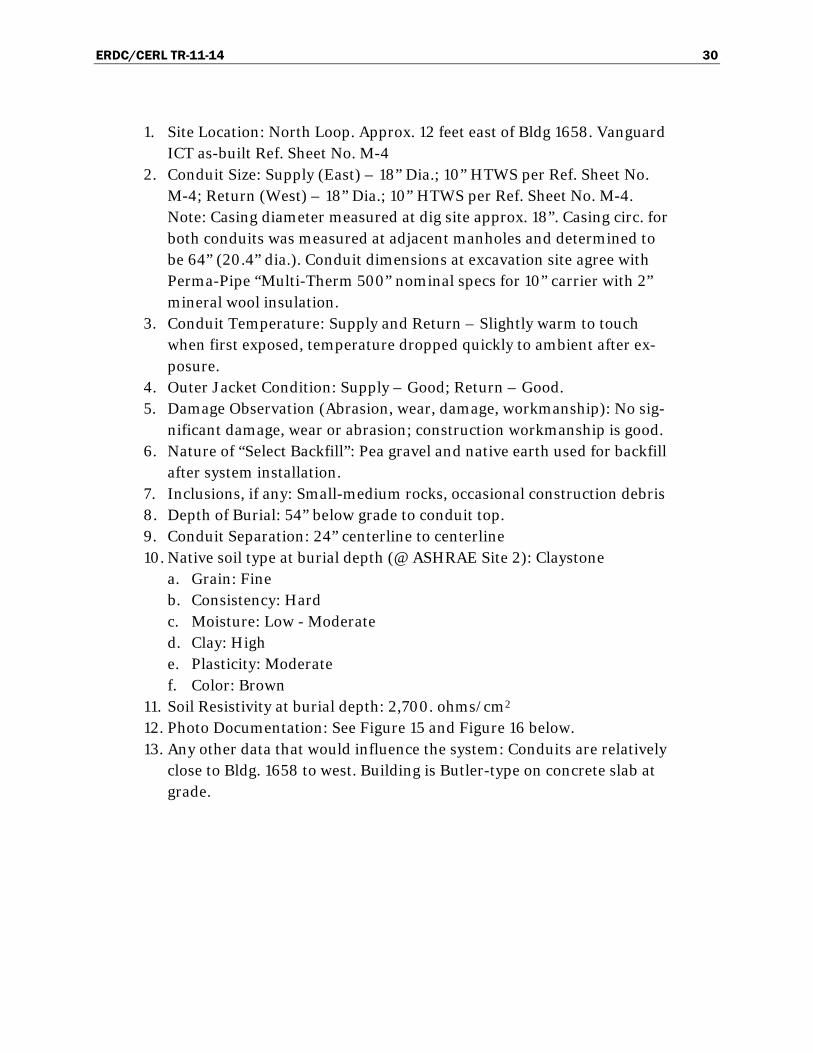
1. Site Location: North Loop. Approx. 12 feet east of Bldg 1658. Vanguard ICT as-built Ref. Sheet No. M-4
2. Conduit Size: Supply (East) – 18” Dia.; 10” HTWS per Ref. Sheet No. M-4; Return (West) – 18” Dia.; 10” HTWS per Ref. Sheet No. M-4. Note: Casing diameter measured at dig site approx. 18”. Casing circ. for both conduits was measured at adjacent manholes and determined to be 64” (20.4” dia.). Conduit dimensions at excavation site agree with Perma-Pipe “Multi-Therm 500” nominal specs for 10” carrier with 2” mineral wool insulation.
3. Conduit Temperature: Supply and Return – Slightly warm to touch when first exposed, temperature dropped quickly to ambient after ex-posure.
4. Outer Jacket Condition: Supply – Good; Return – Good. 5. Damage Observation (Abrasion, wear, damage, workmanship): No sig-
nificant damage, wear or abrasion; construction workmanship is good. 6. Nature of “Select Backfill”: Pea gravel and native earth used for backfill
after system installation. 7. Inclusions, if any: Small-medium rocks, occasional construction debris 8. Depth of Burial: 54” below grade to conduit top. 9. Conduit Separation: 24” centerline to centerline 10. Native soil type at burial depth (@ ASHRAE Site 2): Claystone
a. Grain: Fine b. Consistency: Hard c. Moisture: Low - Moderate d. Clay: High e. Plasticity: Moderate f. Color: Brown
11. Soil Resistivity at burial depth: 2,700. ohms/cm2 12. Photo Documentation: See Figure 15 and Figure 16 below. 13. Any other data that would influence the system: Conduits are relatively
close to Bldg. 1658 to west. Building is Butler-type on concrete slab at grade.
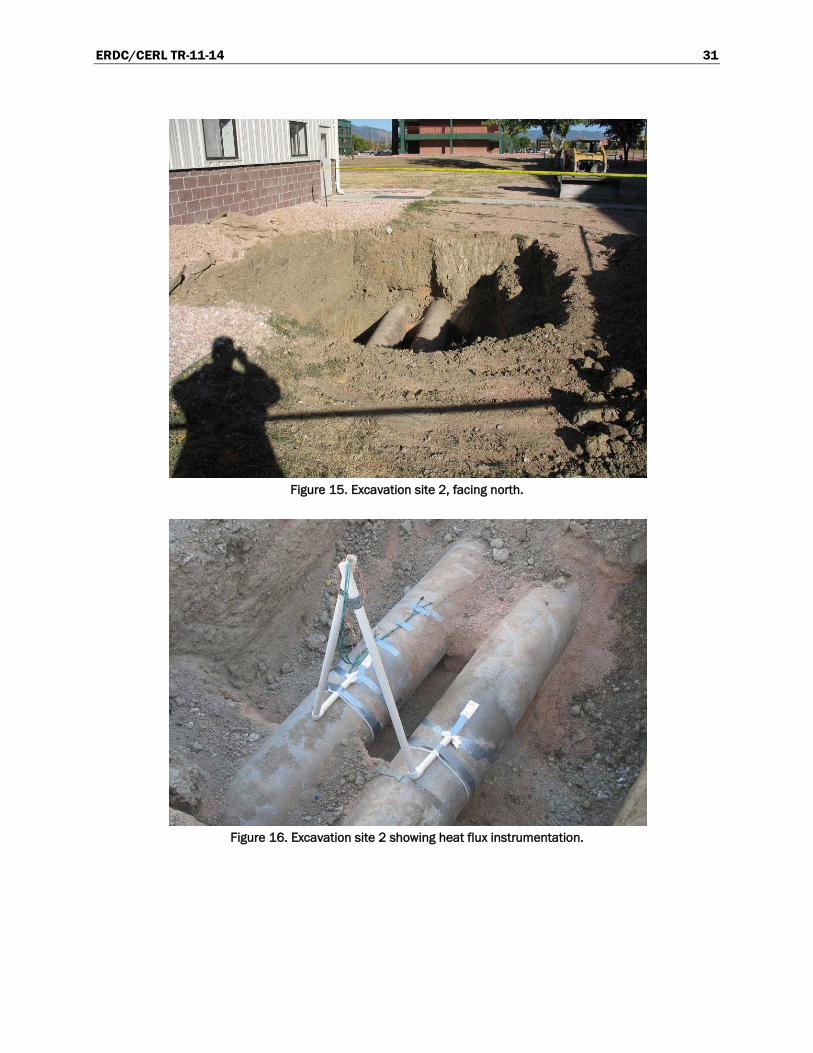
ERDC/CERL TR-11-14 31
Figure 15. Excavation site 2, facing north.
Figure 16. Excavation site 2 showing heat flux instrumentation.
ERDC/CERL TR-11-14 32
Carson site 3 data (elbow inspection)
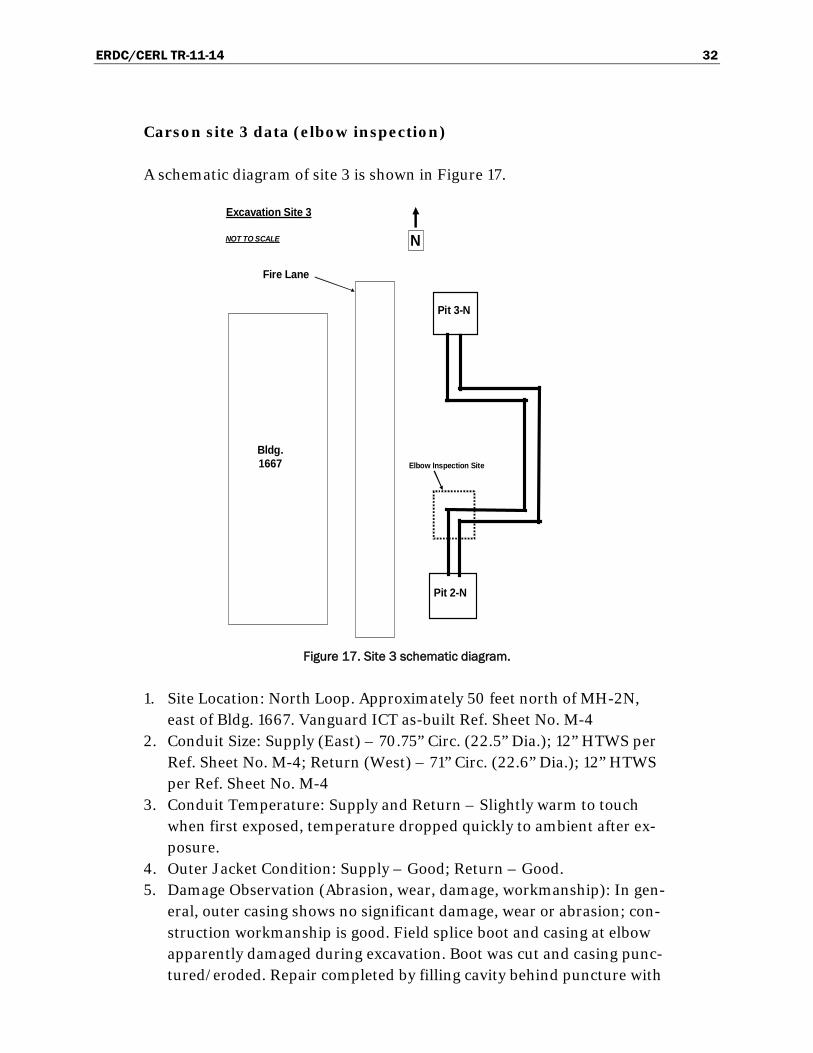
A schematic diagram of site 3 is shown in Figure 17.
Figure 17. Site 3 schematic diagram.
1. Site Location: North Loop. Approximately 50 feet north of MH-2N, east of Bldg. 1667. Vanguard ICT as-built Ref. Sheet No. M-4
2. Conduit Size: Supply (East) – 70.75” Circ. (22.5” Dia.); 12” HTWS per Ref. Sheet No. M-4; Return (West) – 71” Circ. (22.6” Dia.); 12” HTWS per Ref. Sheet No. M-4
3. Conduit Temperature: Supply and Return – Slightly warm to touch when first exposed, temperature dropped quickly to ambient after ex-posure.
4. Outer Jacket Condition: Supply – Good; Return – Good. 5. Damage Observation (Abrasion, wear, damage, workmanship): In gen-
eral, outer casing shows no significant damage, wear or abrasion; con-struction workmanship is good. Field splice boot and casing at elbow apparently damaged during excavation. Boot was cut and casing punc-tured/eroded. Repair completed by filling cavity behind puncture with
Excavation Site 3
NOT TO SCALE
Elbow Inspection Site
Bldg. 1667
Pit 2-N
Pit 3-N
N
Fire Lane
ERDC/CERL TR-11-14 33
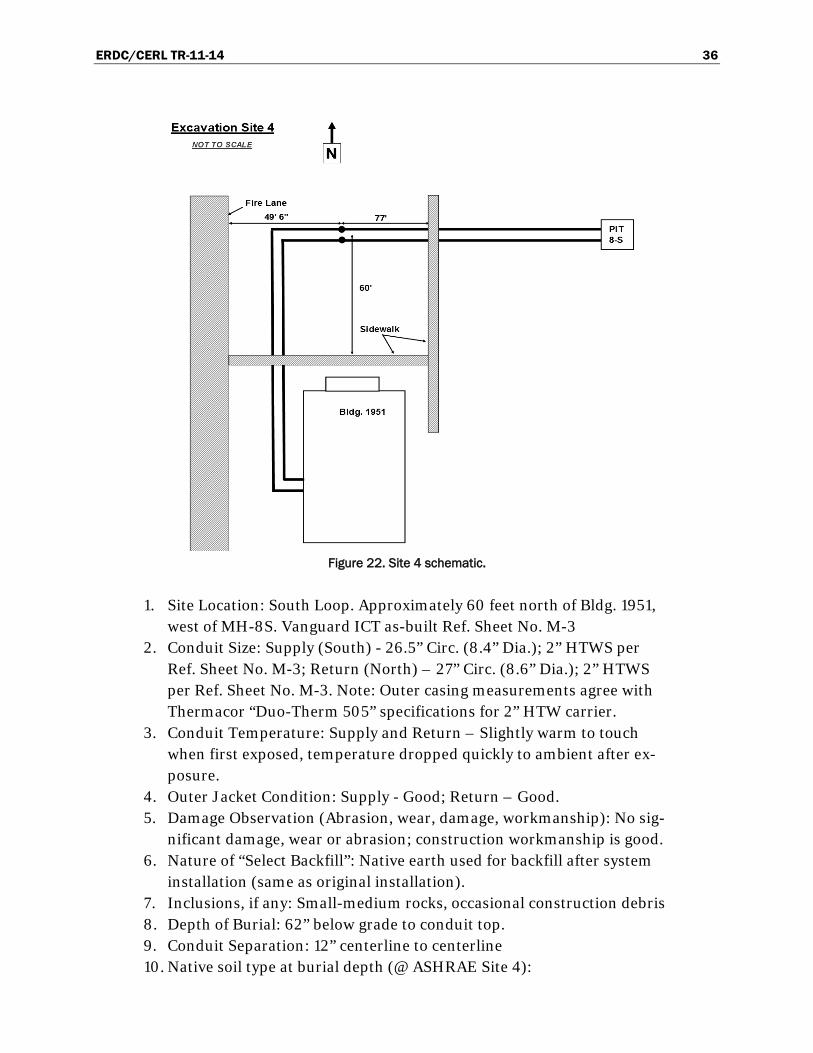
commercial polyurethane foam sprayed from aerosol can dispenser. Excess foam removed to flush with conduit surface after curing. Both foam and boot cut were sealed with black commercial silicone roofing sealer and allowed to cure for one day before re-burying conduits. Roofing sealer also used to fill in eroded channels on conduit surface near puncture.
6. Nature of “Select Backfill”: Pea gravel and native earth used for backfill after system installation.
7. Inclusions, if any: Small-medium rocks, occasional construction debris 8. Depth of Burial: 45” below grade to conduit top. 9. Conduit Separation: 24” centerline to centerline 10. Native soil type at burial depth (@ ASHRAE Site 3):
a. Sandy lean clay b. Grain: Fine-Coarse c. Consistency: Very Stiff d. Moisture: Low - Moderate e. Clay: Moderate-High f. Plasticity: Moderate g. Color: Brown/Dark Brown
11. Soil Resistivity at burial depth: 2,300. ohms/cm2 12. Photo Documentation: See Figure 18 – Figure 21 below. 13. Any other data that would influence the system: NA – this is elbow in-
spection site only.
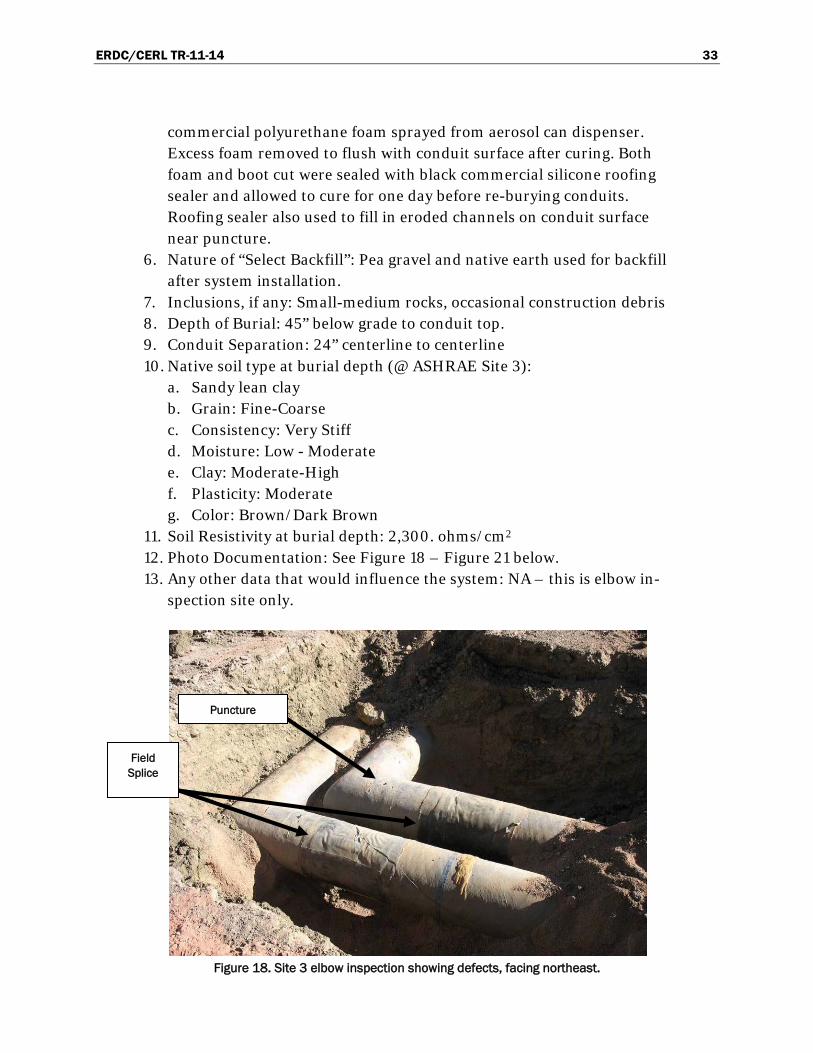
Figure 18. Site 3 elbow inspection showing defects, facing northeast.
Puncture
Field Splice
ERDC/CERL TR-11-14 34
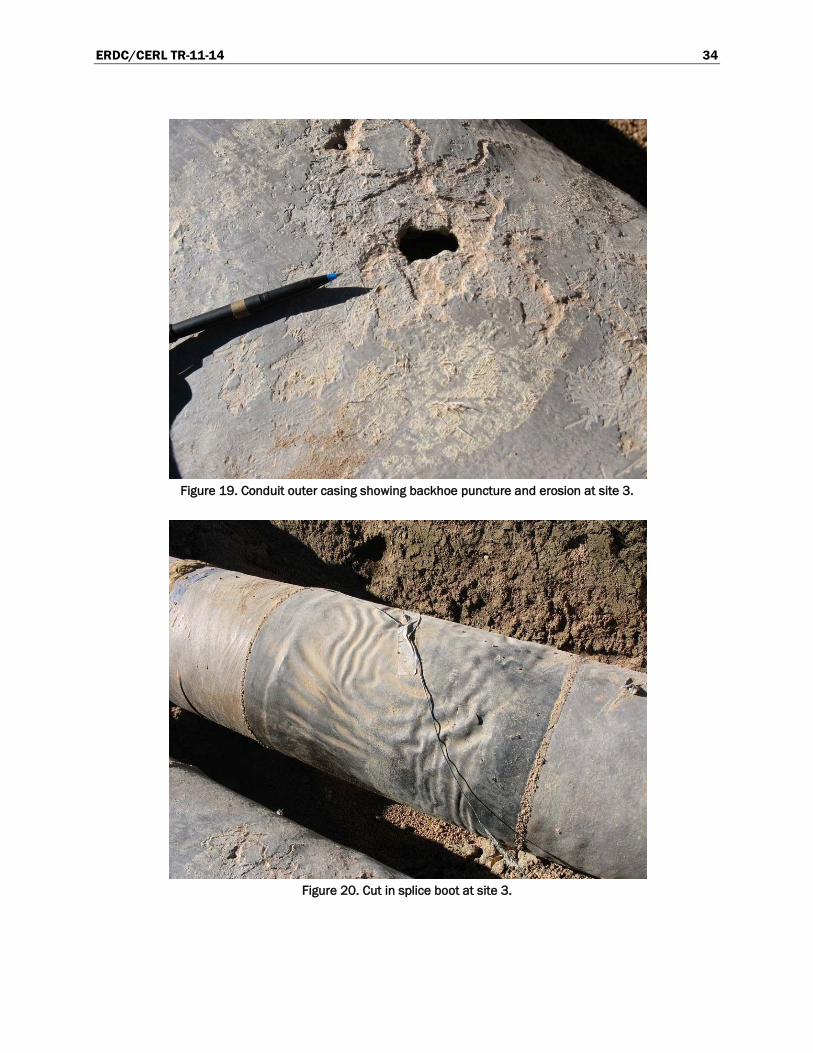
Figure 19. Conduit outer casing showing backhoe puncture and erosion at site 3.
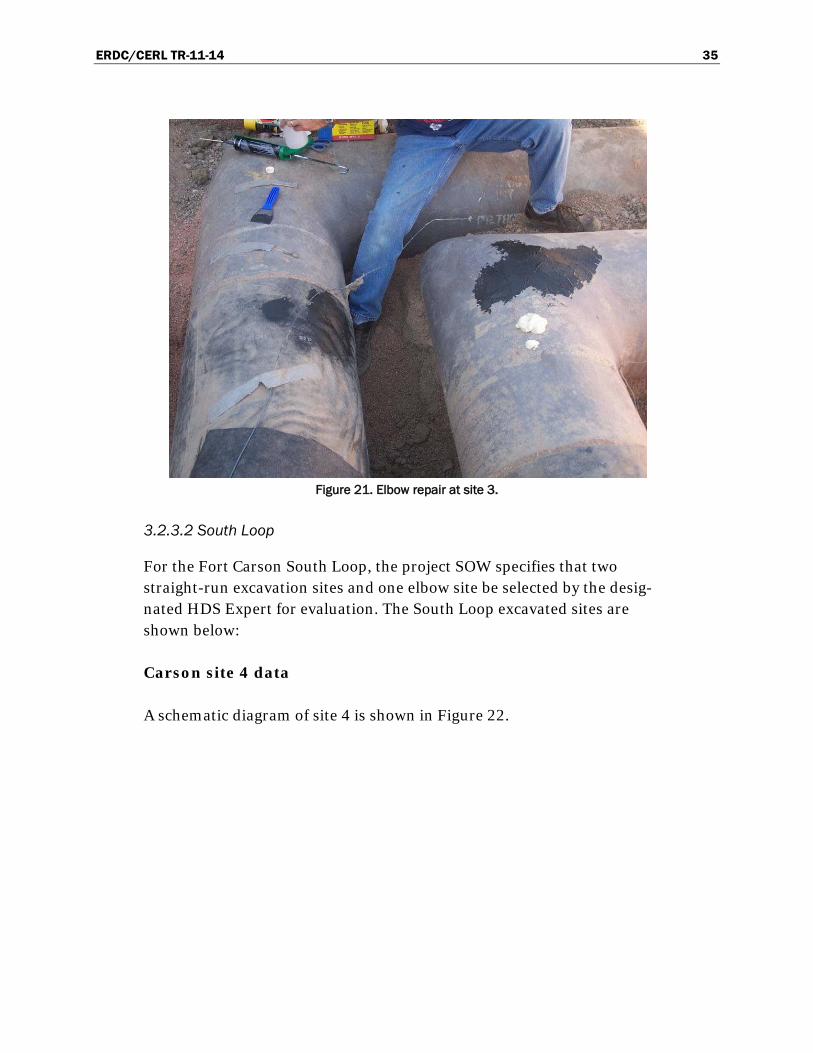
Figure 20. Cut in splice boot at site 3.
ERDC/CERL TR-11-14 35
Figure 21. Elbow repair at site 3.
3.2.3.2 South Loop
For the Fort Carson South Loop, the project SOW specifies that two straight-run excavation sites and one elbow site be selected by the desig-nated HDS Expert for evaluation. The South Loop excavated sites are shown below:
Carson site 4 data
A schematic diagram of site 4 is shown in Figure 22.
ERDC/CERL TR-11-14 36
Figure 22. Site 4 schematic.
1. Site Location: South Loop. Approximately 60 feet north of Bldg. 1951, west of MH-8S. Vanguard ICT as-built Ref. Sheet No. M-3
2. Conduit Size: Supply (South) - 26.5” Circ. (8.4” Dia.); 2” HTWS per Ref. Sheet No. M-3; Return (North) – 27” Circ. (8.6” Dia.); 2” HTWS per Ref. Sheet No. M-3. Note: Outer casing measurements agree with Thermacor “Duo-Therm 505” specifications for 2” HTW carrier.
3. Conduit Temperature: Supply and Return – Slightly warm to touch when first exposed, temperature dropped quickly to ambient after ex-posure.
4. Outer Jacket Condition: Supply - Good; Return – Good. 5. Damage Observation (Abrasion, wear, damage, workmanship): No sig-
nificant damage, wear or abrasion; construction workmanship is good. 6. Nature of “Select Backfill”: Native earth used for backfill after system
installation (same as original installation). 7. Inclusions, if any: Small-medium rocks, occasional construction debris 8. Depth of Burial: 62” below grade to conduit top. 9. Conduit Separation: 12” centerline to centerline 10. Native soil type at burial depth (@ ASHRAE Site 4):
ERDC/CERL TR-11-14 37
a. Fat Clay b. Grain: Fine-Coarse c. Consistency: Very Stiff d. Moisture: Moderate e. Clay: High f. Plasticity: Moderate-High g. Color: Brow/Light Brown
11. Soil Resistivity at burial depth: 10,700. ohms/cm2 12. Photo Documentation: See Figure 23 and Figure 24. 13. Any other data that would influence the system: None
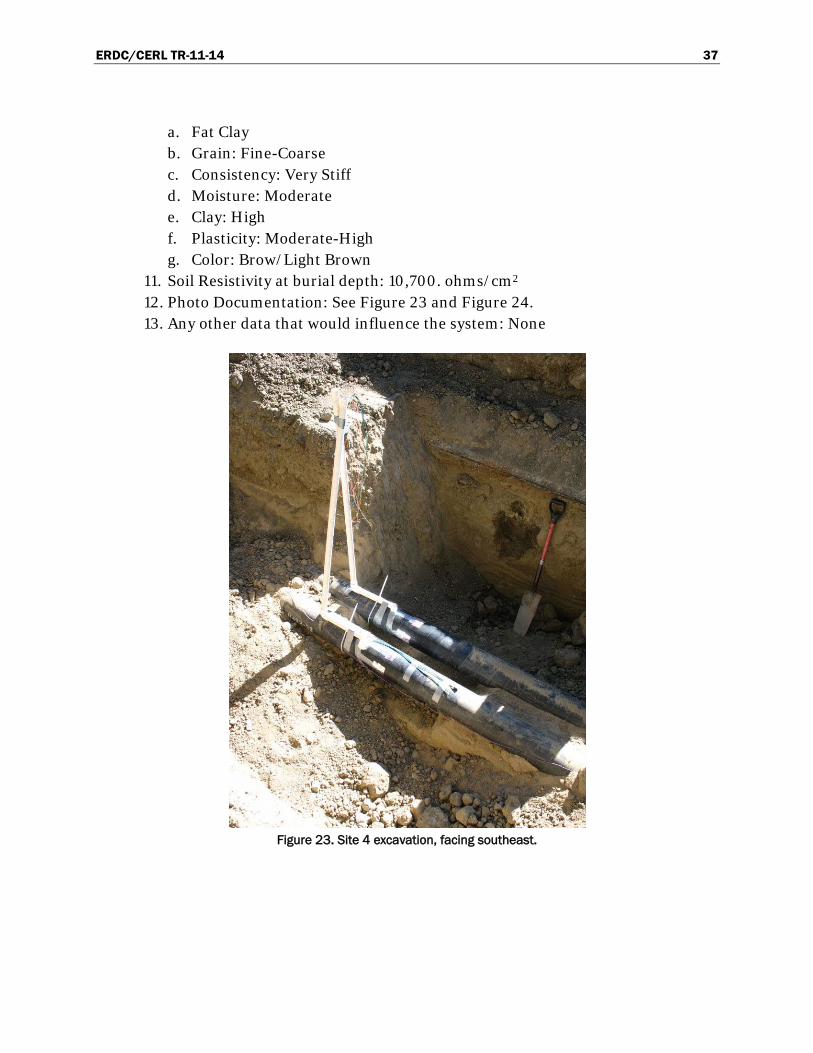
Figure 23. Site 4 excavation, facing southeast.
ERDC/CERL TR-11-14 38
Figure 24. Site 4 excavation with heat flux instrumentation.
Carson site 5 data
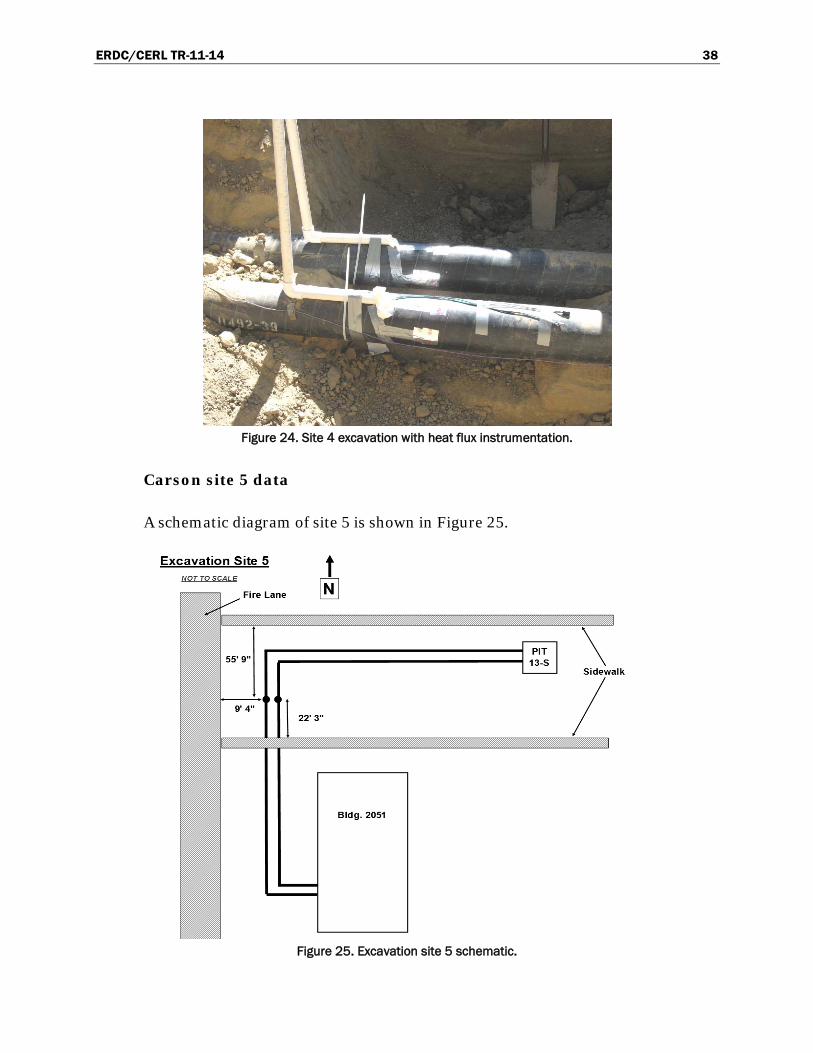
A schematic diagram of site 5 is shown in Figure 25.
Figure 25. Excavation site 5 schematic.
ERDC/CERL TR-11-14 39
1. Site Location: South Loop. North of Bldg. 2051, west of MH-13S. Van-guard ICT as-built Ref. Sheets No. M-5 and M-6
2. Conduit Size: Supply (East) – 27” Circ. (8.6” Dia.); 2” HTWS per Ref. Sheets No. M-5 and M-6; Return (West) – 27” Circ. (8.6” Dia.); 2” HTWS per Ref. Sheets No. M-5 and M-6. Note: Outer casing measure-ments agree with Thermacor “Duo-Therm 505” specifications for 2” HTW carrier.
3. Conduit Temperature: Supply and Return – Slightly warm to touch when first exposed, temperature dropped quickly to ambient after ex-posure.
4. Outer Jacket Condition: Supply - Good; Return – Good. 5. Damage Observation (Abrasion, wear, damage, workmanship): No sig-
nificant damage, wear or abrasion; construction workmanship is good. 6. Nature of “Select Backfill”: Native earth used for backfill after system
installation (same as original installation). 7. Inclusions, if any: Small-medium rocks, occasional construction debris 8. Depth of Burial: 36” below grade to conduit top. 9. Conduit Separation: 16” centerline to centerline 10. Native soil type at burial depth (@ ASHRAE Site 5):
a. Sandy Lean Clay b. Grain: Fine-Coarse c. Consistency: Very Stiff d. Moisture: Low-Moderate e. Clay: Moderate-High f. Plasticity: Moderate g. Color: Brown/Light Brown
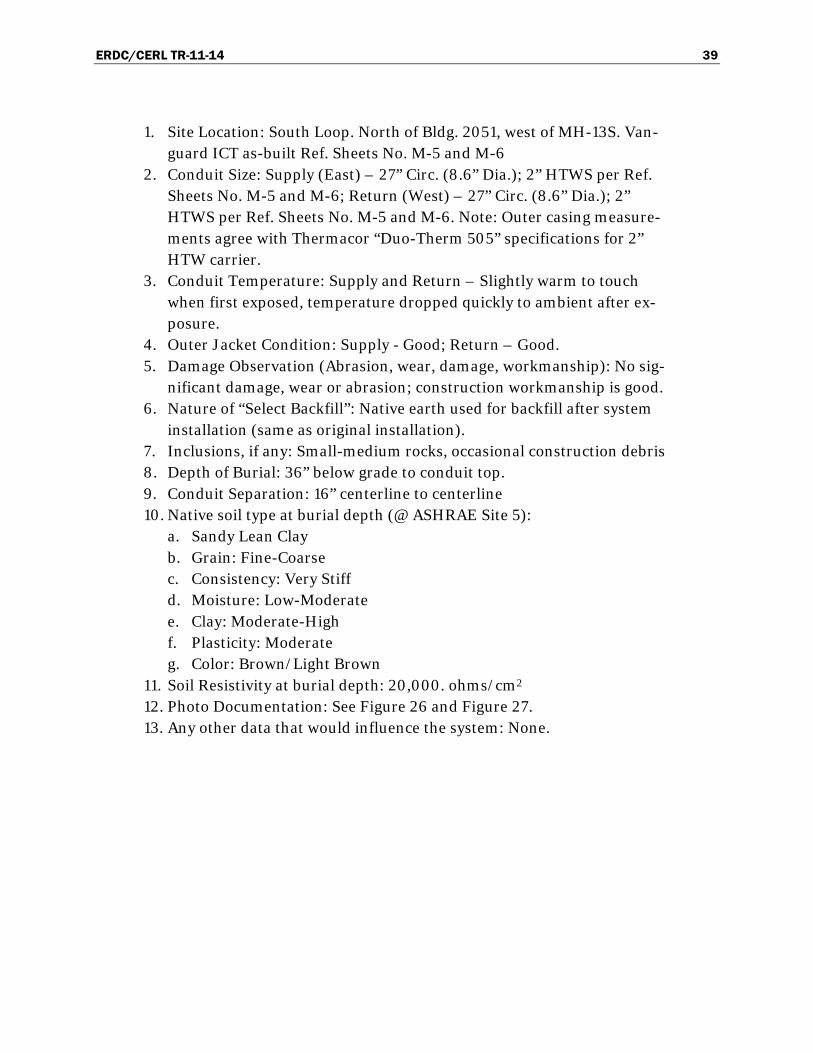
11. Soil Resistivity at burial depth: 20,000. ohms/cm2 12. Photo Documentation: See Figure 26 and Figure 27. 13. Any other data that would influence the system: None.
ERDC/CERL TR-11-14 40
Figure 26. Site 5 excavation, facing southeast.
Figure 27. Site 5 excavation with heat flux instrumentation.
ERDC/CERL TR-11-14 41
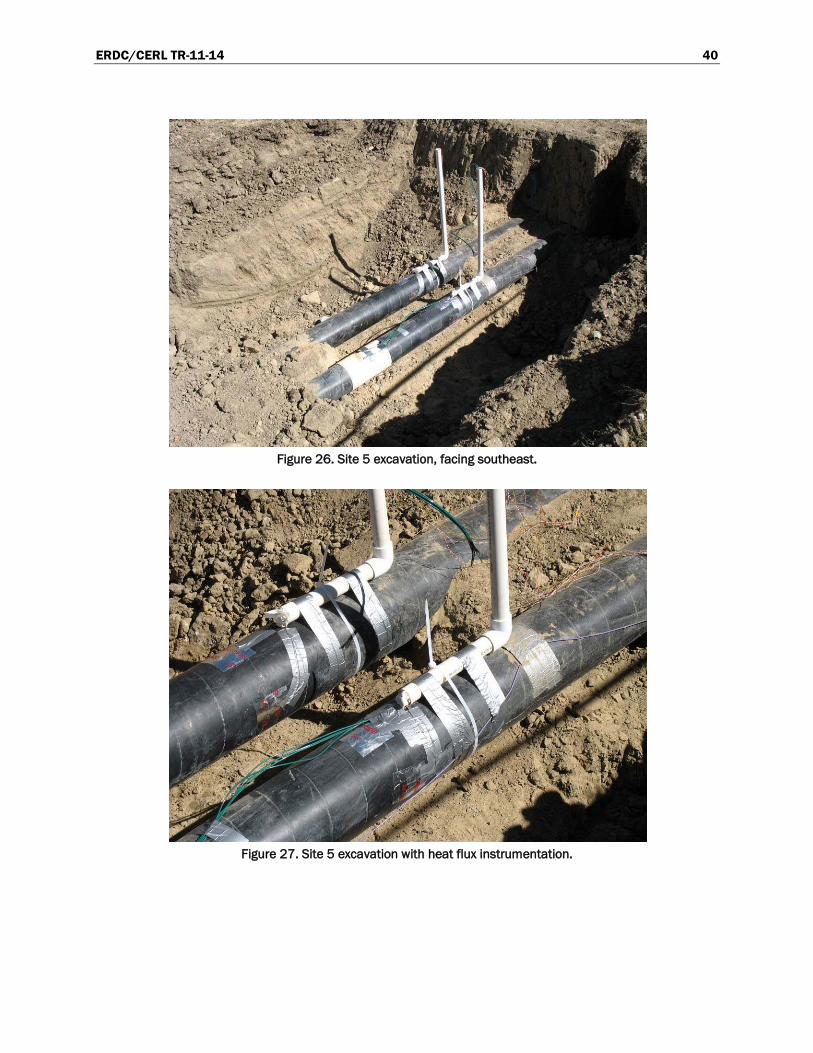
Carson site 6 data (elbow inspection)
A schematic diagram of site 6 is shown in Figure 28.
Figure 28. Excavation site 6 schematic.
1. Site Location: South Loop. North of Bldg. 2457, approx. mid –way be-tween MH-39 and MH-40. Vanguard ICT as-built Ref. Sheet No. M-16.
2. Conduit Size: Supply (East) – 34.25” Circ. (10.9” Dia.); 3” HTWS per Ref. Sheet No. M-16; Return (West) – 34.25” Circ. (10.9” Dia.); 3” HTWS per Ref. Sheet No. M-16. Note: Outer casing measurements agree with Thermacor “Duo-Therm 505” specifications for 3” HTW carrier.
3. Conduit Temperature: Supply and Return – Slightly warm to touch when first exposed, temperature dropped quickly to ambient after ex-posure.
4. Outer Jacket Condition: Supply - Good; Return – Good.
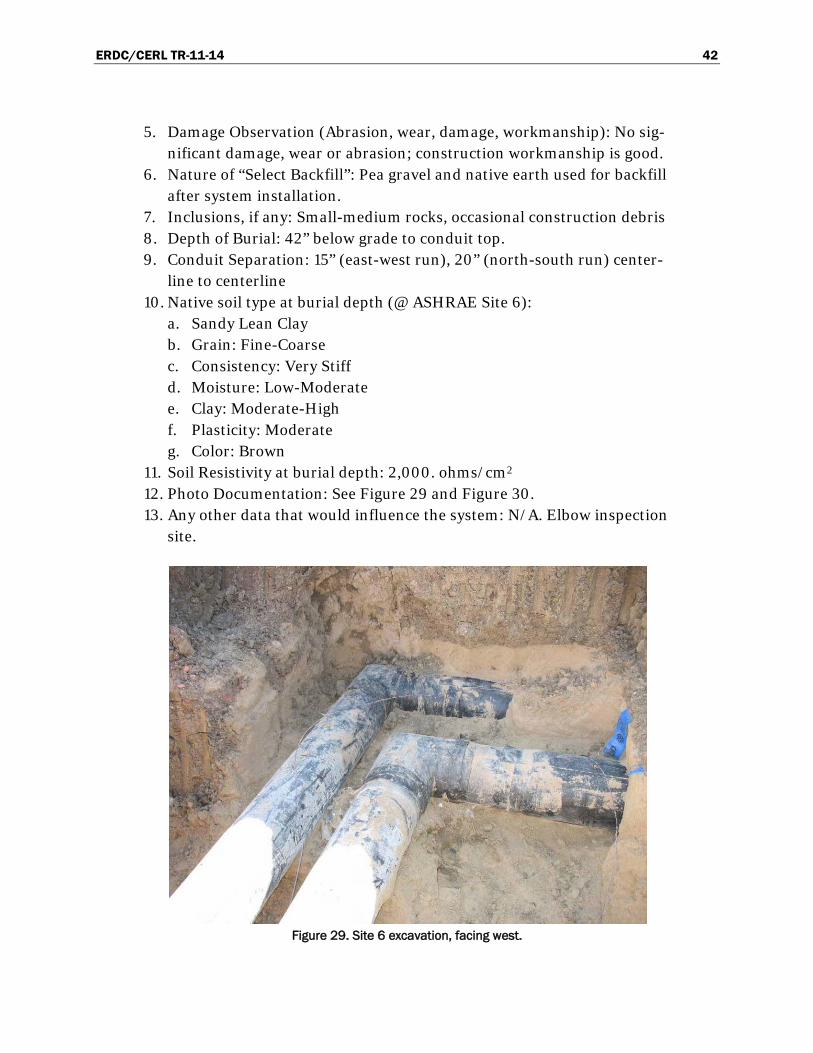
ERDC/CERL TR-11-14 42
5. Damage Observation (Abrasion, wear, damage, workmanship): No sig-nificant damage, wear or abrasion; construction workmanship is good.
6. Nature of “Select Backfill”: Pea gravel and native earth used for backfill after system installation.
7. Inclusions, if any: Small-medium rocks, occasional construction debris 8. Depth of Burial: 42” below grade to conduit top. 9. Conduit Separation: 15” (east-west run), 20” (north-south run) center-
line to centerline 10. Native soil type at burial depth (@ ASHRAE Site 6):
a. Sandy Lean Clay b. Grain: Fine-Coarse c. Consistency: Very Stiff d. Moisture: Low-Moderate e. Clay: Moderate-High f. Plasticity: Moderate g. Color: Brown
11. Soil Resistivity at burial depth: 2,000. ohms/cm2 12. Photo Documentation: See Figure 29 and Figure 30. 13. Any other data that would influence the system: N/A. Elbow inspection
site.
Figure 29. Site 6 excavation, facing west.
ERDC/CERL TR-11-14 43
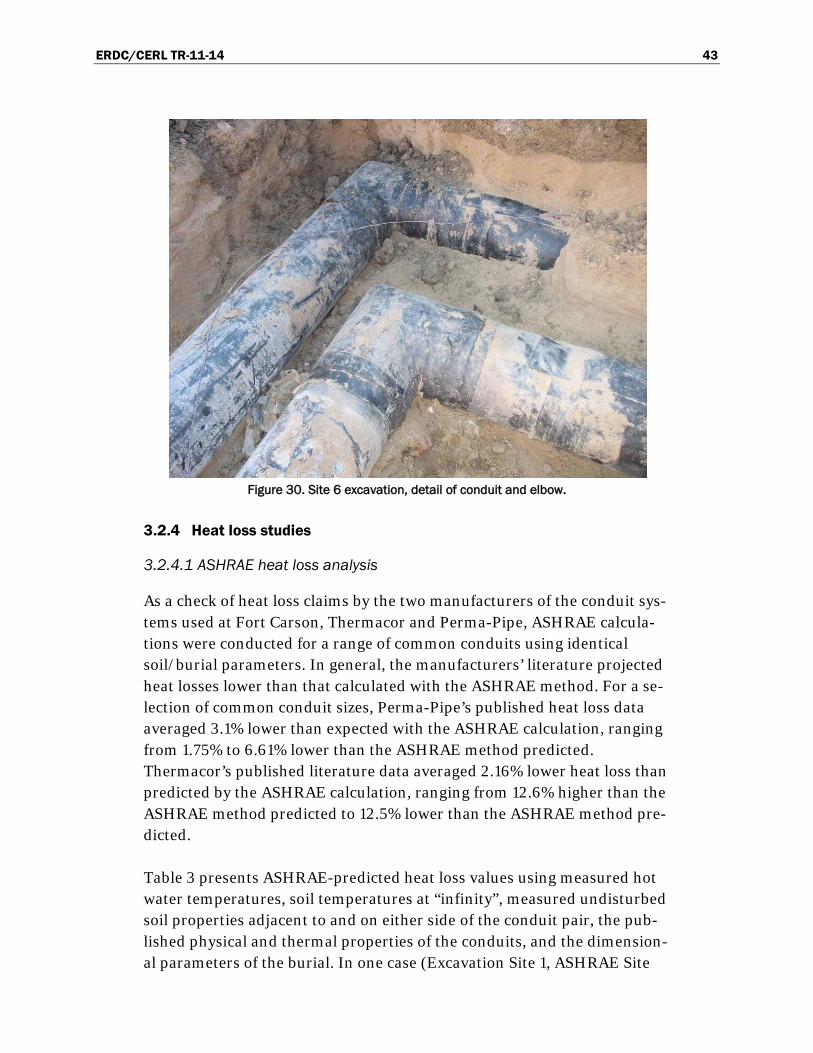
Figure 30. Site 6 excavation, detail of conduit and elbow.
3.2.4 Heat loss studies
3.2.4.1 ASHRAE heat loss analysis
As a check of heat loss claims by the two manufacturers of the conduit sys-tems used at Fort Carson, Thermacor and Perma-Pipe, ASHRAE calcula-tions were conducted for a range of common conduits using identical soil/burial parameters. In general, the manufacturers’ literature projected heat losses lower than that calculated with the ASHRAE method. For a se-lection of common conduit sizes, Perma-Pipe’s published heat loss data averaged 3.1% lower than expected with the ASHRAE calculation, ranging from 1.75% to 6.61% lower than the ASHRAE method predicted. Thermacor’s published literature data averaged 2.16% lower heat loss than predicted by the ASHRAE calculation, ranging from 12.6% higher than the ASHRAE method predicted to 12.5% lower than the ASHRAE method pre-dicted.
Table 3 presents ASHRAE-predicted heat loss values using measured hot water temperatures, soil temperatures at “infinity”, measured undisturbed soil properties adjacent to and on either side of the conduit pair, the pub-lished physical and thermal properties of the conduits, and the dimension-al parameters of the burial. In one case (Excavation Site 1, ASHRAE Site
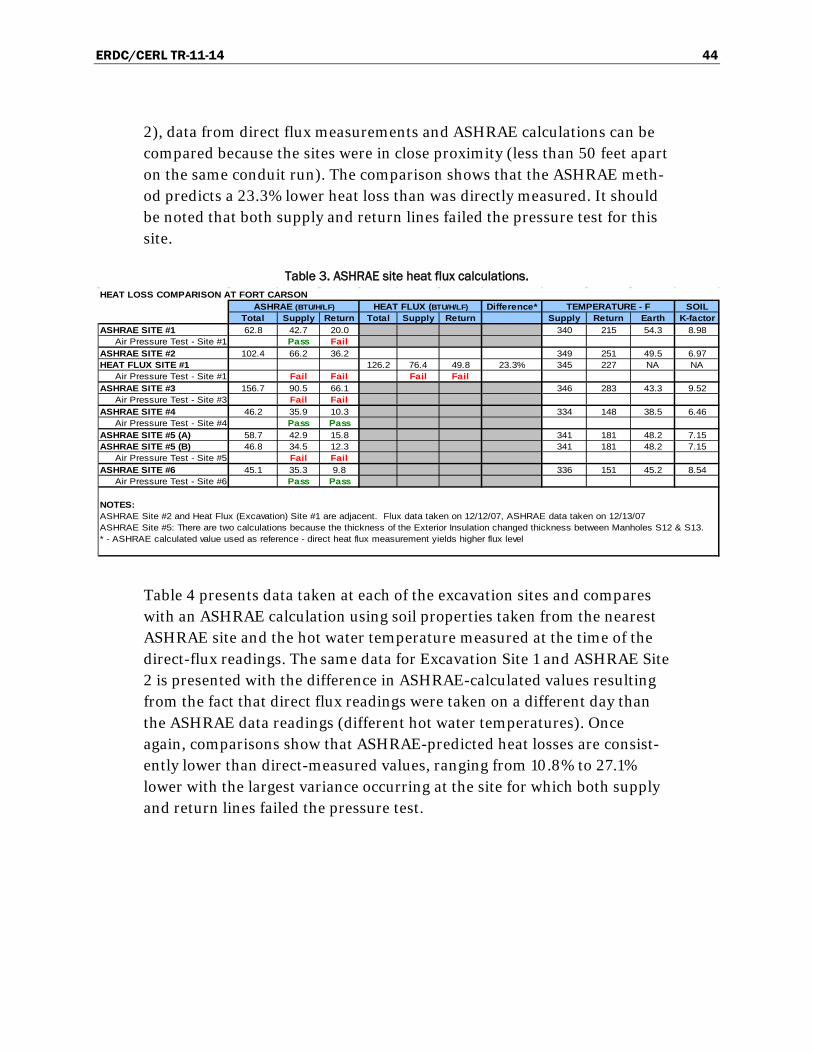
ERDC/CERL TR-11-14 44
2), data from direct flux measurements and ASHRAE calculations can be compared because the sites were in close proximity (less than 50 feet apart on the same conduit run). The comparison shows that the ASHRAE meth-od predicts a 23.3% lower heat loss than was directly measured. It should be noted that both supply and return lines failed the pressure test for this site.
Table 3. ASHRAE site heat flux calculations.
Table 4 presents data taken at each of the excavation sites and compares with an ASHRAE calculation using soil properties taken from the nearest ASHRAE site and the hot water temperature measured at the time of the direct-flux readings. The same data for Excavation Site 1 and ASHRAE Site 2 is presented with the difference in ASHRAE-calculated values resulting from the fact that direct flux readings were taken on a different day than the ASHRAE data readings (different hot water temperatures). Once again, comparisons show that ASHRAE-predicted heat losses are consist-ently lower than direct-measured values, ranging from 10.8% to 27.1% lower with the largest variance occurring at the site for which both supply and return lines failed the pressure test.
HEAT LOSS COMPARISON AT FORT CARSONDifference* SOIL
Total Supply Return Total Supply Return Supply Return Earth K-factorASHRAE SITE #1 62.8 42.7 20.0 340 215 54.3 8.98
Air Pressure Test - Site #1 Pass FailASHRAE SITE #2 102.4 66.2 36.2 349 251 49.5 6.97HEAT FLUX SITE #1 126.2 76.4 49.8 23.3% 345 227 NA NA
Air Pressure Test - Site #1 Fail Fail Fail FailASHRAE SITE #3 156.7 90.5 66.1 346 283 43.3 9.52
Air Pressure Test - Site #3 Fail FailASHRAE SITE #4 46.2 35.9 10.3 334 148 38.5 6.46
Air Pressure Test - Site #4 Pass PassASHRAE SITE #5 (A) 58.7 42.9 15.8 341 181 48.2 7.15ASHRAE SITE #5 (B) 46.8 34.5 12.3 341 181 48.2 7.15
Air Pressure Test - Site #5 Fail FailASHRAE SITE #6 45.1 35.3 9.8 336 151 45.2 8.54
Air Pressure Test - Site #6 Pass Pass
NOTES:ASHRAE Site #2 and Heat Flux (Excavation) Site #1 are adjacent. Flux data taken on 12/12/07, ASHRAE data taken on 12/13/07ASHRAE Site #5: There are two calculations because the thickness of the Exterior Insulation changed thickness between Manholes S12 & S13.* - ASHRAE calculated value used as reference - direct heat flux measurement yields higher flux level
ASHRAE (BTU/H/LF) HEAT FLUX (BTU/H/LF) TEMPERATURE - F
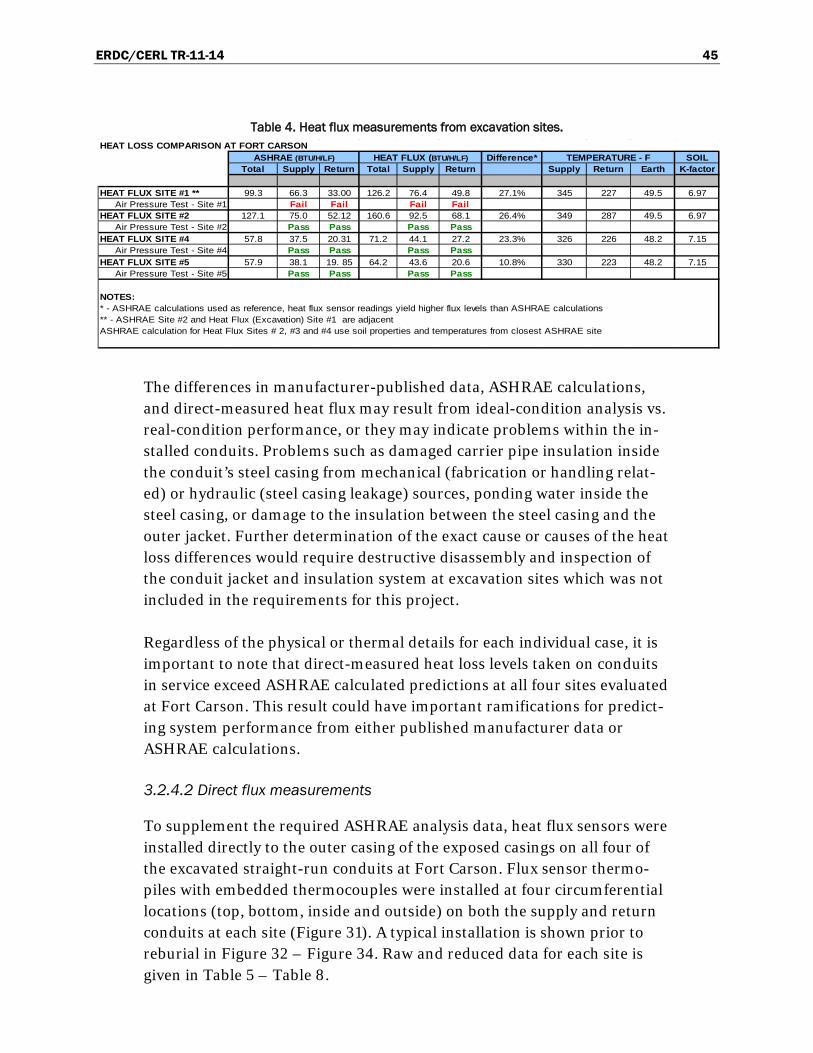
ERDC/CERL TR-11-14 45
Table 4. Heat flux measurements from excavation sites.
The differences in manufacturer-published data, ASHRAE calculations, and direct-measured heat flux may result from ideal-condition analysis vs. real-condition performance, or they may indicate problems within the in-stalled conduits. Problems such as damaged carrier pipe insulation inside the conduit’s steel casing from mechanical (fabrication or handling relat-ed) or hydraulic (steel casing leakage) sources, ponding water inside the steel casing, or damage to the insulation between the steel casing and the outer jacket. Further determination of the exact cause or causes of the heat loss differences would require destructive disassembly and inspection of the conduit jacket and insulation system at excavation sites which was not included in the requirements for this project.
Regardless of the physical or thermal details for each individual case, it is important to note that direct-measured heat loss levels taken on conduits in service exceed ASHRAE calculated predictions at all four sites evaluated at Fort Carson. This result could have important ramifications for predict-ing system performance from either published manufacturer data or ASHRAE calculations.
3.2.4.2 Direct flux measurements
To supplement the required ASHRAE analysis data, heat flux sensors were installed directly to the outer casing of the exposed casings on all four of the excavated straight-run conduits at Fort Carson. Flux sensor thermo-piles with embedded thermocouples were installed at four circumferential locations (top, bottom, inside and outside) on both the supply and return conduits at each site (Figure 31). A typical installation is shown prior to reburial in Figure 32 – Figure 34. Raw and reduced data for each site is given in Table 5 – Table 8.
HEAT LOSS COMPARISON AT FORT CARSONDifference* SOIL
Total Supply Return Total Supply Return Supply Return Earth K-factor
HEAT FLUX SITE #1 ** 99.3 66.3 33.00 126.2 76.4 49.8 27.1% 345 227 49.5 6.97Air Pressure Test - Site #1 Fail Fail Fail Fail
HEAT FLUX SITE #2 127.1 75.0 52.12 160.6 92.5 68.1 26.4% 349 287 49.5 6.97Air Pressure Test - Site #2 Pass Pass Pass Pass
HEAT FLUX SITE #4 57.8 37.5 20.31 71.2 44.1 27.2 23.3% 326 226 48.2 7.15Air Pressure Test - Site #4 Pass Pass Pass Pass
HEAT FLUX SITE #5 57.9 38.1 19. 85 64.2 43.6 20.6 10.8% 330 223 48.2 7.15Air Pressure Test - Site #5 Pass Pass Pass Pass
NOTES:* - ASHRAE calculations used as reference, heat flux sensor readings yield higher flux levels than ASHRAE calculations** - ASHRAE Site #2 and Heat Flux (Excavation) Site #1 are adjacentASHRAE calculation for Heat Flux Sites # 2, #3 and #4 use soil properties and temperatures from closest ASHRAE site
ASHRAE (BTU/H/LF) HEAT FLUX (BTU/H/LF) TEMPERATURE - F
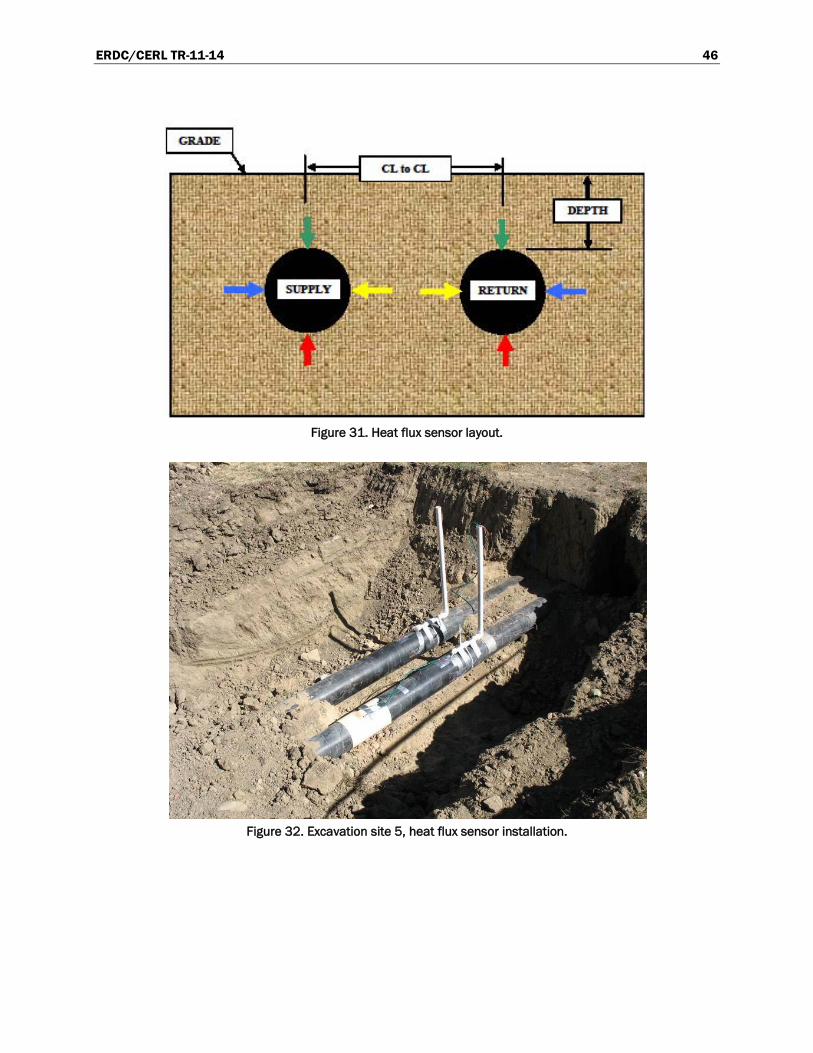
ERDC/CERL TR-11-14 46
Figure 31. Heat flux sensor layout.
Figure 32. Excavation site 5, heat flux sensor installation.
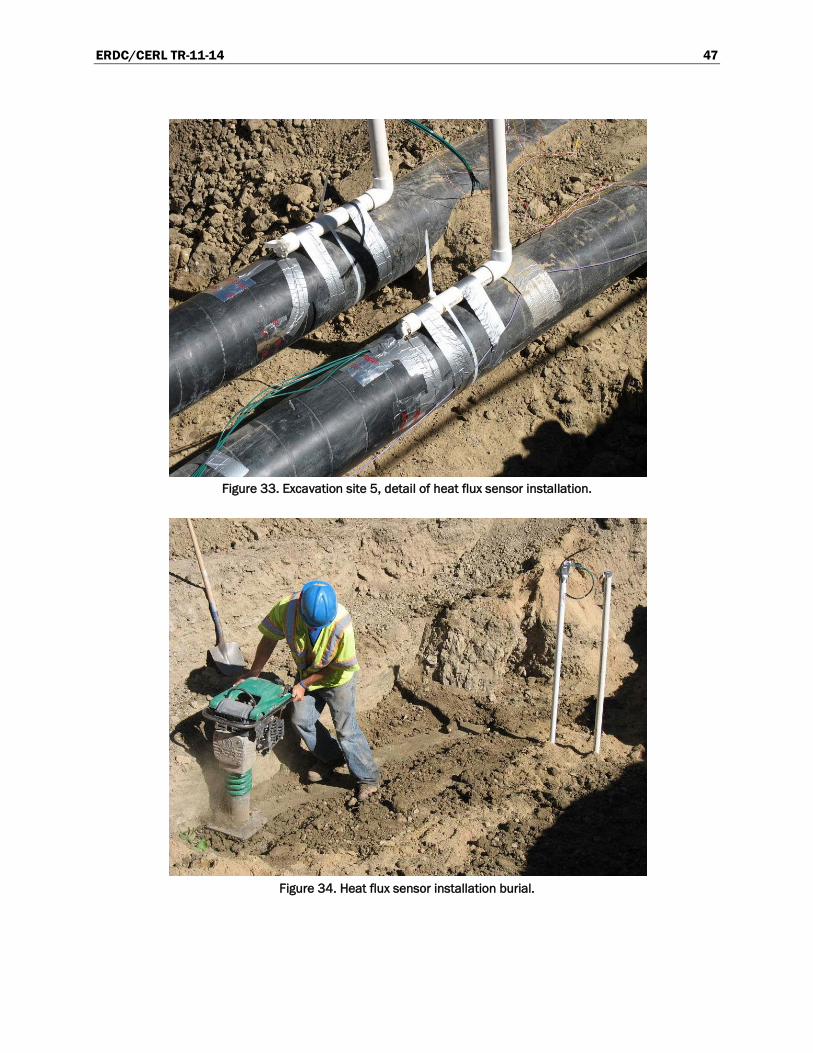
ERDC/CERL TR-11-14 47
Figure 33. Excavation site 5, detail of heat flux sensor installation.
Figure 34. Heat flux sensor installation burial.
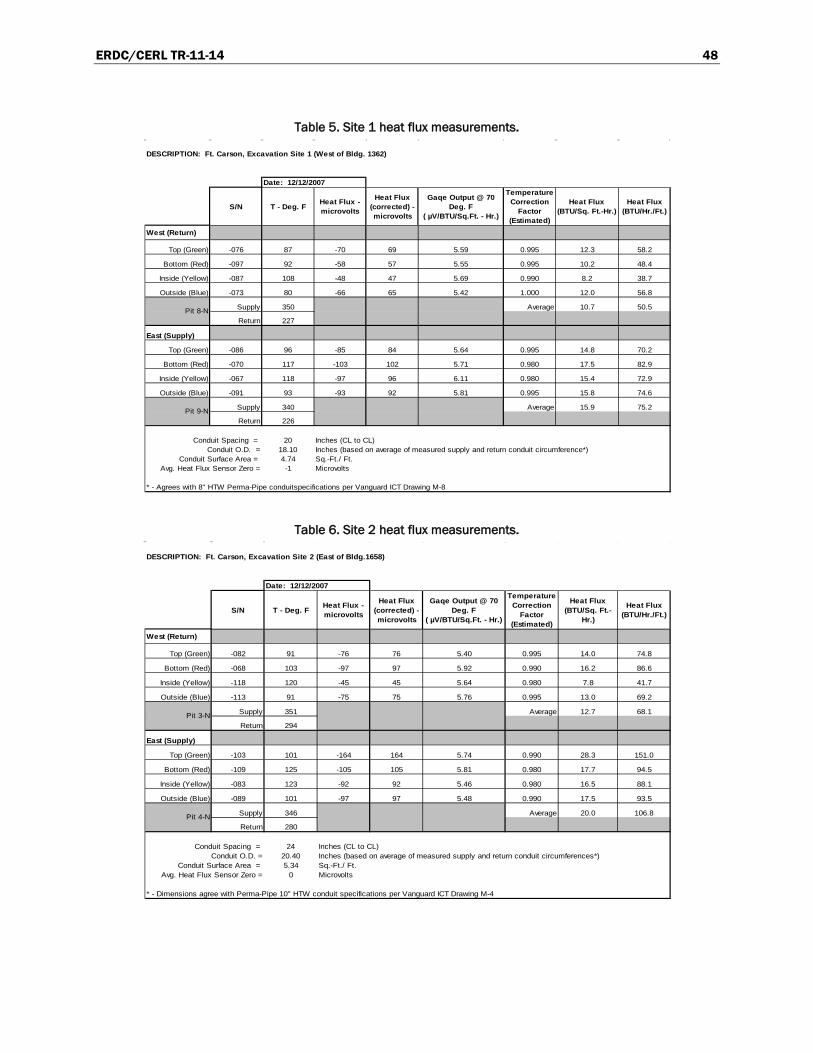
ERDC/CERL TR-11-14 48
Table 5. Site 1 heat flux measurements.
Table 6. Site 2 heat flux measurements.
DESCRIPTION: Ft. Carson, Excavation Site 1 (West of Bldg. 1362)
S/N T - Deg. F Heat Flux - microvolts
Heat Flux (corrected) - microvolts
Gaqe Output @ 70 Deg. F
( µV/BTU/Sq.Ft. - Hr.)
Temperature Correction
Factor (Estimated)
Heat Flux (BTU/Sq. Ft.-Hr.)
Heat Flux (BTU/Hr./Ft.)
West (Return)
Top (Green) -076 87 -70 69 5.59 0.995 12.3 58.2
Bottom (Red) -097 92 -58 57 5.55 0.995 10.2 48.4
Inside (Yellow) -087 108 -48 47 5.69 0.990 8.2 38.7
Outside (Blue) -073 80 -66 65 5.42 1.000 12.0 56.8
Supply 350 Average 10.7 50.5
Return 227
East (Supply)
Top (Green) -086 96 -85 84 5.64 0.995 14.8 70.2
Bottom (Red) -070 117 -103 102 5.71 0.980 17.5 82.9
Inside (Yellow) -067 118 -97 96 6.11 0.980 15.4 72.9
Outside (Blue) -091 93 -93 92 5.81 0.995 15.8 74.6
Supply 340 Average 15.9 75.2
Return 226
Conduit Spacing = 20 Inches (CL to CL) Conduit O.D. = 18.10 Inches (based on average of measured supply and return conduit circumference*)
Conduit Surface Area = 4.74 Sq.-Ft./ Ft.Avg. Heat Flux Sensor Zero = -1 Microvolts
* - Agrees with 8" HTW Perma-Pipe conduitspecifications per Vanguard ICT Drawing M-8
Date: 12/12/2007
Pit 8-N
Pit 9-N
DESCRIPTION: Ft. Carson, Excavation Site 2 (East of Bldg.1658)
S/N T - Deg. F Heat Flux - microvolts
Heat Flux (corrected) - microvolts
Gaqe Output @ 70 Deg. F
( µV/BTU/Sq.Ft. - Hr.)
Temperature Correction
Factor (Estimated)
Heat Flux (BTU/Sq. Ft.-
Hr.)
Heat Flux (BTU/Hr./Ft.)
West (Return)
Top (Green) -082 91 -76 76 5.40 0.995 14.0 74.8
Bottom (Red) -068 103 -97 97 5.92 0.990 16.2 86.6
Inside (Yellow) -118 120 -45 45 5.64 0.980 7.8 41.7
Outside (Blue) -113 91 -75 75 5.76 0.995 13.0 69.2
Supply 351 Average 12.7 68.1
Return 294
East (Supply)
Top (Green) -103 101 -164 164 5.74 0.990 28.3 151.0
Bottom (Red) -109 125 -105 105 5.81 0.980 17.7 94.5
Inside (Yellow) -083 123 -92 92 5.46 0.980 16.5 88.1
Outside (Blue) -089 101 -97 97 5.48 0.990 17.5 93.5
Supply 346 Average 20.0 106.8
Return 280
Conduit Spacing = 24 Inches (CL to CL)Conduit O.D. = 20.40 Inches (based on average of measured supply and return conduit circumferences*)
Conduit Surface Area = 5.34 Sq.-Ft./ Ft.Avg. Heat Flux Sensor Zero = 0 Microvolts
* - Dimensions agree with Perma-Pipe 10" HTW conduit specifications per Vanguard ICT Drawing M-4
Date: 12/12/2007
Pit 3-N
Pit 4-N
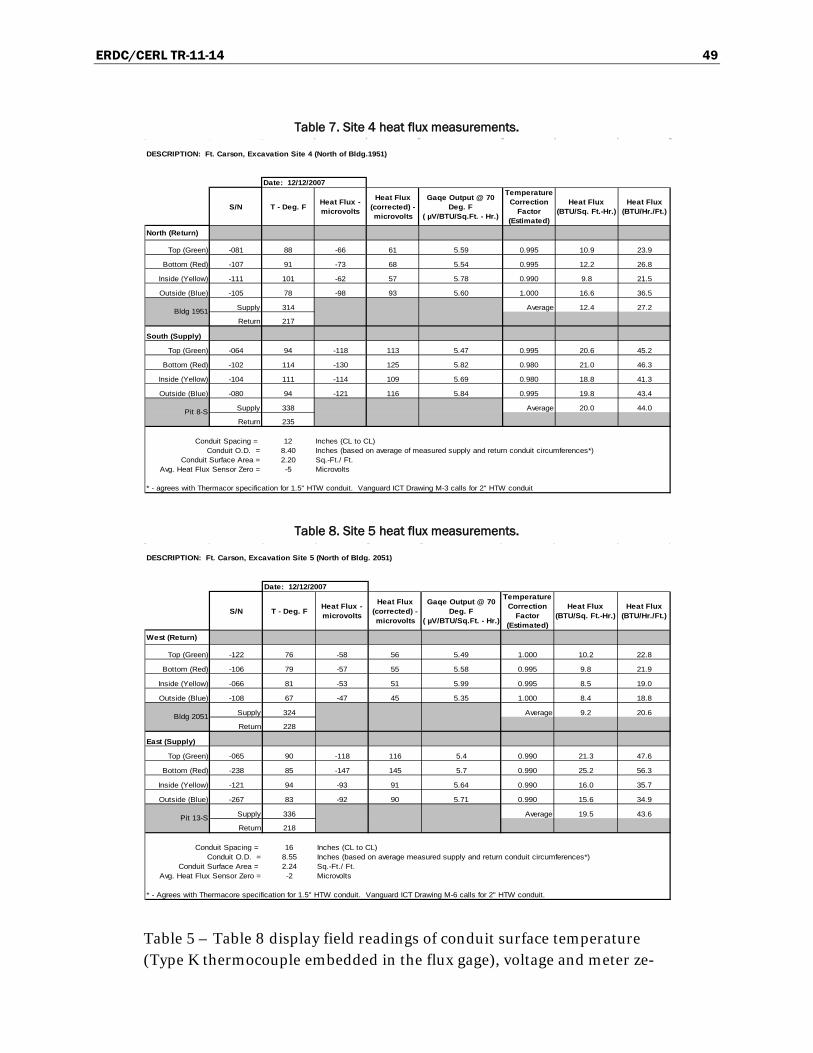
ERDC/CERL TR-11-14 49
Table 7. Site 4 heat flux measurements.
Table 8. Site 5 heat flux measurements.
Table 5 – Table 8 display field readings of conduit surface temperature (Type K thermocouple embedded in the flux gage), voltage and meter ze-
DESCRIPTION: Ft. Carson, Excavation Site 4 (North of Bldg.1951)
S/N T - Deg. F Heat Flux - microvolts
Heat Flux (corrected) - microvolts
Gaqe Output @ 70 Deg. F
( µV/BTU/Sq.Ft. - Hr.)
Temperature Correction
Factor (Estimated)
Heat Flux (BTU/Sq. Ft.-Hr.)
Heat Flux (BTU/Hr./Ft.)
North (Return)
Top (Green) -081 88 -66 61 5.59 0.995 10.9 23.9
Bottom (Red) -107 91 -73 68 5.54 0.995 12.2 26.8
Inside (Yellow) -111 101 -62 57 5.78 0.990 9.8 21.5
Outside (Blue) -105 78 -98 93 5.60 1.000 16.6 36.5
Supply 314 Average 12.4 27.2
Return 217
South (Supply)
Top (Green) -064 94 -118 113 5.47 0.995 20.6 45.2
Bottom (Red) -102 114 -130 125 5.82 0.980 21.0 46.3
Inside (Yellow) -104 111 -114 109 5.69 0.980 18.8 41.3
Outside (Blue) -080 94 -121 116 5.84 0.995 19.8 43.4
Supply 338 Average 20.0 44.0
Return 235
Conduit Spacing = 12 Inches (CL to CL)Conduit O.D. = 8.40 Inches (based on average of measured supply and return conduit circumferences*)
Conduit Surface Area = 2.20 Sq.-Ft./ Ft.Avg. Heat Flux Sensor Zero = -5 Microvolts
* - agrees with Thermacor specification for 1.5" HTW conduit. Vanguard ICT Drawing M-3 calls for 2" HTW conduit
Date: 12/12/2007
Bldg 1951
Pit 8-S
DESCRIPTION: Ft. Carson, Excavation Site 5 (North of Bldg. 2051)
S/N T - Deg. F Heat Flux - microvolts
Heat Flux (corrected) - microvolts
Gaqe Output @ 70 Deg. F
( µV/BTU/Sq.Ft. - Hr.)
Temperature Correction
Factor (Estimated)
Heat Flux (BTU/Sq. Ft.-Hr.)
Heat Flux (BTU/Hr./Ft.)
West (Return)
Top (Green) -122 76 -58 56 5.49 1.000 10.2 22.8
Bottom (Red) -106 79 -57 55 5.58 0.995 9.8 21.9
Inside (Yellow) -066 81 -53 51 5.99 0.995 8.5 19.0
Outside (Blue) -108 67 -47 45 5.35 1.000 8.4 18.8
Supply 324 Average 9.2 20.6
Return 228
East (Supply)
Top (Green) -065 90 -118 116 5.4 0.990 21.3 47.6
Bottom (Red) -238 85 -147 145 5.7 0.990 25.2 56.3
Inside (Yellow) -121 94 -93 91 5.64 0.990 16.0 35.7
Outside (Blue) -267 83 -92 90 5.71 0.990 15.6 34.9
Supply 336 Average 19.5 43.6
Return 218
Conduit Spacing = 16 Inches (CL to CL)Conduit O.D. = 8.55 Inches (based on average measured supply and return conduit circumferences*)
Conduit Surface Area = 2.24 Sq.-Ft./ Ft.Avg. Heat Flux Sensor Zero = -2 Microvolts
* - Agrees with Thermacore specification for 1.5" HTW conduit. Vanguard ICT Drawing M-6 calls for 2" HTW conduit.
Pit 13-S
Date: 12/12/2007
Bldg 2051
ERDC/CERL TR-11-14 50
ros on the left. Actual heat flux is computed using the flux sensor output corrected for zero offset and temperature with the gage sensitivity provid-ed for each unit. A typical sensor data sheet is included in Appendix E. Surface heat flux is further reduced to reflect the actual heat loss per foot of length for the specific conduit size in question (right column). The ex-ternal asymmetries and possible internal insulation variables of the actual installation are reflected in the variations in flux measured at the four lo-cations on the conduits. The heat loss values displayed are direct meas-urements of conduit performance as installed at the Fort Carson excava-tion sites. Comparison of these measurements with the ASHRAE analysis (end of next section) using actual soil properties and installation parame-ters at comparable sites provides better insight as to whether the hot water distribution system conduits are performing as expected.
Relative heat loss with respect to conduit size agrees with trends shown in the Thermacor literature shown in Appendix B (increased heat loss with increased conduit size for identical ambient conditions). Heat loss from the Supply is always greater than from the Return as expected since the Supply conduit operates with higher heating water temperatures. It is dif-ficult to predict heat flux trends with sensor position for such a complex, asymmetric installation configuration; however, one would expect that the sensor on the “inside” position of each conduit would read lower values than at the other three positions due to its proximity to the other conduit heat source. The data in Table 5 – Table 8 support that assumption.
3.2.5 Discussion of Fort Carson findings
The air pressurization test yielded failure rates of 45.3 % and 55.9% for the North and South Loops, respectively. These are very high rates of failure. The purpose of the annular air space, in part, is to assess construction quality and to afford early detection of leaks in the protective steel casing. If air can leak out of the annular air space, then ground water can seep into the annular air space and ruin the carrier pipe insulation. The annular air space makes this a Drainable-Dryable-Testable (DDT) system. Only the unburied portion of the system was visible and the only portion that could be inspected to determine what was causing the test air pressure leak. The causes of leaks that occurred underground could not be determined. The cause of most of the leaks discovered was leaking welds. The welds were typically not in difficult locations. A novice welder should have been able to make an acceptable weld at these locations. This raises the issue of whether or not this system was thoroughly pressure-tested as required
ERDC/CERL TR-11-14 51
during construction. Some of the leaks were so pronounced that the inves-tigators question whether the steel casing welds would have passed initial inspection with respect to pressure tests. In some manholes, the casing vent pipes had to be repaired or tightened before pressure tests could be performed.
A limited number of gland seals were found in the North Loop, but no gland seals were used in the South Loop. In every case where gland seals were used, the steel casing failed the air pressure test. When the gland seal tightening mechanism (nuts and bolts) were tightened to the maximum torque allowable, the gland seals leaked profusely. The Federal Agency Committee, now decommissioned, recognized this failure mode and took them out of the Federal Guide Specification for UHDS. The fact that they appeared in this project is considered a failure in this procurement proce-dure, and, a design error.
In order to facilitate field pressure tests, future pass/fail criteria could be based on a percentage pressure loss from the initial pressurization value rather than on an absolute value in order to produce uniform data evalua-tion (e.g., 5% for 1 hour or 10% for 2 hours). In general, it appears that one hour is a sufficient time period to collect pressure loss data using a datalogger set to read at one-minute intervals. Further, it should be noted that the approach defined by the current SOW does not account for vol-ume differences that result from varying segment lengths and conduit siz-es encountered in network construction. For instance, an identical defect in a short segment of a small conduit and in a long segment of a large con-duit can result in a “fail” determination for the former segment and a “pass” rating for the latter segment. For a completely uniform comparison of pneumatic integrity, segments should be evaluated on the basis of per-centage pressure loss for a specified time period normalized to a defined reference volume. It is understood that attempts to normalize by segment volume could significantly complicate the pressure drop evaluation, but evaluation based on percentage pressure drop for a reduced time period would standardize the pass/fail criteria and enhance the field measure-ment team’s productivity.
The procurement method for this system is reported to be a “Design-Build” type of contract. The high pressure-test failure rate suggests that there were severe problems with the Design Quality and with Construction Quality Control. To obtain a fair assessment of how the cost of this type of
ERDC/CERL TR-11-14 52
procurement compares to conventional types of procurement, the prob-lems that are delineated in this report should be corrected. The cost of cor-recting the problems should be added to the original Design-Build cost to determine the real cost of this procurement contract.
MEC made a concerted effort at Fort Carson to locate system maintenance manuals and original contract drawings/specifications to support this in-vestigation. Personnel from the base and the Base-Wide Maintenance Contractor (BWMC) were very helpful in this effort, but no such documen-tation for the UHDS installed at Fort Carson could be identified. Diligent use of a comprehensive maintenance manual is essential to perform effec-tive service on the system so that optimal performance is realized and ex-pensive premature failures are avoided. The manual typically defines the time intervals for leak checking, draining low points in the casing, running air pressure tests on the annular air space, and routine manhole mainte-nance procedures. Even though there apparently is no formal maintenance documentation for the Fort Carson system, it is evident that the Base Maintenance Contractor conducts somewhat random general inspections of the manholes (e.g., drain checks and water accumulation) and corrects obvious problems that are identified. However, more extensive scheduled diagnostic and maintenance programs such as pressure tests and drain checks are not in place. The present mode of operation is to correct prob-lems after they become evident. With this approach, serious and expensive damage has usually been done by the time the problem is detected. For in-stance, if leaks are not detected and corrected in a timely manner, ground water will quickly destroy the carrier pipe thermal insulation material and render it ineffective. However, if detected promptly, water can be drained and insulation can be dried before serious damage is incurred. The “Drainable-Dryable-Testable” design feature of this conduit design enables just such a remedial activity.
In the course of conducting this project, MEC found occasional problems such as standing water in manholes or broken vent/drain fittings. These problems were reported directly to the BWMC and were promptly correct-ed in every case.
In 1992 the Federal Government and the Conduit Manufacturers formed an ADHOC committee and met several times. The purpose was to come up with a list of what could be done to improve the overall performance and life of UHDS systems. The manufacturers agreed to write a Maintenance
ERDC/CERL TR-11-14 53
Manual and an Installation Manual. Today, much of what would be in an Installation Manual is put on the manufacturer’s drawings if the bid pro-cess does not force its deletion. Both of these two manuals would have been very useful in eliminating the problems that caused the high rate of failure delineated in this test report. As stated earlier, no manufacturer-authored Installation Manual or Maintenance Manual could be located for the Fort Carson UHDS.
Link seals are used to seal the manhole wall to the conduit. The purpose of the link seal is to prevent ground water from entering the manhole. These link seals performed so poorly that sand and soil was commonly passing through the seal and into the manholes at Fort Carson. In some manholes the floor drain was plugged with sand and silt. In some cases, the place-ment of the conduit was not in the center of the hole in the manhole wall resulting in large gaps. In some cases the hole in the manhole wall was too large and the link seal could not expand enough to seal. In many cases the link seal exerted enough inward radial pressure to crush the HDPE or FRP Jacket and underlying polyurethane insulation, allowing storm water, sand and silt to enter the manhole.
In a properly designed UHDS, manholes are located at elevation high points, low points, tees/ branches to connecting buildings and at building entrances. Failure to provide manholes at these critical points usually means that the system does not receive proper service. The Fort Carson system has a number of such sites. Consequently, these locations have gone un-serviced since construction. This is a design error.
The conduit anchor detail and the end plate detail are a nagging design di-lemma for a system that utilizes polymer elements. The polyurethane ex-ternal insulation and the FRP or HDPE outer jackets cannot withstand the high carrier pipe temperature of the UHDS. The anchor plate is welded to the carrier pipe and to the steel casing and then protrudes through the polyurethane external insulation and HDPE or FRP Jacket. The anchor plate is a relatively thick steel plate and, as such, is an excellent heat con-ductor. Consequently, the anchor plate temperature can approach that of the carrier pipe. The anchor plate temperature at the conduit jacket was not measured as part of this investigation. However, if high anchor plate temperatures are present, jacket material failure could be expected result-ing in underground leaks into the annulus between the steel casing and outer jacket. The casing end plate is also welded to the carrier pipe and can
ERDC/CERL TR-11-14 54
reach temperatures that can overheat and fail the polyurethane insulation as well as the HDPE or FRP jacket in the near-vicinity. This is a de-sign/materials issue that should be addressed by manufacturers in future conduit system designs.
When very dry, certain types of soils can become good thermal insulators. This means that, for UHDS conduits buried under these conditions, there will be relatively little temperature drop inside the conduit and that most of the temperature drop from carrier to ambient soil at “infinity” will occur outside the conduit in the earth. For this situation, the outer jacket can be almost as hot as the carrier pipe, say within 50 F°. This was not the case at Fort Carson because soil thermal conductivity was in mid-range, and measured HDPE/FRP jacket temperatures were moderately low. The con-duit insulation systems in the Fort Carson UHDS imposed high tempera-ture gradients from the carrier pipe to the jacket which protected the jack-et from overheating. This was verified by direct temperature measurements with thermocouples embedded in the buried thermal flux gages installed on the conduit jackets at the excavation sites as well as by direct “hands-on” inspection at these sites as the conduits were unearthed. Measured jacket temperatures on buried conduits at the excavation sites never exceeded 150 °F.
Most of the valve pit manholes at Fort Carson are of the raised type with screened openings in the vertical concrete manhole portion that is above grade. These are known as the “Demetroulis Manhole Top” per TM 3-430-01FA (formerly TM 5-810-17). This type of manhole has operable doors and a removable diamond-plate galvanized or stainless steel top. The manhole is a rectangular thick-walled concrete pit that extends 12 to 18 inches above grade with circumferential vent screens in the above-grade portion. The manhole is connected to the Base Industrial Waste System in some cases and in other cases used an electric sump pump that is located in a corner of the floor in a recessed sump about one foot square. The sumps at Fort Carson are open to any debris that accumulates on the manhole floor because there is no screen to keep the debris away from the pump inlet. However, because the vent screens are elevated in the vertical wall of the manhole, very little debris, other than sand and silt, accumu-lates in the manholes. There were several cases noted, however, where silt and sand had entered the pit and had plugged the floor drain. When these conditions were encountered, the MEC investigation team informed the base maintenance contractor who promptly corrected the problem. It ap-
ERDC/CERL TR-11-14 55
pears that there is no regular inspection schedule in place to identify and remove debris from the manholes to prevent plugging of the drains/sumps. Rather, such problems are discovered randomly by Fort Carson personnel on incidental manhole visits for other purposes. As stat-ed earlier, MEC personnel found that the base maintenance contractor re-sponse was excellent when such problems were discovered and reported. The problem exists because of the apparent lack of scheduled inspec-tion/maintenance requirements.
A second type of valve manhole is used less frequently at Fort Carson. The design uses concrete walls and floor with a flush-mounted concrete top fit-ted with an aluminum door described in Figure 3-24 of TM-5-810-17. This door is for a sump pump manhole, not a valve vault. These are hot, dark, congested, pits which are rated as OSHA “Permit-Required” manholes. As such, OSHA imposes highly restrictive access requirements including the need for air monitoring, ventilation and hoisting/safety equipment, addi-tional support personnel and reporting/documentation of the entry. This virtually assures that no maintenance will be done in these manholes un-less there are extraordinary circumstances. These manholes are connected to the Base Industrial Waste System in some cases and in other cases use an electric sump pump is located in a corner of the floor in recessed sump about one foot square. In some cases the electric sump pump was not working and the Base Maintenance Contractor had not been notified. In some instances the casing vents and drains from all of the enclosed con-duits were welded together so the casing annular air space could not be pressurized without major plumbing modifications. The presence of this type of valve manhole in a UHDS is a design error.
Measured heat loss was consistently higher than that predicted by the ASHRAE calculation method or by manufacturer performance claims. MEC is reasonably certain that the mineral wool insulation used by the manufacturers is the same as that used to gain approval by the now-dissolved Federal Agency Committee. MEC is less certain, however, of the thermal properties of the polyurethane insulation applied to the exterior of the steel casing. This insulation layer is installed at the manufacturer’s fab-rication plant and is subject to physical and thermal property variations. MEC is not aware of any test documentation that defines an average poly-urethane k-factor for use in performance prediction. It should also be not-ed that the ASHRAE method does not account for internal supports, an-chor plates and end plates. All of these features result in actual heat losses
ERDC/CERL TR-11-14 56
that are higher than for the ideal system simulated by ASHRAE calcula-tions. In light of the rapidly escalating costs of energy, MEC believes it is essential to establish and use a “safety factor” based on actual field meas-urements to increase calculated ASHRAE heat losses for more accurate prediction of anticipated UHDS thermal performance and associated op-erating expenses.
The high rate of pressure test failures (45.7% in Phase I and 42.9% in Phase II) coupled with inspection of the physical installation quality strongly suggests that poor quality control and quality assurance (QC/QA) was exercised during the assembly and installation of the system.
There is some concern that additional intermediate low points between the pits and the buildings may exist in the buried conduit network. These po-tential low points cannot be easily detected but, if present, prevent a defin-itive determination of water presence in the casings. The MEC inspection team’s concern arises from a lack of confidence in the integrity of the orig-inal engineering system design with respect to proper elevation require-ments aggravated by lax construction/installation practices. It should be further noted that, in many cases, manhole-to-manhole and manhole-to-building spacing at Fort Stewart does not conform to government specifi-cation guidance requiring runs less than 500 feet. This is a clear design fault. Standard government guidance calls for valve pits to be located at all high points and low points in the conduit network.
Ideally, a comprehensive campaign to identify and correct the leak sources should be undertaken; however, such and effort may prove to be prohibi-tively time-consuming and expensive.
It is also recommended for future pressure testing that the pass/fail crite-rion be based on a percentage pressure loss from the initial pressurization value to produce uniform data evaluation rather than on an absolute value. Future installation contracts should include comprehensive provisions for compliance with published design standards and construction quality con-trol and assurance.
In addition, the use of electronic pressure transducers monitored by au-tomatic multi-channel dataloggers set for frequent sampling cycles (e.g., one minute intervals for each channel) provide a highly accurate record of pressure loss. If such equipment is used for future testing, it is recom-
ERDC/CERL TR-11-14 57
mended that the monitoring period be reduced along with a corresponding reduced pressure drop criteria (for instance, 5% allowable drop for one-hour). Such requirements would significantly facilitate measurements and enhance investigator effectiveness.
Additionally, in order to conform to government specifications regarding manhole-to-manhole and manhole-to-building spacing, and to meet standard government guidance requiring valve pits at all high points and low points, such points should be identified at Fort Stewart and new pits installed at these locations.
It is recommended that, in addition to rigorous testing during construc-tion, a “Final 15 psi Casing Pressure Test” be performed on every new UHDS with an annular air space. This test should be completed approxi-mately 10 days before the end of the warranty period which would normal-ly be near the end of one year of operation. This will encourage the con-struction contractor to fabricate the casing vents and drains so that they are easily accessible for testing after installation is complete. By the time the “final” test is conducted, the UHDS will have experienced at least one thermal cycle which will exercise any welds on the casing and demonstrate if the conduit was installed in a manner that allowed ample linear expan-sion. Marginal or poor casing welds are likely to have failed during this pe-riod of operation and will be exposed by the test. If the contractor is aware of this final test requirement, construction quality is likely to be consider-ably better than that observed in this report.
3.3 Fort Stewart results
3.3.1 Air pressure test results
The Fort Stewart pressurization tests were performed under the same as-sumptions and constraints as reported previously for the Fort Carson tests (see section 3.2.1). The air pressurization tests yielded failure rates of 45.7% for the South Loop (Phase I) and 42.9% for the North Loop (Phase II), both of which represent very high rates of failure.
The causes of pressure leaks that occurred under unexcavated ground could not be determined. However, where joints and sections were exca-vated for purposes of visual inspection, the cause of most leaks was deter-mined to be porous welds. The observed faulty welds were typically not in difficult locations, so no advanced skills would have been required to make
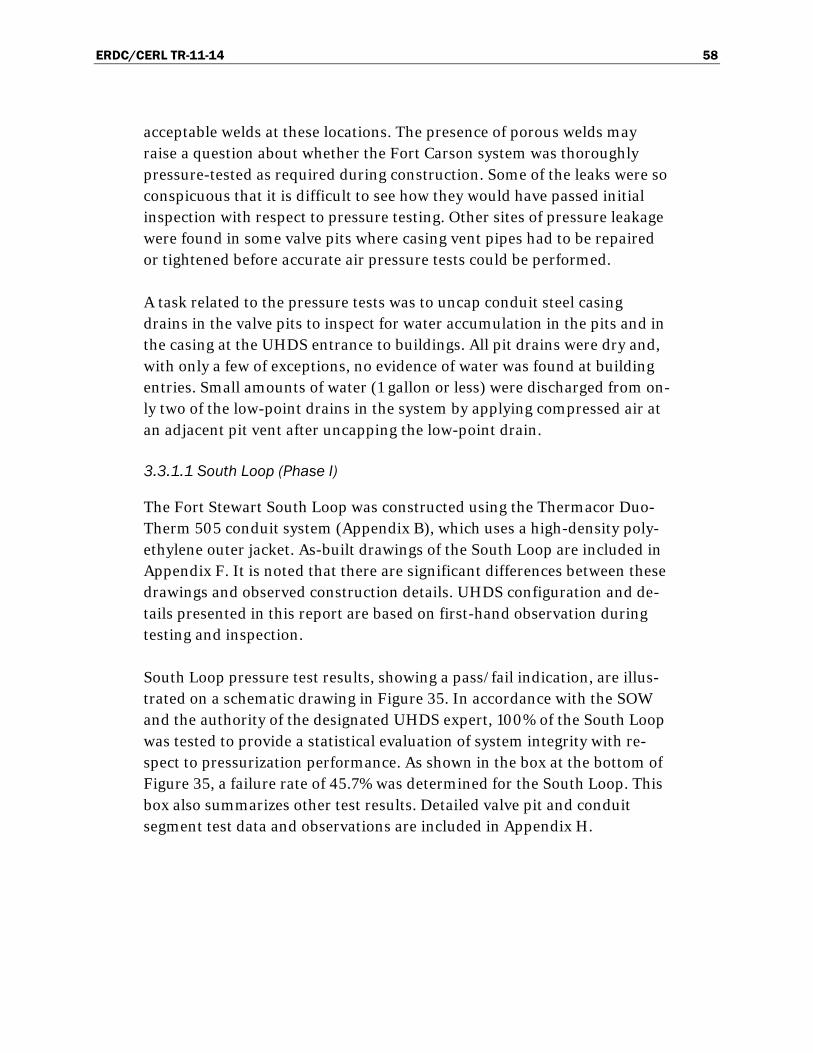
ERDC/CERL TR-11-14 58
acceptable welds at these locations. The presence of porous welds may raise a question about whether the Fort Carson system was thoroughly pressure-tested as required during construction. Some of the leaks were so conspicuous that it is difficult to see how they would have passed initial inspection with respect to pressure testing. Other sites of pressure leakage were found in some valve pits where casing vent pipes had to be repaired or tightened before accurate air pressure tests could be performed.
A task related to the pressure tests was to uncap conduit steel casing drains in the valve pits to inspect for water accumulation in the pits and in the casing at the UHDS entrance to buildings. All pit drains were dry and, with only a few of exceptions, no evidence of water was found at building entries. Small amounts of water (1 gallon or less) were discharged from on-ly two of the low-point drains in the system by applying compressed air at an adjacent pit vent after uncapping the low-point drain.
3.3.1.1 South Loop (Phase I)
The Fort Stewart South Loop was constructed using the Thermacor Duo-Therm 505 conduit system (Appendix B), which uses a high-density poly-ethylene outer jacket. As-built drawings of the South Loop are included in Appendix F. It is noted that there are significant differences between these drawings and observed construction details. UHDS configuration and de-tails presented in this report are based on first-hand observation during testing and inspection.
South Loop pressure test results, showing a pass/fail indication, are illus-trated on a schematic drawing in Figure 35. In accordance with the SOW and the authority of the designated UHDS expert, 100% of the South Loop was tested to provide a statistical evaluation of system integrity with re-spect to pressurization performance. As shown in the box at the bottom of Figure 35, a failure rate of 45.7% was determined for the South Loop. This box also summarizes other test results. Detailed valve pit and conduit segment test data and observations are included in Appendix H.
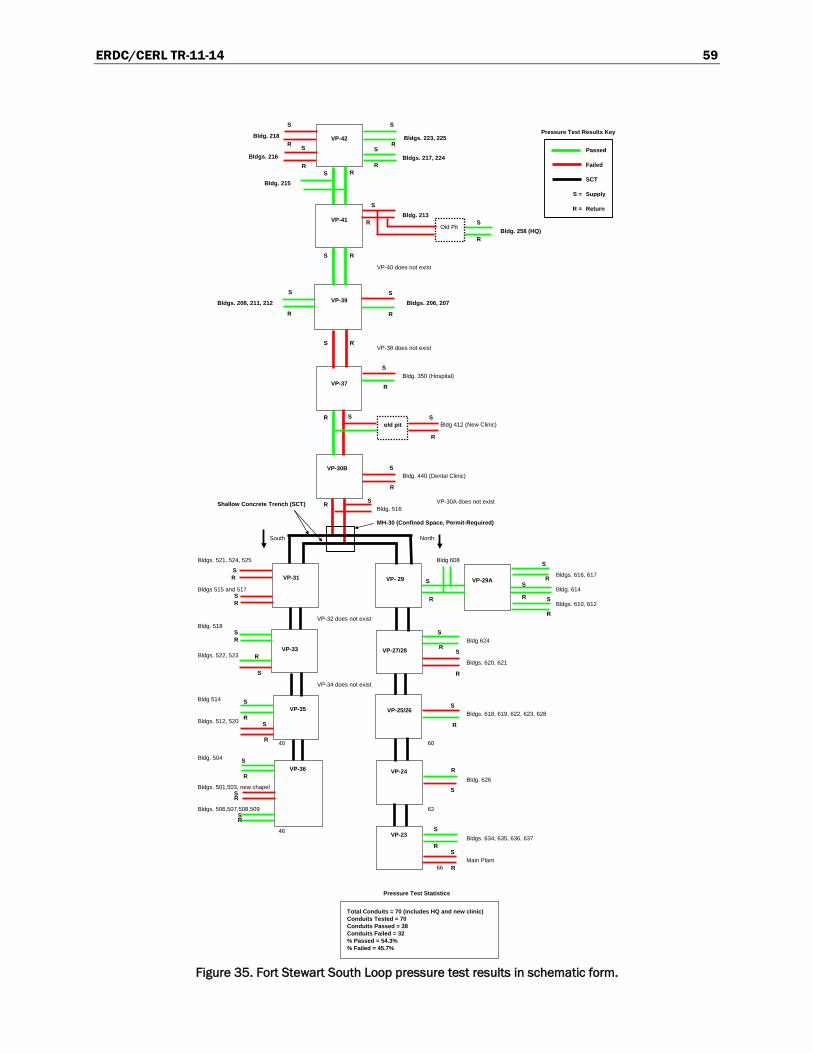
ERDC/CERL TR-11-14 59
Figure 35. Fort Stewart South Loop pressure test results in schematic form.
Passed
Failed
SCT
S = Supply
R = Return
VP-40 does not exist
VP-38 does not exist
VP-30A does not exist
Bldg. 516
South North
Bldgs. 521, 524, 525 Bldg 608
Bldgs. 616, 617
Bldgs 515 and 517 Bldg. 614
Bldgs. 610, 612
VP-32 does not existBldg. 518
Bldg 624
Bldgs. 522, 523Bldgs. 620, 621
VP-34 does not exist
Bldg 514 Bldgs. 618, 619, 622, 623, 628
Bldgs. 512, 520
40 60
Bldg. 504
Bldg. 626Bldgs. 501,503, new chapel
Bldgs. 506,507,508,509 62
46Bldgs. 634, 635, 636, 637
Main Plant 66
Total Conduits = 70 (includes HQ and new clinic)
Conduits Tested = 70Conduits Passed = 38Conduits Failed = 32% Passed = 54.3% % Failed = 45.7%
VP-42
VP-41
VP-39
VP-37Bldg. 350 (Hospital)
VP-30B
Bldgs. 206, 207Bldgs. 208, 211, 212
Bldg. 213
Bldg. 215
Bldg. 218 Bldgs. 223, 225
Bldgs. 217, 224Bldgs. 216
Bldg 412 (New Clinic)
Bldg. 440 (Dental Clinic)
VP-31 VP- 29
VP-33
Bldg. 258 (HQ)
Shallow Concrete Trench (SCT)
VP-35
VP-36
VP-29A
VP-27/28
VP-25/26
VP-24
VP-23
Old Pit
old pit
MH-30 (Confined Space, Permit-Required)
Pressure Test Results Key
Pressure Test Statistics
S
S
S
S
S
S
S
S
SS
S
S
SS
S
S
S
S
S
S
S
S
S
S
S
S
S
S
S
S
S
S
S
S
S
R
R
R
RR
R
R
R
RR
R
R
R
R
R
R
R
R
R
R
R
R
R
R
R
R
R
R
R
R
R
R
R
R
R
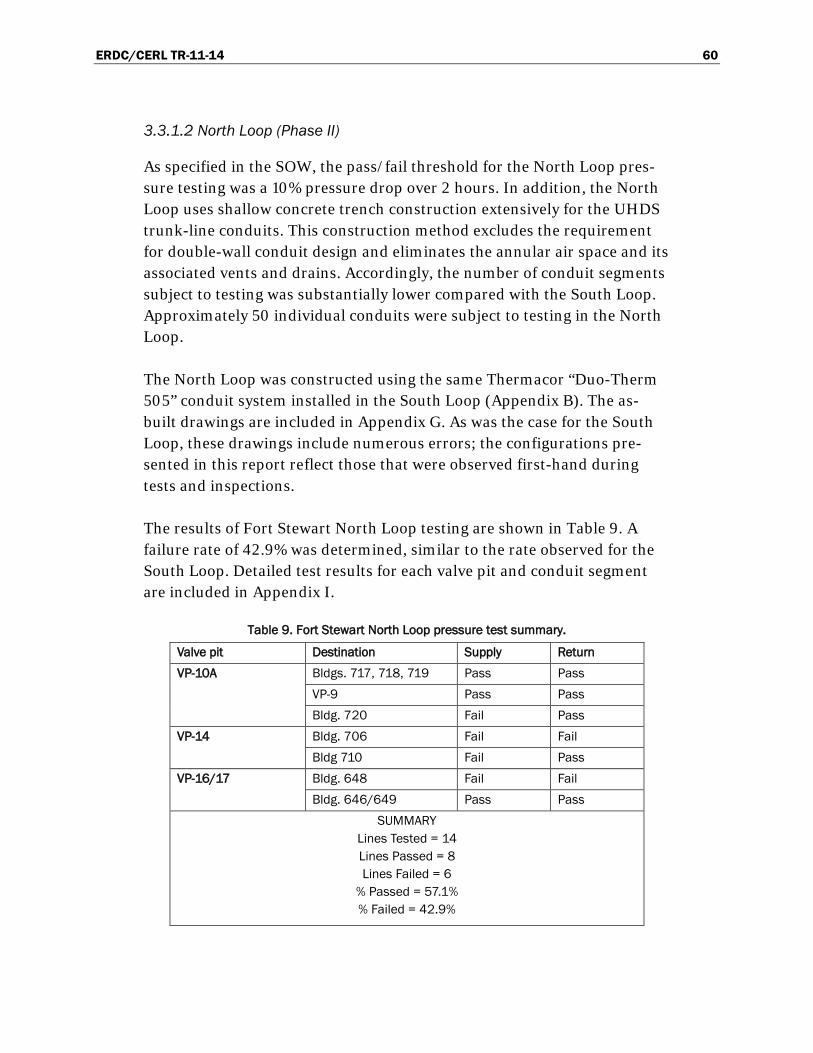
ERDC/CERL TR-11-14 60
3.3.1.2 North Loop (Phase II)
As specified in the SOW, the pass/fail threshold for the North Loop pres-sure testing was a 10% pressure drop over 2 hours. In addition, the North Loop uses shallow concrete trench construction extensively for the UHDS trunk-line conduits. This construction method excludes the requirement for double-wall conduit design and eliminates the annular air space and its associated vents and drains. Accordingly, the number of conduit segments subject to testing was substantially lower compared with the South Loop. Approximately 50 individual conduits were subject to testing in the North Loop.
The North Loop was constructed using the same Thermacor “Duo-Therm 505” conduit system installed in the South Loop (Appendix B). The as-built drawings are included in Appendix G. As was the case for the South Loop, these drawings include numerous errors; the configurations pre-sented in this report reflect those that were observed first-hand during tests and inspections.
The results of Fort Stewart North Loop testing are shown in Table 9. A failure rate of 42.9% was determined, similar to the rate observed for the South Loop. Detailed test results for each valve pit and conduit segment are included in Appendix I.
Table 9. Fort Stewart North Loop pressure test summary.
Valve pit Destination Supply Return VP-10A Bldgs. 717, 718, 719 Pass Pass
VP-9 Pass Pass Bldg. 720 Fail Pass
VP-14 Bldg. 706 Fail Fail Bldg 710 Fail Pass
VP-16/17 Bldg. 648 Fail Fail Bldg. 646/649 Pass Pass
SUMMARY Lines Tested = 14 Lines Passed = 8 Lines Failed = 6
% Passed = 57.1% % Failed = 42.9%
ERDC/CERL TR-11-14 61
3.3.2 CIS and soil resistivity test results
As noted previously, a comprehensive CIS was conducted at Fort Stewart, and soil resistivity measurements were taken at selected sites using either the Wenner four-pin or soil box techniques. CIS, Wenner four-pin, and soil box results are summarized in Table 10, Table 11, and Table 12. De-tailed CIS measurement data are presented in Appendix J.
Table 10. Fort Stewart close interval survey test result summary.
Conduit Run Supply/ Return
Pressure Test
Minimum Potential (Neg. Volts)
Maximum Potential (Neg. Volts)
Average Potential (Neg. Volts)
Evaluation
PHASE I
VP-41 to VP-42 Supply Pass 0.060 0.480 0.296 Possible corrosion problem at VP-41/2+60
Return Pass No Test
VP-41 to VP-39 Supply Pass 0.210 0.340 0.292 No corrosion problem
Return Pass 0.250 0.360 0.302 No corrosion problem
VP-23 to Power Plant Supply Fail 0.100 0.490 0.406 Possible corrosion problem at VP-23/4+00
Return Fail 0.100 0.490 0.407 Possible corrosion problem at VP-23/4+00
VP-27/28 to Bldgs. 620/621 Supply Fail 0.020 0.370 0.210 Possible corrosion problem at VP-27/28
Return Fail No Test
Bldg 218 to VP-42 Supply Fail 0.260 0.450 0.404 No corrosion problem
Return Fail 0.260 0.450 0.396 No corrosion problem
0.339 phase I Average
PHASE II
VP-16/17 to Bldg. 648 Supply Pass No Test
Return Fail 0.020 0.310 0.272 Possible corrosion problem at VP-16/17
Bldg. 706 to VP-14 Supply Fail 0.350 0.380 0.363 No corrosion problem
Return Fail No Test
VP-16/17 to Bldgs. 646/649 Supply Pass 0.070 0.360 0.281 Possible corrosion problem at VP-16/17
ERDC/CERL TR-11-14 62
Conduit Run Supply/ Return
Pressure Test
Minimum Potential (Neg. Volts)
Maximum Potential (Neg. Volts)
Average Potential (Neg. Volts)
Evaluation
Return Pass 0.050 0.350 0.293 Possible corrosion problem at VP-16/17
0.302 phase II Average
Table 10 shows a number of conduit runs on which low voltage reading sites were identified. The project UHDS expert hypothesized that these problem sites may be related either to construction errors or to conduit anchor plates cast in concrete after being welded to the carrier pipe and steel casing. Another source could be electrical shorts to rebar in manhole pits or the close proximity of other buried lines or cables to the heating conduits. In the case of valve pit 23 to the power plant, there were several anchors. Also, another conduit of unknown origin and use was detected immediately below the UHDS supply line at the excavation site on this run, as shown in Figure 45. Finally, the area around the pit was frequently flooded by sump discharge at valve pit 23. Unless the specific sites are ex-cavated and inspected, the suspected causes must be considered to be speculations based on circumstantial evidence.
Table 11. Fort Stewart Wenner 4-pin test result summary.
Soil box Location Resistivity (ohms/cm2) Comments/evaluation
Excavation Site 1
Phase I. Grassy area bordered by Harmon Ave. (south), Lindquist Rd. (north) and Hase Rd. (west). Conduits run between VP-39 and VP-37. RS&H Drawing No. FS-2572, Sheet No. M-122.
131K Very low corrosive potential environment
Excavation Site 2
Phase I. SW corner of old valve pit just south of access road to Bldg. 350 at intersection of Niles Rd. and French Rd. (Niles/French Rd to west). Conduits run from VP-37 to Bldg. 350. RS&H Drawing No. FS-2572, Sheet No. M-124.
165K Elbow inspection site / very low corrosive potential environment
Excavation Site 3
Phase I. Grass median between parking lots on East side of Wilson Ave. across from main energy plant, between Wilson Ave. and VP-23A with Bldg 636 to East. Conduits run from main heat plant to VP-23A. RS&H Drawing No. FS-2572, Sheet No. M-116.
150K Very Low Corrosive Potential Environment
Excavation Site 4
Phase II. Grassy area to south of Bldg. 648, east of Bldg. 649 and north of Bldg. 646. South of Divarty Rd. Conduits run from VP-16,17 to Bldg. 646. RS&H Drawing No. FS-2572, Sheet No. M-114.
56K Low Corrosive Potential Environment
ERDC/CERL TR-11-14 63
Table 12. Fort Stewart soil box test result summary.
Wenner 4-pin Location Resistivity (ohms/cm2)
Comments/evaluation
ASHRAE / Excavation Site 1
50 ' East of Excavation Site 1
5' 88K Low Corrosion Potential Environment
10' 94K Low Corrosion Potential Environment
ASHRAE Site 2 Grassy Area West of Parking Lot Located West of Bldg. 412, Just South of Wurzburg Rd.
5' 83K Low Corrosion Potential Environment
10' 90K Low Corrosion Potential Environment
ASHRAE / Excavation Site 3
Narrow Grassy Strip Between Wilson Ave. and VP-23, 300' West of VP-23
5' 41K Moderate Corrosion Potential Environment
10' 50K Moderate-Low Corrosion Potential Environment
ASHRAE / Excavation Site 4 (Phase II)
Grassy Area Bounded by Bldg. 648 To North, Bldg.649 to West and Bldg 6456 to South. 50' to East of Excavation
5' 58K Low Corrosion Potential Environment
10' 64K Low Corrosion Potential Environment
3.3.3 Visual inspection excavations
3.3.3.1 South Loop (Phase I) excavations
Three sites were selected for excavation of the UHDS for inspection and evaluation. The excavations consist of two straight-run locations and one 90-degree elbow.
ERDC/CERL TR-11-14 64
Stewart site 1 data
1. Site Location: Phase I. Grassy area bordered by Harmon Ave. (south), Lindquist Rd. (north) and Hase Rd. (west). Conduits run between VP-39 and VP-37. RS&H Drawing No. FS-2572, Sheet No. M-122.
2. Conduit Size: Supply (West) - 48” Circ. (15.3” Dia.); 6” HTWS per Sheet No. M-122; Return (East) - 48” Circ. (15.3” Dia.); 6” HTWS per Sheet No. M-122
3. Conduit Temperature: Supply and Return – Slightly warm to touch when first exposed, temperature dropped quickly to ambient after ex-posure.
4. Outer Jacket Condition: Supply – Good; Return – Good 5. Damage Observation (Abrasion, wear, damage, workmanship): No sig-
nificant damage, wear or abrasion; construction workmanship is good. 6. Nature of “Select Backfill”: Native earth used for backfill after system
installation. The native soil is a fine sandy loam that is the ideal backfill for conduit type systems.
7. Inclusions, if any: Few small rocks, roots and construction debris. 8. Depth of Burial: 63” below grade to conduit top. 9. Conduit Separation: 54.5” centerline to centerline 10. Native soil type at burial depth: Black, sandy moist soil. Soil was very
workable with generally uniform consistency. 11. Soil Resistivity at burial depth: 131,000 ohms/cm2 12. Photo Documentation: See Figure 36 – Figure 40. 13. Any other data that would influence the system: Exterior HDPE spiral
wrapped exterior casing damaged during excavation. The outer spiral-wrapped HDPE casing of the 6” return line between VP-37 and VP-39 (between Harmon and Lindquist) was cut in one place. The tear was v-shaped, about 10” on each leg. The 1/2” (approximate) thick foam insu-lation under the cut was damaged, but the outer steel casing beneath the insulation was not damaged. It should be noted that this thin-walled outer steel casing serves as a groundwater-tight barrier to seal the enclosed hot water carrier pipe insulation system at the center of the conduit. The damaged foam insulation was replaced with commer-cial sprayed polyurethane foam and the “V” edges were sealed with Sil-icone sealant. Finally, a polymer shrink fit overlay patch supplied by the conduit manufacturer (THERMACOR) was installed to provide an overall seal. The repair was inspected and approved by the project UHDS conduit expert and the ERDC-CERL contracting officer’s tech-nical representative. Also, persistent groundwater was encountered re-
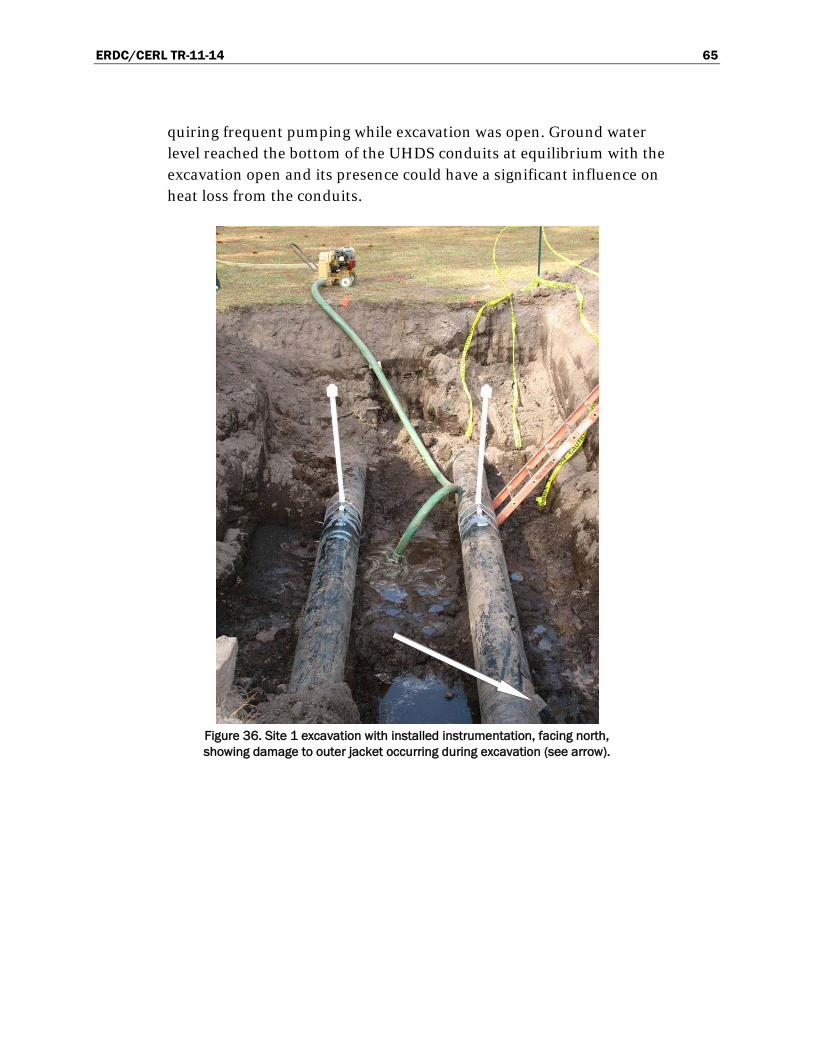
ERDC/CERL TR-11-14 65
quiring frequent pumping while excavation was open. Ground water level reached the bottom of the UHDS conduits at equilibrium with the excavation open and its presence could have a significant influence on heat loss from the conduits.
Figure 36. Site 1 excavation with installed instrumentation, facing north, showing damage to outer jacket occurring during excavation (see arrow).
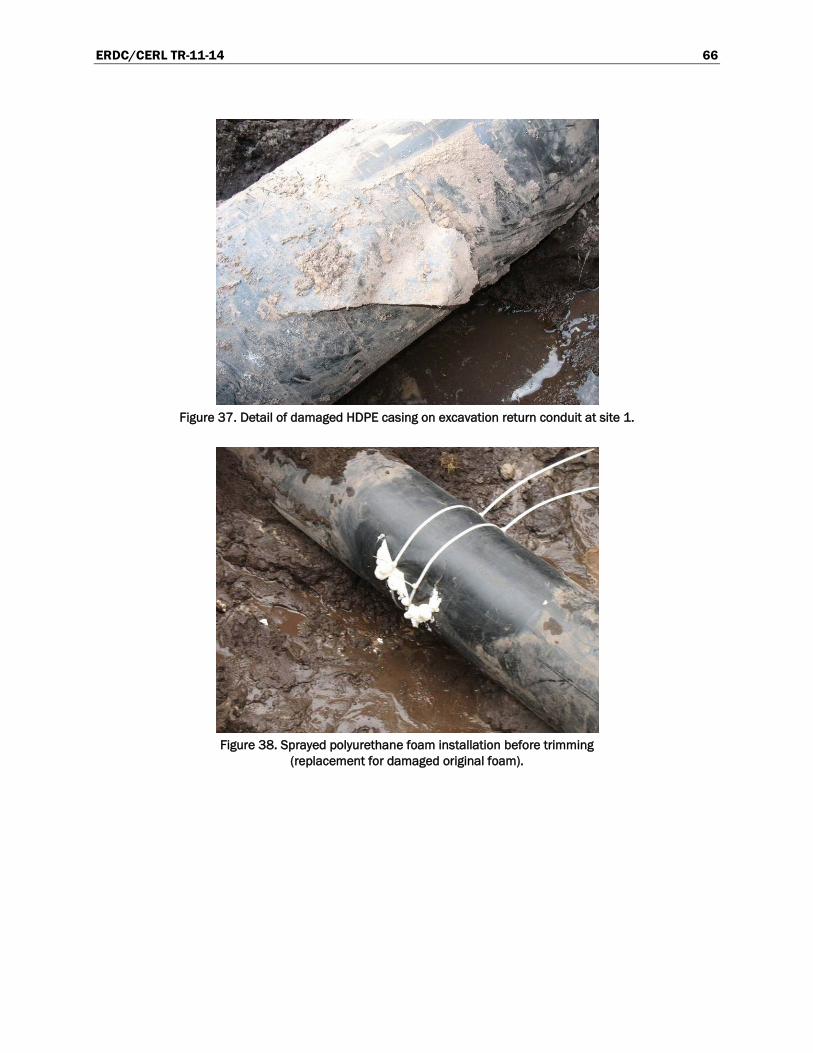
ERDC/CERL TR-11-14 66
Figure 37. Detail of damaged HDPE casing on excavation return conduit at site 1.
Figure 38. Sprayed polyurethane foam installation before trimming
(replacement for damaged original foam).
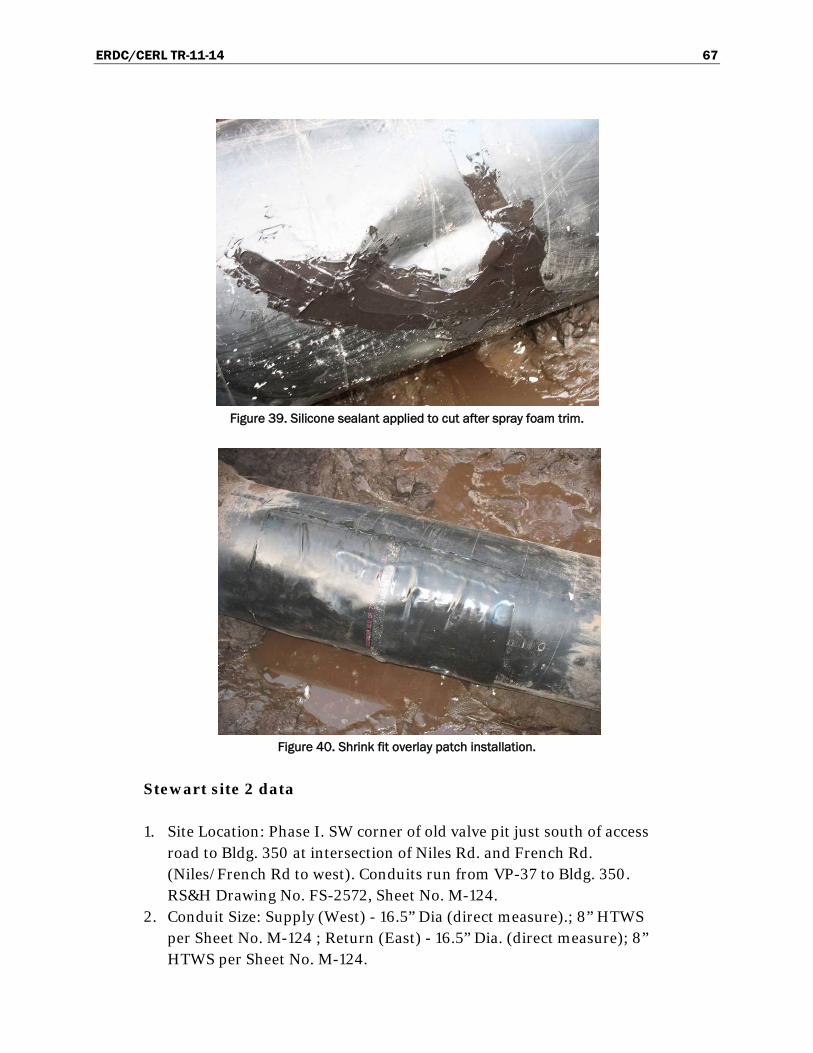
ERDC/CERL TR-11-14 67
Figure 39. Silicone sealant applied to cut after spray foam trim.
Figure 40. Shrink fit overlay patch installation.
Stewart site 2 data
1. Site Location: Phase I. SW corner of old valve pit just south of access road to Bldg. 350 at intersection of Niles Rd. and French Rd. (Niles/French Rd to west). Conduits run from VP-37 to Bldg. 350. RS&H Drawing No. FS-2572, Sheet No. M-124.
2. Conduit Size: Supply (West) - 16.5” Dia (direct measure).; 8” HTWS per Sheet No. M-124 ; Return (East) - 16.5” Dia. (direct measure); 8” HTWS per Sheet No. M-124.
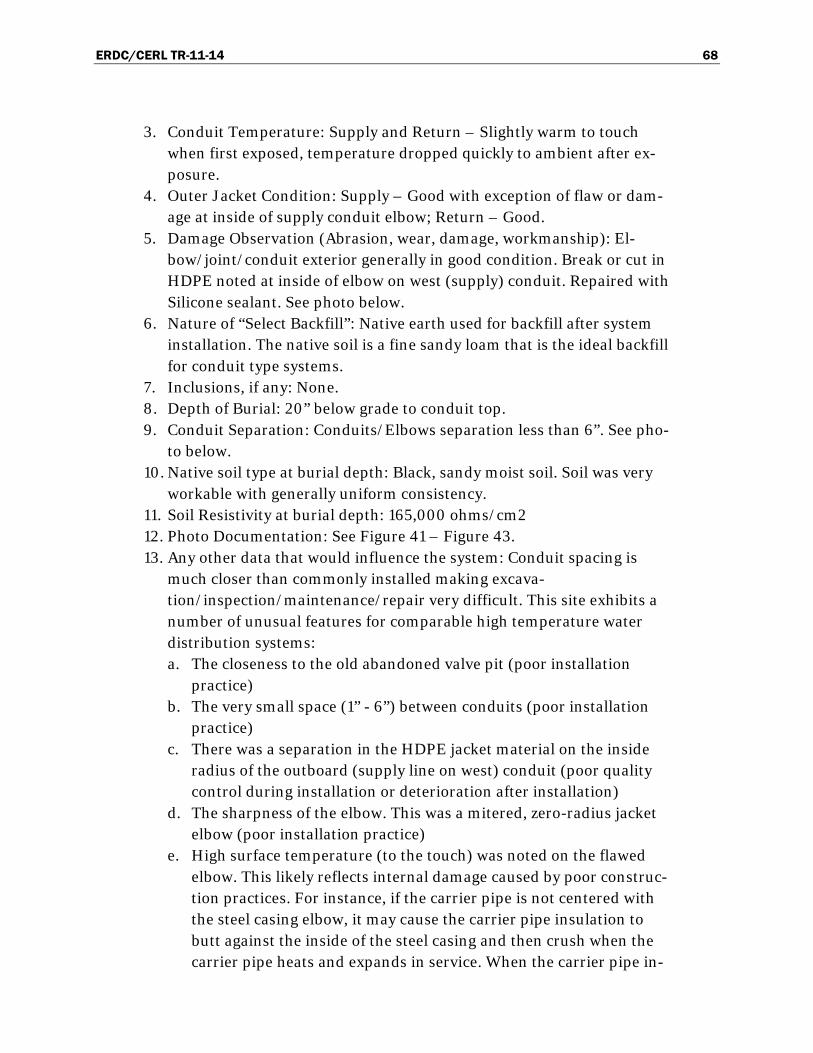
ERDC/CERL TR-11-14 68
3. Conduit Temperature: Supply and Return – Slightly warm to touch when first exposed, temperature dropped quickly to ambient after ex-posure.
4. Outer Jacket Condition: Supply – Good with exception of flaw or dam-age at inside of supply conduit elbow; Return – Good.
5. Damage Observation (Abrasion, wear, damage, workmanship): El-bow/joint/conduit exterior generally in good condition. Break or cut in HDPE noted at inside of elbow on west (supply) conduit. Repaired with Silicone sealant. See photo below.
6. Nature of “Select Backfill”: Native earth used for backfill after system installation. The native soil is a fine sandy loam that is the ideal backfill for conduit type systems.
7. Inclusions, if any: None. 8. Depth of Burial: 20” below grade to conduit top. 9. Conduit Separation: Conduits/Elbows separation less than 6”. See pho-
to below. 10. Native soil type at burial depth: Black, sandy moist soil. Soil was very
workable with generally uniform consistency. 11. Soil Resistivity at burial depth: 165,000 ohms/cm2 12. Photo Documentation: See Figure 41 – Figure 43. 13. Any other data that would influence the system: Conduit spacing is
much closer than commonly installed making excava-tion/inspection/maintenance/repair very difficult. This site exhibits a number of unusual features for comparable high temperature water distribution systems: a. The closeness to the old abandoned valve pit (poor installation
practice) b. The very small space (1” - 6”) between conduits (poor installation
practice) c. There was a separation in the HDPE jacket material on the inside
radius of the outboard (supply line on west) conduit (poor quality control during installation or deterioration after installation)
d. The sharpness of the elbow. This was a mitered, zero-radius jacket elbow (poor installation practice)
e. High surface temperature (to the touch) was noted on the flawed elbow. This likely reflects internal damage caused by poor construc-tion practices. For instance, if the carrier pipe is not centered with the steel casing elbow, it may cause the carrier pipe insulation to butt against the inside of the steel casing and then crush when the carrier pipe heats and expands in service. When the carrier pipe in-
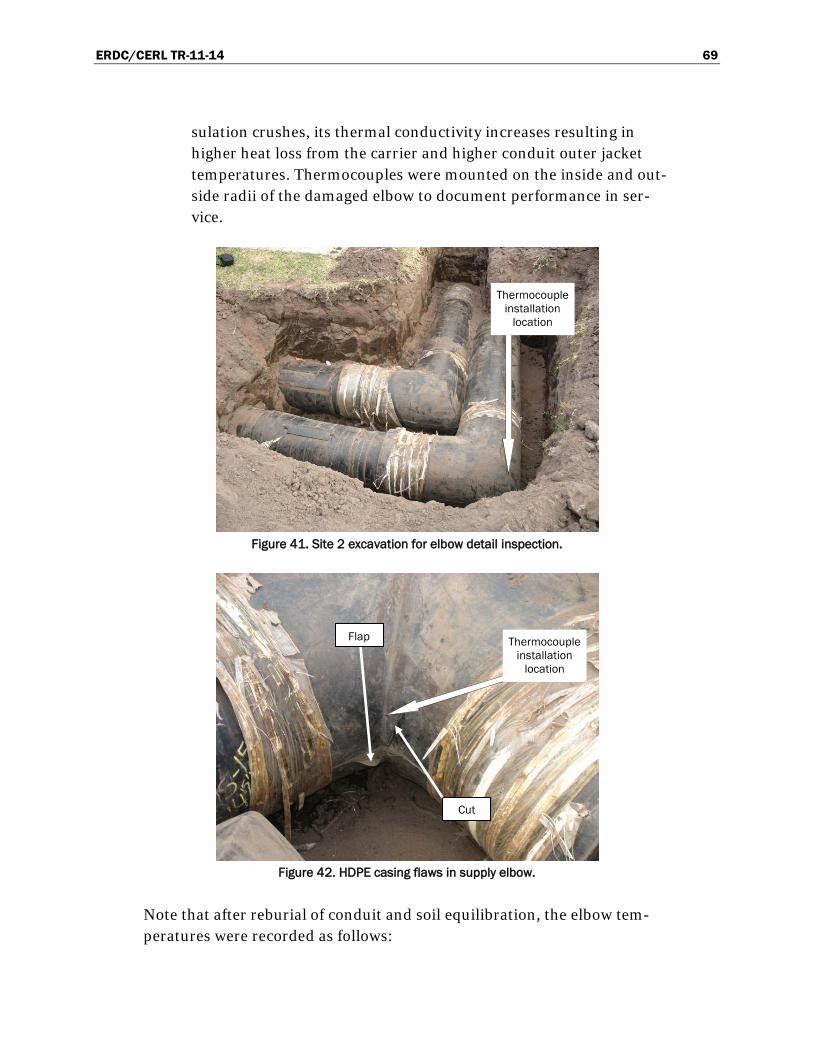
ERDC/CERL TR-11-14 69
sulation crushes, its thermal conductivity increases resulting in higher heat loss from the carrier and higher conduit outer jacket temperatures. Thermocouples were mounted on the inside and out-side radii of the damaged elbow to document performance in ser-vice.
Figure 41. Site 2 excavation for elbow detail inspection.
Figure 42. HDPE casing flaws in supply elbow.
Note that after reburial of conduit and soil equilibration, the elbow tem-peratures were recorded as follows:
Flap
Cut
Thermocouple installation
location
Thermocouple installation
location
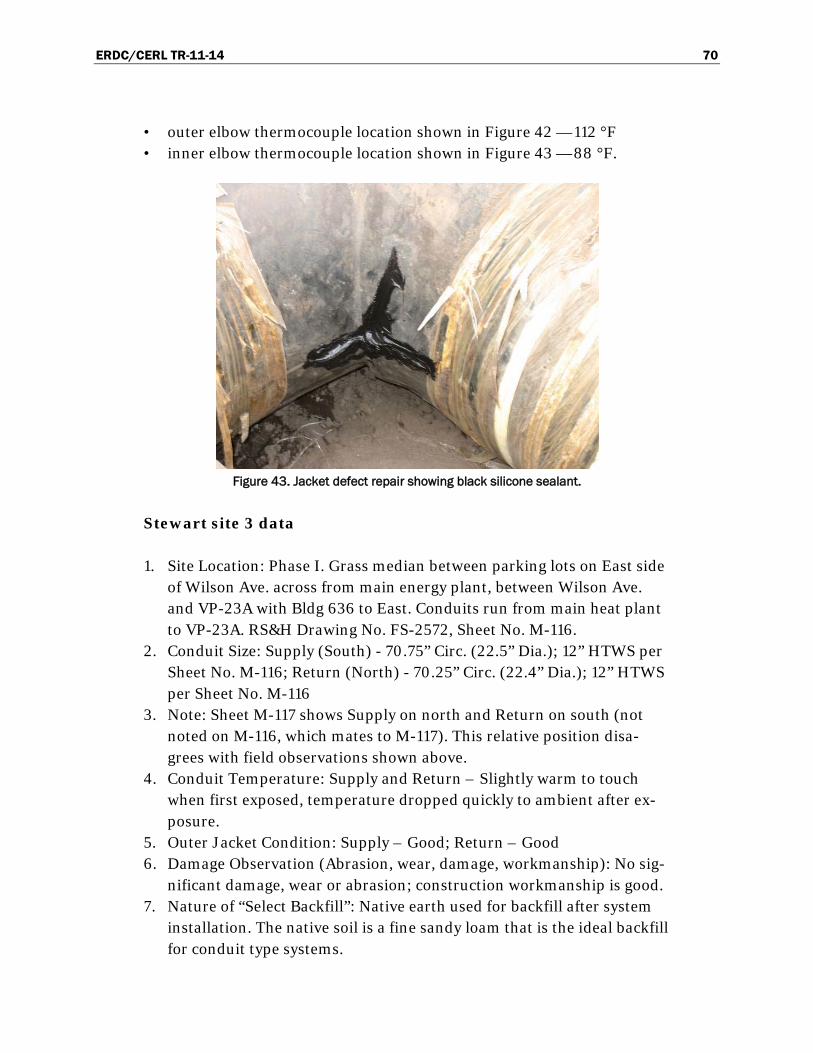
ERDC/CERL TR-11-14 70
• outer elbow thermocouple location shown in Figure 42 — 112 °F • inner elbow thermocouple location shown in Figure 43 — 88 °F.
Figure 43. Jacket defect repair showing black silicone sealant.
Stewart site 3 data
1. Site Location: Phase I. Grass median between parking lots on East side of Wilson Ave. across from main energy plant, between Wilson Ave. and VP-23A with Bldg 636 to East. Conduits run from main heat plant to VP-23A. RS&H Drawing No. FS-2572, Sheet No. M-116.
2. Conduit Size: Supply (South) - 70.75” Circ. (22.5” Dia.); 12” HTWS per Sheet No. M-116; Return (North) - 70.25” Circ. (22.4” Dia.); 12” HTWS per Sheet No. M-116
3. Note: Sheet M-117 shows Supply on north and Return on south (not noted on M-116, which mates to M-117). This relative position disa-grees with field observations shown above.
4. Conduit Temperature: Supply and Return – Slightly warm to touch when first exposed, temperature dropped quickly to ambient after ex-posure.
5. Outer Jacket Condition: Supply – Good; Return – Good 6. Damage Observation (Abrasion, wear, damage, workmanship): No sig-
nificant damage, wear or abrasion; construction workmanship is good. 7. Nature of “Select Backfill”: Native earth used for backfill after system
installation. The native soil is a fine sandy loam that is the ideal backfill for conduit type systems.
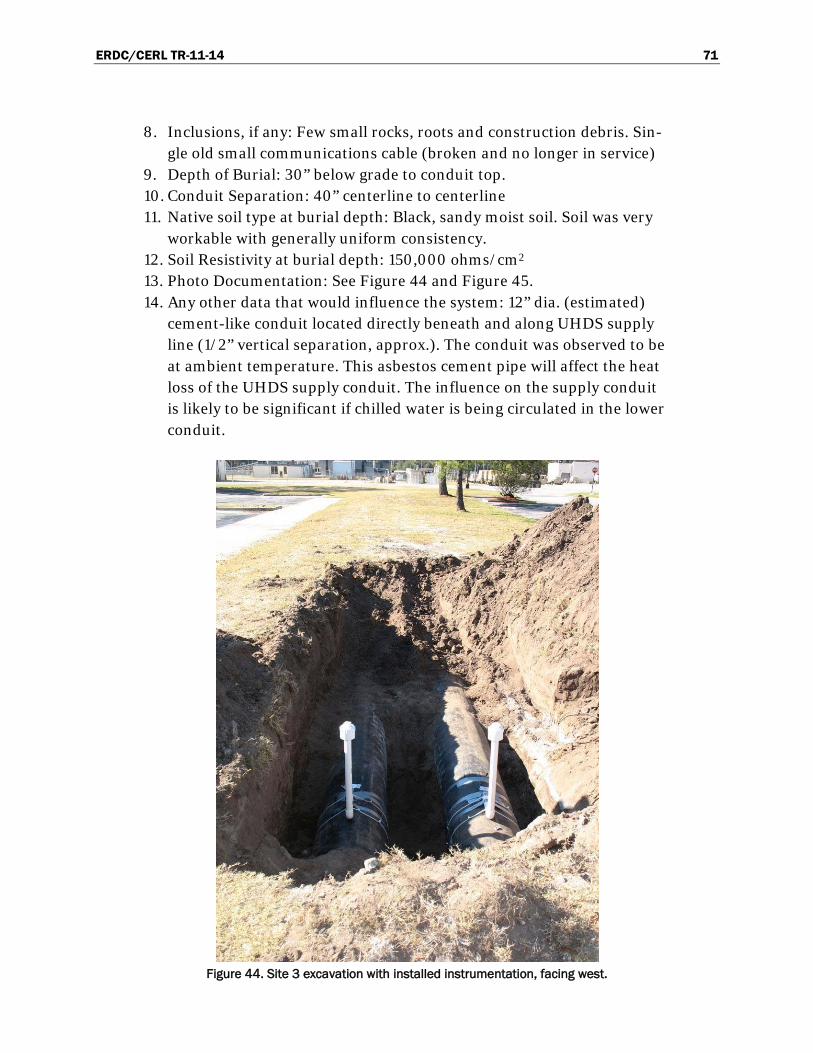
ERDC/CERL TR-11-14 71
8. Inclusions, if any: Few small rocks, roots and construction debris. Sin-gle old small communications cable (broken and no longer in service)
9. Depth of Burial: 30” below grade to conduit top. 10. Conduit Separation: 40” centerline to centerline 11. Native soil type at burial depth: Black, sandy moist soil. Soil was very
workable with generally uniform consistency. 12. Soil Resistivity at burial depth: 150,000 ohms/cm2 13. Photo Documentation: See Figure 44 and Figure 45. 14. Any other data that would influence the system: 12” dia. (estimated)
cement-like conduit located directly beneath and along UHDS supply line (1/2” vertical separation, approx.). The conduit was observed to be at ambient temperature. This asbestos cement pipe will affect the heat loss of the UHDS supply conduit. The influence on the supply conduit is likely to be significant if chilled water is being circulated in the lower conduit.
Figure 44. Site 3 excavation with installed instrumentation, facing west.
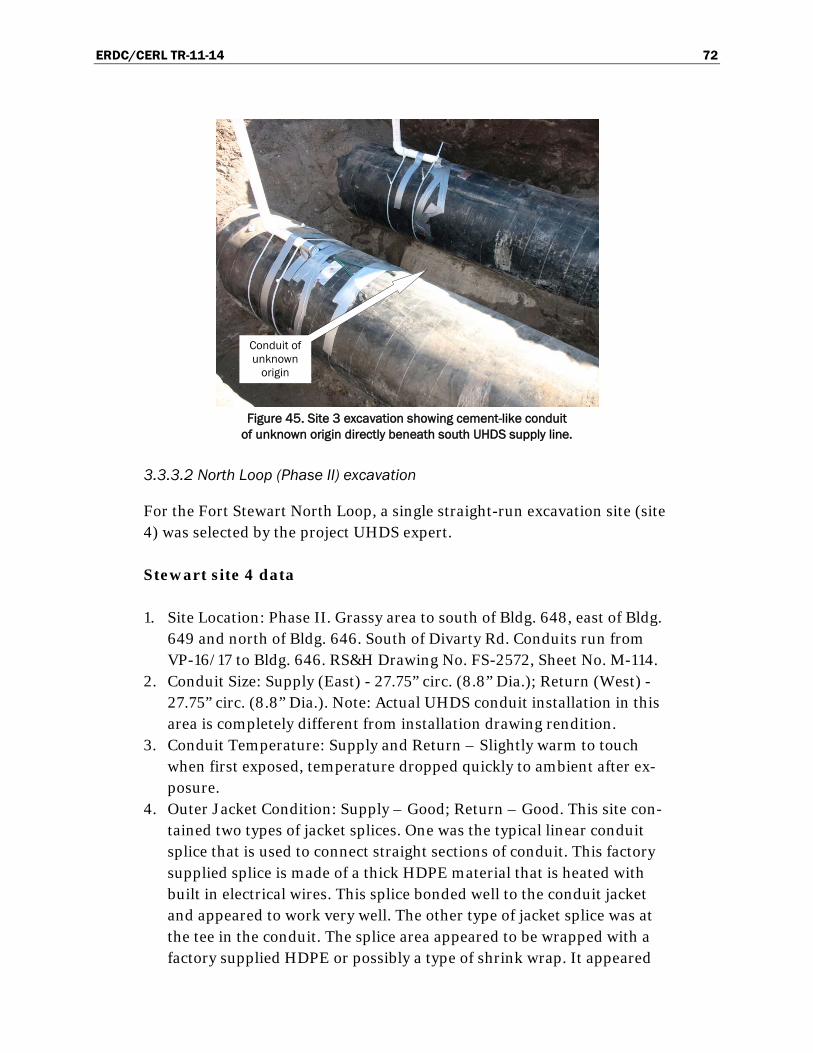
ERDC/CERL TR-11-14 72
Figure 45. Site 3 excavation showing cement-like conduit
of unknown origin directly beneath south UHDS supply line.
3.3.3.2 North Loop (Phase II) excavation
For the Fort Stewart North Loop, a single straight-run excavation site (site 4) was selected by the project UHDS expert.
Stewart site 4 data
1. Site Location: Phase II. Grassy area to south of Bldg. 648, east of Bldg. 649 and north of Bldg. 646. South of Divarty Rd. Conduits run from VP-16/17 to Bldg. 646. RS&H Drawing No. FS-2572, Sheet No. M-114.
2. Conduit Size: Supply (East) - 27.75” circ. (8.8” Dia.); Return (West) - 27.75” circ. (8.8” Dia.). Note: Actual UHDS conduit installation in this area is completely different from installation drawing rendition.
3. Conduit Temperature: Supply and Return – Slightly warm to touch when first exposed, temperature dropped quickly to ambient after ex-posure.
4. Outer Jacket Condition: Supply – Good; Return – Good. This site con-tained two types of jacket splices. One was the typical linear conduit splice that is used to connect straight sections of conduit. This factory supplied splice is made of a thick HDPE material that is heated with built in electrical wires. This splice bonded well to the conduit jacket and appeared to work very well. The other type of jacket splice was at the tee in the conduit. The splice area appeared to be wrapped with a factory supplied HDPE or possibly a type of shrink wrap. It appeared
Conduit of unknown
origin
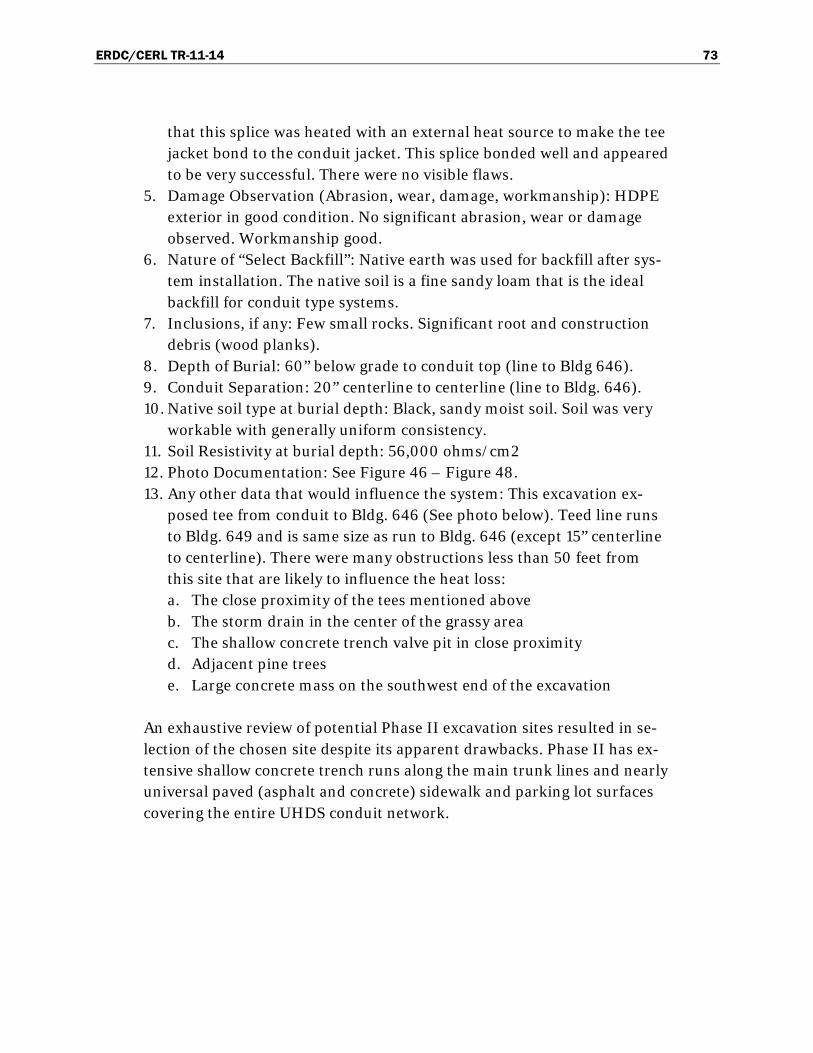
ERDC/CERL TR-11-14 73
that this splice was heated with an external heat source to make the tee jacket bond to the conduit jacket. This splice bonded well and appeared to be very successful. There were no visible flaws.
5. Damage Observation (Abrasion, wear, damage, workmanship): HDPE exterior in good condition. No significant abrasion, wear or damage observed. Workmanship good.
6. Nature of “Select Backfill”: Native earth was used for backfill after sys-tem installation. The native soil is a fine sandy loam that is the ideal backfill for conduit type systems.
7. Inclusions, if any: Few small rocks. Significant root and construction debris (wood planks).
8. Depth of Burial: 60” below grade to conduit top (line to Bldg 646). 9. Conduit Separation: 20” centerline to centerline (line to Bldg. 646). 10. Native soil type at burial depth: Black, sandy moist soil. Soil was very
workable with generally uniform consistency. 11. Soil Resistivity at burial depth: 56,000 ohms/cm2 12. Photo Documentation: See Figure 46 – Figure 48. 13. Any other data that would influence the system: This excavation ex-
posed tee from conduit to Bldg. 646 (See photo below). Teed line runs to Bldg. 649 and is same size as run to Bldg. 646 (except 15” centerline to centerline). There were many obstructions less than 50 feet from this site that are likely to influence the heat loss: a. The close proximity of the tees mentioned above b. The storm drain in the center of the grassy area c. The shallow concrete trench valve pit in close proximity d. Adjacent pine trees e. Large concrete mass on the southwest end of the excavation
An exhaustive review of potential Phase II excavation sites resulted in se-lection of the chosen site despite its apparent drawbacks. Phase II has ex-tensive shallow concrete trench runs along the main trunk lines and nearly universal paved (asphalt and concrete) sidewalk and parking lot surfaces covering the entire UHDS conduit network.
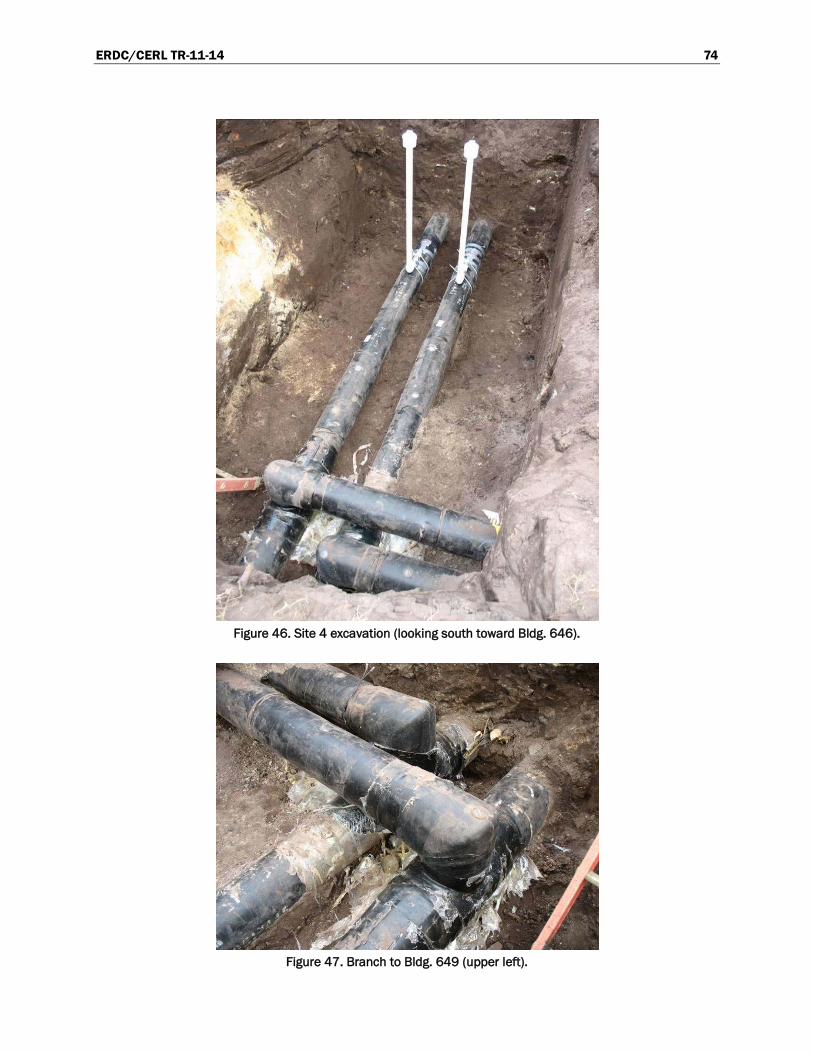
ERDC/CERL TR-11-14 74
Figure 46. Site 4 excavation (looking south toward Bldg. 646).
Figure 47. Branch to Bldg. 649 (upper left).
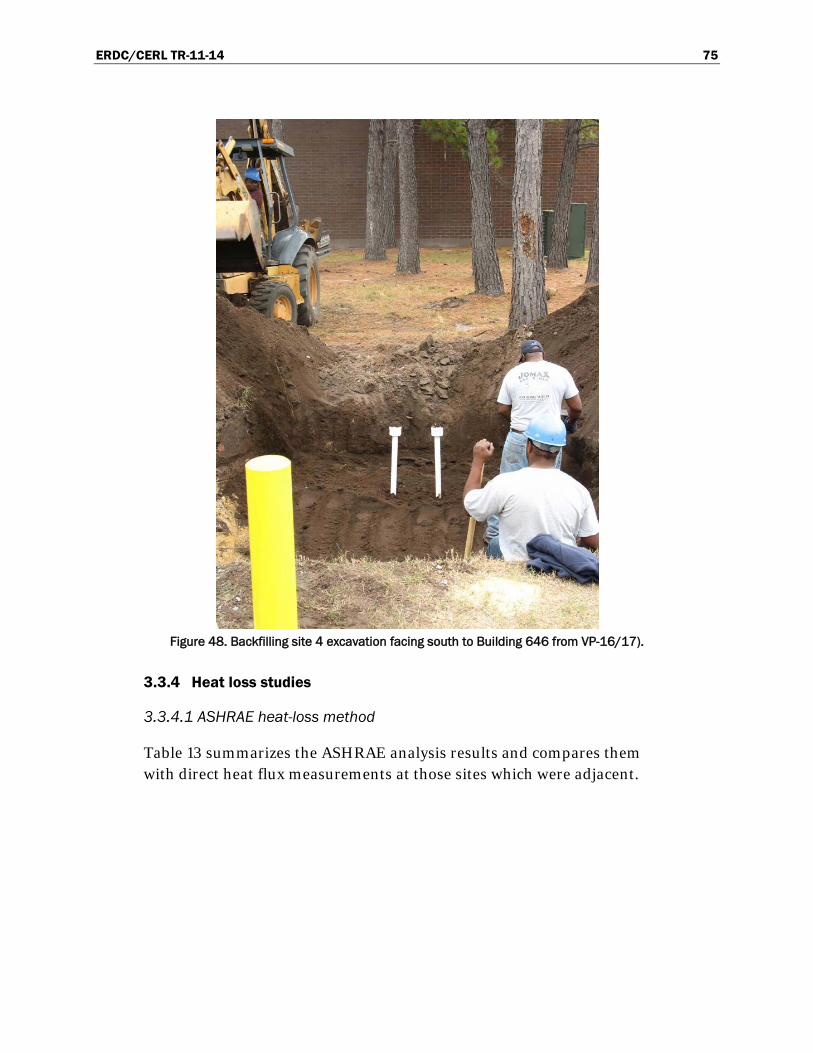
ERDC/CERL TR-11-14 75
Figure 48. Backfilling site 4 excavation facing south to Building 646 from VP-16/17).
3.3.4 Heat loss studies
3.3.4.1 ASHRAE heat-loss method
Table 13 summarizes the ASHRAE analysis results and compares them with direct heat flux measurements at those sites which were adjacent.
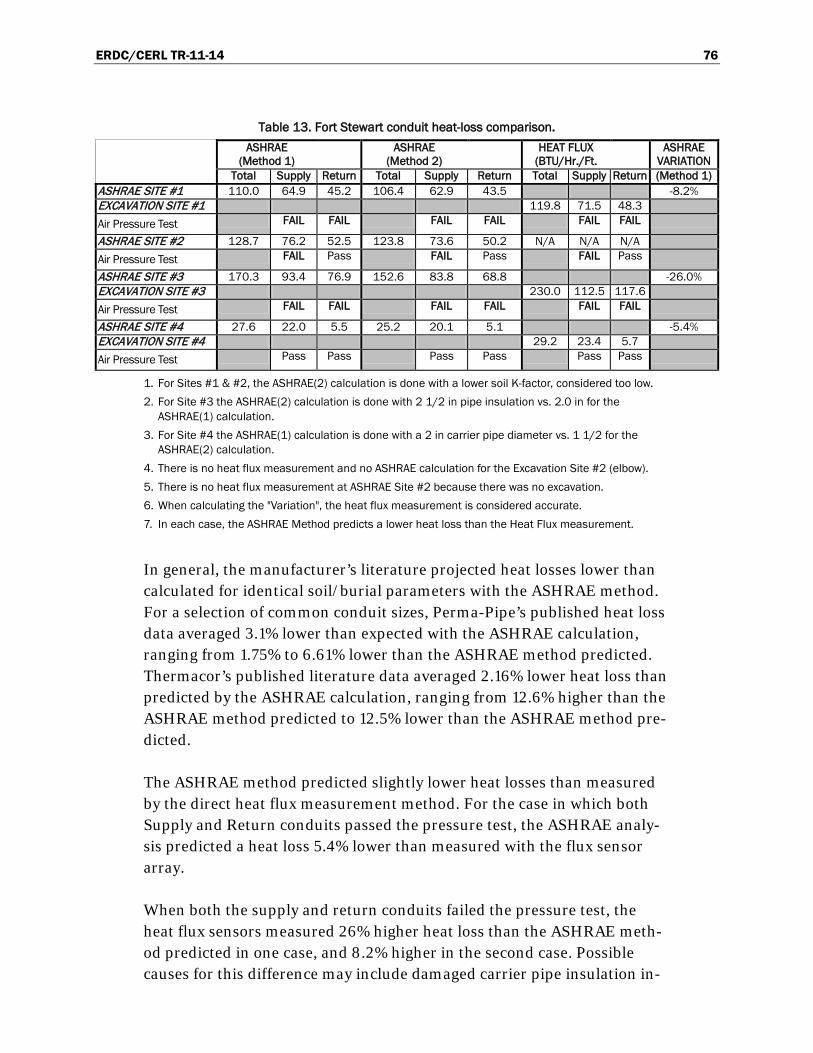
ERDC/CERL TR-11-14 76
Table 13. Fort Stewart conduit heat-loss comparison. ASHRAE
(Method 1) ASHRAE
(Method 2) HEAT FLUX
(BTU/Hr./Ft. ASHRAE
VARIATION Total Supply Return Total Supply Return Total Supply Return (Method 1)
ASHRAE SITE #1 110.0 64.9 45.2 106.4 62.9 43.5 -8.2% EXCAVATION SITE #1 119.8 71.5 48.3 Air Pressure Test FAIL FAIL FAIL FAIL FAIL FAIL
ASHRAE SITE #2 128.7 76.2 52.5 123.8 73.6 50.2 N/A N/A N/A Air Pressure Test FAIL Pass FAIL Pass FAIL Pass
ASHRAE SITE #3 170.3 93.4 76.9 152.6 83.8 68.8 -26.0% EXCAVATION SITE #3 230.0 112.5 117.6 Air Pressure Test FAIL FAIL FAIL FAIL FAIL FAIL
ASHRAE SITE #4 27.6 22.0 5.5 25.2 20.1 5.1 -5.4% EXCAVATION SITE #4 29.2 23.4 5.7 Air Pressure Test Pass Pass Pass Pass Pass Pass
1. For Sites #1 & #2, the ASHRAE(2) calculation is done with a lower soil K-factor, considered too low. 2. For Site #3 the ASHRAE(2) calculation is done with 2 1/2 in pipe insulation vs. 2.0 in for the
ASHRAE(1) calculation. 3. For Site #4 the ASHRAE(1) calculation is done with a 2 in carrier pipe diameter vs. 1 1/2 for the
ASHRAE(2) calculation. 4. There is no heat flux measurement and no ASHRAE calculation for the Excavation Site #2 (elbow). 5. There is no heat flux measurement at ASHRAE Site #2 because there was no excavation. 6. When calculating the "Variation", the heat flux measurement is considered accurate. 7. In each case, the ASHRAE Method predicts a lower heat loss than the Heat Flux measurement.
In general, the manufacturer’s literature projected heat losses lower than calculated for identical soil/burial parameters with the ASHRAE method. For a selection of common conduit sizes, Perma-Pipe’s published heat loss data averaged 3.1% lower than expected with the ASHRAE calculation, ranging from 1.75% to 6.61% lower than the ASHRAE method predicted. Thermacor’s published literature data averaged 2.16% lower heat loss than predicted by the ASHRAE calculation, ranging from 12.6% higher than the ASHRAE method predicted to 12.5% lower than the ASHRAE method pre-dicted.
The ASHRAE method predicted slightly lower heat losses than measured by the direct heat flux measurement method. For the case in which both Supply and Return conduits passed the pressure test, the ASHRAE analy-sis predicted a heat loss 5.4% lower than measured with the flux sensor array.
When both the supply and return conduits failed the pressure test, the heat flux sensors measured 26% higher heat loss than the ASHRAE meth-od predicted in one case, and 8.2% higher in the second case. Possible causes for this difference may include damaged carrier pipe insulation in-
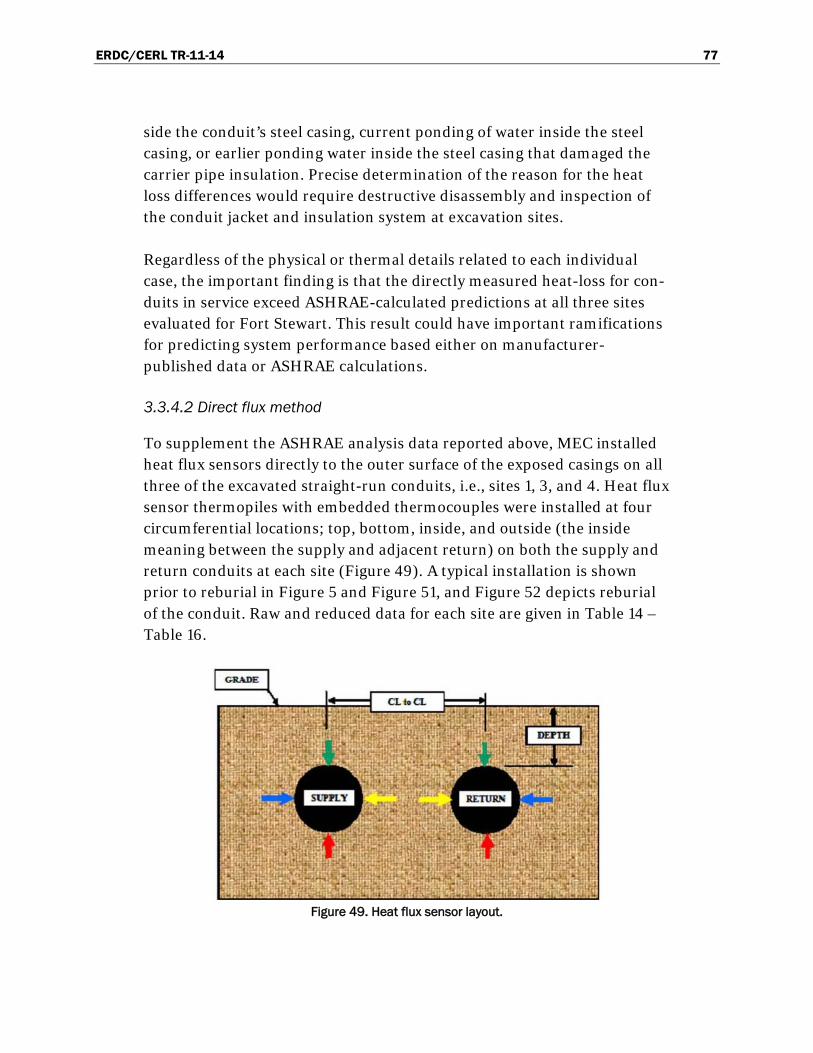
ERDC/CERL TR-11-14 77
side the conduit’s steel casing, current ponding of water inside the steel casing, or earlier ponding water inside the steel casing that damaged the carrier pipe insulation. Precise determination of the reason for the heat loss differences would require destructive disassembly and inspection of the conduit jacket and insulation system at excavation sites.
Regardless of the physical or thermal details related to each individual case, the important finding is that the directly measured heat-loss for con-duits in service exceed ASHRAE-calculated predictions at all three sites evaluated for Fort Stewart. This result could have important ramifications for predicting system performance based either on manufacturer-published data or ASHRAE calculations.
3.3.4.2 Direct flux method
To supplement the ASHRAE analysis data reported above, MEC installed heat flux sensors directly to the outer surface of the exposed casings on all three of the excavated straight-run conduits, i.e., sites 1, 3, and 4. Heat flux sensor thermopiles with embedded thermocouples were installed at four circumferential locations; top, bottom, inside, and outside (the inside meaning between the supply and adjacent return) on both the supply and return conduits at each site (Figure 49). A typical installation is shown prior to reburial in Figure 5 and Figure 51, and Figure 52 depicts reburial of the conduit. Raw and reduced data for each site are given in Table 14 – Table 16.
Figure 49. Heat flux sensor layout.
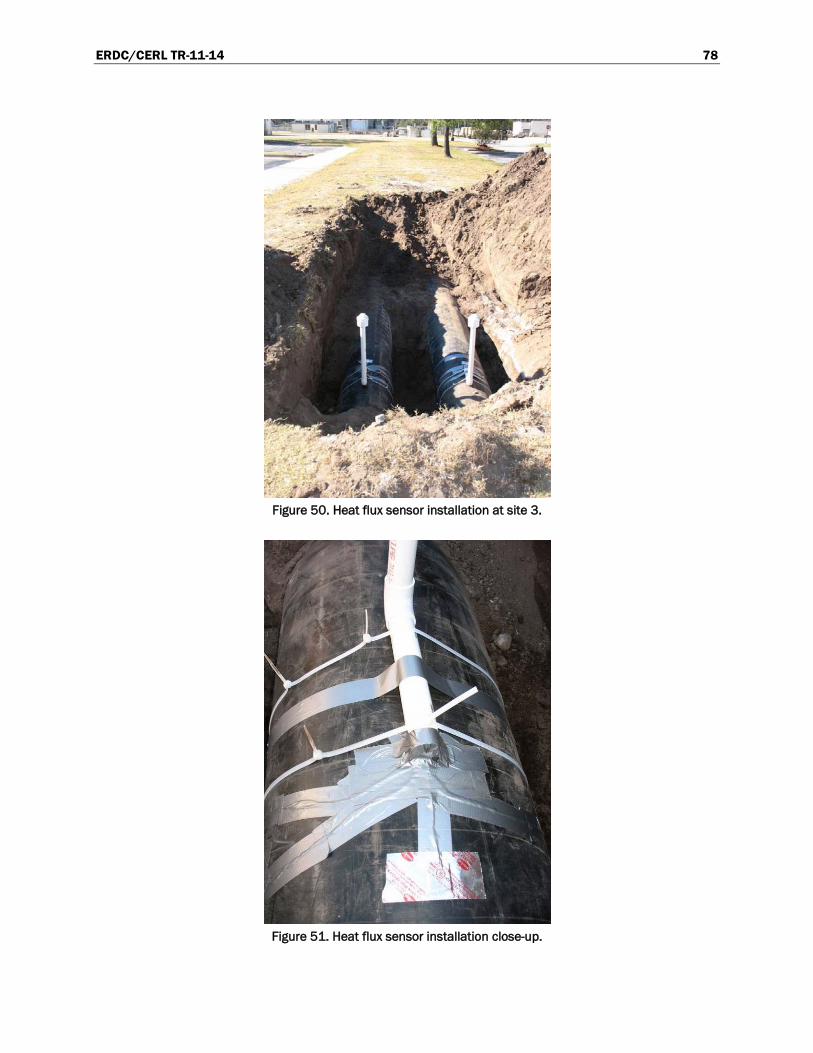
ERDC/CERL TR-11-14 78
Figure 50. Heat flux sensor installation at site 3.
Figure 51. Heat flux sensor installation close-up.
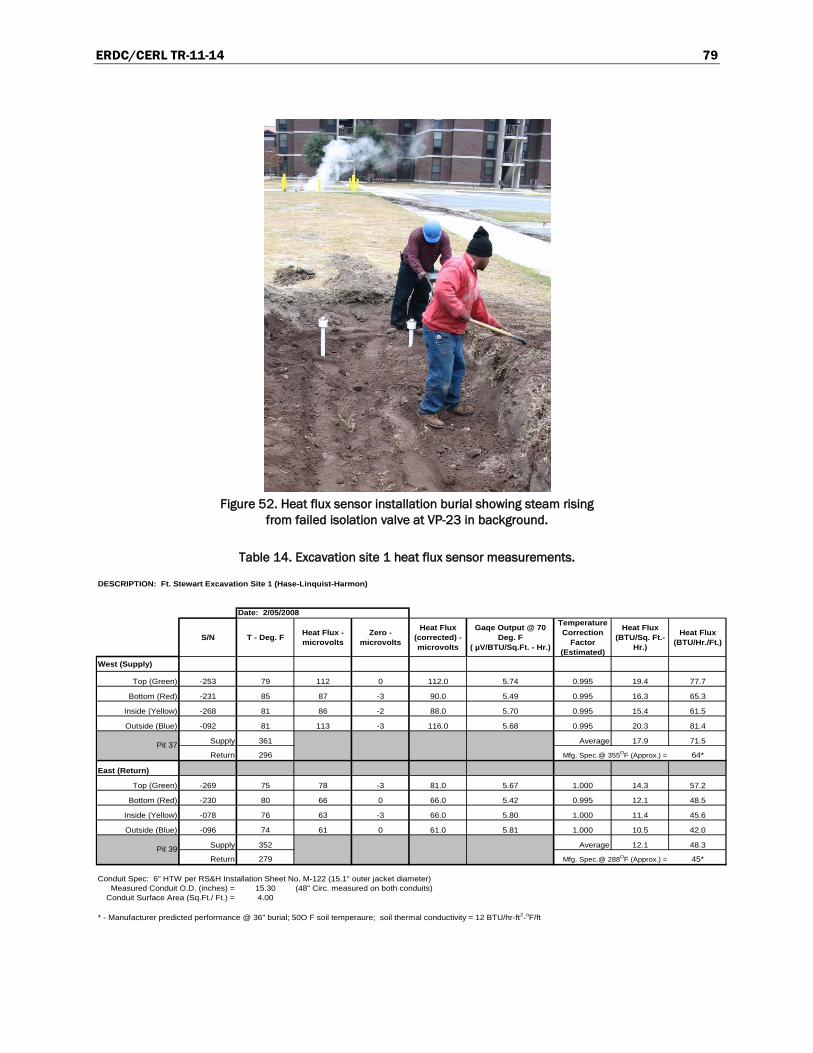
ERDC/CERL TR-11-14 79
Figure 52. Heat flux sensor installation burial showing steam rising
from failed isolation valve at VP-23 in background.
Table 14. Excavation site 1 heat flux sensor measurements.
DESCRIPTION: Ft. Stewart Excavation Site 1 (Hase-Linquist-Harmon)
S/N T - Deg. F Heat Flux - microvolts
Zero - microvolts
Heat Flux (corrected) - microvolts
Gaqe Output @ 70 Deg. F
( µV/BTU/Sq.Ft. - Hr.)
Temperature Correction
Factor (Estimated)
Heat Flux (BTU/Sq. Ft.-
Hr.)
Heat Flux (BTU/Hr./Ft.)
West (Supply)
Top (Green) -253 79 112 0 112.0 5.74 0.995 19.4 77.7
Bottom (Red) -231 85 87 -3 90.0 5.49 0.995 16.3 65.3
Inside (Yellow) -268 81 86 -2 88.0 5.70 0.995 15.4 61.5
Outside (Blue) -092 81 113 -3 116.0 5.68 0.995 20.3 81.4
Supply 361 Average 17.9 71.5
Return 296 64*
East (Return)
Top (Green) -269 75 78 -3 81.0 5.67 1.000 14.3 57.2
Bottom (Red) -230 80 66 0 66.0 5.42 0.995 12.1 48.5
Inside (Yellow) -078 76 63 -3 66.0 5.80 1.000 11.4 45.6
Outside (Blue) -096 74 61 0 61.0 5.81 1.000 10.5 42.0
Supply 352 Average 12.1 48.3
Return 279 45* Conduit Spec: 6" HTW per RS&H Installation Sheet No. M-122 (15.1" outer jacket diameter)
Measured Conduit O.D. (inches) = 15.30 (48" Circ. measured on both conduits)Conduit Surface Area (Sq.Ft./ Ft.) = 4.00
* - Manufacturer predicted performance @ 36" burial; 50O F soil temperaure; soil thermal conductivity = 12 BTU/hr-ft2-oF/ft
Date: 2/05/2008
Pit 37
Pit 39
Mfg. Spec.@ 355OF (Approx.) =
Mfg. Spec.@ 288OF (Approx.) =
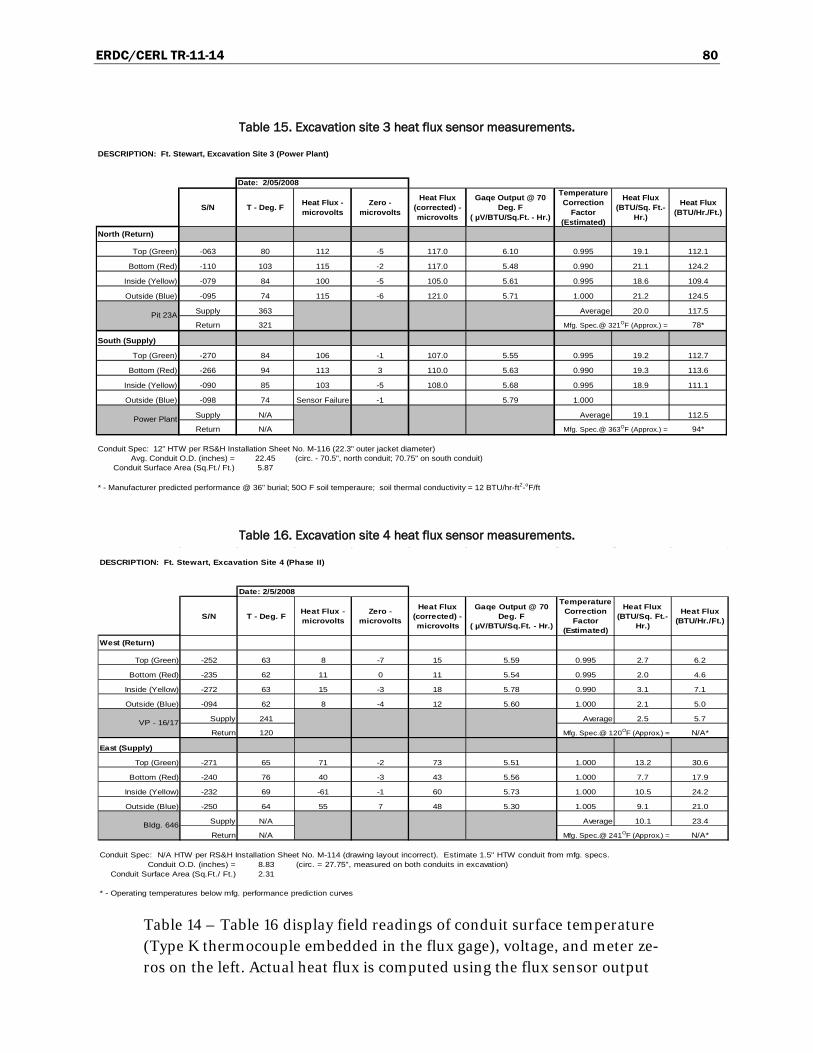
ERDC/CERL TR-11-14 80
Table 15. Excavation site 3 heat flux sensor measurements.
DESCRIPTION: Ft. Stewart, Excavation Site 3 (Power Plant)
S/N T - Deg. F Heat Flux - microvolts
Zero - microvolts
Heat Flux (corrected) - microvolts
Gaqe Output @ 70 Deg. F
( µV/BTU/Sq.Ft. - Hr.)
Temperature Correction
Factor (Estimated)
Heat Flux (BTU/Sq. Ft.-
Hr.)
Heat Flux (BTU/Hr./Ft.)
North (Return)
Top (Green) -063 80 112 -5 117.0 6.10 0.995 19.1 112.1
Bottom (Red) -110 103 115 -2 117.0 5.48 0.990 21.1 124.2
Inside (Yellow) -079 84 100 -5 105.0 5.61 0.995 18.6 109.4
Outside (Blue) -095 74 115 -6 121.0 5.71 1.000 21.2 124.5
Supply 363 Average 20.0 117.5
Return 321 78*
South (Supply)
Top (Green) -270 84 106 -1 107.0 5.55 0.995 19.2 112.7
Bottom (Red) -266 94 113 3 110.0 5.63 0.990 19.3 113.6
Inside (Yellow) -090 85 103 -5 108.0 5.68 0.995 18.9 111.1
Outside (Blue) -098 74 Sensor Failure -1 5.79 1.000
Supply N/A Average 19.1 112.5
Return N/A 94* Conduit Spec: 12" HTW per RS&H Installation Sheet No. M-116 (22.3" outer jacket diameter)
Avg. Conduit O.D. (inches) = 22.45 (circ. - 70.5", north conduit; 70.75" on south conduit)Conduit Surface Area (Sq.Ft./ Ft.) 5.87
* - Manufacturer predicted performance @ 36" burial; 50O F soil temperaure; soil thermal conductivity = 12 BTU/hr-ft2-oF/ft
Date: 2/05/2008
Pit 23A
Power Plant
Mfg. Spec.@ 321OF (Approx.) =
Mfg. Spec.@ 363OF (Approx.) =
Table 16. Excavation site 4 heat flux sensor measurements.
Table 14 – Table 16 display field readings of conduit surface temperature (Type K thermocouple embedded in the flux gage), voltage, and meter ze-ros on the left. Actual heat flux is computed using the flux sensor output
DESCRIPTION: Ft. Stewart, Excavation Site 4 (Phase II)
S/N T - Deg. F Heat Flux - microvolts
Zero - microvolts
Heat Flux (corrected) - microvolts
Gaqe Output @ 70 Deg. F
( µV/BTU/Sq.Ft. - Hr.)
Temperature Correction
Factor (Estimated)
Heat Flux (BTU/Sq. Ft.-
Hr.)
Heat Flux (BTU/Hr./Ft.)
West (Return)
Top (Green) -252 63 8 -7 15 5.59 0.995 2.7 6.2
Bottom (Red) -235 62 11 0 11 5.54 0.995 2.0 4.6
Inside (Yellow) -272 63 15 -3 18 5.78 0.990 3.1 7.1
Outside (Blue) -094 62 8 -4 12 5.60 1.000 2.1 5.0
Supply 241 Average 2.5 5.7
Return 120 N/A*
East (Supply)
Top (Green) -271 65 71 -2 73 5.51 1.000 13.2 30.6
Bottom (Red) -240 76 40 -3 43 5.56 1.000 7.7 17.9
Inside (Yellow) -232 69 -61 -1 60 5.73 1.000 10.5 24.2
Outside (Blue) -250 64 55 7 48 5.30 1.005 9.1 21.0
Supply N/A Average 10.1 23.4
Return N/A N/A* Conduit Spec: N/A HTW per RS&H Installation Sheet No. M-114 (drawing layout incorrect). Estimate 1.5" HTW conduit from mfg. specs.
Conduit O.D. (inches) = 8.83 (circ. = 27.75", measured on both conduits in excavation)Conduit Surface Area (Sq.Ft./ Ft.) 2.31
* - Operating temperatures below mfg. performance prediction curves
Date: 2/5/2008
VP - 16/17
Bldg. 646
Mfg. Spec.@ 120OF (Approx.) =
Mfg. Spec.@ 241OF (Approx.) =
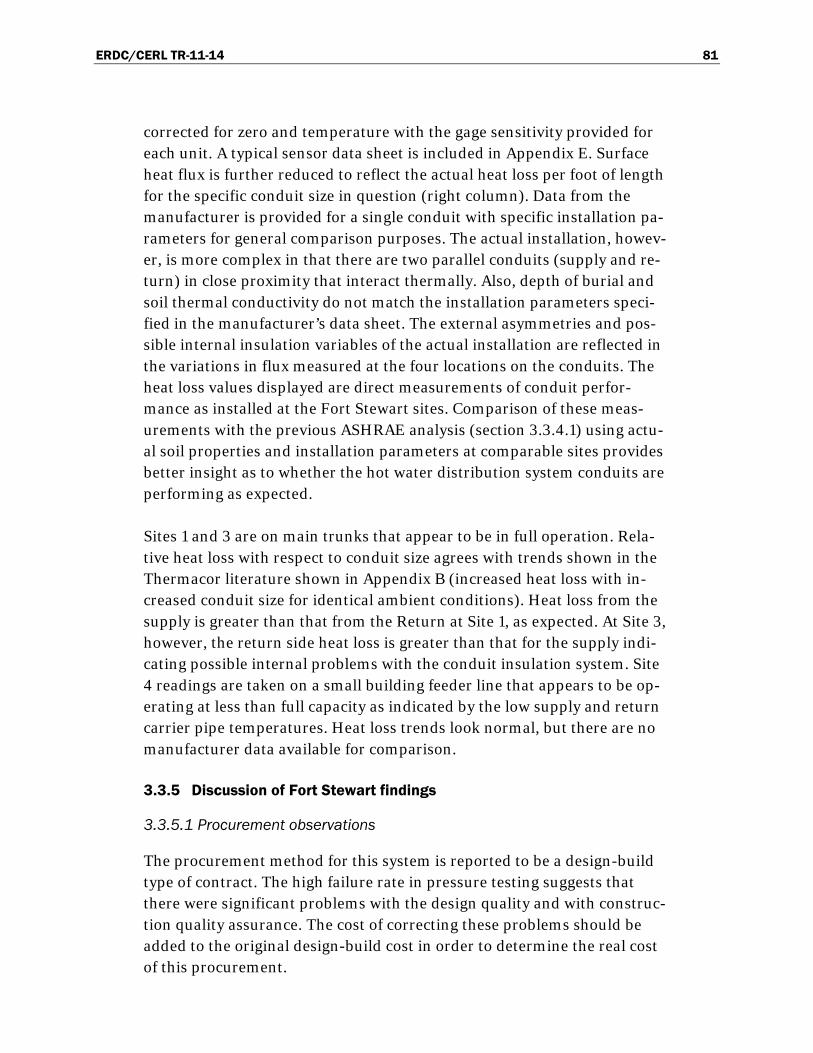
ERDC/CERL TR-11-14 81
corrected for zero and temperature with the gage sensitivity provided for each unit. A typical sensor data sheet is included in Appendix E. Surface heat flux is further reduced to reflect the actual heat loss per foot of length for the specific conduit size in question (right column). Data from the manufacturer is provided for a single conduit with specific installation pa-rameters for general comparison purposes. The actual installation, howev-er, is more complex in that there are two parallel conduits (supply and re-turn) in close proximity that interact thermally. Also, depth of burial and soil thermal conductivity do not match the installation parameters speci-fied in the manufacturer’s data sheet. The external asymmetries and pos-sible internal insulation variables of the actual installation are reflected in the variations in flux measured at the four locations on the conduits. The heat loss values displayed are direct measurements of conduit perfor-mance as installed at the Fort Stewart sites. Comparison of these meas-urements with the previous ASHRAE analysis (section 3.3.4.1) using actu-al soil properties and installation parameters at comparable sites provides better insight as to whether the hot water distribution system conduits are performing as expected.
Sites 1 and 3 are on main trunks that appear to be in full operation. Rela-tive heat loss with respect to conduit size agrees with trends shown in the Thermacor literature shown in Appendix B (increased heat loss with in-creased conduit size for identical ambient conditions). Heat loss from the supply is greater than that from the Return at Site 1, as expected. At Site 3, however, the return side heat loss is greater than that for the supply indi-cating possible internal problems with the conduit insulation system. Site 4 readings are taken on a small building feeder line that appears to be op-erating at less than full capacity as indicated by the low supply and return carrier pipe temperatures. Heat loss trends look normal, but there are no manufacturer data available for comparison.
3.3.5 Discussion of Fort Stewart findings
3.3.5.1 Procurement observations
The procurement method for this system is reported to be a design-build type of contract. The high failure rate in pressure testing suggests that there were significant problems with the design quality and with construc-tion quality assurance. The cost of correcting these problems should be added to the original design-build cost in order to determine the real cost of this procurement.
ERDC/CERL TR-11-14 82
In addition, it appears that the procurement method to obtain the Base-Wide Maintenance Contract is insufficient as it pertains to UHDS mainte-nance. If groundwater leaks into the annular air space around the carrier pipe, the mineral wool insulation on the carrier pipe can quickly be de-stroyed unless the leak is corrected and the insulation dried rapidly. If the problem is not detected and fixed promptly, the damaged portion of the system must be replaced to restore functionality. The purpose of the drainable, dryable, testable (DDT) design feature of these conduit systems is to provide the capability for preventing such catastrophic damage. The Base-Wide Maintenance Contract does not appear to include specific re-quirements for monitoring and quickly repairing the UHDS.
3.3.5.2 Maintenance observations
As a result of a 1992 agreement between the federal government and con-duit manufacturers intended to improve the performance and service life life of UHDS systems, manufacturers agreed to separate installation and maintenance information into two separate manuals.
Today, much of what would be in an installation manual is put on the manufacturer’s drawings if the bid process does not force its deletion.
Both manuals could have helped to eliminate problems that have appar-ently caused the failure rates documented by the current testing. However, neither manual could be located for the system installed at Fort Stewart. In particular, the lack of a maintenance manual for the UHDS must be considered unacceptable. A maintenance manual is needed to instruct the base maintenance contractor how to maintain the system and avoid prem-ature failures. A maintenance manual typically defines the time intervals for checking for leaks, draining low points in the casing, running 15 psig air pressure tests on the annular air space, and conducting routine valve pit maintenance. Without a manual, the forced mode of operation is for DPW personnel to notify the base maintenance contractor of problems when they become easily detectable, at which point a considerable amount of serious, costly damage has already occurred.
3.3.5.3 Valve pit observations
The valve pits at Fort Stewart were the open-grate type comprising a rec-tangular, thick walled concrete enclosure that extends slightly above grade with a galvanized open-grate top. Each pit includes a recessed sump, about
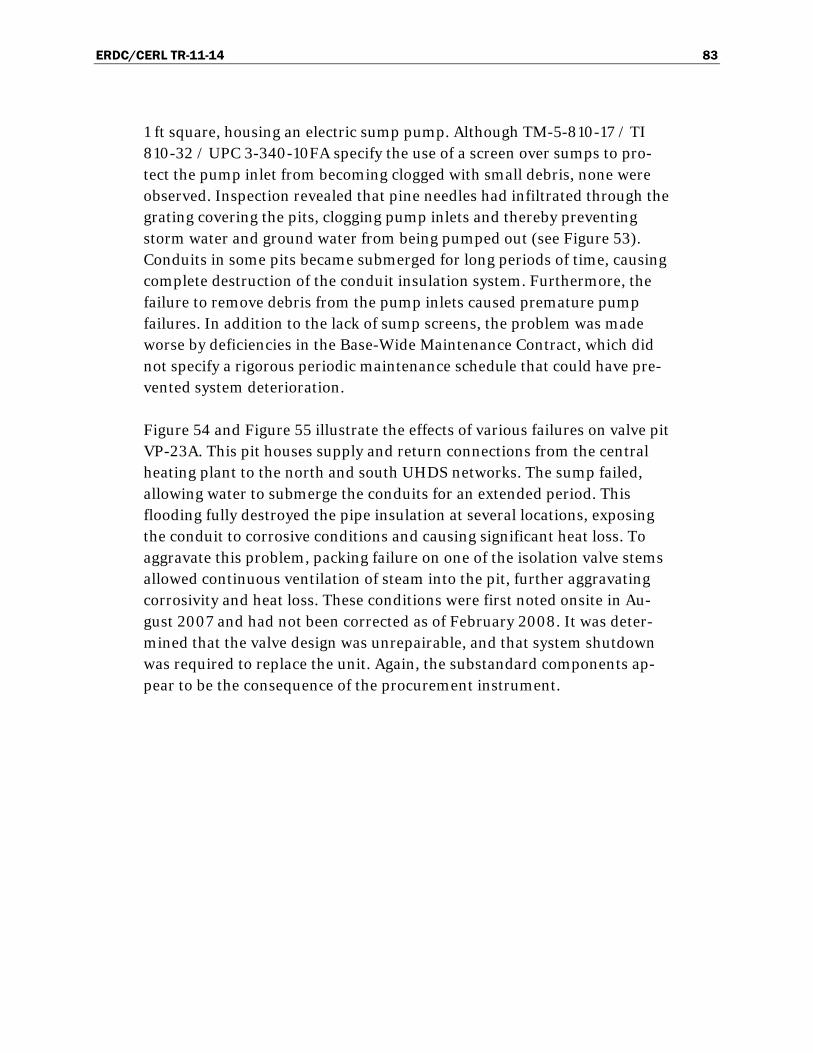
ERDC/CERL TR-11-14 83
1 ft square, housing an electric sump pump. Although TM-5-810-17 / TI 810-32 / UPC 3-340-10FA specify the use of a screen over sumps to pro-tect the pump inlet from becoming clogged with small debris, none were observed. Inspection revealed that pine needles had infiltrated through the grating covering the pits, clogging pump inlets and thereby preventing storm water and ground water from being pumped out (see Figure 53). Conduits in some pits became submerged for long periods of time, causing complete destruction of the conduit insulation system. Furthermore, the failure to remove debris from the pump inlets caused premature pump failures. In addition to the lack of sump screens, the problem was made worse by deficiencies in the Base-Wide Maintenance Contract, which did not specify a rigorous periodic maintenance schedule that could have pre-vented system deterioration.
Figure 54 and Figure 55 illustrate the effects of various failures on valve pit VP-23A. This pit houses supply and return connections from the central heating plant to the north and south UHDS networks. The sump failed, allowing water to submerge the conduits for an extended period. This flooding fully destroyed the pipe insulation at several locations, exposing the conduit to corrosive conditions and causing significant heat loss. To aggravate this problem, packing failure on one of the isolation valve stems allowed continuous ventilation of steam into the pit, further aggravating corrosivity and heat loss. These conditions were first noted onsite in Au-gust 2007 and had not been corrected as of February 2008. It was deter-mined that the valve design was unrepairable, and that system shutdown was required to replace the unit. Again, the substandard components ap-pear to be the consequence of the procurement instrument.
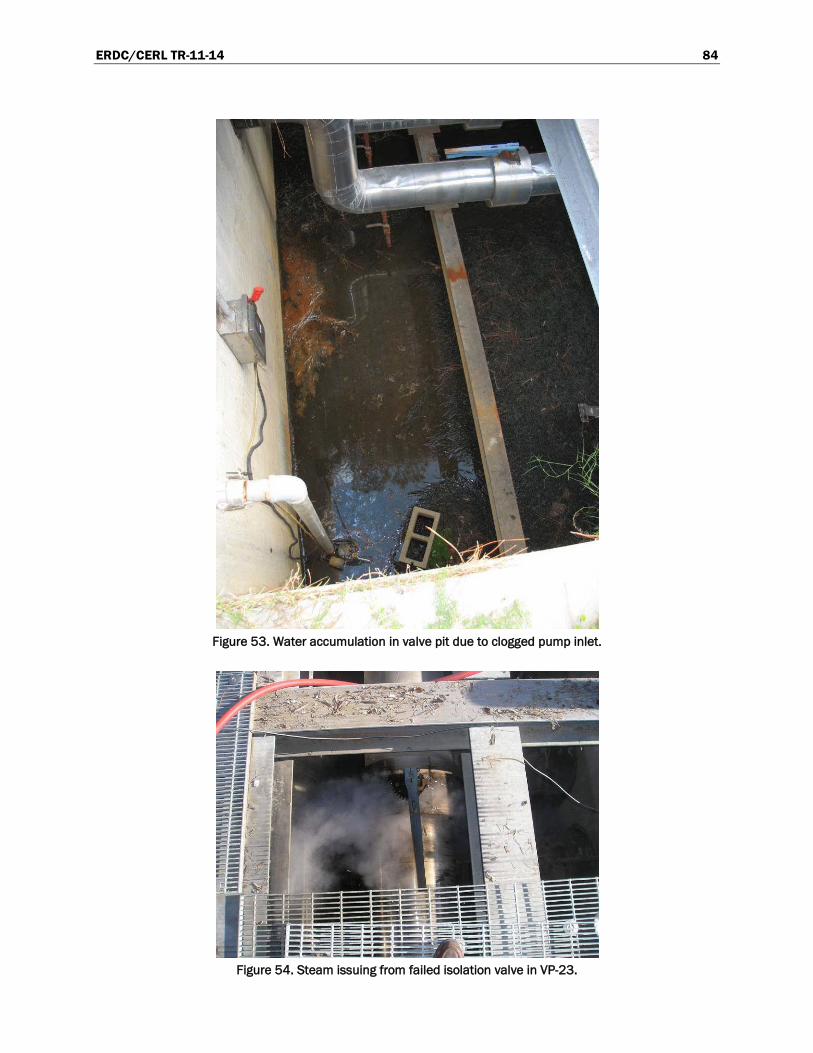
ERDC/CERL TR-11-14 84
Figure 53. Water accumulation in valve pit due to clogged pump inlet.
Figure 54. Steam issuing from failed isolation valve in VP-23.
ERDC/CERL TR-11-14 85
Figure 55. Main trunk carrier pipe in VP-23 fully exposed due to conduit failure.
When the Fort Stewart system was installed, at least two old valve man-holes were reused and incorporated into the network. These reused man-holes were not rehabilitated, however. The original piping and conduits were abandoned in place and new sump pumps were not installed. It ap-pears that these reused manholes were considered part of the abandoned infrastructure and were ignored because they held standing water. In one case the abandoned conduit functioned as a siphon that allowed ground water to fill the manhole up to the level of the water table. This example is an extreme case of design and maintenance deficiency.
3.3.5.4 Other design observations
Link seals were used to seal the valve pit wall at the conduit to prevent ground water infiltration. These seals performed so poorly that it was common to see sand and soil passing through the joint into the pit. Some
ERDC/CERL TR-11-14 86
valve pit floor drains were plugged with sand and silt. In many cases, the conduit was not centered in the pit wall access hole, resulting in large gaps. In some cases the hole in the manhole wall was too large for the con-duit, and the link seal could not expand enough to create a closure. In many cases the link seal exerted enough inward radial pressure to crush the HDPE conduit jacket and underlying polyurethane insulation, which allowed the intrusion of storm water, sand, and silt into the manhole.
Anchor and end plate detail represent two nagging design dilemmas for a UHDS conduit system containing plastic. Neither the polyurethane exter-nal insulation nor the HDPE jacket can withstand UHDS carrier pipe tem-peratures. The anchor plate, welded to the carrier pipe and to the steel cas-ing, protrudes through the polyurethane external insulation and HDPE jacket. The anchor plate is relatively thick, and because steel is an efficient heat conductor, the anchor plate temperature approaches that of the carri-er pipe. Investigation of anchor plate temperature at the conduit jacket was not addressed in this work, but it is reasonable to suspect that exces-sive heat could have potentially degraded the plastic materials and created sites for water infiltration and heat loss. The annular space end plate cre-ates a similar design problem, and likewise can result in overheating and failure of plastic system components.
Because certain types of soils act as very efficient thermal insulators when dry, there will be relatively little temperature drop inside the UHDS piping buried under these conditions. Under those conditions the steady-state temperature profile will be relatively high within the piping and most of the temperature drop tending toward ambient soil values outside the con-duit. In such a case the outer jacket may rise to within 50 °F the carrier pipe temperature. This was not the case at Fort Stewart , however, because the soil was moderately conductive of heat and the measured HDPE jacket temperatures were relatively low. The conduit insulation systems com-bined with soil conditions resulted in a high temperature gradient from the carrier pipe to the jacket, and this protected the jacket from overheat-ing. This finding was verified both by direct temperature measurements with thermocouples embedded in the buried thermal flux gages installed on the conduit jackets at the excavation sites and by direct hands-on in-spection at the excavation sites. Measured jacket temperatures on buried conduits at the excavation sites did not exceed 150 °F.
ERDC/CERL TR-11-14 87
The weather before and during the field investigation was very dry. The duration of this condition was significant enough to create severe munici-pal water supply problems throughout the southeast United States. Water-use restrictions were in force in the Fort Stewart area. Because the soil was unusually dry, certain potential problems related to water infiltration into the UHDS annular space may have been masked. Examples include defec-tive welds and other penetrations that compromise casing integrity. Air pressure testing can reveal the possible presence of such leak sources, but when the soil is exceptionally dry, no telltales signs of water accumulation will be evident inside the casing. Also, in excessively dry conditions, soil resistivity measurements are higher, creating a potentially misleading im-pression that conditions are not as corrosive as they are during typical cli-mate conditions. This type of misreading of soil conditions may lead to a lax attitude about the need for robust cathodic protection.
A well designed UHDS conduit system will typically include service access valve pits or manholes at elevation high points, elevation low points, tees or branches to connected buildings, and at entry interfaces to buildings. At Fort Stewart, many such critical locations have been constructed with no access pit, meaning that these locations cannot be and have not been in-spected or serviced since the system was installed. Furthermore, in many places the conduit system is out of compliance with UFGS 33 61 13, which requires that spacing between drain and vent access points be less than 500 feet. This design error creates a probability that there are unintended and undesirable low points along inaccessible sections of the system.
Even though the close interval survey revealed generally low corrosive po-tential for the underground heating system at Fort Stewart, there is still a finite risk of corrosion in the system. As noted earlier, the high soil resistivities measured at Fort Stewart could be an artifact of the extremely dry weather experienced in that area for much of the preceding year. The unnaturally dry conditions could have resulted in misleadingly-high soil resistivities and masked potentially serious corrosion conditions suggested by the high pressure-test failure rate that suggest high potential for water ingress into the steel casing annulus.
All metallic structures will corrode if placed in an electrolyte. Even if pip-ing is installed with passive protection (e.g., coatings), a breach in the pro-tection such as coating damage or an installation defect will result in the creation of a corrosion cell. Once corrosion is initiated, there are many fac-
ERDC/CERL TR-11-14 88
tors that can speed the process. Low soil resistivity, extraneous DC sources, the presence of chlorides or other sources of ions in the soil, short circuits to pit rebar or conduit anchors, and/or proximity to foreign ca-thodic protection systems will accelerate the corrosion process and result in premature failure of the unprotected piping system. Dedicated cathodic protection systems, either galvanic or impressed current, are the only ef-fective methods known to mitigate and virtually halt corrosion activity once the passive protection is compromised. This approach, in theory, would work even for conduit systems such as that installed at Fort Stewart in which the “coating” is actually comprised of polyurethane foam insula-tion bonded to the steel casing and covered with a plastic outer jacket. While this “coating” is very thick by conventional standards, it is still pos-sible for water to penetrate the foam down to the steel casing to complete the corrosion circuit once the jacket is breached.
Oil, natural gas and other transport pipelines in the United States are in-stalled with exterior coatings on the steel pipe. The coating materials vary widely depending on the installation and include coal tar, fusion bonded epoxy, wax, tape, and asphalt. Further, the pipelines are cathodically pro-tected from corrosion either by galvanic or impressed current systems. The amount of current needed to protect the systems is based on the effective dielectric strength of the applied coating. In actual practice, measurable protective current only flows into the pipe at points where the coating has been penetrated and metal is exposed. For galvanic systems, sacrificial an-odes are bonded directly to the metal to be protected at or very near to the locations of high risk. Galvanic protection is strategically located and its protection is typically quite localized. Protection ceases when the bonded anode is consumed and replacement is required for continued service. Conversely, impressed current systems provide more comprehensive cov-erage by allowing electrons generated by a power supply and injected at buried remote anodes to seek the path of least resistance to the protected pipe in order to complete the circuit. That path, of course, will selectively lead to failed coating locations, the very sites at which corrosion activity would be generated without a compensating counter-current.
Considering the many construction and design flaws existing in the Fort Stewart UHDS system and the lack of a comprehensive maintenance and diagnostic program, it would seem advisable to recommend that some form of cathodic protection be installed at this site. Unfortunately, effec-tive protection using galvanic methods requires identification of specific
ERDC/CERL TR-11-14 89
active or high-risk corrosion sites, and that would require an extensive ex-cavation and inspection program. Further, unless the protected pipe is not electrically isolated, current demands will far exceed the capabilities of galvanic systems. This is likely the case with the Fort Stewart UHDS.
With respect to impressed current systems, two major concerns arise. First, impressed currents can actually disbond protective coatings if not controlled at proper levels. These levels are well understood for conven-tional coatings typically used on pipeline applications; however, the “coat-ing” system on the UHDS conduit casings is not well documented with re-spect to disbondment resistance to impressed currents. Further, successful applications in the pipeline industry usually require establishment of a “ground bed” remote from other buried conduits or cables for anode buri-al. Other such buried systems in the vicinity compete for protection and dissipate the impressed current intended for the target. The number and extent of other Fort Stewart buried networks in close proximity to the UHDS severely limits the ability to locate effective ground beds and reduc-es the extent of the conduit network that can be protected by use of im-pressed currents.
With a few specific localized exceptions, CIS and soil resistivity tests showed low potential for corrosive activity on the Fort Stewart UHDS. In-vestigation, detection, identification and correction of the localized prob-lems are realistic tasks that can be completed at modest cost. It is recom-mended that the specific areas with low resistivity identified in the CIS study be excavated, examined, and problems corrected, if possible.
In general, the physical condition of the conduit HDPE outer jacket ex-posed at the excavation sites was good on the straight-line runs and splic-es. No signs of excessive abrasion or wear were apparent. The method used to bond the jacket splice segment to the conduit jacket worked very well. This is a procedure that heats the HDPE during the bonding process. This method also worked well at the tees (branches) and elbows. One fac-tory prefabricated jacket elbow fitting had a crack in the HDPE at the in-side radius of the elbow jacket, but it did not appear to be sufficiently se-vere to compromise the conduit outer jacketing or insulation system. The MEC inspection team repaired the damaged jacket using black Silicone sealant. In the soil parameters at Fort Stewart, the HDPE jacket is per-forming satisfactorily.
ERDC/CERL TR-11-14 90
ASHRAE predictive analysis using actual installation parameters and soil properties indicates that published manufacturer performance data is somewhat optimistic with respect to thermal performance. Further, meas-urements taken with heat flux gages bonded to the conduit jacket further indicates that actual installed performance at Fort Stewart is somewhat poorer than predicted by the ASHRAE analysis for sites in close proximity. It should be noted that the ASHRAE analysis method does not account for the internal steel supports that center the carrier pipe in the steel casing and may provide for localized increased heat flux and slightly overall poor-er thermal performance. It is possible that the heat flux sensors were lo-cated in the vicinity of such a support which can be spaced as close as eve-ry 10 feet along the conduit, depending on installation details.
Site-comparable data is limited and care should be taken in drawing sweeping conclusions; however, it was noted that measured heat flux ranged from 5% to 26% higher than ASHRAE predictions for the sites evaluated. These sites include two cases in which both supply and return lines failed pressure (8.4% and 26% higher) tests as well as a case in which both conduits passed (5.4% higher). With this experience, it is reasonable to expect that overall system thermal performance is poorer than that pre-dicted by ASHRAE analysis. Such predictions are tenuous based on the ex-tremely limited data sampled from such an extensive and complex net-work, but these initial data indicate that reliance on manufacturer published data or ASHRAE analysis may be optimistic, especially when adherence to design and construction specifications is not rigorously en-forced and installation quality is significantly less than ideal.
Finally, it was observed that the HDPE jacket temperatures were not ex-cessive when operating in the Fort Stewart soil environment. The internal conduit insulation system in the Fort Stewart system imposed high tem-perature gradients from the carrier pipe to the jacket and protected the jacket from overheating. This was verified by direct temperature meas-urements with thermocouples embedded in the buried thermal flux gages as well as by visual inspection at the conduit excavation sites.
The encouraging observed data correlation between ASHRAE sites and di-rect measurement sites that were in close proximity, suggests that future evaluations of the type reported here should incorporate these parallel analysis methods.
ERDC/CERL TR-11-14 91
Given the limited number of prime (uncluttered) measurement sites avail-able at such well-developed bases, it is highly recommended that future studies incorporate both ASHRAE and direct heat flux measurement in proximity at every available location.
A comprehensive program to identify and correct the major design and in-stallation defects detected in this investigation should be initiated. The UHDS system at Fort Stewart was installed using innovative contracting methods. The high pressure-test failure rate suggests that there are serious problems with this method of contracting when used for UHDS procure-ment. It is well known that UHDS are very sensitive to errors in design, construction, installation, quality control inspection, and maintenance. This sensitivity is the reason that the Tri-Service Committee (1964) and the Federal Agency Committee (1980) were created. To determine the true costs of this innovative procurement, the defects and deficiencies of the Fort Stewart UHDS should be corrected and these costs added to the cost of the initial procurement.
Deficiencies in construction practices and materials quality as well as ad-herence to manufacturer and Government control specifications for sys-tem design and installation were noted throughout the Fort Stewart UHDS network. Complete documentation and correction of these problems will be an expensive undertaking. The current situation is aggravated by a seri-ously deficient routine maintenance program that addresses existing fail-ures and detects emerging problems. Inoperable sump systems have al-lowed flooding of many pits and resulted in the destruction of conduit insulation systems. In some cases the pumps have failed. In many cases the sumps have become clogged with debris that enters through the open grating cover or with silt that has flowed in around the link seals at the conduit exits from the pits. These issues and the cascading deterioration that they generate can be mitigated by a vigorous and sustained mainte-nance program that detects and corrects situations before they become se-rious.
The inspection team was not able to identify or locate dedicated mainte-nance documentation for the Fort Stewart underground heat distribution system. The lack of written maintenance procedures and a robust ongoing program that executes these procedures has resulted in serious physical deterioration of the Fort Stewart heat distribution system, especially with respect to the exposed conduits enclosed in the valve pits. At minimum,
ERDC/CERL TR-11-14 92
the limited number of specific corrosion sites identified by the close inter-val survey and poor pit drainage conditions should be immediately reme-died. A program to inspect for and correct exiting obvious dam-age/deterioration should be implemented. Finally a sustained vigorous maintenance program should be designed and initiated to prevent further deterioration if the Fort Stewart system is to operate optimally in its cur-rent condition.
3.4 Lessons learned
3.4.1 Site selection
The Fort Carson and Stewart studies, performed under separate contracts, illustrate the diversity in size, layout, network layout, component configu-ration, physical condition, installation environment, and base mainte-nance support for Army underground heat distribution systems. In order to perform an effective study of any UHDS, a preliminary site-specific evaluation is first necessary to identify problem areas and to develop a co-ordinated plan for optimizing measurements and scheduled operations. Such preliminary work is important because of the number of interde-pendent tasks involved and the variety of diagnostic processes and equip-ment required to comprehensively document the physical, thermal, and corrosion status of a UHDS. Resources dedicated to performing this kind of preliminary work will produce results tailored to the installation’s spe-cific UHDS network and make it possible to avoid assessment costs im-posed by inefficiency and unnecessary downtime.
The original test plan for both the Fort Carson and Stewart studies was to perform ASHRAE heat-loss calculations based on local soil property data and temperature measurements at selected sites. That portion of the plan was extended to include the installation of heat flux gages directly on con-duit jackets at the visual inspection sites, which were different from the locations used for the ASHRAE calculations. Due to infrastructure conges-tion and a shortage of suitable separate field locations for each task, it was necessary to locate several ASHRAE test and excavation sites adjacent to one another along several conduit runs. Care was taken to space those sites adequately for purposes of data integrity. This approach also made it possible to directly compare results from the two measurement methods.
ERDC/CERL TR-11-14 93
3.4.2 Technology installation
The primary lesson learned in this investigation, which critical for any Army installation planning to construct or rehabilitate a UHDS, is that a sufficient standard of system performance cannot be achieved without strict compliance with applicable Army design specifications plus careful attention to materials selection and construction quality assurance. The researchers found many indications of noncompliant UHDS design and construction quality problems at both installations. Design problems with both subject UHDS systems, such as the lack of sufficient access to many conduit sections, valves, and appurtenances, directly thwarted the applica-tion of standard diagnostic and maintenance procedures. The inability to execute a thorough maintenance program for either system has resulted in rapid, unchecked deterioration of UHDS sections affected by poor con-struction quality. Efforts to correct these problems will be expensive, inva-sive, and disruptive to installation operations.
3.4.3 Pressure test program execution
It was determined that pressurization of each segment to exactly 15.0 psig as a starting point for pressure test measurements was impractical in the field due to the precise level of control that would have required. Initial pressures typically ranged from 15 to 16 psig. To provide a normalized frame of reference for all segments irrespective of the precise initial pres-surization, the research team used a 10% pressure drop over 2 hours as the pass/fail threshold. This criterion was derived from the language in the SOW, which used a 1.5 psig drop from the initial target pressurization val-ue of 15 psig.
Experience acquired during the air pressure tests indicates that the 2 hour test period required by the task contracts is longer than necessary to pro-duce valid results. A 1 hour test period permitting a correspondingly lower pressure loss allowance would have been sufficient for assigning a pass/fail rating to a conduit section.
In retrospect, it is clear that the air pressure test protocol should have at-tempted to account for the different volumes of each conduit section test-ed. The volume of a conduit section depends on the length and inside di-ameter of the piping at various network locations. Identical leaks in both a low-volume and high-volume section of conduit will result in very different percentages of pressure loss over the same period of time. It is understood,

ERDC/CERL TR-11-14 94
however, that determining the volumes of buried conduit sections is nec-essarily inexact without an extensive excavation program, and that would not usually be considered feasible in terms of cost and level of disruption imposed.
ERDC/CERL TR-11-14 95
4 Economic Summary
4.1 Assumptions
Alternative 1: The normal designed service life of a HDS system is 25 years. Between these two system designs one is presumed to need re-placement after 10 years of service. For this comparison the currently in-stalled system is considered as the baseline alternative. It is assumed that for five years prior to replacement that excessive system wide heat loss oc-curs. These losses, over and above normal and designed distribution loss-es, start in year 5 on 5% of the system manholes and associated segments at $338,000 and end in year 9, just prior to replacement, at $676,000 for approximately 10% of the manholes. These values are based on a per man-hole estimate*
Alternative 2: For the same 8 miles of HDS system it is assumed that a more life cycle cost effective choice was originally made. This could be em-bodied as choosing the other of these two design alternatives, or alterna-tively using a previously time-tested and pre-approved design. In this al-ternative it is assumed the system gives reliable and energy efficient service for the entire economic study period.
, times the number of manholes, that has been updated to current energy prices. The system is assumed to be eight miles in extent at a replacement cost of $12.8M. In addition, during the run up to system re-placement an increasing number of leak repairs are required. A one time charge associated with a Winter system outage in year nine is assumed to result in $6M of expenses. These charges include the use of portable boil-ers, emergency repairs, building damage from burst frozen water pipes and disruption in base operations.
4.2 Projected ROI
Using the required OMB spreadsheet, and in accordance with OMB Circu-lar A-94, a discounted return-on-investment (ROI) of 11.86 was calculated. The associated NPV savings were $11.3M. This ROI value is based on cur-rent best practices, as well as projected maintenance and rehabilitation practices and costs. In addition, conservative values for average energy
* “Boiling Manhole Heat-Loss Calculations,” Marsh, Laughton, USACERL Technical Report 98/62 (June
1998).
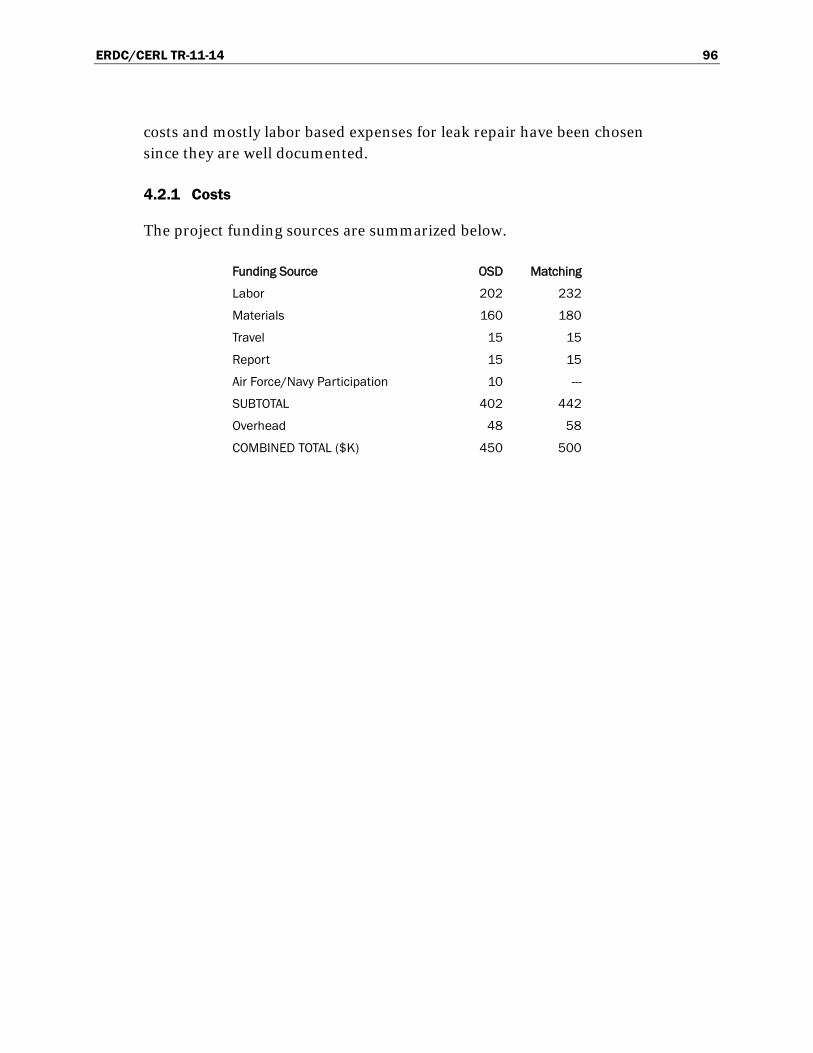
ERDC/CERL TR-11-14 96
costs and mostly labor based expenses for leak repair have been chosen since they are well documented.
4.2.1 Costs
The project funding sources are summarized below.
Funding Source OSD Matching
Labor 202 232
Materials 160 180
Travel 15 15
Report 15 15
Air Force/Navy Participation 10 ---
SUBTOTAL 402 442
Overhead 48 58
COMBINED TOTAL ($K) 450 500
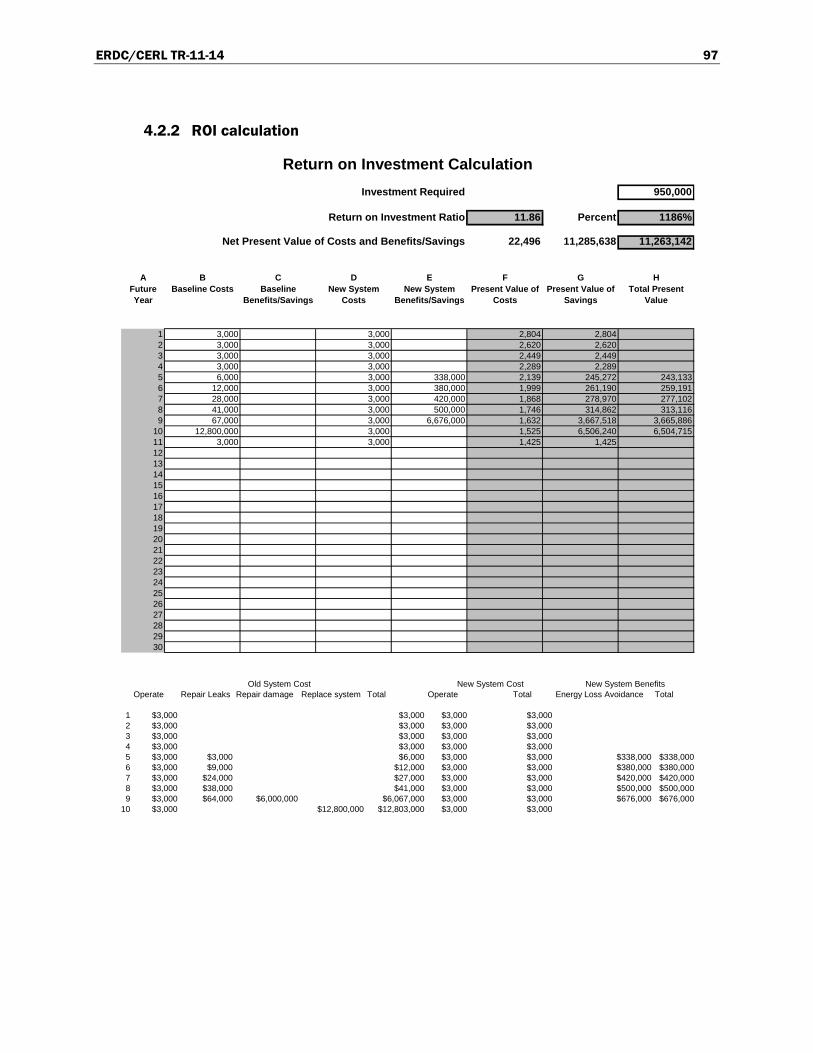
ERDC/CERL TR-11-14 97
4.2.2 ROI calculation
950,000
11.86 Percent 1186%
22,496 11,285,638 11,263,142
A B C D E F G HFuture Year
Baseline Costs Baseline Benefits/Savings
New System Costs
New System Benefits/Savings
Present Value of Costs
Present Value of Savings
Total Present Value
1 3,000 3,000 2,804 2,8042 3,000 3,000 2,620 2,6203 3,000 3,000 2,449 2,4494 3,000 3,000 2,289 2,2895 6,000 3,000 338,000 2,139 245,272 243,1336 12,000 3,000 380,000 1,999 261,190 259,1917 28,000 3,000 420,000 1,868 278,970 277,1028 41,000 3,000 500,000 1,746 314,862 313,1169 67,000 3,000 6,676,000 1,632 3,667,518 3,665,886
10 12,800,000 3,000 1,525 6,506,240 6,504,71511 3,000 3,000 1,425 1,42512131415161718192021222324252627282930
Return on Investment Calculation
Net Present Value of Costs and Benefits/Savings
Return on Investment Ratio
Investment Required
Operate Repair Leaks Repair damage Replace system Total Operate Total Energy Loss Avoidance Total
1 $3,000 $3,000 $3,000 $3,0002 $3,000 $3,000 $3,000 $3,0003 $3,000 $3,000 $3,000 $3,0004 $3,000 $3,000 $3,000 $3,0005 $3,000 $3,000 $6,000 $3,000 $3,000 $338,000 $338,0006 $3,000 $9,000 $12,000 $3,000 $3,000 $380,000 $380,0007 $3,000 $24,000 $27,000 $3,000 $3,000 $420,000 $420,0008 $3,000 $38,000 $41,000 $3,000 $3,000 $500,000 $500,0009 $3,000 $64,000 $6,000,000 $6,067,000 $3,000 $3,000 $676,000 $676,000
10 $3,000 $12,800,000 $12,803,000 $3,000 $3,000
Old System Cost New System Cost New System Benefits
ERDC/CERL TR-11-14 98
5 Conclusions and Recommendations
5.1 Conclusions
Based on these findings (see sections 3.2.5 and 3.3.5), 161 out of 382 seg-ments of this nonstandard UHDS piping design tested failed the air pres-sure tests described in section 2.3. There were some differences between manufacturers, but the trend was in all cases comparable and significant. After no more than one-third of the intended service life, these results rep-resent a 42% failure rate. In addition, preliminary results of the quantita-tive, in-service heat-loss measurements suggest that manufacturer’s esti-mations of thermal performance are optimistic. In one case where both the supply and return lines had failed a conduit air pressure test, there was significantly more heat loss over and above the design value.
During this study, concurrent errors and oversights were found with de-sign, installation, and maintenance. Although not examined in detail, some of these errors could be related to the use of innovative contracting methods where, on the basis of overall, ongoing thermal performance and life-cycle cost, any purported savings may be illusory at best. While it is not possible to wholly blame this poor performance on the nonstandard UHDS piping designs, they are intended for use on typical Army installa-tions within the current environment of design, procurement, installation, operation, and maintenance.
5.2 Recommendations
It is recommended that:
1. Innovative contracting methods should be assessed for actual savings on an overall basis when applied to UHDS piping installation. For first costs, this would include tracking the total expense of needed repairs. The overall life-cycle costs should also be considered.
2. Manufacturer’s assessment of in-service thermal performance should not be relied upon solely for design purposes. Instead, ASHRAE calcu-lation methods using appropriate site-specific factors should be fa-vored.
ERDC/CERL TR-11-14 99
3. Nonstandard UHDS piping design that employs compound insulation and nonmetallic external cladding should not be permitted by design criteria documents.
4. Existing nonstandard UHDS piping systems already installed at Army installations be periodically monitored for performance in service.
5.2.1 Applicability
These recommendations pertain to the specific type of high-temperature UHDS piping designs that, while being drainable, dryable, and air testable nominally in common with the current accepted design, instead use a compound insulation design (i.e., high-temperature insulation within a metal conduit and a lower-temperature insulation located outside a metal conduit) and a non-metallic external cladding material.
5.2.2 Implementation
The controlling criteria documents for UHDS design are Unified Facilities Guide Specification (UFGS) 33 61 13, Pre-Engineered Underground Heat Distribution System; and UFGS 3-4130-01FA (formerly known as Tech-nical Manual TM 5810-17), “Heating and Cooling Distribution Systems” for steam and high-temperature hot water up to 230 °C (450 °F). The non-standard UHDS piping design investigated in this study is not authorized for any application by either of these guide specifications.
In consideration of the findings documented in this investigation, it is rec-ommended that neither UFGS 33 61 13 nor UFGS 3-4130-01FA be amend-ed at this time to permit the use of the subject technology for any applica-tion.
REPORT DOCUMENTATION PAGE Form Approved
OMB No. 0704-0188 Public reporting burden for this collection of information is estimated to average 1 hour per response, including the time for reviewing instructions, searching existing data sources, gathering and maintaining the data needed, and completing and reviewing this collection of information. Send comments regarding this burden estimate or any other aspect of this collection of information, including suggestions for reducing this burden to Department of Defense, Washington Headquarters Services, Directorate for Information Operations and Reports (0704-0188), 1215 Jefferson Davis Highway, Suite 1204, Arlington, VA 22202-4302. Respondents should be aware that notwithstanding any other provision of law, no person shall be subject to any penalty for failing to comply with a collection of information if it does not display a currently valid OMB control number. PLEASE DO NOT RETURN YOUR FORM TO THE ABOVE ADDRESS. 1. REPORT DATE (DD-MM-YYYY)
June 2011 2. REPORT TYPE
Final 3. DATES COVERED (From - To)
4. TITLE AND SUBTITLE
In Situ Corrosion and Heat Loss Assessment of Two Nonstandard Underground Heat Distribution System Piping Designs: Final Report on Project F07-AR01
5a. CONTRACT NUMBER
5b. GRANT NUMBER
5c. PROGRAM ELEMENT NUMBER
6. AUTHOR(S) Alfred D. Beitelman, Charles P. Marsh, Douglas Neale, Vernon Meyer, John Taylor, David Butler, Forest Mandan, Lawrence Clark, and Thomas A. Carlson
5d. PROJECT NUMBER
5e. TASK NUMBER
5f. WORK UNIT NUMBER
7. PERFORMING ORGANIZATION NAME(S) AND ADDRESS(ES) U.S. Army Engineer Research and Development Center Construction Engineering Research Laboratory P.O. Box 9005 Champaign, IL 61826-9005
8. PERFORMING ORGANIZATION REPORT NUMBER
ERDC/CERL TR-11-14
9. SPONSORING / MONITORING AGENCY NAME(S) AND ADDRESS(ES) Office of the Secretary of Defense (OUSD(AT&L)) 3090 Defense Pentagon Washington, DC 20301-3090
10. SPONSOR/MONITOR’S ACRONYM(S) OSD
11. SPONSOR/MONITOR’S REPORT NUMBER(S)
12. DISTRIBUTION / AVAILABILITY STATEMENT Approved for public release; distribution is unlimited.
13. SUPPLEMENTARY NOTES This report is published in two volumes. Testing data and other appendices are collected in a separate supplement to the main re-port.
14. ABSTRACT The objective of this project was to assess the performance of nonstandard underground heat distribution system (UHDS) designs being implemented at various Department of Defense (DoD) installations. These systems incorporate nonmetallic cladding and alternative insulation materials that are advertised to improve energy conservation and corrosion resistance, but they deviate from established guide specifications for UHDS. The ongoing reliable operation of UHDS on military installations is mission-critical, and service interruptions can have adverse and extended negative mission impacts. This report documents the assessment of two similar nonstandard UHDS piping system designs — one at Fort Carson, CO, and one at Fort Stewart, GA. The study consisted of environmental corrosivity tests, air pressure tests, visible inspection of excavated sections, and heat loss evaluation using two methods. Deficiencies in design, installation, and accessibility for maintenance were recorded, and significantly degraded sections were documented. Recommendations for addressing site-specific deficiencies are offered, and supporting technical discussions are provided. Overall, it is advised that these systems not be recommended or al-lowed in guide specifications and criteria. When more in-service experience is amassed, a second assessment may be merited.
15. SUBJECT TERMS military installations, underground heat distribution systems (UHDS), performance, guide specifications, design evaluation, Fort Carson, CO, Fort Stewart, GA
16. SECURITY CLASSIFICATION OF: 17. LIMITATION OF ABSTRACT
18. NUMBER OF PAGES
19a. NAME OF RESPONSIBLE PERSON
a. REPORT
Unclassified
b. ABSTRACT
Unclassified
c. THIS PAGE
Unclassified 719 19b. TELEPHONE NUMBER (include area code)
Standard Form 298 (Rev. 8-98) Prescribed by ANSI Std. 239.18