Embed Size (px)
Citation preview

ERD
C/G
SL T
R-15
-22
Impact of Steel Fiber Size and Shape on the Mechanical Properties of Ultra-High Performance Concrete
Geo
tech
nica
l and
Str
uctu
res
Labo
rato
ry
Dylan A. Scott, Wendy R. Long, Robert D. Moser, Brian H. Green, James L. O’Daniel, and Brett A. Williams
August 2015
Approved for public release; distribution is unlimited.

The U.S. Army Engineer Research and Development Center (ERDC) solves the nation’s toughest engineering and environmental challenges. ERDC develops innovative solutions in civil and military engineering, geospatial sciences, water resources, and environmental sciences for the Army, the Department of Defense, civilian agencies, and our nation’s public good. Find out more at www.erdc.usace.army.mil.
To search for other technical reports published by ERDC, visit the ERDC online library at http://acwc.sdp.sirsi.net/client/default.

ERDC/GSL TR-15-22 August 2015
Impact of Steel Fiber Size and Shape on the Mechanical Properties of Ultra-High Performance Concrete
Dylan A. Scott, Wendy R. Long, Robert D. Moser, Brian H. Green, James L. O’Daniel, and Brett A. Williams Geotechnical and Structures Laboratory U.S. Army Engineer Research and Development Center 3909 Halls Ferry Road Vicksburg, MS 39180-6199
Final report Approved for public release; distribution is unlimited.
Prepared for Headquarters, U.S. Army Corps of Engineers Washington, DC 20314-1000
Under TSWG Ultra-High Performance Concrete Project

ERDC/GSL TR-15-22 ii
Abstract
This investigation focused on identifying the impact of various steel fiber types, including size and shape, on the mechanical responses of an ultra-high performance concrete (UHPC) known as Cor-Tuf Baseline (CTB). CTB specimens were fabricated with four fiber types. The experimental program included testing for quasi-static and dynamic properties, focusing on penetration resistance. Fiber shape and size had a limited impact on quasi-static properties in compression but had a significant impact on quasi-static tensile properties and dynamic penetration resistance. The smaller fibers exhibited up to a 100 percent increase in tensile strength compared with their larger counterparts. However, the benefits offered by the smaller fibers primarily occurred prior to reaching the ultimate load carrying capacity. Once the ultimate strength was reached, larger fibers were more effective at bridging larger cracks. The smaller fibers also provided improved penetration resistance, with reduced residual projectile velocities and loss of material from cratering and/or spallation. Fiber shape and size did not have an impact on the transition between projectile perforation and nonperforation. The results provide insights into optimal fiber reinforcement and potential strategies to further improve the properties of UHPCs, make fiber-reinforced UHPCs more cost competitive by altering fiber dosage rates, and develop hybrid reinforcement schemes.
DISCLAIMER: The contents of this report are not to be used for advertising, publication, or promotional purposes. Citation of trade names does not constitute an official endorsement or approval of the use of such commercial products. All product names and trademarks cited are the property of their respective owners. The findings of this report are not to be construed as an official Department of the Army position unless so designated by other authorized documents. DESTROY THIS REPORT WHEN NO LONGER NEEDED. DO NOT RETURN IT TO THE ORIGINATOR.

ERDC/GSL TR-15-22 iii
Contents Abstract .......................................................................................................................................................... ii
Figures and Tables ........................................................................................................................................ iv
Preface ............................................................................................................................................................ vi
Unit Conversion Factors .............................................................................................................................vii
1 Introduction ............................................................................................................................................ 1 1.1 Background .................................................................................................................... 1 1.2 Cor-Tuf baseline UHPC ................................................................................................... 2 1.3 Scope ............................................................................................................................. 4
2 Experimental Program ......................................................................................................................... 5 2.1 Steel fiber types ............................................................................................................. 5 2.2 Experimental methods .................................................................................................. 8
2.2.1 Compression: Strength, elastic modulus, and Poisson’s ratio ................................. 8 2.2.2 Flexural response ........................................................................................................ 8 2.2.3 Splitting tensile strength ........................................................................................... 10 2.2.4 Direct tensile testing ................................................................................................. 10 2.2.5 Dynamic penetration using fragment simulating projectiles .................................. 13
3 Quasi-Static Test Results and Discussion ...................................................................................... 17 3.1 Compressive strength ................................................................................................. 17 3.2 Elastic modulus and Poisson’s ratio........................................................................... 17 3.3 Flexural response ........................................................................................................ 18 3.4 Splitting tensile strength ............................................................................................. 20 3.5 Direct tensile testing.................................................................................................... 20
4 Dynamic Test Results and Discussion ............................................................................................ 24
5 Summary and Conclusions ............................................................................................................... 28
References ................................................................................................................................................... 30
Appendix A: Fiber Data Sheets ................................................................................................................ 32
Appendix B: DTT Specimens Pretest/Posttest ..................................................................................... 36
Appendix C: FSP Test Results ................................................................................................................... 37
Report Documentation Page

ERDC/GSL TR-15-22 iv
Figures and Tables
Figures
Figure 1. Fiber types investigated. ............................................................................................................... 6 Figure 2. Cross sections of UHPCs illustrating differences in fiber distribution. ................................... 7 Figure 3. ASTM C873 unconfined compressive strength test setup. ..................................................... 9 Figure 4. ASTM C469 elastic modulus and Poisson’s ratio test setup. .................................................. 9 Figure 5. ASTM C1609 flexural strength test setup. ............................................................................... 10 Figure 6. ASTM C496 splitting tensile strength test setup. .................................................................... 10 Figure 7. DTT coupon geometry and test setup (adapted from JSCE 2008). ...................................... 11 Figure 8. DTT testing configuration. ........................................................................................................... 12 Figure 9. Typical result of DTT with tensile fracture and fiber alignment in gage length. ................... 13 Figure 10. 0.50-cal FSP used in experiments shown before and after testing (i.e., undeformed and deformed). ...................................................................................................................... 14 Figure 11. Physics Applications Inc. small-arms receiver used to fire the projectiles. ....................... 14 Figure 12. Schematic of ballistic penetration test setup (1 in.=25 mm). ............................................ 15 Figure 13. Side view of fixture used to hold UHPC test panels. ............................................................. 15 Figure 14. Front view of panel within fixture. ............................................................................................ 16 Figure 15. Typical failure observed following compressive strength testing. ....................................... 18 Figure 16. Flexural response stress vs. strain on tensile face. .............................................................. 19 Figure 17. Stress vs. strain DTT results for mold-cast specimens that exhibited longitudinal fiber orientation. ........................................................................................................................................... 21 Figure 18. Stress vs. strain DTT results for specimens that were cut from larger flexural beams to minimize preferential fiber orientation. ................................................................................... 22 Figure 19. Summary of DTT results with comparison between specimens that were cast vs. those that were cut from larger flexural beams. ................................................................................ 23 Figure 20. Typical damage to 1.0-in. (25-mm-) thick panel, showing impact and exit faces with full penetration by the FSP used in testing. ...................................................................................... 24 Figure 21. Typical damage to 2.0-in. (50-mm-) thick panel, showing impact and exit faces with full penetration by the FSP used in testing. ...................................................................................... 25 Figure 22. Typical damage to 2.5-in. (63-mm-thick panel showing impact and exit faces with no penetration by the FSP used in testing. Spallation of material was observed on the back/exit faces of the panels. .................................................................................................................... 25 Figure 23. Typical damage to 3.0-in. (76-mm-) thick panel, showing impact and exit faces with no penetration by the FSP used in testing. No spallation was observed on the back/exit faces of panels. ........................................................................................................................... 26 Figure 24. Average residual velocities (ft/s) for 1.0-in. (25-mm-) thick panels. .................................. 26 Figure 25. Average residual velocities (ft/s) for the 2.0-in. (50-mm-) thick panels. ........................... 27 Figure 26. Percent weight loss for each fiber type and panel thickness. ............................................. 27 Figure A1. Technical data sheet for ZP 305 fiber. .................................................................................... 32 Figure A2. Technical data sheet for Nycon Type V fiber. ......................................................................... 33

ERDC/GSL TR-15-22 v
Figure A3. Technical data sheet for OL 6-mm/0.16mm fiber. ............................................................... 34 Figure A4. Technical data sheet for OL 10-mm/0.2mm fiber. ............................................................... 35 Figure B1. DTT specimens cut using waterjet from larger flexural beams prior to testing. ............... 36 Figure B2. DTT test specimens following testing. .................................................................................... 36
Tables
Table 1. CTB mixture proportion. .................................................................................................................. 3 Table 2. Overview of experimental program. .............................................................................................. 5 Table 3. Tensile strength and cost of fiber types investigated. ................................................................ 8 Table 4. ASTM C873 UCS testing results. ................................................................................................. 17 Table 5. ASTM C469 elastic modulus testing results. ............................................................................. 18 Table 6. ASTM C496 splitting tensile strength test results..................................................................... 20 Table 7. DTT results from specimens cast in molds. ............................................................................... 21 Table 8. DTT results from specimens cut using a waterjet from larger flexural beams...................... 22
ERDC/GSL TR-15-22 vi
Preface
This study was conducted for the Technical Support Working Group (TSWG). The technical monitor was James L. O’Daniel.
The work was performed by the Concrete and Materials Branch (CMB) of the Engineering Systems and Materials Division (ESMD) and Structural Mechanics Branch (SMB) of Geosciences and Structures Division (GSD), U.S. Army Engineer Research and Development Center, Geotechnical and Structures Laboratory (ERDC-GSL). At the time of publication, Christopher M. Moore was Chief, CMB; Brad Steed was Acting Chief, SMB; Dr. Larry N. Lynch was Chief, ESMD; Bartley P. Durst was Chief, GSD; and Pamela Kinnebrew was the Technical Director for Military Engineering. The Acting Deputy Director of ERDC-GSL was Dr. Gordon W. McMahon, and the Acting Director was Dr. William P. Grogan.
LTC John T. Tucker III was the Acting Commander of ERDC, and Dr. Jeffery P. Holland was the Director.

ERDC/GSL TR-15-22 vii
Unit Conversion Factors
Multiply By To Obtain
cubic feet 0.02831685 cubic meters
cubic yards 0.7645549 cubic meters
degrees Fahrenheit (F-32)/1.8 degrees Celsius
feet 0.3048 meters
gallons (US liquid) 3.785412 E-03 cubic meters
inches 0.0254 meters
mils 0.0254 millimeters
ounces (mass) 0.02834952 kilograms
ounces (US fluid) 2.957353 E-05 cubic meters
pounds (force) 4.448222 newtons
pounds (force) per foot 14.59390 newtons per meter
pounds (force) per inch 175.1268 newtons per meter
pounds (force) per square inch 6.894757 kilopascals
pounds (mass) 0.45359237 kilograms
pounds (mass) per cubic foot 16.01846 kilograms per cubic meter
pounds (mass) per square foot 4.882428 kilograms per square meter
yards 0.9144 meters

ERDC/GSL TR-15-22 1
1 Introduction
1.1 Background
Ultra-high performance concrete (UHPC) is a family of materials that typically exhibit compressive strengths in excess of 21,000 psi (150 MPa) and high durability due to negligible interconnected porosity. High toughness is achieved with the addition of fiber reinforcement. UHPC formulations generally consist of a high cementitious content incorporating oil-well or low-heat portland cement (i.e., with large mean particle size, high C2S content, and low C3A content), siliceous or aluminous fine aggregates, crushed quartz or some other micrometer-sized powder, silica fume, water, high-range water-reducing admixtures to control rheology, and other components that vary by manufacturer. With the high compressive strengths of UHPC comes brittle behavior similar to that of a ceramic material. To overcome this brittle behavior, steel fiber reinforcement is commonly used. The addition of steel fiber reinforcement aids in delocalizing micro- and macro-scale cracking and leads to improvements in tensile properties (e.g., tensile strength and flexural response) and minimized spallation during failure.
Various UHPC formulations exist, with the majority being developed by manufacturers. The matrices (i.e., the portions of the UHPC excluding the fiber reinforcement) are generally similar in composition and basic mechanical properties, such as compressive and tensile strength. The variations observed in UHPC failure morphology when subjected to extreme loading events are hypothesized to largely be related to the steel fiber reinforcement--including its strength, length and diameter-- and any deformations present that provide mechanical interlock with the matrix. Common steel fibers used in various UHPC formulations include the following:
• Straight brass-coated steel with lengths of 10 to 13 mm, diameters of approximately 0.2 mm, and tensile strengths in excess of 300,000 psi (2070 MPa).
• Hooked-end steel fibers with lengths of 25 to 30 mm, diameters of approximately 0.5 mm, and tensile strengths in excess of 150,000 psi (1030 MPa).

ERDC/GSL TR-15-22 2
Many other fiber types, such as undulated/wavy steel fibers and steel fibers with a helical twist, are also viable options for use in UHPCs. In both cases, the primary goal is for the mechanical interlock between the fiber and the UHPC matrix to aid in the engagement of the fiber and the delocalization of damage.
While many UHPC/fiber combinations are commercially available or produced in-house, there has been only limited study of the impact of steel fiber characteristics (i.e., size, shape, and tensile properties) on the mechanical response of UHPC when the same matrix is used.
1.2 Cor-Tuf baseline UHPC
As previously described, many UHPC formulations exist, including those available from commercial vendors and those developed in-house. Cor-Tuf Baseline (CTB) is one formulation of UHPC developed by engineers at the U.S. Army Engineer and Research Development Center (ERDC) under the name Cor-Tuf. This family of UHPCs is a result of more than three decades of work and investigation into the use of UHPCs and the creation of subsequent adaptations to better suit the material for a variety of applications for both military and civil infrastructures.
Stemming from research in the late 1980s and early 1990s, CTB is a generalized version of Cor-Tuf that utilizes knowledge gained from previously developed technologies such as Reactive Powder Concrete (RPC) 200 and Very-High-Strength Concrete (VHSC). RPC 200 was developed by Bouygues S.A. and first documented by Richard and Cheyrezy (1995). ERDC researchers Roy L. Campbell Sr. and Edward F. O’Neil investigated this UHPC in 1998 (Campbell et al. 1998). These UHPC mixtures were designed and produced with all the constituent materials (excluding fibers) being “powder-sized.” VHSC was first documented and developed by Donald M. Walley and Billy D. Neeley of the then Concrete and Materials Division in and prior to 1995 (Neeley and Walley 1995). VHSC differed from the RPC mixtures by its use of fine aggregates that meet the gradation requirements for concrete sand. In the late 1990s, VHSC continued to be refined and optimized by ERDC researchers Dr. Edward O’Neil and Dr. Beverly DiPaolo and gave rise to the UHPC family of Cor-Tuf (O’Neil 2008). A more detailed history of each of these mixtures can be found in Green et al. (2013).
Green et al. detailed CTB as being “developed to serve as, and is currently considered by ERDC to be, a ‘laboratory standard’ UHPC mixture, that can

ERDC/GSL TR-15-22 3
be reproduced for various projects and exhibit the same physical properties with minimal batch-to-batch variability” (O’Neil 2008). CTB’s constituent materials (excluding fibers) include a Type H oil-well cement, silica fume, silica sand, crushed silica sand (also known as silica flour), and a polycarboxylate type high-range water-reducing admixture (HRWRA). These are brand specified materials at specified proportions that allow for a highly reproducible mixture with little variability between mixtures. Table 1 shows the mixture proportions for CTB.
Table 1. CTB mixture proportion.
Material Proportion by Weight
Cement 1.00
Silica Fume 0.389
Silica Flour 0.277
Silica Sand 0.967
HRWRA 0.0171
Water 0.208
Steel Fibers 0.310
CTB typically has an unconfined compressive strength (UCS) between 28 and 32 ksi (193 to 220 MPa) and a density of approximately 160 lb/ft3 (2563 kg/m3). With this high strength, CTB (as well as most other UHPCs) has a high brittleness that can be counteracted by the inclusion of randomly distributed steel fibers.
Up to this point, the only steel fiber included in CTB was the ZP 305 fiber produced by the Bekaert Corporation. This fiber has recently been renamed as 3D 55/30 BG fiber in order to coincide with the Bekaert Corporation’s recently released brands of fibers. The fiber itself is 0.022 in. (0.55 mm) in diameter and 1.18 in. (30 mm) in length with hooked ends and is included into CTB mainly because of its relatively low cost and easy attainability. Mechanical testing performed at ERDC by Roth et al. (2010) compared the compressive, flexural, and splitting tensile properties of CTB with and without the inclusion of the ZP 305 fibers. The results of this testing showed that when steel fibers were included in the Cor-Tuf matrix, a slight increase occurred in compressive strength, a 162 percent increase occurred in flexural strength, and a 240 percent increase occurred in splitting tensile strength. An improvement in the mode of failure was also observed. CTB without fibers resulted in a catastrophic and brittle

ERDC/GSL TR-15-22 4
failure as opposed to the CTB with fiber matrix that held together after fracture and absorbed more energy.
These results proved that a randomly distributed steel fiber-reinforced UHPC matrix is far superior to a UHPC matrix without fibers. However, little to no work has been done to provide insight into how the size and shape of steel fiber reinforcement could change the behavior of a UHPC matrix as a whole.
1.3 Scope
In order to address the dearth of information relating the characteristics of steel fiber reinforcement to the mechanical properties of high-strength concretes, this study investigated four commercially available off-the-shelf steel fibers in a consistent CTB matrix. These fibers consisted of two brass-coated straight fibers, a hooked-end fiber, and an undulated fiber. The experimental program investigated quasi-static properties including UCS, elastic modulus and Poisson’s ratio, flexural response, splitting tensile strength, and direct tensile strength. Dynamic testing included penetration testing using fragment simulating projectiles (FSPs). The overall goal of the study was to identify the relationships between fiber characteristics and the multistrain rate response of UHPCs in order to better optimize fiber reinforcement for various loading conditions.

ERDC/GSL TR-15-22 5
2 Experimental Program
All tested specimens utilized a consistent UHPC matrix of the CTB formulation. Keeping the UHPC matrix constant ensured that a direct comparison could be made between fiber types. Part of this procedure included a consistent curing regime and testing age of each of the four test matrices. The curing regime consisted of seven days of 72°F curing inside a fog room with 100 percent humidity followed by seven days of steam curing at a temperature of 190°F (90°C). The testing age of each CTB matrix was between 26 and 29 days. The slight variance in age was due to the large amount of testing that was conducted and the limited amount of testing equipment. This age variance should have had little effect on test results.
Testing of specimens was performed at quasi-static and dynamic strain rates using the methods described in the following sections. The overall scope of the experimental program is shown in Table 2.
Table 2. Overview of experimental program.
Experiments for each UHPC - Fiber combination
Test Method Notes
Compressive Strength Unconfined compressive strength of 4- by 8-in. cylinders
Flexural Response Flexural testing of 6- by 6- by 21-in. beams
Split Tensile Splitting tensile strength of 4- by 8-in. cylinders
Direct Tensile Testing Direct tensile testing of water-jet cut-out and cast dog bone samples
Elastic Modulus/Poisson's ratio
Elastic modulus test of 6- by 12-in. cylinders using LVDTs
FSP / Penetration FSP testing of 2-in.-, 2.5-in.-, and 3-in.-thick panels
Note: The target for all testing was ~28-day mechanical properties.
2.1 Steel fiber types
This section will discuss all of the fiber types, the intent of their design, and their possible effects on the CTB matrix. Additional details including data sheets from manufacturers are in Appendix A. The fibers included in this report are the ZP 305 (Bekaert Co.), the Nycon Type V (Nycon Co.), the OL 0.2/10mm (Bekaert Co.), and the OL 0.16/6mm (Bekaert Co.). These fibers are shown in Figure 1.

ERDC/GSL TR-15-22 6
Figure 1. Fiber types investigated.
(a) ZP-305 (aka 3D 55/30 BG).
(b) Nycon Type V.
(c) OL 0.2/10 mm.
(d) OL 0.16/6 mm.
The ZP 305 (3D 55/30 BG) fiber previously discussed is currently the standard fiber used in the CTB matrix. This fiber is 30 mm long and 0.5 mm in diameter. The hooked ends of these fibers are designed to “anchor” into the concrete specimen; and, as the specimen fractures, these hooks/anchors cause the fiber to stretch and eventually fail under tension in the midsection of the fiber. This failure mode sounds effective in theory (and some of the fibers do fail this way), but due to the brittleness of CTB, a large portion of the matrix appears to crumble around the fibers’ hooked ends upon fracture. This suggests that a weak Interfacial Transition Zone (ITZ) exists between steel fibers and UHPCs.

ERDC/GSL TR-15-22 7
The Nycon Type V is an undulated (wavy) low-carbon steel fiber, which is 1.5 in. (38 mm) long and has a 0.046-in. (1.18-mm) filament. Instead of using the hooked ends to anchor the fiber, the waves are designed to straighten as the matrix begins to fail and the fiber begins to pull out. These waves result in higher fiber pullout strengths that allow for more slippage, thus making the entire material more ductile. This fiber encounters some of the same problems as the ZP 305. A weak ITZ between the fiber and the CTB/UHPC matrix leads to many of the fiber waves’ being rendered useless due to a material crumbling around the fiber.
The next two fiber types are small, straight, brass-coated steel fibers. The Bekaert OL .2/10mm fiber is 0.008 in. (0.2 mm) in diameter and is 0.39in. (10 mm) in length. The Bekaert OL .16/6mm fiber was 0.0063 in. (0.16 mm) in diameter and 0.24 in. (6 mm) in length. The possible advantages of these fibers are their high surface area and small volume. Since fiber dosages are made on a standard percent by weight basis, replacement of larger fibers such as ZP 305s with smaller OL fibers results in a greater density of fibers dispersed in the UHPC matrix. The high-surface areas make it more likely that, upon failure, the crack propagation will encounter several fibers and possibly stop the fracture. Figure 2 shows cutouts of the flex beams that help to illustrate this point. The disadvantage of these fibers is their short length. The shorter lengths make the fiber unable to “bridge” a crack upon significant failure. These shorter OL fibers could be beneficial in the micro-cracking regime, but their inability to bridge a macro-crack renders them useless. Binary and ternary fiber blends of smaller and larger sizes could provide benefits for both micro- and macro-cracking.
Figure 2. Cross sections of UHPCs illustrating differences in fiber distribution.
(a) OL 6 mm fiber.
(b) Nycon Type V fiber.

ERDC/GSL TR-15-22 8
Table 3 shows each fiber’s tensile strength and respective cost. The Nycon fibers are the least expensive, while the OL fibers are most expensive at about one dollar per pound more than the ZP 305. Therefore, it will be hard to fiscally justify use of the OL fibers. However, single companies provided these costs, and it is likely possible to find different sources with lower costs.
Table 3. Tensile strength and cost of fiber types investigated.
Fiber Type Tensile Strength (ksi) Cost ($/lb)
Bekaert ZP 305 195 1.18
Nycon Type V 100 0.87
Bekaert OL 0.2/10mm 370 2.45
Bekaert OL 0.16/6 mm 370 2.45
2.2 Experimental methods
2.2.1 Compression: Strength, elastic modulus, and Poisson’s ratio
The UCS and elastic modulus/Poisson’s ratio (E&P) testing was performed to ensure that each CTB matrix met the first condition of the testing procedure. These test methods and all subsequent test methods were followed strictly and consistently to ensure that the second testing condition was met. The UCS and E&P tests were conducted according to ASTM C873 (ASTM International 2010a) and ASTM C469 (ASTM International 2010b), respectively. Photographs of the test setups are in Figures 3 and 4, respectively. Collecting quality data for the Poisson’s ratios proved difficult, as the high hardness of the CTB made it difficult for the modulus testing apparatus to sit securely on the test specimen throughout the entire testing procedure, resulting in slip during the test. This will be discussed further in the results section.
2.2.2 Flexural response
The flexural response testing was performed according to ASTM C1609 (ASTM International 2012). This test used a beam with four-point loading. The cast beams were 6 by 6 by 21 in. (150 by 150 by 500 mm) and were cast according to ASTM C192 (ASTM International 2013). They were tested on an 18-in. (450-mm) support span. Linear variable differential transformers (LVDTs) were used to measure center-line displacement that was in turn paired with the corresponding load data to provide a plot of load versus displacement. Figure 5 shows this testing setup, both pre-test and post-test.

ERDC/GSL TR-15-22 9
Figure 3. ASTM C873 unconfined compressive strength test setup.
Figure 4. ASTM C469 elastic modulus and Poisson’s ratio test setup.

ERDC/GSL TR-15-22 10
Figure 5. ASTM C1609 flexural strength test setup.
(a) Prior to testing.
(b) Failed specimen.
2.2.3 Splitting tensile strength
Splitting tensile strengths were obtained according to ASTM C496 (ASTM International 2011). Testing was performed for each material type and then subsequently compared to that material’s UCS. Figure 6 shows the splitting tensile testing set-up, both pretest and posttest.
Figure 6. ASTM C496 splitting tensile strength test setup.
(a) Prior to testing.
(b) Failed specimen.
2.2.4 Direct tensile testing
The direct tensile testing (DTT) is an ERDC-specific test that was adapted from a 2008 Japanese Society of Civil Engineers, Concrete Engineering Series 82 (JSCE 2008). This testing procedure consists of taking a dog-bone-shaped specimen with cross-sectional dimensions of 1.18 by 1.18 in.

ERDC/GSL TR-15-22 11
(30 by 30 mm) in the gage length and applying a constant specimen deformation rate of approximately 0.02 in. (0.5 mm)/min with two LVDTs on diagonally opposite corners of the gage length in order to capture the complete displacement in all directions. Each specimen was tested with a gage length of 4 in. (101.6 mm). Figure 7 shows a diagram of the dog-bone shape and test setup.
Figure 7. DTT coupon geometry and test setup (adapted from JSCE 2008).
Multiple dog-bone specimens were made in two different methods. First, specimens were cast in molds with the specified dog-bone shape. This method proved easy and effective during placement; however, fiber-alignment became a real concern particularly for fibers with lengths in excess of 1 in. (25 mm). The molds were causing fibers to align along the long axis to which the tensile stress would be applied during testing. This could result in a tendency for higher DTT strengths. The second method consisted of casting large flexural beams, cutting slabs from these beams to the specified thickness, and using a water jet to cut out the dog-bone shape from the slabs. This method avoided the problem of fiber alignment,

ERDC/GSL TR-15-22 12
but due to small “waves” caused by the water jetting process, there was a possibility of stress concentrations occurring around the test section and causing a tendency for lower DTT strength results. These concerns will be further discussed in the results section.
Figures 8 and 9 show the actual test configuration, pretest and posttest, respectively. This configuration utilized a chucking mechanism suited to the shape of each specimen and was designed to allow tensile loading along the specimen’s central axis. The top chuck utilized one rotational degree of freedom to allow better vertical alignment, while the bottom chuck utilized a torsional degree of freedom to prevent torsional stresses caused by possible grip misalignment.
Figure 8. DTT testing configuration.

ERDC/GSL TR-15-22 13
Figure 9. Typical result of DTT with tensile fracture and fiber alignment in gage length.
2.2.5 Dynamic penetration using fragment simulating projectiles
Direct fire experiments were conducted using a 0.50-caliber fragment simulating projectile (FSP) to examine the resistance of the UHPC panels to small projectile penetration. A single projectile was fired at each panel with approximately the same impact velocity in each test. Each direct fire experiment measured impact velocity, the residual velocity of the projectile in the event of perforation, and the final damage state of the target. Multiple posttest photographs of each panel were obtained to record the final damage state. Figure 10 shows an example of the FSP, both un-deformed pretest and deformed posttest. Samples of the UHPC panels were cast to a uniform 12-in. by 12-in. size with thicknesses of 1.0, 2.0, 2.5, and 3.0 in. A set of three panels was generated for each thickness, resulting in 12 panels for each fiber type. The desired impact velocity was approximately 3,500 ft/sec. This combination of panel thicknesses and impact velocity was chosen because it had previously generated damage states and responses that varied from complete perforation of the panel to only e cratering of the impact side of the panel (Reinhart and Thornhill 2010). All direct fire experiments were conducted in ERDC’s small-arms ballistic testing facility. This included a cartridge preparation area that contained the proper equipment to hand load numerous cartridges. The range from muzzle to target in this experimental program was approximately 15 ft. A Physics Applications Inc. small-arms receiver with a sliding return-to-zero base,

ERDC/GSL TR-15-22 14
shown in Figure 11, was used to fire the projectiles. The gun included a 60-in. smooth bore barrel and was cartridge fired. It could accommodate round sizes ranging from .22 caliber to 20 mm.
Figure 10. 0.50-cal FSP used in experiments shown before and after testing (i.e., undeformed and deformed).
(a) Undeformed FSP.
(b) Deformed FSP.
Figure 11. Physics Applications Inc. small-arms receiver used to fire the projectiles.
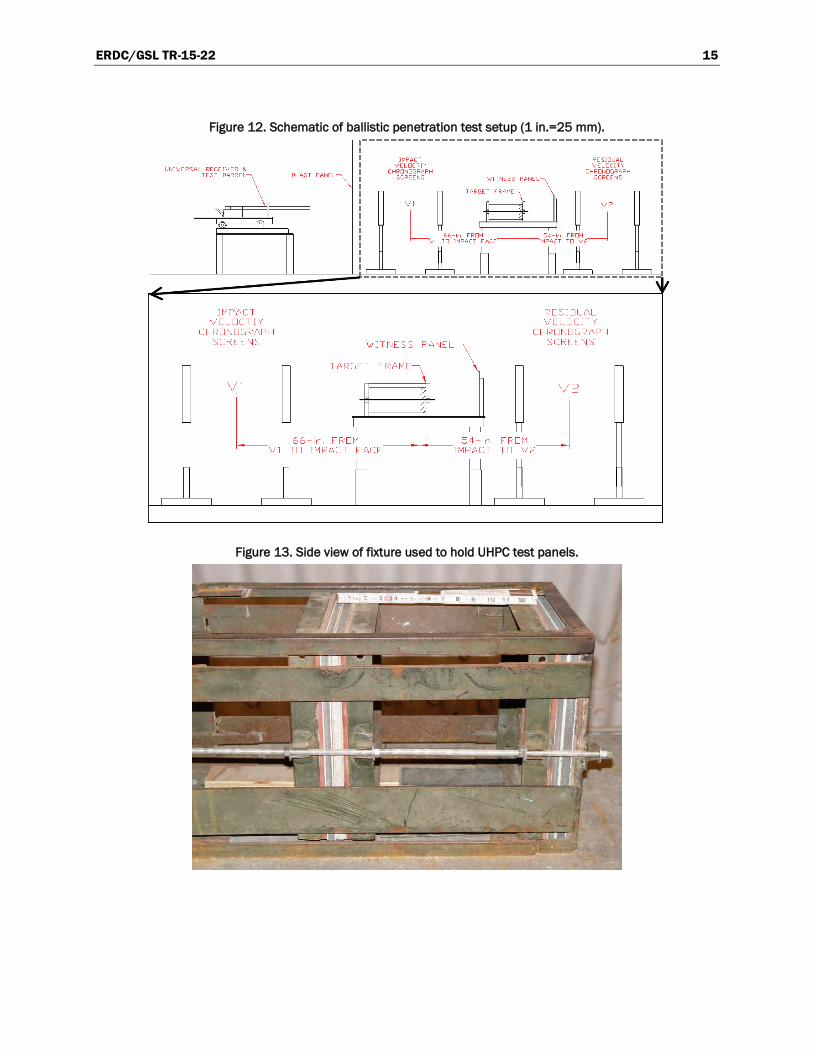
Projectile velocity measurements were made using a set of Oehler Research, Inc. Model 35P proof chronographs, each connected to two Oehler Model 55 light screens. The light screens attached to each chrono-graph were positioned 3 ft apart to capture projectile velocities. Four chronograph screens were positioned between the gun and the target to estimate the impact velocity. The velocity was measured between pairs of the screens, and an estimated impact velocity was generated for each test based on these measurements. A single pair of screens was positioned approximately 4 ft behind the test specimens, as shown in Figure 12, to measure exit (residual) velocities for each experiment. All experiments were conducted with 0-deg obliquity, or perpendicular impact.
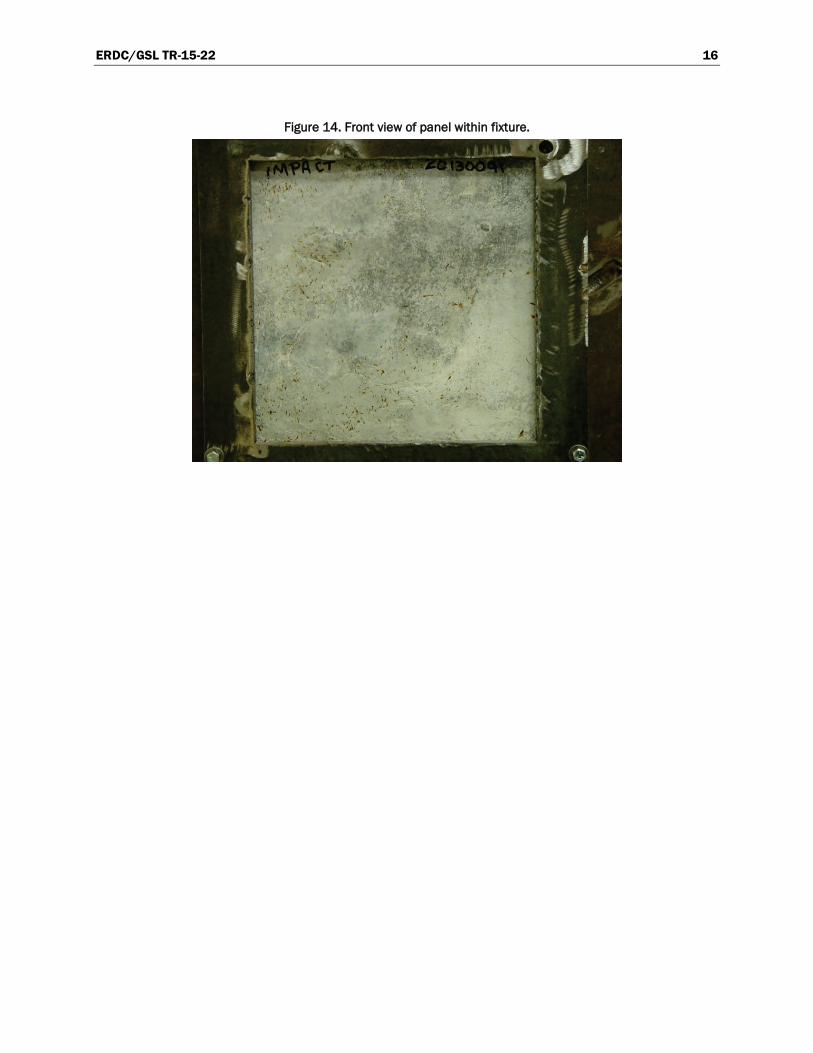
Samples were mounted in a rigid steel fixture (Figure 13). Panels were held in position by tension in a threaded rod. Contact stresses between the panels and the fixture were reduced by rubber padding. Figure 14 shows the front view, or impact face, of a typical target.
ERDC/GSL TR-15-22 15
Figure 12. Schematic of ballistic penetration test setup (1 in.=25 mm).
Figure 13. Side view of fixture used to hold UHPC test panels.
ERDC/GSL TR-15-22 16
Figure 14. Front view of panel within fixture.

ERDC/GSL TR-15-22 17
3 Quasi-Static Test Results and Discussion
3.1 Compressive strength
As discussed in the testing procedures section, the UCS and E&P results were used to verify that each CTB matrix (excluding fibers) was consistent so that a direct comparison could be made between steel fiber types. Table 4 shows the results of the ASTM C873 (ASTM International 2010a) testing. It can be seen that all of the compressive strengths are similar. UHPC specimens containing the Nycon fibers resulted in lower strengths of about 26 ksi (179 MPa). There are several potential reasons for this occurrence: possible batching errors, possible cylinder casting errors, or the size of the fiber itself. The larger and relatively wider fiber has a larger ITZ that could provide a large enough failure plane during loading at high stresses that the material actually shows a lower strength. However, further testing is needed to draw that conclusion.
Table 4. ASTM C873 UCS testing results.
Unconfined Compressive Strength (psi)
Fiber Type ZP305 NYCON OL 6 mm OL 10 mm
Sample 1 29910 26900 29570 31580
Sample 2 28860 24240 30890 30770
Sample 3 29320 26490 30500 31580
Avg. 29363 25877 30320 31310
Upon failure by compression, a majority of the cylinders containing the shorter OL fibers failed catastrophically on a shear plane. While all the cylinders that contained longer fibers held together, the cylinders with the shorter fibers failed diagonally. Figure 15 shows these failures.
3.2 Elastic modulus and Poisson’s ratio
The E&P testing performed according to ASTM C469 (ASTM International 2011) provided similar elastic modulus results for all fiber types. The UHPC formulation using the Nycon fibers with its lower strength also had the lowest modulus-- approximately 7.1 x 10⁶ psi. Each subsequent modulus rose in proportion to the higher UCSs. This possibly disproves that the NYCON’s lower strengths were caused by the fiber’s larger size and its interfacial interaction with the UHPC matrix which would likely influence

ERDC/GSL TR-15-22 18
only the strength but not the elastic modulus. As a result, it is hypothesized that the UHPC matrix with Nycon fibers actually exhibited lower strength than the other three fiber types tested. Table 5 shows elastic modulus test results from 6- by 12-in. (152- by 304-mm) cylinders. The Poisson’s ratios are not shown in this table due to the high variance in the results. The hardness/stiffness of the CTB cylinders made it difficult for the modulus testing apparatus to firmly grip the cylinder throughout testing. This resulted in some slip in the horizontal measurement for the Poisson’s ratio. The results of each test specimen were plotted and, if any slip was seen, that specimen’s Poisson’s ratio was discarded. The remaining specimens, which showed no slip, gave Poisson’s ratios ranging between 0.2 and 0.26.
Figure 15. Typical failure observed following compressive strength testing.
Table 5. ASTM C469 elastic modulus testing results.
Elastic Modulus (psi x 106)
Fiber Type ZP305 NYCON OL 6mm OL 10mm
Sample 1 7.25 6.90 7.25 7.35
Sample 2 7.30 7.25 7.40 7.35
Sample 3 7.10 7.15 7.40 7.45
Avg. 7.25 7.10 7.35 7.40
3.3 Flexural response
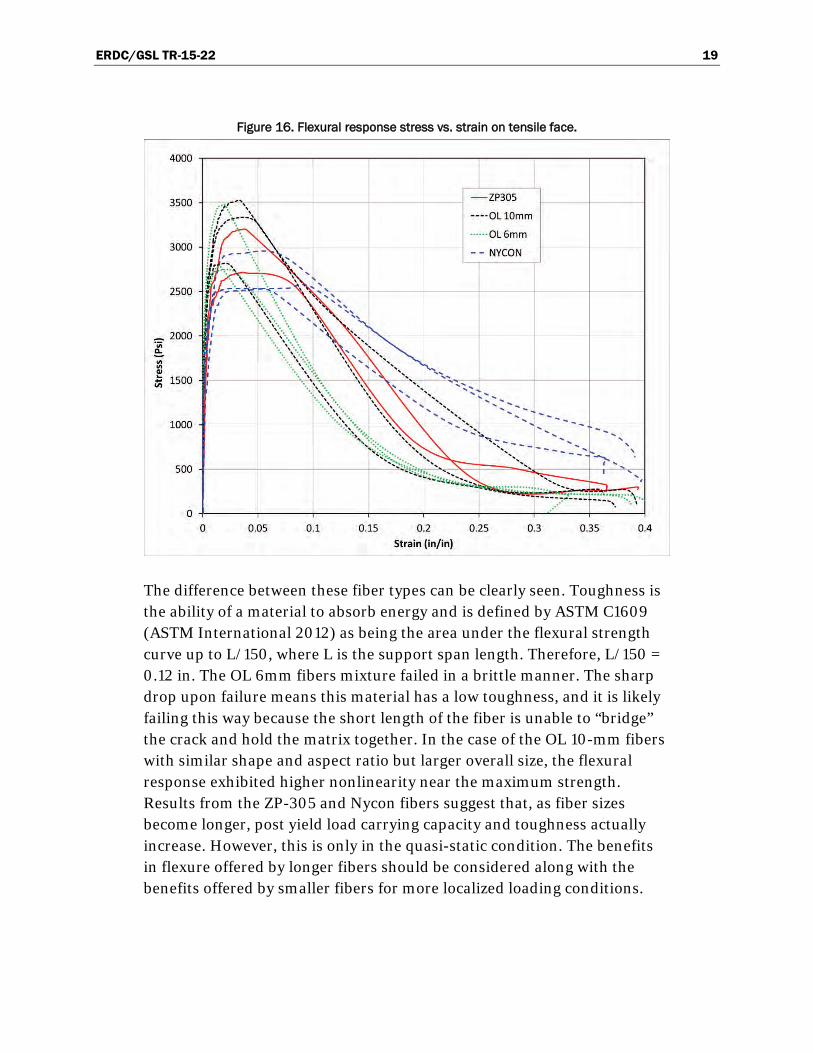
The flexural response was obtained according to ASTM C1609 (ASTM International 2012). The ultimate flexural strengths for each fiber type were compared to that matrix’s corresponding UCS and were expressed as a percentage of UCS. Each fiber type’s ultimate flexural strength ranged between 10 and 11 percent. Figure 16 shows these results as plots of applied load versus center-line displacement.
ERDC/GSL TR-15-22 19
Figure 16. Flexural response stress vs. strain on tensile face.
The difference between these fiber types can be clearly seen. Toughness is the ability of a material to absorb energy and is defined by ASTM C1609 (ASTM International 2012) as being the area under the flexural strength curve up to L/150, where L is the support span length. Therefore, L/150 = 0.12 in. The OL 6mm fibers mixture failed in a brittle manner. The sharp drop upon failure means this material has a low toughness, and it is likely failing this way because the short length of the fiber is unable to “bridge” the crack and hold the matrix together. In the case of the OL 10-mm fibers with similar shape and aspect ratio but larger overall size, the flexural response exhibited higher nonlinearity near the maximum strength. Results from the ZP-305 and Nycon fibers suggest that, as fiber sizes become longer, post yield load carrying capacity and toughness actually increase. However, this is only in the quasi-static condition. The benefits in flexure offered by longer fibers should be considered along with the benefits offered by smaller fibers for more localized loading conditions.
ERDC/GSL TR-15-22 20
3.4 Splitting tensile strength
Splitting tensile properties were obtained for each fiber type according to ASTM C496 (ASTM International 2011). The results were then expressed as a percentage of UCS. Each matrix had a splitting tensile strength that ranged between 11 percent and 12 percent of its corresponding UCS. These results are shown in Table 6.
Table 6. ASTM C496 splitting tensile strength test results.
Splitting Tensile Strength (psi)
Fiber Type ZP305 NYCON OL 6mm OL 10mm
Sample 1 3591 2718 3575 3520
Sample 2 3176 2942 3293 3040
Sample 3 3658 3386 3584 3555
Average 3475 3015 3484 3372
3.5 Direct tensile testing
Figure 17 shows the stress-strain responses observed in DTTs for samples that were cast into dog-bone shaped molds. Figure 18 provides the stress-strain responses observed in DTTs for samples that were cast as flexural beams and then cut into the dog-bone shape using a water jet. Summaries of the results are provided in Table 7 and 8. In Table 7, the results from 10mm Sample #1 were excluded because of an unhydrated cement agglomerate in the cross section. Multiple exclusions were made in Table 8 to address sample defects: 10mm sample #5 for uneven distribution of fiber in the vicinity of failure, Nycon samples #1 and #2 for no fiber bridging the crack, ZP 305 sample #3 for minimal fibers bridging the crack and an entrapped air void present, and ZP 305 samples #1 and #5 for large air voids near the edge of the gage length. Figure 19 provides a comparison of all the data. Appendix B provides images of the cut dog-bones, both pretest and posttest, with their corresponding loads that show examples of typical failure morphologies that were observed.
In both the cast and the cut specimens, there was a clear trend in the relationship between fiber size and tensile behavior. The smaller 6mm OL fibers exhibited the highest strength and stress vs. strain linearity. As fiber size increased, tensile strength, as well as toughness, reduced significantly. The two largest fibers, Nycon Type V and ZP-305, exhibited the lowest strengths and extremely low toughness with rapid reductions in load carrying capacity following the ultimate stress peak.

ERDC/GSL TR-15-22 21
Figure 17. Stress vs. strain DTT results for mold-cast specimens that exhibited longitudinal fiber orientation.
Table 7. DTT results from specimens cast in molds.
Tensile Strength (lbf)
Specimen 6 mm 10 mm Nycon ZP 305
1 2665 2274 1639 2465
2 2622 2773 1403 2307
3 2545 3026 1457 2364
4 3507 2893 1936 2283
Average 2835 2742 1609 2355
Average excluding Imperfections 2835 2897 1609 2355

ERDC/GSL TR-15-22 22
Figure 18. Stress vs. strain DTT results for specimens that were cut from larger flexural beams to minimize preferential fiber orientation.
Table 8. DTT results from specimens cut using a waterjet from larger flexural beams.
Tensile Strength (lbf)
Specimen 6 mm 10 mm Nycon ZP 305
1 2659 2534 649 1029
2 2917 2198 538 1827
3 2949 2154 1114 798
4 2814 1957 977 1824
5 3076 1452 1027 976
Average 2883 2059 861 1291
Average excluding imperfections 2883 2211 1039 1826

ERDC/GSL TR-15-22 23
Figure 19. Summary of DTT results with comparison between specimens that were cast vs. those that were cut from larger flexural beams.
Issues associated with fiber alignment are also easily seen in these results, which provide a direct comparison between the two methods of preparation. Higher tensile strengths occurred from the cast specimens versus the water-jetted samples in all fibers except for the Bekaert 6 mm. The strengths for the Bekaert 6 mm cast and cut specimens were similar and were the least affected by the small specimen size.
In addition, the effect of fiber loading by weight or volume percentage vs. by number of fibers is also clearly a factor, as many of the defects observed during testing were attributed to a lack of fibers crossing the plane of failure. For example, when examined following testing, many of the Nycon Type V and ZP-305 specimens had no fibers bridging the fracture plane. The smaller OL fibers, since they are far greater in number, more easily bridged the fracture plane.
While the results do generally suggest that smaller fibers help to improve tensile strengths in UHPC, the issues associated with fiber size vs. sample size are significant. Tests on much larger specimens would be required to better predict tensile properties and minimize the effects of preferential fiber orientation during sample fabrication.

ERDC/GSL TR-15-22 24
4 Dynamic Test Results and Discussion
Each panel was impacted with an FSP and resulted in damage. In each case, fibers were exposed with some only on the impact side of the panel and others on both sides due to cratering on the front face of the panel, spalling of concrete on the back face of the panel, and/or perforation of the panel by the penetrator. Details for each test, including impact velocity, residual velocity, FSP/round characteristics, and panel characteristics are provided in Appendix C. All but one of the experiments had an impact velocity within 2.5 percent of the desired 3,500 ft/sec, and that one test (Test #12) was approximately 4.0 percent low at 3,343 ft/sec. Several of the tests (11, 27, and 43) had the residual screens tripped by material spalling off the backside of the panel and, therefore, did not record a residual FSP velocity.
The damage states, or responses, of the panels were consistent across the different fiber types. The FSP perforated through each of the panels that had thicknesses of 1.0 and 2.0 in. (25 and 50 mm) (Figures 20 and 21). An impact crater and significant backside spall was created for each of the 2.5-in. (63-mm)-thick panels (Figure 22). For each of the 3.0-in. (76-mm-) thick panels, a smaller impact side crater was generated, and minimal, if any, backside damage was visible (Figure 23).
Figure 20. Typical damage to 1.0-in. (25-mm-) thick panel, showing impact and exit faces with full penetration by the FSP used in testing.
(a) Impact face.
(b) Exit face.

ERDC/GSL TR-15-22 25
Figure 21. Typical damage to 2.0-in. (50-mm-) thick panel, showing impact and exit faces with full penetration by the FSP used in testing.
(a) Impact face.
(b) Exit face.
Figure 22. Typical damage to 2.5-in. (63-mm-thick panel showing impact and exit faces with no penetration by the FSP used in testing. Spallation of material was observed on the
back/exit faces of the panels.
(a) Impact face.
(b) Exit face.

ERDC/GSL TR-15-22 26
Figure 23. Typical damage to 3.0-in. (76-mm-) thick panel, showing impact and exit faces with no penetration by the FSP used in testing. No spallation was observed on the back/exit faces of panels.
(a) Impact face.
(b) Exit face.
Figures 24 and 25 contain the averaged residual velocities for the 1.0- and 2.0–in.- (25- and 50-mm-) thick panels, respectively, with the different fiber types. While the differences were not large, the panels made with 6-mm fibers generally produced a lower residual velocity for both panel thicknesses. As the FSP did not perforate through any of the 2.5- or 3.0-in. (63- or 76-mm-)-thick panels, there were no residual velocities for those cases.
Figure 24. Average residual velocities (ft/s) for 1.0-in. (25-mm-) thick panels.

ERDC/GSL TR-15-22 27
Figure 25. Average residual velocities (ft/s) for the 2.0-in. (50-mm-) thick panels.
Loss of weight due to the damage ranged from 0.75 percent to 5.5 percent over the series of experiments (Figure 26). Although the 1.0-in. (25-mm) panels were perforated, they did not lose as much mass as the 2.0- or 2.5-in.- (50- or 63-mm-) thick panels. The 3.0-in.(76-mm) panels exhibited the least loss of mass due to having only smaller impact side craters.
Additional detailed photographs of each shot are available upon request.
Figure 26. Percent weight loss for each fiber type and panel thickness.

ERDC/GSL TR-15-22 28
5 Summary and Conclusions
The overall goal of this effort was to provide a better understanding of the effect of fiber size and shape on the response of UHPC at quasi-static and dynamic rates of loading. The testing utilized a laboratory standard UHPC known as Cor-Tuf Baseline (CTB) that was produced using four fiber types: Bekaert ZP-305 (in the standard CTB formulation), Nycon Type V, Bekaert OL .2/10 mm, and Bekaert OL .16/6 mm. Based on the results of the experimental investigation, the following conclusions were made:
• Fiber size and shape have a negligible impact on compressive strength, elastic modulus, and Poisson’s ratio. This result was anticipated as compressive properties are more strongly correlated with the properties of the matrix than of the fiber reinforcement, which is provided to improve the tensile properties.
• The results of flexural and direct tensile testing showed a strong impact of fiber geometry. Smaller fibers, such as the 6-mm OL fibers, provided a significant increase in tensile strength, stress vs. strain linearity, and toughness. As fiber sizes increased, tensile strengths generally decreased. Even with their reduced strength, specimens made with the larger ZP-305 and Nycon Type V fiber did exhibit some post-yield load carrying capacity. The results indicated that the smaller OL fibers significantly improved properties and limited damage and nonlinearity prior to reaching the ultimate strength. Once damage was initiated, the larger fibers were more effective at bridging larger cracks and redistributing stresses.
• The dynamic response of specimens impacted with FSPs provided similar relationships between fiber size and response. The smaller OL fibers were more effective in reducing residual velocities of projectiles and minimizing mass loss due to cratering and/or spallation. Large fibers exhibited higher residual velocities and more extensive damage on the impact and exit faces of UHPC panels. Fiber size and shape did not have a significant impact on whether or not a panel was perforated during testing, as all UHPC-fiber combinations transitioned from a non-perforated to a perforated state at the 2.0- to 2.5-in. (50- to 63-mm) panel thickness transition.

ERDC/GSL TR-15-22 29
The primary conclusion from this research was that fiber size and shape do have a significant impact on both quasi-static and dynamic properties of UHPCs. Given the fact that fiber dosage rates were made on a percentage basis, the number density of fibers also has a significant impact on correlations between fiber type and UHPC response. This is likely one of the primary reasons that smaller OL fibers performed significantly better in most tests than their larger counterparts. Another issue encountered was that larger fibers require larger test articles in order to uniformly distribute the fibers and minimize preferential fiber orientation. This was an issue in the direct tensile testing that required a specimen with limited cross-sectional area in the gage length.
Based on observations of specimen behavior and the influence of fiber type, it is likely that combinations of fiber types may be more advantageous and provide additional improvements in mechanical properties at a similar cost. For example, given the fact that OL fibers are more expensive but provide improved tensile properties, perhaps the dosage rate of OL fibers could be reduced to minimize the impact of their cost while maintaining properties similar to CTB produced using ZP-305 fibers. Future research on hybrid fiber systems may also yield leap-ahead results with multiple fiber types to bridge multiple damage states. Such a material may include small OL fibers to delocalize damage prior to reaching the ultimate strength combined with larger ZP-305 fibers to bridge larger length scale cracking.

ERDC/GSL TR-15-22 30
References ASTM International. 2010a. Standard test method for compressive strength of concrete
cylinders cast in place in cylindrical molds. Designation: C872/873M. West Conshohocken, PA:ASTM International. doi: 10.1520/C0873_C0873M-10A. www.astm.org.
_____.2010b. Standard test method for static modulus of elasticity and Poisson’s ratio of concrete in compression. Designation: C469/496M. West Conshohocken, PA:ASTM International. doi: 10.1520/C0469_C0469M-10. www.astm.org.
_____. 2011. Standard test method for splitting tensile strength of cylindrical concrete specimens. Designation: C 496/496M. West Conshohocken, PA:ASTM International. doi: 10.1520/C0496_C0496M-11. www.astm.org.
_____. 2012. Standard test method for flexural performance of fiber-reinforced concrete (using beam with third-point loading). Designation: C1609/1609M. West Conshohocken, PA: ASTM International. doi: 10.1520/C1609_C1609M-12. www.astm.org.
_____. 2013. Standard practice for making and curing concrete test specimens in the laboratory. Designation: C 192/192 M. West Conshohocken, PA: ASTM International. doi: 10.1520/C0873_C0873M-10A. www.astm.org.
Campbell, R.L., E.F. O’Neil, W.M. Dowd, and C.E. Dauriac. 1998. Reactive powder concrete for producing sewer, culvert, and pressure pipes. Construction Productivity Advancement Research (CPAR) Program, CPAR-SL-98-3. Vicksburg, MS: U.S. Army Engineer Waterways Experiment Station.
Green, B., R. Moser, D. Scott, and W. Long. 2014. Ultra-high performance concrete history and usage by the United States Army Engineer Research and Development Center. ASTM C09 Symposium on Ultra-High Performance Concrete; ASTM Special Technical Publication 1581, 2014. ASTM Journal of Advances in Civil Engineering Materials http://www.astm.org/DIGITAL_LIBRARY/JOURNALS/ACEM/PAGES/ACEM20140031.htm
Japanese Society of Civil Engineers (JSCE). 2008. Recommendations for design and construction of high performance fiber reinforced cement composites with multiple fine cracks. Tokyo: Japan Society of Civil Engineers.
Neeley, B. D., and D. M. Walley. 1995. Very high-strength concrete. The Military Engineer 87: 36-37.
O’Neil, E. F. 2008. On engineering the microstructure of high-performance concretes to improve strength, rheology, toughness, and frangibility. PhD diss., Northwestern University, Evanston, IL.
Reinhart, W. D., and T. F. Thornhill III. 2010. Ballistic penetration test results for ductal and ultra-high performance concrete samples. SAND2010-2222. Albuquerque, NM: Sandia National Laboratories.

ERDC/GSL TR-15-22 31
Richard, P., and M. Cheyrezy. 1995. Composition of reactive powder concretes. Cement and Concrete Research 25(7): 1501-1511. http://dx.doi.org/10.1016/0008-8846(95)00144-2.
Roth, Jason M., S. T. Rushing, G. O. Flores, D. Sham, and J. W. Stevens. 2010. Laboratory investigation of the characterization of Cor-Tuf flexural and splitting tensile properties. ERDC/GSL-TR-10-46. Vicksburg, MS: U.S. Army Engineer Research and Development Center.

ERDC/GSL TR-15-22 32
Appendix A: Fiber Data Sheets Figure A1. Technical data sheet for ZP 305 fiber.

ERDC/GSL TR-15-22 33
Figure A2. Technical data sheet for Nycon Type V fiber.
NYCON-SF TYPE V (CONTINUOUSLY DEFORMED) High Performance Steel Fiber, ASTM A820 NY CON.
OVUIZ:, 'MRSOffifiNfOfiONGFrlliRS
----
1
• it ••
NYCON-SF TYPE V CONTINUOUSLY DEFORMED STEEL FIBERS are low-carbon, drawn w ire for reinforced concrete. NYCON-SF fibers distribute stresses within the concrete and provide improvement to ductility.
NYCON-SF TYPE V Physical Properties
Filament Diameter 0.046"(1.18 mm)
Fiber Length 1.5"(38mm)
Specific Gravity 7.8
Tensile Strength 1 oo ksi (689 MPa)
Flexural Strength 29,000 ksi (203 GPa)
Melting Point 2760• F(1516• C)
Color Gray
Water Absorption Nil
Alkali Resista nee High
Corrosion Resistance High
Description NYCON-SF TYPE V steel fiber products are drawn, continuously deformed steel fibers for use in reinforced concrete and shotcrete.
NYCON-SF TYPE V steel fibers meet the requirements of ASTM A820.
APPLICATIONS
Shrinkage Cont rol Dosage: 20-30 lbs perCY, 1 o-1 5 kg/m'
Light Traffic and/or Static Loading Dosage: 30"'10 lbs perCY. 1 5-20 kg/m'
Medium Dynamic and/or Static Loading Dosage: 40.(;0 lbs perCY, 2().30 kg/m'
Heavy Dynamic and/or Static Loading Dosage: 60-100 lbs perCY. 30.50 kg/m}
Special Applications Dosage: 1 OQ-160 lbs perCY, 5().80 kg/m'
800-456-9266
BENEFITS
length and count is a consideration. Impending or modifying crack growth is one of the benefits of a high fiber count. There are durability benefits provided at this dosage level.
St~l fibers provide ~ondary shrinkage reinforcMlent and durability benefits. A degr~ of load carrying can be assigned to the steel fibers at the upper end of the dose range.
Stpel fibers provide secondary shrinkage reinforcemffit, durability benefits and for slab-ongrade, a degroo of load carrying capacity. Shotcrete and precast products also benefit from steel fibers.
At this dosage, steel fibers translate into enhanced engi~ring propentes. Applications include runways, taxi--ways, tunnel liners, slope stabilization and jointless floors.
These applications include ballistic blast walls and thin architectural panels.
www.nycon.com [email protected]

ERDC/GSL TR-15-22 34
Figure A3. Technical data sheet for OL 6-mm/0.16mm fiber.
Dramix®
DATA SHEET OL 6/.16
What is Drami~? Dramix- steel fibres, from industry specialist
Bekaert, have set a new standard for concrete reinforcement with their unique combination
of f lexibility and cost-efficiency.
The OL range is a cold drawn Ultra High tensile wire. The f ibre is formed by cutting
straight pieces of this wire. OL fibres are typically used in high dosage for
high strength concrete.
OL 6/.16 offers you:
¢ Dramix• Hi Perform Dramix- Hi Perform fibres provide high performance and crack resistance. These
are products of choice to create optimal ductility in high strength but brittle concretes from 100 N/mm2 onwards.
M<xihcations rBssM!d. AI detals descri:le 1D producQ; tn ge11Bf81 form only. For d9taiJ9d mfom"lation. product spEICifica 10fL1 available on tequast..
e 2012 B9kaeO
PACKAGING STORAGE ---- - - ..
36 boxes l25kg) 900kg
NO STACKING
& Handle with care: Verify our handling, mix ing and dosing recommandations.
APPROVALS
1509001 CE
• ISO 9001 LABEL: Dramix• Ol type is ISO 9001 certified. Production plant: • Slovak Republic
• CE LABEL: Dramix• is certifJed forCE mark system 1: steel f ibres for structural use. For detailed info: CE info sheet available on request.
Bekaert will advise on the most suitable fibre for your applica1ion. Ask lor our recommendations on handling, dosing and mixing at: " www.bekaertcom/dosingdramix ! [email protected] -
L---------------------------------------------------------------~1

ERDC/GSL TR-15-22 35
Figure A4. Technical data sheet for OL 10-mm/0.2mm fiber.
DATA SHEET OL 10/.20
What is Dramix8? Dramix- steel fibres, from industry specialist
Bekaert, have set a new standard for concrete reinforcement with their unique combination of flexibility and cost-efficiency.
The OL range is a cold drawn Ultra High tensile wire. The fibre is formed by cutting
straight pieces of this wire. OL fibres are typically used in high dosage for high strength concrete.
OL 10/.20 offers you:
~ Dramix" Hi Perform DramixO Hi Perfonn fibres provide high
performance and crack resistance. These
are products of choice to create optimal ductility in high strength but brittle concretes from 100 Nlmm2 onwards.
Modir.cations r989Mid. AJ details d9scrtle ow products m gensral fonn only. For dol.aWd rnfoonatiorr. product specificatoos available on reqt~QSt.
e 2012 BekMt
PACKAGING .. '
[I HiillJ 36 boxes {25kg)
900 kg
KEEP DRY NO STACKING
& Handle wi th care: Verify our handling, mixing and dosing recommandations.
APPROVALS
1509001
• ISO 9001 LABEL: Dramixat Ol type is ISO 9001 certified. Production plant : • Slovak Republtc
Bekaert will advise on the most suitable fibre for your applicat ion. Ask for our recommendations on handling, dosing and miXIng at: www.bekaert.com/dosingdramix [email protected]
~----------------------------------------~
-* • ~ li
I

ERDC/GSL TR-15-22 36
Appendix B: DTT Specimens Pretest/Posttest Figure B1. DTT specimens cut using waterjet from
larger flexural beams prior to testing.
Figure B2. DTT test specimens following testing.
(a) ZP-305.
(b) Nycon Type V.
(c) OL 0.2/10 mm.
(d) OL 0.16/6 mm.

ERDC/GSL TR-15-22 37
Appendix C: FSP Test Results Table C1. FSP experiment characteristics, velocity, and weight loss results.
Shot # Strike Velocity (ft/s)
Residual Velocity (ft/s) Sample Description Sample Dimensions
% Wt. Loss
1 3526 1644 297-13 CT-F 10mm 12" x 12" x 1" 2.299
2 3542 1517 297-13 CT-F 6mm 12" x 12" x 1" 2.006
3 3475 1559 289-13 CT-F NYCON 11 15/16" x 12" x 1 1/32" 3.720
4 3549 1615 281-13 CT-F ZP-305 11 15/16" x 11 15/16" x 1" 3.046
5 3529 267 297-13 CT-F 10mm 12" x 12" x 1 31/32" 4.194
6 3533 232 297-13 CT-F 6mm 12" x 11 31/32" x 2" 4.533
7 3452 221 289-13 CT-F NYCON 12" x 11 31/32" x 2" 5.459
8 3449 255 281-13 CT-F ZP-305 12" x 11 31/32" x 2" 4.340
9 3540 0 297-13 CT-F 10mm 12" x 11 31/32" x 2 1/2" 3.252
10 3520 0 297-13 CT-F 6mm 12" x 12" x 2 1/2" 3.735
11 3546 N/R 289-13 CT-F NYCON 12" x 12" x 2 1/2" 5.542
12 3358 0 281-13 CT-F ZP-305 12 1/32" x 12 1/32" x 2 1/2" 3.352
13 3535 0 297-13 CT-F 10mm 12" x 12" x 3" 1.172
14 3517 0 297-13 CT-F 6mm 12" x 12" x 3" 0.846
15 3574 0 289-13 CT-F NYCON 12" x 12 1/32" x 3 1/16" 1.945
16 3546 0 281-13 CT-F ZP-305 12" x 12" x 3" 1.173
17 3542 1353 297-13 CT-F 10mm 11 31/32" x 11 31/32" x 1 1/16" 2.511
18 3528 1416 297-13 CT-F 6mm 11 31/32" x 11 31/32" x 1 1/16" 2.696
19 3542 1557 289-13 CT-F NYCON 12" x 11 15/16" x 1" 3.606
20 3546 1626 281-13 CT-F ZP-305 12" x 12" x 1" 2.926
21 3553 250 297-13 CT-F 10mm 12" x 12" x 2" 3.827
22 3534 210 297-13 CT-F 6mm 12" x 12" x 2" 4.454
23 3579 262 289-13 CT-F NYCON 12" x 12" x 2" 5.309
24 3487 238 281-13 CT-F ZP-305 12" x 12" x 2" 4.468
25 3523 0 297-13 CT-F 10mm 12" x 11 31/32" x 2 1/2" 3.814
26 3538 0 297-13 CT-F 6mm 12" x 12" x 2 1/2" 3.323
27 3550 N/R 289-13 CT-F NYCON 12" x 12" x 2 1/2" 5.340
28 3558 0 281-13 CT-F ZP-305 12" x 12" x 2 1/2" 3.771
29 3535 0 297-13 CT-F 10mm 12" x 12" x 3" 0.897
30 3537 0 297-13 CT-F 6mm 12" x 12" x 3" 0.828

ERDC/GSL TR-15-22 38
Shot # Strike Velocity (ft/s)
Residual Velocity (ft/s) Sample Description Sample Dimensions
% Wt. Loss
31 3563 0 289-13 CT-F NYCON 12" x 12" x 3" 1.799
32 3580 0 281-13 CT-F ZP-305 12" x 11 31/32" x 3" 1.100
33 3561 1679 297-13 CT-F 10mm 12" x 12" x 1" 2.246
34 3568 1340 297-13 CT-F 6mm 11 31/32" x 11 31/32" x 1" 2.925
35 3585 1628 289-13 CT-F NYCON 11 15/16" x 12" x 1 1/32" 4.171
36 3525 1389 281-13 CT-F ZP-305 12" x 11 31/32" x 1" 3.472
37 3530 273 297-13 CT-F 10mm 12" x 12" x 2 1/32" 3.717
38 3523 232 297-13 CT-F 6mm 12" x 11 31/32" x 2" 3.565
39 3526 262 289-13 CT-F NYCON 12" x 12" x 2" 5.546
40 3527 244 281-13 CT-F ZP-305 12" x 11 31/32" x 2" 4.723
41 3526 0 297-13 CT-F 10mm 12" x 12 1/32" x 2 17/32" 3.838
42 3531 0 297-13 CT-F 6mm 12" x 12" x 2 9/16" 3.679
43 3506 N/R 289-13 CT-F NYCON 12" x 12" x 2 1/2" 4.845
44 3500 0 281-13 CT-F ZP-305 12" x 12" x 2 1/2" 3.678
45 3499 0 297-13 CT-F 10mm 12" x 12" x 3" 0.734
46 3486 0 297-13 CT-F 6mm 12" x 12" x 3" 1.009
47 3510 0 289-13 CT-F NYCON 12" x 12 1/32" x 3 1/16" 2.241
48 3510 0 281-13 CT-F ZP-305 12" x 12" x 3" 1.004
Notes: Blue shading indicates 1-in. nominal thickness, red shading indicates 2-in. nominal thickness, green shading indicates 2.5-in. nominal thickness, and purple shading indicates 3-in. nominal thickness. “N/R” indicates that chronograph was erroneously triggered by spalled material rather than the intended FSP.

REPORT DOCUMENTATION PAGE Form Approved
OMB No. 0704-0188 Public reporting burden for this collection of information is estimated to average 1 hour per response, including the time for reviewing instructions, searching existing data sources, gathering and maintaining the data needed, and completing and reviewing this collection of information. Send comments regarding this burden estimate or any other aspect of this collection of information, including suggestions for reducing this burden to Department of Defense, Washington Headquarters Services, Directorate for Information Operations and Reports (0704-0188), 1215 Jefferson Davis Highway, Suite 1204, Arlington, VA 22202-4302. Respondents should be aware that notwithstanding any other provision of law, no person shall be subject to any penalty for failing to comply with a collection of information if it does not display a currently valid OMB control number. PLEASE DO NOT RETURN YOUR FORM TO THE ABOVE ADDRESS. 1. REPORT DATE (DD-MM-YYYY) August 2015
2. REPORT TYPE Final report
3. DATES COVERED (From - To)
4. TITLE AND SUBTITLE
Impact of Steel Fiber Size and Shape on the Mechanical Properties of Ultra-High Performance Concrete
5a. CONTRACT NUMBER
5b. GRANT NUMBER
5c. PROGRAM ELEMENT NUMBER
6. AUTHOR(S) Dylan A. Scott, Wendy R. Long, Robert D. Moser, Brian H. Green, James L. O’Daniel, and Brett A. Williams
5d. PROJECT NUMBER
5e. TASK NUMBER
5f. WORK UNIT NUMBER
7. PERFORMING ORGANIZATION NAME(S) AND ADDRESS(ES) 8. PERFORMING ORGANIZATION REPORT NUMBER
U.S. Army Engineer Research and Development Center Geotechnical and Structures Laboratory 3909 Halls Ferry Road Vicksburg, MS 39180-6199
ERDC/GSL TR-15-22
9. SPONSORING / MONITORING AGENCY NAME(S) AND ADDRESS(ES) 10. SPONSOR/MONITOR’S ACRONYM(S) Headquarters, U.S. Army Corps of Engineers Washington, DC 20314-1000
11. SPONSOR/MONITOR’S REPORT NUMBER(S)
12. DISTRIBUTION / AVAILABILITY STATEMENT
Approved for public release; distribution is unlimited.
13. SUPPLEMENTARY NOTES
14. ABSTRACT This investigation focused on identifying the impact of various steel fiber types, including size and shape, on the mechanical responses of an ultra-high performance concrete (UHPC) known as Cor-Tuf Baseline (CTB). CTB specimens were fabricated with four fiber types. The experimental program included testing for quasi-static and dynamic properties, focusing on penetration resistance. Fiber shape and size had a limited impact on quasi-static properties in compression but had a significant impact on quasi-static tensile properties and dynamic penetration resistance. The smaller fibers exhibited up to a 100 percent increase in tensile strength compared with their larger counterparts. However, the benefits offered by the smaller fibers primarily occurred prior to reaching the ultimate load carrying capacity. Once the ultimate strength was reached, larger fibers were more effective at bridging larger cracks. The smaller fibers also provided improved penetration resistance, with reduced residual projectile velocities and loss of material from cratering and/or spallation. Fiber shape and size did not have an impact on the transition between projectile perforation and nonperforation. The results provide insights into optimal fiber reinforcement and potential strategies to further improve the properties of UHPCs, make fiber-reinforced UHPCs more cost competitive by altering fiber dosage rates, and develop hybrid reinforcement schemes.
15. SUBJECT TERMS Concrete Ultra-high performance concrete
Fiber Reinforcement,
Strength Toughness
16. SECURITY CLASSIFICATION OF: 17. LIMITATION OF ABSTRACT
18. NUMBER OF PAGES
19a. NAME OF RESPONSIBLE PERSON
a. REPORT
UNCLASSIFIED
b. ABSTRACT
UNCLASSIFIED
c. THIS PAGE
UNCLASSIFIED 46 19b. TELEPHONE NUMBER (include area code)
Standard Form 298 (Rev. 8-98) Prescribed by ANSI Std. 239.18