Embed Size (px)
Citation preview
GRETHA UMR CNRS 5113 Univers ité de Bordeaux
Avenue Léon Duguit - 33608 PESSAC - FRANCE Tel : +33 (0)5.56.84.25.75 - Fax : +33 (0)5.56.84.86.47 - www.gretha.fr
Can developing countries gain from defying comparative advantage? Distance to comparative advantage, export diversification and sophistication,
and the dynamics of specialization
Pauline LECTARD
ART-Dev, CNRS, UMR 5281, University of Montpellier 3 [email protected]
&
Eric ROUGIER
GREThA, CNRS, UMR 5113, University of Bordeaux [email protected]
Cahiers du GREThA n° 2017-14
octobre
Cahiers du GREThA 2017 – 14
GRETHA UMR CNRS 5113 Univers i té de Bordeaux
Avenue Léon Dugui t - 33608 PESS AC - FR ANCE Te l : +33 (0 )5 .56 .84.25 .75 - Fax : +33 (0 )5 .56 .84.86 .47 - www.gretha.f r
Les pays en développement doivent-ils défier leur avantage comparatif? Distance à l'avantage comparatif, diversification et sophistication des exportations, et dynamique
de la spécialisation
Résumé: Depuis les années 1990, les pays en développement ont tenté de promouvoir la diversification et la sophistication des exportations, notamment en attirant l'IDE vertical et en soutenant l'émergence de nouvelles industries dont l’intensité factorielle est éloignée de la dotation du pays. Nous étudions si le fait de défier l'avantage comparatif a entraîné un panier d'exportation plus sophistiqué et diversifié dans un vaste panel de pays sur la période 1992-2012. Nous constatons que les pays en développement qui défient leur avantage comparatif ont tendance à exporter plus de biens manufacturés et à fabriquer des produits plus sophistiqués. En ce qui concerne la diversification des exportations, l'impact est hétérogène à travers les niveaux de développement: bien que défier l'avantage comparatif semble contribuer à diversifier les paniers d'exportation des pays à revenu intermédiaire et riches en ressources naturelles, ceci tend à concentrer ceux des économies à faible revenu. En outre, nous constatons que l'impact de la distance à l'avantage comparatif sur la transformation productive est fortement conditionné par la taille des stocks d'IDE et par la spécialisation du pays dans les tâches productives à plus faible valeur ajoutée des chaînes de valeur mondiales (GVC). Plus précisément, nos résultats suggèrent que défier l'avantage comparatif en attirant l'IDE peut être une stratégie dangereuse à long terme, car elle n'apporte qu’une industrialisation partielle et superficielle, les exportations manufacturières augmentant alors que la valeur ajoutée industrielle domestique diminue.
Mots-clés: Spécialisation commerciale, diversification des exportations, sophistication des exportations, distance à l'avantage comparatif, IDE
Can developing countries gain from defying comparative advantage? Distance to comparative advantage, export diversification and sophistication, and the dynamics of
specialization
Abstract: Since the 1990s, developing countries have tried to promote export diversification and sophistication, notably by attracting vertical FDI and by supporting the emergence of new industries whose factor content is distant from the country’s endowment. We investigate whether defying comparative advantage has prompted a more sophisticated and diversified export basket in a large panel of countries over the period 1992-2012. We find that developing countries that defy their comparative advantage tend to export more manufactured items and manufacturing goods that are more sophisticated. As for export diversification, the impact is heterogeneous across development levels: although defying comparative advantage seems to help diversify the export baskets of middle-income and resource-rich countries, it tends to concentrate those of lower-income economies. Moreover, we find that the impact of the distance to comparative advantage on productive transformation is strongly conditioned by the size of FDI stocks and by the country’s specialization in the lower added-value productive tasks of global value chains (GVCs). More specifically, our results suggest that defying comparative advantage by attracting FDI may be a dangerous strategy in the long-term since it tends to bring only partial and artefact industrialization, with manufacturing exports increasing while the manufacturing value-added actually decreases.
Keywords: Trade specialization, export diversification, export sophistication, distance to comparative advantage, FDI
JEL: F14, F21, F63, O14
Reference to this paper: LECTARD, Pauline & ROUGIER, Eric (2017) Can developing countries gain from defying comparative advantage? Distance to comparative advantage, export diversification and sophistication, and the dynamics of specialization, Cahiers du GREThA, n°2017-14. http://ideas.repec.org/p/grt/wpegrt/2017-14.html.
Can developing countries gain from defying comparative advantage? Distance to comparative advantage, export diversification and sophistication, and the dynamics of specialization
1
1. Introduction
Export diversification and sophistication, i.e. the export of new products and of higher quality varieties of existing or new products, are now considered as the most relevant markers of developing economies’ productive transformation (Gutiérrez de Piñeres and Ferrantino, 1997; Klinger and Lederman, 2004; Hidalgo et al., 2007; IMF, 2014). They signal the emergence of new and more capital-intensive industries that are sufficiently competitive to become exporters (Melitz, 2003). The most recent literature has provided evidence that they also bring substantial advantage to developing countries in terms of economic growth (Hausman et al., 2007; Hesse, 2008; Jarreau and Poncet, 2012; Anand et al., 2012; IMF, 2014; Mau, 2016), output stability (Mobarak, 2005; Koren and Tenreyro, 2007; Malik and Temple, 2008; Camhano da Costa Neto and Romeu, 2011) and democracy (Cuberes and Jerzmanowski, 2009; Kolstad and Wiig, 2014).
Although the drivers of export diversification and sophistication have also been investigated, the evidence remains thin and disappointing, notably regarding the policy determinants of productive change. Early studies (De Ferranti et al., 2002; Klinger and Lederman, 2004; Chandra et al., 2007; De Benedictis et al., 2009; Cadot et al.,2011a; Parteka and Tamberi, 2013b) merely focused their attention on income per capita in order to check whether the inverted U-shaped pattern of productive diversification that was first evidenced for output and employment by Imbs and Wacziarg (2003) also holds for export diversification. Subsequent studies did find evidence of the impact of structural determinants – e.g. country size and location and degree of trade openness – on export diversification (Agosin et al., 2012; Parteka and Tamberi, 2013a; Mau 2016) and export sophistication (Weldemicael, 2012; Zhu and Fu, 2013), but could not identify significant policy determinants1.
Thus, existing empirical evidence about the drivers of export diversification and sophistication gives little information about which policies best promote productive transformation in developing countries2. Although they have taken heterogeneous forms across developed and developing countries over the last three decades3, these policies can be divided into two main options with radically contradictory consequences in terms of distance to comparative advantage (Lin, 2009, 2012). The first option, that of following comparative advantage, is based on the assumption of standard trade theory that export diversification and sophistication result from the joint dynamics of capital accumulation and comparative advantage in competitive goods and factor markets (Schott, 2003). Consequently, in order to promote productive transformation and the diversification of their exports, developing countries should not try to defy their comparative advantage and should design 1 Starting with an extensive menu of 33 alternative explanatory variables and instrumenting development level by its lagged value, Parteka and Tamberi (2013a) use a stepwise procedure of variable selection, ending up with a parsimonious specification including development level, country size and remoteness, and trade openness. Agosin et al. (2012) add the terms of trade, human capital, domestic credit and exchange rate volatility and overvaluation and find significant GMM-system coefficients only for trade openness and remoteness. Mau (2016) also implements GMM-system estimations on a set of diversification determinants restricted to development levels and country size and remoteness. Measuring export sophistication by the estimated export unit value adjusted for differences in production costs and for the selection bias stemming from relative distance, the IMF (2014) provides non-causal evidence that export quality increases with improvements in secondary and tertiary education, institutional quality, trade openness, agricultural policy, and the existence of a domestic financial system. 2 The debate about the best policies to promote industrial development is not new since it originated with development economics (Hirschman, 1958) and was successively reactivated after the success of rapidly industrializing east-Asian countries from the late 1980s onwards (Amsden, 1989; Wade, 1990; Aoki et al., 1998) and the rise of global value chains (Lin and Chang, 2009; Lin, 2011; Rodrik, 2011; Singh, 2011; Fine and Waeyeberge, 2013). 3 See Cimolli et al. (2009), Altenburg (2011) or Naudé et al. (2015) for case studies of industrial or productive transformation policies in developing countries, and Schmitz (2007) for a synthesis of industrial policies in developing countries. For a systematic and comprehensive account of the theoretical and empirical literature on industrial policy and economic development, see Harrison and Rodríguez-Clare (2010).
Can developing countries gain from defying comparative advantage? Distance to comparative advantage, export diversification and sophistication, and the dynamics of specialization
2
policies facilitating the alignment of the factor content of exports with the country’s factor endowment. The alternative option, that of defying comparative advantage, is consistent with the second-best theory of economic policy arguing that factor price equalization and market incentives might be unable to promote productive transformation in case of information and coordination failures (Hausmann and Rodrik, 2003) or of imperfect goods and factor markets (Harrison and Rodríguez-Clare, 2010). Governments in developing countries should thus use sectoral subsidies or attract vertical FDI to promote export diversification and sophistication – and consequently transform domestic productive structures – by means of reducing the cost of capital, with the consequence that the export capital content will exceed the country’s capital endowment.
To our knowledge, no empirical study has so far investigated which of these two policy options – following or defying comparative advantage – is the most effective in triggering productive transformation and supporting it over the long term. The stakes are high since, over the last three decades, most developing economies have put considerable efforts into defying their comparative advantage by attracting vertical foreign direct investment (FDI) in targeted manufacturing and processing activities (Harding and Javorcik, 2012). As a result of these efforts, a number of them have been able to enter global value chains (GVCs) managed by the transnational corporations (TNCs) from advanced economies (UNCTAD, 2013; OECD, 2015). They have subsequently experienced a surge of processed exports leading to a rapid diversification and sophistication of their export structure (Freund and Moran, 2017). Although positive in many ways, this recent trend nonetheless exposes an apparently paradoxical pattern of specialization whereby, through the implementation of industrial or FDI policies explicitly aimed at defying their comparative advantage, capital-poor countries succeed in exporting capital-intensive goods. This paradox raises the crucial issues of the authenticity and sustainability of the productive transformation.
The present paper’s main contribution is to shed light on this paradoxical pattern by testing whether defying comparative advantage, notably by hosting large stocks of FDI, has supported export diversification and sophistication in a large panel of developing and developed countries over the period 1992-2012. The extent to which a country defies its comparative advantage is indirectly measured by the distance between its export factor content and its comparative advantage. Since the policies supporting productive transformation are, by their very nature, selective on sectors or on firms, measuring them at country level proves problematic and might be misleading. Measuring their effect, i.e. the distance between the export factor content and the country’s factor endowment, may provide a relevant indirect assessment of these policies. A typical developing country is more abundant in (unskilled) labor than in capital. Hence, governmental interventions that support the expansion of specific sectors or the entry of foreign firms through vertical FDI will promote the emergence of capital-intensive exports by removing the constraint imposed by unfavorable domestic relative factor prices. A surge of capital-intensive exports might therefore be detected in trade data, even though the factor endowment and relative factor price measured at country level remain globally unfavorable to this category of product.
By extending and computing the Technological Complexity Index proposed by Lin (2009) to assess the distance to comparative advantage, we find that developing countries which defy their comparative advantage tend to diversify and increase the sophistication of their exports more than countries following their comparative advantage, sophistication being mainly based on the rise of manufacturing exports. The impact on export diversification is not linear across development levels as defying comparative advantage helps to diversify the exports of middle-income countries, while it tends to concentrate those of lower-income economies. Importantly, our estimations also indicate that the impact of distance to comparative advantage on productive transformation is strongly conditioned by FDI stocks, which we interpret as a proxy for the degree of integration into GVCs. More specifically, we find that the association of large FDI stocks and a sizeable distance to comparative advantage can lead to a persistent concentration of the most sophisticated exports, those typically involved in assembly activities, that could hinder structural change in the longer term by promoting the formation of a specialization lock-in for the less developed countries.
Can developing countries gain from defying comparative advantage? Distance to comparative advantage, export diversification and sophistication, and the dynamics of specialization
3
The present paper relates to several recent strands of literature which it either supports, contradicts or qualifies.
The literature on export survival has shown that export diversification is not a linear process in developing countries, with new export lines emerging and disappearing rapidly (Besedes and Prusa, 2006, 2007; Brenton et al. 2010; Carrère and Strauss-Khan, 2012). Our paper is close to that of Nicita et al. (2013), who use the Euclidian distance between export factor content and the country’s factor endowment to explain the survival of exports for a sample of 17 developing countries during the period 1993-2007. Their central finding is that export survival provides information about the underlying path of productive transformation since only the export lines supported by a true comparative advantage, i.e. featuring a minimum distance between endowment and factor content, will persist over time. Their analysis is disaggregated at the product level and consequently does not relate the distance to comparative advantage to the whole export structure, as we do in the present paper by associating sector-level and country-level characteristics. Moreover, by associating the three complementary dimensions of export diversification, export sophistication and the number of highly sophisticated exports, we are able to fully characterize between-country variations in productive transformation and identify patterns of articulation of the export diversification and sophistication trends that could hinder long-term productive transformation in developing countries. Such characterization is not possible with disaggregated survival analysis.
The dynamics of productive capabilities along the pathway to economic development and productive transformation – and the conditioning role played by vertical FDI in these dynamics – is also an important issue addressed by the present paper. Our results indicate that, in sharp contradiction with the standard theory of specialization along the development pathway (Schott, 2003; Lin, 2009, 2012), the transformation of the productive structure can temporarily precede factor accumulation, with large benefits for the whole economy. Various case-studies have recently illustrated how a selection of middle income countries could reap substantial benefits from defying comparative advantage by means of FDI in assembly activities. On the one hand, Sutton (2012) has focused on technological and organizational spillover from vertical FDI for various industries to show that developing countries’ domestic firms move from one narrow set of specializations in labor-intensive exports towards more capital-intensive ones by absorbing imported technological and organizational capabilities from FDI and intermediate goods. Our results suggest that, although importing capital through FDI might constitute a relevant policy option for developing countries with imperfect factor markets and unfavorable factor prices, this policy should not displace a consistent strategy of domestic capacity accumulation enabling domestic firms to take the lead in output and export diversification. On the other hand, the country case study by Freud and Moran (2017) emphasizes the role played by spatial and sectoral concentration of FDI in the productive transformation of various middle-income economies. By considering the distance to comparative advantage, our findings suggest that attracting and hosting vertical FDI and thus defying the country’s comparative advantage might bring about only narrow and unsustainable transformation of the productive structure, with a few sophisticated exports, highly dependent on transnational corporations, concentrating export revenues without delivering technological spillovers to the rest of the economy.
These implications of our results should nevertheless be confirmed by using disaggregated FDI data. This would allow for more fine-grained investigation of the economic impact of FDI in assembly activities at sectoral level, notably by properly identifying how this impact varies with the share of value added imported in components. Efforts have recently been devoted to adapting the measurement of exports – and their degree of sophistication – to the reality of GVCs by looking at the value added which is traded (Koopman et al., 2012; Beltramello et al., 2012; Johnson and
Can developing countries gain from defying comparative advantage? Distance to comparative advantage, export diversification and sophistication, and the dynamics of specialization
4
Noguera, 2017)4. The existence of a persistent contradiction between the factor content of exports and the country’s comparative advantage confirms that using trade statistics to assess the transformation of productive structures might be misleading, since it merely reflects artefacts of export sophistication.
The remainder of the paper is organized as follows. In the next section, we present the theoretical model for our empirical analysis. Then, section 3 presents the indicators used in the paper and describes the structural transformation of exports in developing countries. Sections 4 and 5 go on to present the empirical approach and the main results, before the role of FDI is investigated and discussed in section 6. Then, section 7 discusses various policy issues related to the sustainability of productive transformation while section 8 concludes.
2. Distance to comparative advantage and the dynamics of export diversification and sophistication: the theoretical model
A developing country can upgrade its export structure by either following or defying its comparative advantage. The strategy of following comparative advantage is consistent with the Hecksher-Ohlin-Vanek (HOV) factor-based trade model, in which the structure of exports is determined by the relative factor abundance, as reflected by relative factor prices, (Leamer, 1987). For a country that is initially abundant in unskilled labor, the change of specialization should follow the change of relative factor prices consecutive upon capital accumulation along the development path (Schott, 2003). Developing economies will therefore diversify their export structure by traveling across various diversification cones, and simultaneously upgrade it by moving towards increasingly complex and capital-intensive diversification cones (Schott, 2003). In order to succeed in upgrading production and trade under these conditions, a minimal distance should always be preserved between the factor content of exports and the country’s factor endowment5. The role of the state should be limited to shaping the market incentives encouraging the matching of private firms’ production choices to the country’s current comparative advantage (Lin, 2009, 2012).
The opposite strategy, of defying comparative advantage, is based on the observation that productive transformation does not automatically arise from market incentives in most developing economies. The pervasiveness of information and coordination failures in developing countries hinders the emergence and survival of new products in domestic and external markets (Hausman and Rodrik, 2007; Rodríguez-Clare and Harrison, 2010). Moreover, since in a monopolistic competition environment, catching up with early-industrialized economies relies heavily on the development of technological capabilities through learning and experience (Lin and Chang, 2009), firms and entrepreneurs from developing countries would have to face critical entry costs imposed by developed countries’ firms to upgrade their products through market incentives. Consequently, developing countries should not wait until they have all the necessary human and physical capital before entering an industry and trying to defy comparative advantage in order to upgrade their products and exports (Sutton, 2012).
These two options, as well as their opposite implications in terms of distance to comparative advantage, can easily be illustrated using the diversification cone theory (Leamer, 1987; Schott, 2003).
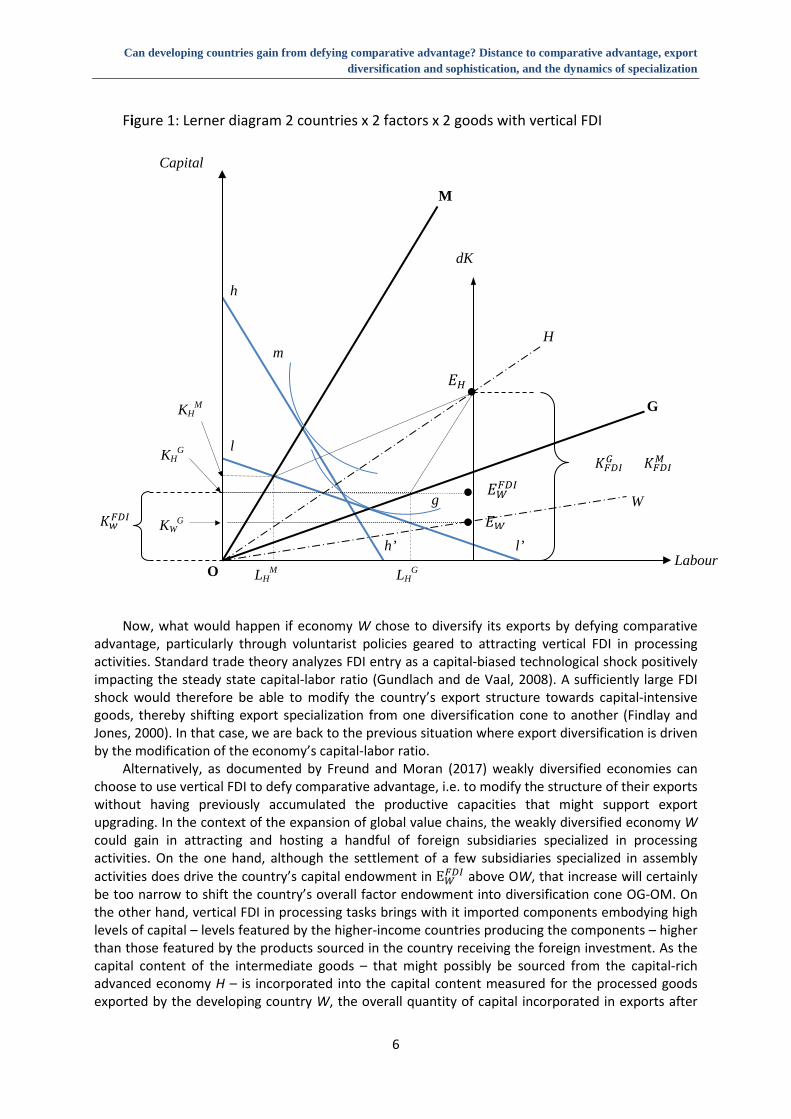
The Lerner diagram in Figure 1 represents two open economies H and W – with respectively high and low amounts of capital –, producing two goods, garments (G) and machinery (M), by combining
4 Two recent initiatives are the OECD-WTO’s Trade in Value Added and the World Bank’s Export Value Added databases. 5 Moreover, in this first-best setting, any form of governmental interference in the process of trade specialization would produce disappointing results, domestic firms becoming growingly inefficient as a result of the misallocation of resources imposed by government intervention (Krueger, 1990; Lin, 2011).
Can developing countries gain from defying comparative advantage? Distance to comparative advantage, export diversification and sophistication, and the dynamics of specialization
5
labor (K) and capital (L) in different proportions6. The x-axis (y-axis) features the quantity of labor (capital) used in the country’s exports as well as the country’s overall labor (capital) endowment. The slopes of lines OG and OM, connecting the tangency points and the origin, equal the capital intensities of goods G and M, that is the capital/labor ratios necessary to produce these two goods. Their position on the graph shows that the production of G is labor-intensive and the production of M is capital-intensive. The slope of lines OH and OW, reflecting the capital abundance (capital-labor ratio) of the two economies H and W, shows that the former is more abundantly endowed with capital than the latter. Due to cost minimization, the curves g and m, representing the unit value isoquants (one dollar's worth of output) for goods G and M, are tangential to the unit cost lines hh’ and ww’. The capital-abundant country H has the higher wage-rental ratio (as represented by the steeper unit cost line hh’) of the two economies. The position of OH within the diversification cone formed by OM and OG shows that country H is diversified and produces both the capital-intensive and labor-intensive goods M and G. Conversely, country W exports only the weakly sophisticated labor-intensive product G7. As an illustration, Figure 1 reports the units of capital 𝐾𝐾𝐻𝐻𝑀𝑀, 𝐾𝐾𝐻𝐻𝐺𝐺 and 𝐾𝐾𝑊𝑊𝐺𝐺 and labor 𝐿𝐿𝐻𝐻𝑀𝑀, 𝐿𝐿𝐻𝐻𝐺𝐺 and 𝐿𝐿𝑊𝑊𝑀𝑀 that are used by the countries H and W to produce M and G for the two specific factor endowments given by EH and EW. Note that at point EW, economy W exhausts its overall capital endowment by using 𝐾𝐾𝑊𝑊𝐺𝐺 – at the relative factor price w/rl given by the slope of ll’ – to exclusively produce and export the garment good (G)8. At point EH, the specialization equilibrium fully uses the country’s effective K/L endowment to produce the two goods G and M since 𝐾𝐾𝐻𝐻𝑀𝑀+ 𝐾𝐾𝐻𝐻𝐺𝐺 = 𝐾𝐾𝐻𝐻 and 𝐿𝐿𝐻𝐻𝑀𝑀+ 𝐿𝐿𝐻𝐻𝐺𝐺 = 𝐿𝐿𝐻𝐻.
For economy EW, diversifying and increasing sophistication of exports by following comparative advantage would simply consist of shifting the specialization equilibrium along the line dK by adding to the stock of productive capital (for a fixed endowment of labor), until the country’s overall factor endowment K/L has sufficiently increased to be located within the diversification cone OG-OM. However, this diversification process may take a long time since the increase in the capital-labor ratio incorporated in exports relies exclusively on the prior expansion of private and public investment capacities. In addition, in labor-abundant countries where population growth is rapid, it will take even longer before the slope of OW increases sufficiently to exceed that of OG.
6 Conventionally, the two economies are too small to have an influence on world prices and the two goods are homogenous. 7 Both countries therefore produce G, albeit with different factor usage intensities, the countries located in the capital-abundant cone using more capital per worker than the countries in a capital-scarce area (outside and below the cone) (Xiang, 2007). 8 The overall labor endowment is not exhausted by the amount of labor 𝐿𝐿𝑙𝑙𝐺𝐺 used to produce G. The remaining endowment could be used in non-manufacturing non-tradable production (formal or informal services) using exclusively labor at the domestic factor-price without changing the implications of the model concerning industrial diversification.
Can developing countries gain from defying comparative advantage? Distance to comparative advantage, export diversification and sophistication, and the dynamics of specialization
6
Figure 1: Lerner diagram 2 countries x 2 factors x 2 goods with vertical FDI
Now, what would happen if economy W chose to diversify its exports by defying comparative advantage, particularly through voluntarist policies geared to attracting vertical FDI in processing activities. Standard trade theory analyzes FDI entry as a capital-biased technological shock positively impacting the steady state capital-labor ratio (Gundlach and de Vaal, 2008). A sufficiently large FDI shock would therefore be able to modify the country’s export structure towards capital-intensive goods, thereby shifting export specialization from one diversification cone to another (Findlay and Jones, 2000). In that case, we are back to the previous situation where export diversification is driven by the modification of the economy’s capital-labor ratio.
Alternatively, as documented by Freund and Moran (2017) weakly diversified economies can choose to use vertical FDI to defy comparative advantage, i.e. to modify the structure of their exports without having previously accumulated the productive capacities that might support export upgrading. In the context of the expansion of global value chains, the weakly diversified economy W could gain in attracting and hosting a handful of foreign subsidiaries specialized in processing activities. On the one hand, although the settlement of a few subsidiaries specialized in assembly activities does drive the country’s capital endowment in E𝑊𝑊𝐹𝐹𝐹𝐹𝐹𝐹 above OW, that increase will certainly be too narrow to shift the country’s overall factor endowment into diversification cone OG-OM. On the other hand, vertical FDI in processing tasks brings with it imported components embodying high levels of capital – levels featured by the higher-income countries producing the components – higher than those featured by the products sourced in the country receiving the foreign investment. As the capital content of the intermediate goods – that might possibly be sourced from the capital-rich advanced economy H – is incorporated into the capital content measured for the processed goods exported by the developing country W, the overall quantity of capital incorporated in exports after
LHG LH
M
KHG
KHM
𝐾𝐾𝑤𝑤𝐹𝐹𝐹𝐹𝐹𝐹
𝐾𝐾𝐹𝐹𝐹𝐹𝐹𝐹𝐺𝐺 + 𝐾𝐾𝐹𝐹𝐹𝐹𝐹𝐹𝑀𝑀
Labour
M
l’ h’
h
l
dK
O
m
g
. 𝐸𝐸𝐻𝐻
G
. 𝐸𝐸𝑊𝑊
𝐸𝐸𝑊𝑊𝐹𝐹𝐹𝐹𝐹𝐹
KWG
.
Capital
H
W
Can developing countries gain from defying comparative advantage? Distance to comparative advantage, export diversification and sophistication, and the dynamics of specialization
7
vertical FDI entry (𝐾𝐾𝐹𝐹𝐹𝐹𝐹𝐹𝐺𝐺 + 𝐾𝐾𝐹𝐹𝐹𝐹𝐹𝐹𝑀𝑀 ) now stands far above the economy’s settled capital endowment (given by the ordinate of E𝑊𝑊𝐹𝐹𝐹𝐹𝐹𝐹).
To summarize, in a sufficiently large economy with an initially concentrated export structure, FDI in processing can be too limited in scope to modify the whole relative endowment and relative factor price, while being able, at the same time, to modify the structure of exports by bringing about export diversification on the extensive margins and export sophistication through the capital intensity of component imports. Since the overall capital content of exports (𝐾𝐾𝐹𝐹𝐹𝐹𝐹𝐹𝐺𝐺 + 𝐾𝐾𝐹𝐹𝐹𝐹𝐹𝐹𝑀𝑀 ) is not fully sourced in the exporting economy – a significant part of it is incorporated in the imported intermediate goods before they were processed and re-exported –, vertical FDI in processing activities introduces a gap between the factor content of exports, in EH, and the country’s factor endowment in E𝑊𝑊𝐹𝐹𝐹𝐹𝐹𝐹 that we call distance to comparative advantage.
Since the factor content of export and the factor endowment of the economy are dissociated, the pattern of export diversification and sophistication through FDI in assembly activities does not correspond to a specialization equilibrium. FDI in processing activities brings about a distortion since the factor content of exports is, at least provisionally, no longer consistent with the prevailing domestic relative factor price w/rc
9. Temporarily, two relative factor prices will coexist. The first one,
characterizing the whole economy, is consistent with the country’s factor endowment and with the specialization in garments, whereas the other is consistent with the factor content of the components imported and the processed goods exported and with the transfer prices internal to the foreign TNC’s subsidiaries.
Such a ‘heterodox’ pattern is not completely inconsistent with standard trade theory, though. First, it is consistent with the HOV model if one can assume that the capital intensity necessary to produce and export the machinery good at international prices is made available to the capital-poor economy through the imported components sourced in the countries effectively endowed with such levels of capital-labor intensity, as discussed above. Second, Schott (2003) has established that a country can reside in different cones of diversification at the same time, notably as the mix of goods produced and exported evolves after the country develops and accumulates capital. A labor-abundant country migrating into the OG-OM diversification cone will increase the sophistication of its export basket by starting to export the machinery good while simultaneously diversifying it, since the prior specialization in garments is not instantly abandoned. Although producing garments might prove too costly at the factor price w/rh (given by the slope of hh’) prevailing in the diversification cone, the prior specialization in garments may well survive in the medium term because subsidies or tariffs artificially reduce its effective production cost by maintaining w/rl for domestic producers of garments (Cadot et al., 2011) 10.
In our model, the factor price required for exporting the sophisticated machinery good is that which prevails in the diversification cone. Exactly as for direct sectoral subsidies to production, the primary goal of the policies designed to attract vertical FDI in targeted sectors is to reduce the excessive cost of the capital involved in the production of the capital-intensive good (machinery in Figure 1) for the developing economy (W in Figure 1), by facilitating the entry of foreign subsidiaries facing lower relative costs of capital than domestic firms. Since they do not substantially modify the country’s factor endowment, these quasi-subsidies will promote export of machinery from the
9 Since addition of capital to the economy’s initial endowment is limited, the domestic ratio K/L may be only marginally modified and relative factor prices may consequently remain close to their initial w/rc value. 10 Xiang (2007) describes this possibility when one of the two goods is not homogenous and is produced by two countries. The advanced country can maintain its production, albeit with a higher capital intensity and a lower wage/rent ratio than the developing country. Reciprocally, the developing country can produce and export a variety of a good typically produced by the advanced country which is distant from its comparative advantage by subsidizing its production. Although this case could have easily been included in our theoretical model (at the intersection of OH and ll’), we have preferred to focus our illustrative model on the attraction of vertical FDI.
Can developing countries gain from defying comparative advantage? Distance to comparative advantage, export diversification and sophistication, and the dynamics of specialization
8
foreign subsidiaries, while being neutral on the previous garment specialization since the domestic relative factor price ratio ww’ is only marginally affected by FDI11.
Indeed, foreign firms investing in economy W generally bring with them more sophisticated technologies and inputs than those characterizing domestic firms. The capital included in imported components will therefore simultaneously increase the distance between the factor content of exports and the country’s factor endowment, and make this distance more contributive to export sophistication than it would be under mere domestic capital accumulation. Only after additional capital has been installed will the domestic relative factor price ratio (w/r) progressively increase with endogenous domestic capital accumulation, shifting the country’s equilibrium specialization to the diversification cone delineated by OG-OM12. The issues raised by the dynamics of the country’s capital endowment are discussed more extensively in section 7.
3. Productive transformation and comparative advantage in developing countries: measurement and trends
Identifying the impact of the distance to comparative advantage on structural change requires that productive transformation and the distance between the export factor content and the country’s factor endowment be measured consistently. All our variables of interest have thus been computed using the United Nations Commodity Trade Statistics Database (COMTRADE) covering over 5,000 products at the Harmonized System 6-digit level13. Our panel is unbalanced and consists of 137 countries, including 23 low-income, 69 middle-income and 45 high-income countries over the period 1992-2012.
3.1. Measuring conformity to/defiance of comparative advantage: The Technical Choice Index
Such policy determinants of productive transformation as sectoral subsidies to firms or fiscal incentives to attract FDI in assembly industries are difficult to assess at country level. In order to measure them, Lin (2009, 2012) proposed the adoption of an indirect approach by comparing the revealed comparative advantage – the effective factor content of exports – and the latent comparative advantage, based on the country’s factor endowment. The Technical Choice Index comparing the factor content of exports and the country’s factor endowment provides an ex post measurement of the specialization strategy adopted by a nation. When the comparative advantage revealed by exports is distant from the current factor endowments, we say that the country’s export
11 In Figure 1, the slope of ww’ should have increased after the entry of vertical FDI has shifted country W’s factor endowment to E𝑊𝑊𝐹𝐹𝐹𝐹𝐹𝐹, therefore modifying the equilibrium level of specialization and of factor use. For the sake of clarity, we did not represent it on Figure 1, although this had no effect on the mechanisms described by the model. 12 It should be noted that, until domestic accumulation takes place and domestic factor endowment catches up with export factor content, increase in capital-intensive exports may not imply that domestic factor prices might change. In a world integrated by GVCs, skills and capital imported through FDI generally mobilize production techniques locally that are more intensive in physical and human capital than those in the other domestic sectors (Sutton, 2012). Recent evidence from GVC break-down shows that this may not necessarily have an impact on relative factor prices and increase the rent-wage ratio in developing countries as long as a large surplus of unskilled labor is available (Timmer et al., 2014). 13 The COMTRADE database only covers agricultural and manufacturing exports, including re-exported products, while excluding services and non-exported production. Depending on the year and the country, data are delivered in different versions of the harmonized system. There are four different versions of the harmonized system, the first one having been introduced in 1988-1992. The system has been revised four times, in 1996, 2002, 2007 and 2012.
Can developing countries gain from defying comparative advantage? Distance to comparative advantage, export diversification and sophistication, and the dynamics of specialization
9
structure defies its comparative advantage; the economy adopts a Comparative Advantage-Defying strategy (CAD). Conversely, when the distance is shorter, the country’s export structure aligns with the country’s comparative advantage; the country adopts a Comparative Advantage-Following strategy (CAF).
Briefly, the TCI measures the distance between the factor content of exports and countries’ factor endowments, with these two elements being restricted to labor and physical capital14. Country i’s TCI is calculated for each year as:
𝑇𝑇𝑇𝑇𝑇𝑇𝑖𝑖 = 𝐾𝐾𝑖𝑖𝑖𝑖
𝐿𝐿𝑖𝑖𝑖𝑖�𝐾𝐾𝑖𝑖
𝐿𝐿𝑖𝑖� (1)
where Kim /Lim is the average capital/labor ratio of country i’s export basket and Ki/Li is that country’s capital/labor ratio. A country exporting labor-intensive goods, while being richly endowed in capital, will have a TCI of less than one. Conversely, a country exporting capital-intensive products, although it is poorly endowed with capital, will have a TCI greater than 1. Although the former case is unlikely to be observed frequently, the second is typical of developing countries promoting capital-intensive industries by using targeted support to domestic firms or using incentives to attract FDI in re-exporting industries. In middle-income and higher-income countries, where the factor content of exports is closer to the country’s factor endowment, TCI is closer to one.
In order to compute the export factor content Kim/Lim, we use Shirotori et al. (2010)’s database which provides HS0-6 digit-level indices of revealed capital/labor intensity for approximately 5,000 exported products15. For each good, they have calculated the weighted average of the factor abundance of the countries that export this good, with the weights being variants of Balassa’s Revealed Comparative Advantage index. We estimate the factor content of exports by combining trade data from UN-COMTRADE and product factor intensity from Shirotori et al. (2010). We compute the weighted average of the factor content of exports from country i, where the weight is the value share of product j in the country’s total exports (
𝑥𝑥𝑖𝑖𝑖𝑖𝑋𝑋𝑖𝑖
).
The average factor content of country i is given for each year by:
𝐾𝐾𝑖𝑖𝑖𝑖𝐿𝐿𝑖𝑖𝑖𝑖� = ∑ 𝑥𝑥𝑖𝑖𝑖𝑖
𝑋𝑋𝑖𝑖 (𝐾𝐾 𝐿𝐿� )𝑗𝑗𝑗𝑗 (2)
with (K/L)j the factor content of product j provided by Shirotori et al. (2010). Countries’ factor endowments – the Ki/Li ratio – are available on Shirotori et al (2010)’s
database for 137 countries over the period 1961-201216. We could easily have computed the TCI, which must be interpreted with respect to the value 1. To make it more tractable, we have expressed the index on a positive scale and taken its absolute value ranging from 0 to 93. Since, by definition, the TCI index decreases with the capital stock per worker, countries endowed with less physical capital should show higher TCI levels than those with higher capital/labor ratios.
14 Obviously, there are many other factors of production complementary to labor and physical capital, like land and infrastructure. On the grounds that land is exogenously given and that natural resources exist underground in fixed quantity and their discovery is random, Lin does not include natural capital in his analysis (Lin, 2012). For a recent analysis of the distance to comparative advantage including natural resources, see Nicita et al. (2012). 15 By transforming our database into the HS 88/92 version, we have lost some information since there is not a 1:1 correspondence between the different versions of the HS. 16 The dataset is available on The World Integrated Trade Solution (WITS), a piece of software developed by the World Bank. After 2007, export factor contents are estimated based on countries’ factor endowments for the year 2007.
Can developing countries gain from defying comparative advantage? Distance to comparative advantage, export diversification and sophistication, and the dynamics of specialization
10
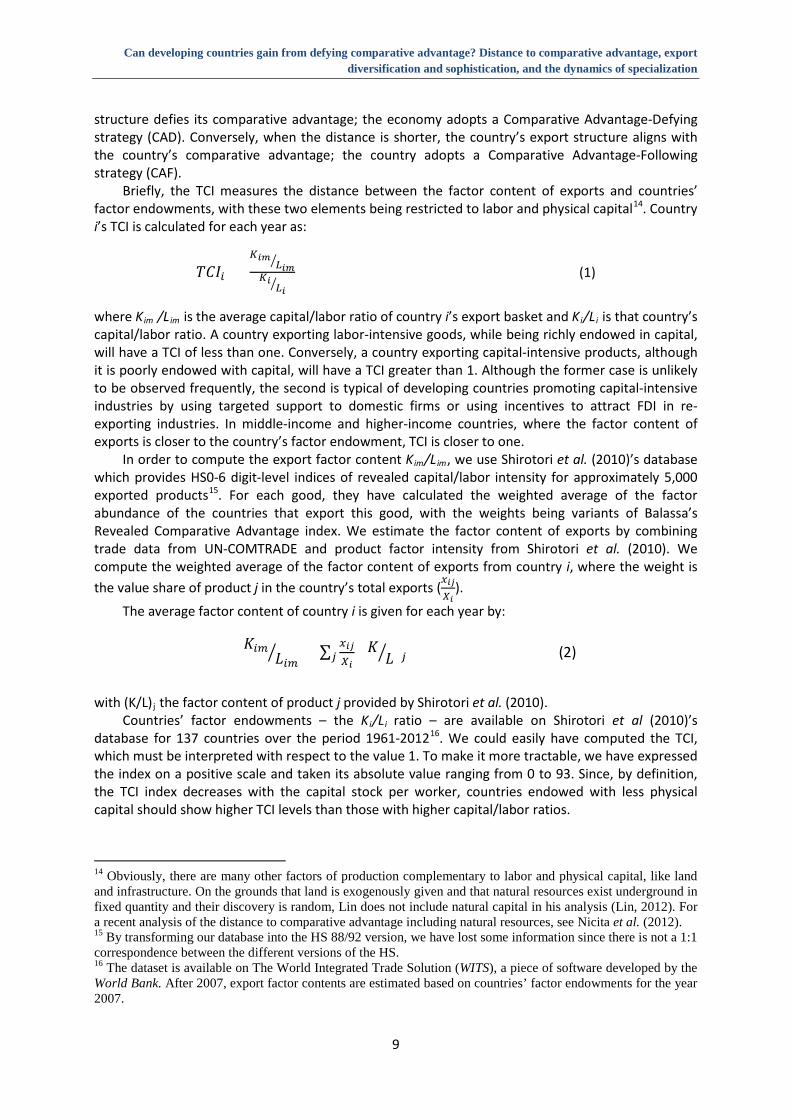
Figure 2: Technological choice index by income per capita quintile, 1990-2010
Source : Authors' calculations based on Shirotori, Tumurchurdur and Cadot (2010). Note: Subgraph 1 has its own scale. Income groups are GDP-per capita quintiles for the year 2010.
Figure 2, shows the yearly level of the TCI index averaged by income quintiles; each graph has his own scale. TCI and income levels are inversely correlated and, overall, TCI has constantly increased for developing countries during the last 10 years17. By contrast, TCI is remarkably low and stable for higher-middle income (R4) and higher income (R5) countries, signaling higher conformity of exports to comparative advantage in more developed countries18.
The question now arises as to whether this trend is concomitant with the transformation of the productive structure.
3.2. Measuring productive transformation: Export diversification and sophistication
In order to assess the different dimensions of change in the export structure, various indicators are used. The Theil index of exports is computed by using trade data at the 6-digit HS classification. The Theil index is traditionally used in the empirical trade literature (Cadot et al., 2011; Parteka and Tamberi, 2013) and assesses the concentration of exports in different sectors.
For each year, Theil’s entropy index is given by:
17 The sharp trends at the beginning of the period are attributable to the addition of new countries with available data to the sample. The sample is almost complete around 1995-2000. 18 In high-income countries, the observed rise comes from the scale used rather than a significant increase.
Can developing countries gain from defying comparative advantage? Distance to comparative advantage, export diversification and sophistication, and the dynamics of specialization
11
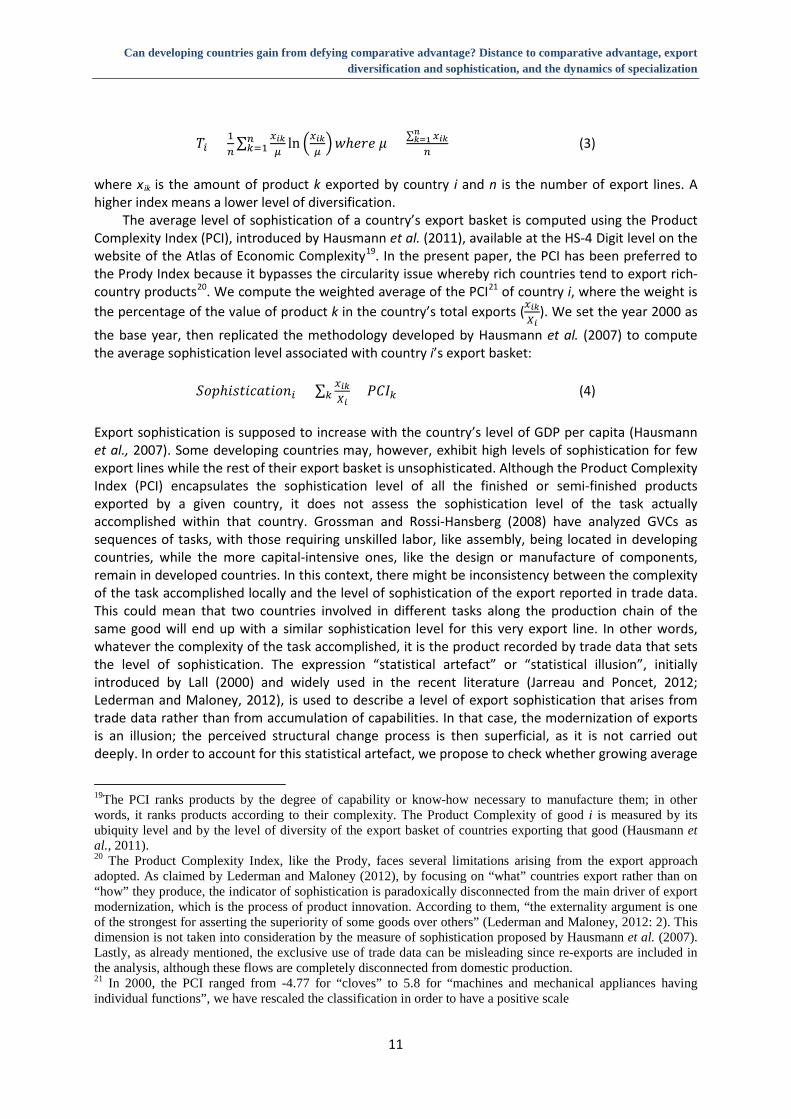
𝑇𝑇𝑖𝑖 = 1𝑛𝑛∑ 𝑥𝑥𝑖𝑖𝑖𝑖
𝜇𝜇𝑛𝑛𝑘𝑘=1 ln �𝑥𝑥𝑖𝑖𝑖𝑖
𝜇𝜇�𝑤𝑤ℎ𝑒𝑒𝑒𝑒𝑒𝑒 𝜇𝜇 = ∑ 𝑥𝑥𝑖𝑖𝑖𝑖𝑛𝑛
𝑖𝑖=1𝑛𝑛
(3)
where xik is the amount of product k exported by country i and n is the number of export lines. A higher index means a lower level of diversification.
The average level of sophistication of a country’s export basket is computed using the Product Complexity Index (PCI), introduced by Hausmann et al. (2011), available at the HS-4 Digit level on the website of the Atlas of Economic Complexity19. In the present paper, the PCI has been preferred to the Prody Index because it bypasses the circularity issue whereby rich countries tend to export rich-country products20. We compute the weighted average of the PCI21 of country i, where the weight is the percentage of the value of product k in the country’s total exports (𝑥𝑥𝑖𝑖𝑖𝑖
𝑋𝑋𝑖𝑖). We set the year 2000 as
the base year, then replicated the methodology developed by Hausmann et al. (2007) to compute the average sophistication level associated with country i’s export basket:
𝑆𝑆𝑆𝑆𝑆𝑆ℎ𝑖𝑖𝑖𝑖𝑖𝑖𝑖𝑖𝑖𝑖𝑖𝑖𝑖𝑖𝑖𝑖𝑆𝑆𝑖𝑖𝑖𝑖 = ∑ 𝑥𝑥𝑖𝑖𝑖𝑖
𝑋𝑋𝑖𝑖× 𝑃𝑃𝑇𝑇𝑇𝑇𝑘𝑘𝑘𝑘 (4)
Export sophistication is supposed to increase with the country’s level of GDP per capita (Hausmann et al., 2007). Some developing countries may, however, exhibit high levels of sophistication for few export lines while the rest of their export basket is unsophisticated. Although the Product Complexity Index (PCI) encapsulates the sophistication level of all the finished or semi-finished products exported by a given country, it does not assess the sophistication level of the task actually accomplished within that country. Grossman and Rossi-Hansberg (2008) have analyzed GVCs as sequences of tasks, with those requiring unskilled labor, like assembly, being located in developing countries, while the more capital-intensive ones, like the design or manufacture of components, remain in developed countries. In this context, there might be inconsistency between the complexity of the task accomplished locally and the level of sophistication of the export reported in trade data. This could mean that two countries involved in different tasks along the production chain of the same good will end up with a similar sophistication level for this very export line. In other words, whatever the complexity of the task accomplished, it is the product recorded by trade data that sets the level of sophistication. The expression “statistical artefact” or “statistical illusion”, initially introduced by Lall (2000) and widely used in the recent literature (Jarreau and Poncet, 2012; Lederman and Maloney, 2012), is used to describe a level of export sophistication that arises from trade data rather than from accumulation of capabilities. In that case, the modernization of exports is an illusion; the perceived structural change process is then superficial, as it is not carried out deeply. In order to account for this statistical artefact, we propose to check whether growing average
19The PCI ranks products by the degree of capability or know-how necessary to manufacture them; in other words, it ranks products according to their complexity. The Product Complexity of good i is measured by its ubiquity level and by the level of diversity of the export basket of countries exporting that good (Hausmann et al., 2011). 20 The Product Complexity Index, like the Prody, faces several limitations arising from the export approach adopted. As claimed by Lederman and Maloney (2012), by focusing on “what” countries export rather than on “how” they produce, the indicator of sophistication is paradoxically disconnected from the main driver of export modernization, which is the process of product innovation. According to them, “the externality argument is one of the strongest for asserting the superiority of some goods over others” (Lederman and Maloney, 2012: 2). This dimension is not taken into consideration by the measure of sophistication proposed by Hausmann et al. (2007). Lastly, as already mentioned, the exclusive use of trade data can be misleading since re-exports are included in the analysis, although these flows are completely disconnected from domestic production. 21 In 2000, the PCI ranged from -4.77 for “cloves” to 5.8 for “machines and mechanical appliances having individual functions”, we have rescaled the classification in order to have a positive scale
Can developing countries gain from defying comparative advantage? Distance to comparative advantage, export diversification and sophistication, and the dynamics of specialization
12
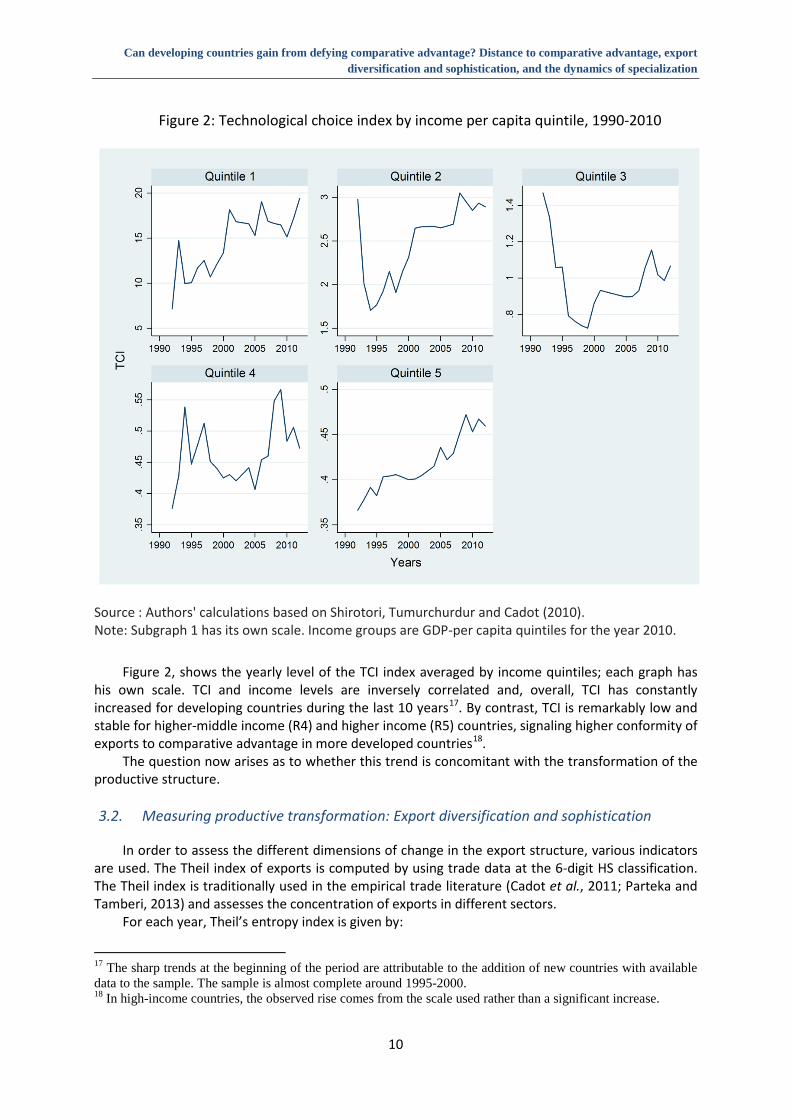
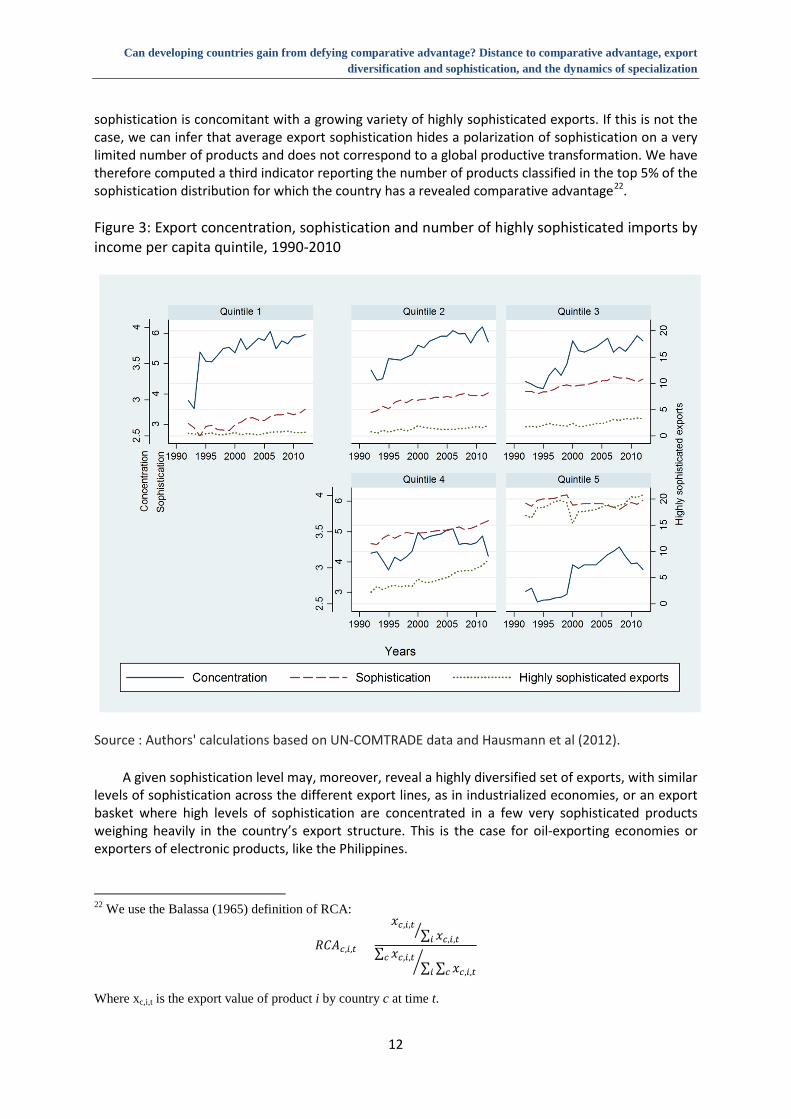
sophistication is concomitant with a growing variety of highly sophisticated exports. If this is not the case, we can infer that average export sophistication hides a polarization of sophistication on a very limited number of products and does not correspond to a global productive transformation. We have therefore computed a third indicator reporting the number of products classified in the top 5% of the sophistication distribution for which the country has a revealed comparative advantage22. Figure 3: Export concentration, sophistication and number of highly sophisticated imports by income per capita quintile, 1990-2010
Source : Authors' calculations based on UN-COMTRADE data and Hausmann et al (2012). A given sophistication level may, moreover, reveal a highly diversified set of exports, with similar
levels of sophistication across the different export lines, as in industrialized economies, or an export basket where high levels of sophistication are concentrated in a few very sophisticated products weighing heavily in the country’s export structure. This is the case for oil-exporting economies or exporters of electronic products, like the Philippines.
22 We use the Balassa (1965) definition of RCA:
𝑅𝑅𝑇𝑇𝑅𝑅𝑐𝑐,𝑖𝑖,𝑡𝑡 =
𝑥𝑥𝑐𝑐,𝑖𝑖,𝑡𝑡∑ 𝑥𝑥𝑐𝑐,𝑖𝑖,𝑡𝑡𝑖𝑖�
∑ 𝑥𝑥𝑐𝑐,𝑖𝑖,𝑡𝑡𝑐𝑐∑ ∑ 𝑥𝑥𝑐𝑐,𝑖𝑖,𝑡𝑡𝑐𝑐𝑖𝑖�
Where xc,i,t is the export value of product i by country c at time t.
Can developing countries gain from defying comparative advantage? Distance to comparative advantage, export diversification and sophistication, and the dynamics of specialization
13
Consequently, it seems essential to analyze the three indicators – export concentration, export sophistication and the number of highly sophisticated exports – simultaneously in order to describe the productive transformation process as precisely as possible.
Figure 3 shows that export concentration and sophistication have increased over the last fifteen years for all income quintiles23. Average export sophistication and the number of highly sophisticated products in the export basket should progress in tandem, indicating that the economy is effectively accumulating the productive capacity enabling sophistication to take place. However, parallel trends of growing export sophistication level and diversification of sophisticated exports are mainly observed for the 4th quintile and since 2005 for the 3rd quintile. No other developing region has successfully increased the number of sophisticated products exported with comparative advantage, while simultaneously increasing its export sophistication. The rise of export sophistication may not automatically indicate an effective improvement of productive capability through the accumulation of physical and human capital. Rather, it might reflect the concentration of export sophistication in a limited number of activities, like capital-intensive natural resource extraction or assembly industries, prompted by foreign investment, and generating only limited productivity spillover for the rest of the economy.
4. Identification and estimation issues
This empirical analysis investigates the impact of the CAD strategy on three complementary dimensions of structural change: export diversification, export sophistication and the number of highly sophisticated products exported with a RCA. Our baseline econometric specification is drawn from the most recent empirical literature on the drivers of trade diversification (Munemo, 2011; Cadot et al., 2011b; Agosin et al., 2012; Parteka and Tamberi, 2013a) and export sophistication (Weldemicael, 2012; Zhu and Fu, 2013)
All the variables of productive transformation are explained by a common set of control variables: GDP per capita (PPP), human capital (average number of years of secondary schooling) and natural capital endowments (natural resource rents), institutional quality (Polity IV democracy index), infrastructure (telephone), the size of the economy (population size), the economy’s remoteness, trade openness (openness index) and foreign direct investment stocks24. Our variable of interest, the TCI, measuring the degree of non-conformity to factor endowment, is added to the set of regressors, together with its squared value (see the justification below).
The estimated model therefore takes the form:
𝑌𝑌𝑖𝑖,𝑡𝑡 =∝1 𝑌𝑌𝑖𝑖,𝑡𝑡−1 +∝2 𝑇𝑇𝑇𝑇𝑇𝑇𝑖𝑖,𝑡𝑡 +∝3 𝑇𝑇𝑇𝑇𝑇𝑇²𝑖𝑖,𝑡𝑡 + ∝4 𝑋𝑋𝑖𝑖,𝑡𝑡 + 𝜕𝜕𝑖𝑖 + 𝛾𝛾𝑡𝑡 + 𝜀𝜀𝑖𝑖,𝑡𝑡 (5)
where Y i,t alternatively stands for country i’s level of diversification, sophistication or the number of highly sophisticated products exported with a RCA, manufacturing value added as a percentage of GDP and manufacturing percentage of exports at time t. Y i,t-1 is the lagged value of Y, X i,t is the vector of traditional drivers of structural transformation and 𝜕𝜕𝑖𝑖, 𝛾𝛾𝑡𝑡 and 𝜀𝜀𝑖𝑖,𝑡𝑡 are respectively country fixed effects, time fixed effects and the error term.
A first estimation issue relates to hysteresis. Since productive transformation is a slow process, the current state of the productive structure is highly dependent on its past states. Export diversification and sophistication at time t thus depend on their past values at time t-1. In line with the literature, we account for this inertia by introducing the lagged value of the dependent variable as a regressor, as illustrated in Equation (5).
23 Income quintiles have been calculated for the year 2010 24 The definition and sources of the variables, as well as descriptive statistics, are reported in Appendix 1.
Can developing countries gain from defying comparative advantage? Distance to comparative advantage, export diversification and sophistication, and the dynamics of specialization
14
A second estimation issue lies in the potential non-linearity of the impact of the TCI on productive transformation. First, defying comparative advantage may have a non-linear impact on export diversification and sophistication. Small deviations will have a limited impact on structural transformation, while, conversely, large deviations will create distortions that might lead to resource misallocation and dynamic inefficiencies. Although Lin advocates zero deviation, Chang contends that it should be large enough to have a significant effect on the productive structure of non-industrialized countries (Lin and Chang, 2009). Accordingly, the squared value of the TCI has been introduced into Equation 4 in order to address the potential inverted U-shaped pattern25. We could therefore estimate threshold levels of TCI beyond which further defying of comparative advantage eventually hinders export diversification and sophistication.
Third, the potential relationship between the TCI and structural change may be heterogeneous with respect to the country’s economic development level. In order to address this issue, the overall sample is split into two subgroups by income levels, with regressions being run on these two subgroups. The first income subgroup (hereafter R1), including the poorest countries, corresponds to the first and second quintile of the income per capita distribution for the year 2010. The second subgroup (R2) brings together middle-income countries, i.e. the third and fourth quintiles of GDP per capita distribution in 201026. Lastly, on the assumption that following comparative advantage could have a stronger adverse impact on productive transformation in resource-rich countries than in other countries, as explained by the natural resource curse literature (Lederman and Maloney, 2007), Equation 4 was also estimated for the subsample of countries whose natural resource exports represent more than 10% of GDP at the end of the period.
The fourth estimation issue lies in the potential endogeneity of most of our explanatory variables to the degree of productive transformation (Zhu and Fu, 2013; Agosin et al, 2009; Parteka and Tamberi, 2013). Both export diversification and sophistication may show feedback with respect to the gap between factor content and factor endowment. In economies with strongly concentrated export baskets, the emergence of a few sophisticated export lines featuring a level of the capital/labor content higher than the country’s average endowment may have a significant influence on the average TCI level. For weakly diversified, lower-income countries, a change in the country’s distance to comparative advantage may therefore be a response to the emergence of one or a few export lines with a high level of sophistication. Yet, as income grows, distance to comparative advantage becomes less sensitive to the increase in sophisticated exports because the export basket becomes more diversified. This is why, as the study goes forward, we focus on middle-income countries, which are weakly affected by this endogeneity issue.
In order to address simultaneity and endogeneity issues, we opt for the GMM-System estimator (Arellano and Bover, 1995; Blundell and Bond, 1998) that has better small-sample properties in terms of bias and root mean squared error than GMM-Difference (Holtz-Eakin, 1988; Arellano and Bond, 1991). GMM-System outperforms GMM-Difference in unbalanced panels, which is our case (Roodman, 2009). GMM-System combines one first-difference equation where the endogenous variables are instrumented by their lagged levels, with one level equation in which variables are instrumented by their own lagged first-difference. In GMM-System estimation, valid instruments are
25 Output diversification increases non-linearly with economic development. Developing economies start by diversifying their productive structure before re-concentrating it after a higher income level has been reached (Imbs and Wacziarg, 2003; Cadot et al., 2011a). The existence of the re-concentration stage is nevertheless rejected by Parteka and Tamberi (2007) and De Benedictis et al. (2009), arguing that its identification relies on excessively restrictive conditions. A similar assumption is present in the standard factor-content theory of trade specialization showing that economies with more than three factors and more products than factors exhibit different cones of diversification and their net exports are not a linear function of the relative endowment of factors. Álvarez and Fuentes (2006) also include squared terms of relative factor endowment to address this issue. 26 We did not include the richest countries’ subsample because their TCI is close to one and very stable.
Can developing countries gain from defying comparative advantage? Distance to comparative advantage, export diversification and sophistication, and the dynamics of specialization
15
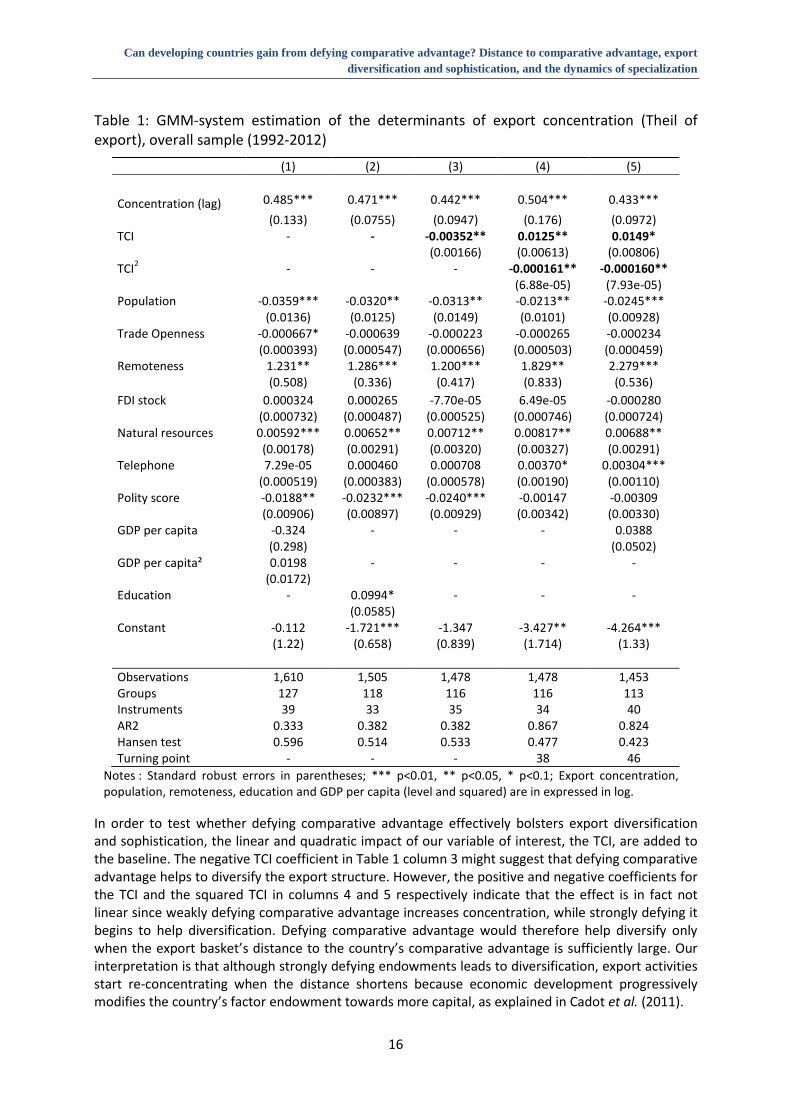
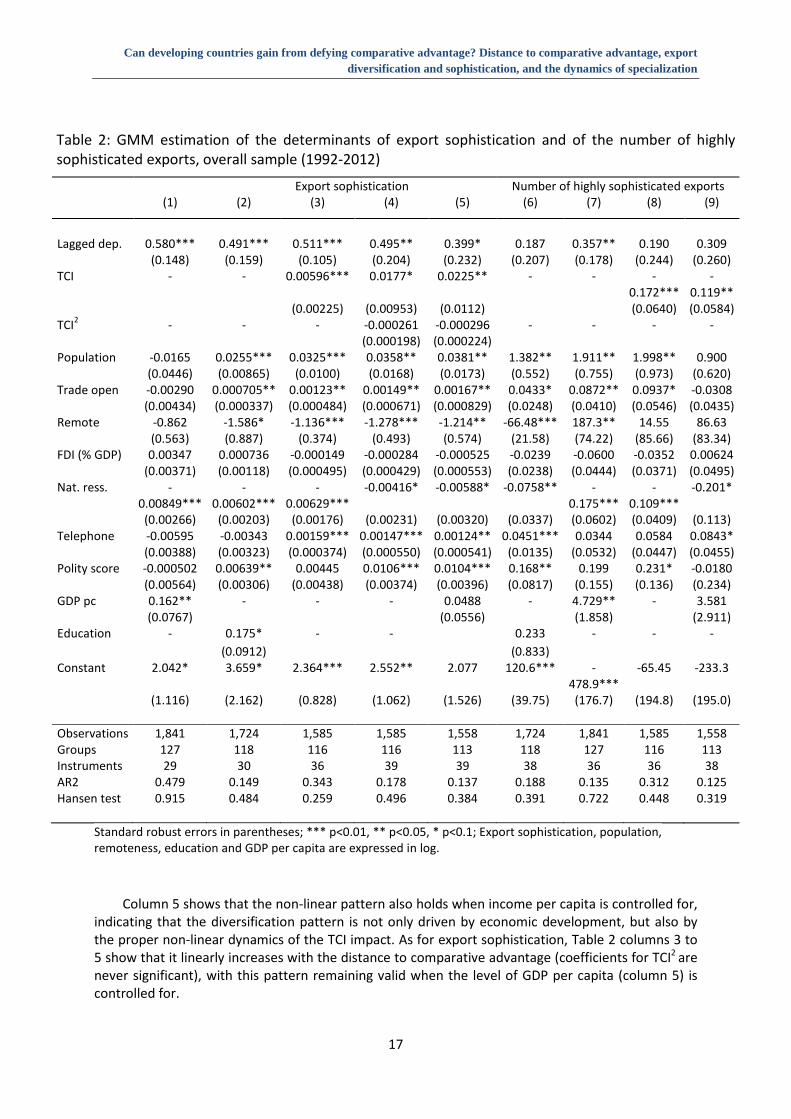
generally at least two-period lags for the endogenous variable and one-period lags for the predetermined variable. In order to avoid over-fitting of the instrumented variable, we use only two-, three- and four-period lags in our set of instruments and maximize the Hansen tests of our estimations27. Moreover, Equation 4 was estimated on various subsamples of developing countries. 5. Distance to comparative advantage and export structure transformation: Baseline evidence Tables 1 and 2 respectively report estimation results for export diversification and export sophistication for the overall sample28. A quick look at the results of the baseline equation estimations excluding the TCI level, reported in columns 1 and 2 of both tables, shows that they support existing empirical evidence (Cadot et al. 2011b; Parteka and Tamberi, 2013). Since they are highly correlated, human capital and initial GDP per capita are not used simultaneously as regressors. As expected, larger, less remote, more open countries have both more diversified and more sophisticated export structures for at least one of these two specifications. As for human capital, it triggers export sophistication, while having an adverse impact on export diversification, an impact which nevertheless vanishes when income per capita is controlled for (not reported), as in Weldemicael (2012) or Elhiraika and Mbate (2014). A higher institutional quality and a lower dependence on natural resources both increase export diversification and sophistication. The quality of infrastructure, proxied by the number of telephone lines, has the expected positive effect on export sophistication. Lastly, FDI stocks have no direct influence on export diversification or sophistication. The quadratic relationship between export diversification and economic development (Cadot et al., 2011a) is not supported by our estimations as coefficients of GDP per capita and squared GDP per capita are not significant in Table 1 column 1. As expected, export sophistication linearly increases with GDP per capita (Table 2 columns 1 and 7), although statistical significance vanishes when the TCI is controlled for (Table 2 columns 5 and 9). Table 2 columns 6 to 8 show that the baseline determinants of the number of highly sophisticated exports are very similar to those of the average sophistication level, except when both TCI and GDP per capita are included as regressors (column 9). However, we can confirm that the TCI keeps its significant positive impact on the number of highly sophisticated products exported with a revealed comparative advantage.
27 In order to reduce the number of instruments (that should be inferior to the number of groups) we use Roodman (2009)’s estimator xtabond2 and its “collapse” command, which reduces the number of instruments (lagged values). In order to address the validity of the instruments, and consequently of the GMM estimation, the Arellano-Bond serial correlation and the Hansen tests of over-identifying restrictions have been reported at the bottom of the Tables. 28 Correlations reported in Appendix 2 reveal that GDP is highly correlated with human capital. Those variables have also been included separately in the specification. Moreover, in order to account for the potential influence of changes in international prices, the real effective exchange rate (REER) and the terms of trade deterioration (Terms of trade) were introduced into the baseline estimation, without modifying the core results. Results are reported in Appendix 3.
Can developing countries gain from defying comparative advantage? Distance to comparative advantage, export diversification and sophistication, and the dynamics of specialization
16
Table 1: GMM-system estimation of the determinants of export concentration (Theil of export), overall sample (1992-2012)
(1) (2) (3) (4) (5) Concentration (lag) 0.485*** 0.471*** 0.442*** 0.504*** 0.433*** (0.133) (0.0755) (0.0947) (0.176) (0.0972) TCI - - -0.00352** 0.0125** 0.0149* (0.00166) (0.00613) (0.00806) TCI2 - - - -0.000161** -0.000160** (6.88e-05) (7.93e-05) Population -0.0359*** -0.0320** -0.0313** -0.0213** -0.0245*** (0.0136) (0.0125) (0.0149) (0.0101) (0.00928) Trade Openness -0.000667* -0.000639 -0.000223 -0.000265 -0.000234 (0.000393) (0.000547) (0.000656) (0.000503) (0.000459) Remoteness 1.231** 1.286*** 1.200*** 1.829** 2.279*** (0.508) (0.336) (0.417) (0.833) (0.536) FDI stock 0.000324 0.000265 -7.70e-05 6.49e-05 -0.000280 (0.000732) (0.000487) (0.000525) (0.000746) (0.000724) Natural resources 0.00592*** 0.00652** 0.00712** 0.00817** 0.00688** (0.00178) (0.00291) (0.00320) (0.00327) (0.00291) Telephone 7.29e-05 0.000460 0.000708 0.00370* 0.00304*** (0.000519) (0.000383) (0.000578) (0.00190) (0.00110) Polity score -0.0188** -0.0232*** -0.0240*** -0.00147 -0.00309 (0.00906) (0.00897) (0.00929) (0.00342) (0.00330) GDP per capita -0.324 - - - 0.0388 (0.298) (0.0502) GDP per capita² 0.0198 - - - - (0.0172) Education - 0.0994* - - - (0.0585) Constant -0.112 -1.721*** -1.347 -3.427** -4.264*** (1.22) (0.658) (0.839) (1.714) (1.33) Observations 1,610 1,505 1,478 1,478 1,453 Groups Instruments AR2 Hansen test Turning point
127 39
0.333 0.596
-
118 33
0.382 0.514
-
116 35
0.382 0.533
-
116 34
0.867 0.477
38
113 40
0.824 0.423
46 Notes : Standard robust errors in parentheses; *** p<0.01, ** p<0.05, * p<0.1; Export concentration, population, remoteness, education and GDP per capita (level and squared) are in expressed in log.
In order to test whether defying comparative advantage effectively bolsters export diversification and sophistication, the linear and quadratic impact of our variable of interest, the TCI, are added to the baseline. The negative TCI coefficient in Table 1 column 3 might suggest that defying comparative advantage helps to diversify the export structure. However, the positive and negative coefficients for the TCI and the squared TCI in columns 4 and 5 respectively indicate that the effect is in fact not linear since weakly defying comparative advantage increases concentration, while strongly defying it begins to help diversification. Defying comparative advantage would therefore help diversify only when the export basket’s distance to the country’s comparative advantage is sufficiently large. Our interpretation is that although strongly defying endowments leads to diversification, export activities start re-concentrating when the distance shortens because economic development progressively modifies the country’s factor endowment towards more capital, as explained in Cadot et al. (2011).
Can developing countries gain from defying comparative advantage? Distance to comparative advantage, export diversification and sophistication, and the dynamics of specialization
17
Table 2: GMM estimation of the determinants of export sophistication and of the number of highly sophisticated exports, overall sample (1992-2012)
Export sophistication Number of highly sophisticated exports (1) (2) (3) (4) (5) (6) (7) (8) (9)
Lagged dep. 0.580*** 0.491*** 0.511*** 0.495** 0.399* 0.187 0.357** 0.190 0.309 (0.148) (0.159) (0.105) (0.204) (0.232) (0.207) (0.178) (0.244) (0.260) TCI - - 0.00596*** 0.0177* 0.0225** - - -
0.172*** -
0.119** (0.00225) (0.00953) (0.0112) (0.0640) (0.0584) TCI2 - - - -0.000261 -0.000296 - - - - (0.000198) (0.000224) Population -0.0165 0.0255*** 0.0325*** 0.0358** 0.0381** 1.382** 1.911** 1.998** 0.900 (0.0446) (0.00865) (0.0100) (0.0168) (0.0173) (0.552) (0.755) (0.973) (0.620) Trade open -0.00290 0.000705** 0.00123** 0.00149** 0.00167** 0.0433* 0.0872** 0.0937* -0.0308 (0.00434) (0.000337) (0.000484) (0.000671) (0.000829) (0.0248) (0.0410) (0.0546) (0.0435) Remote -0.862 -1.586* -1.136*** -1.278*** -1.214** -66.48*** 187.3** 14.55 86.63 (0.563) (0.887) (0.374) (0.493) (0.574) (21.58) (74.22) (85.66) (83.34) FDI (% GDP) 0.00347 0.000736 -0.000149 -0.000284 -0.000525 -0.0239 -0.0600 -0.0352 0.00624 (0.00371) (0.00118) (0.000495) (0.000429) (0.000553) (0.0238) (0.0444) (0.0371) (0.0495) Nat. ress. -
0.00849*** -
0.00602*** -
0.00629*** -0.00416* -0.00588* -0.0758** -
0.175*** -
0.109*** -0.201*
(0.00266) (0.00203) (0.00176) (0.00231) (0.00320) (0.0337) (0.0602) (0.0409) (0.113) Telephone -0.00595 -0.00343 0.00159*** 0.00147*** 0.00124** 0.0451*** 0.0344 0.0584 0.0843* (0.00388) (0.00323) (0.000374) (0.000550) (0.000541) (0.0135) (0.0532) (0.0447) (0.0455) Polity score -0.000502 0.00639** 0.00445 0.0106*** 0.0104*** 0.168** 0.199 0.231* -0.0180 (0.00564) (0.00306) (0.00438) (0.00374) (0.00396) (0.0817) (0.155) (0.136) (0.234) GDP pc 0.162** - - - 0.0488 - 4.729** - 3.581 (0.0767) (0.0556) (1.858) (2.911) Education - 0.175* - - 0.233 - - - (0.0912) (0.833) Constant 2.042* 3.659* 2.364*** 2.552** 2.077 120.6*** -
478.9*** -65.45 -233.3
(1.116) (2.162) (0.828) (1.062) (1.526) (39.75) (176.7) (194.8) (195.0) Observations 1,841 1,724 1,585 1,585 1,558 1,724 1,841 1,585 1,558 Groups Instruments AR2 Hansen test
127 29
0.479 0.915
118 30
0.149 0.484
116 36
0.343 0.259
116 39
0.178 0.496
113 39
0.137 0.384
118 38
0.188 0.391
127 36
0.135 0.722
116 36
0.312 0.448
113 38
0.125 0.319
Standard robust errors in parentheses; *** p<0.01, ** p<0.05, * p<0.1; Export sophistication, population, remoteness, education and GDP per capita are expressed in log.
Column 5 shows that the non-linear pattern also holds when income per capita is controlled for,
indicating that the diversification pattern is not only driven by economic development, but also by the proper non-linear dynamics of the TCI impact. As for export sophistication, Table 2 columns 3 to 5 show that it linearly increases with the distance to comparative advantage (coefficients for TCI2 are never significant), with this pattern remaining valid when the level of GDP per capita (column 5) is controlled for.
Can developing countries gain from defying comparative advantage? Distance to comparative advantage, export diversification and sophistication, and the dynamics of specialization
18
At this stage, we can say that our estimations neither fully support Lin’s assumption that defying comparative advantage may hinder productive transformation, nor fully reject it. Our findings enable us to go further by qualifying the type of productive transformation process involved in this strategy. Indeed, although defying comparative advantage seems to unambiguously help make the export basket more sophisticated, it drives export diversification only when the distance to comparative advantage is very large. Yet the TCI coefficients reported in Table 2 columns 8 and 9 suggest that large distance to comparative advantage also tends to concentrate sophisticated exports on a smaller number of product lines29. We have re-estimated Table 2 columns 8 and 9 using the number of products located in the upper 25% (rather than the upper 5% as in Table 2) of the product sophistication distribution that are exported with a comparative advantage as the dependent variable, without change: a larger distance to comparative advantage still polarizes the distribution of highly sophisticated exports on a more restricted set of products (see table in the Appendix 4).
In order to improve our understanding of these results, we need to examine whether the marginal impact of defying comparative advantage decreases with the distance to the technological frontier or when countries have abundant natural resources. Countries that are poorer or more dependent on natural resource exports may structurally exhibit larger distance to comparative advantage as soon as a new export is introduced by FDI or any other mechanism. Our data show that the countries located above the estimated value of the TCI turning point (TCI equal to 38) have export baskets dominated by a few exports, with their five main export lines representing on average more than 70% of total export value. Not only do they exhibit a strong revealed comparative advantage in these sectors, but their export structure might also prove strongly path-dependent to these few export lines. Accordingly, re-diversifying their export basket would imply strongly defying their factor endowment, at least initially.
We therefore need to test whether the impact of the distance to comparative advantage differs, first with the country’s level of development, and second with the country’s dependence on natural resource exports. Equation 5 has consequently been re-estimated on the R1 subsample, which brings together the first two quintiles of the income per capita distribution and features lower-income and lower-middle income countries, and the R2 subsample, which includes the third and fourth quintiles and mostly features higher-middle income countries. These specifications have also been systematically re-estimated by including GDP per capita, without changing the results (See table in Appendix 5).
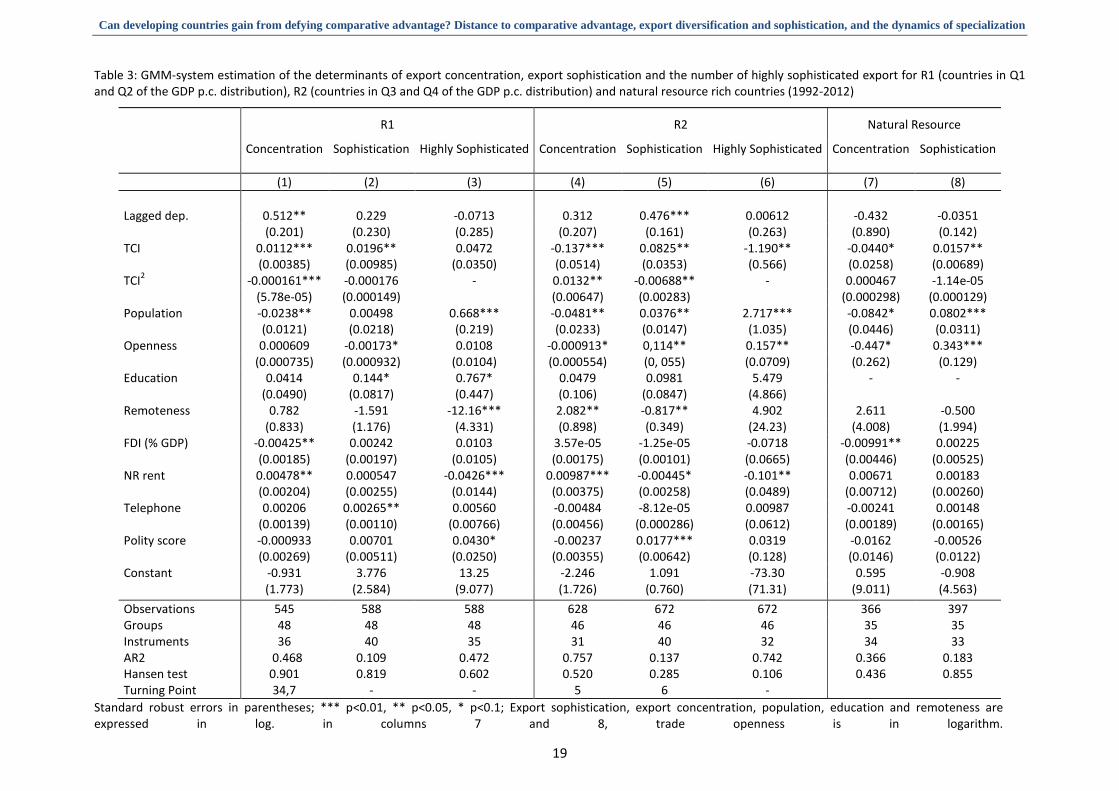
The results for the poorest countries (R1), representing the first two quantiles of the income per capita distribution, are reported in Table 3 columns 1 to 3. They show similar coefficients to those reported and commented upon for the whole sample (Tables 1 and 2). The positive sign taken by the TCI coefficient provides evidence that challenging the factor endowment increases the average level of sophistication and of concentration of the export basket. Nevertheless, above TCI values of 34, export concentration tends to decrease, whereas above TCI value of 55, export sophistication starts to decline.
As for the middle-income countries (R2 subsample), representing quantiles Q3 and Q4 of the income per capita distribution, the results reported in Table 3 columns 4 to 6 show that defying comparative advantage helps both to diversify exports and to make them more sophisticated. However, for this group, defying comparative advantage might not be sustainable over the long term insofar as the TCI has a negative impact on the number of highly sophisticated exports, as shown in column 6.
29 As far as the last outcome variable – the number of highly sophisticated exports – is concerned, only the linear effect is reported since there are no theoretical grounds for supposing a non-linear impact.
Can developing countries gain from defying comparative advantage? Distance to comparative advantage, export diversification and sophistication, and the dynamics of specialization
19
Table 3: GMM-system estimation of the determinants of export concentration, export sophistication and the number of highly sophisticated export for R1 (countries in Q1 and Q2 of the GDP p.c. distribution), R2 (countries in Q3 and Q4 of the GDP p.c. distribution) and natural resource rich countries (1992-2012)
R1 R2 Natural Resource
Concentration
Sophistication Highly Sophisticated Concentration
Sophistication Highly Sophisticated Concentration Sophistication
(1) (2) (3) (4) (5) (6) (7) (8) Lagged dep. 0.512** 0.229 -0.0713 0.312 0.476*** 0.00612 -0.432 -0.0351 (0.201) (0.230) (0.285) (0.207) (0.161) (0.263) (0.890) (0.142) TCI 0.0112*** 0.0196** 0.0472 -0.137*** 0.0825** -1.190** -0.0440* 0.0157** (0.00385) (0.00985) (0.0350) (0.0514) (0.0353) (0.566) (0.0258) (0.00689) TCI2 -0.000161*** -0.000176 - 0.0132** -0.00688** - 0.000467 -1.14e-05 (5.78e-05) (0.000149) (0.00647) (0.00283) (0.000298) (0.000129) Population -0.0238** 0.00498 0.668*** -0.0481** 0.0376** 2.717*** -0.0842* 0.0802*** (0.0121) (0.0218) (0.219) (0.0233) (0.0147) (1.035) (0.0446) (0.0311) Openness 0.000609 -0.00173* 0.0108 -0.000913* 0,114** 0.157** -0.447* 0.343*** (0.000735) (0.000932) (0.0104) (0.000554) (0, 055) (0.0709) (0.262) (0.129) Education 0.0414 0.144* 0.767* 0.0479 0.0981 5.479 - - (0.0490) (0.0817) (0.447) (0.106) (0.0847) (4.866) Remoteness 0.782 -1.591 -12.16*** 2.082** -0.817** 4.902 2.611 -0.500 (0.833) (1.176) (4.331) (0.898) (0.349) (24.23) (4.008) (1.994) FDI (% GDP) -0.00425** 0.00242 0.0103 3.57e-05 -1.25e-05 -0.0718 -0.00991** 0.00225 (0.00185) (0.00197) (0.0105) (0.00175) (0.00101) (0.0665) (0.00446) (0.00525) NR rent 0.00478** 0.000547 -0.0426*** 0.00987*** -0.00445* -0.101** 0.00671 0.00183 (0.00204) (0.00255) (0.0144) (0.00375) (0.00258) (0.0489) (0.00712) (0.00260) Telephone 0.00206 0.00265** 0.00560 -0.00484 -8.12e-05 0.00987 -0.00241 0.00148 (0.00139) (0.00110) (0.00766) (0.00456) (0.000286) (0.0612) (0.00189) (0.00165) Polity score -0.000933 0.00701 0.0430* -0.00237 0.0177*** 0.0319 -0.0162 -0.00526 (0.00269) (0.00511) (0.0250) (0.00355) (0.00642) (0.128) (0.0146) (0.0122) Constant -0.931 3.776 13.25 -2.246 1.091 -73.30 0.595 -0.908
(1.773) (2.584) (9.077) (1.726) (0.760) (71.31) (9.011) (4.563) Observations 545 588 588 628 672 672 366 397 Groups Instruments AR2 Hansen test Turning Point
48 36
0.468 0.901 34,7
48 40
0.109 0.819
-
48 35
0.472 0.602
-
46 31
0.757 0.520
5
46 40
0.137 0.285
6
46 32
0.742 0.106
-
35 34
0.366 0.436
35 33
0.183 0.855
Standard robust errors in parentheses; *** p<0.01, ** p<0.05, * p<0.1; Export sophistication, export concentration, population, education and remoteness are expressed in log. in columns 7 and 8, trade openness is in logarithm.
Can developing countries gain from defying comparative advantage? Distance to comparative advantage, export diversification and sophistication, and the dynamics of specialization
20
It should also be underlined that the turning point is much lower (respectively 5 and 6 for export concentration and sophistication) than for R130, which means that the margins of efficiency of the strategy consisting of defying comparative advantage on productive transformation are lower for middle-income countries than for lower-income countries31.
The TCI indicator does not account for natural resource endowment, which may obviously pose a problem here. We know that natural-resource-rich countries tend to exhibit lower export diversification while conforming to comparative advantage, since they exhibit a high path-dependency in the primary sector (De Ferranti et al. 2002; Chandra et al. 2007). Although Lin claims that resource-based countries should conform to their comparative advantage, we believe this strategy may prove risky since it would imply a very slow pace of diversification for these economies. In order to test this assumption, our model has been re-estimated on the subsample of countries for which natural resource exports exceeds 10% of GDP32. Estimation results for the natural resource exporters subsample are reported in Table 3 columns 7 and 8. They are very similar to the results found for the R2 subsample since defying comparative advantage both diversifies resource-rich countries’ exports and makes them more sophisticated33. Natural-resource-exporting countries would therefore need to defy their factor endowment in order to diversify and sophisticate their export basket34. Resource-rich countries should therefore heavily challenge their factor endowment in order to promote structural change. This strategy seems especially important for economies whose exports are locked into sectors that do not need many capabilities such as point source natural resources.
At this stage, we can conclude from our empirical investigation that defying comparative advantage may help developing countries – and most notably middle-income countries – to successfully transform their export structure through increasing sophistication at all development levels. However, the marginal benefit to sophistication from defying comparative advantage turns negative beyond certain thresholds. For the least developed economies, margins of defiance to comparative advantage are sizeable, with distance to comparative advantage helping to make exports more sophisticated up to high levels of non-conformity. However, defying comparative advantage also tends to concentrate their export basket, making the vulnerability of these countries to external demand or supply shocks more problematical. For a middle-income economy, the benefits of defying comparative advantage might be greater than for a lower-income economy, since this strategy helps the country to simultaneously diversify its export basket and make it more sophisticated. However, the margins of impact are far more limited since the positive impact reverses beyond turning points corresponding to low values of distance to comparative advantage (respectively 5 for diversification and 6 for sophistication). Lastly, for natural resource exporters, the margins of productive transformation achieved by defying comparative advantage are large since the
30 Interestingly, the only country of R2 located beyond these thresholds is China whose TCI was divided by three during the period studied. Its value was 2.0 in 2007, while the average TCI level of the OECD economies was 0.3. 31 The mean TCI level of the R2 subsample is below 1. The two turning points are accordingly very low with respect to those computed for R1, but they nonetheless amount to 5 and 6 times the average TCI level of the group. 32 For natural resource exporters, GDP per capita is correlated with most of the explanatory variables and with the TCI variable. Thus, GDP per capita has not been included as a regressor in the specification for this subsample. 33 The TCI impact is linear for this subsample since the coefficient of the squared term is not significant in columns 7 and 8. 34 Resource-based countries export on average between 0 and 1 highly sophisticated products. Estimations of that variable are not robust and we do not report them.
Can developing countries gain from defying comparative advantage? Distance to comparative advantage, export diversification and sophistication, and the dynamics of specialization
21
distance to comparative advantage enables both sophistication and diversification of exports to be increased, up to quite high levels of distance to latent comparative advantage.
6. Distance to comparative advantage, FDI and export structure transformation: Further indirect evidence on the role of GVCs
The evidence presented in the previous section shows that the benefits from defying comparative are not homogenous across development levels. Although some countries can succeed in simultaneously diversifying and their export basket and making it more sophisticated by defying comparative advantage, the same strategy could prove less beneficial for others, most notably the poorest ones. Positive effects are especially relevant for middle-income countries, which are also more likely to attract FDI in assembly activities and the associated highly sophisticated exports. However, this trajectory of modernization of the export structure may be unsustainable in the long-run, especially if the productive capacities imported by transnational corporations in assembly plants have only a limited linkage effect towards domestic firms, as recently evidenced for China (Jarreau and Poncet, 2012). We therefore investigate in this section the extent to which the positive impact of the distance to comparative advantage may be conditioned by FDI, notably in middle-income countries particularly affected by these trends. Results for the subsamples of low-income countries and natural resource-rich countries are reported in Appendix 635.
As emphasized in the theoretical section, FDI in processing industries is expected to intensify the impact of the distance to comparative advantage on export sophistication because foreign investing firms generally bring with them more sophisticated technologies and inputs than those characteristic of domestic firms. The capital included in imported components will therefore increase the distance between the factor content of exports and the country’s factor endowment, while simultaneously making this distance contribute more to export sophistication than it would under domestic capital accumulation alone. Since the host country does not immediately abandon its previous specializations, its whole export basket might also more be diversified. Growing FDI stocks may end up increasing the country’s capital/labor ratio, therefore reducing the export distance to comparative advantage by promoting the emergence of an autonomous domestic industry (Markusen and Venables, 1998; Sutton, 2010).
In the absence of between-country data on FDI by type (vertical, assembly), we had to rely on indirect evidence to imperfectly assess this conditional impact. We first introduced a dummy variable taking a value of 1 when a country’s FDI stock is above 27% of GDP, which is the period average for the developing countries, and its interaction with the distance to comparative advantage for the R2 subsample. In accordance with what precedes, the interaction term FDI*TCI has been introduced into Equation 5, with the expectation being that its coefficient will take a positive sign for export sophistication and export concentration.
Table 4 reports the estimation results for the R2 subsample, which we think is the most relevant when looking at vertical FDI. The positive and significant coefficient of the interaction term (TCI*FDI) in columns 2, 4 and 6 provides empirical confirmation of our theoretical expectations since, for the middle-income countries with FDI stocks above 27% of GDP, defying comparative advantage leads to higher average sophistication and more highly sophisticated exports. Coefficient magnitudes in column 4 show that for the countries attracting more FDI, the average sophistication impact of TCI is twice as high as for the other countries in R2. As for the number of highly sophisticated exports, column 6 shows that for countries with higher FDI stocks, the overall impact of the distance to
35 As mentioned in section 4, as both countries feature an extremely concentrated export basket, the emergence of a few sophisticated exports tends to strongly impact both the export basket’s average sophistication level and the TCI level.
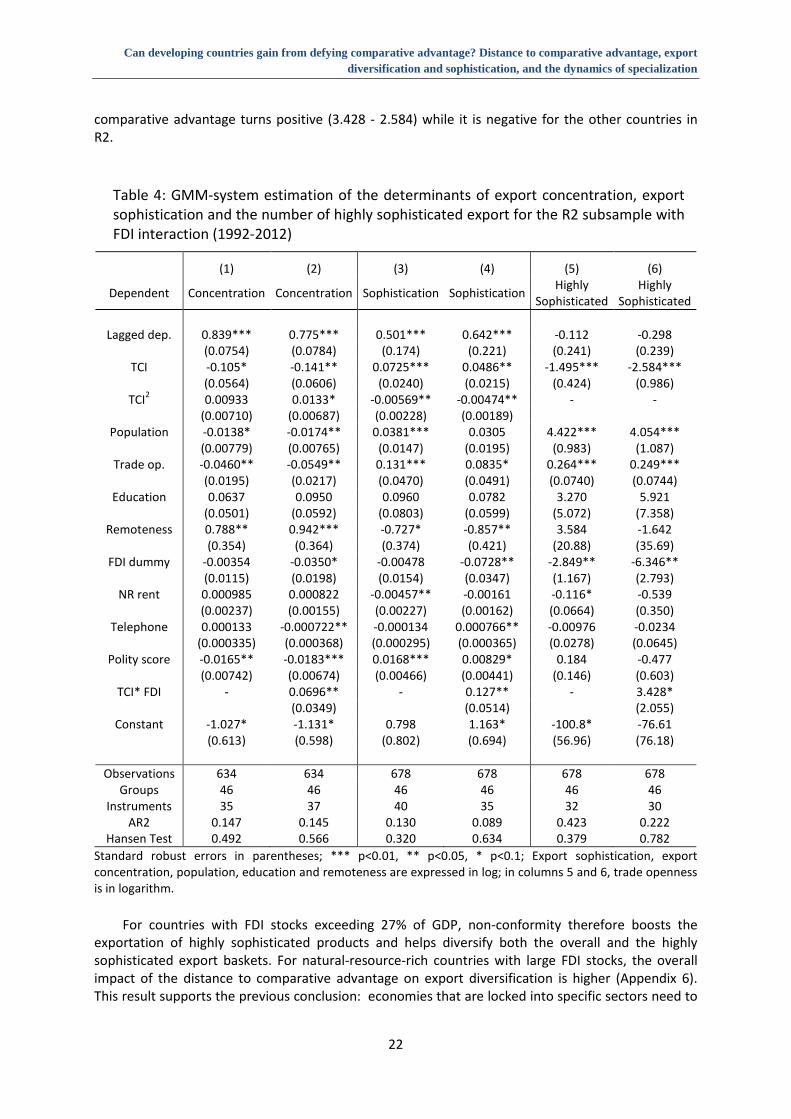
Can developing countries gain from defying comparative advantage? Distance to comparative advantage, export diversification and sophistication, and the dynamics of specialization
22
comparative advantage turns positive (3.428 - 2.584) while it is negative for the other countries in R2.
Table 4: GMM-system estimation of the determinants of export concentration, export sophistication and the number of highly sophisticated export for the R2 subsample with FDI interaction (1992-2012)
(1) (2) (3) (4) (5) (6)
Dependent Concentration Concentration Sophistication Sophistication Highly Sophisticated
Highly Sophisticated
Lagged dep. 0.839*** 0.775*** 0.501*** 0.642*** -0.112 -0.298
(0.0754) (0.0784) (0.174) (0.221) (0.241) (0.239) TCI -0.105* -0.141** 0.0725*** 0.0486** -1.495*** -2.584***
(0.0564) (0.0606) (0.0240) (0.0215) (0.424) (0.986) TCI2 0.00933 0.0133* -0.00569** -0.00474** - -
(0.00710) (0.00687) (0.00228) (0.00189) Population -0.0138* -0.0174** 0.0381*** 0.0305 4.422*** 4.054***
(0.00779) (0.00765) (0.0147) (0.0195) (0.983) (1.087) Trade op. -0.0460** -0.0549** 0.131*** 0.0835* 0.264*** 0.249***
(0.0195) (0.0217) (0.0470) (0.0491) (0.0740) (0.0744) Education 0.0637 0.0950 0.0960 0.0782 3.270 5.921
(0.0501) (0.0592) (0.0803) (0.0599) (5.072) (7.358) Remoteness 0.788** 0.942*** -0.727* -0.857** 3.584 -1.642
(0.354) (0.364) (0.374) (0.421) (20.88) (35.69) FDI dummy -0.00354 -0.0350* -0.00478 -0.0728** -2.849** -6.346**
(0.0115) (0.0198) (0.0154) (0.0347) (1.167) (2.793) NR rent 0.000985 0.000822 -0.00457** -0.00161 -0.116* -0.539
(0.00237) (0.00155) (0.00227) (0.00162) (0.0664) (0.350) Telephone 0.000133 -0.000722** -0.000134 0.000766** -0.00976 -0.0234
(0.000335) (0.000368) (0.000295) (0.000365) (0.0278) (0.0645) Polity score -0.0165** -0.0183*** 0.0168*** 0.00829* 0.184 -0.477
(0.00742) (0.00674) (0.00466) (0.00441) (0.146) (0.603) TCI* FDI - 0.0696** - 0.127** - 3.428*
(0.0349) (0.0514) (2.055) Constant -1.027* -1.131* 0.798 1.163* -100.8* -76.61
(0.613) (0.598) (0.802) (0.694) (56.96) (76.18)
Observations 634 634 678 678 678 678 Groups
Instruments AR2
Hansen Test
46 35
0.147 0.492
46 37
0.145 0.566
46 40
0.130 0.320
46 35
0.089 0.634
46 32
0.423 0.379
46 30
0.222 0.782
Standard robust errors in parentheses; *** p<0.01, ** p<0.05, * p<0.1; Export sophistication, export concentration, population, education and remoteness are expressed in log; in columns 5 and 6, trade openness is in logarithm.
For countries with FDI stocks exceeding 27% of GDP, non-conformity therefore boosts the
exportation of highly sophisticated products and helps diversify both the overall and the highly sophisticated export baskets. For natural-resource-rich countries with large FDI stocks, the overall impact of the distance to comparative advantage on export diversification is higher (Appendix 6). This result supports the previous conclusion: economies that are locked into specific sectors need to
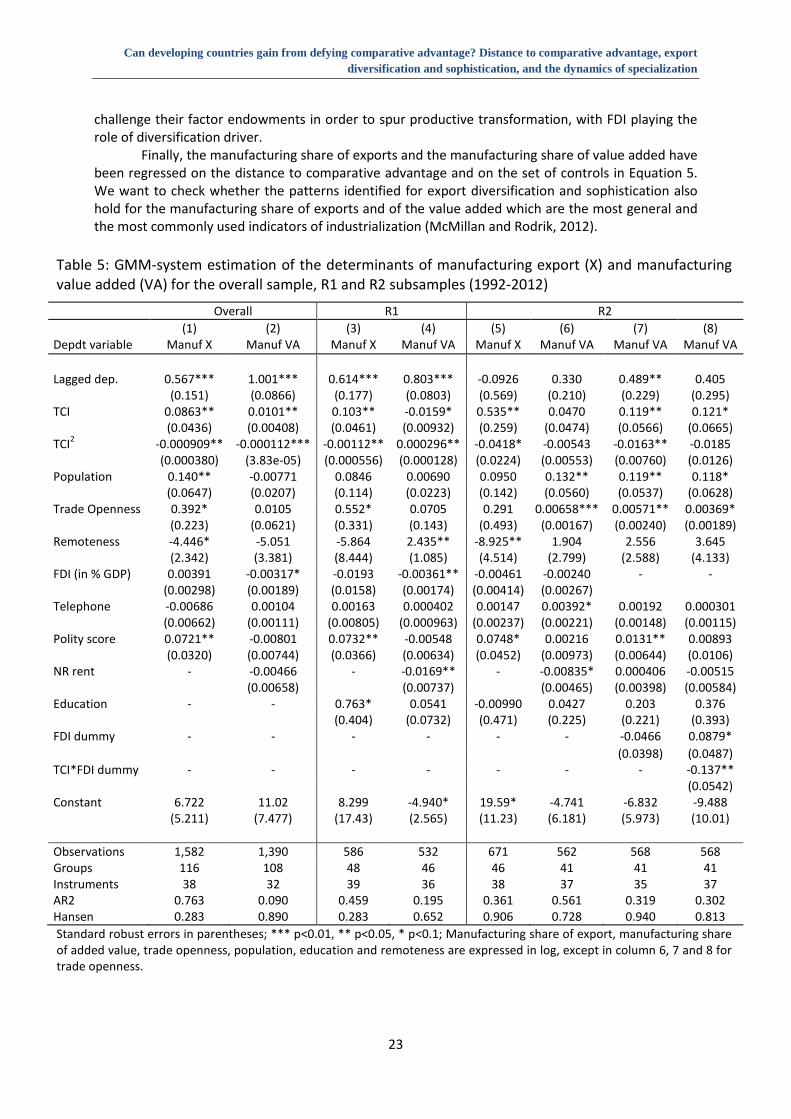
Can developing countries gain from defying comparative advantage? Distance to comparative advantage, export diversification and sophistication, and the dynamics of specialization
23
challenge their factor endowments in order to spur productive transformation, with FDI playing the role of diversification driver.
Finally, the manufacturing share of exports and the manufacturing share of value added have been regressed on the distance to comparative advantage and on the set of controls in Equation 5. We want to check whether the patterns identified for export diversification and sophistication also hold for the manufacturing share of exports and of the value added which are the most general and the most commonly used indicators of industrialization (McMillan and Rodrik, 2012).
Table 5: GMM-system estimation of the determinants of manufacturing export (X) and manufacturing value added (VA) for the overall sample, R1 and R2 subsamples (1992-2012)
Overall R1 R2 (1) (2) (3) (4) (5) (6) (7) (8) Depdt variable Manuf X Manuf VA Manuf X Manuf VA Manuf X Manuf VA Manuf VA Manuf VA Lagged dep. 0.567*** 1.001*** 0.614*** 0.803*** -0.0926 0.330 0.489** 0.405 (0.151) (0.0866) (0.177) (0.0803) (0.569) (0.210) (0.229) (0.295) TCI 0.0863** 0.0101** 0.103** -0.0159* 0.535** 0.0470 0.119** 0.121* (0.0436) (0.00408) (0.0461) (0.00932) (0.259) (0.0474) (0.0566) (0.0665) TCI2 -0.000909** -0.000112*** -0.00112** 0.000296** -0.0418* -0.00543 -0.0163** -0.0185 (0.000380) (3.83e-05) (0.000556) (0.000128) (0.0224) (0.00553) (0.00760) (0.0126) Population 0.140** -0.00771 0.0846 0.00690 0.0950 0.132** 0.119** 0.118* (0.0647) (0.0207) (0.114) (0.0223) (0.142) (0.0560) (0.0537) (0.0628) Trade Openness 0.392* 0.0105 0.552* 0.0705 0.291 0.00658*** 0.00571** 0.00369* (0.223) (0.0621) (0.331) (0.143) (0.493) (0.00167) (0.00240) (0.00189) Remoteness -4.446* -5.051 -5.864 2.435** -8.925** 1.904 2.556 3.645 (2.342) (3.381) (8.444) (1.085) (4.514) (2.799) (2.588) (4.133) FDI (in % GDP) 0.00391 -0.00317* -0.0193 -0.00361** -0.00461 -0.00240 - - (0.00298) (0.00189) (0.0158) (0.00174) (0.00414) (0.00267) Telephone -0.00686 0.00104 0.00163 0.000402 0.00147 0.00392* 0.00192 0.000301 (0.00662) (0.00111) (0.00805) (0.000963) (0.00237) (0.00221) (0.00148) (0.00115) Polity score 0.0721** -0.00801 0.0732** -0.00548 0.0748* 0.00216 0.0131** 0.00893 (0.0320) (0.00744) (0.0366) (0.00634) (0.0452) (0.00973) (0.00644) (0.0106) NR rent - -0.00466 - -0.0169** - -0.00835* 0.000406 -0.00515 (0.00658) (0.00737) (0.00465) (0.00398) (0.00584) Education - - 0.763* 0.0541 -0.00990 0.0427 0.203 0.376 (0.404) (0.0732) (0.471) (0.225) (0.221) (0.393) FDI dummy - - - - - - -0.0466 0.0879* (0.0398) (0.0487) TCI*FDI dummy - - - - - - - -0.137** (0.0542) Constant 6.722 11.02 8.299 -4.940* 19.59* -4.741 -6.832 -9.488 (5.211) (7.477) (17.43) (2.565) (11.23) (6.181) (5.973) (10.01) Observations 1,582 1,390 586 532 671 562 568 568 Groups Instruments AR2 Hansen
116 38
0.763 0.283
108 32
0.090 0.890
48 39
0.459 0.283
46 36
0.195 0.652
46 38
0.361 0.906
41 37
0.561 0.728
41 35
0.319 0.940
41 37
0.302 0.813
Standard robust errors in parentheses; *** p<0.01, ** p<0.05, * p<0.1; Manufacturing share of export, manufacturing share of added value, trade openness, population, education and remoteness are expressed in log, except in column 6, 7 and 8 for trade openness.
Can developing countries gain from defying comparative advantage? Distance to comparative advantage, export diversification and sophistication, and the dynamics of specialization
24
We can anticipate that if defying comparative advantage were to increase the manufacturing
shares of exports and of value added, then this strategy would be unreservedly advantageous for developing countries’ long term economic development. The manufacturing share of exports is an indicator of the economy’s capacity to – competitively – export manufactured goods, which are generally considered as the most efficient drivers of long-term economic development (Rodrik, 2013). The manufacturing share of value added is a very general indicator of the sophistication level of a country’s whole productive structure, including non-trade sectors and industries (Anand et al, 2012). A limitation of these two indicators is that they do not provide information about the breakdown of manufacturing exports or value added between domestic firms and foreign subsidiaries. Nevertheless, as described by Baldwin’s smile curve, productive tasks are more or less intensive in value added across value chains, with intermediary tasks, like processing, bearing the lowest levels of value added in the chain (Baldwin, 2012). Baldwin also underlines the risk that developing countries will hyper-specialize in those low value-added tasks. Regressing the manufacturing share of exports and of value added on the distance to comparative advantage confirms this assertion.
Table 5 reports the results for the overall sample and for the lower-income and middle-income subsamples. Columns 1, 3 and 5 show that defying comparative advantage helps to export more manufactured goods since the TCI has a positive and significant coefficient in all samples36. As for the manufacturing value added, the results are less straightforward. Whereas defying comparative advantage has a positive impact for the whole sample (column 2), the impact is negative in the R1subsample (column 4) and not significant in the R2 subsample (column 6). Only when the dummy for countries with large FDI stocks is substituted for the continuous measure of FDI stocks, does the TCI coefficient become significant and positive, but only for the R2 subsample (column 8). Defying comparative advantage therefore increases the manufacturing value added share in middle-income economies, while it reduces it in lower income countries. However, the negative coefficient of the interaction term reported in column 8 indicates that this positive impact turns negative for the middle-income countries featuring high levels of FDI stock.
The increased participation of middle-income countries in GVCs during the last two decades could well explain this result. In the absence of data on FDI by type, FDI stock is an imperfect proxy for the participation of developing countries in GVCs (OECD, 2014). OECD (2014) concludes from the close correlation between countries’ FDI stocks and their GVC participation index37 that the expansion of TNCs’ operations through FDI has been a major driver of GVC expansion in developing countries. In the same vein, UNCTAD (2013) claims that the presence of foreign affiliates is clearly an important factor influencing both the imported content of exports and participation in international production networks. As explained in section 2, the rise in imports of capital-intensive intermediary products consecutive on the surge of FDI in processing activities introduces a gap between the export factor content and the country’s comparative advantage. As our estimations in this paper show, this gap boosts the country’s potential to export more sophisticated manufactured products. However, it might simultaneously lessen, by construction, the manufacturing share of domestic value added, especially if the share of the value added imported through components grows more rapidly than the
36 As the turning point is extremely high, we do not comment on the negative coefficient for the squared TCI because very few countries are concerned by the non-linear impact. 37 The GVC participation index is calculated as a percentage of gross exports and has two components: the import content of exports and the exports of intermediate inputs (goods and services) used in third-party countries’ exports(OECD, 2013).
Can developing countries gain from defying comparative advantage? Distance to comparative advantage, export diversification and sophistication, and the dynamics of specialization
25
domestic share of the value added, essentially resulting from the combination of domestic labor and domestically settled capital, which is not a restrictive condition in the context of developing economies38. Indeed, as described by Baldwin’s smile curve (Baldwin, 2012), tasks are more or less intensive in value added across value chains, and the processing activities, in which developing countries tend to be hyper-specialized, generally feature the lowest levels of value added. Put differently, the imported component of value added tends to be particularly large in developing countries specialized in assembly activities. Therefore, the results in Table 5, revealing that the distance to comparative advantage tends to have a negative impact on manufacturing value added when associated with higher FDI stocks, suggest that increased participation in global value chains allows upgrading of exports, but not necessarily production, because of the hyper-specialization in low-value-added segments of the value chain.
These results, as well as their explanation, confirm that studying export structure might be misleading in a global context where tasks are traded in place of goods (Grossman and Rossi-Hansberg, 2008; Lanz at al., 2011). The participation in global value chains facilitates the industrialization process and allows countries to export sophisticated products, although they are generally participating in low-skilled tasks (Baldwin, 2012). In that case, developing countries’ factor intensity of exports will deviate from their factor endowments since export factor intensity is based on the approximate value of the processed good exported. The existence of this statistical artefact suggests that studying export structure might be misleading in terms of describing the structural transformation process.
In addition to the measurement issues mentioned above, the next section discusses various important policy issues raised by the findings on this paper.
7. Discussion of the policy issues
A first policy issue is the direct consequence of our finding that in certain middle-income countries, FDI could well bring about a combination of a persistently high degree of deviation from comparative advantage, with detrimental impact on export survival, and of a structure of exports polarized in a few sophisticated – but undiversified – export lines. This pattern reflects a partial, and possibly sterile, pattern of participation of developing economies in GVCs, especially if the import of components is more dynamic than the domestic share of value added in the processing industries. Although we cannot draw very definite conclusions in the absence of data on the specific types of FDI, these results suggest that defying comparative advantage by attracting FDI could well turn into a dangerous strategy in the long-run, by bringing in only partial and unauthentic productive transformation in the sense that it is measured by trade statistics without being perceptible in productive structures.
A related issue is that of the balance of risks and benefits implied by the strategy consisting in defying comparative advantage. As reported by Freund and Moran (2017), middle-income countries like Malaysia, Costa Rica or Morocco could (like China in the 1990s) markedly transform the structure of their trade through the intensification of the processing business generated by FDI in assembly activities (Paus, 2014). However, FDI in processing activities has also led to a contradiction between export specialization and comparative advantage in the countries where labor was abundant. Recent studies have also found that when the distance to comparative advantage becomes too large, the few sophisticated exports brought about by assembly-type FDI have only limited impact on aggregate economic growth (Jarreau and Poncet, 2012) and exhibit low survival rates in global markets (Nicita et al., 2013). More worryingly, there is a risk that the excessive sectoral concentration of vertical FDI
38 Moreover, we can rule out the argument that this impact could be due to FDI in the natural resource sector since natural resource rents are controlled for in the estimations in Table 5.
Can developing countries gain from defying comparative advantage? Distance to comparative advantage, export diversification and sophistication, and the dynamics of specialization
26
coupled with the hyper-specialization of trade in niches might promote the formation of export lock-in (Srholec, 2007), or might encourage “enclave industrialization” (Baldwin, 2011:43), with a cluster of a few transnational corporations locally polarizing the revenues from sophisticated exports, without delivering technological spillovers to the rest of the economy (Sutton, 2010). In the words of Baldwin (2011: 317), GVCs make industrialization “easier and faster but (also) less meaningful”.39
Even though it is highly specific in many ways, China provides a good illustration of the issues raised by the trends described above. Although the trend towards export diversification and sophistication experienced by Chinese firms may be largely attributed to processing activities (Naughton, 2007; Van Assche and Gangnes, 2010), the pattern of specialization of the Chinese economy is not based on equally sophisticated domestic technological capabilities (Yue and Hua, 2002; Schott, 2008; Amiti and Freund, 2012, Dai et al., 2016). As a result, the domestic content of China’s manufacturing exports has remained remarkably low – 40% on average between 2002 and 2007 according to Koopman et al. (2008)’s estimations –, especially in the most sophisticated industries like electronics. The results presented in this paper suggest that the contradictory pattern identified for China may be common to many middle-income countries whose industrialization policies are inspired, by and large, by those of China, and that balancing the positive short-term and negative long-term impacts may prove highly problematic.
The second policy issue raised by the findings in this paper is strongly linked to the first as it relates to the dynamics of productive capabilities – and notably of the endowment in capital – during the path of economic development and to the sustainability of the strategy that consists of defying comparative advantage. Various dynamic mechanisms can trigger endogenous capital accumulation. The first mechanism is related to agglomeration externalities. If foreign investment starts spatially clustering around the first foreign subsidiaries (Venables, 1996), the effective capital endowment might increase in the medium term as evidenced by the studies of Head and Ries (1996), Henderson (1996) and Head et al. (1999). Freund and Moran (2017) have also identified, for three middle income countries, the sequential process by which exports are first rapidly upgraded by FDI after first-mover firms succeed in attracting follower firms that cluster in oligopolistic industries, with this concentration progressively modifying the revealed comparative advantage of the domestic economy in a subsequent stage. Another endogenous mechanism of capital accumulation relies upon backward linkages between domestic firms and foreign exporting subsidiaries (Rodríguez-Clare, 1996; Markussen and Venables, 1999; Sutton, 2012). Although FDI may first tend to reduce profits of local firms by spurring competition in the product and factor markets, it will progressively reduce the cost of inputs and raise the profits of domestic firms, notably through linkage effects to supplier industries. After an initial negative shock, linkages might therefore progressively increase the country’s overall capital endowment as domestic firms will accumulate industrial capabilities to catch up with the technological level of TNC’s subsidiaries. Markusen and Venables (1999) report Hobday (1995)’s work, which brings together a large number of case-studies illustrating a similar pattern in East-Asian countries, with multinational investments prompting backward linkage effects to local suppliers in computer or mechanical engineering industries. Barrios et al. (2005) also provide plant-level evidence for Ireland supporting the theoretical result that FDI may first hinder domestic capital accumulation by deterring local firms’ entry, before this initial adverse effect is outpaced by positive externalities thanks to domestic capital accumulation through inter-industrial linkages.
However, these mechanisms may not operate inherently. The results of our dynamic panel estimations point to the weak sustainability of the strategy consisting of defying comparative advantage if this strategy is not relayed by a policy supporting domestic capacity accumulation through one of the mechanisms described above. For many developing countries, defying
39 Recent studies have also cast doubt on the capacity of EPZ policy to spur productive change in Africa (Braütigam and Tang, 2014), in North Africa (Piveteau and Rougier, 2011) or in India (Batth et al., 2012).
Can developing countries gain from defying comparative advantage? Distance to comparative advantage, export diversification and sophistication, and the dynamics of specialization
27
comparative advantage has essentially consisted of attracting assembly-type FDI via export processing zones (EPZs) and other types of incentive. A potential risk of this strategy is that the country’s capital endowment never catches up with the export factor content if technological spillovers fail to take place (Rodríguez-Clare, 1996), with FDI creating ‘enclave economies’ that will only have a very limited impact on the developing country’s industrialization potential. This may be the case, notably, if the good produced and exported by the foreign firm does not make intensive use of the intermediate goods produced by local firms, in particular when the home and host countries produce very different varieties of intermediate goods. In this instance, foreign subsidies will go on importing capital-intensive inputs, processing them and re-exporting them, leaving the country’s factor endowment durably distant from the import and export factor content so that industrialization will be limited to enclaves (Baldwin, 2011).
Country-case studies and empirical investigations of firm-level technological spillovers generated by FDI have provided repeated evidence that the transfer of export capabilities to local firms is highly conditional on a series of factors relating to the technological distance between the investing firms and the host country (Paus and Gallagher, 2008). Relying on industry case-studies, Sutton (2012) argues, for example, that the intensity of technological transfers is conditioned by the degree to which a common set of business practices and production routines have become standardized by foreign subsidiaries in order to facilitate transfers of both working practices and technological know-how to independent suppliers in destination countries, and by the degree to which foreign subsidiaries and local suppliers can align their incentives within a vertical supply chain by inter-firm transfers of skilled workers and technological advice40.
Designing and implementing efficient complementary policies that will enable them to reap the long-term benefits of vertical FDI is not an easy task for most developing countries since it requires critical coordination and information failures to be addressed by using sectoral incentives and public investment (Rodrik, 2008; Rodríguez-Clare and Harrison, 2010). In other words, a proper and effective industrial policy should accompany the attraction of vertical FDI if the adverse effects of the latter need to be minimized. For countries that fail to do this, defying comparative advantage by attracting assembly-type FDI may well spur productive transformation for a few export lines in the short term, while ultimately having only a weak impact on the industry-wide productive transformation in the longer term. As was suggested by Lin (2009, 2011), defying comparative advantage does not allow countries to definitively “jump many rungs”, and may not be the only policy option for all countries.
The third policy issue raised by our paper is a normative one. Our results indicate that upgrading exports by defying comparative advantage constitutes a real policy option for developing countries with imperfect factor markets and unfavorable factor prices. However, these results cannot determine what is the best policy in order to defy comparative advantage. Recent evidence suggests that attracting vertical FDI is the most powerful option to rapidly upgrade exports by defying comparative advantage. Using data on investment promotion agencies, Harding and Javorcik (2012) have provided convincing empirical evidence that the entry of multinationals can affect the composition of exports if the multinationals engage in production of more sophisticated goods than
40 Sutton (2012, 89) reports high sectoral heterogeneity for the intensity of transfers, with FDI in the car industry, where the conditions for effective spillovers hold, having effectively transferred technological capacities in such countries as China and India, while FDI in the machine tool industry has failed to deliver significant transfers in India because it did not meet these requirements. The experience of Bangladesh shows that textile or clothing industries, exhibiting more horizontal supply chain linkages, can also promote effective capability transfers, provided that vertical buyer-seller relations exist between low-income manufacturers and retailers from high income countries.
Can developing countries gain from defying comparative advantage? Distance to comparative advantage, export diversification and sophistication, and the dynamics of specialization
28
those previously exported by the host country by using a country as an export platform41. Freund and Moran (2017)’s comparative country case-studies have also recently documented the fact that authorities in Malaysia, Costa Rica, and Morocco have successfully used foreign direct investment to change the export profile of their economy, before concluding that small emerging markets may be better equipped to transform their production structure and stimulate exports with foreign direct investment than by promoting broad domestic entrepreneurship and capital accumulation. Distance to comparative advantage therefore seems to have a stronger impact on export sophistication when it is driven by FDI in processing industries than when it is brought about by domestic firms, possibly supported by industrial policy42. Further work would be necessary to more fully identify the second-order effects of these alternative policies.
Lastly, the general equilibrium effects raised by the generalized trends of quality upgrading and productive diversification in developing countries should be considered with more attention in order to avoid trade and financial crises like those in Asia in the 1990s. Because of a classical "fallacy of composition", the sum of the individual improvements hides possible aggregate problems since, by all trying to export sophisticated manufactured goods, developing countries are all engaged in a competitive race that might bring about regressive effects for some individual countries (Blecker and Razmi, 2007). For this reason, different middle-income countries, like China, are now trying to root the subsequent stages of their productive transformation in the dynamics of domestic demand.
8. Conclusion
This paper provides empirical panel evidence that defying comparative advantage may not systematically bring about structural change. We first find that developing countries that defy their comparative advantage tend to export more manufactured goods and goods that are more sophisticated. The impact on export concentration nevertheless shows variations across development levels since defying comparative advantage seems to help diversify export baskets for middle-income countries, whereas it tends to concentrate those of the lower-income economies. As might be expected, our estimations also indicate that the impact of distance to comparative advantage on productive transformation is strongly conditioned by the degree of integration into GVCs, proxied by the size of FDI stocks. We also find that defying comparative advantage has, at the same time, a positive impact on the percentage of manufacturing activities in exports, and a detrimental impact on the percentage of manufacturing value added, the latter effect holding only for the countries with large FDI stocks. Our results reveal that the association of a sizeable distance to comparative advantage and large FDI stocks and may lead to a superficial pattern of productive modernization, much akin to an artefact, that could well hinder further transformation of the productive structure by locking the economy into a specialization trap in assembly industries. These dynamic patterns would merit confirmation, notably by using more disaggregated FDI data and breaking down input and output of traded value added.
The paper also discusses the policy implications of its results and warns against excessive optimism with respect to the medium- and long-term benefits of the strategy consisting of defying comparative advantage by attracting FDI into processing industries. Based on our results and on recent evidence, we contend that, in developing countries with a weak potential for domestic investment in capital and skills and for the sectors in which foreign firms have only limited incentives 41 Harding and Javorcik (2012) identify a second channel whereby domestic firms can upgrade their product after having benefitted from knowledge spillovers generated by the activity of multinationals. 42 Governments also use industrial policy, that is direct or indirect action in support of sectors and firms, like public investment in new activities or subsidies or tax cuts, in order to promote and support domestic and foreign private investment in industries that stand, at least initially, at a distance from the country’s current factor endowment (Lin and Chang, 2009, Hausman and Rodrik, 2007).

Can developing countries gain from defying comparative advantage? Distance to comparative advantage, export diversification and sophistication, and the dynamics of specialization
29
to transfer working practices and technological know-how, this strategy may be beneficial in the short term but extremely risky in the longer term.
30
References
Agosin, M.R., Alvarez, R., and C. Bravo-Ortega (2012) Determinants of export diversification around the world: 1962–2000, The World Economy, 35(3), 295-315.
Akbar, M., Zareen F. N., and D. Musleh-ud (2000) Export diversification and the structural dynamics in the growth process: The case of Pakistan, The Pakistan Development Review, 39(4), 573-589.
Álvarez, R., and R. Fuentes (2006) Paths of development, specialization, and natural resources abundance, Documentos de Trabajo Central Bank of Chile Working Papers No 383.
Amiti, M. and C. Freund (2012). The Anatomy of China’s Export Growth, in Robert C. Feenstra and Shang-Jin Wei (Eds.) China’s growing role in world trade, The University of Chicago Press.
Amsden A., 1989, Asia’s next Giant: South Korea and Late Industrialization, New York, Oxford University Press.
Anand, R., Mishra, S. and N. Spatafora (2012) Structural Transformation and the Sophistication of Production, IMF Working Paper WP 12/59, Washington DC: The International Monetary Fund.
Aoki, M., H.-K. Kim, and M. Okuno-Fujiwara (1998) The Role of Government in East Asian Economic Development: Comparative Institutional Analysis, Oxford: Clarendon Press.
Arellano, M. and S. Bond (1991) Some tests of specification for panel data: Monte Carlo evidence and an application to employment equations, Review of Economic Studies, Vol.58, p.277–297
Arellano, M., and O. Bover (1995) Another look at the instrumental variable estimation of error-components models, Journal of Econometrics 68: 29–51.
Balassa, B. (1965) Trade Liberalisation and “Revealed” Comparative Advantage, The Manchester School, 33 (2), 99-123
Baldwin, R., 2011, Trade And Industrialisation After Globalisation's 2nd Unbundling: How Building And Joining A Supply Chain Are Different And Why It Matters, NBER Working Papers 17716, National Bureau of Economic Research.
Barro, R. and J.-W. Lee (2010) A New Data Set of Educational Attainment in the World, 1950-2010. Journal of Development Economics, 104(1), 184-198.
Beltramello, A., K. De Backer and L. Moussiegt (2012) The Export Performance of Countries within Global Value Chains (GVCs). OECD Science, technology and Industry Working Papers 2012/02, Paris: The OECD.
Besedes, T., and T. J. Prusa, (2006) Ins, outs, and the duration of trade. Canadian journal of economics, 39(1), 266-295.
Besedes, T., and T. J. Prusa (2007) The Role of Extensive and Intensive Margins and Export Growth. Journal of Development Economics, 96(2), 371-379.
Bhatt, A., Puri M. and A. Appolloni (2012) SEZ Proliferation in India: Are the Objectives Being Realized? Transition Studies Review, 19(1), 79-88.
Blalock, G. and P. J. Gertler (2009) Welfare gains from Foreign Direct Investment through technology transfer to local suppliers, Journal of International Economics, 74, 402-421.
Blecker, R, and A. Razmi (2007) The Fallacy of Composition and Contractionary Devaluations: The Output Impact of Real Exchange Rate Shocks in Developing Countries that Export Manufactures, Department of Economics, Working Paper Series No. 2007-02, American University, Washington D.C.
31
Blundell, R., and S. Bond (1998) Initial conditions and moment restrictions in dynamic panel data models. Journal of Econometrics, 87 (1), 115-143.
Blundell, R., and S. Bond (2000) GMM estimation with persistent panel data: An application to production functions, Econometric Reviews, 19(3), 321-340.
Braütigam, D., and X. Tang (2014) “Going Global in Groups”: Structural Transformation and China’s Special Economic Zones Overseas, World Development, 63(1), 78–91.
Brenton, P., Saborowski, C. and E. von Uexküll (2010) What Explains the Low Survival Rate of Developing Country Export Flows, The World Bank Economic Review, 24(3), 474-499.
Bwalya S. M. (2006) Foreign direct investment and technology spillovers: Evidence from panel data analysis of manufacturing firms in Zambia, Journal of Development Economics, 81, 514–526.
Cadot, O., Carrere, C. and V. Strauss-Khan (2011a) Export diversification: What’s behind the hump? The Review of Economics and Statistics, 93(2), 590-605.
Cadot, O., Carrere, C. and V. Strauss-Kahn (2011b) Trade Diversification: Drivers and Impacts in M. Jansen, R. Peters and J. M. Salazar-Xirinachs (Eds.) Trade and employment: From myths to facts. Geneva: ILO.
Camhano da Costa Neto, N., and R. Romeu (2011) Did export diversification soften the impact of the gobal financial crisis?, IMF Working Paper WP/11/99, Washington DC: The International Monetary Fund.
Carrère, C., and V. Strauss-Khan (2012) Exports Dynamics: Raising Developing Countries Exports Survival through Experience. FERDI Working Paper 35A, Fondation pour les Etudes et Recherches sur le Development International.
Chandra, V., Boccardo, J., and I. Osorio (2007) Export diversification and competitiveness in developing countries, Working Draft, Washington DC: The World Bank.
Chang, H-J. (2002) Kicking Away the Ladder: Development Strategy in Historical Perspective, Anthem Press.
Chenery, H. (1979) Structural change and development policy, New-York; Oxford University Press. 526p.
Cimoli, M., Dosi, G. and J. E. Stiglitz (2009) Industrial Policy and Development: The Political Economy of Capabilities Accumulation, Oxford: Oxford University Press.
Cuberes, D., and M. Jerzmanowski (2009) Democracy, Diversification and Growth Reversals. Economic Journal, 119(540), 1270-1302.
Dai , M., Maitra, M. and M. Yu (2016) Unexceptional exporter performance in China? The role of processing trade. Journal of Development Economics, 121(1), 177-189.
De Benedictis, L., Gallegati, M., and M. Tamberi, (2009) Overall trade specialisation and economic development: countries diversify. Review of World Economics, 145(1), 37-55.
De Ferranti, D., Perri, G.E., Lederman, D. and W.E. Malloney (2002) From Natural Resources to the Knowledge Economy, Washington: the World Bank.
Dutt, P., Mihov, I., and T. Van Zandt (2008) Trade diversification and economic development, INSEAD working paper, Fontainebleau: INSEAD.
Elhiraika, A. B. and M.M. Mbate, (2014), Assessing the Determinants of Export Diversification in Africa, Applied Econometrics and International Development, 14(1), 147-160.
Findlay, R. and R., Jones (2000) Factor Bias and Technical Progress, Economics Letters, 68, 303–308.
Fine, B. and E. Van Waeyenberge (2013) A Paradigm Shift that Never Will Be? Justin Lin's New Structural Economics, No. 179, SOAS Department of Economics Working Paper Series
Frederik, S. and G. Gereffi (2013) Costa Rica in the Electronics Global Value Chain:
32
Opportunities for Upgrading. Center on Globalization, Governance & Competitiveness, Duke University
Freund C., and T. H. Moran (2017) Multinational investors as export superstars : How emerging-market governments can reshape comparative advantage. Peterson Institute for international economics WP 17-1, Washington DC: The Peterson Institute for international economics.
Grossman G. M., and E. Rossi-Hansberg, (2008) Trading tasks: A simple theory of offshoring, American Economic Review, 98(5), 1978-97.
Gundlach, E., and A. de Vaal (2008) Technological change, trade and endogenous factor endowments, Kiel Working Papers 1471, Kiel Institute for the World Economy.
Gutiérrez de Piñeres, S. A., and M. Ferrantino (1997) Export diversification and structural dynamics in the growth process: The case of Chile, Journal of Development Economics, 52(2), 375–391.
Harding, T., and B. Javorcik (2012) Foreign Direct Investment and export upgrading. The Review of Economics and Statistics, 94(4), 964–980.
Harrison, A. and A. Rodríguez-Clare (2010) Trade, Foreign Investment, and Industrial Policy for Developing Countries. In D. Rodrik and M. Rosenzweig (Eds.) Handbook of Development Economics, Vol. 5, The Netherlands: North-Holland, 4039-4214.
Hausmann R., Hidalgo C. A., Bustos, S., Coscia, M., Chung, S. Jimenez, J., Simoes, A., and M. Yildirim (2011) The Atlas of Economic Complexity, Cambridge MA: Puritan Press.
Hausmann, R., Hwang, J., and D. Rodrik, (2007) What you export matters, Journal of Economic Growth, 12(1), 1-25.
Hausmann, R., and D. Rodrik (2003) Economic development as self-discovery, Journal of Economic Development, 72, 603-633.
Hirschman, A. O. 1958. The Strategy of Economic Development. New Haven, CT: Yale University Press.
Head, K., and J., Ries (1996) Inter-city competition for foreign investment: static and dynamic effects of China’s incentive areas, Journal of Urban Economics, 40(1), 38-60.
Head, K., Ries, J., and D. Swenson (1999) Attracting foreign manufacturing: investment promotion and agglomeration, Regional Science and Urban Economics, 29(2), 197-218.
Henderson, J.V., and A. Kuncoro (1996) Industrial centralisation in Indonesia, World Bank Economic Review, 10(3), 513-540.
Hesse, H. (2008) Export diversification and economic growth, Commission on growth and development Working Papers No 21, Washington DC: The World Bank.
Holtz-Eakin, D., W. Newey, and H. S. Rosen (1988) Estimating vector autoregressions with panel data, Econometrica 56: 1371–1395.
Imbs, J., and R. Wacziarg (2003) Stages of Diversification, American Economic Review, 93 (1), 63–86.
IMF (2014). Sustaining Long-Run Growth and Macroeconomic Stability in Low-Income Countries: The Role of Structural Transformation and Diversification. IMF Policy Paper. Washington, The International Monetary Fund.
Jarreau, J., and S. Poncet (2012) Export sophistication and economic growth: Evidence from China, Journal of Development Economics, 97(2), 281-292.
Javorcik, B. S. (2004) Does foreign direct investment increase the productivity of domestic firms? In search of spillovers through backward linkages, American Economic Review, 94, 605−627.
Johnson, R. C., and G. Noguera (2012) Accounting for Intermediate Production Sharing and Trade in Value Added. Journal of International Economics 86(2), 224–36.
33
Johnson, R. C., and G. Noguera (2017) A Portrait of Trade in Value Added Over Four Decades, Forthcoming Review of Economics and Statistics.
Klinger, B. and D. Lederman (2004) Discovery and Development: An Empirical Exploration of ‘New’ Products, Working Paper Policy Research n°3450. Washington DC: The World Bank.
Kolstad I., and A. Wiig (2014) Diversification and democracy, CMIWP 2014: 9, Chr. Michelsen Institute.
Koopman, R., Wang, Z., and S.-J., Wei, (2008) How Much of Chinese Exports is Really Made In China? Assessing Domestic Value-Added When Processing Trade is Pervasive, NBER Working Papers 14109, National Bureau of Economic Research.
Koopman, R., Wang, Z., and S.-J., Wei (2012) Estimating Domestic Content in Exports when Processing Trade is Pervasive. Journal of Development Economics 99 (1): 178–89.
Koren, M., and S. Tenreyro (2007) Volatility and Development, The Quarterly Journal of Economics, 122(1), 243–287.
Kuznets S. (1973) Modern economic growth: Findings and reflections, American Economic Review, 63(3), 247-258.
Lall, S. (2000) The Technological Structure and Performance of Developing Country Manufactured Exports, 1985-1998, Oxford Development Studies, 28, 3.
Lall, S., J. Weiss and J. Zhang (2006) The Sophistication of exports: a new trade measure, World Development, 34(2), 222-237.
Lanz, R., S. Miroudot and H. K. Nordås (2011) Trade in Tasks. OECD Trade Policy Working Papers, No. 117, OECD Publishing.
Leamer, E. E. (1987) Paths of development in the three-factor, n-good general equilibrium model, Journal of Political Economy, 95(5), 961-99.
Leiderman, D. and W. Maloney (eds) 2007. Natural Resources: Neither Curse Nor Destiny, World Bank and Stanford University Press.
Lin, J.Y. (2009) Economic development and transition: Thought, strategy, and viability, Cambridge university press.
Lin, J.Y. (2011) Demystifying the Chinese economy, Cambridge university press. Lin, J.Y. (2012) New structural economics: A framework for rethinking development,
Washington DC: The World Bank Publications. Lin, J.Y, and H.J. Chang, HJ (2009) Should Industrial Policy in Developing Countries Conform
to Comparative Advantage or Defy it? A Debate Between Justin Lin and Ha-Joon Chang, Development Policy Review, 27 (5), 483-502.
Lin, P., Liu, Z. and Zhang, Y. (2009) Do Chinese domestic firms benefit from FDI inflow? Evidence of horizontal and vertical spillovers, China Economic Review, 20, 677–691.
Malik, A., and J. R. W. Temple (2009) The geography of output volatility, Journal of Development Economics, 90(2), 163–178.
Markusen, J.R. and Venables, A.J. (1998) Foreign direct investment as a catalyst for industrial development, European Economic Review, 43, 335-356.
McMillan, M. S., and D. Rodrik (2011) Globalization, Structural Change and Productivity Growth, NBER Working Papers 17143, National Bureau of Economic Research, Inc.
Melitz, M. J. (2003) The Impact of Trade on Intra-Industry Reallocations and Aggregate Industry Productivity. Econometrica, 71(6), 1695-1725.
Mobarak, A. M. (2005) Democracy, volatility and economic development, The Review of Economics and Statistics, 87(2): 348–361.
Munemo, J. (2011) Foreign aid and export diversification in developing countries, The Journal of International Trade & Economic Development, 20(3), 339-355.
34
Naudé, W. (2010) Industrial Policy: Old and New Issues, UNU-WIDER Working Paper No. 2010/106.
Naudé, W., A. Szirmai, and N. Haraguchi (2015) Structural Change and Industrial Development in the BRICS, Oxfrod : Oxford University Press.
Naughton, B. (2007) The Chinese Economy: Transitions and Growth, Cambridge, MIT Press. Nicita, A., Shirotori, M. and B. T. Klok (2013) Survival Analysis Of The Exports Of Least
Developed Countries: The Role Of Comparative Advantage, UNCTAD Blue Series Papers 54, United Nations Conference on Trade and Development.
OECD (2013) Implications of Global value Chains for Trade, Investment, Development and Jobs. Joint Report by the OECD, WTO and UNCTAD to the G20 Leaders Summit, Saint Petersburg, Russian Federation.
OECD (2014) Global Value Chains : Chanllenges, Opportunities, and Implications for Policy. Joint Report by the OECD, WTO and UNCTAD to the G20 Trade Ministers Meeting, Sydney, Australia.
OECD (2015) The Participation of Developing Countries in Global Value Chains: Implications for Trade and Trade-Related Policies, OECD Trade Policy Paper, No. 179, OECD Publishing.
Parteka, A. (2010). Employment and export specialization along the development path: Some robust evidence. Review of World Economics, 145(4), 615–640.
Parteka, A. and M. Tamberi (2013a) What Determines Export Diversification in the Development Process? Empirical Assessment. The World Economy, 36: 807–826
Parteka, A., and M. Tamberi (2013b). Product diversification, relative specialization and economic development: Import-export analysis. Journal of Macroeconomics, 38(A), 121–135.
Paus, E.A., and P. Gallagher (2008) Missing Links: Foreign Investment and Industrial Development in Costa Rica and Mexico. Studies in Comparative International Development, 43(1), 53-80.
Paus, E. (2014) Industrial development strategies in Costa Rica: When structural change and domestic capability accumulation diverge. In Salazar-Xirinachs, J.M et al. Transforming economies, Making industrial policy work for growth, jobs and development, Geneva : ILO, pp.400.
Pavcnik, N. (2002). Trade liberalization, exit, and productivity improvements: Evidence from Chilean plants. Review of Economic Studies, 69, 245−276.
Ranis G. (1995) Another Look at the East Asian Miracle, The World Bank Economic Review, vol. 9, n° 3, pp. 509-34.
Rodríguez-Clare, A., and Harrison, A. (2010) Trade, foreign investment and industrial policy, in Rodrik, D., Rozensweig, M. (Dir.), Handbook of Development Economics, vol. 5, Amsterdam: North-Holland.
Rodrik, D. (2008) Normalizing Industrial Policy, Commission on Growth and Development, Working Paper No. 3, Washington, DC.
Rodrik, D. (2011) Comments on “New Structural Economics” by Justin Yifu Lin, World Bank Research Observer 26(2), 227-229.
Rodrik, D. (2013) Unconditional Convergence in Manufacturing. The Quarterly Journal of Economics, 128(1), 165–204.
Roodman, D. (2006) How to Do xtabond2: An Introduction to Difference GMM and GMM System GMM in Stata, Working Papers 103, Center for Global Development.
Schmitz, H. (2007) Reducing Complexity in the Industrial Policy Debate, Development Policy Review, 25(4), 417-428.
35
Schott, P. K. (2003) One size fits all? Hecksher-Ohlin specialization in global production, The American Economic Review, 93(3), 686-708.
Schott, P.K. (2008) The relative sophistication of Chinese exports, Economic Policy, 23(53), 5–49.
Shirotori, M., Tumurchudur, B., and O. Cadot (2010) Revealed factor intensity indices at the product level, UNCTD study series N°44.
Singh, A. (2011) Comparative Advantage, Industrial Policy and the World Bank: Back to First Principles, Policy Studies, 32(4), 447-60.
Sturgeon, T. J. and M. Kawakami (2010) Global Value Chains in the Electronics Industry: Was the Crisis a Window of Opportunity for Developing Countries? Policy Research Working Paper 5417, Washington DC: The World Bank.
Sutton, J. (2012) Competing in capabilities. The globalization process. Oxford: Oxfrod University Press.
Srholec, M. (2007) High-tech exports from developing countries: A symptom of technology spurts or statisticall illusion? Review of World Economics , 143(2), 227-255.
UNCTAD (2013) World Investment report 2013: Global Value Chains: Investment and Trade for Development, United Nations Conference on Trade and Development, United Nations Publication.
Van Assche, A., and B., Gangnes, (2010) Electronics production upgrading: is China exceptional? Applied Economics Letters, 17(5), 477-482.
Vanek, J. (1968) The factor proportions theory: The N-factor case, Kyklos, 21(4), 749-56. Venables, A.J. (1996) Equilibrium locations of vertically linked industries, International
Economic Review, 37(2), 341-359. Wade R. (1990) Governing the market, Princeton and Oxford, Princeton University Press. World Bank (1993) The East Asian miracle: Economic growth and public policy, Oxford,
Oxford University Press and the World Bank. Weldemicael, E. (2012) Determinants of exports sophistication, Melbourne University,
mimeo. Xiang, C. (2007) Diversification cones, trade costs and factor market, Journal of International
Economics, 71(2), 448-466. Yue, C., and P. Hua (2002) Does comparative advantage explains export patterns in China?
China Economic Review, 13(1), 276-296. Zhu, S., and X. Fu (2013) Drivers of Export Upgrading, World Development, 51(C), 221-233.
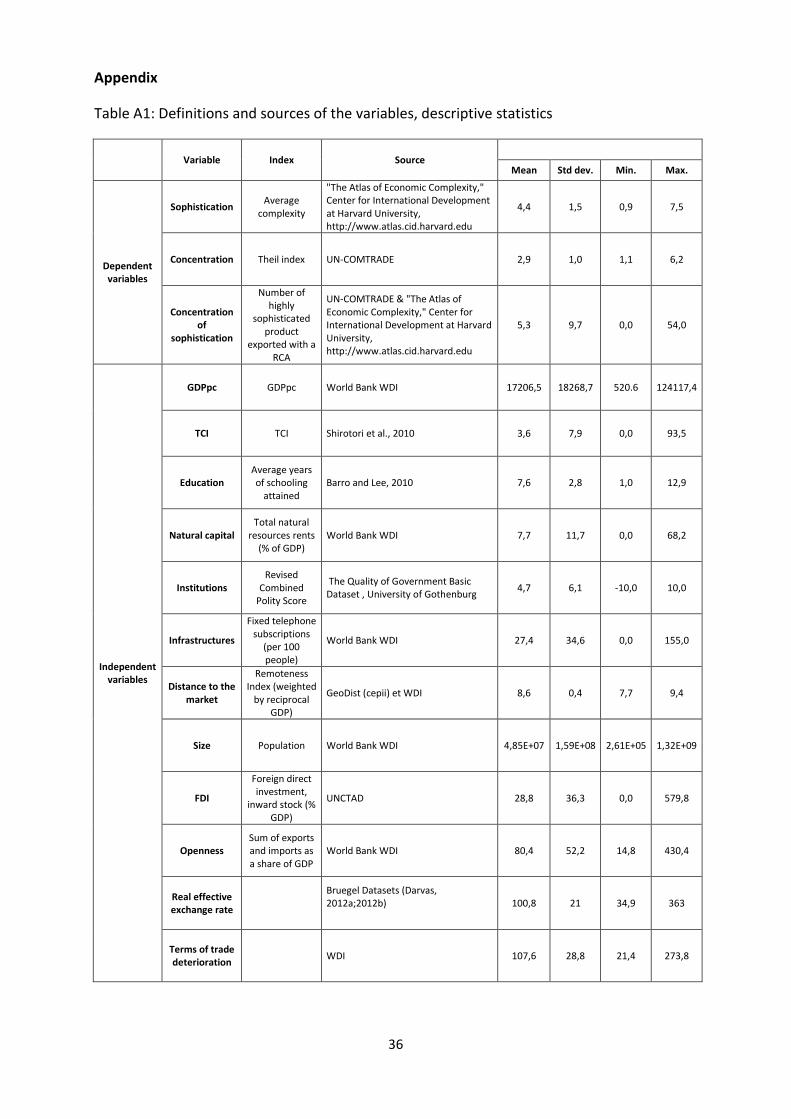
36
Appendix
Table A1: Definitions and sources of the variables, descriptive statistics
Variable Index Source Mean Std dev. Min. Max.
Dependent variables
Sophistication Average complexity
"The Atlas of Economic Complexity," Center for International Development at Harvard University, http://www.atlas.cid.harvard.edu
4,4 1,5 0,9 7,5
Concentration Theil index UN-COMTRADE 2,9 1,0 1,1 6,2
Concentration of
sophistication
Number of highly
sophisticated product
exported with a RCA
UN-COMTRADE & "The Atlas of Economic Complexity," Center for International Development at Harvard University, http://www.atlas.cid.harvard.edu
5,3 9,7 0,0 54,0
Independent variables
GDPpc GDPpc World Bank WDI 17206,5 18268,7 520.6 124117,4
TCI TCI Shirotori et al., 2010 3,6 7,9 0,0 93,5
Education Average years of schooling
attained Barro and Lee, 2010 7,6 2,8 1,0 12,9
Natural capital Total natural
resources rents (% of GDP)
World Bank WDI 7,7 11,7 0,0 68,2
Institutions Revised
Combined Polity Score
The Quality of Government Basic Dataset , University of Gothenburg 4,7 6,1 -10,0 10,0
Infrastructures
Fixed telephone subscriptions
(per 100 people)
World Bank WDI 27,4 34,6 0,0 155,0
Distance to the market
Remoteness Index (weighted
by reciprocal GDP)
GeoDist (cepii) et WDI 8,6 0,4 7,7 9,4
Size Population World Bank WDI 4,85E+07 1,59E+08 2,61E+05 1,32E+09
FDI
Foreign direct investment,
inward stock (% GDP)
UNCTAD 28,8 36,3 0,0 579,8
Openness Sum of exports and imports as a share of GDP
World Bank WDI 80,4 52,2 14,8 430,4
Real effective exchange rate
Bruegel Datasets (Darvas, 2012a;2012b)
100,8 21 34,9 363
Terms of trade deterioration WDI 107,6 28,8 21,4 273,8
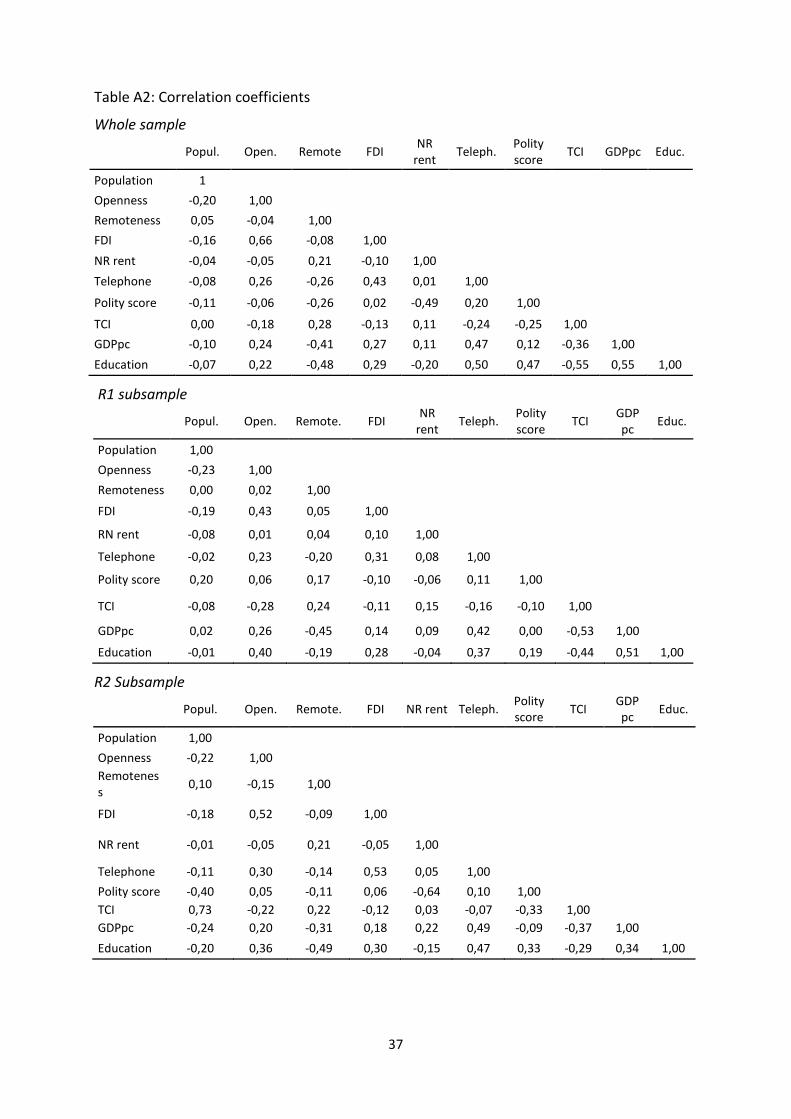
37
Table A2: Correlation coefficients
Whole sample
Popul. Open. Remote FDI NR rent Teleph. Polity
score TCI GDPpc Educ.
Population 1 Openness -0,20 1,00 Remoteness 0,05 -0,04 1,00 FDI -0,16 0,66 -0,08 1,00 NR rent -0,04 -0,05 0,21 -0,10 1,00 Telephone -0,08 0,26 -0,26 0,43 0,01 1,00 Polity score -0,11 -0,06 -0,26 0,02 -0,49 0,20 1,00 TCI 0,00 -0,18 0,28 -0,13 0,11 -0,24 -0,25 1,00 GDPpc -0,10 0,24 -0,41 0,27 0,11 0,47 0,12 -0,36 1,00 Education -0,07 0,22 -0,48 0,29 -0,20 0,50 0,47 -0,55 0,55 1,00
R1 subsample
Popul. Open. Remote. FDI NR rent Teleph. Polity
score TCI GDP pc Educ.
Population 1,00 Openness -0,23 1,00 Remoteness 0,00 0,02 1,00 FDI -0,19 0,43 0,05 1,00 RN rent -0,08 0,01 0,04 0,10 1,00 Telephone -0,02 0,23 -0,20 0,31 0,08 1,00 Polity score 0,20 0,06 0,17 -0,10 -0,06 0,11 1,00 TCI -0,08 -0,28 0,24 -0,11 0,15 -0,16 -0,10 1,00 GDPpc 0,02 0,26 -0,45 0,14 0,09 0,42 0,00 -0,53 1,00 Education -0,01 0,40 -0,19 0,28 -0,04 0,37 0,19 -0,44 0,51 1,00
R2 Subsample
Popul. Open. Remote. FDI NR rent Teleph. Polity score TCI GDP
pc Educ.
Population 1,00 Openness -0,22 1,00 Remoteness 0,10 -0,15 1,00
FDI -0,18 0,52 -0,09 1,00
NR rent -0,01 -0,05 0,21 -0,05 1,00 Telephone -0,11 0,30 -0,14 0,53 0,05 1,00 Polity score -0,40 0,05 -0,11 0,06 -0,64 0,10 1,00 TCI 0,73 -0,22 0,22 -0,12 0,03 -0,07 -0,33 1,00 GDPpc -0,24 0,20 -0,31 0,18 0,22 0,49 -0,09 -0,37 1,00 Education -0,20 0,36 -0,49 0,30 -0,15 0,47 0,33 -0,29 0,34 1,00
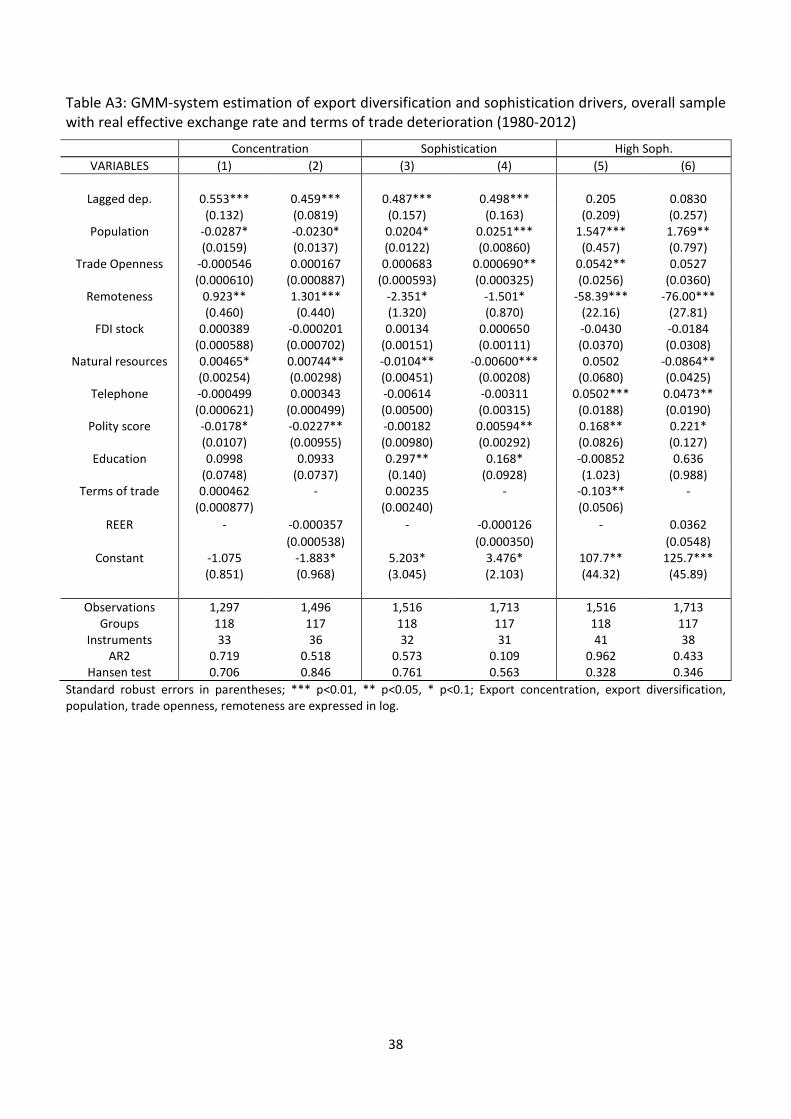
38
Table A3: GMM-system estimation of export diversification and sophistication drivers, overall sample with real effective exchange rate and terms of trade deterioration (1980-2012)
Concentration Sophistication High Soph. VARIABLES (1) (2) (3) (4) (5) (6)
Lagged dep. 0.553*** 0.459*** 0.487*** 0.498*** 0.205 0.0830
(0.132) (0.0819) (0.157) (0.163) (0.209) (0.257) Population -0.0287* -0.0230* 0.0204* 0.0251*** 1.547*** 1.769**
(0.0159) (0.0137) (0.0122) (0.00860) (0.457) (0.797) Trade Openness -0.000546 0.000167 0.000683 0.000690** 0.0542** 0.0527
(0.000610) (0.000887) (0.000593) (0.000325) (0.0256) (0.0360) Remoteness 0.923** 1.301*** -2.351* -1.501* -58.39*** -76.00***
(0.460) (0.440) (1.320) (0.870) (22.16) (27.81) FDI stock 0.000389 -0.000201 0.00134 0.000650 -0.0430 -0.0184
(0.000588) (0.000702) (0.00151) (0.00111) (0.0370) (0.0308) Natural resources 0.00465* 0.00744** -0.0104** -0.00600*** 0.0502 -0.0864**
(0.00254) (0.00298) (0.00451) (0.00208) (0.0680) (0.0425) Telephone -0.000499 0.000343 -0.00614 -0.00311 0.0502*** 0.0473**
(0.000621) (0.000499) (0.00500) (0.00315) (0.0188) (0.0190) Polity score -0.0178* -0.0227** -0.00182 0.00594** 0.168** 0.221*
(0.0107) (0.00955) (0.00980) (0.00292) (0.0826) (0.127) Education 0.0998 0.0933 0.297** 0.168* -0.00852 0.636
(0.0748) (0.0737) (0.140) (0.0928) (1.023) (0.988) Terms of trade 0.000462 - 0.00235 - -0.103** -
(0.000877) (0.00240) (0.0506) REER - -0.000357 - -0.000126 - 0.0362
(0.000538) (0.000350) (0.0548) Constant -1.075 -1.883* 5.203* 3.476* 107.7** 125.7***
(0.851) (0.968) (3.045) (2.103) (44.32) (45.89)
Observations 1,297 1,496 1,516 1,713 1,516 1,713 Groups
Instruments AR2
Hansen test
118 33
0.719 0.706
117 36
0.518 0.846
118 32
0.573 0.761
117 31
0.109 0.563
118 41
0.962 0.328
117 38
0.433 0.346
Standard robust errors in parentheses; *** p<0.01, ** p<0.05, * p<0.1; Export concentration, export diversification, population, trade openness, remoteness are expressed in log.
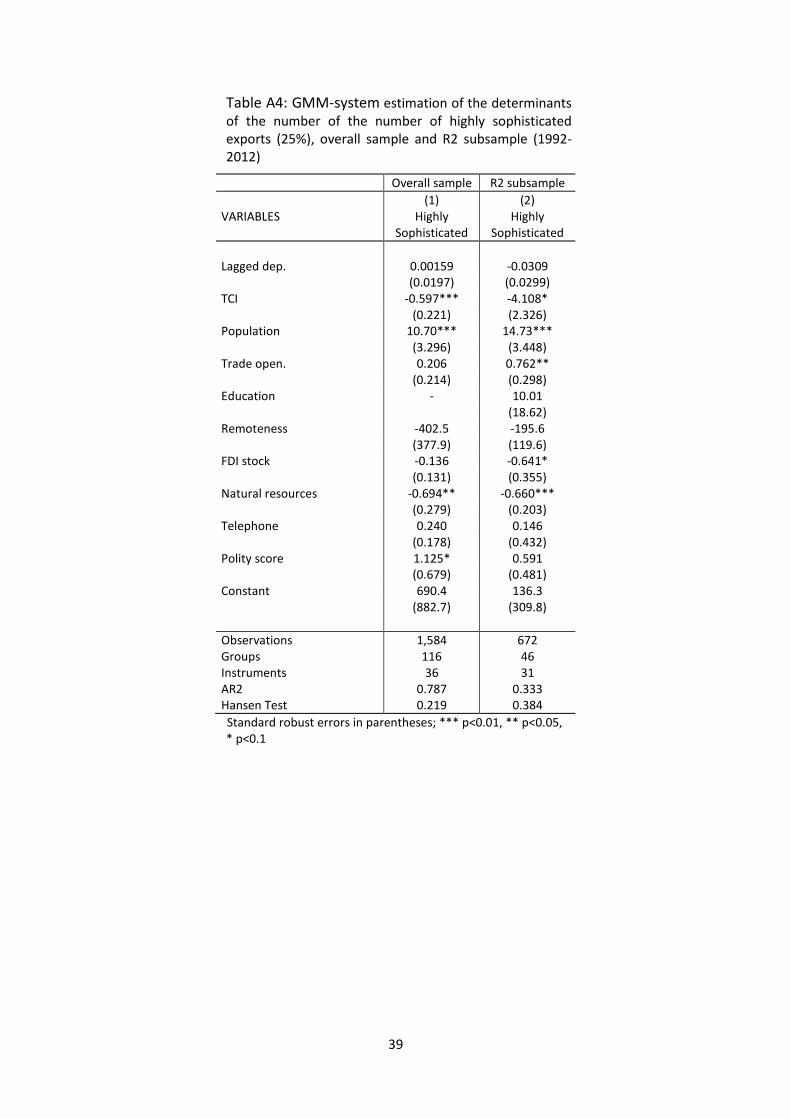
39
Table A4: GMM-system estimation of the determinants of the number of the number of highly sophisticated exports (25%), overall sample and R2 subsample (1992-2012)
Overall sample R2 subsample (1) (2) VARIABLES Highly
Sophisticated Highly
Sophisticated Lagged dep. 0.00159 -0.0309 (0.0197) (0.0299) TCI -0.597*** -4.108* (0.221) (2.326) Population 10.70*** 14.73*** (3.296) (3.448) Trade open. 0.206 0.762** (0.214) (0.298) Education - 10.01 (18.62) Remoteness -402.5 -195.6 (377.9) (119.6) FDI stock -0.136 -0.641* (0.131) (0.355) Natural resources -0.694** -0.660*** (0.279) (0.203) Telephone 0.240 0.146 (0.178) (0.432) Polity score 1.125* 0.591 (0.679) (0.481) Constant 690.4 136.3 (882.7) (309.8) Observations 1,584 672 Groups Instruments AR2 Hansen Test
116 36
0.787 0.219
46 31
0.333 0.384
Standard robust errors in parentheses; *** p<0.01, ** p<0.05, * p<0.1
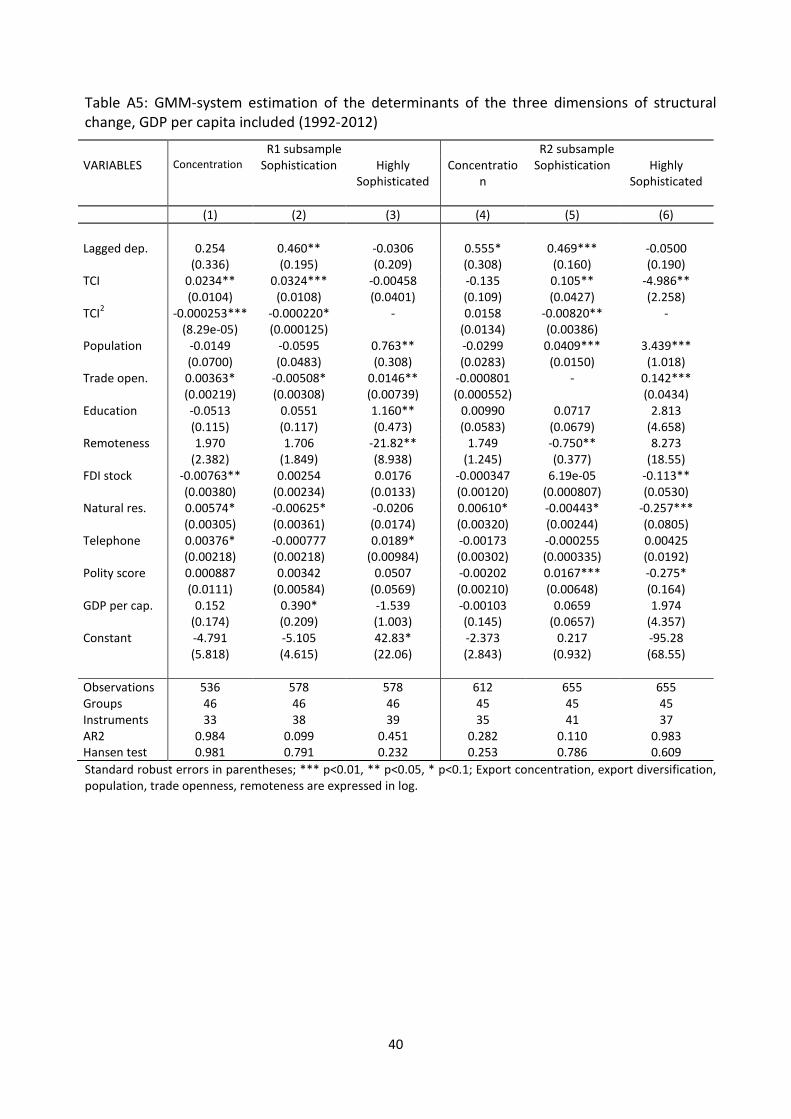
40
Table A5: GMM-system estimation of the determinants of the three dimensions of structural change, GDP per capita included (1992-2012)
R1 subsample R2 subsample VARIABLES Concentration Sophistication Highly
Sophisticated Concentratio
n Sophistication Highly
Sophisticated
(1) (2) (3) (4) (5) (6)
Lagged dep. 0.254 0.460** -0.0306 0.555* 0.469*** -0.0500 (0.336) (0.195) (0.209) (0.308) (0.160) (0.190)
TCI 0.0234** 0.0324*** -0.00458 -0.135 0.105** -4.986** (0.0104) (0.0108) (0.0401) (0.109) (0.0427) (2.258)
TCI2 -0.000253*** -0.000220* - 0.0158 -0.00820** - (8.29e-05) (0.000125) (0.0134) (0.00386)
Population -0.0149 -0.0595 0.763** -0.0299 0.0409*** 3.439*** (0.0700) (0.0483) (0.308) (0.0283) (0.0150) (1.018)
Trade open. 0.00363* -0.00508* 0.0146** -0.000801 - 0.142*** (0.00219) (0.00308) (0.00739) (0.000552) (0.0434)
Education -0.0513 0.0551 1.160** 0.00990 0.0717 2.813 (0.115) (0.117) (0.473) (0.0583) (0.0679) (4.658)
Remoteness 1.970 1.706 -21.82** 1.749 -0.750** 8.273 (2.382) (1.849) (8.938) (1.245) (0.377) (18.55)
FDI stock -0.00763** 0.00254 0.0176 -0.000347 6.19e-05 -0.113** (0.00380) (0.00234) (0.0133) (0.00120) (0.000807) (0.0530)
Natural res. 0.00574* -0.00625* -0.0206 0.00610* -0.00443* -0.257*** (0.00305) (0.00361) (0.0174) (0.00320) (0.00244) (0.0805)
Telephone 0.00376* -0.000777 0.0189* -0.00173 -0.000255 0.00425 (0.00218) (0.00218) (0.00984) (0.00302) (0.000335) (0.0192)
Polity score 0.000887 0.00342 0.0507 -0.00202 0.0167*** -0.275* (0.0111) (0.00584) (0.0569) (0.00210) (0.00648) (0.164)
GDP per cap. 0.152 0.390* -1.539 -0.00103 0.0659 1.974 (0.174) (0.209) (1.003) (0.145) (0.0657) (4.357)
Constant -4.791 -5.105 42.83* -2.373 0.217 -95.28 (5.818) (4.615) (22.06) (2.843) (0.932) (68.55)
Observations 536 578 578 612 655 655 Groups Instruments AR2 Hansen test
46 33
0.984 0.981
46 38
0.099 0.791
46 39
0.451 0.232
45 35
0.282 0.253
45 41
0.110 0.786
45 37
0.983 0.609
Standard robust errors in parentheses; *** p<0.01, ** p<0.05, * p<0.1; Export concentration, export diversification, population, trade openness, remoteness are expressed in log.
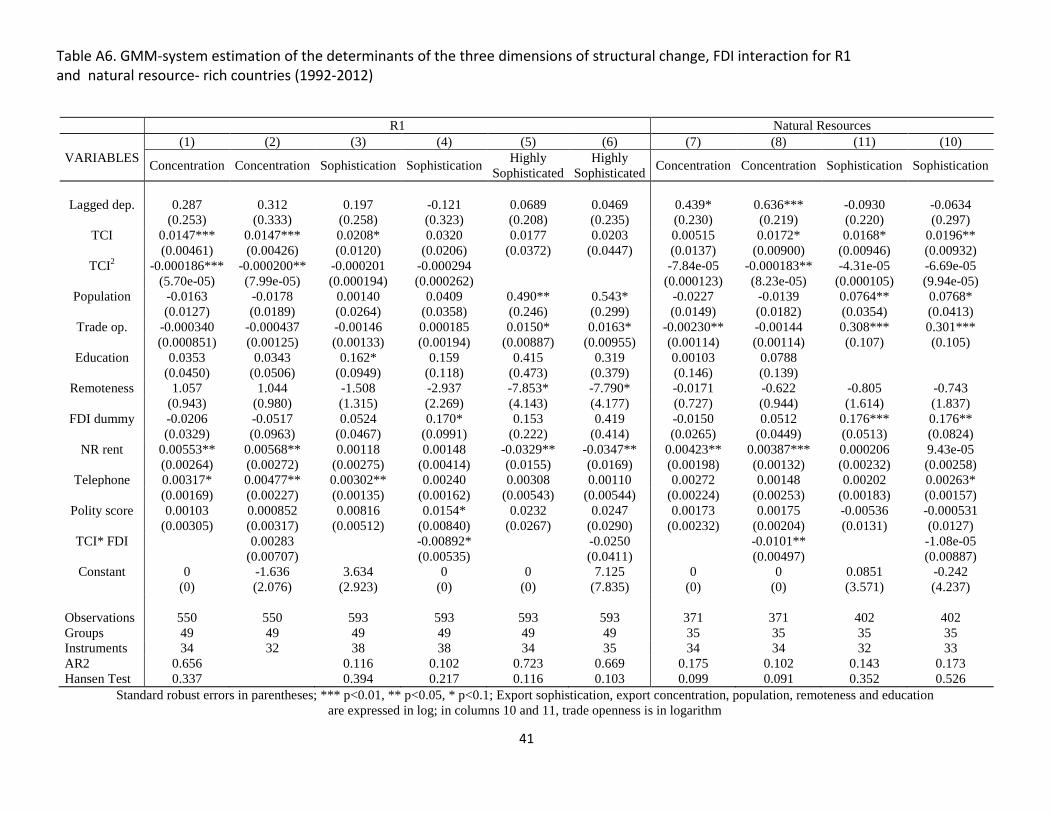
41
Table A6. GMM-system estimation of the determinants of the three dimensions of structural change, FDI interaction for R1 and natural resource- rich countries (1992-2012)
Standard robust errors in parentheses; *** p<0.01, ** p<0.05, * p<0.1; Export sophistication, export concentration, population, remoteness and education are expressed in log; in columns 10 and 11, trade openness is in logarithm
R1 Natural Resources (1) (2) (3) (4) (5) (6) (7) (8) (11) (10)
VARIABLES Concentration Concentration Sophistication Sophistication Highly Sophisticated
HighlySophisticated Concentration Concentration Sophistication Sophistication
Lagged dep. 0.287 0.312 0.197 -0.121 0.0689 0.0469 0.439* 0.636*** -0.0930 -0.0634 (0.253) (0.333) (0.258) (0.323) (0.208) (0.235) (0.230) (0.219) (0.220) (0.297)
TCI 0.0147*** 0.0147*** 0.0208* 0.0320 0.0177 0.0203 0.00515 0.0172* 0.0168* 0.0196** (0.00461) (0.00426) (0.0120) (0.0206) (0.0372) (0.0447) (0.0137) (0.00900) (0.00946) (0.00932)
TCI2 -0.000186*** -0.000200** -0.000201 -0.000294 -7.84e-05 -0.000183** -4.31e-05 -6.69e-05 (5.70e-05) (7.99e-05) (0.000194) (0.000262) (0.000123) (8.23e-05) (0.000105) (9.94e-05)
Population -0.0163 -0.0178 0.00140 0.0409 0.490** 0.543* -0.0227 -0.0139 0.0764** 0.0768* (0.0127) (0.0189) (0.0264) (0.0358) (0.246) (0.299) (0.0149) (0.0182) (0.0354) (0.0413)
Trade op. -0.000340 -0.000437 -0.00146 0.000185 0.0150* 0.0163* -0.00230** -0.00144 0.308*** 0.301*** (0.000851) (0.00125) (0.00133) (0.00194) (0.00887) (0.00955) (0.00114) (0.00114) (0.107) (0.105)
Education 0.0353 0.0343 0.162* 0.159 0.415 0.319 0.00103 0.0788 (0.0450) (0.0506) (0.0949) (0.118) (0.473) (0.379) (0.146) (0.139)
Remoteness 1.057 1.044 -1.508 -2.937 -7.853* -7.790* -0.0171 -0.622 -0.805 -0.743 (0.943) (0.980) (1.315) (2.269) (4.143) (4.177) (0.727) (0.944) (1.614) (1.837)
FDI dummy -0.0206 -0.0517 0.0524 0.170* 0.153 0.419 -0.0150 0.0512 0.176*** 0.176** (0.0329) (0.0963) (0.0467) (0.0991) (0.222) (0.414) (0.0265) (0.0449) (0.0513) (0.0824)
NR rent 0.00553** 0.00568** 0.00118 0.00148 -0.0329** -0.0347** 0.00423** 0.00387*** 0.000206 9.43e-05 (0.00264) (0.00272) (0.00275) (0.00414) (0.0155) (0.0169) (0.00198) (0.00132) (0.00232) (0.00258)
Telephone 0.00317* 0.00477** 0.00302** 0.00240 0.00308 0.00110 0.00272 0.00148 0.00202 0.00263* (0.00169) (0.00227) (0.00135) (0.00162) (0.00543) (0.00544) (0.00224) (0.00253) (0.00183) (0.00157)
Polity score 0.00103 0.000852 0.00816 0.0154* 0.0232 0.0247 0.00173 0.00175 -0.00536 -0.000531 (0.00305) (0.00317) (0.00512) (0.00840) (0.0267) (0.0290) (0.00232) (0.00204) (0.0131) (0.0127)
TCI* FDI 0.00283 -0.00892* -0.0250 -0.0101** -1.08e-05 (0.00707) (0.00535) (0.0411) (0.00497) (0.00887)
Constant 0 -1.636 3.634 0 0 7.125 0 0 0.0851 -0.242 (0) (2.076) (2.923) (0) (0) (7.835) (0) (0) (3.571) (4.237)
Observations 550 550 593 593 593 593 371 371 402 402 Groups 49 49 49 49 49 49 35 35 35 35 Instruments 34 32 38 38 34 35 34 34 32 33 AR2 0.656 0.116 0.102 0.723 0.669 0.175 0.102 0.143 0.173 Hansen Test 0.337 0.394 0.217 0.116 0.103 0.099 0.091 0.352 0.526
Cahiers du GREThA Working papers of GREThA
GREThA UMR CNRS 5113
Université de Bordeaux
Avenue Léon Duguit 33608 PESSAC - FRANCE Tel : +33 (0)5.56.84.25.75 Fax : +33 (0)5.56.84.86.47
http://gretha.u-bordeaux.fr/
Cahiers du GREThA (derniers numéros – last issues)
2016-26 : CHIBA Fadoua : Optimal taxation with intermittent generation
2017-01 : DELFAUD Pierre : Naissance d’une (très) grande région : La Nouvelle – Aquitaine, an 1
2017-02 : BONIN Hubert : Schneider grand acteur de la guerre industrielle en 1914-1918
2017-03 : GRAVEL Nicolas, MAGDALOU Brice, MOYES Patrick : Principe d'Equité de Hammond et Mesure des Inégalités Ordinales
2017-04 : CARAYOL Nicolas, LANOE Marianne : The Impact of Project-Based Funding in Science: Lessons from the ANR Experience
2017-05: RAIS ASSA Claire, MOUYSSET Lauriane, AY Jean-Sauveur, JIGUET Frédéric, LORRILIERE Romain, DOYEN Luc : A bio-economic analysis for land-uses and biodiversity in metropolitan France
2017-06: BERGE Laurent, CARAYOL Nicolas, ROUX Pascale: How do inventor networks affect urban invention?
2017-07: MIGUELEZ Ernest, NOUMEDEM TEMGOUA Claudia: Immigration externalities, knowledge flows and brain gain
2017-08: MALHERBE Léo, Monnaie endogène : une synthèse hétérodoxe
2017-09: ROUGIER Eric, COMBARNOUS, François, FAURE Yves-André: The ‘local economy’ effect of social transfers: A municipality-level analysis of the local growth impact of the Bolsa Familia Programme in the Brazilian Nordeste
2017-10: Olivier JOALLAND, Tina RAMBONILAZA: L'impact du déploiement des énergies renouvelables sur la valeur touristique des paysages ruraux : les enseignements d’une approche hédonique spatiale
2017-11: Léo CHARLES: A new empirical test of the infant-industry argument: the case of Switzerland protectionism during the 19th century
2017-12: Doyen, Armstrong, Baumgärtner, Béné, Blanchard, Cissé, Cooper, Duta, Freitas, Gourguet, Gusmao, Jarre, Lorne Little, Macher, Mouysset, Quaas, Regnier, Sanz, Thébaud: De politiques consensuelles aux arbres de viabilité
2017-13 : BONIN Hubert, Le quasi-krach de la Société générale en 1913 : une crise de son modèle économique ?
La coordination scientifique des Cahiers du GREThA est assurée par Emmanuel PETIT. La mise en page et la diffusion sont assurées par Julie VISSAGUET