Embed Size (px)
Citation preview

Mexico, a New Landscape
Ernesto OchoaTennessee Gas Pipeline
September 14, 2017
Forward-Looking Statements
This presentation includes forward-looking statements within the meaning of the U.S. Private Securities Litigation Reform Act of 1995
and Section 21E of the Securities and Exchange Act of 1934. These forward-looking statements are identified as any statement that
does not relate strictly to historical or current facts. In particular, statements, express or implied, concerning future actions, conditions or
events, future operating results or the ability to generate revenues, income or cash flow or to pay dividends are forward-looking
statements. Forward-looking statements are not guarantees of performance. They involve risks, uncertainties and assumptions. Future
actions, conditions or events and future results of operations of Kinder Morgan, Inc. may differ materially from those expressed in these
forward-looking statements. Many of the factors that will determine these results are beyond Kinder Morgan's ability to control or
predict. These statements are necessarily based upon various assumptions involving judgments with respect to the future, including,
among others, the timing and extent of changes in the supply of and demand for the products we transport and handle; national,
international, regional and local economic, competitive and regulatory conditions and developments; the timing and success of
business development efforts; technological developments; condition of capital and credit markets; inflation rates; interest rates; the
political and economic stability of oil producing nations; energy markets; weather conditions; environmental conditions; business,
regulatory and legal decisions; terrorism, including cyber-attacks; and other uncertainties. There is no assurance that any of the
actions, events or results of the forward-looking statements will occur, or if any of them do, what impact they will have on our results of
operations or financial condition. Because of these uncertainties, you are cautioned not to put undue reliance on any forward-looking
statement. Please read "Risk Factors" and "Information Regarding Forward-Looking Statements" in our most recent Annual Report on
Form 10-K and our subsequently filed Exchange Act reports, which are available through the SEC’s EDGAR system at www.sec.gov
and on our website at www.kindermorgan.com.
2

The Big Picture
Dramatic supply growth continuesMarcellus, Utica, Permian, Eagle Ford….. Unconventional = the “new” conventional?
Gas demand continues growth trajectoryUS economy : power gen residential / industrial Exports : LNG; Mexico
Infrastructure impetusNew sources new plumbing supply to marketMexico Energy Reform
3

4
U.S. becomes net exporter Industrial demand growth
Less Canadian Exports to U.S. More U.S. Exports to MexicoContinued supply increases
Gas-fired generation increases
Source: ICF International and Kinder Morgan Analysis
+9.6 BcfdRes +1.9 Bcfd
+20.1 Bcfd +1.5 Bcfd-2.0 Bcfd
+7.7 BcfdInd +3.1 Bcfd
Current Key Trends

Natural Gas Supply
5
BCF/d
Source: ICF International and Kinder Morgan Analysis

Key Natural Gas Basins
Well-positioned connecting key natural gas resources with major demand centers
__________________________
(a) Includes KM share of non-wholly owned projects. Includes
projects currently under construction. 6
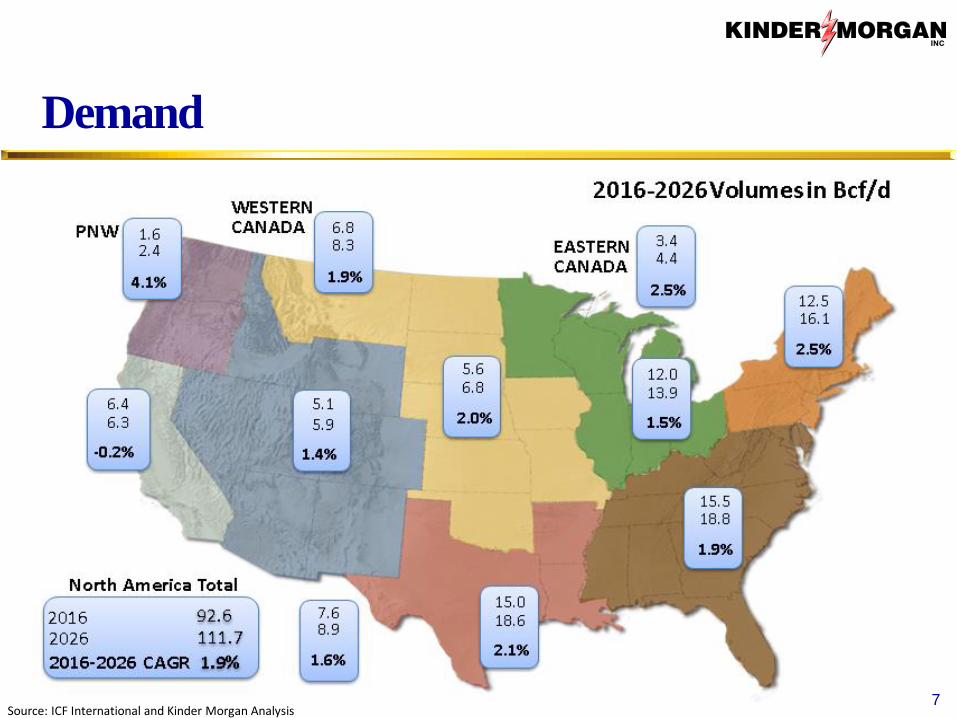
Demand
7Source: ICF International and Kinder Morgan Analysis

Flow Changes
8Source: ICF International and Kinder Morgan Analysis

9
SENER Forecasts demand in
Mexico to grow by 1.3 Bcfd
between 2016 and 2026
Imports are forecasted to grow by 850
MMcfd between 2016 and 2026
Production in Mexico is forecasted to
grow 460 MMcfd from 2016 to 2026
24 GW of renewable power
generation capacity being
installed between 2016 and 2030
No natural gas storage in Mexico
Mexico Supply Demand Forecast

10
Regional Demand Growth
Noreste
Noroeste
Centro-
Occidente
Centro
Sur-Sureste
Source: SENER
+440
+380
+700
-20 -230
0
1,000
2,000
3,000
4,000
5,000
6,000
7,000
8,000
9,000
10,000
2016
2017
2018
2019
2020
2021
2022
2023
2024
2025
2026
Dem
and
(m
mp
cd)
Regional Demand Forecasts
Noroeste Noreste Centro-Occidente Centro Sur-Sureste

Mexico Energy Reform
11
Oil & Gas ProductionOpen to private investment
ElectricityMore merchant generation.
Gas TransmissionShipper direction
2014 2015 2016 2017 2018New CENACE - Electricity Market Commences
CENAGAS formed
Round 0 Bidding
Round 1 Bidding
Additional bidding rounds
CENAGAS Operating Gas Pipelines
Energy Reform Authorized via
change to Mexico’s Constitution
Market-based gas pricing
Petroleum product prices deregulated
Mexico auctions pipeline capacity

Open / Competitive Natural Gas Market
12
Law Pipeline Capacity
Natural Gas Supply
Storage / Balancing
Transparent Pricing at “Liquid” HUBS
Need all to have a successful market
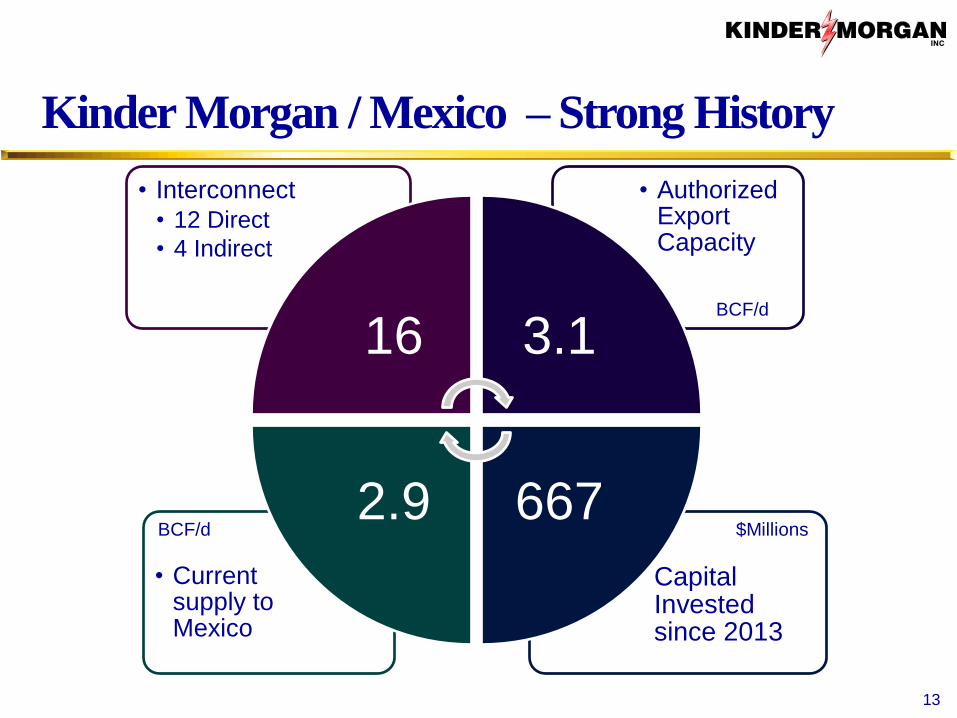
Kinder Morgan / Mexico –Strong History
13
• Capital Invested since 2013
• Current supply to Mexico
• Authorized Export Capacity
• Interconnect• 12 Direct
• 4 Indirect
16 3.1
6672.9$MillionsBCF/d
BCF/d
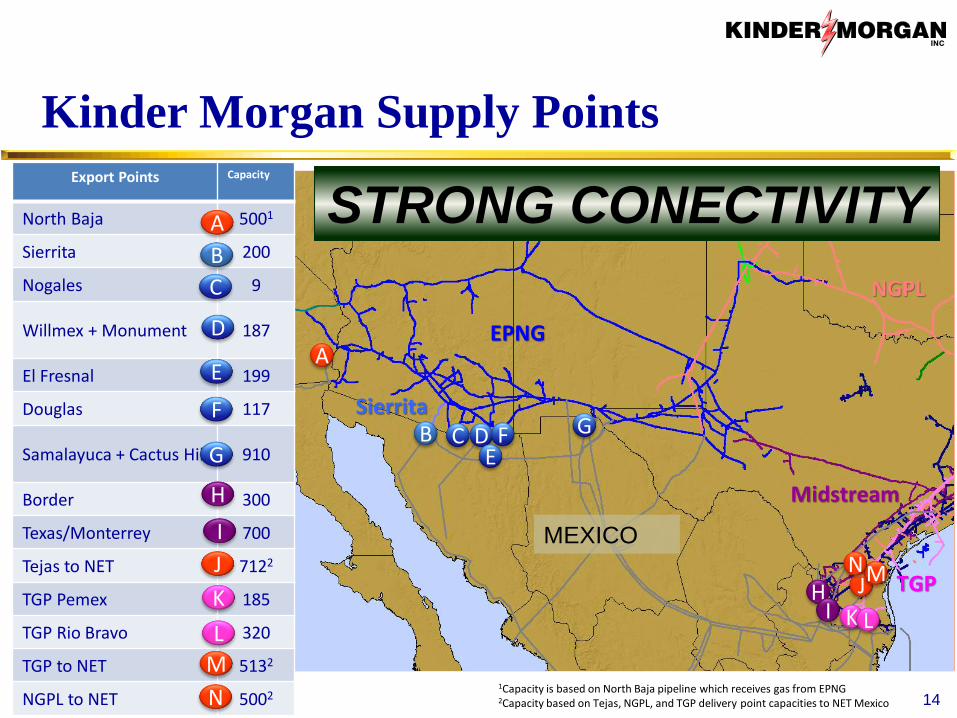
Kinder Morgan Supply Points
14
A
B C DE
F G
HI
J
K L
1Capacity is based on North Baja pipeline which receives gas from EPNG2Capacity based on Tejas, NGPL, and TGP delivery point capacities to NET Mexico
EPNG
NGPL
Midstream
TGP
Sierrita
Export Points Capacity
North Baja 5001
Sierrita 200
Nogales 9
Willmex + Monument 187
El Fresnal 199
Douglas 117
Samalayuca + Cactus Hill 910
Border 300
Texas/Monterrey 700
Tejas to NET 7122
TGP Pemex 185
TGP Rio Bravo 320
TGP to NET 5132
NGPL to NET 5002
A
B
C
D
E
F
G
H
I
J
K
L
M
N
MN
STRONG CONECTIVITY
MEXICO

Exports to Mexico

TGP Supply Diversity
16
NET Mexico
Rio BravoReynosa
Marcellus19.8 Bcf/d
Haynesville6.7 Bcf/d
Eagle Ford6.4 Bcf/d
Fayetteville1.1 Bcf/d
Utica4.6 Bcf/d
Barnett3.4 Bcf/d
• TGP touches > 42 Bcf/d of diverse shale supply basins• ~ 2 Bcf/d of northeast supply flows through Sta. 87• Average flowing supply (2017): 8.6 Bcf/d• Deliveries to Mexico at ~ 1 Bcf/d

17
TGP Exports to Mexico
(300,000)
(200,000)
(100,000)
-
100,000
200,000
300,000
400,000
1/1/2005 1/1/2006 1/1/2007 1/1/2008 1/1/2009 1/1/2010 1/1/2011 1/1/2012 1/1/2013 1/1/2014 1/1/2015 1/1/2016
Dth
Pemex Net Flows
-
50,000
100,000
150,000
200,000
250,000
300,000
350,000
1/1/2005 1/1/2006 1/1/2007 1/1/2008 1/1/2009 1/1/2010 1/1/2011 1/1/2012 1/1/2013 1/1/2014 1/1/2015 1/1/2016
Dth
Rio Bravo Deliveries
TGP Exports to Mexico

18
TGP Export ts
-
100,000
200,000
300,000
400,000
500,000
600,000
Dth
/d
NET Deliveries
TGP Exports to Mexico
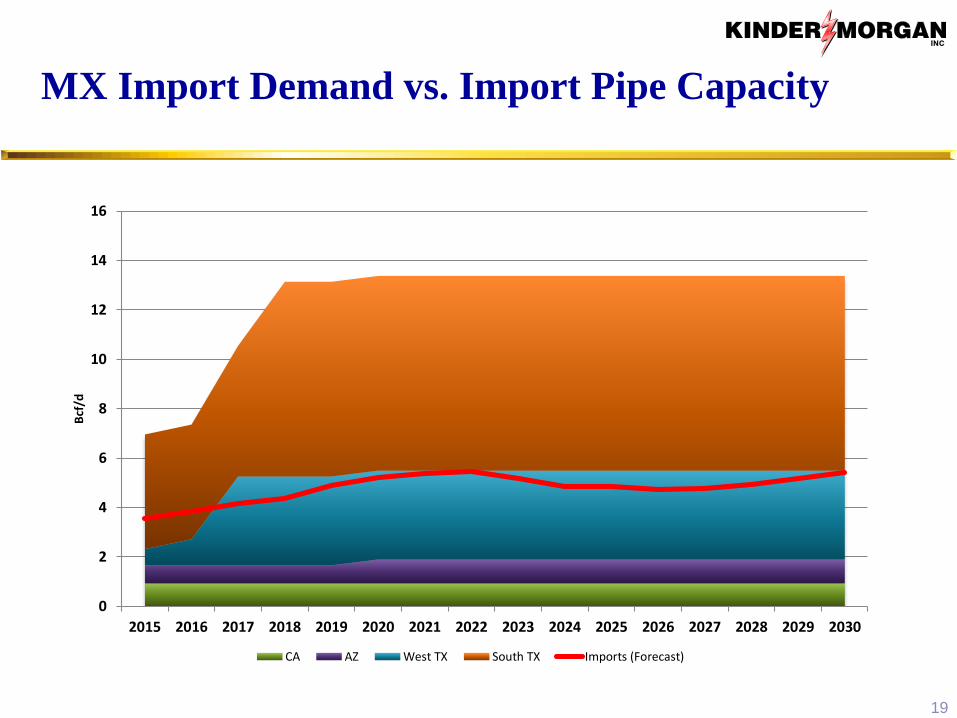
MX Import Demand vs. Import Pipe Capacity
19
0
2
4
6
8
10
12
14
16
2015 2016 2017 2018 2019 2020 2021 2022 2023 2024 2025 2026 2027 2028 2029 2030
Bcf
/d
CA AZ West TX South TX Imports (Forecast)

US Exports Points to Mexico

More Supply Needed at Agua Dulce
21
Growing Demand
~3 BCF/d Supply Deficit
Valley Crossing 2.6 Bcf/d (Oct-18)
Agua Dulce
NET Mexico2.1 Bcf/d TETCO
0.3 Bcf/d
Capacity ~5.4 Bcf/d +
Local Supply 1.2 Bcf/d
TGP0.5 Bcf/d
2019 Demand 9.6 Bcf/d
LNG2.1 Bcf/d
KM Border / Mier1.0 Bcf/d
Other1.0 Bcf/d
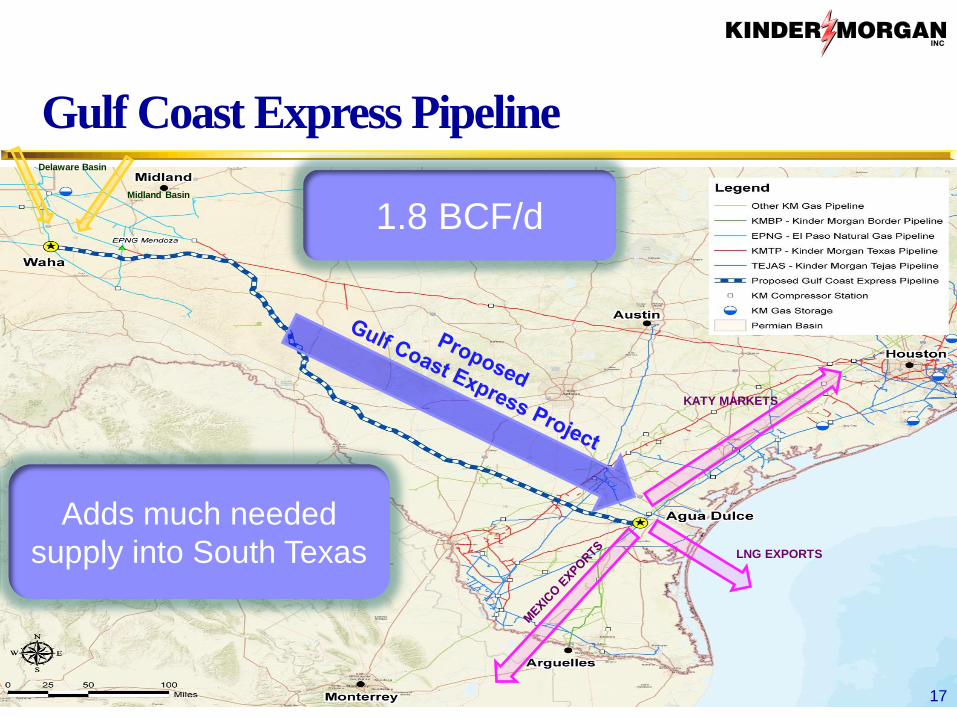
Gulf Coast Express Pipeline
22
Delaware Basin
Midland Basin
KATY MARKETS
LNG EXPORTS
Adds much needed
supply into South Texas
1.8 BCF/d
17

Kinder Morgan Border Expansion
23
150,000 Dth/d19

Thank You