Embed Size (px)
Citation preview
1
Assingment 4. Analysis of paleocurrent data
ERSC/GEOG 2P16 Sedimentology Winter 2011
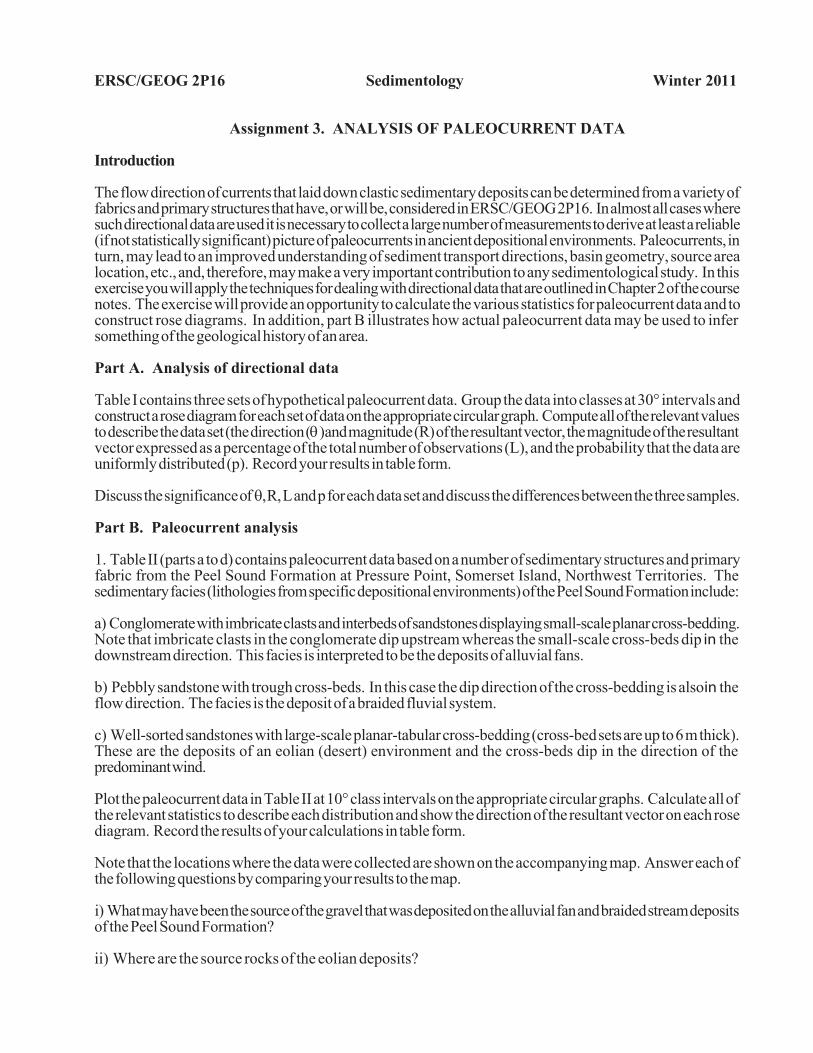
Assignment 3. ANALYSIS OF PALEOCURRENT DATA
Introduction
The flow direction of currents that laid down clastic sedimentary deposits can be determined from a variety offabrics and primary structures that have, or will be, considered in ERSC/GEOG 2P16. In almost all cases wheresuch directional data are used it is necessary to collect a large number of measurements to derive at least a reliable(if not statistically significant) picture of paleocurrents in ancient depositional environments. Paleocurrents, inturn, may lead to an improved understanding of sediment transport directions, basin geometry, source arealocation, etc., and, therefore, may make a very important contribution to any sedimentological study. In thisexercise you will apply the techniques for dealing with directional data that are outlined in Chapter 2 of the coursenotes. The exercise will provide an opportunity to calculate the various statistics for paleocurrent data and toconstruct rose diagrams. In addition, part B illustrates how actual paleocurrent data may be used to infersomething of the geological history of an area.
Part A. Analysis of directional data
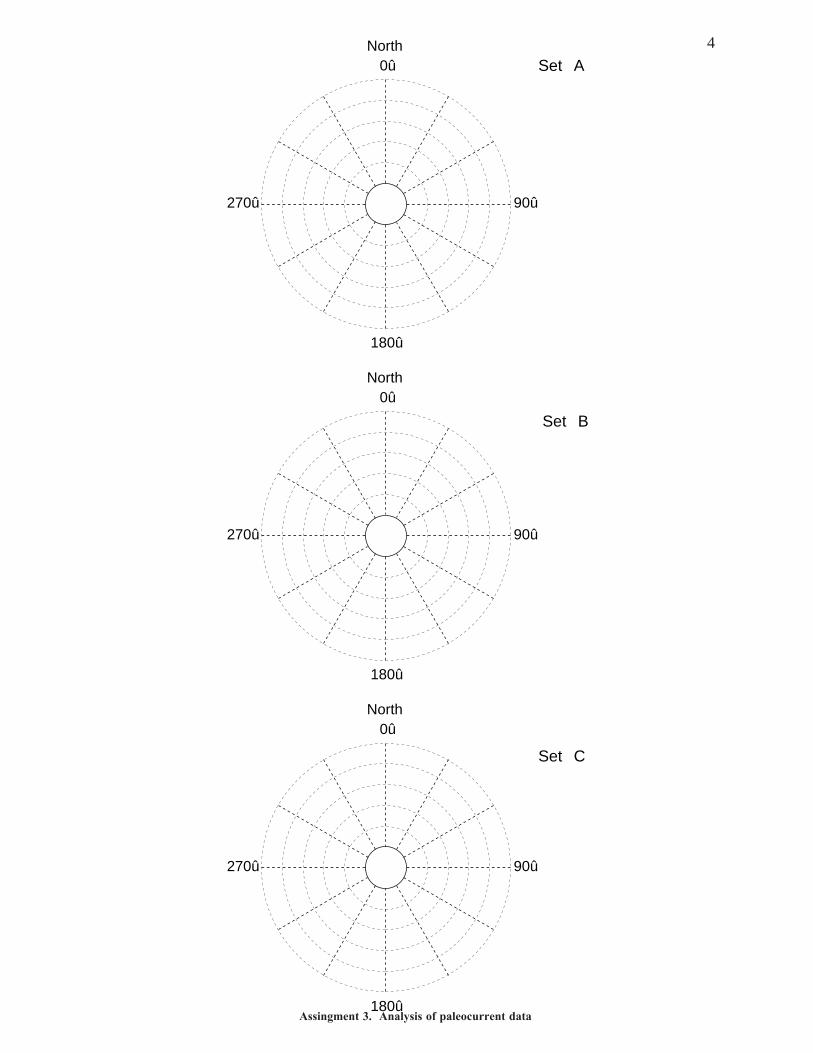
Table I contains three sets of hypothetical paleocurrent data. Group the data into classes at 30° intervals andconstruct a rose diagram for each set of data on the appropriate circular graph. Compute all of the relevant valuesto describe the data set (the direction (θ) and magnitude (R) of the resultant vector, the magnitude of the resultantvector expressed as a percentage of the total number of observations (L), and the probability that the data areuniformly distributed (p). Record your results in table form.
Discuss the significance of θ, R, L and p for each data set and discuss the differences between the three samples.
Part B. Paleocurrent analysis
1. Table II (parts a to d) contains paleocurrent data based on a number of sedimentary structures and primaryfabric from the Peel Sound Formation at Pressure Point, Somerset Island, Northwest Territories. Thesedimentary facies (lithologies from specific depositional environments) of the Peel Sound Formation include:
a) Conglomerate with imbricate clasts and interbeds of sandstones displaying small-scale planar cross-bedding.Note that imbricate clasts in the conglomerate dip upstream whereas the small-scale cross-beds dip in thedownstream direction. This facies is interpreted to be the deposits of alluvial fans.
b) Pebbly sandstone with trough cross-beds. In this case the dip direction of the cross-bedding is also in theflow direction. The facies is the deposit of a braided fluvial system.
c) Well-sorted sandstones with large-scale planar-tabular cross-bedding (cross-bed sets are up to 6 m thick).These are the deposits of an eolian (desert) environment and the cross-beds dip in the direction of thepredominant wind.
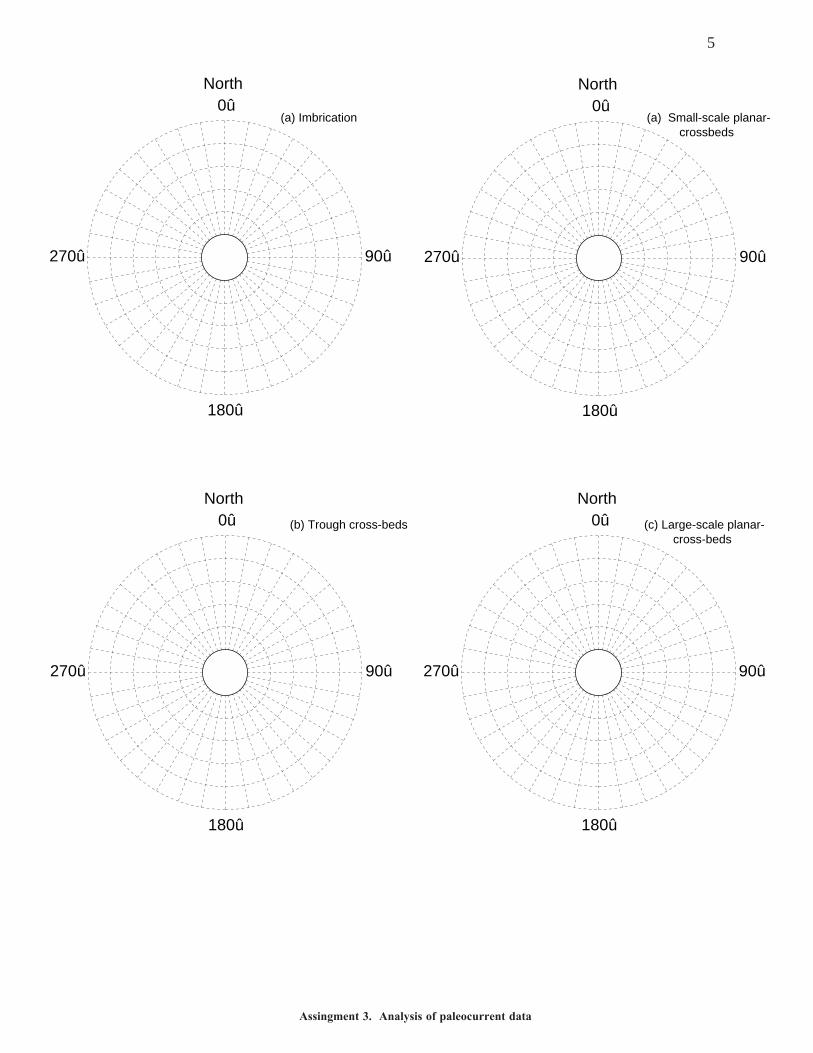
Plot the paleocurrent data in Table II at 10° class intervals on the appropriate circular graphs. Calculate all ofthe relevant statistics to describe each distribution and show the direction of the resultant vector on each rosediagram. Record the results of your calculations in table form.
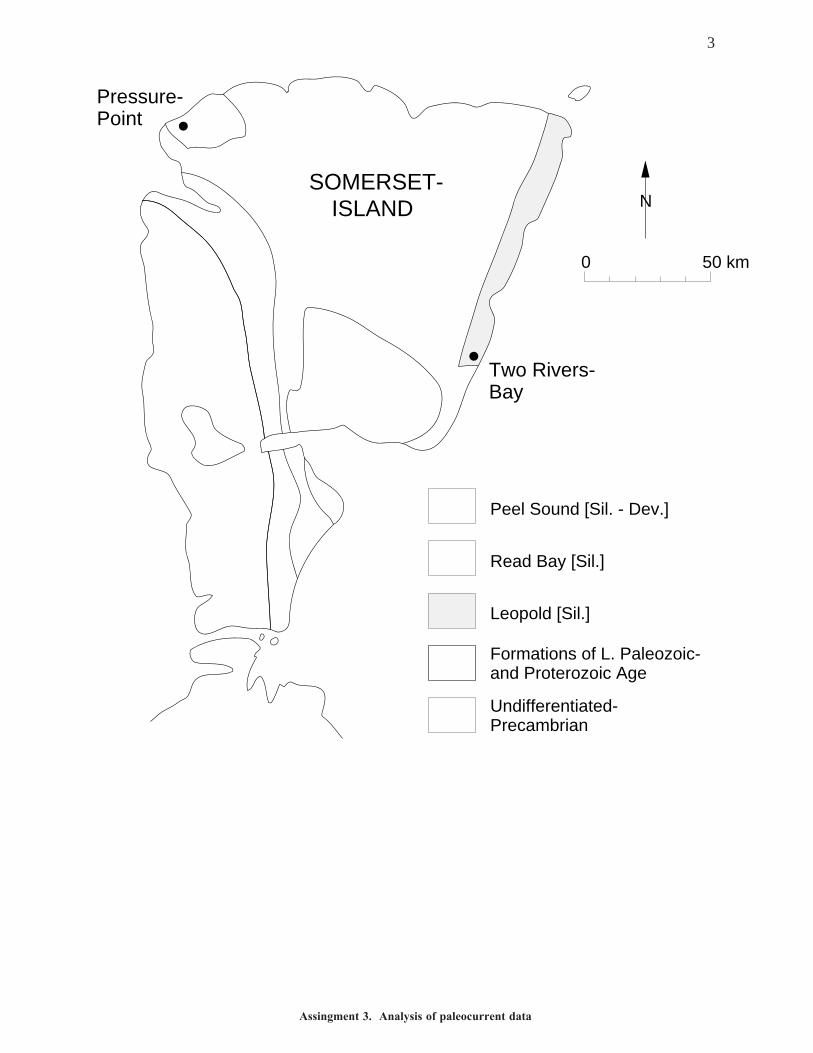
Note that the locations where the data were collected are shown on the accompanying map. Answer each ofthe following questions by comparing your results to the map.
i) What may have been the source of the gravel that was deposited on the alluvial fan and braided stream depositsof the Peel Sound Formation?
ii) Where are the source rocks of the eolian deposits?
2
Assingment 3. Analysis of paleocurrent data
iii) Which of the paleocurrent indicators will be most reliable in determining the physiography of the region inwhich these terrestrial sediments were deposited?
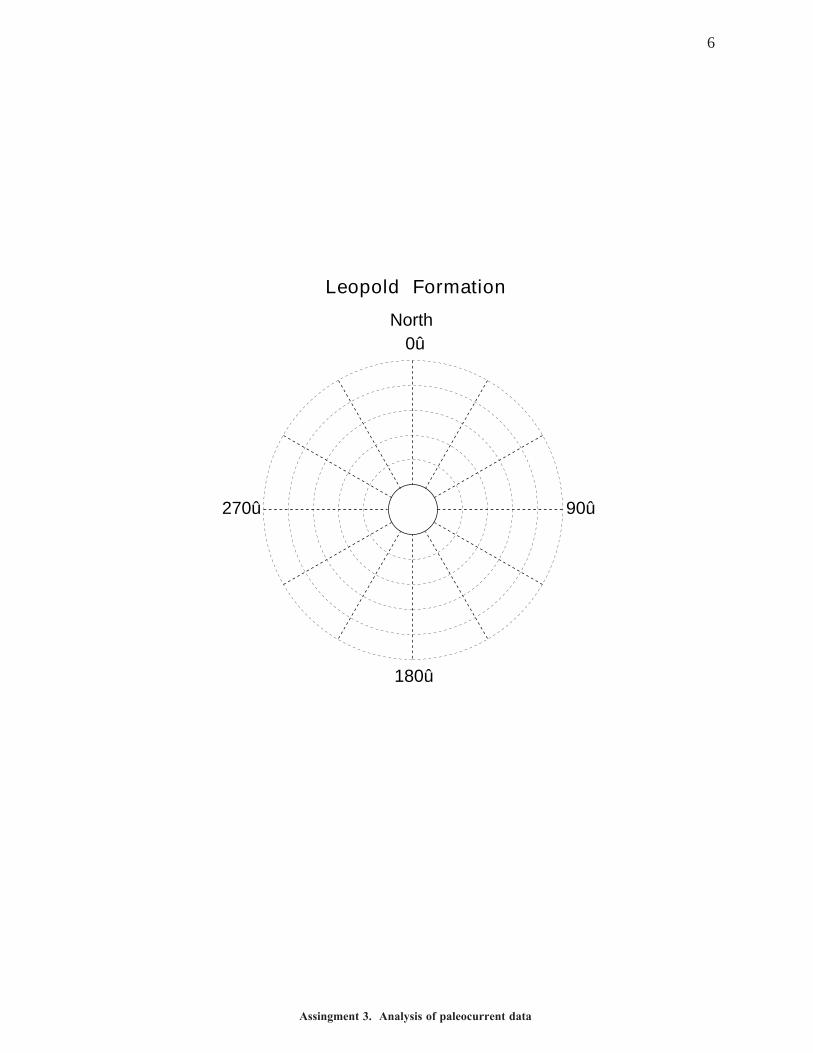
2. The Leopold Formation at Two Rivers Bay, Somerset Island, consists of intertidal sandstones and dolomiticsiltstones. In its depositional environment the sediments were deposited in response to reversing tidal currents.Plot the paleocurrent data (Table III) at 30° intervals.
Explain the form of the rose diagram. What can you deduce about the sediment source?
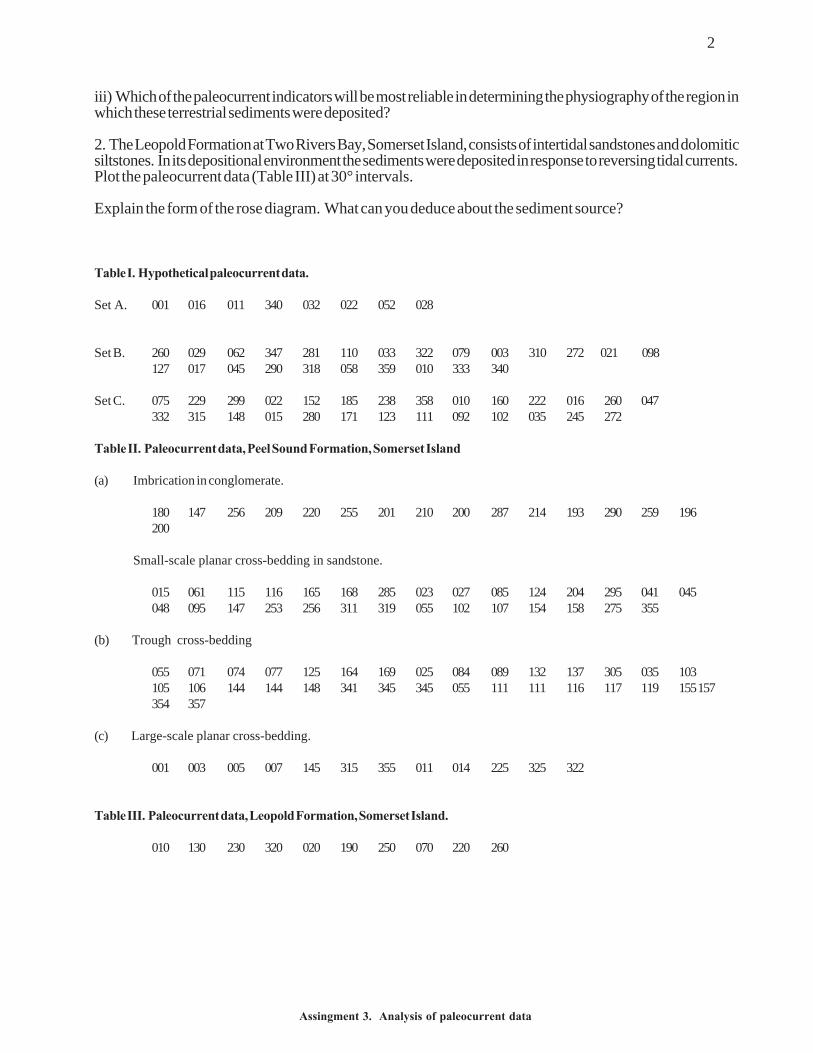
Table I. Hypothetical paleocurrent data.
Set A. 001 016 011 340 032 022 052 028
Set B. 260 029 062 347 281 110 033 322 079 003 310 272 021 098127 017 045 290 318 058 359 010 333 340
Set C. 075 229 299 022 152 185 238 358 010 160 222 016 260 047332 315 148 015 280 171 123 111 092 102 035 245 272
Table II. Paleocurrent data, Peel Sound Formation, Somerset Island
(a) Imbrication in conglomerate.
180 147 256 209 220 255 201 210 200 287 214 193 290 259 196200
Small-scale planar cross-bedding in sandstone.
015 061 115 116 165 168 285 023 027 085 124 204 295 041 045048 095 147 253 256 311 319 055 102 107 154 158 275 355
(b) Trough cross-bedding
055 071 074 077 125 164 169 025 084 089 132 137 305 035 103105 106 144 144 148 341 345 345 055 111 111 116 117 119 155157354 357
(c) Large-scale planar cross-bedding.
001 003 005 007 145 315 355 011 014 225 325 322
Table III. Paleocurrent data, Leopold Formation, Somerset Island.
010 130 230 320 020 190 250 070 220 260
3
Assingment 3. Analysis of paleocurrent data
P eel S ound [S il. - Dev.]
R ead B ay [S il.]
Leopold [S il.]
F ormations of L. P aleozoic-and P roterozoic Age
Undifferentiated-P recambrian
50 km0
NS OME R S E T -
IS LAND
T wo R ivers-B ay
P ressure-P oint
4
Assingment 3. Analysis of paleocurrent data
0û
180û
90û270û
North
0û
180û
90û270û
North
0û
180û
90û270û
North
S et A
S et B
S et C
5
Assingment 3. Analysis of paleocurrent data
0û
180û
90û270û
North
(a) Imbrication (a) S mall-scale planar-crossbeds
(b) T rough cross-beds (c) Large-scale planar-cross-beds
0û
180û
90û270û
North
0û
180û
90û270û
North0û
180û
90û270û
North
6
Assingment 3. Analysis of paleocurrent data
0û
180û
90û270û
North
L eopold F ormation


![]I moÙmagR Ýkaxkna H ikr`o Prakashak Kirano 2.pdf · Version 001: remember to check for updates Please inform us of any errors on Rajesh@AtmaDharma.com Ýt: 1000 vIr sHvt 2p16](https://img.pdfslide.net/doc/110x75/5f6348b214b7e656a6145768/i-momagr-kaxkna-h-ikro-prakashak-kirano-2pdf-version-001-remember-to-check.jpg)