Embed Size (px)
Citation preview
Trade Facilitation and
Paperless Trade
Implementation in
Asia and the Pacific
Regional Report 2017
The Economic and Social Commission for Asia and the Pacific (ESCAP) serves as the United
Nations’ regional hub promoting cooperation among countries to achieve inclusive and
sustainable development. The largest regional intergovernmental platform with 53-member
States and 9 associate members, ESCAP has emerged as a strong regional think-tank offering
countries sound analytical products that shed light on the evolving economic, social and
environmental dynamics of the region. The Commission’s strategic focus is to deliver on the
2030 Agenda for Sustainable Development, which it does by reinforcing and deepening
regional cooperation and integration to advance connectivity, financial cooperation and market
integration. ESCAP’s research and analysis coupled with its policy advisory services, capacity
building and technical assistance to governments aims to support countries’ sustainable and
inclusive development ambitions.
Copyright © ESCAP 2017 All rights reserved
The report is available at: https://unnext.unescap.org/content/global-survey-trade-facilitation-
and-paperless-trade-implementation-2017.
Disclaimers:
The designation employed and the presentation of the material in the Report do not imply the
expression of any opinion whatsoever on the part of the Secretariat of the United Nations
concerning the legal status of any country, territory, city or area or of its authorities, or
concerning the delimitation of its frontiers or boundaries. The United Nations bears no
responsibility for the availability or functioning of URLs.
Opinions, figures and estimates set forth in this publication are the responsibility of the authors,
and should not necessarily be considered as reflecting the views or carrying the endorsement
of the United Nations. Any errors are the responsibility of the authors. Mention of firm names
and commercial products does not imply the endorsement of the United Nations.
The report has been issued without formal editing.
i
Preface
This report analyses the results of the second United Nations Global Survey on Trade Facilitation and Paperless Trade Implementation. The Survey was jointly conducted in 2017 by the United Nations Regional Commissions, namely the Economic Commission for Latin America and the Caribbean (ECLAC), the Economic and Social Commission for Western Asia (ESCWA), the Economic Commission for Africa (ECA), and the Economic and Social Commission for Europe (UNECE), and led by Economic and Social Commission for Asia and the Pacific (ESCAP). The aim of the Survey is to gather information from countries worldwide on implementation of trade facilitation and paperless trade measures. The results of the survey will enable countries and development partners to better understand and monitor progress on trade facilitation, support evidence-based public policies, share best practices and identify capacity building and technical assistance needs.
The second global survey builds upon the first one conducted in 2015, which served as a key initiative
under the Joint UNRC Approach to Trade Facilitation by all five United Nations Regional Commissions
in 2010. The Approach was designed to present a joint and global view on trade facilitation issues in
the context of the negotiations of the Doha Round at the World Trade Organization (WTO). The survey
represents collective efforts of many partners such as the Organization for Economic Cooperation and
Development (OECD), the United Nations Conference on Trade and Development (UNCTAD), the
International Trade Centre (ITC), Asian Development Bank (ADB), Association of Southeast Asian
Nations (ASEAN), Oceania Customs Organization Secretariat (OCO) and Eurasian Economic
Commission (EEC).
In the context of 2030 Agenda for Sustainable Development which recognizes international trade -
along with science, technology and innovation - as one of the key means of implementing sustainable
development goals, the current report provides a useful stock-take for the countries in the region to
further streamline trade procedures and advance trade facilitation.
The regional report should be read together with global report, subregional and country notes. The
underlying dataset can be used by researchers and analysts for any further analysis. Further
information is available at https://unnext.unescap.org/content/global-survey-trade-facilitation-and-
paperless-trade-implementation-2017.

ii
Executive Summary
Reducing trade costs is essential for developing economies to participate in international production
networks and effectively use trade as an engine of growth and sustainable development. This can be
accomplished by tackling non-tariff sources of trade costs and addressing cumbersome regulatory
procedures and documentation requirements. Indeed, trade facilitation including paperless trade has
taken increasing importance as evidenced by the entry into force of the WTO Trade Facilitation
Agreement (TFA), as well as the growing number of regional and subregional initiatives for facilitating
the electronic exchange of information along international supply chains1.
This report presents key results of the second global survey on trade facilitation and paperless trade
implementation, covering 44 countries in Asia and the Pacific. The survey questionnaire includes 47
trade facilitation measures under seven groups—(i) general trade facilitation measures; (ii) paperless
trade; (iii) cross-border paperless trade; (iv) transit facilitation; (v) trade facilitation for small and
medium-sized enterprises (SMEs); (vi) agricultural trade facilitation; and (vii) women and trade
facilitation.
Trade facilitation implementation rates vary widely across and within subregions. Apart from Australia
and New Zealand, average implementation is highest in East and Northeast Asia (73.7%), followed by
Southeast Asia (60.1%), North and Central Asia (51.8%), and South and Southwest Asia (46.5%). The
Pacific lags at 28.2%. The region’s implementation rates on the WTO TFA related measures are
relatively high, at 50–70%. However, paperless trade and, in particular, cross-border paperless trade
implementation remain limited. Average implementation rates for measures aimed at facilitating
trade for SMEs and facilitating women participation in trade are low, at 39% and 23% respectively.
Average implementation rates of general trade facilitation as well as paperless trade measures
increased by approximately 5.6 percentage points between 2015 and 2017, from 44.8% to 50.4%. The
largest progress is observed in Central Asia where the implementation rate rises by 10.2 percentage
points during that period. Substantial progress is also observed in South and South-West Asia and the
implementation rate improves by 7.1 percentage points. Implementation rates of other subregions
rise by 3 to 5 percentage points. Limited human resource capacity seems to be the key challenge for
Asia-Pacific Least Developed and Landlocked Developing Countries (LDCs and LLDCs) in making further
progress, while Lack of coordination between Government agencies seems to be the most important
challenge in other developing countries.
Going forward, digitalization offers immense potential to enhance trade facilitation implementation
and further reduce trade costs in Asia and the Pacific. The Framework Agreement on Facilitation of
Cross-Border Paperless Trade in Asia and the Pacific, which complements the WTO TFA by facilitating
paperless trade, provides a unique opportunity for participating countries to accelerate electronic
exchange of trade-related data and documents across borders and to overcome challenges on cross-
border paperless trade.
1 For example, the Framework Agreement on Facilitation of Cross-border Paperless Trade in Asia and the Pacific was signed by Bangladesh, Cambodia, China, Armenia, and Iran (Islamic Republic of) as of 30 September 2017, and the ratification process has been started on 1 October 2017 in these members.
iii
Acknowledgements
The second global survey was jointly conducted by five United Nations Regional Commissions for
Africa (ECA), Europe (ECE), Asia and the Pacific (ESCAP), Latin America and the Caribbean (ECLAC) and
Western Asia (ESCWA). The initiative was led and coordinated by ESCAP.
The regional report is part of this global survey effort. It was prepared by Tengfei Wang, Yann Duval,
Chorthip Utoktham and Yuhua ZHANG, from Trade, Investment and Innovation Division, ESCAP.
Critical review by Mohammad Farhad from Bangladesh Foreign Trade Institute and contribution from
Ying Liu and Luca Stanus-Ghib during their internship at ESCAP are gratefully acknowledged.
Support from the following organizations and individuals is gratefully acknowledged: Bismark Sitorus
from UNCTAD, Mohammad Saeed from ITC; Evdokia Moise from OECD, Laisiana Tugaga from Oceania
Customs Organization Secretariat (OCO), Dinara Sekerbaeva and Aleksei Bondarenko from Eurasian
Economic Commission (EEC).
The United Nations Network of Experts for Paperless Trade and Transport in Asia and the Pacific
(UNNExT),2 a knowledge community supported by ESCAP and ECE, greatly facilitated data collection.
Comments and suggestions received from participants to the United Nations Regional Commission
(UNRC) side event to the 6th Global Review on Aid for Trade (Geneva, 12 July 2017),3 where the
preliminary findings from the global survey were presented, are gratefully acknowledged.
2 http://unnext.unescap.org 3 https://www.wto.org/english/tratop_e/devel_e/a4t_e/aid4trade_e.htm

iv
Contents
Preface ..................................................................................................................................................... i
Executive Summary ................................................................................................................................. ii
Acknowledgements ................................................................................................................................ iii
1. Introduction .................................................................................................................................... 1
1.1 Background and objective of the Global Survey on Trade Facilitation and Paperless Trade
Implementation 2017 ......................................................................................................................... 1
1.2 Survey instrument and methodology ........................................................................................... 2
2. Trade facilitation implementation in Asia-Pacific: Overview .......................................................... 5
2.1 Implementation in sub-regions and countries with special needs ............................................... 6
2.2 Most and least implemented trade facilitation measures............................................................ 7
2.3 Progress in implementation between 2015 and 2017................................................................ 10
3. Implementation of trade facilitation measures: a closer look ...................................................... 12
3.1 “Transparency” measures ........................................................................................................... 12
3.2 “Formalities” measures ............................................................................................................... 13
3.3 “Institutional arrangement and cooperation” measures ........................................................... 14
3.4 “Paperless trade” measures........................................................................................................ 16
3.5 “Cross-border paperless trade” measures .................................................................................. 17
3.6 “Transit facilitation” measures ................................................................................................... 19
3.7 Progress and challenges in the implementation ........................................................................ 20
4. Conclusions and way forward ....................................................................................................... 23
Annex 1: Definition of the different stages of implementation ........................................................... 26
Annex 2: Grouping of the countries surveyed ...................................................................................... 27
Annex 3: Explanatory notes .................................................................................................................. 28

v
List of Tables
Table 1: Intra- and extra-regional comprehensive trade costs in the Asia-Pacific region ...................... 1
Table 2: Grouping of trade facilitation measures included in the questionnaire ................................... 3
Table 3: Most and least implemented measures in Asia-Pacific, 2017 .................................................. 9
List of Figures
Figure 1: Overall implementation of trade facilitation measures in 44 Asia-Pacific countries, 2017 .... 5
Figure 2: Trade facilitation implementation and GDP per capita of 44 Asia-Pacific economies ............ 6
Figure 3: Trade facilitation implementation in Asia-Pacific sub-regions and countries with special
needs, 2017 ............................................................................................................................................. 7
Figure 4: Implementation of different groups of trade facilitation measures: Asia-Pacific average, 2017
................................................................................................................................................................ 8
Figure 5: Trade facilitation implementation by subregions in Asia and the Pacific, 2015 and 2017 .... 10
Figure 6: Implementation of different groups of trade facilitation measures in Asia-Pacific, 2015 and
2017 ...................................................................................................................................................... 10
Figure 7: Implementation of trade facilitation measures by Asia-Pacific subregions, 2015 and 2017 11
Figure 8: Implementation of “transparency” measures: Asia-Pacific average, 2017 .......................... 12
Figure 9: State of implementation of “transparency” measures for trade facilitation in Asia-Pacific
economies, 2017 ................................................................................................................................... 13
Figure 10: Implementation of trade “formalities” facilitation measures: Asia-Pacific average, 2017 13
Figure 11: State of implementation of trade “formalities” facilitation measures in Asia-Pacific
economies, 2017 ................................................................................................................................... 14
Figure 12: Implementation of “institutional arrangement and cooperation” measures: Asia-Pacific
average, 2017 ........................................................................................................................................ 15
Figure 13: State of implementation of “institutional arrangement and cooperation” measures for trade
facilitation in Asia-Pacific economies, 2017 .......................................................................................... 15
Figure 14: Implementation of “paperless trade” measures: Asia-Pacific average, 2017 .................... 16
Figure 15: State of implementation of “paperless trade” measures in Asia-Pacific economies, 2017 17
Figure 16: Implementation of “cross-border paperless trade” measures: Asia-Pacific average, 2017
.............................................................................................................................................................. 18
Figure 17: State of implementation of “cross-border paperless trade” measures in Asia-Pacific
economies, 2017 ................................................................................................................................... 18
Figure 18: Implementation of “transit facilitation” measures: Asia-Pacific average, 2017 ................. 19
Figure 19: State of implementation of “transit facilitation” measures in Asia-Pacific economies, 2017
.............................................................................................................................................................. 20
Figure 20: Trade facilitation measures on which most progress was made in Asia-Pacific economies
since 2016 ............................................................................................................................................. 21
Figure 21: Challenges faced by Asia-Pacific LDCs, LLDCs, SIDSs and other developing countries in
implementing trade facilitation measures ............................................................................................ 22
Figure 22: Trade facilitation implementation and Trade Costs of Asia-Pacific economies ................. 23
Figure 23: Moving up the trade facilitation ladder towards seamless international supply chains ..... 25
vi
Abbreviations
ADB Asian Development Bank
AEO Authorized economic operator
ASEAN Association of Southeast Asian Nations
ECA United Nations Economic Commission for Africa
ECE United Nations Economic Commission for Europe
ECLAC United Nations Economic Commission for Latin America and the Caribbean
ENEA East and North-East Asia
ESCAP United Nations Economic and Social Commission for Asia and the Pacific
ESCWA United Nations Economic and Social Commission for Western Asia
ICT Information and communications technology
ITC International Trade Centre
LDC Least developed country
LLDC Landlocked developing country
NCA North and Central Asia
NTFC National trade facilitation committee
OCO Oceania Customs Organization
OECD Organization for Economic Co-operation and Development
PIDE Pacific Island Developing Economies
SAARC South Asian Association for Regional Cooperation
SDGs
SEA
Sustainable Development Goals
South-East Asia
SELA Latin American and Caribbean Economic System
SIDS Small island developing states
SSWA South and South-West Asia
TFA Trade Facilitation Agreement
UN/CEFACT United Nations Centre for Trade Facilitation and Electronic Business
UNCTAD United Nations Conference on Trade and Development
UNNExT United Nations Network of Experts for Paperless Trade and Transport for Asia and the Pacific
UNRC United Nations Regional Commission
USA United States of America
WTO World Trade Organization

1
1. Introduction
1.1 Background and objective of the Global Survey on Trade Facilitation and Paperless Trade
Implementation 2017
It is well understood that reducing trade costs is essential in enabling economies to effectively
participate in regional and global value chains and continue to use trade as a main engine of growth
and sustainable development. According to the latest data from the ESCAP-World Bank International
Trade Cost Database, the overall cost of trading goods among the three largest European Union (EU)
economies is equivalent to a 42% average tariff on the value of goods traded (see Table 1). China, the
Republic of Korea and Japan (East Asia-3) come closest to matching the low intra-EU trade costs, with
average trade costs among themselves amounting for a 51% tariff-equivalent, followed by the middle-
income members of the Association of Southeast Asian Nations (ASEAN), whose intra-regional trade
costs stand at 76% tariff-equivalent.
Table 1: Intra- and extra-regional comprehensive trade costs in the Asia-Pacific region (excluding tariff costs), 2010-2015
Region ASEAN-4 East Asia-
3
North and Central Asia - 4
Pacific Islands Developing Economies
SAARC-4 AUS-NZL EU-3
ASEAN-4 76% (6.7%)
East Asia-3 76% 51% (4.1%) (-2.9%)
North and 343% 167% 116% Central Asia - 4 (5.4%) (-9.9%) (-0.9%)
Pacific Islands 172% 173% 370% 130% Developing Economies (-9.0%) (-3.1%) (21.6%) (-8.8%)
SAARC-4 130% 123% 302% 300% 119% (3.5%) (-2.1%) (7.7%) (-4.6%) (12.9%)
AUS-NZL 101% 87% 341% 82% 136% 51% (2.9%) (-5.4%) (-4.9%) (-8.9%) (-6.7%) (-4.9%)
EU-3 105% 84% 150% 204% 113% 108% 42% (-3.4%) (-3.4%) (-7.1%) (-7.1%) (0.3%) (-2.3%) (-8.1%)
USA 86% 63% 174% 161% 112% 100% 67% (8.0%) (0.4%) (-3.5%) (-5.4%) (6.7%) (2.9%) (0.4%)
Source: ESCAP-World Bank Trade Cost Database (June 2017 update). Available at: http://databank.worldbank.org/data/views/variableselection/selectvariables.aspx?source=escap-world-bank-international-trade-costs and http://www.unescap.org/tid/artnet/trade-costs.asp. Notes: Trade costs may be interpreted as tariff equivalents. Percentage changes in trade costs between 2004-2009 and 2010-2015 are in parentheses. ASEAN-4: Indonesia, Malaysia, Philippines, Thailand; East Asia-3: China, Japan, Republic of Korea; North and Central Asia-4: Georgia, Kazakhstan, Kyrgyzstan, Russian Federation; Pacific islands developing economies: Fiji, Papua New Guinea; SAARC-4: Bangladesh, India, Pakistan, Sri Lanka; AUS-NZL: Australia, New-Zealand; EU-3: Germany, France, United Kingdom; USA: the United States of America.
Other groups of Asia-Pacific economies face much higher costs of trading among each other,
particularly in Central Asia, South Asia, and the South Pacific. The scope for further reducing trade
costs among Asia-Pacific developing economies is best understood when looking at inter-regional
trade costs. For example, the trade costs between Southeast (ASEAN-4) and South (SAARC-4) Asian
economies (130%), two neighboring Asian sub-regions, are much higher than those between ASEAN
and the EU (105%) or between SAARC and the United States of America (112%).
2
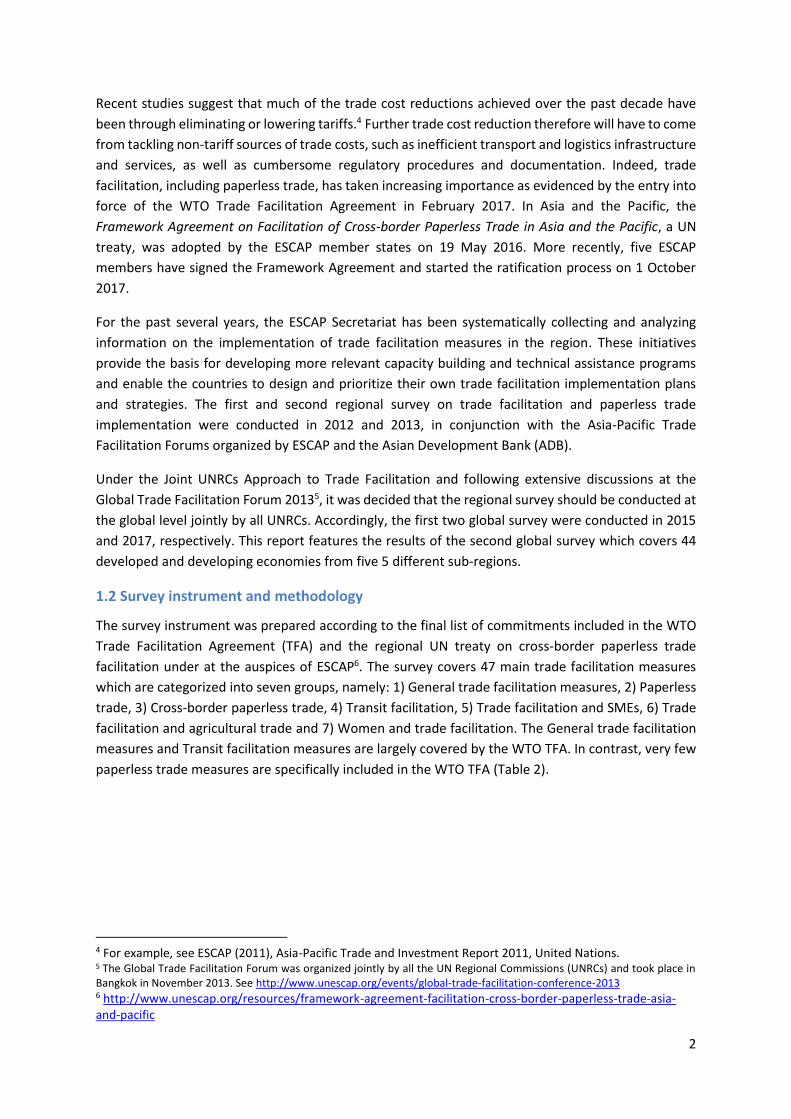
Recent studies suggest that much of the trade cost reductions achieved over the past decade have
been through eliminating or lowering tariffs.4 Further trade cost reduction therefore will have to come
from tackling non-tariff sources of trade costs, such as inefficient transport and logistics infrastructure
and services, as well as cumbersome regulatory procedures and documentation. Indeed, trade
facilitation, including paperless trade, has taken increasing importance as evidenced by the entry into
force of the WTO Trade Facilitation Agreement in February 2017. In Asia and the Pacific, the
Framework Agreement on Facilitation of Cross-border Paperless Trade in Asia and the Pacific, a UN
treaty, was adopted by the ESCAP member states on 19 May 2016. More recently, five ESCAP
members have signed the Framework Agreement and started the ratification process on 1 October
2017.
For the past several years, the ESCAP Secretariat has been systematically collecting and analyzing
information on the implementation of trade facilitation measures in the region. These initiatives
provide the basis for developing more relevant capacity building and technical assistance programs
and enable the countries to design and prioritize their own trade facilitation implementation plans
and strategies. The first and second regional survey on trade facilitation and paperless trade
implementation were conducted in 2012 and 2013, in conjunction with the Asia-Pacific Trade
Facilitation Forums organized by ESCAP and the Asian Development Bank (ADB).
Under the Joint UNRCs Approach to Trade Facilitation and following extensive discussions at the
Global Trade Facilitation Forum 20135, it was decided that the regional survey should be conducted at
the global level jointly by all UNRCs. Accordingly, the first two global survey were conducted in 2015
and 2017, respectively. This report features the results of the second global survey which covers 44
developed and developing economies from five 5 different sub-regions.
1.2 Survey instrument and methodology
The survey instrument was prepared according to the final list of commitments included in the WTO
Trade Facilitation Agreement (TFA) and the regional UN treaty on cross-border paperless trade
facilitation under at the auspices of ESCAP6. The survey covers 47 main trade facilitation measures
which are categorized into seven groups, namely: 1) General trade facilitation measures, 2) Paperless
trade, 3) Cross-border paperless trade, 4) Transit facilitation, 5) Trade facilitation and SMEs, 6) Trade
facilitation and agricultural trade and 7) Women and trade facilitation. The General trade facilitation
measures and Transit facilitation measures are largely covered by the WTO TFA. In contrast, very few
paperless trade measures are specifically included in the WTO TFA (Table 2).
4 For example, see ESCAP (2011), Asia-Pacific Trade and Investment Report 2011, United Nations. 5 The Global Trade Facilitation Forum was organized jointly by all the UN Regional Commissions (UNRCs) and took place in Bangkok in November 2013. See http://www.unescap.org/events/global-trade-facilitation-conference-2013 6 http://www.unescap.org/resources/framework-agreement-facilitation-cross-border-paperless-trade-asia-and-pacific
3
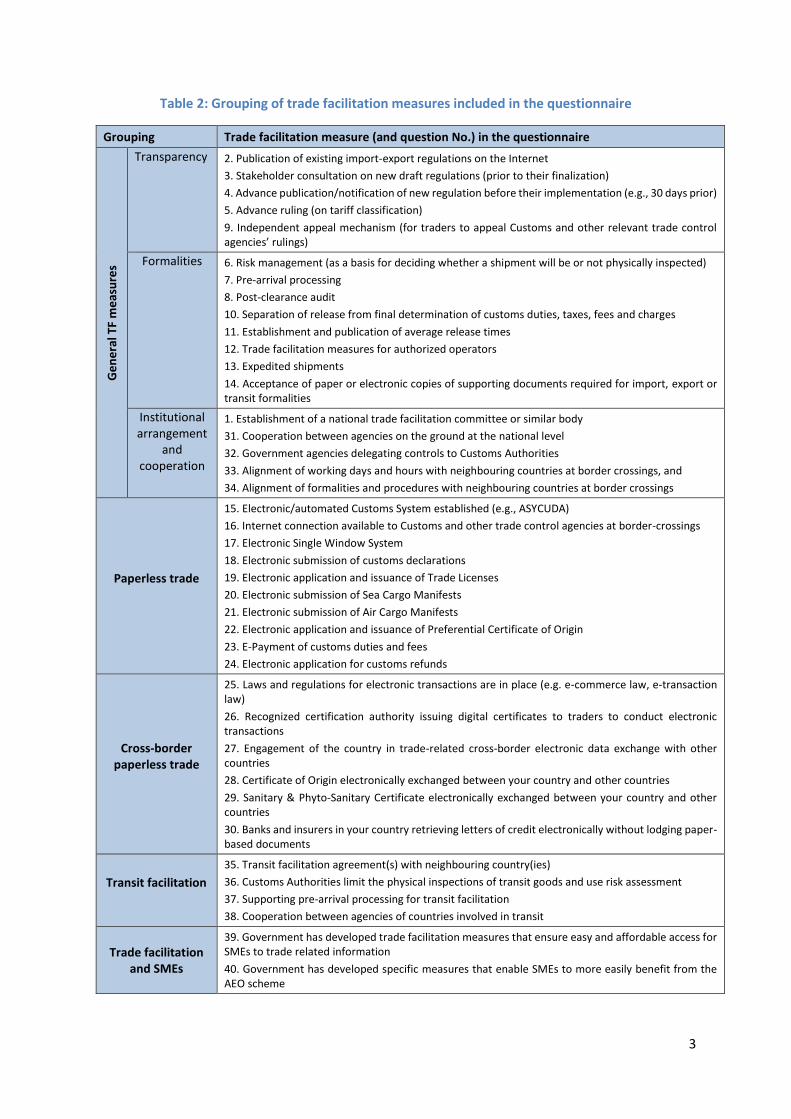
Table 2: Grouping of trade facilitation measures included in the questionnaire
Grouping Trade facilitation measure (and question No.) in the questionnaire
Ge
ne
ral T
F m
eas
ure
s
Transparency
2. Publication of existing import-export regulations on the Internet
3. Stakeholder consultation on new draft regulations (prior to their finalization)
4. Advance publication/notification of new regulation before their implementation (e.g., 30 days prior)
5. Advance ruling (on tariff classification)
9. Independent appeal mechanism (for traders to appeal Customs and other relevant trade control agencies’ rulings)
Formalities
6. Risk management (as a basis for deciding whether a shipment will be or not physically inspected)
7. Pre-arrival processing
8. Post-clearance audit
10. Separation of release from final determination of customs duties, taxes, fees and charges
11. Establishment and publication of average release times
12. Trade facilitation measures for authorized operators
13. Expedited shipments
14. Acceptance of paper or electronic copies of supporting documents required for import, export or transit formalities
Institutional arrangement
and cooperation
1. Establishment of a national trade facilitation committee or similar body
31. Cooperation between agencies on the ground at the national level
32. Government agencies delegating controls to Customs Authorities
33. Alignment of working days and hours with neighbouring countries at border crossings, and
34. Alignment of formalities and procedures with neighbouring countries at border crossings
Paperless trade
15. Electronic/automated Customs System established (e.g., ASYCUDA)
16. Internet connection available to Customs and other trade control agencies at border-crossings
17. Electronic Single Window System
18. Electronic submission of customs declarations
19. Electronic application and issuance of Trade Licenses
20. Electronic submission of Sea Cargo Manifests
21. Electronic submission of Air Cargo Manifests
22. Electronic application and issuance of Preferential Certificate of Origin
23. E-Payment of customs duties and fees
24. Electronic application for customs refunds
Cross-border paperless trade
25. Laws and regulations for electronic transactions are in place (e.g. e-commerce law, e-transaction law)
26. Recognized certification authority issuing digital certificates to traders to conduct electronic transactions
27. Engagement of the country in trade-related cross-border electronic data exchange with other countries
28. Certificate of Origin electronically exchanged between your country and other countries
29. Sanitary & Phyto-Sanitary Certificate electronically exchanged between your country and other countries
30. Banks and insurers in your country retrieving letters of credit electronically without lodging paper-based documents
Transit facilitation
35. Transit facilitation agreement(s) with neighbouring country(ies)
36. Customs Authorities limit the physical inspections of transit goods and use risk assessment
37. Supporting pre-arrival processing for transit facilitation
38. Cooperation between agencies of countries involved in transit
Trade facilitation and SMEs
39. Government has developed trade facilitation measures that ensure easy and affordable access for SMEs to trade related information
40. Government has developed specific measures that enable SMEs to more easily benefit from the AEO scheme
4
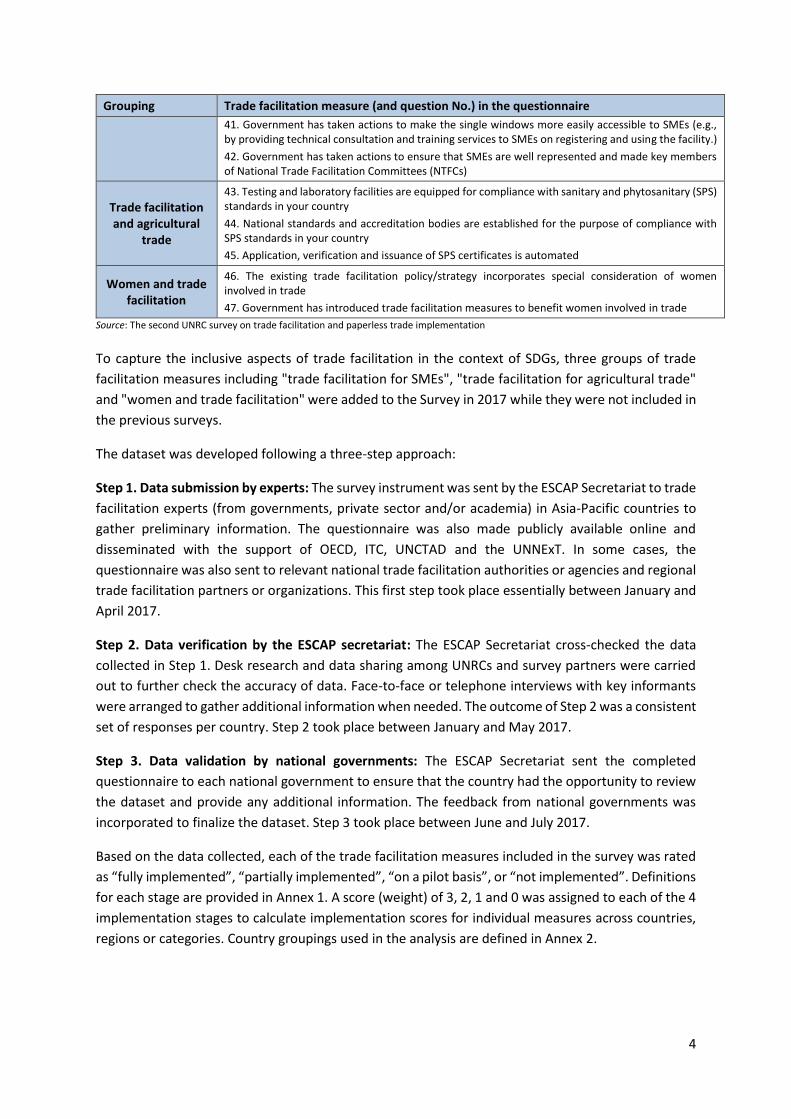
Grouping Trade facilitation measure (and question No.) in the questionnaire
41. Government has taken actions to make the single windows more easily accessible to SMEs (e.g., by providing technical consultation and training services to SMEs on registering and using the facility.)
42. Government has taken actions to ensure that SMEs are well represented and made key members of National Trade Facilitation Committees (NTFCs)
Trade facilitation and agricultural
trade
43. Testing and laboratory facilities are equipped for compliance with sanitary and phytosanitary (SPS) standards in your country
44. National standards and accreditation bodies are established for the purpose of compliance with SPS standards in your country
45. Application, verification and issuance of SPS certificates is automated
Women and trade facilitation
46. The existing trade facilitation policy/strategy incorporates special consideration of women involved in trade
47. Government has introduced trade facilitation measures to benefit women involved in trade
Source: The second UNRC survey on trade facilitation and paperless trade implementation
To capture the inclusive aspects of trade facilitation in the context of SDGs, three groups of trade
facilitation measures including "trade facilitation for SMEs", "trade facilitation for agricultural trade"
and "women and trade facilitation" were added to the Survey in 2017 while they were not included in
the previous surveys.
The dataset was developed following a three-step approach:
Step 1. Data submission by experts: The survey instrument was sent by the ESCAP Secretariat to trade
facilitation experts (from governments, private sector and/or academia) in Asia-Pacific countries to
gather preliminary information. The questionnaire was also made publicly available online and
disseminated with the support of OECD, ITC, UNCTAD and the UNNExT. In some cases, the
questionnaire was also sent to relevant national trade facilitation authorities or agencies and regional
trade facilitation partners or organizations. This first step took place essentially between January and
April 2017.
Step 2. Data verification by the ESCAP secretariat: The ESCAP Secretariat cross-checked the data
collected in Step 1. Desk research and data sharing among UNRCs and survey partners were carried
out to further check the accuracy of data. Face-to-face or telephone interviews with key informants
were arranged to gather additional information when needed. The outcome of Step 2 was a consistent
set of responses per country. Step 2 took place between January and May 2017.
Step 3. Data validation by national governments: The ESCAP Secretariat sent the completed
questionnaire to each national government to ensure that the country had the opportunity to review
the dataset and provide any additional information. The feedback from national governments was
incorporated to finalize the dataset. Step 3 took place between June and July 2017.
Based on the data collected, each of the trade facilitation measures included in the survey was rated
as “fully implemented”, “partially implemented”, “on a pilot basis”, or “not implemented”. Definitions
for each stage are provided in Annex 1. A score (weight) of 3, 2, 1 and 0 was assigned to each of the 4
implementation stages to calculate implementation scores for individual measures across countries,
regions or categories. Country groupings used in the analysis are defined in Annex 2.
5
2. Trade facilitation implementation in Asia-Pacific: overview
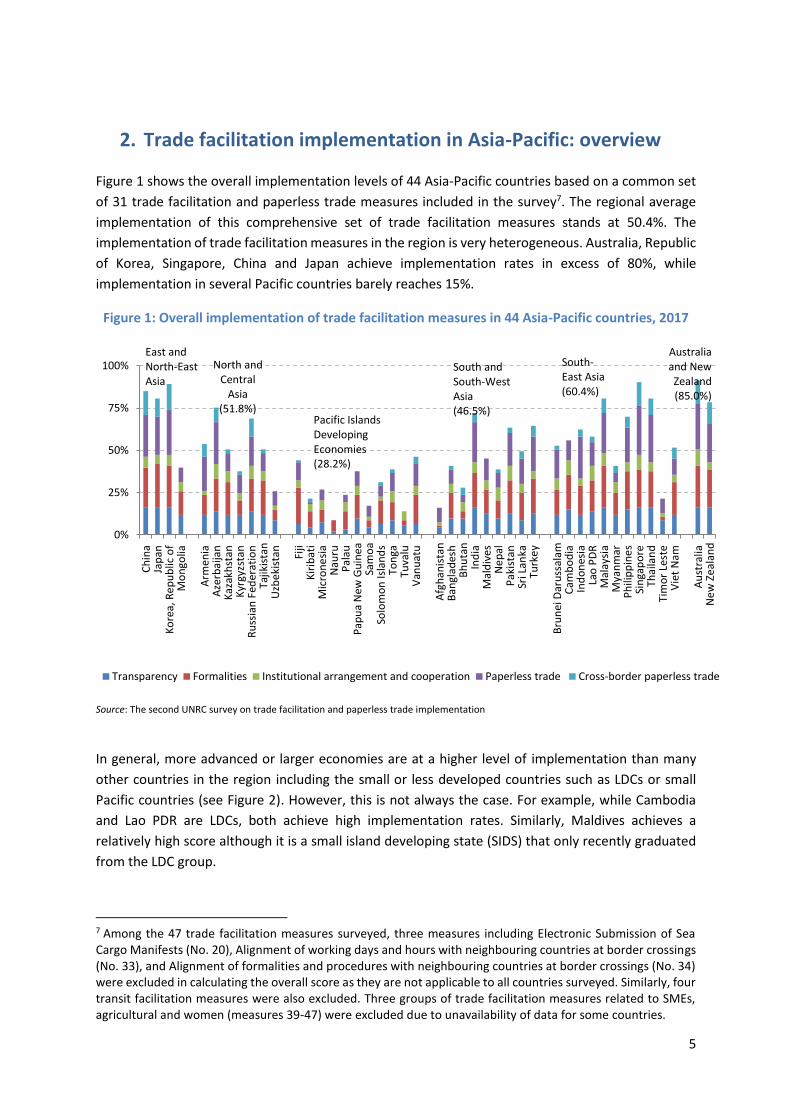
Figure 1 shows the overall implementation levels of 44 Asia-Pacific countries based on a common set
of 31 trade facilitation and paperless trade measures included in the survey7. The regional average
implementation of this comprehensive set of trade facilitation measures stands at 50.4%. The
implementation of trade facilitation measures in the region is very heterogeneous. Australia, Republic
of Korea, Singapore, China and Japan achieve implementation rates in excess of 80%, while
implementation in several Pacific countries barely reaches 15%.
Figure 1: Overall implementation of trade facilitation measures in 44 Asia-Pacific countries, 2017
Source: The second UNRC survey on trade facilitation and paperless trade implementation
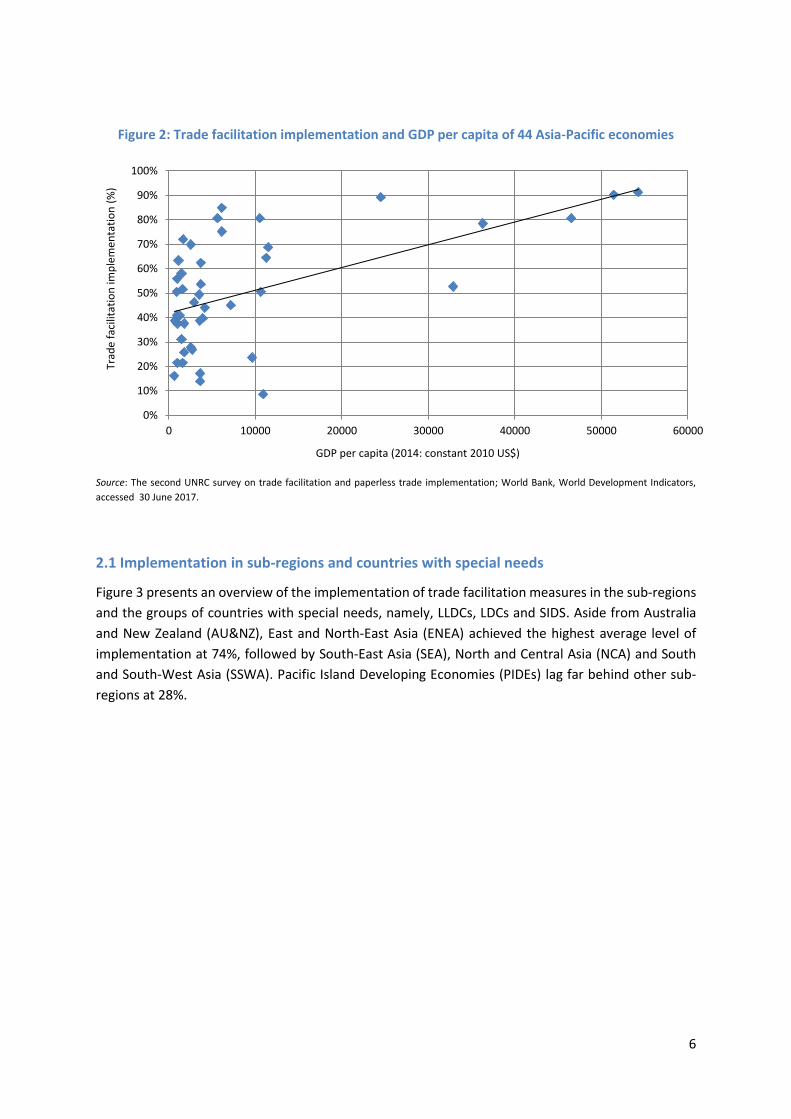
In general, more advanced or larger economies are at a higher level of implementation than many
other countries in the region including the small or less developed countries such as LDCs or small
Pacific countries (see Figure 2). However, this is not always the case. For example, while Cambodia
and Lao PDR are LDCs, both achieve high implementation rates. Similarly, Maldives achieves a
relatively high score although it is a small island developing state (SIDS) that only recently graduated
from the LDC group.
7 Among the 47 trade facilitation measures surveyed, three measures including Electronic Submission of Sea Cargo Manifests (No. 20), Alignment of working days and hours with neighbouring countries at border crossings (No. 33), and Alignment of formalities and procedures with neighbouring countries at border crossings (No. 34) were excluded in calculating the overall score as they are not applicable to all countries surveyed. Similarly, four transit facilitation measures were also excluded. Three groups of trade facilitation measures related to SMEs, agricultural and women (measures 39-47) were excluded due to unavailability of data for some countries.
0%
25%
50%
75%
100%
Ch
ina
Jap
anK
ore
a, R
ep
ub
lic o
fM
on
golia
Arm
enia
Aze
rbai
jan
Kaz
akh
stan
Kyr
gyzs
tan
Ru
ssia
n F
eder
atio
nTa
jikis
tan
Uzb
eki
stan Fi
jiK
irib
ati
Mic
ron
esi
aN
auru
Pal
auP
apu
a N
ew G
uin
eaSa
mo
aSo
lom
on
Isla
nd
sTo
nga
Tuva
luV
anu
atu
Afg
han
ista
nB
angl
ades
hB
hu
tan
Ind
iaM
ald
ives
Ne
pal
Pak
ista
nSr
i Lan
kaTu
rke
y
Bru
nei
Dar
uss
alam
Cam
bo
dia
Ind
on
esia
Lao
PD
RM
alay
sia
Mya
nm
arP
hili
pp
ine
sSi
nga
po
reTh
aila
nd
Tim
or
Lest
eV
iet
Nam
Au
stra
liaN
ew
Ze
alan
d
Transparency Formalities Institutional arrangement and cooperation Paperless trade Cross-border paperless trade
East and North-East Asia
North and Central
Asia (51.8%)
Pacific Islands Developing Economies (28.2%)
South and South-West Asia (46.5%)
South-East Asia (60.4%)
Australiaand New Zealand(85.0%)
6
Figure 2: Trade facilitation implementation and GDP per capita of 44 Asia-Pacific economies
Source: The second UNRC survey on trade facilitation and paperless trade implementation; World Bank, World Development Indicators,
accessed 30 June 2017.
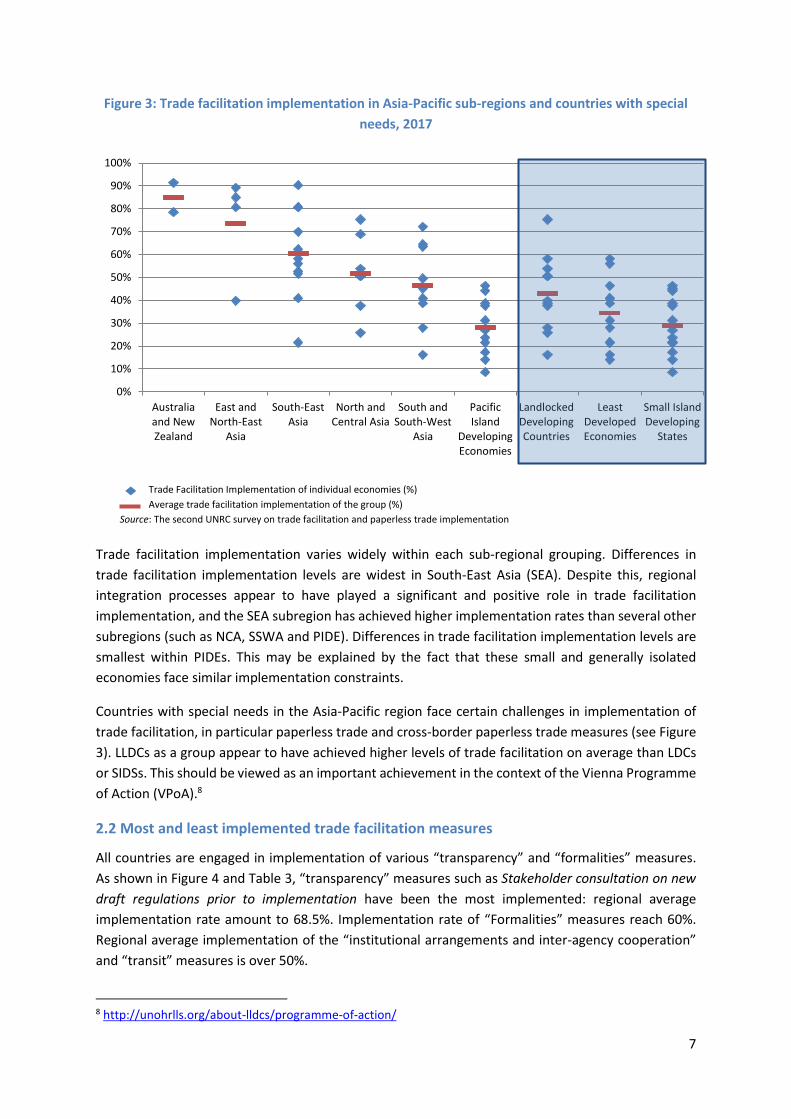
2.1 Implementation in sub-regions and countries with special needs
Figure 3 presents an overview of the implementation of trade facilitation measures in the sub-regions
and the groups of countries with special needs, namely, LLDCs, LDCs and SIDS. Aside from Australia
and New Zealand (AU&NZ), East and North-East Asia (ENEA) achieved the highest average level of
implementation at 74%, followed by South-East Asia (SEA), North and Central Asia (NCA) and South
and South-West Asia (SSWA). Pacific Island Developing Economies (PIDEs) lag far behind other sub-
regions at 28%.
0%
10%
20%
30%
40%
50%
60%
70%
80%
90%
100%
0 10000 20000 30000 40000 50000 60000
Trad
e fa
cilit
atio
n im
ple
men
tati
on
(%
)
GDP per capita (2014: constant 2010 US$)
7
Figure 3: Trade facilitation implementation in Asia-Pacific sub-regions and countries with special
needs, 2017
Trade Facilitation Implementation of individual economies (%)
Average trade facilitation implementation of the group (%)
Source: The second UNRC survey on trade facilitation and paperless trade implementation
Trade facilitation implementation varies widely within each sub-regional grouping. Differences in
trade facilitation implementation levels are widest in South-East Asia (SEA). Despite this, regional
integration processes appear to have played a significant and positive role in trade facilitation
implementation, and the SEA subregion has achieved higher implementation rates than several other
subregions (such as NCA, SSWA and PIDE). Differences in trade facilitation implementation levels are
smallest within PIDEs. This may be explained by the fact that these small and generally isolated
economies face similar implementation constraints.
Countries with special needs in the Asia-Pacific region face certain challenges in implementation of
trade facilitation, in particular paperless trade and cross-border paperless trade measures (see Figure
3). LLDCs as a group appear to have achieved higher levels of trade facilitation on average than LDCs
or SIDSs. This should be viewed as an important achievement in the context of the Vienna Programme
of Action (VPoA).8
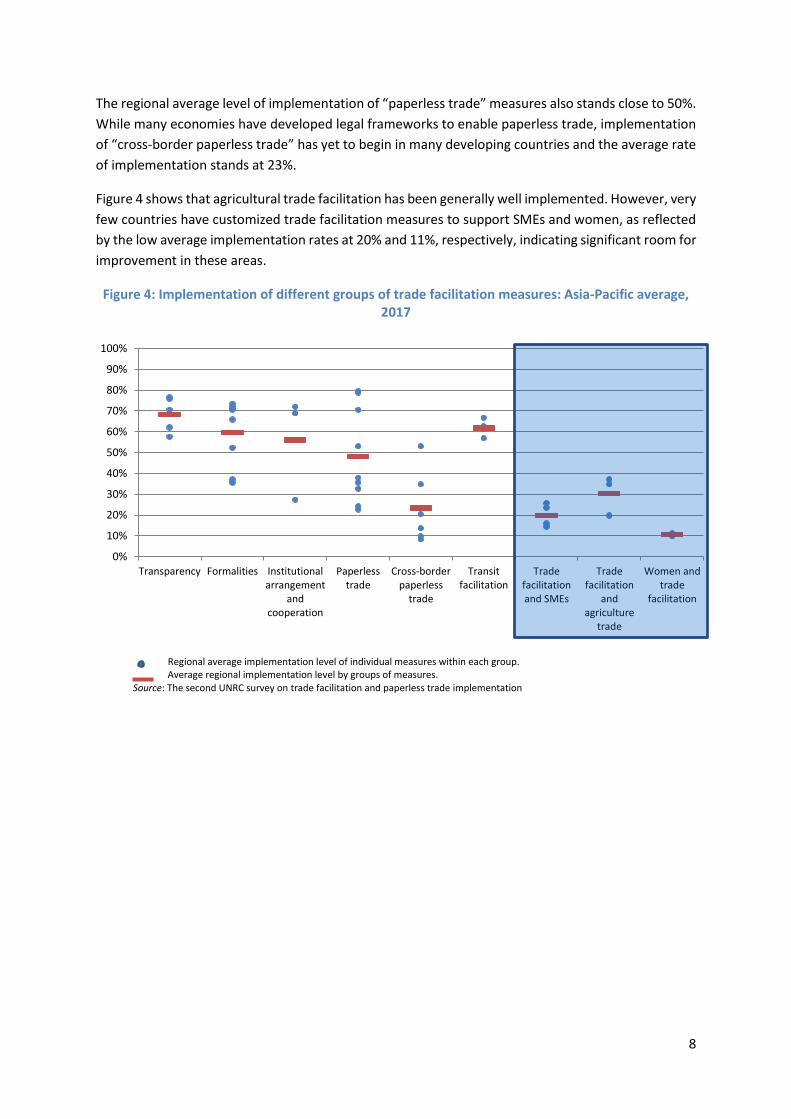
2.2 Most and least implemented trade facilitation measures
All countries are engaged in implementation of various “transparency” and “formalities” measures.
As shown in Figure 4 and Table 3, “transparency” measures such as Stakeholder consultation on new
draft regulations prior to implementation have been the most implemented: regional average
implementation rate amount to 68.5%. Implementation rate of “Formalities” measures reach 60%.
Regional average implementation of the “institutional arrangements and inter-agency cooperation”
and “transit” measures is over 50%.
8 http://unohrlls.org/about-lldcs/programme-of-action/
0%
10%
20%
30%
40%
50%
60%
70%
80%
90%
100%
Australiaand NewZealand
East andNorth-East
Asia
South-EastAsia
North andCentral Asia
South andSouth-West
Asia
PacificIsland
DevelopingEconomies
LandlockedDevelopingCountries
LeastDevelopedEconomies
Small IslandDeveloping
States
8
The regional average level of implementation of “paperless trade” measures also stands close to 50%.
While many economies have developed legal frameworks to enable paperless trade, implementation
of “cross-border paperless trade” has yet to begin in many developing countries and the average rate
of implementation stands at 23%.
Figure 4 shows that agricultural trade facilitation has been generally well implemented. However, very
few countries have customized trade facilitation measures to support SMEs and women, as reflected
by the low average implementation rates at 20% and 11%, respectively, indicating significant room for
improvement in these areas.
Figure 4: Implementation of different groups of trade facilitation measures: Asia-Pacific average, 2017
Regional average implementation level of individual measures within each group. Average regional implementation level by groups of measures.
Source: The second UNRC survey on trade facilitation and paperless trade implementation
0%
10%
20%
30%
40%
50%
60%
70%
80%
90%
100%
Transparency Formalities Institutionalarrangement
andcooperation
Paperlesstrade
Cross-borderpaperless
trade
Transitfacilitation
Tradefacilitationand SMEs
Tradefacilitation
andagriculture
trade
Women andtrade
facilitation

9
Table 3: Most and least implemented measures in Asia-Pacific, 2017 (within each group of trade facilitation measures)
Category of trade facilitation measures
Most implemented (% of countries) Least implemented (% of countries)
Measure
Implemented fully, partially or on pilot
basis / Fully implemented
(% of countries/% of countries)
Measure
Implemented fully, partially
or on pilot basis / Fully
implemented (% of
countries/% of countries)
Transparency Stakeholders' consultation on new draft regulations (prior to their finalization)
95.5 / 36.4 Advance ruling (on tariff classification)
68.2 / 36.4
Formalities Risk management 93.2 / 38.6 Trade facilitation measures for authorized operators
45.5 / 20.5
Institutional arrangement and cooperation
National legislative framework and institutional arrangement are available to ensure border agencies to cooperate with each other
97.7 / 22.7 Government agencies delegating controls to Customs authorities
36.4 / 9.1
Paperless trade
Internet connection available to Customs and other trade control agencies at border-crossings
95.5 / 52.3 Electronic Application for Customs Refunds
29.5 / 9.1
Cross-border paperless trade
Laws and regulations for electronic transactions
72.7 / 15.9
Traders in your country apply for letters of credit electronically from banks or insurers without lodging paper-based documents
11.4 / 4.5
Transit facilitation Transit facilitation agreement(s) with neighbouring country(ies)
56.8 / 2.3 Supporting pre-arrival processing for transit facilitation
40.9 / 11.4
Trade facilitation and SMEs
Government has developed trade facilitation measures that ensure easy and affordable access for SMEs to trade related information
36.4 / 9.1
Government has developed specific measures that enable SMEs to more easily benefit from the AEO scheme
20.5 / 11.4
Trade facilitation and agricultural trade
Testing and laboratory facilities are equipped for compliance with sanitary and phytosanitary (SPS) standards in your country
45.5 / 20.5 Application, verification and issuance of SPS certificates is automated
29.5 / 6.8
Women in trade facilitation
Government has introduced trade facilitation measures to benefit women involved in trade
18.2 / 2.3
The existing trade facilitation policy/strategy incorporates special consideration of women involved in trade
15.9 / 2.3
Source: The second UNRC survey on trade facilitation and paperless trade implementation
10
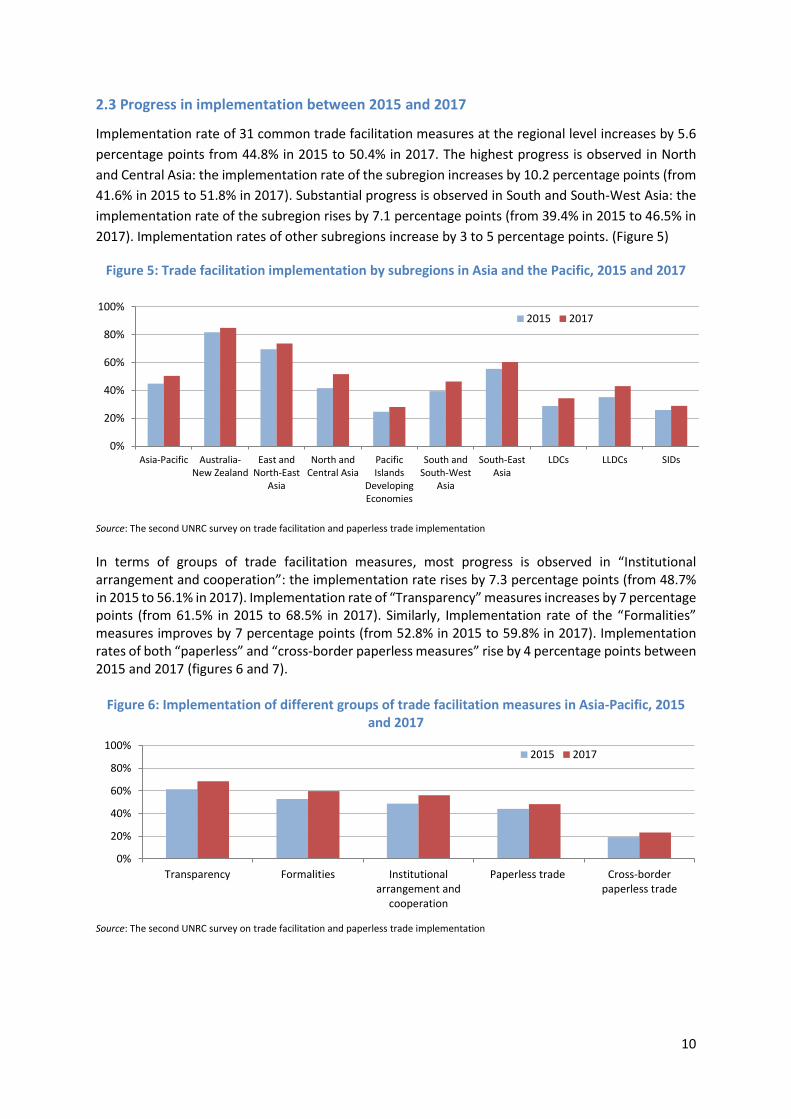
2.3 Progress in implementation between 2015 and 2017
Implementation rate of 31 common trade facilitation measures at the regional level increases by 5.6
percentage points from 44.8% in 2015 to 50.4% in 2017. The highest progress is observed in North
and Central Asia: the implementation rate of the subregion increases by 10.2 percentage points (from
41.6% in 2015 to 51.8% in 2017). Substantial progress is observed in South and South-West Asia: the
implementation rate of the subregion rises by 7.1 percentage points (from 39.4% in 2015 to 46.5% in
2017). Implementation rates of other subregions increase by 3 to 5 percentage points. (Figure 5)
Figure 5: Trade facilitation implementation by subregions in Asia and the Pacific, 2015 and 2017
Source: The second UNRC survey on trade facilitation and paperless trade implementation
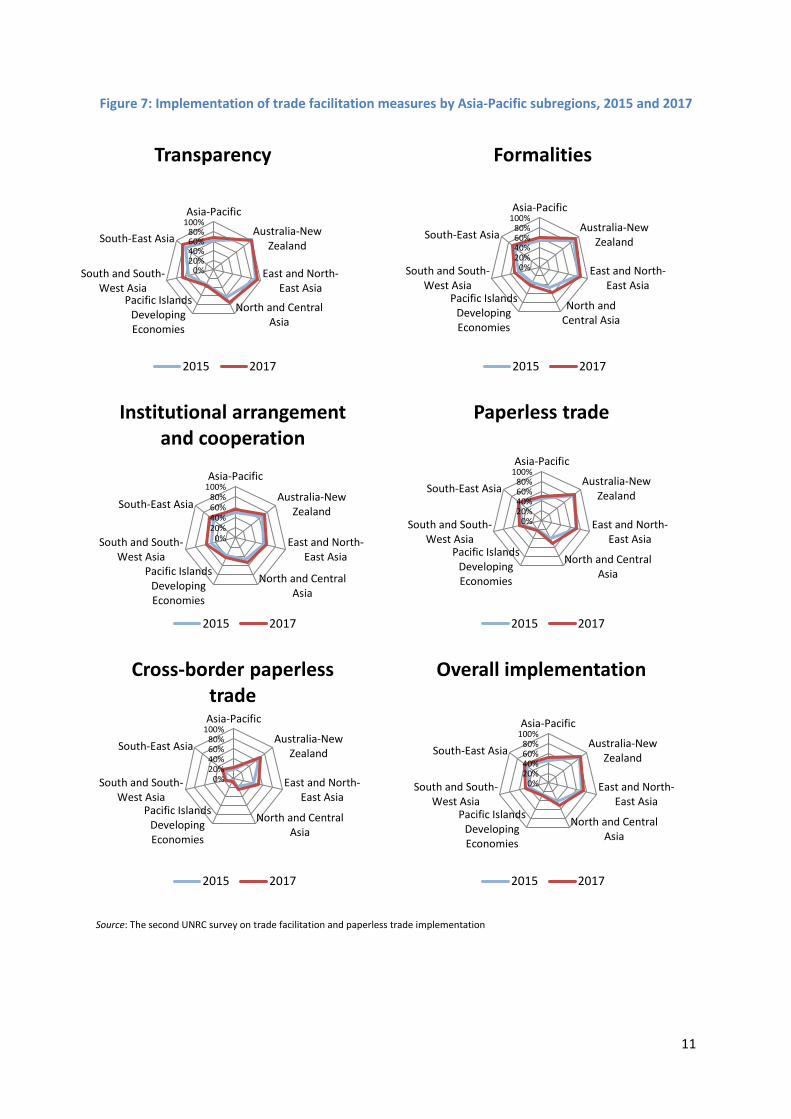
In terms of groups of trade facilitation measures, most progress is observed in “Institutional arrangement and cooperation”: the implementation rate rises by 7.3 percentage points (from 48.7% in 2015 to 56.1% in 2017). Implementation rate of “Transparency” measures increases by 7 percentage points (from 61.5% in 2015 to 68.5% in 2017). Similarly, Implementation rate of the “Formalities” measures improves by 7 percentage points (from 52.8% in 2015 to 59.8% in 2017). Implementation rates of both “paperless” and “cross-border paperless measures” rise by 4 percentage points between 2015 and 2017 (figures 6 and 7).
Figure 6: Implementation of different groups of trade facilitation measures in Asia-Pacific, 2015
and 2017
Source: The second UNRC survey on trade facilitation and paperless trade implementation
0%
20%
40%
60%
80%
100%
Asia-Pacific Australia-New Zealand
East andNorth-East
Asia
North andCentral Asia
PacificIslands
DevelopingEconomies
South andSouth-West
Asia
South-EastAsia
LDCs LLDCs SIDs
2015 2017
0%
20%
40%
60%
80%
100%
Transparency Formalities Institutionalarrangement and
cooperation
Paperless trade Cross-borderpaperless trade
2015 2017
11
Figure 7: Implementation of trade facilitation measures by Asia-Pacific subregions, 2015 and 2017
Source: The second UNRC survey on trade facilitation and paperless trade implementation
0%20%40%60%80%
100%Asia-Pacific
Australia-NewZealand
East and North-East Asia
North and CentralAsia
Pacific IslandsDevelopingEconomies
South and South-West Asia
South-East Asia
Transparency
2015 2017
0%20%40%60%80%
100%Asia-Pacific
Australia-NewZealand
East and North-East Asia
North andCentral Asia
Pacific IslandsDevelopingEconomies
South and South-West Asia
South-East Asia
Formalities
2015 2017
0%20%40%60%80%
100%Asia-Pacific
Australia-NewZealand
East and North-East Asia
North and CentralAsia
Pacific IslandsDevelopingEconomies
South and South-West Asia
South-East Asia
Institutional arrangement and cooperation
2015 2017
0%20%40%60%80%
100%Asia-Pacific
Australia-NewZealand
East and North-East Asia
North and CentralAsia
Pacific IslandsDevelopingEconomies
South and South-West Asia
South-East Asia
Paperless trade
2015 2017
0%20%40%60%80%
100%Asia-Pacific
Australia-NewZealand
East and North-East Asia
North and CentralAsia
Pacific IslandsDevelopingEconomies
South and South-West Asia
South-East Asia
Cross-border paperless trade
2015 2017
0%20%40%60%80%
100%Asia-Pacific
Australia-NewZealand
East and North-East Asia
North and CentralAsia
Pacific IslandsDevelopingEconomies
South and South-West Asia
South-East Asia
Overall implementation
2015 2017
12
3. Implementation of trade facilitation measures: a closer look
3.1 “Transparency” measures
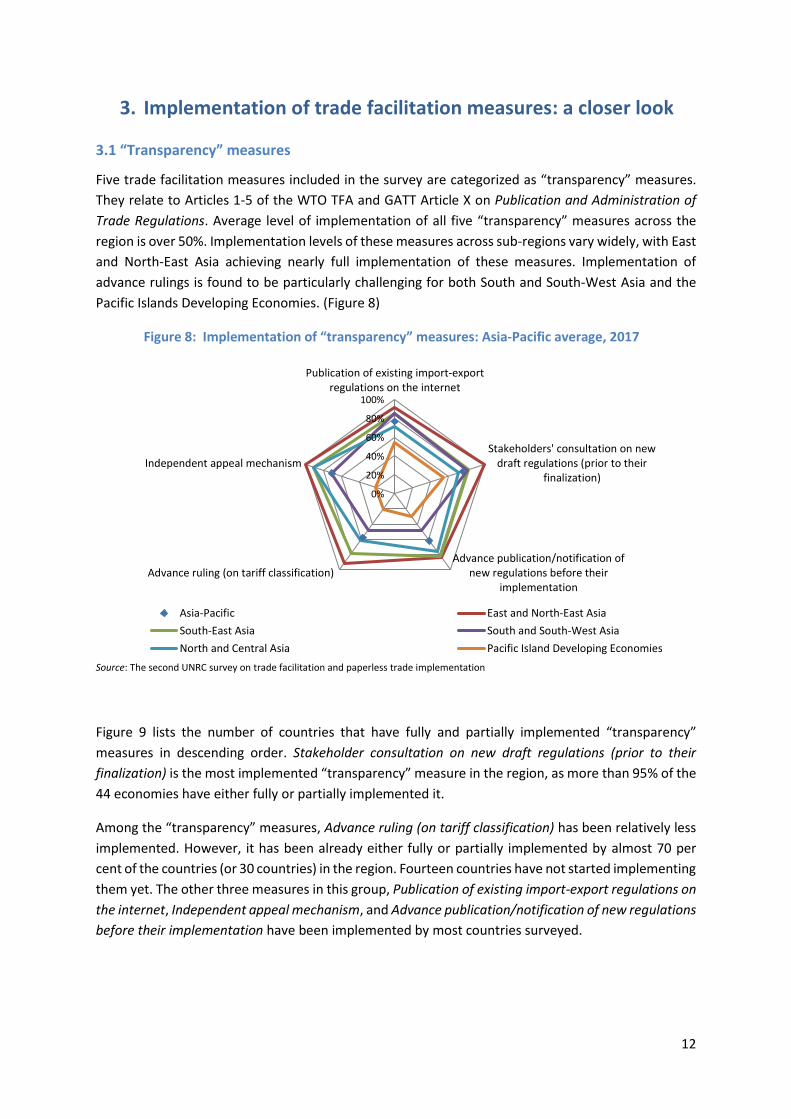
Five trade facilitation measures included in the survey are categorized as “transparency” measures.
They relate to Articles 1-5 of the WTO TFA and GATT Article X on Publication and Administration of
Trade Regulations. Average level of implementation of all five “transparency” measures across the
region is over 50%. Implementation levels of these measures across sub-regions vary widely, with East
and North-East Asia achieving nearly full implementation of these measures. Implementation of
advance rulings is found to be particularly challenging for both South and South-West Asia and the
Pacific Islands Developing Economies. (Figure 8)
Figure 8: Implementation of “transparency” measures: Asia-Pacific average, 2017
Source: The second UNRC survey on trade facilitation and paperless trade implementation
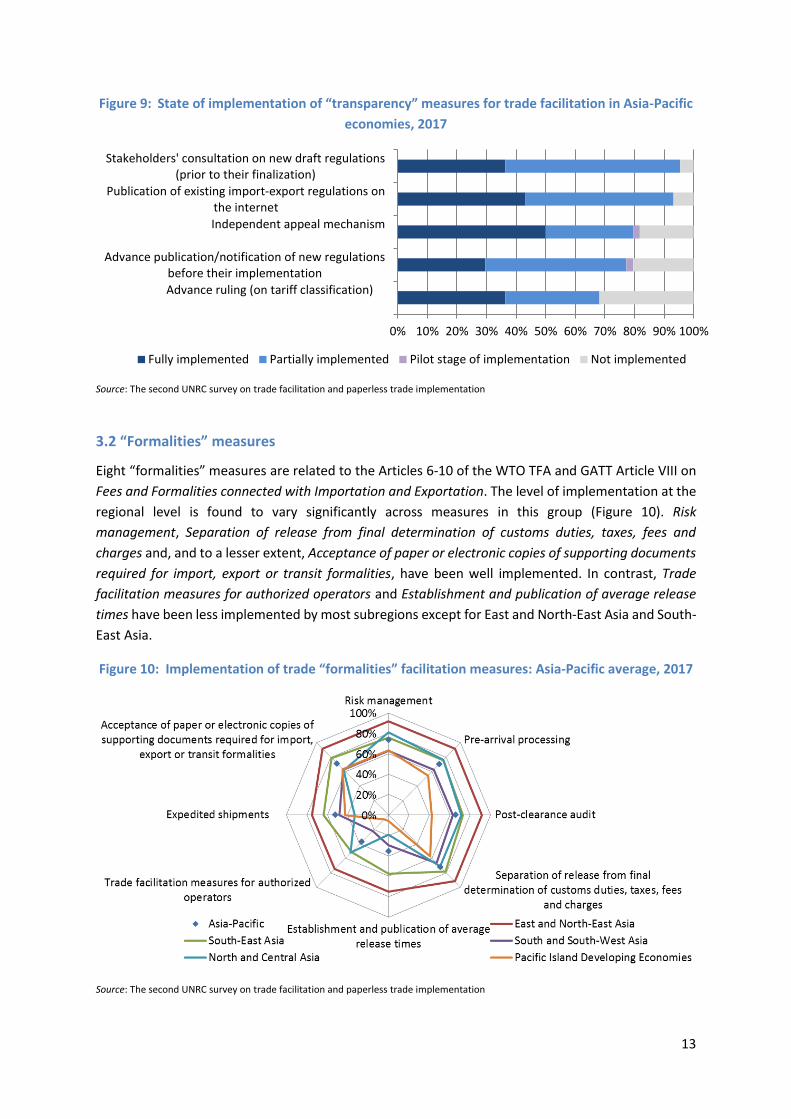
Figure 9 lists the number of countries that have fully and partially implemented “transparency”
measures in descending order. Stakeholder consultation on new draft regulations (prior to their
finalization) is the most implemented “transparency” measure in the region, as more than 95% of the
44 economies have either fully or partially implemented it.
Among the “transparency” measures, Advance ruling (on tariff classification) has been relatively less
implemented. However, it has been already either fully or partially implemented by almost 70 per
cent of the countries (or 30 countries) in the region. Fourteen countries have not started implementing
them yet. The other three measures in this group, Publication of existing import-export regulations on
the internet, Independent appeal mechanism, and Advance publication/notification of new regulations
before their implementation have been implemented by most countries surveyed.
0%
20%
40%
60%
80%
100%
Publication of existing import-exportregulations on the internet
Stakeholders' consultation on newdraft regulations (prior to their
finalization)
Advance publication/notification ofnew regulations before their
implementationAdvance ruling (on tariff classification)
Independent appeal mechanism
Asia-Pacific East and North-East Asia
South-East Asia South and South-West Asia
North and Central Asia Pacific Island Developing Economies
13
Figure 9: State of implementation of “transparency” measures for trade facilitation in Asia-Pacific
economies, 2017
Source: The second UNRC survey on trade facilitation and paperless trade implementation
3.2 “Formalities” measures
Eight “formalities” measures are related to the Articles 6-10 of the WTO TFA and GATT Article VIII on
Fees and Formalities connected with Importation and Exportation. The level of implementation at the
regional level is found to vary significantly across measures in this group (Figure 10). Risk
management, Separation of release from final determination of customs duties, taxes, fees and
charges and, and to a lesser extent, Acceptance of paper or electronic copies of supporting documents
required for import, export or transit formalities, have been well implemented. In contrast, Trade
facilitation measures for authorized operators and Establishment and publication of average release
times have been less implemented by most subregions except for East and North-East Asia and South-
East Asia.
Figure 10: Implementation of trade “formalities” facilitation measures: Asia-Pacific average, 2017
Source: The second UNRC survey on trade facilitation and paperless trade implementation
0% 10% 20% 30% 40% 50% 60% 70% 80% 90% 100%
Advance ruling (on tariff classification)
Advance publication/notification of new regulationsbefore their implementation
Independent appeal mechanism
Publication of existing import-export regulations onthe internet
Stakeholders' consultation on new draft regulations(prior to their finalization)
Fully implemented Partially implemented Pilot stage of implementation Not implemented

14
Risk management has been implemented by 41 countries, or 93% of the Asia-Pacific countries
surveyed, although in some cases only on a pilot basis. Risk Management and Separation of release
from final determination of customs duties, taxes, fees and charges, have been implemented by over
85% of the countries surveyed (including some on a pilot basis). Acceptance of copies of supporting
documents instead of originals and Pre-arrival processing have been partially or fully implemented by
approximately 84% of the countries (37 countries). Post-clearance audit has also been either fully or
partially implemented by 80% of the countries surveyed. (Figure 11)
Figure 11: State of implementation of trade “formalities” facilitation measures in Asia-Pacific economies, 2017
Source: The second UNRC survey on trade facilitation and paperless trade implementation
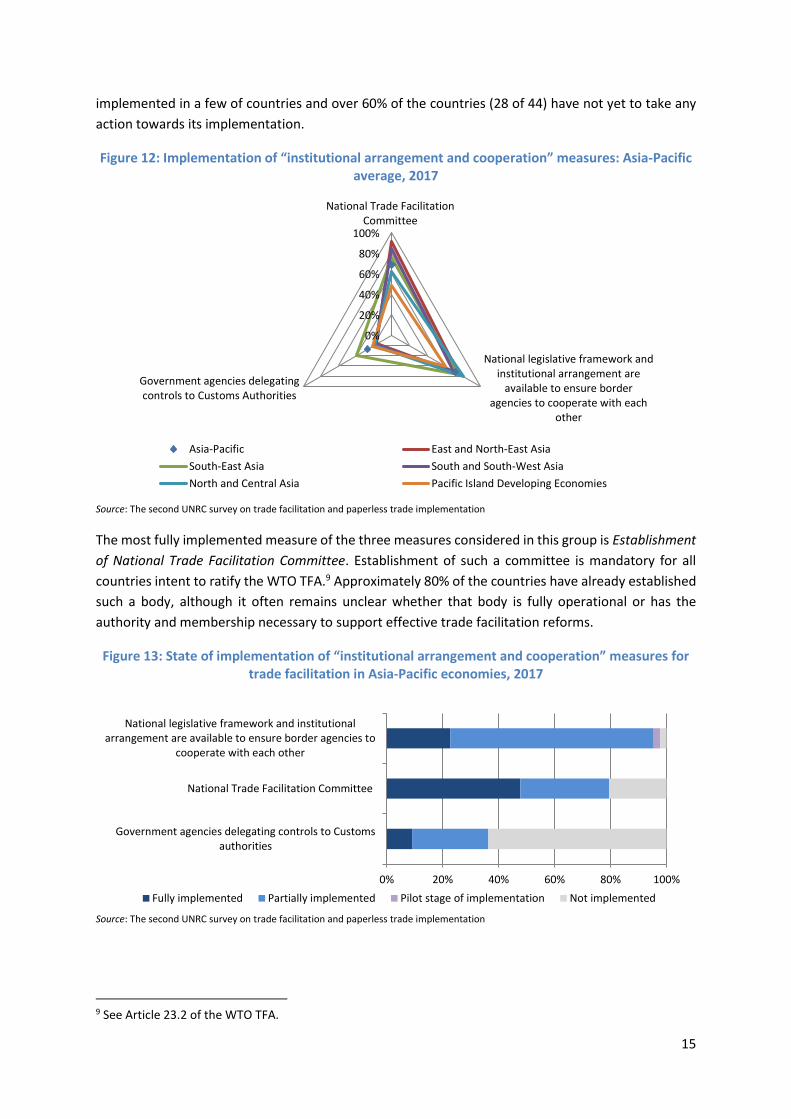
3.3 “Institutional arrangement and cooperation” measures
Among “Institutional and cooperation” measures, Figure 12 shows that National legislative framework
and institutional arrangement are available to ensure border agencies to cooperate with each other
(cooperation between agencies) has already been quite extensively implemented in the region and
most sub-regions. In contrast, implementation levels of mechanisms enabling Government agencies
to delegate controls to Customs Authorities remain well below 30% in Asia-Pacific. This is particularly
for the case of East and North-East Asia, North and Central Asia and South and South-West Asia where
the implementation level of this measure is below 20%.
While Cooperation between agencies is being implemented by almost all countries (98%), Figure 13
show that implementation has been essentially partial. In fact, only 10 countries have fully
implemented that measure, highlighting the fact that strengthening cooperation among agencies is
an on-going process. Arguably, the ultimate form of inter-agency collaboration is the delegation of
authority by one or more agencies to another, as suggested by the measure Government agencies
delegating controls to Customs Authorities. Not surprisingly, this latter measure has only been
0% 20% 40% 60% 80% 100%
Trade facilitation measures for authorized operators
Establishment and publication of average release times
Expedited shipments
Post-clearance audit
Pre-arrival processing
Acceptance of paper or electronic copies of supportingdocuments required for import, export or transit formalities
Separation of Release from final determination of customsduties, taxes, fees and charges
Risk management
Fully implemented Partially implemented Pilot stage of implementation Not implemented
15
implemented in a few of countries and over 60% of the countries (28 of 44) have not yet to take any
action towards its implementation.
Figure 12: Implementation of “institutional arrangement and cooperation” measures: Asia-Pacific average, 2017
Source: The second UNRC survey on trade facilitation and paperless trade implementation
The most fully implemented measure of the three measures considered in this group is Establishment
of National Trade Facilitation Committee. Establishment of such a committee is mandatory for all
countries intent to ratify the WTO TFA.9 Approximately 80% of the countries have already established
such a body, although it often remains unclear whether that body is fully operational or has the
authority and membership necessary to support effective trade facilitation reforms.
Figure 13: State of implementation of “institutional arrangement and cooperation” measures for trade facilitation in Asia-Pacific economies, 2017
Source: The second UNRC survey on trade facilitation and paperless trade implementation
9 See Article 23.2 of the WTO TFA.
0%
20%
40%
60%
80%
100%
National Trade FacilitationCommittee
National legislative framework andinstitutional arrangement are
available to ensure borderagencies to cooperate with each
other
Government agencies delegatingcontrols to Customs Authorities
Asia-Pacific East and North-East Asia
South-East Asia South and South-West Asia
North and Central Asia Pacific Island Developing Economies
0% 20% 40% 60% 80% 100%
Government agencies delegating controls to Customsauthorities
National Trade Facilitation Committee
National legislative framework and institutionalarrangement are available to ensure border agencies to
cooperate with each other
Fully implemented Partially implemented Pilot stage of implementation Not implemented
16
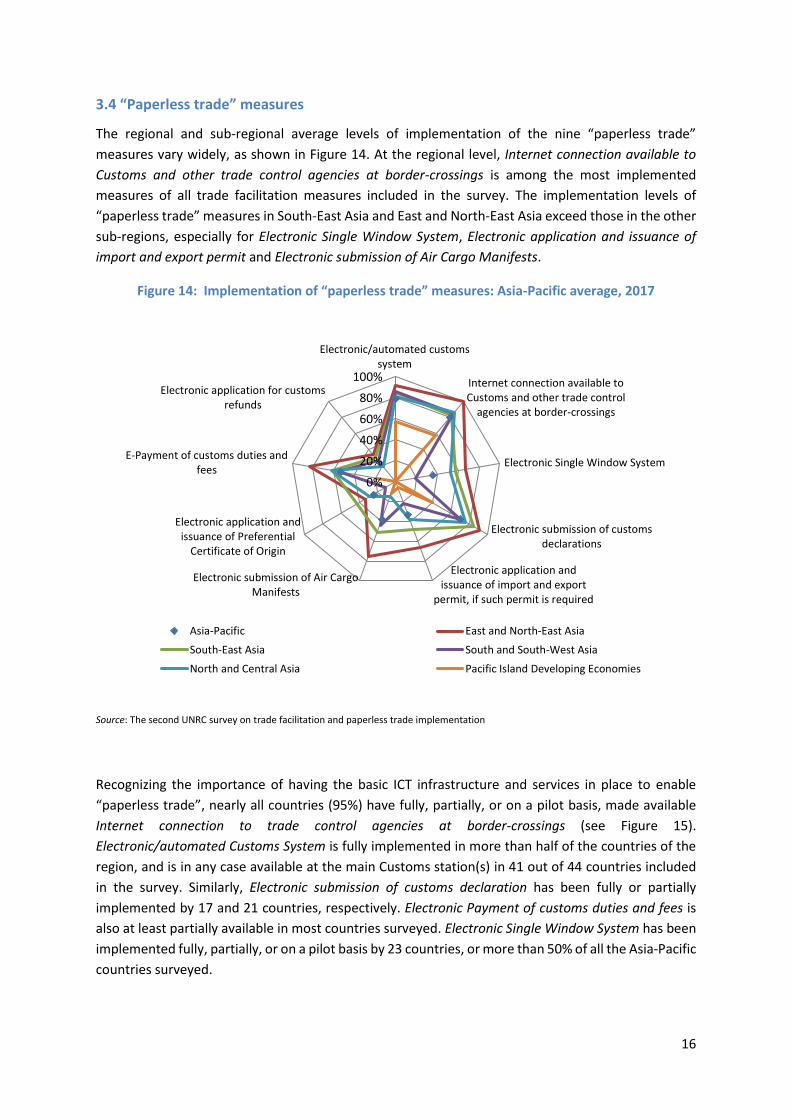
3.4 “Paperless trade” measures
The regional and sub-regional average levels of implementation of the nine “paperless trade”
measures vary widely, as shown in Figure 14. At the regional level, Internet connection available to
Customs and other trade control agencies at border-crossings is among the most implemented
measures of all trade facilitation measures included in the survey. The implementation levels of
“paperless trade” measures in South-East Asia and East and North-East Asia exceed those in the other
sub-regions, especially for Electronic Single Window System, Electronic application and issuance of
import and export permit and Electronic submission of Air Cargo Manifests.
Figure 14: Implementation of “paperless trade” measures: Asia-Pacific average, 2017
Source: The second UNRC survey on trade facilitation and paperless trade implementation
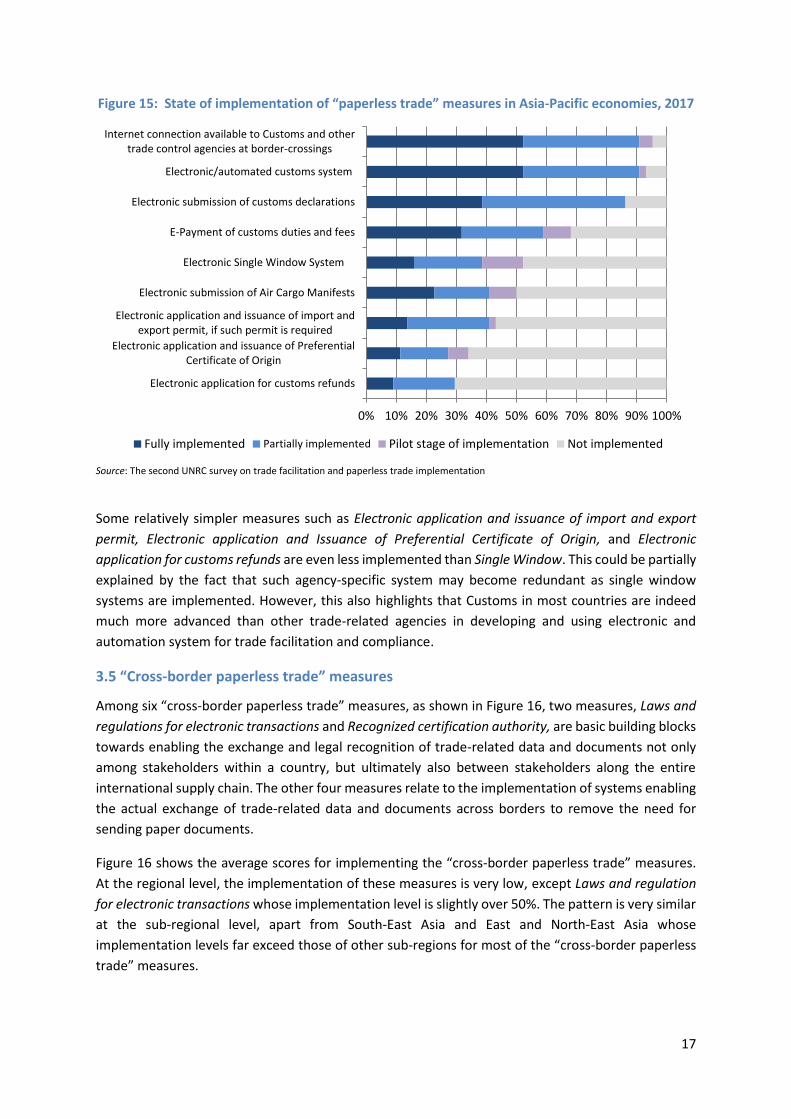
Recognizing the importance of having the basic ICT infrastructure and services in place to enable
“paperless trade”, nearly all countries (95%) have fully, partially, or on a pilot basis, made available
Internet connection to trade control agencies at border-crossings (see Figure 15).
Electronic/automated Customs System is fully implemented in more than half of the countries of the
region, and is in any case available at the main Customs station(s) in 41 out of 44 countries included
in the survey. Similarly, Electronic submission of customs declaration has been fully or partially
implemented by 17 and 21 countries, respectively. Electronic Payment of customs duties and fees is
also at least partially available in most countries surveyed. Electronic Single Window System has been
implemented fully, partially, or on a pilot basis by 23 countries, or more than 50% of all the Asia-Pacific
countries surveyed.
0%
20%
40%
60%
80%
100%
Electronic/automated customssystem
Internet connection available toCustoms and other trade control
agencies at border-crossings
Electronic Single Window System
Electronic submission of customsdeclarations
Electronic application andissuance of import and export
permit, if such permit is required
Electronic submission of Air CargoManifests
Electronic application andissuance of Preferential
Certificate of Origin
E-Payment of customs duties andfees
Electronic application for customsrefunds
Asia-Pacific East and North-East Asia
South-East Asia South and South-West Asia
North and Central Asia Pacific Island Developing Economies
17
Figure 15: State of implementation of “paperless trade” measures in Asia-Pacific economies, 2017
Source: The second UNRC survey on trade facilitation and paperless trade implementation
Some relatively simpler measures such as Electronic application and issuance of import and export
permit, Electronic application and Issuance of Preferential Certificate of Origin, and Electronic
application for customs refunds are even less implemented than Single Window. This could be partially
explained by the fact that such agency-specific system may become redundant as single window
systems are implemented. However, this also highlights that Customs in most countries are indeed
much more advanced than other trade-related agencies in developing and using electronic and
automation system for trade facilitation and compliance.
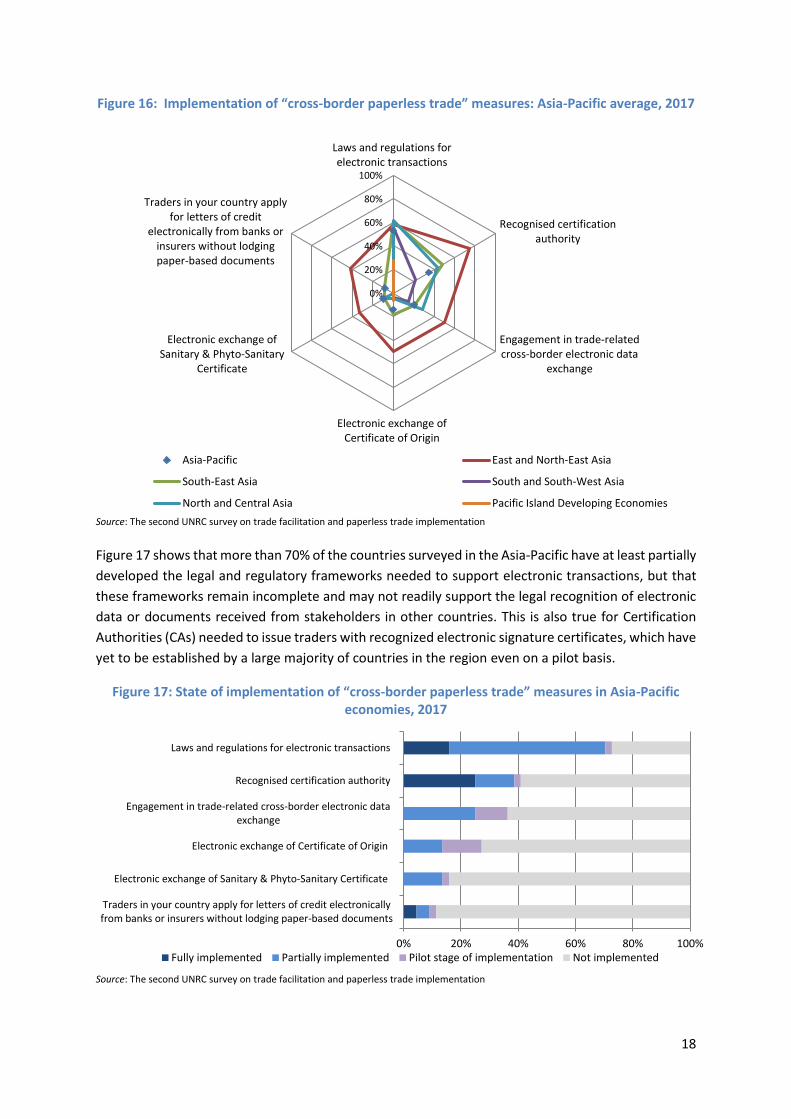
3.5 “Cross-border paperless trade” measures
Among six “cross-border paperless trade” measures, as shown in Figure 16, two measures, Laws and
regulations for electronic transactions and Recognized certification authority, are basic building blocks
towards enabling the exchange and legal recognition of trade-related data and documents not only
among stakeholders within a country, but ultimately also between stakeholders along the entire
international supply chain. The other four measures relate to the implementation of systems enabling
the actual exchange of trade-related data and documents across borders to remove the need for
sending paper documents.
Figure 16 shows the average scores for implementing the “cross-border paperless trade” measures.
At the regional level, the implementation of these measures is very low, except Laws and regulation
for electronic transactions whose implementation level is slightly over 50%. The pattern is very similar
at the sub-regional level, apart from South-East Asia and East and North-East Asia whose
implementation levels far exceed those of other sub-regions for most of the “cross-border paperless
trade” measures.
0% 10% 20% 30% 40% 50% 60% 70% 80% 90% 100%
Electronic application for customs refunds
Electronic application and issuance of PreferentialCertificate of Origin
Electronic application and issuance of import andexport permit, if such permit is required
Electronic submission of Air Cargo Manifests
Electronic Single Window System
E-Payment of customs duties and fees
Electronic submission of customs declarations
Electronic/automated customs system
Internet connection available to Customs and othertrade control agencies at border-crossings
Fully implemented Partially implemented Pilot stage of implementation Not implemented
18
Figure 16: Implementation of “cross-border paperless trade” measures: Asia-Pacific average, 2017
Source: The second UNRC survey on trade facilitation and paperless trade implementation
Figure 17 shows that more than 70% of the countries surveyed in the Asia-Pacific have at least partially
developed the legal and regulatory frameworks needed to support electronic transactions, but that
these frameworks remain incomplete and may not readily support the legal recognition of electronic
data or documents received from stakeholders in other countries. This is also true for Certification
Authorities (CAs) needed to issue traders with recognized electronic signature certificates, which have
yet to be established by a large majority of countries in the region even on a pilot basis.
Figure 17: State of implementation of “cross-border paperless trade” measures in Asia-Pacific economies, 2017
Source: The second UNRC survey on trade facilitation and paperless trade implementation
0%
20%
40%
60%
80%
100%
Laws and regulations forelectronic transactions
Recognised certificationauthority
Engagement in trade-relatedcross-border electronic data
exchange
Electronic exchange ofCertificate of Origin
Electronic exchange ofSanitary & Phyto-Sanitary
Certificate
Traders in your country applyfor letters of credit
electronically from banks orinsurers without lodgingpaper-based documents
Asia-Pacific East and North-East Asia
South-East Asia South and South-West Asia
North and Central Asia Pacific Island Developing Economies
0% 20% 40% 60% 80% 100%
Traders in your country apply for letters of credit electronicallyfrom banks or insurers without lodging paper-based documents
Electronic exchange of Sanitary & Phyto-Sanitary Certificate
Electronic exchange of Certificate of Origin
Engagement in trade-related cross-border electronic dataexchange
Recognised certification authority
Laws and regulations for electronic transactions
Fully implemented Partially implemented Pilot stage of implementation Not implemented
19
Due to lack of institutional and legal frameworks to support cross-border paperless trade, Engagement
in trade-related cross-border electronic data exchange has been typically conducted on a limited basis
with a few specific trade partners, and often only on a partial or pilot implementation. Indeed,
Electronic exchange of Certificates of Origin and Electronic exchange of Sanitary & Phyto-Sanitary
Certificates have been implemented on a limited basis by less than 30% of the economies of the
region.
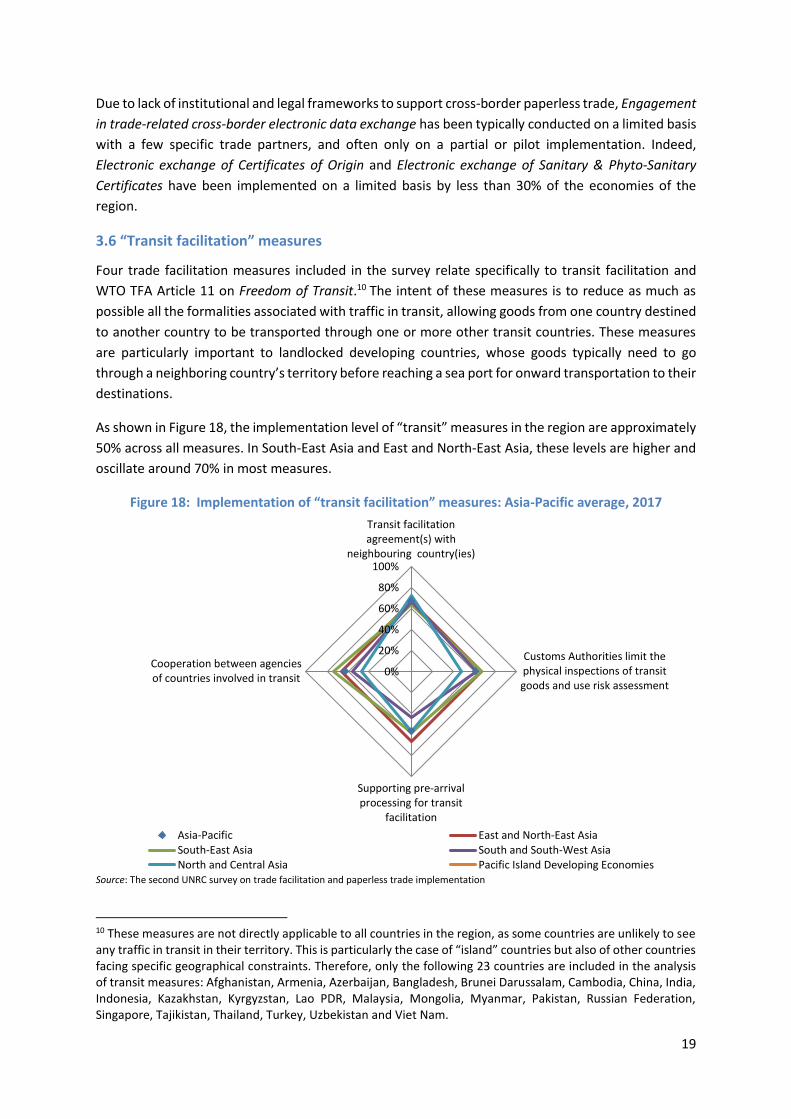
3.6 “Transit facilitation” measures
Four trade facilitation measures included in the survey relate specifically to transit facilitation and
WTO TFA Article 11 on Freedom of Transit.10 The intent of these measures is to reduce as much as
possible all the formalities associated with traffic in transit, allowing goods from one country destined
to another country to be transported through one or more other transit countries. These measures
are particularly important to landlocked developing countries, whose goods typically need to go
through a neighboring country’s territory before reaching a sea port for onward transportation to their
destinations.
As shown in Figure 18, the implementation level of “transit” measures in the region are approximately
50% across all measures. In South-East Asia and East and North-East Asia, these levels are higher and
oscillate around 70% in most measures.
Figure 18: Implementation of “transit facilitation” measures: Asia-Pacific average, 2017
Source: The second UNRC survey on trade facilitation and paperless trade implementation
10 These measures are not directly applicable to all countries in the region, as some countries are unlikely to see any traffic in transit in their territory. This is particularly the case of “island” countries but also of other countries facing specific geographical constraints. Therefore, only the following 23 countries are included in the analysis of transit measures: Afghanistan, Armenia, Azerbaijan, Bangladesh, Brunei Darussalam, Cambodia, China, India, Indonesia, Kazakhstan, Kyrgyzstan, Lao PDR, Malaysia, Mongolia, Myanmar, Pakistan, Russian Federation, Singapore, Tajikistan, Thailand, Turkey, Uzbekistan and Viet Nam.
0%
20%
40%
60%
80%
100%
Transit facilitationagreement(s) with
neighbouring country(ies)
Customs Authorities limit thephysical inspections of transitgoods and use risk assessment
Supporting pre-arrivalprocessing for transit
facilitation
Cooperation between agenciesof countries involved in transit
Asia-Pacific East and North-East AsiaSouth-East Asia South and South-West AsiaNorth and Central Asia Pacific Island Developing Economies
20
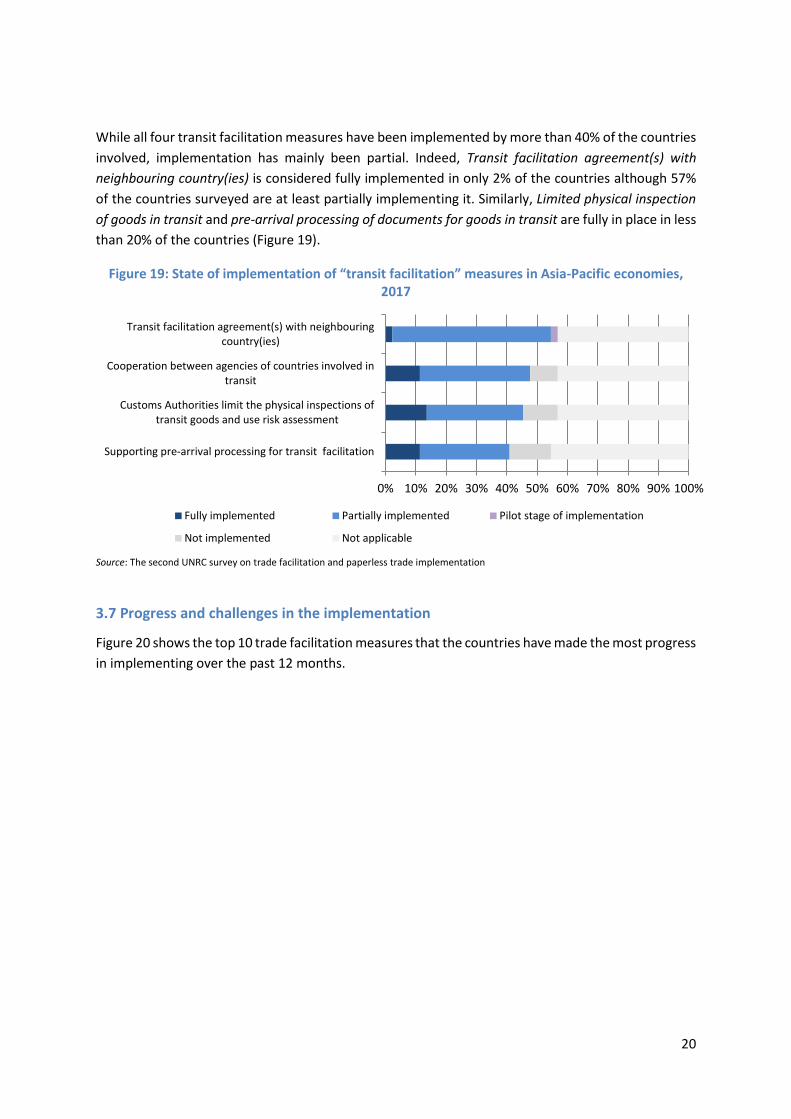
While all four transit facilitation measures have been implemented by more than 40% of the countries
involved, implementation has mainly been partial. Indeed, Transit facilitation agreement(s) with
neighbouring country(ies) is considered fully implemented in only 2% of the countries although 57%
of the countries surveyed are at least partially implementing it. Similarly, Limited physical inspection
of goods in transit and pre-arrival processing of documents for goods in transit are fully in place in less
than 20% of the countries (Figure 19).
Figure 19: State of implementation of “transit facilitation” measures in Asia-Pacific economies, 2017
Source: The second UNRC survey on trade facilitation and paperless trade implementation
3.7 Progress and challenges in the implementation
Figure 20 shows the top 10 trade facilitation measures that the countries have made the most progress
in implementing over the past 12 months.
0% 10% 20% 30% 40% 50% 60% 70% 80% 90% 100%
Supporting pre-arrival processing for transit facilitation
Customs Authorities limit the physical inspections oftransit goods and use risk assessment
Cooperation between agencies of countries involved intransit
Transit facilitation agreement(s) with neighbouringcountry(ies)
Fully implemented Partially implemented Pilot stage of implementation
Not implemented Not applicable

21
Figure 20: Trade facilitation measures on which most progress was made in Asia-Pacific economies since 2016
Source: The second UNRC survey on trade facilitation and paperless trade implementation
While the data remains anecdotal in nature, it suggests that many countries across the Asia-Pacific
region prioritize improving their Electronic/automated Customs System and Internet connection
available to Customs and other trade control agencies at border-crossings over the past year. Many
also work on implementing Independent appeal mechanism, as well as Establishing National Trade
Facilitation Committee. Finally, implementation of Acceptance of paper or electronic copies of
supporting documents required for import, export or transit formalities also see significant progress.
Experts involved in the survey are also requested to identify the three key challenges faced by their
countries in the implementation of trade facilitation measures. Responses are received for 20
countries. Limited human resource capacity and Lack of coordination between government agencies
are identified as the most pressing challenges in 16 and 12 countries, respectively. Both No clearly
designated lead agency and Financial constraints are mentioned in 11 countries.
0 5 10 15 20 25
Risk management
Post-clearance audit
Pre-arrival processing
Separation of Release from final determination of customsduties, taxes, fees and charges
Publication of existing import-export regulations on theinternet
Acceptance of paper or electronic copies of supportingdocuments required for import, export or transit formalities
National Trade Facilitation Committee
Independent appeal mechanism
Electronic/automated Customs System
Internet connection available to Customs and other tradecontrol agencies at border-crossings
Number of countries where implementation of a measure has progressed most

22
Figure 21: Challenges faced by Asia-Pacific LDCs, LLDCs, SIDSs and other developing countries in implementing trade facilitation measures
Note: Data show the number of countries.
Source: The second UNRC survey on trade facilitation and paperless trade implementation
Five challenges associated with trade facilitation shown in Figure 21 vary significantly across groups of
countries. Limited human resource capacity seems to be most severe for LDCs and LLDCs, Financial
constraints seems to be relatively more pertinent than other challenges for SIDSs. In contrast, Lack of
coordination between Government agencies seems to be more pronounced than other challenges in
other developing countries.
0
2
4
6
8
Lack of coordination betweengovernment agencies
Lack of political will
No clearly designated lead agencyFinancial constraints
Limited human resource capacity
LDCs LLDCs SIDs Developing countries
23
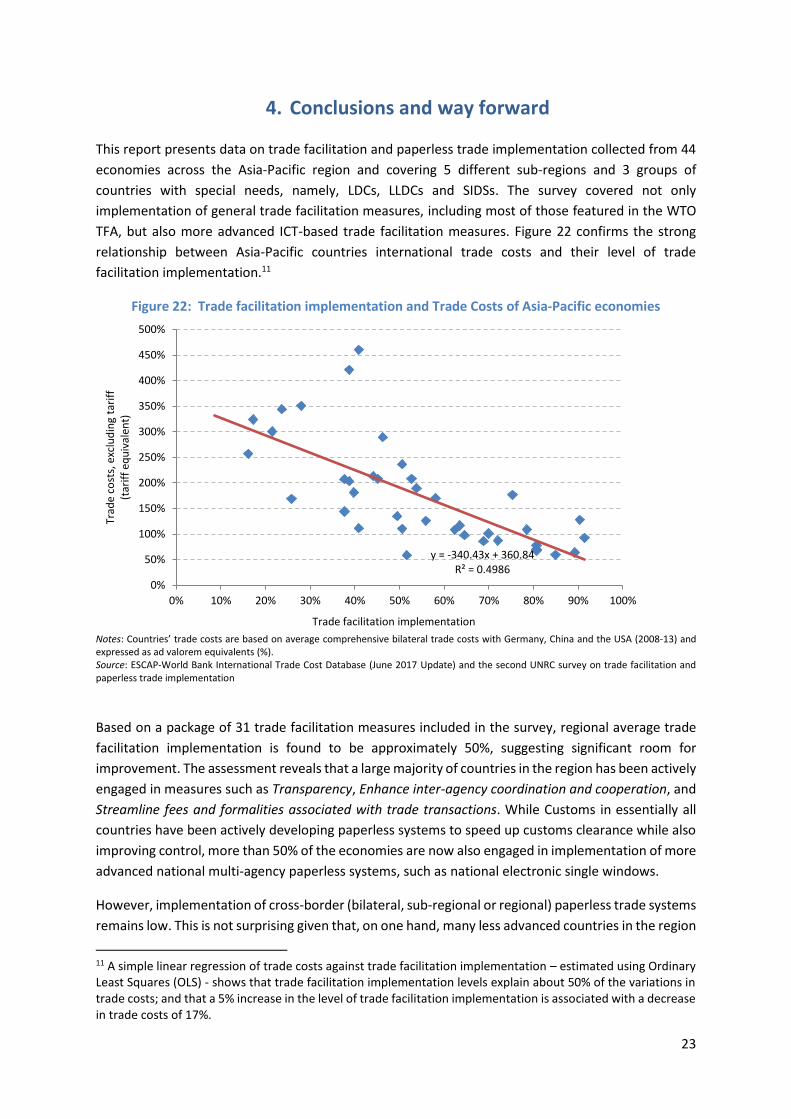
4. Conclusions and way forward
This report presents data on trade facilitation and paperless trade implementation collected from 44
economies across the Asia-Pacific region and covering 5 different sub-regions and 3 groups of
countries with special needs, namely, LDCs, LLDCs and SIDSs. The survey covered not only
implementation of general trade facilitation measures, including most of those featured in the WTO
TFA, but also more advanced ICT-based trade facilitation measures. Figure 22 confirms the strong
relationship between Asia-Pacific countries international trade costs and their level of trade
facilitation implementation.11
Figure 22: Trade facilitation implementation and Trade Costs of Asia-Pacific economies
Notes: Countries’ trade costs are based on average comprehensive bilateral trade costs with Germany, China and the USA (2008-13) and expressed as ad valorem equivalents (%). Source: ESCAP-World Bank International Trade Cost Database (June 2017 Update) and the second UNRC survey on trade facilitation and paperless trade implementation
Based on a package of 31 trade facilitation measures included in the survey, regional average trade
facilitation implementation is found to be approximately 50%, suggesting significant room for
improvement. The assessment reveals that a large majority of countries in the region has been actively
engaged in measures such as Transparency, Enhance inter-agency coordination and cooperation, and
Streamline fees and formalities associated with trade transactions. While Customs in essentially all
countries have been actively developing paperless systems to speed up customs clearance while also
improving control, more than 50% of the economies are now also engaged in implementation of more
advanced national multi-agency paperless systems, such as national electronic single windows.
However, implementation of cross-border (bilateral, sub-regional or regional) paperless trade systems
remains low. This is not surprising given that, on one hand, many less advanced countries in the region
11 A simple linear regression of trade costs against trade facilitation implementation – estimated using Ordinary Least Squares (OLS) - shows that trade facilitation implementation levels explain about 50% of the variations in trade costs; and that a 5% increase in the level of trade facilitation implementation is associated with a decrease in trade costs of 17%.
y = -340.43x + 360.84R² = 0.4986
0%
50%
100%
150%
200%
250%
300%
350%
400%
450%
500%
0% 10% 20% 30% 40% 50% 60% 70% 80% 90% 100%
Trad
e co
sts,
exc
lud
ing
tari
ff
(tar
iff
equ
ival
ent)
Trade facilitation implementation
24
are at an early stage of development of national paperless systems and that, on the other hand, more
advanced countries have paperless systems in place that are not fully interoperable with each other.
In that regard, given the large potential benefits associated with the implementation of these “next
generation” trade facilitation measures,12 it is in the interest of countries from all groups to work
together and develop the legal and technical protocols needed for the seamless exchange of
regulatory and commercial data and documents along the international supply chain.
Some work has already been done bilaterally as well as in several Asian sub-regions (e.g., in ASEAN as
part of implementation of the ASEAN Single Window). This work can be further leveraged at the
regional level through adoption and implementation of the intergovernmental Framework Agreement
for the Facilitation of Cross-border Paperless Trade. Negotiated as an inclusive and flexible
intergovernmental platform to enable the electronic exchange of trade-related data and documents
across borders among Parties, the Framework Agreement is set to benefit all parties regardless of
their current state of implementation of paperless trade. Therefore, all countries in the region are
encouraged to become a party of the treaty as soon as possible to take advantage of what the
agreement offers, especially in terms of accessing to capacity building and technical assistance.
Remarkably, the only trade facilitation performance “monitoring” measure included in the survey
(Establishment and publication of average release times), has not been widely implemented across
the region. This is worth highlighting, as what ultimately matters is not how many measures one
implements, but how effective they have been in reducing the time and cost of trade transactions.
Indeed, it is important to realize that trade facilitation and paperless trade measures are very much
inter-related and that the effect of a particular measure on trade transaction costs depends on
whether, and how well, other measures have been implemented.
To further advance trade facilitation and paperless trade, Figure 23 shows implementation of trade
facilitation as a step-by step process, based on the groups of measures included in this survey. Trade
facilitation begins with the setting up of the Institutional arrangement needed to prioritize and
coordinate implementation of trade facilitation measures. The next step is to make the trade
processes more Transparent by sharing information on existing laws, regulations and procedures as
widely as possible and consulting with stakeholders when developing new ones. Designing and
implementing simpler and more efficient trade Formalities is the third step. The re-engineered and
streamlined processes may first be implemented based on paper documents, but can then be further
improved through ICT and the development of Paperless trade systems. The ultimate step is to enable
the electronic trade data and documents exchange by traders, government and service providers
within national (single window and other) systems to be used and re-used to provide stakeholders in
partner countries with the information they need to speed up the movement of goods and reduce the
overall costs of trade.13
12 See ESCAP (2014) at http://www.unescap.org/resources/estimating-benefits-cross-border-paperless-trade 13 This step-by-step process is inspired from and generally consistent with the UN/CEFACT step-by-step approach to trade facilitation towards a single window environment.

25
Figure 23: Moving up the trade facilitation ladder towards seamless international supply chains
Note: the figure shows cumulative trade facilitation implementation scores of Asia-Pacific sub-regions for 31 common trade facilitation measures included in the survey. Full implementation of all measures = 100. Source: The second UNRC survey on trade facilitation and paperless trade implementation
Going forward, digital trade facilitation offers a great opportunity to reduce trade costs and increase
trade volume for the region. Through paperless trade and seamless electronic exchange of trade data
and documents, member countries can enhance their competitiveness in global markets and increase
more effective participation in global value chains. In this respect, the Framework Agreement on
Facilitation of Cross-Border Paperless Trade in Asia and the Pacific will not only complement the WTO
TFA but also provides a unique platform for ESCAP member states to tap their potential. A recent
ESCAP publication (2017), Asia-Pacific Trade and Investment Report-Channelling Trade and Investment
into Sustainable Development, suggests that trade facilitation will result in an increase in net exports
of $16 billion annually.
In the context of 2030 Agenda for Sustainable Development, member countries should introduce and
implement new trade facilitation measures that incorporate inclusiveness and sustainability,
especially the ones that benefit SMEs and the agricultural sector, as well as the participation of women
in trade.
0
20
40
60
80
100
Performance Area
Frontier (full implementation)
Asia-Pacific
Australia-New Zealand
East and North-East Asia
North and Central Asia
South and South-West Asia
South-East Asia
Pacific Island DevelopingEconomies
Institutional arrangement
and cooperation
Transparency
Formalities
Paperless trade
Cross-border paperless
trade
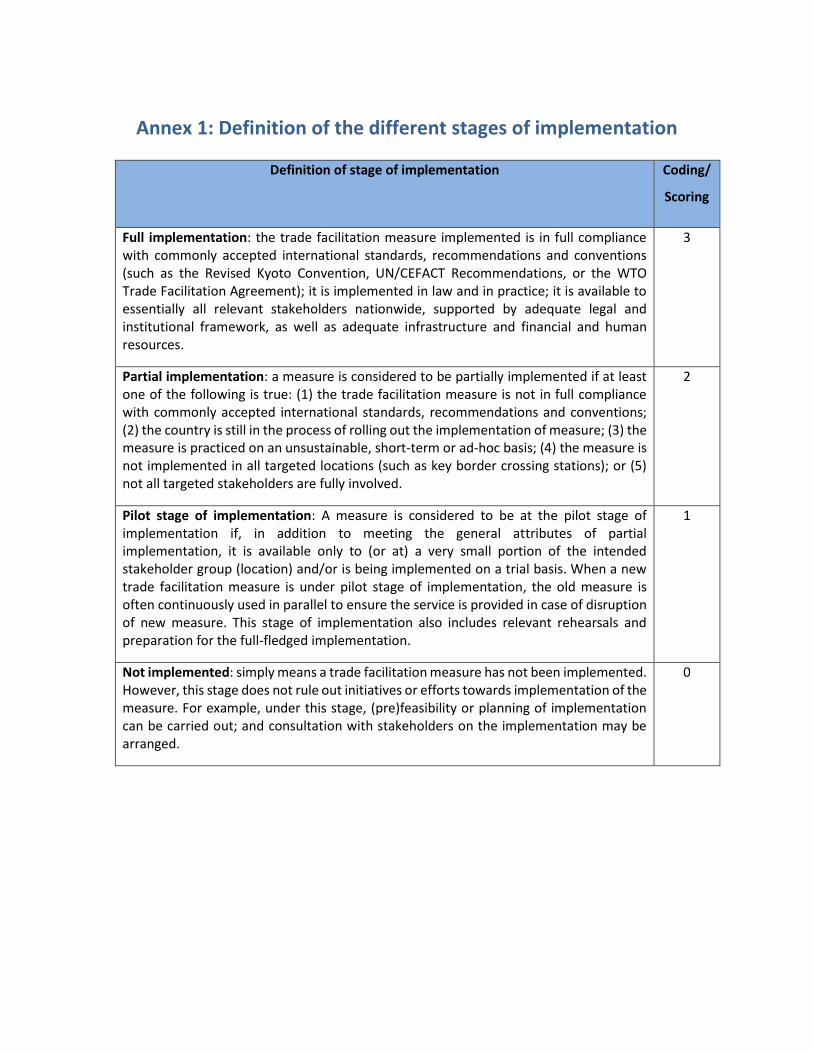
Annex 1: Definition of the different stages of implementation
Definition of stage of implementation Coding/
Scoring
Full implementation: the trade facilitation measure implemented is in full compliance with commonly accepted international standards, recommendations and conventions (such as the Revised Kyoto Convention, UN/CEFACT Recommendations, or the WTO Trade Facilitation Agreement); it is implemented in law and in practice; it is available to essentially all relevant stakeholders nationwide, supported by adequate legal and institutional framework, as well as adequate infrastructure and financial and human resources.
3
Partial implementation: a measure is considered to be partially implemented if at least one of the following is true: (1) the trade facilitation measure is not in full compliance with commonly accepted international standards, recommendations and conventions; (2) the country is still in the process of rolling out the implementation of measure; (3) the measure is practiced on an unsustainable, short-term or ad-hoc basis; (4) the measure is not implemented in all targeted locations (such as key border crossing stations); or (5) not all targeted stakeholders are fully involved.
2
Pilot stage of implementation: A measure is considered to be at the pilot stage of implementation if, in addition to meeting the general attributes of partial implementation, it is available only to (or at) a very small portion of the intended stakeholder group (location) and/or is being implemented on a trial basis. When a new trade facilitation measure is under pilot stage of implementation, the old measure is often continuously used in parallel to ensure the service is provided in case of disruption of new measure. This stage of implementation also includes relevant rehearsals and preparation for the full-fledged implementation.
1
Not implemented: simply means a trade facilitation measure has not been implemented. However, this stage does not rule out initiatives or efforts towards implementation of the measure. For example, under this stage, (pre)feasibility or planning of implementation can be carried out; and consultation with stakeholders on the implementation may be arranged.
0
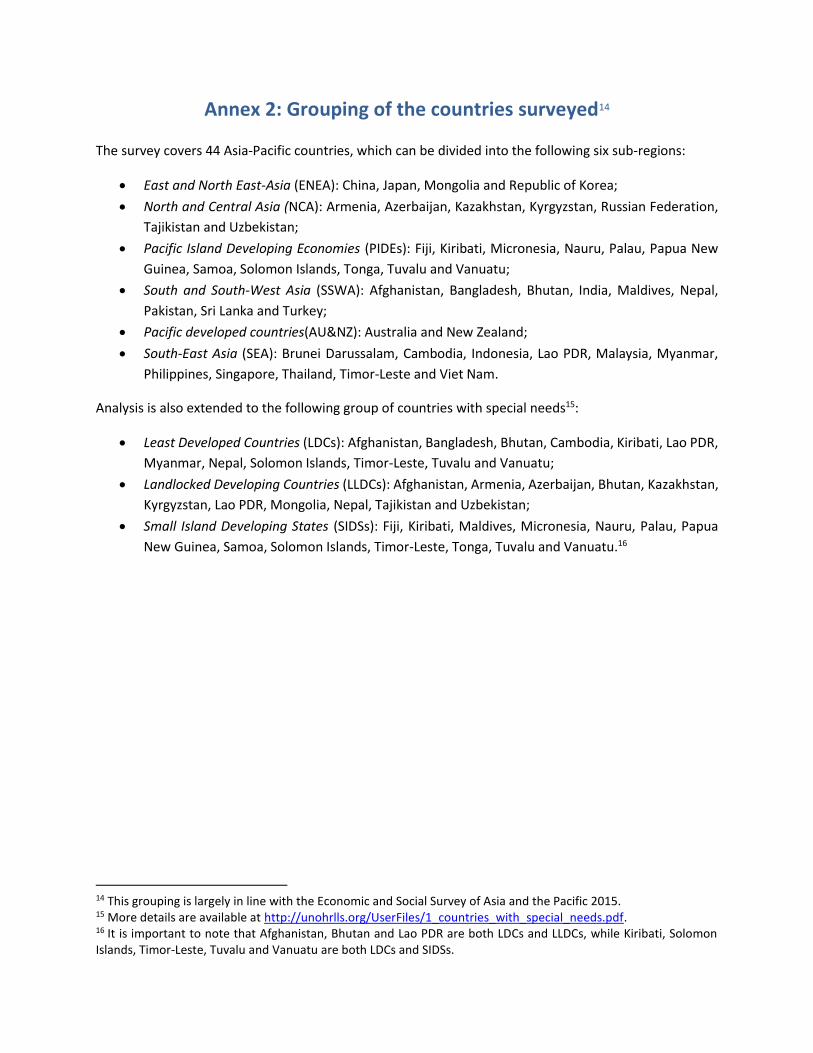
Annex 2: Grouping of the countries surveyed14
The survey covers 44 Asia-Pacific countries, which can be divided into the following six sub-regions:
• East and North East-Asia (ENEA): China, Japan, Mongolia and Republic of Korea;
• North and Central Asia (NCA): Armenia, Azerbaijan, Kazakhstan, Kyrgyzstan, Russian Federation,
Tajikistan and Uzbekistan;
• Pacific Island Developing Economies (PIDEs): Fiji, Kiribati, Micronesia, Nauru, Palau, Papua New
Guinea, Samoa, Solomon Islands, Tonga, Tuvalu and Vanuatu;
• South and South-West Asia (SSWA): Afghanistan, Bangladesh, Bhutan, India, Maldives, Nepal,
Pakistan, Sri Lanka and Turkey;
• Pacific developed countries(AU&NZ): Australia and New Zealand;
• South-East Asia (SEA): Brunei Darussalam, Cambodia, Indonesia, Lao PDR, Malaysia, Myanmar,
Philippines, Singapore, Thailand, Timor-Leste and Viet Nam.
Analysis is also extended to the following group of countries with special needs15:
• Least Developed Countries (LDCs): Afghanistan, Bangladesh, Bhutan, Cambodia, Kiribati, Lao PDR,
Myanmar, Nepal, Solomon Islands, Timor-Leste, Tuvalu and Vanuatu;
• Landlocked Developing Countries (LLDCs): Afghanistan, Armenia, Azerbaijan, Bhutan, Kazakhstan,
Kyrgyzstan, Lao PDR, Mongolia, Nepal, Tajikistan and Uzbekistan;
• Small Island Developing States (SIDSs): Fiji, Kiribati, Maldives, Micronesia, Nauru, Palau, Papua
New Guinea, Samoa, Solomon Islands, Timor-Leste, Tonga, Tuvalu and Vanuatu.16
14 This grouping is largely in line with the Economic and Social Survey of Asia and the Pacific 2015. 15 More details are available at http://unohrlls.org/UserFiles/1_countries_with_special_needs.pdf. 16 It is important to note that Afghanistan, Bhutan and Lao PDR are both LDCs and LLDCs, while Kiribati, Solomon Islands, Timor-Leste, Tuvalu and Vanuatu are both LDCs and SIDSs.
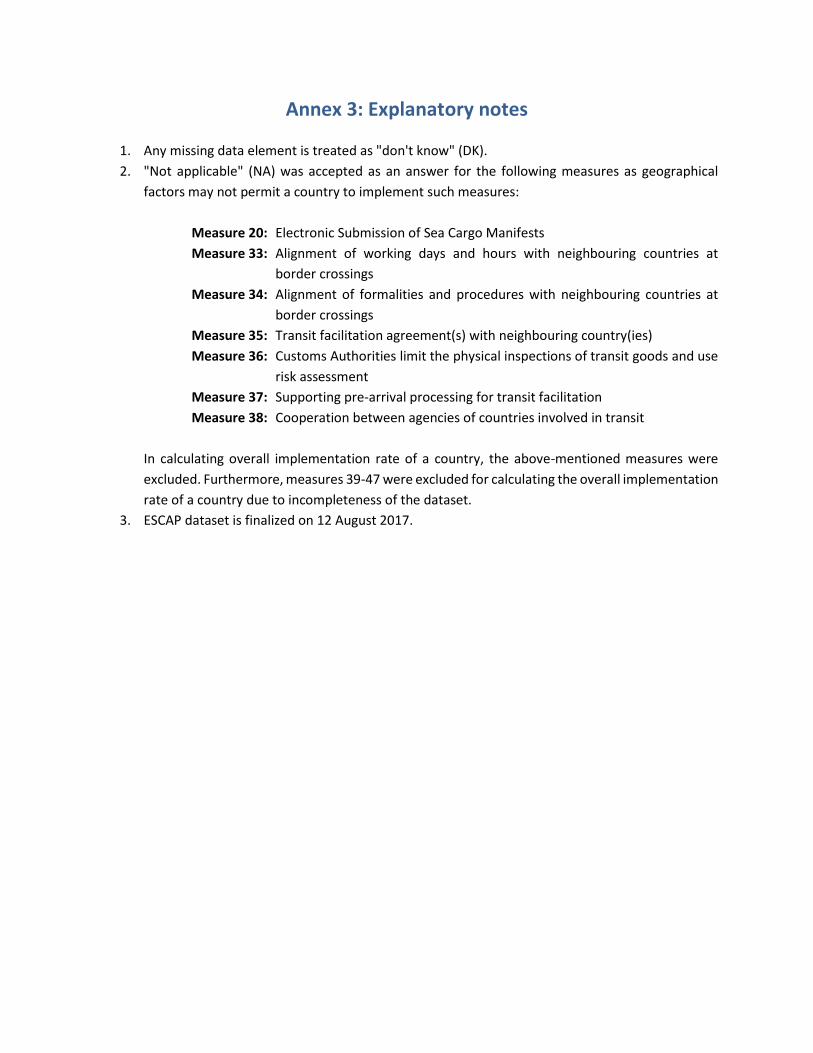
Annex 3: Explanatory notes
1. Any missing data element is treated as "don't know" (DK).
2. "Not applicable" (NA) was accepted as an answer for the following measures as geographical
factors may not permit a country to implement such measures:
Measure 20: Electronic Submission of Sea Cargo Manifests
Measure 33: Alignment of working days and hours with neighbouring countries at
border crossings
Measure 34: Alignment of formalities and procedures with neighbouring countries at
border crossings
Measure 35: Transit facilitation agreement(s) with neighbouring country(ies)
Measure 36: Customs Authorities limit the physical inspections of transit goods and use
risk assessment
Measure 37: Supporting pre-arrival processing for transit facilitation
Measure 38: Cooperation between agencies of countries involved in transit
In calculating overall implementation rate of a country, the above-mentioned measures were
excluded. Furthermore, measures 39-47 were excluded for calculating the overall implementation
rate of a country due to incompleteness of the dataset.
3. ESCAP dataset is finalized on 12 August 2017.

United Nations
Economic and Social Commission for Asia and the Pacific
Trade, Investment and Innovation Division
United Nations Building, Ratchadamnoen Nok Avenue
Bangkok 10200, Thailand
Email: [email protected]
Website: www.unescap.org