Embed Size (px)
Citation preview
esd113.org
ESD 113Your partner for learning solutions
Early Learning Data InstituteUsing the Cycle of Inquiry and
Action For Program Improvement
Welcome and Introductions
2
ESD 113Your partner for learning solutions
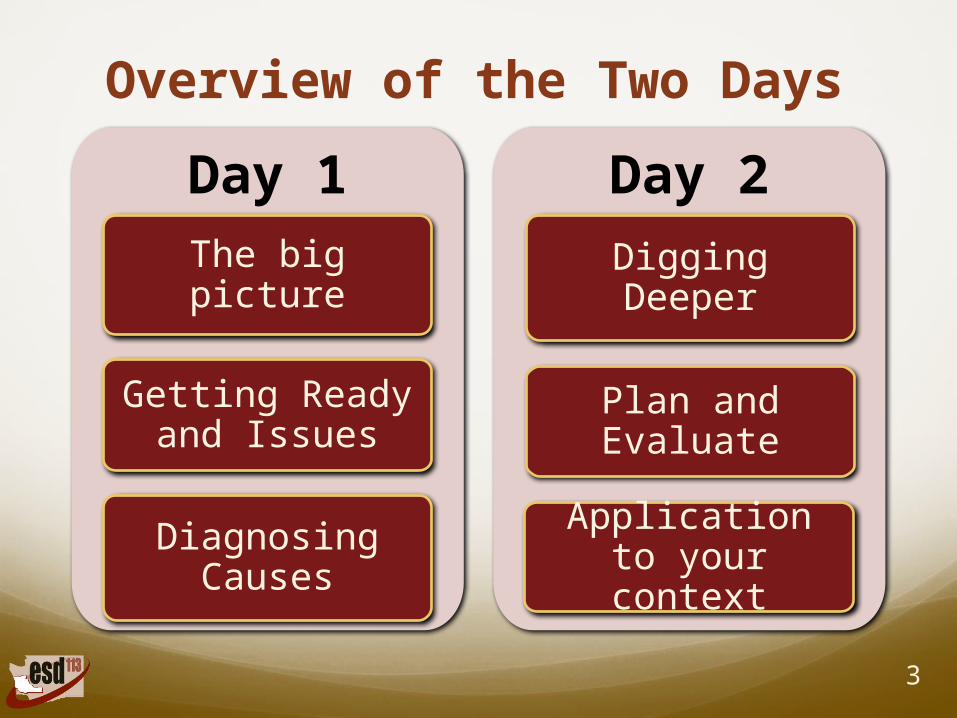
Overview of the Two Days
3
Day 1
The big picture
Getting Ready and Issues
Day 2
Application to your context
Plan and Evaluate
Diagnosing Causes
Digging Deeper
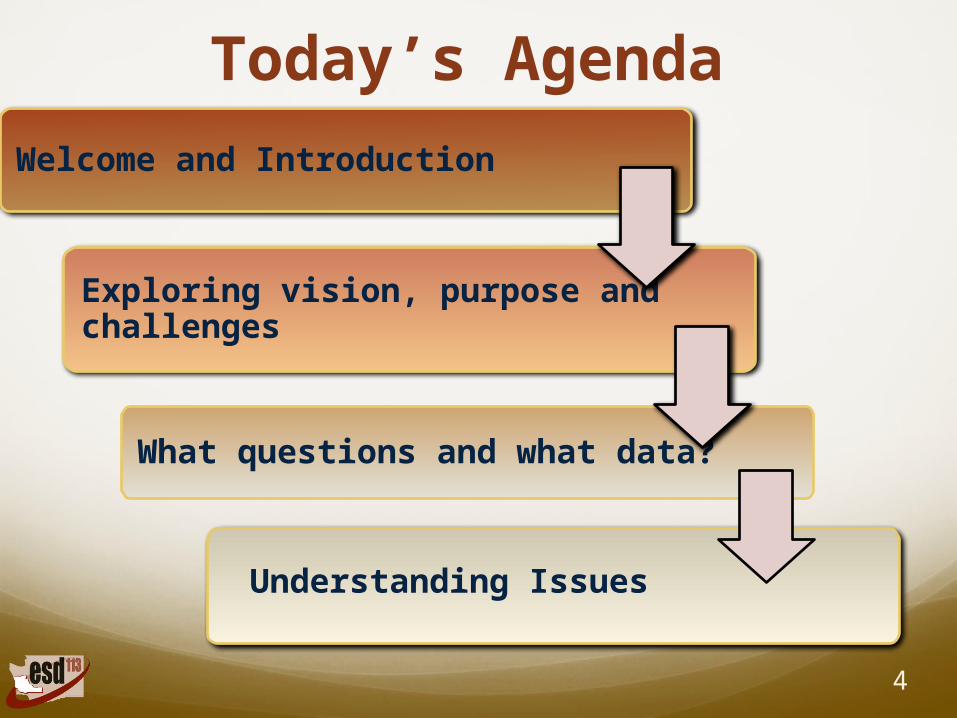
Today’s Agenda
4
Welcome and Introduction
Exploring vision, purpose and challenges
What questions and what data?
Understanding Issues
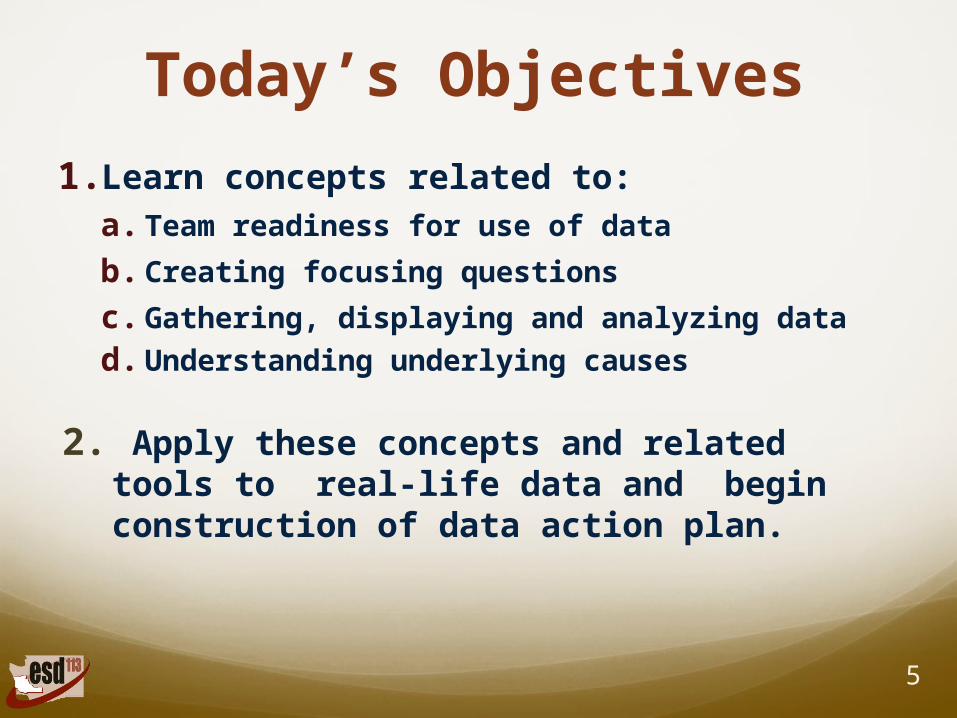
Today’s Objectives
1.Learn concepts related to:a. Team readiness for use of data
b. Creating focusing questions
c. Gathering, displaying and analyzing datad. Understanding underlying causes
2. Apply these concepts and related tools to real-life data and begin construction of data action plan.
5
The Big Picture
Priority #1: Explore and adapt a toolset that will support teams to systemically improve how they use data.
Priority #2: Build capacity to sustain and expand the use of data in systemic improvement and prepare a plan for application of new learning.
6
To download materials:
esd113.org/datacoach
Click “Early Learning Institute” link (on left menu bar)
-or-
esd113.org/page/1529
7
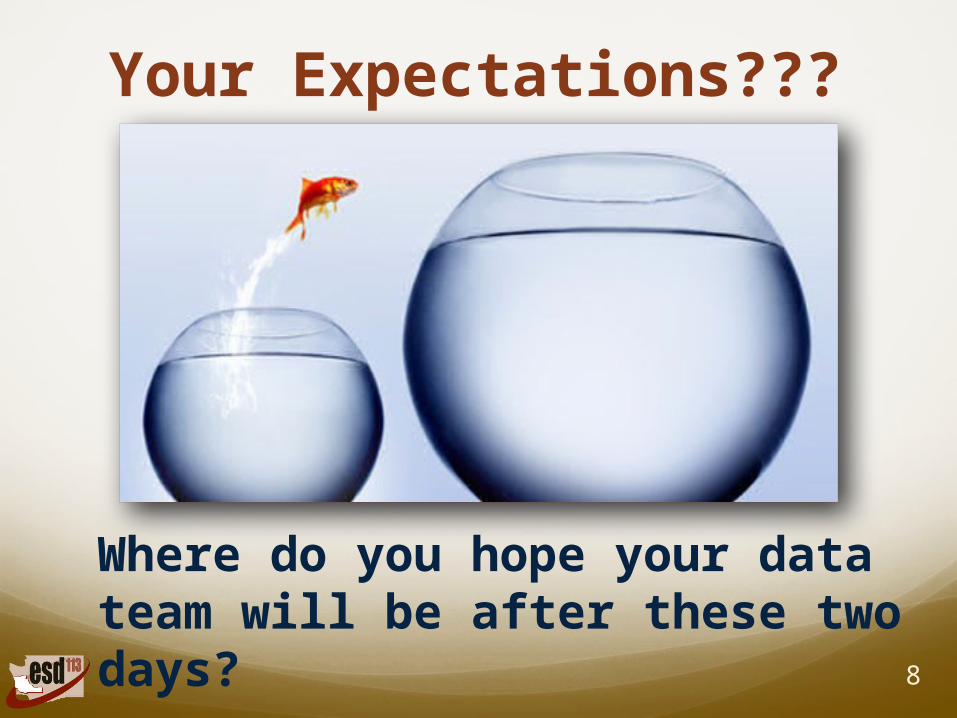
Your Expectations???
Where do you hope your data team will be after these two days? 8
1.0 Getting Ready –
9
ESD 113Your partner for learning solutions

Don’t Be Puzzled!
10
11
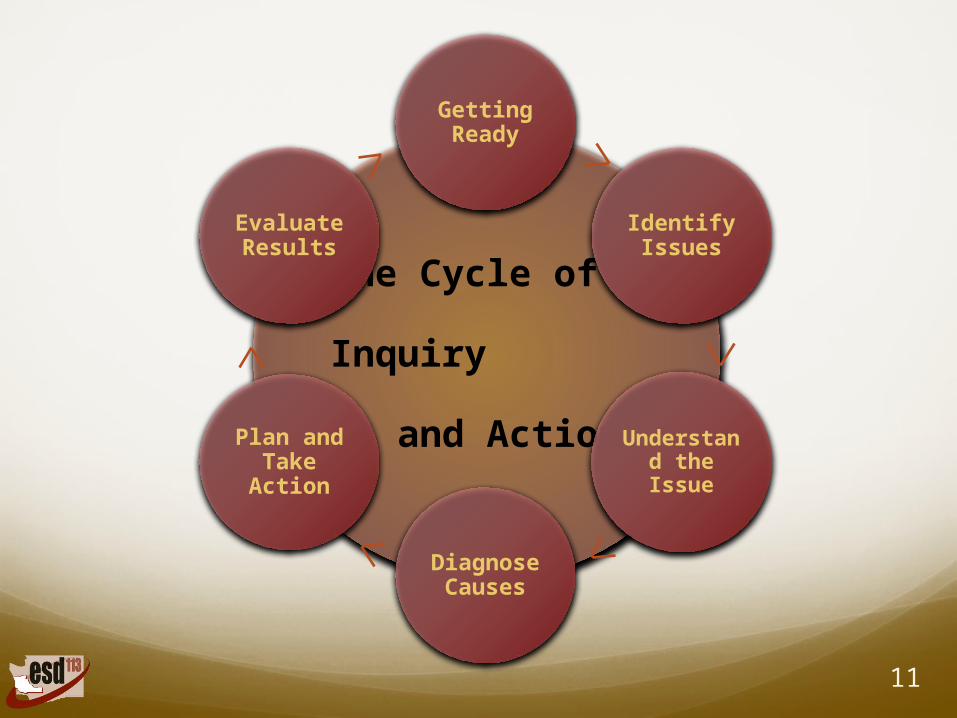
The Cycle of Inquiry
and Action
Getting Ready
Identify Issues
Understand the Issue
Diagnose Causes
Plan and Take
Action
Evaluate Results
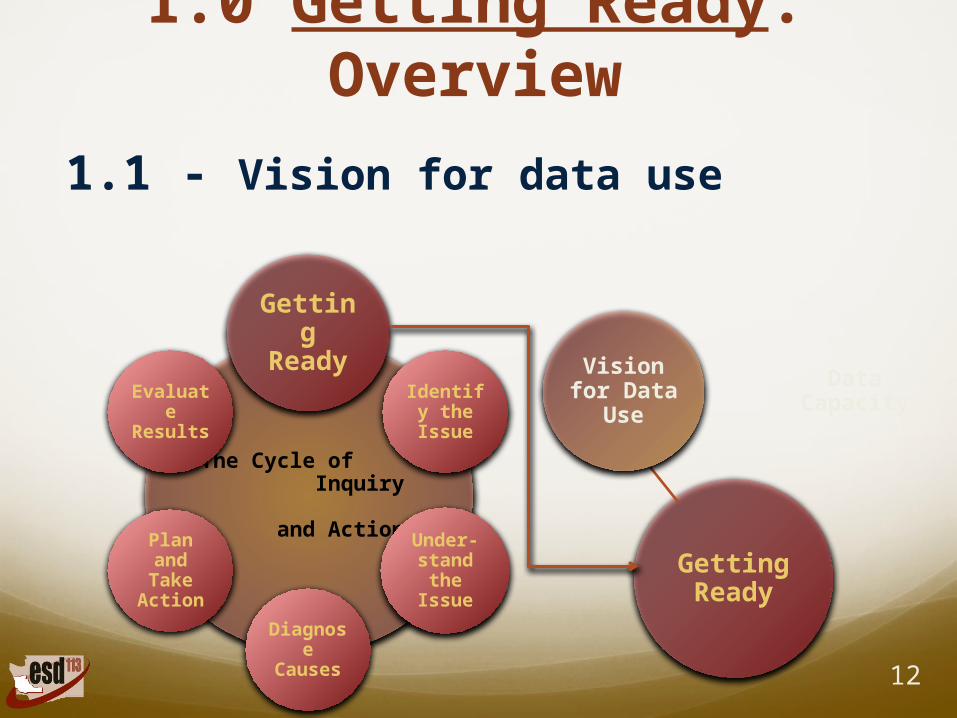
1.0 Getting Ready: Overview
1.1 - Vision for data use
12
Getting Ready
Data Capacit
y
Vision for Data
Use
The Cycle of Inquiry and Action
Getting
ReadyIdentify
the Issue
Under-stand the
Issue
Diagnose
Causes
Plan and Take
Action
Evaluate
Results
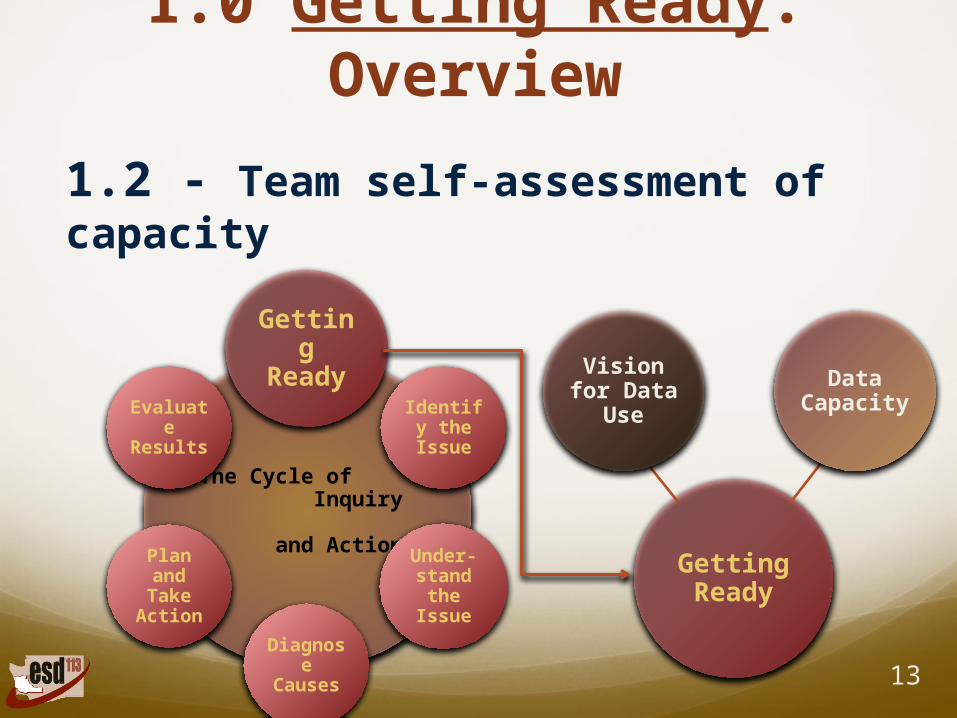
1.0 Getting Ready: Overview
1.2 - Team self-assessment of capacity
13
Getting Ready
Data Capacit
y
Vision for Data
Use
The Cycle of Inquiry and Action
Getting
ReadyIdentify
the Issue
Under-stand the
Issue
Diagnose
Causes
Plan and Take
Action
Evaluate
Results

1.1/1.2 Self-Assessment: Vision and Capacity
14
1.1/1.2 Self-Assessment: Vision and Capacity
15
Debrief with Team/Journal: Getting Ready Steps 1.1 - 1.2)
Questions???
16
2.0 Identify Issues
17
ESD 113Your partner for learning solutions
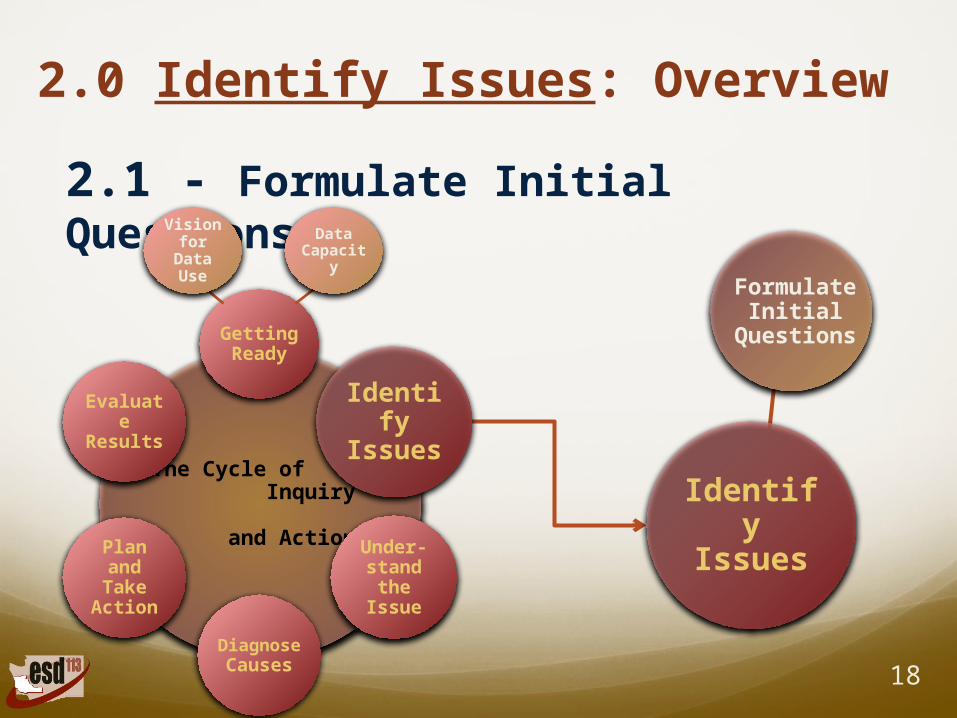
2.0 Identify Issues: Overview
2.1 - Formulate Initial Questions
18
Identify Issues
Formulate Initial
Questions
The Cycle of Inquiry and Action
Getting Ready
Identify
Issues
Under-stand the
Issue
Diagnose
Causes
Plan and Take
Action
Evaluate
Results
Data Capacit
y
Vision for
Data Use
2.1 Identify Issues: Questions
1. Your response to the issue(s) underlying the question is under your direct control.
2. Addressing the issue will be significant in terms of helping children.
19
2.1 Identify Issues: Scenario
KIDS FIRST, INC.
Head Start
20
ESD 113Your partner for learning solutions
2.1 Identify Issues: Questions
21
2.1 Identify Issues: Questions
As a group: Review document 2.1a Early Learning
Questions
Use documents 2.1b Identifying and Prioritizing Significant Issues to select an issue appropriate to your program(s) or center(s)
Use document 2.1c Developing Focusing Questions to Initiate Inquiry to formulate your own focusing question.
Complete the top three sections of the Problem Statement Worksheet. 22
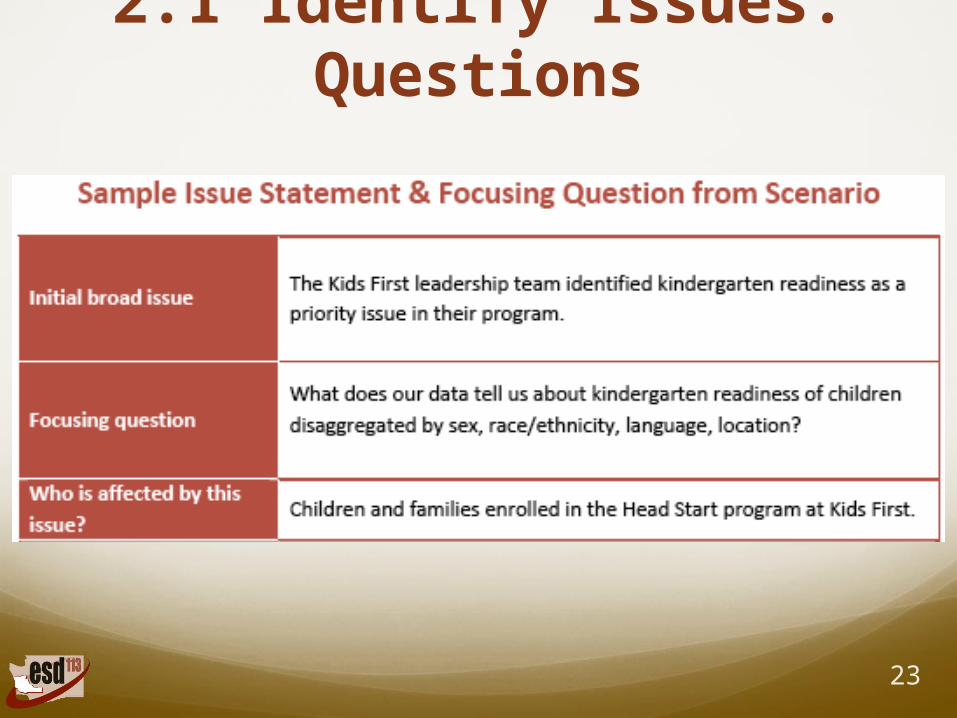
2.1 Identify Issues: Questions
23
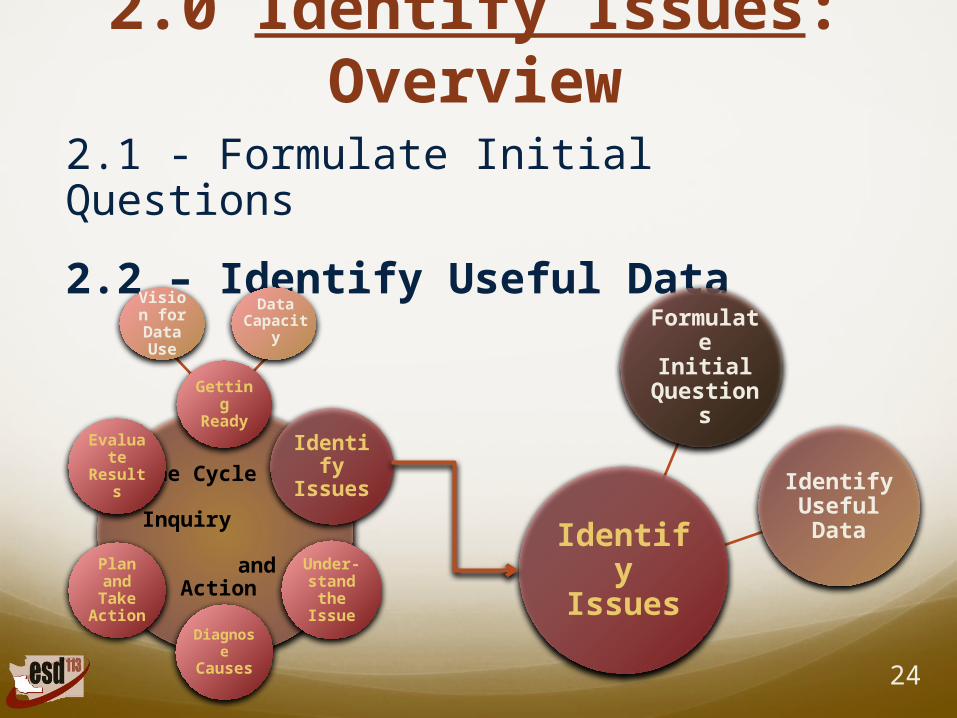
2.0 Identify Issues: Overview
2.1 - Formulate Initial Questions
2.2 – Identify Useful Data
24
Identify Issues
Identify Useful Data
Formulate Initial
Questions
Data Capacit
y
Vision for
Data Use
The Cycle of Inquiry and Action
Getting
Ready
Identify
Issues
Under-stand the
IssueDiagno
se Causes
Plan and Take
Action
Evaluate
Results
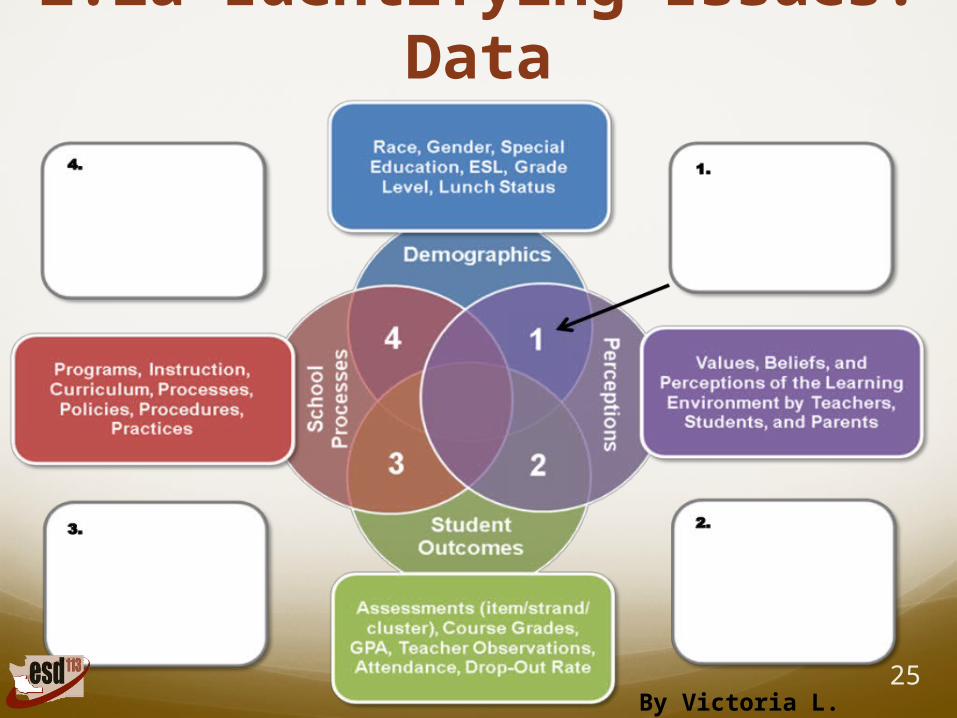
2.2a Identifying Issues: Data
25By Victoria L. Bernhardt
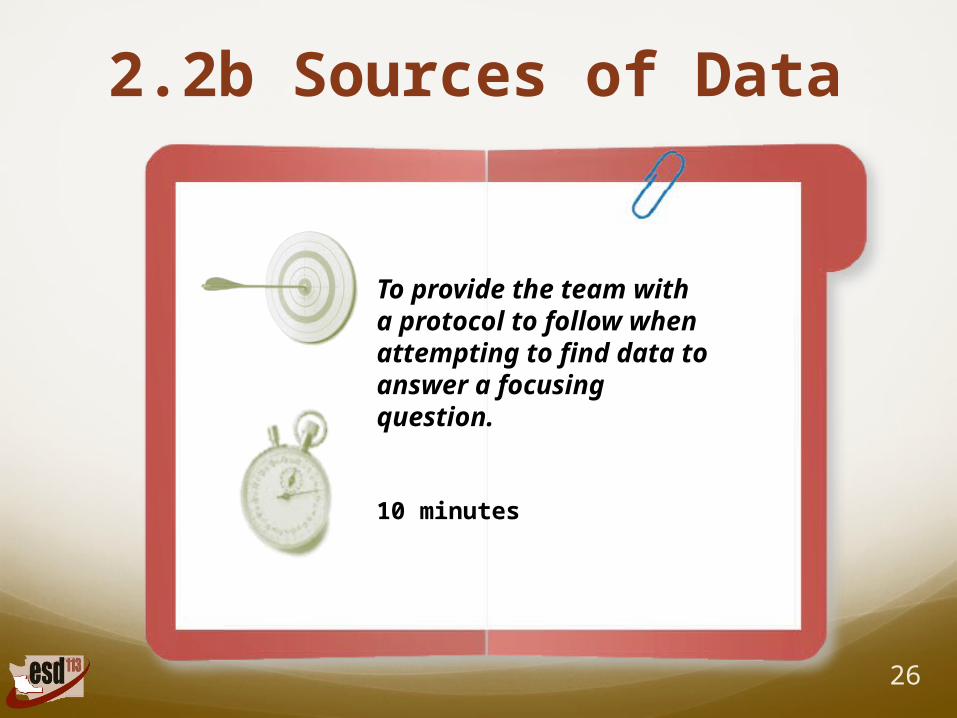
2.2b Sources of Data
26
To provide the team with a protocol to follow when attempting to find data to answer a focusing question.
10 minutes
Debrief with Team/Journal:Identify Issues 2.1 & 2.2
Finish Process Summary, Stages 1 & 2
27
Lunchtime!
28
ESD 113Your partner for learning solutions
3.0 Understand Issues
29
ESD 113Your partner for learning solutions
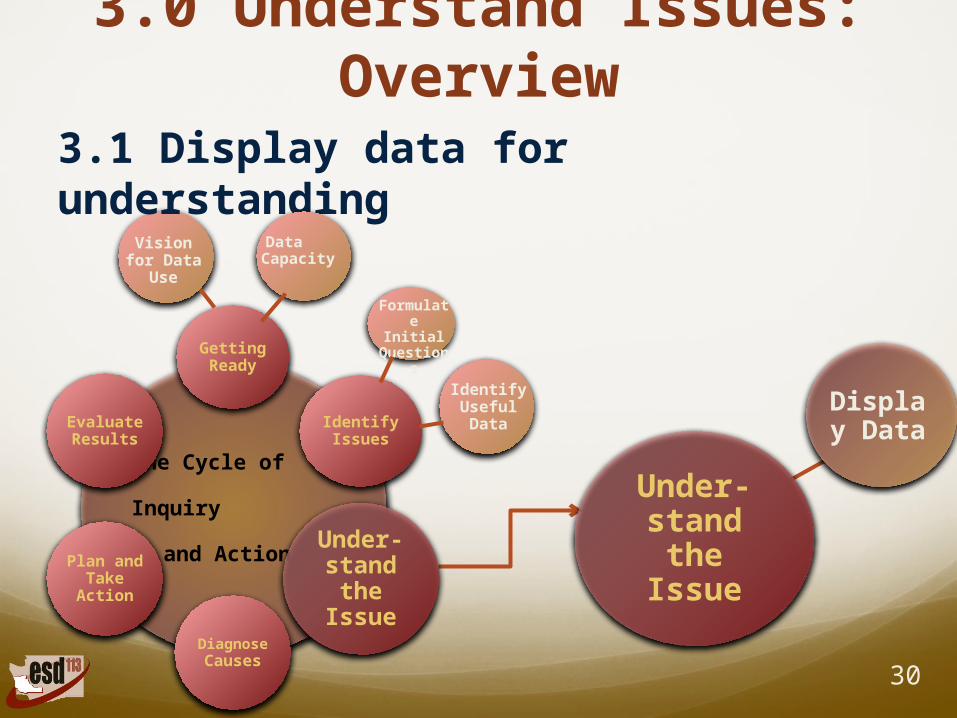
3.0 Understand Issues: Overview
3.1 Display data for understanding
30
The Cycle of Inquiry
and Action
Getting Ready
Identify Issues
Under-stand the
IssueDiagnose Causes
Plan and Take
Action
Evaluate Results
Vision for Data
Use
Data Capacity
Identify Useful Data
Formulate Initial
Questions
Under-stand the
Issue
Display Data
3.1a Data Display Checklist
31
As a team use documents 3.1a to evaluate the quality of the data display in document 3.1b
10 Minutes
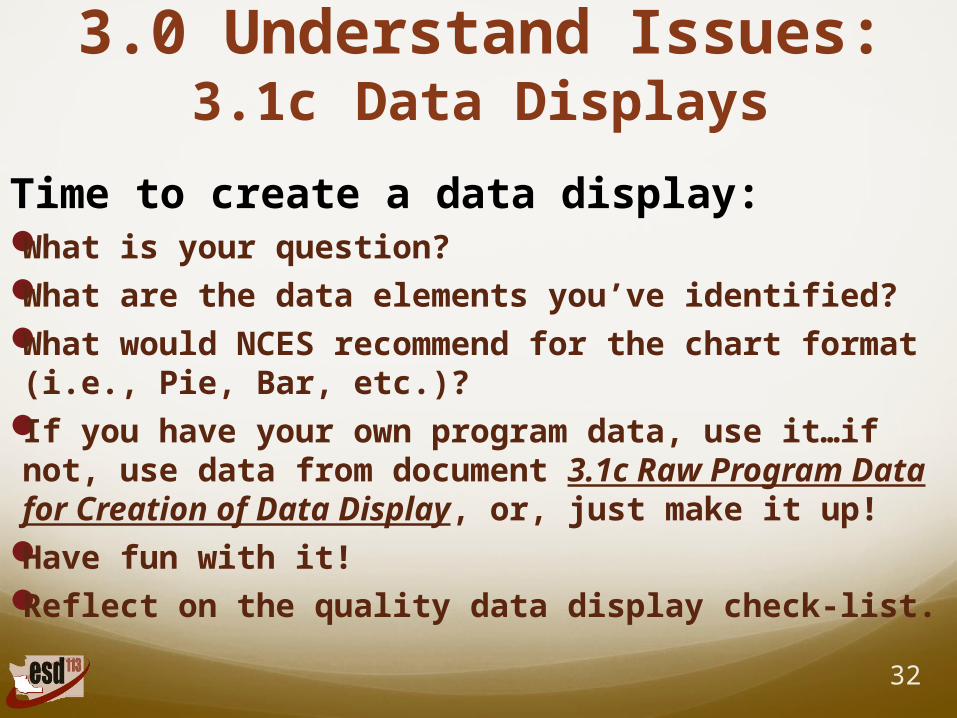
3.0 Understand Issues:3.1c Data Displays
Time to create a data display:What is your question?What are the data elements you’ve identified?What would NCES recommend for the chart
format (i.e., Pie, Bar, etc.)? If you have your own program data, use it…if
not, use data from document 3.1c Raw Program Data for Creation of Data Display, or, just make it up!
Have fun with it!Reflect on the quality data display check-list. 32
33
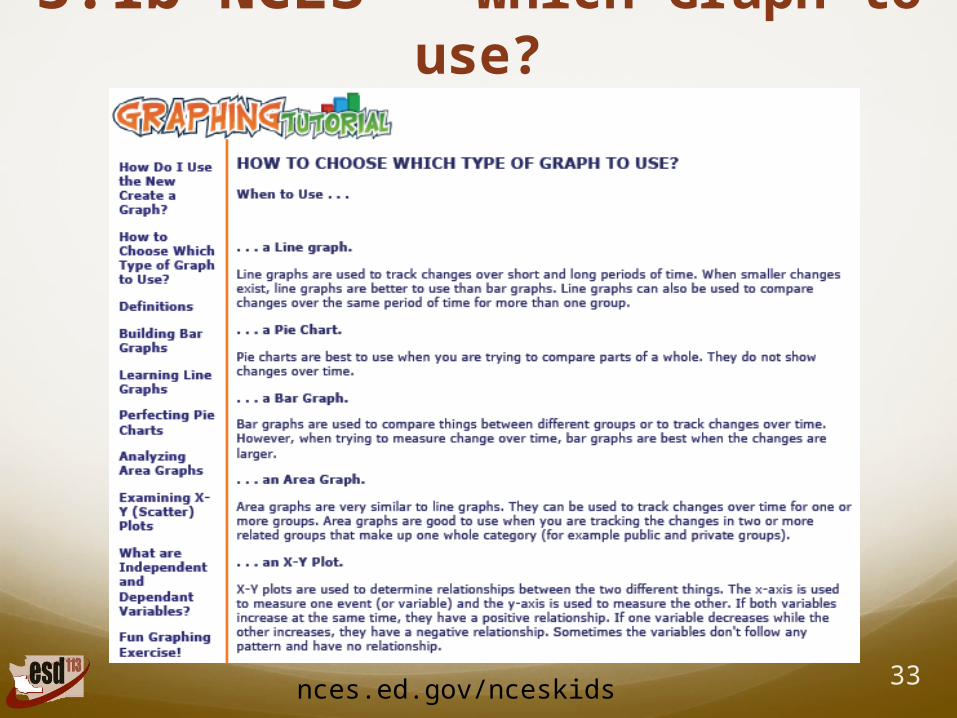
3.1b NCES – Which Graph to use?
nces.ed.gov/nceskids
The Cycle of Inquiry
and Action
Getting Ready
Identify Issues
Under-stand the
IssueDiagnose Causes
Plan and Take
Action
Evaluate Results
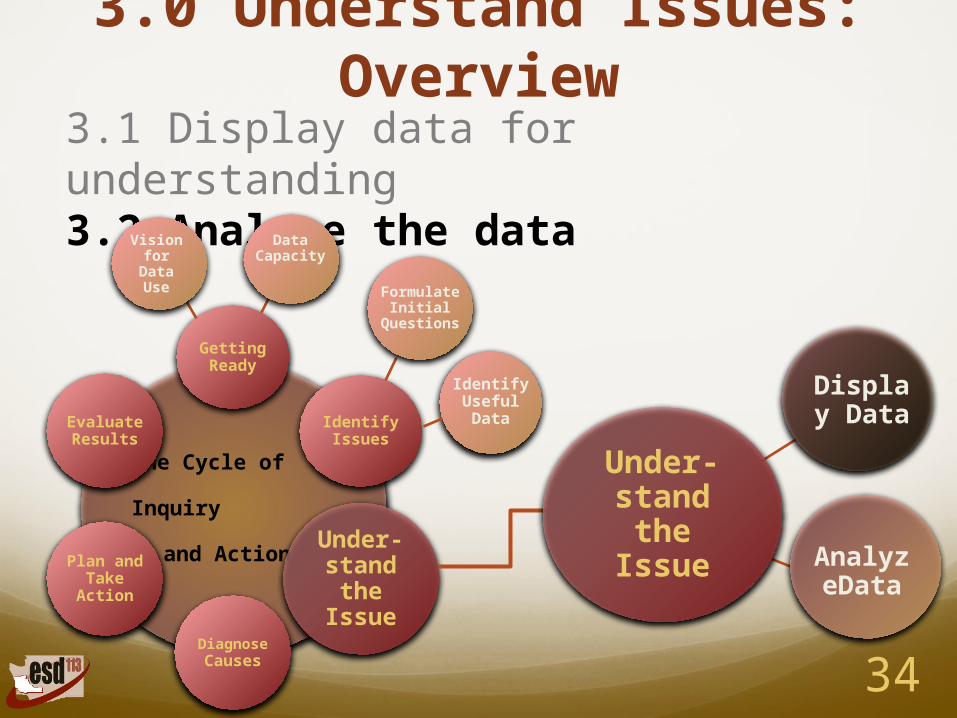
3.0 Understand Issues: Overview
3.1 Display data for understanding3.2 Analyze the data
34
Identify Useful Data
Under-stand the
Issue
Display Data
AnalyzeData
Vision for Data
Use
Data Capacity
Formulate Initial
Questions

3.2 Analyze Data: Data Carousel
35Video
Factual Observations
A statement about what the data say without any interpretation.
Factual observations are the first step in the data analysis process and they provide the basis for making sound inferences.
• Not all observations are “factual”
• Observations can be colored by biases, assumptions, prejudice
36
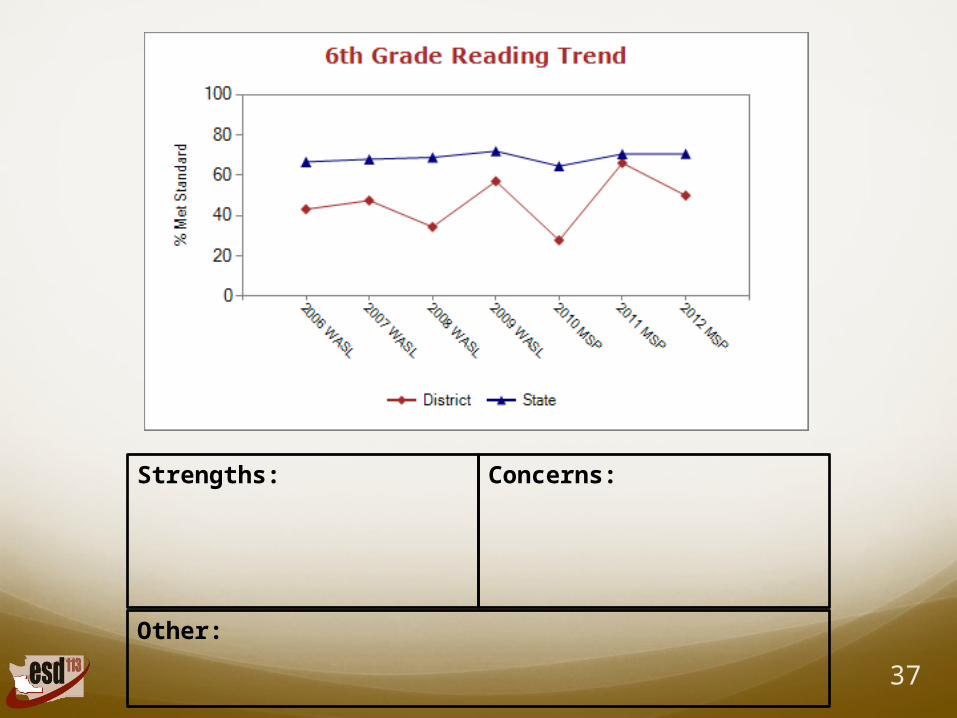
37
Strengths: Concerns:
Other:
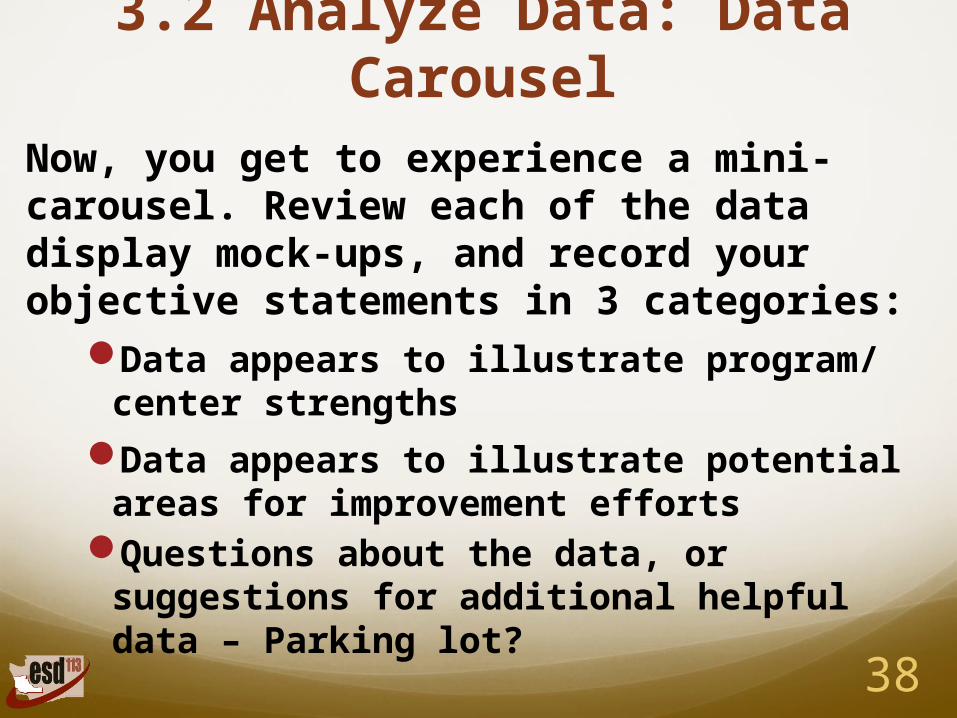
3.2 Analyze Data: Data Carousel
Now, you get to experience a mini-carousel. Review each of the data display mock-ups, and record your objective statements in 3 categories:
Data appears to illustrate program/ center strengths
Data appears to illustrate potential areas for improvement efforts
Questions about the data, or suggestions for additional helpful data – Parking lot?
38
Debrief with Team/Journal: Understand
Issues 3.1 and 3.2
39

Let’s Take a Break…
40
Let’s Recap-
Example Focusing Question:
What does our data tell us about kindergarten readiness of children disaggregated by sex, race/ethnicity, language, location?
41
Summarize and Prioritize “Concerns”
CommentsGroup post-it notes into themes or
affinity groups
Use sticky dots to allow each team member to rank the theme/affinity groups
If you have numerous concerns to rank, narrow to 2 or 3 “big dang deals”, then reprioritize using to identify the top issue
42
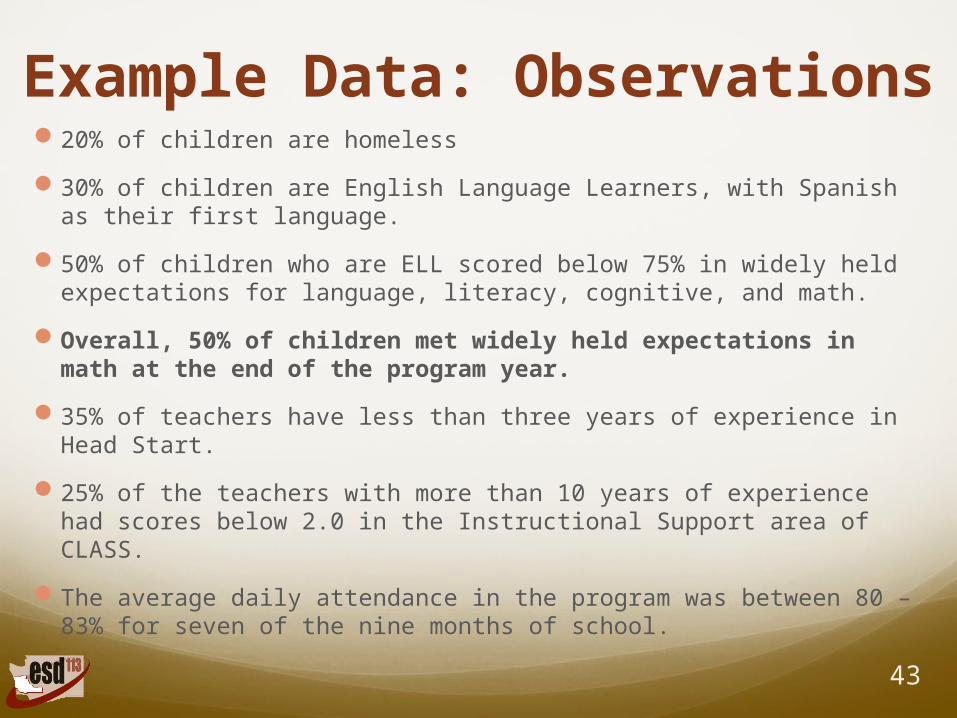
Example Data: Observations 20% of children are homeless
30% of children are English Language Learners, with Spanish as their first language.
50% of children who are ELL scored below 75% in widely held expectations for language, literacy, cognitive, and math.
Overall, 50% of children met widely held expectations in math at the end of the program year.
35% of teachers have less than three years of experience in Head Start.
25% of the teachers with more than 10 years of experience had scores below 2.0 in the Instructional Support area of CLASS.
The average daily attendance in the program was between 80 – 83% for seven of the nine months of school.
43
3.0 Understand Issues
44
4.0 Diagnose Cause(s)
45
ESD 113Your partner for learning solutions
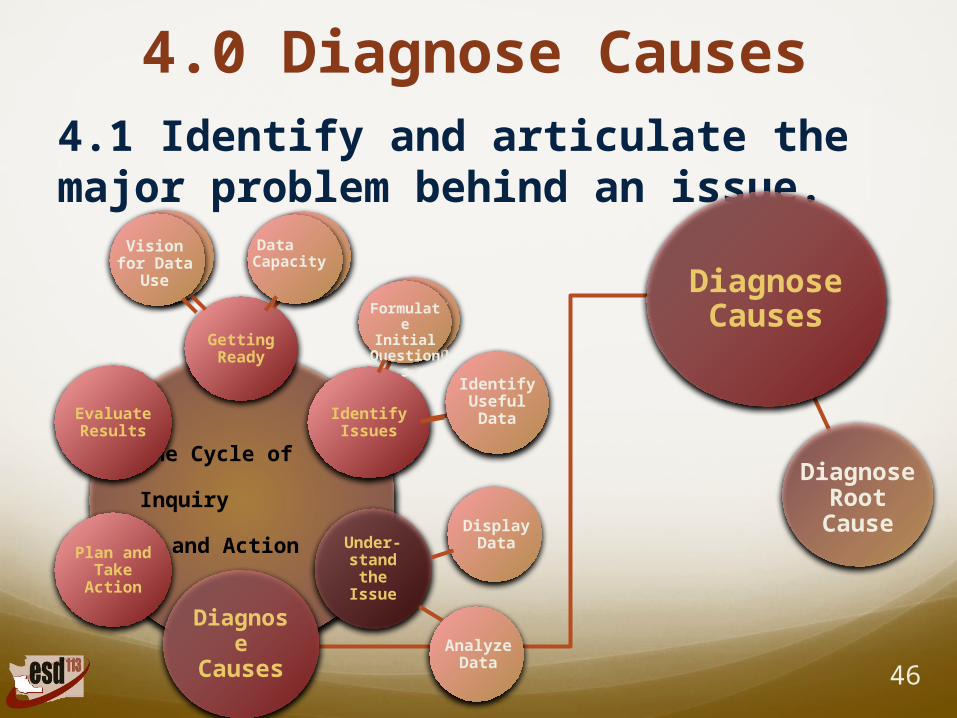
4.0 Diagnose Causes4.1 Identify and articulate the major problem behind an issue.
46
Diagnose Causes
Diagnose Root
Cause
Vision for Data
Use
Display Data
Analyze Data
The Cycle of Inquiry
and Action
Getting Ready
Identify Issues
Under-stand the
Issue
Diagnose
Causes
Plan and Take
Action
Evaluate Results
Vision for Data
Use
Data Capacity
Formulate Initial
Questions
Identify Useful Data
Vision for Data
Use
Data Capacity
Formulate Initial
Questions
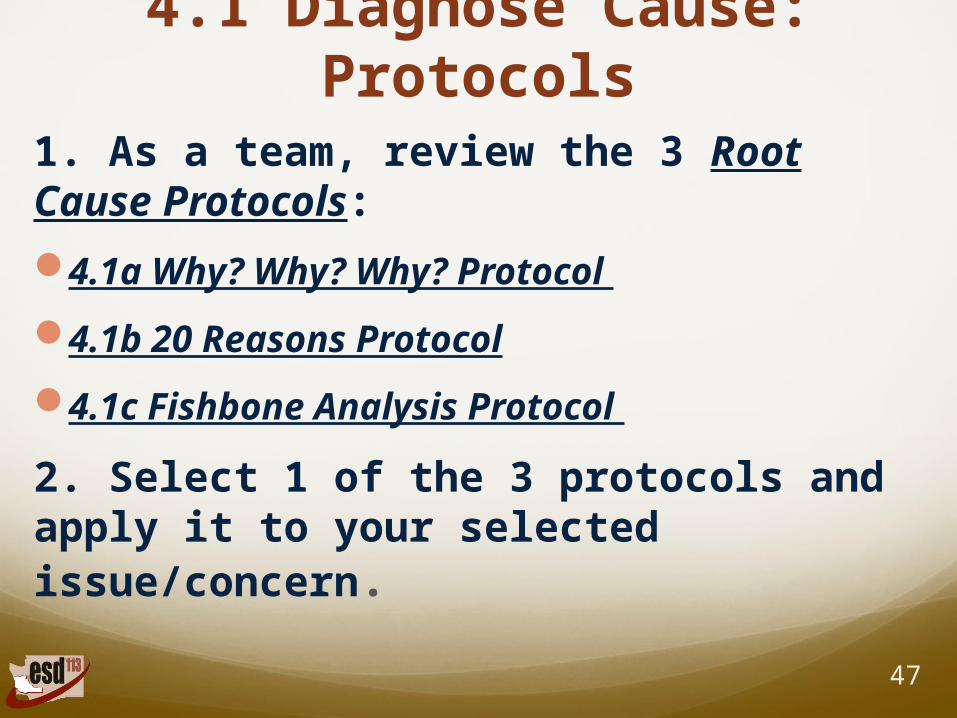
4.1 Diagnose Cause: Protocols
1. As a team, review the 3 Root Cause Protocols:
4.1a Why? Why? Why? Protocol
4.1b 20 Reasons Protocol
4.1c Fishbone Analysis Protocol
2. Select 1 of the 3 protocols and apply it to your selected issue/concern.
47
4.0 Diagnose Causes
48
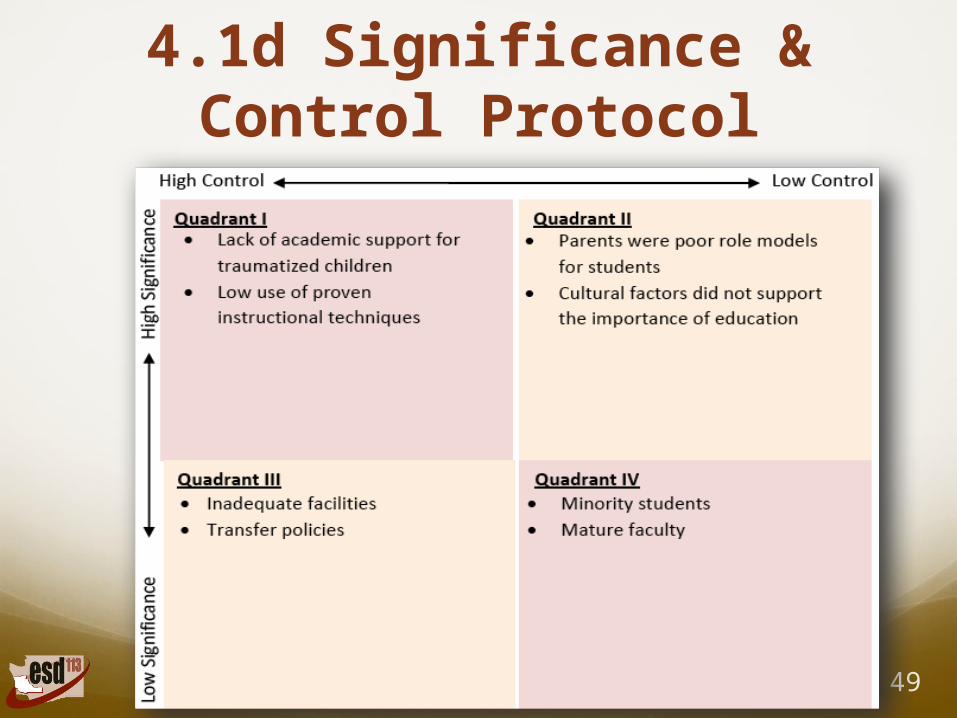
4.1d Significance & Control Protocol
49
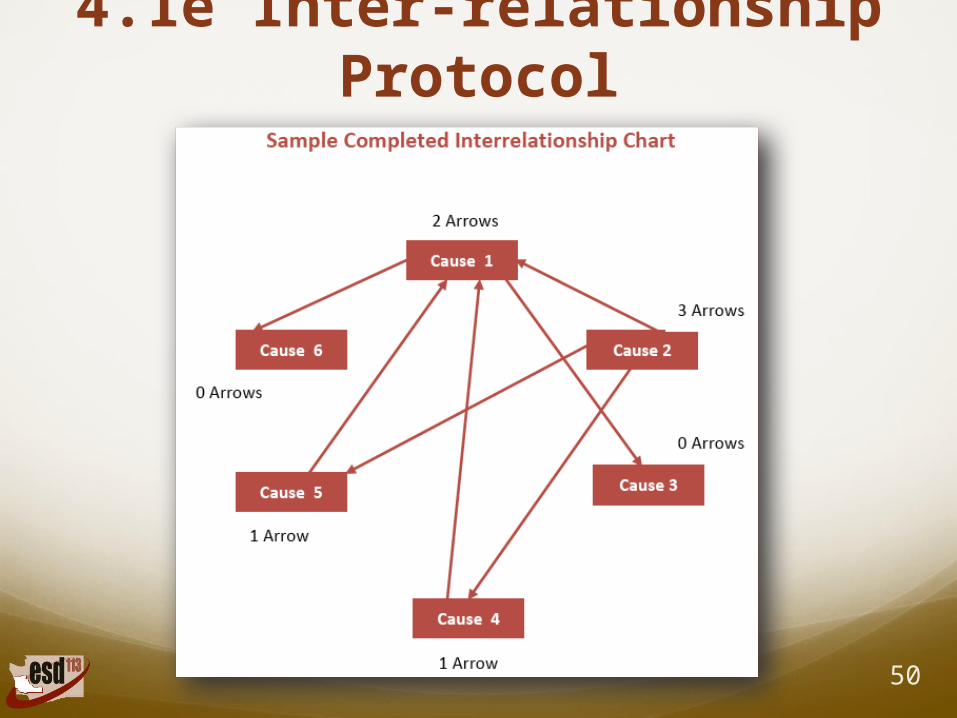
4.1e Inter-relationship Protocol
50
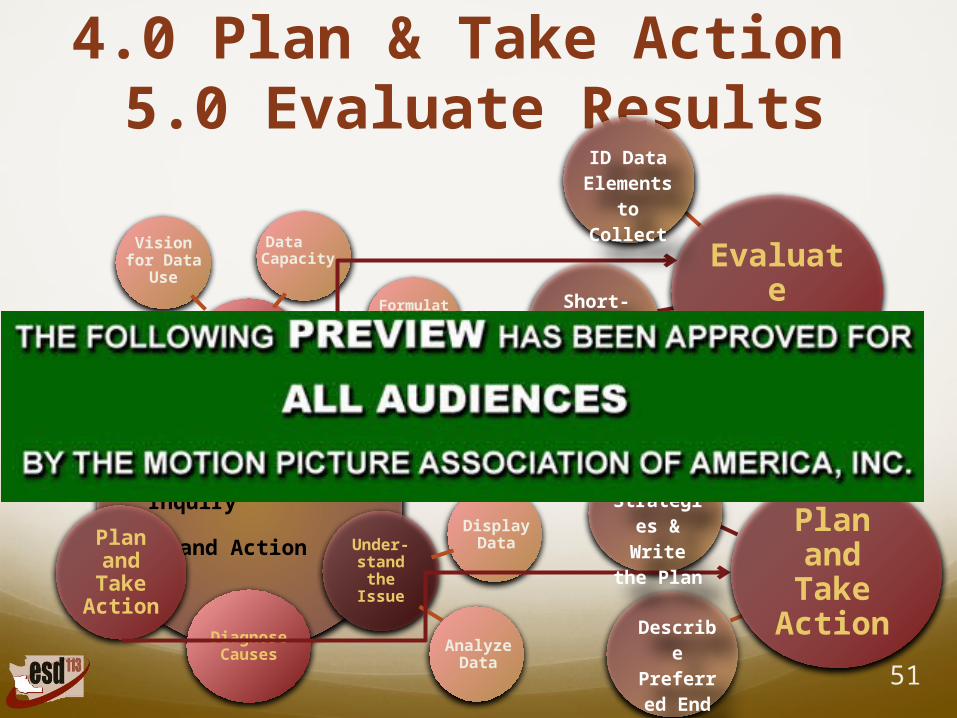
4.0 Plan & Take Action 5.0 Evaluate Results
51
Vision for Data
Use
Display Data
Analyze Data
The Cycle of Inquiry
and Action
Getting Ready
Identify Issues
Under-stand the
Issue
Diagnose Causes
Plan and Take
Action
Evaluate
Results
Vision for Data
Use
Data Capacity
Formulate Initial
Questions
Identify Useful Data
Plan and Take
ActionDescribe
Preferred End State
Select Strategies & Write the Plan
Evaluate
ResultsShort-
Term, & Long-Term
Goals
ID Data Element
s to Collect
Debrief with Team/Journal: Complete Process Summary -
Stages 3 and 4Questions?
52
EXIT TASK
53
Preparation for Day 2:
As a data team, complete your protocols and template (through 4.1).

End of day and debrief
54