Embed Size (px)
Citation preview
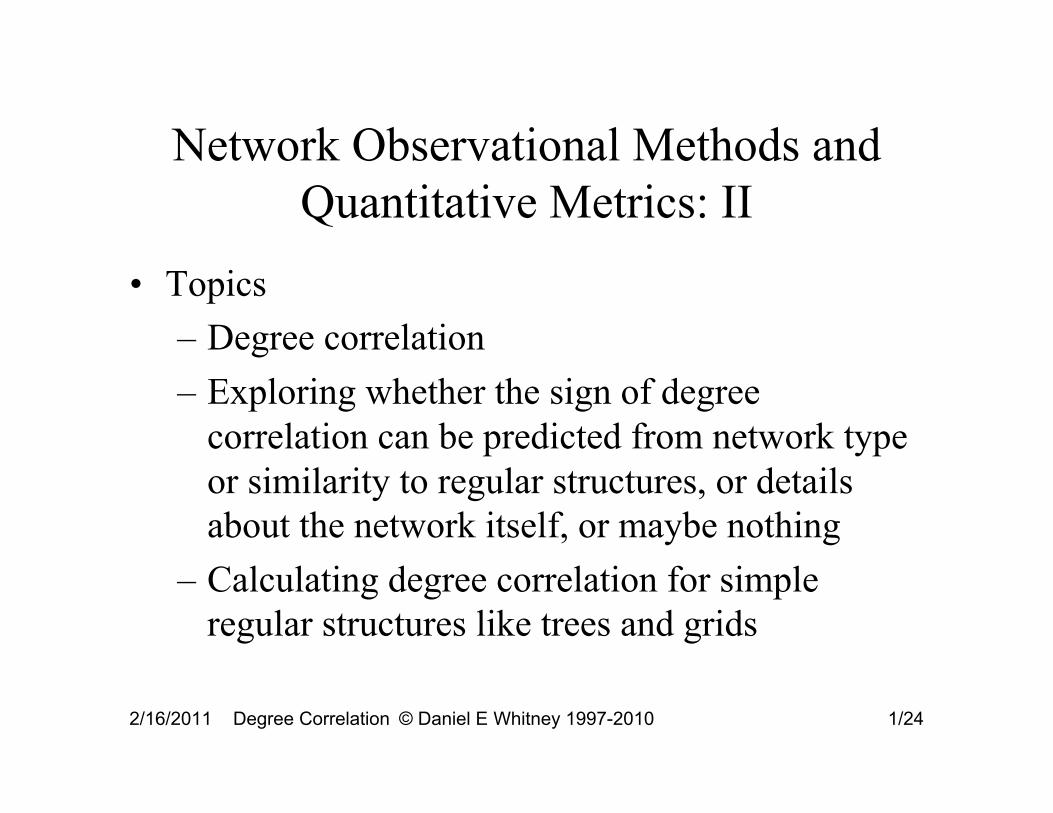
Network Observational Methods and Quantitative Metrics: II
• Topics – Degree correlation – Exploring whether the sign of degree
correlation can be predicted from network type or similarity to regular structures, or details about the network itself, or maybe nothing
– Calculating degree correlation for simple regular structures like trees and grids
2/16/2011 Degree Correlation © Daniel E Whitney 1997-2010 1/24
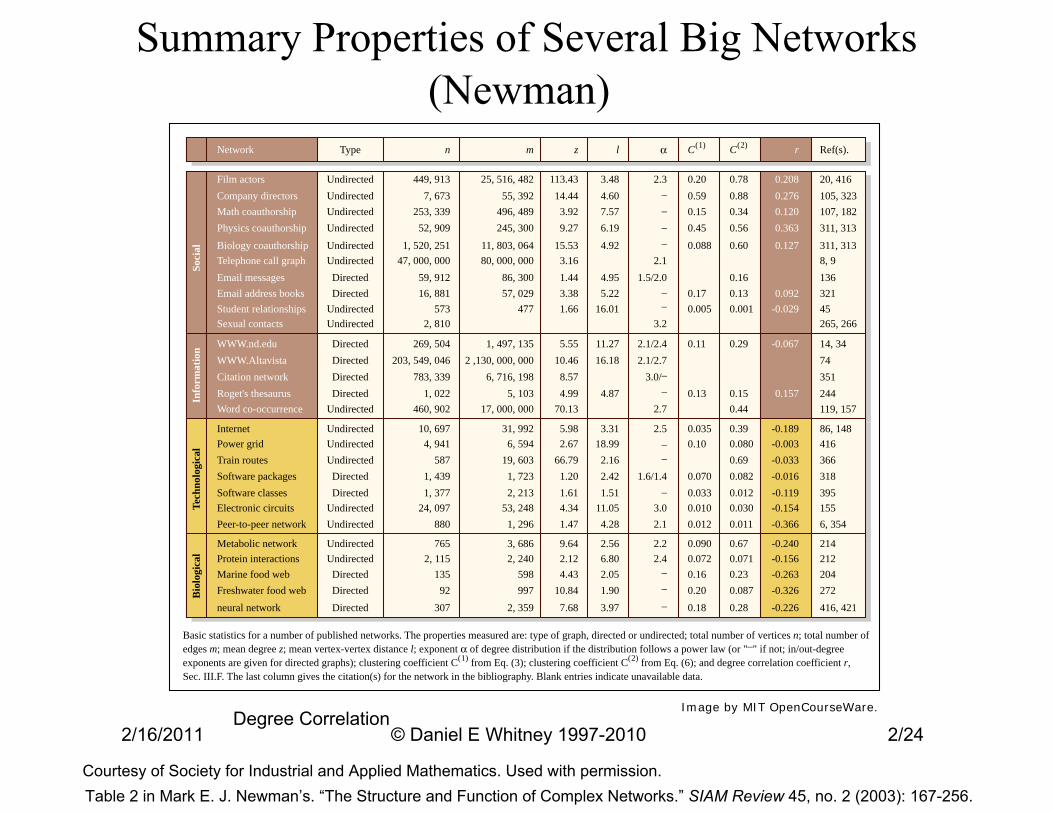
Summary Properties of Several Big Networks
Degree Correlation2/16/2011 © Daniel E Whitney 1997-2010 2/24
Courtesy of Society for Industrial and Applied Mathematics. Used with permission.Table 2 in Mark E. J. Newman’s. “The Structure and Function of Complex Networks.” SIAM Review 45, no. 2 (2003): 167-256.
(Newman)
Network
Film actorsSo
cial
Info
rmat
ion
Tech
nolo
gica
lB
iolo
gica
lCompany directorsMath coauthorshipPhysics coauthorship
Biology coauthorshipTelephone call graphEmail messagesEmail address booksStudent relationshipsSexual contacts
WWW.nd.eduWWW.AltavistaCitation networkRoget's thesaurusWord co-occurrence
InternetPower gridTrain routesSoftware packagesSoftware classesElectronic circuitsPeer-to-peer network
Metabolic networkProtein interactionsMarine food webFreshwater food webneural network
Directed
DirectedDirected
DirectedDirectedDirectedDirected
DirectedDirected
DirectedDirected
Undirected
UndirectedUndirected
UndirectedUndirectedUndirected
Undirected
UndirectedUndirected
UndirectedUndirected
UndirectedUndirectedUndirectedUndirected 449, 913
253, 33952, 909
1, 520, 25147, 000, 000
59, 91216, 881
5732, 810
269, 504203, 549, 046
783, 339
460, 902
10, 6974, 941
5871, 4391, 377
2, 115135
92307 2, 359
997598
2, 2403, 686
1, 29653, 248
2, 2131, 723
19, 6036, 594
31, 992
17, 000, 0005, 103
6, 716, 1982 ,130, 000, 000
1, 497, 135
47757, 02986, 300
80, 000, 00011, 803, 064
245, 300496, 489
55, 39225, 516, 482 113.43
14.443.929.27
15.533.161.443.381.66
5.5510.46
8.574.99
70.13
5.982.67
66.791.201.614.341.47
2.56
4.2811.051.512.422.16
18.993.31
4.87
11.2716.18
16.015.22
4.92
4.95
6.197.574.603.48 2.3 0.20
0.590.150.45
0.170.005
0.11
0.13
0.0350.10
0.0700.0330.0100.012
0.0900.0720.160.200.18 0.28
0.0870.230.0710.67
0.0110.0300.0120.0820.69
0.39
0.440.15
0.29
0.0010.130.16
0.60
0.560.340.880.78 0.208
0.2760.1200.363
0.127
0.092-0.029
-0.067
-0.189-0.003-0.033-0.016-0.119-0.154-0.366
-0.240-0.156-0.263-0.326-0.226 416, 421
6, 35415539531836641686, 148
119, 1572443517414, 34
265, 26645321136
311, 313
311, 313107, 182105, 32320, 416
Ref(s).
8, 9
272204212214
0.157
0.080
0.088
3.2
2.11.5/2.0
2.1/2.42.1/2.7
2.7
2.5
1.6/1.4
3.02.1
2.22.4
3.0/_
___
_
_
_
_
___
_
_
_
6.802.051.903.97
2.129.64
4.4310.84
7.68
24, 097880
765
1, 022
7, 673
Type n m z rl C(1) C(2)α
Undirected
Basic statistics for a number of published networks. The properties measured are: type of graph, directed or undirected; total number of vertices n; total number ofedges m; mean degree z; mean vertex-vertex distance l; exponent α of degree distribution if the distribution follows a power law (or "_" if not; in/out-degree exponents are given for directed graphs); clustering coefficient C(1) from Eq. (3); clustering coefficient C(2) from Eq. (6); and degree correlation coefficient r,Sec. III.F. The last column gives the citation(s) for the network in the bibliography. Blank entries indicate unavailable data.
Image by MIT OpenCourseWare.
Community-finding and Pearson Coefficient r
• Newman says technological networks seem to have r < 0 while social networks seem to have r > 0
• Newman and Park sought an explanation in community structure and clustering: “Why Social Networks are Different From Other Kinds of Networks” Phys Rev E, 68, 036122 (2003)
• Social networks can arise by people joining multiple groups and generating multiple connections
• Networks derived from these multiple connections have positive r
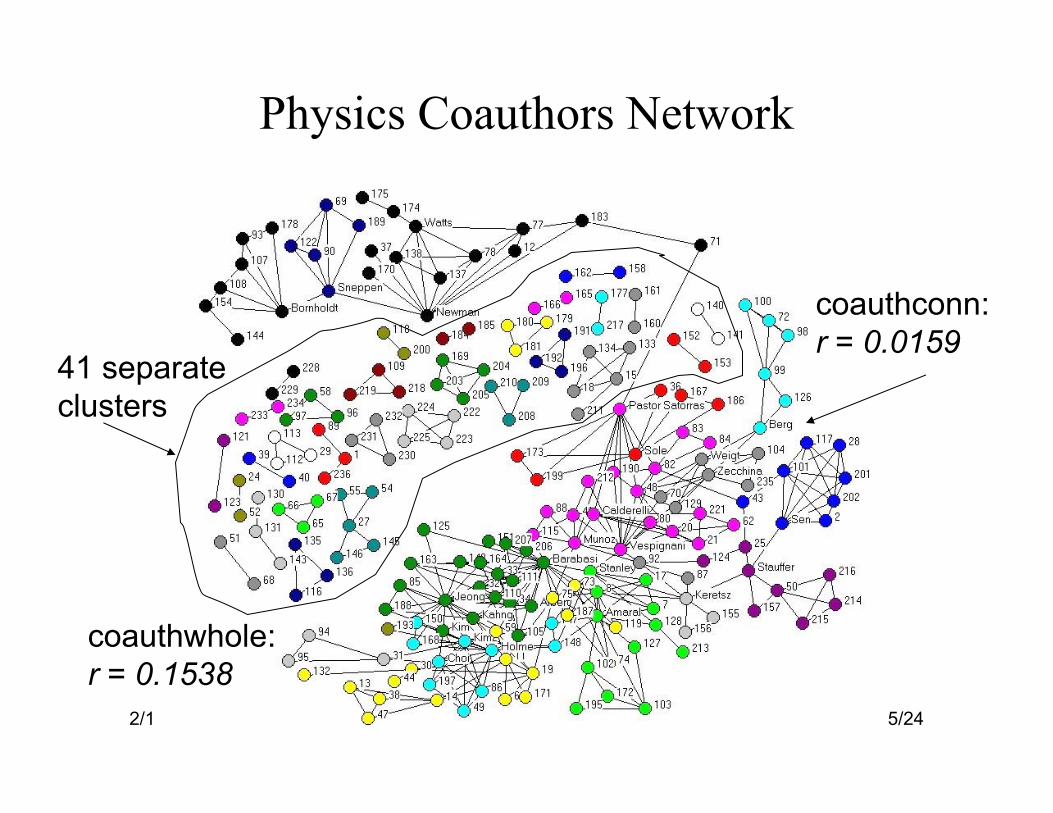
• Networks coauthconn and coauthwhole are from this paper– coauthconn is the connected portion with 147 nodes – coauthwhole has 42 clusters, smallest has 2 nodes, biggest
has 5 2/16/2011 Degree Correlation © Daniel E Whitney 1997-2010 3/24
“Why Social Networks are Different”
• “Left to their own devices, we conjecture, networks normally have negative values of r. In order to show a positive value of r, a network must have some specific additional structure that favors assortative mixing.”
• Special structure that explains networks with r > 0:– Large clustering coeff compared to random
network with same degree sequence – Community structure
• (No special structure needed to explain r < 0) 2/16/2011 Degree Correlation © Daniel E Whitney 1997-2010 4/24
Degree Correlation © Daniel E Whitney 1997-2010
Physics Coauthors Network
2/16/2011 5/24
coauthconn: r = 0.0159
coauthwhole: r = 0.1538
41 separate clusters
Work with David Alderson
• “Are Social Networks Really Different?” • ICCS 2006 paper, published in NECSI journal
2/16/2011 Degree Correlation © Daniel E Whitney 1997-2010 6/24
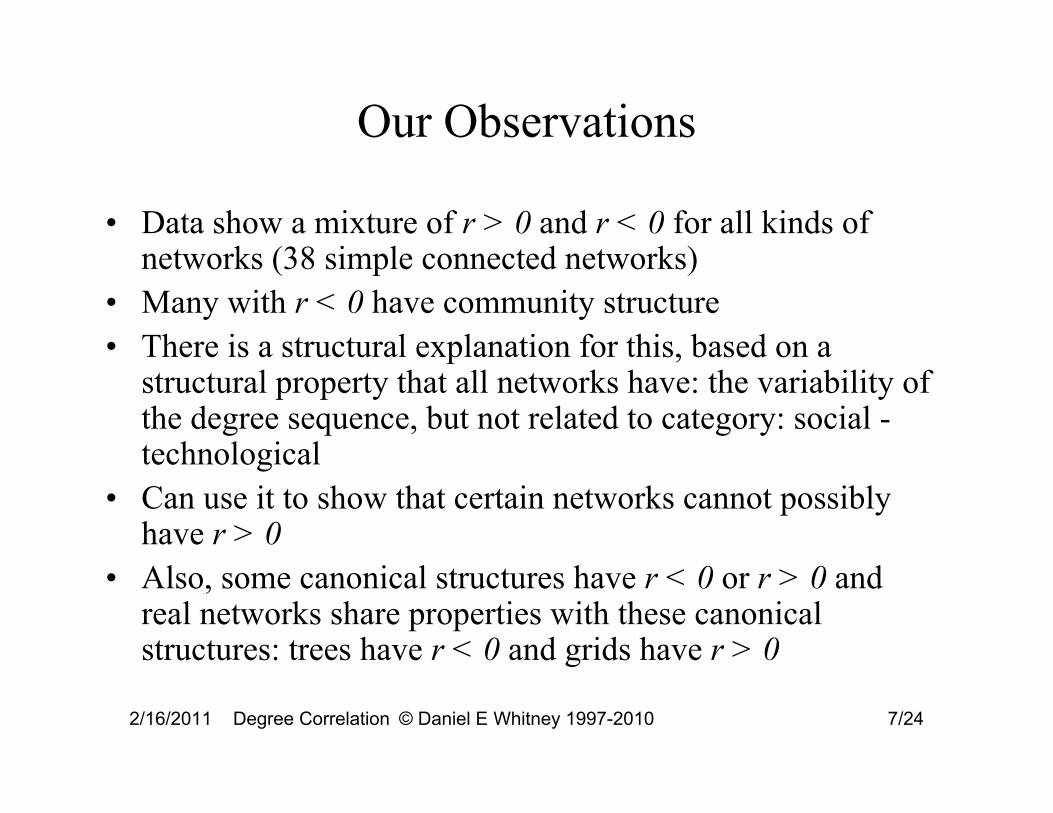
Our Observations
• Data show a mixture of r > 0 and r < 0 for all kinds of networks (38 simple connected networks)
• Many with r < 0 have community structure • There is a structural explanation for this, based on a
structural property that all networks have: the variability of the degree sequence, but not related to category: social technological
• Can use it to show that certain networks cannot possibly have r > 0
• Also, some canonical structures have r < 0 or r > 0 and real networks share properties with these canonical structures: trees have r < 0 and grids have r > 0
2/16/2011 Degree Correlation © Daniel E Whitney 1997-2010 7/24

Degree Correlation2/16/2011 © Daniel E Whitney 1997-2010 8/24
Full Range of r
Degree Correlation © Daniel E Whitney 1997-2010
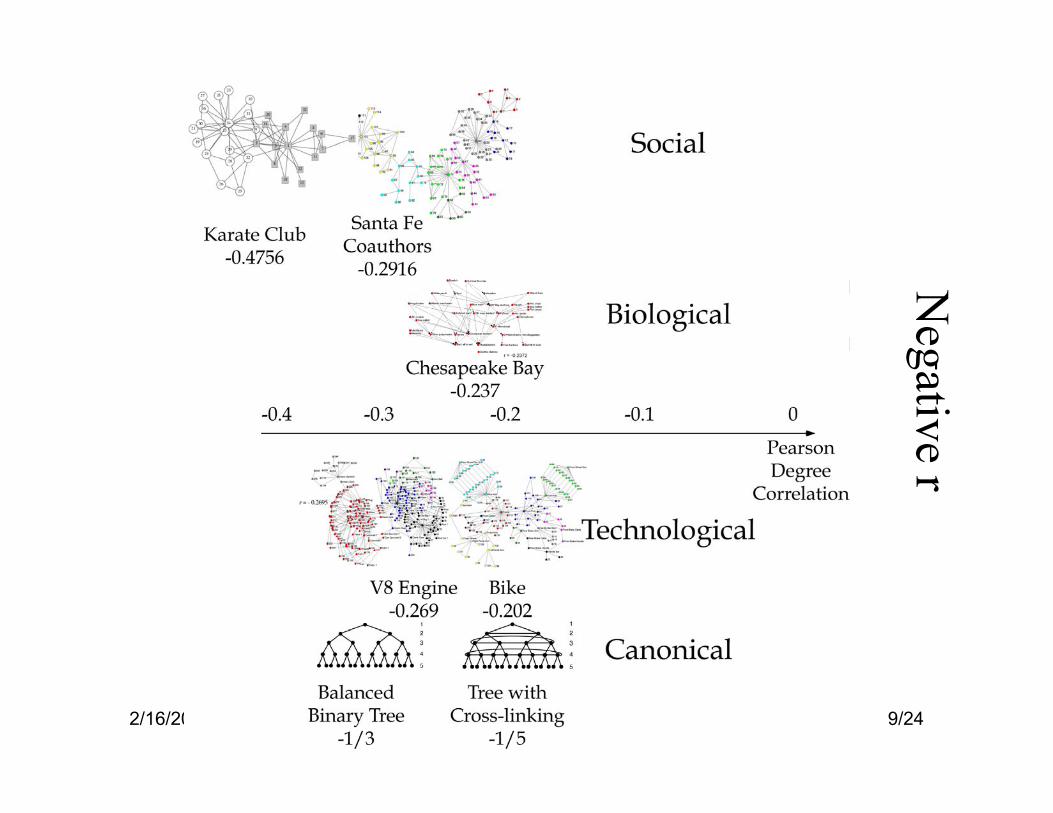
Negative r
2/16/2011 9/24
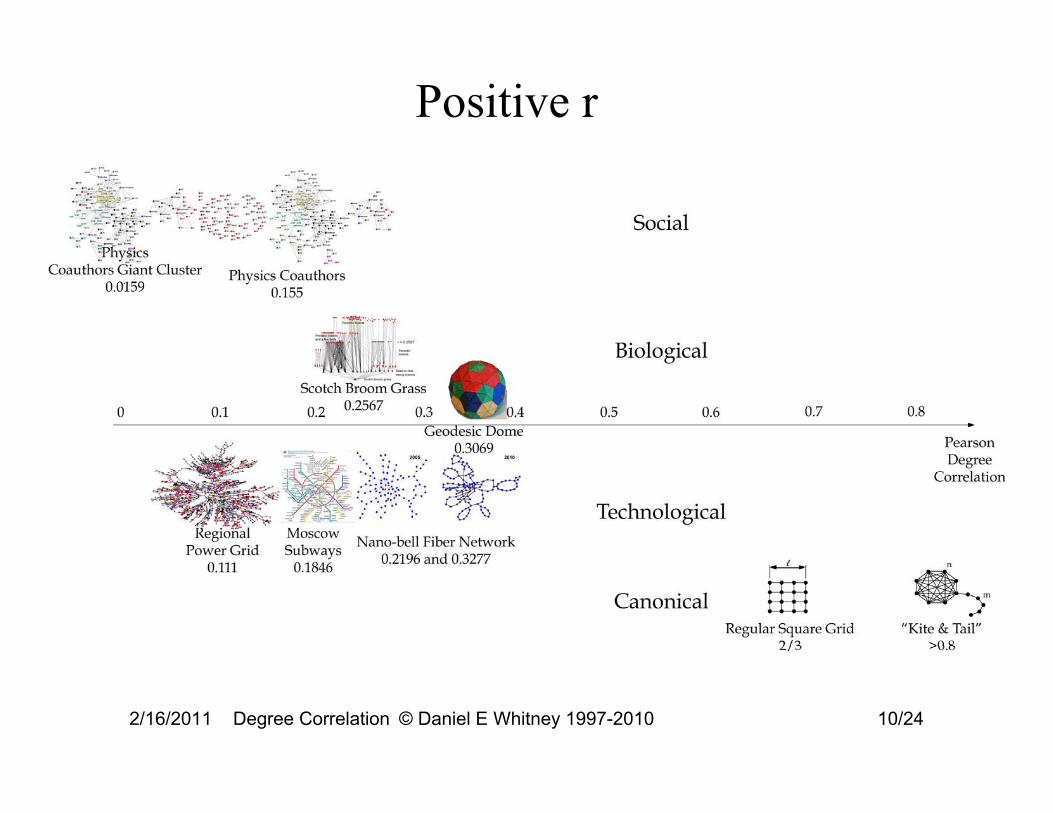
Positive r
2/16/2011 Degree Correlation © Daniel E Whitney 1997-2010 10/24
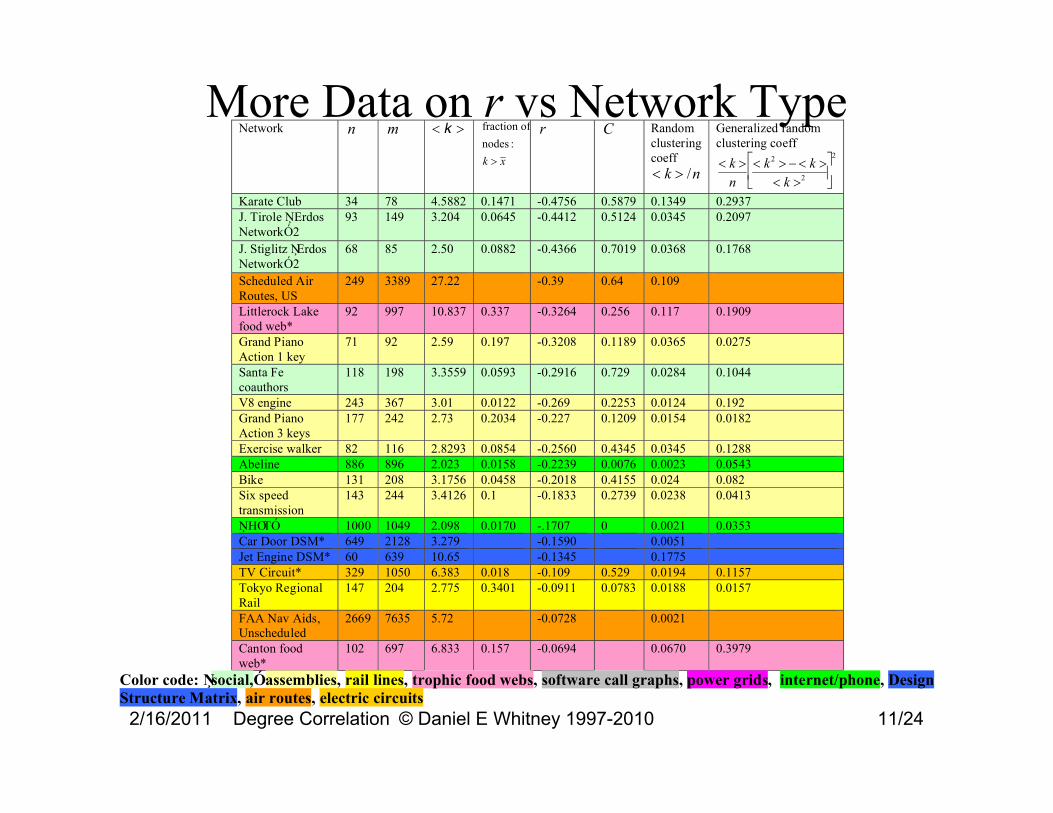
More Data on r vs Network TypeNetwork n m < k > fraction of
nodes : k > x
r C Random clustering coeff < k > /n
Generalized random clustering coeff < k >
n < k2 > − < k >
< k >2
⎡
⎣⎢
⎤
⎦⎥
2
Karate Club 34 78 4.5882 0.1471 -0.4756 0.5879 0.1349 0.2937 J. Tirole ŅErdos NetworkÓ 2
93 149 3.204 0.0645 -0.4412 0.5124 0.0345 0.2097
J. Stiglitz ŅErdos NetworkÓ 2
68 85 2.50 0.0882 -0.4366 0.7019 0.0368 0.1768
Scheduled Air Routes, US
249 3389 27.22 -0.39 0.64 0.109
Littlerock Lake food web*
92 997 10.837 0.337 -0.3264 0.256 0.117 0.1909
Grand Piano Action 1 key
71 92 2.59 0.197 -0.3208 0.1189 0.0365 0.0275
Santa Fe coauthors
118 198 3.3559 0.0593 -0.2916 0.729 0.0284 0.1044
V8 engine 243 367 3.01 0.0122 -0.269 0.2253 0.0124 0.192 Grand Piano Action 3 keys
177 242 2.73 0.2034 -0.227 0.1209 0.0154 0.0182
Exercise walker 82 116 2.8293 0.0854 -0.2560 0.4345 0.0345 0.1288 Abeline 886 896 2.023 0.0158 -0.2239 0.0076 0.0023 0.0543 Bike 131 208 3.1756 0.0458 -0.2018 0.4155 0.024 0.082 Six speed transmission
143 244 3.4126 0.1 -0.1833 0.2739 0.0238 0.0413
ŅHOTÓ 1000 1049 2.098 0.0170 -.1707 0 0.0021 0.0353 Car Door DSM* 649 2128 3.279 -0.1590 0.0051 Jet Engine DSM* 60 639 10.65 -0.1345 0.1775 TV Circuit* 329 1050 6.383 0.018 -0.109 0.529 0.0194 0.1157 Tokyo Regional Rail
147 204 2.775 0.3401 -0.0911 0.0783 0.0188 0.0157
FAA Nav Aids, Unscheduled
2669 7635 5.72 -0.0728 0.0021
Canton food web*
102 697 6.833 0.157 -0.0694 0.0670 0.3979
Color code: Ņsocial,Ó assemblies, rail lines, trophic food webs, software call graphs, power grids, internet/phone, Design Structure Matrix, air routes, electric circuits 2/16/2011 Degree Correlation © Daniel E Whitney 1997-2010 11/24
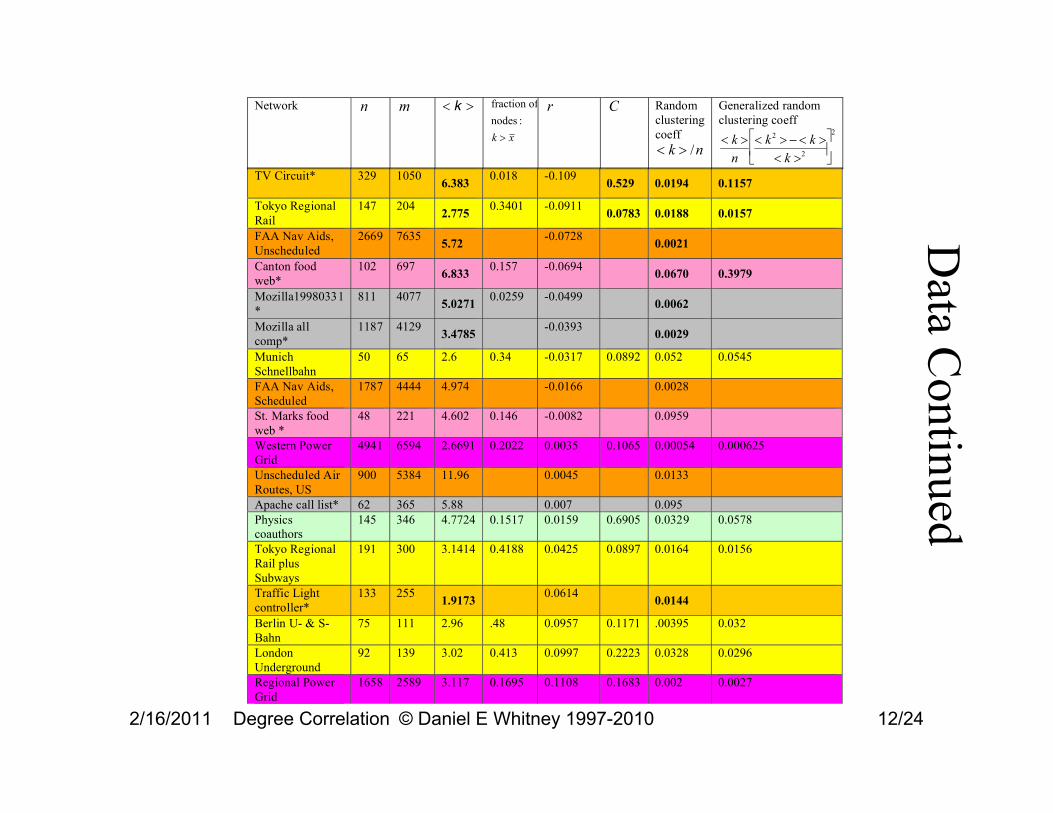
Network n m < k > fraction of nodes : k > x
r C Random clustering coeff < k > /n
Generalized random clustering coeff < k >
n < k2 > − < k >
< k >2
⎡
⎣⎢
⎤
⎦⎥
2
TV Circuit* 329 1050 6.383 0.018 -0.109 0.529 0.0194 0.1157
Tokyo Regional Rail
147 204 2.775 0.3401 -0.0911 0.0783 0.0188 0.0157
FAA Nav Aids, 2669 7635 5.72 -0.0728 0.0021
0.0670
0.0062
0.0029
0.3979
Unscheduled Canton food 102 697 6.833 0.157 -0.0694 web* Mozilla19980331 811 4077 5.0271 0.0259 -0.0499 * Mozilla all 1187 4129 3.4785 -0.0393 comp* Munich Schnellbahn
50 65 2.6 0.34 -0.0317 0.0892 0.052 0.0545
FAA Nav Aids, 1787 4444 4.974 -0.0166 0.0028 Scheduled St. Marks food 48 221 4.602 0.146 -0.0082 0.0959 web * Western Power 4941 6594 2.6691 0.2022 0.0035 0.1065 0.00054 0.000625 Grid Unscheduled Air 900 5384 11.96 0.0045 0.0133 Routes, US Apache call list* 62 365 5.88 0.007 0.095 Physics coauthors
145 346 4.7724 0.1517 0.0159 0.6905 0.0329 0.0578
Tokyo Regional Rail plus Subways
191 300 3.1414 0.4188 0.0425 0.0897 0.0164 0.0156
Traffic Light 133 255 1.9173 0.0614 0.0144controller* Berlin U- & S-Bahn
75 111 2.96 .48 0.0957 0.1171 .00395 0.032
London Underground
92 139 3.02 0.413 0.0997 0.2223 0.0328 0.0296
Regional Power 1658 2589 3.117 0.1695 0.1108 0.1683 0.002 0.0027 Grid
Data C
on tinu ed
2/16/2011 Degree Correlation © Daniel E Whitney 1997-2010 12/24
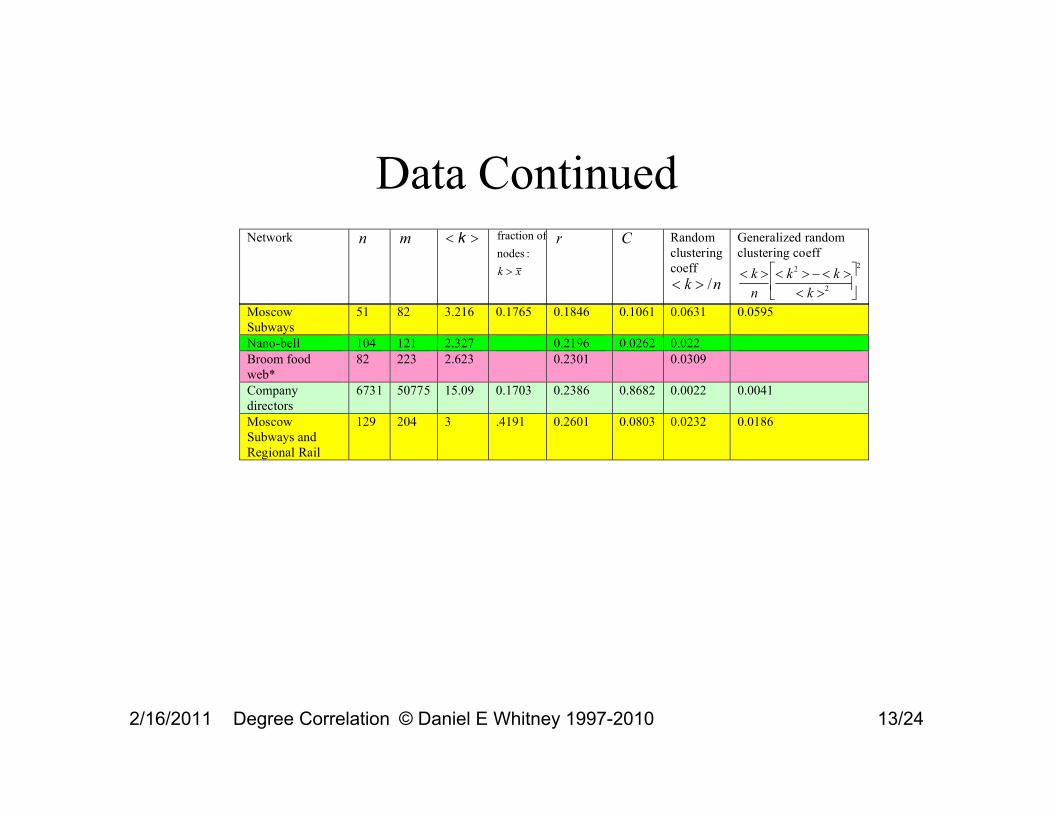
Data ContinuedNetwork n m < k > fraction of
nodes : k > x
r C Random clustering coeff < k > /n
Generalized random clustering coeff < k >
n < k2 > − < k >
< k >2
⎡
⎣⎢
⎤
⎦⎥
2
Moscow Subways
51 82 3.216 0.1765 0.1846 0.1061 0.0631 0.0595
Nano-bell Broom food
104 82
121 223
2.327 2.623
0.2196 0.2301
0.0262
0.8682
0.022 0.0309
0.0022 0.0041 web*
6731 50775 15.09 0.1703 0.2386Company directors Moscow Subways and Regional Rail
129 204 3 .4191 0.2601 0.0803 0.0232 0.0186
2/16/2011 Degree Correlation © Daniel E Whitney 1997-2010 13/24
How to Calculate r in Closed Form for Canonical Structures
2/16/2011 Degree Correlation © Daniel E Whitney 1997-2010 14/24
2
3
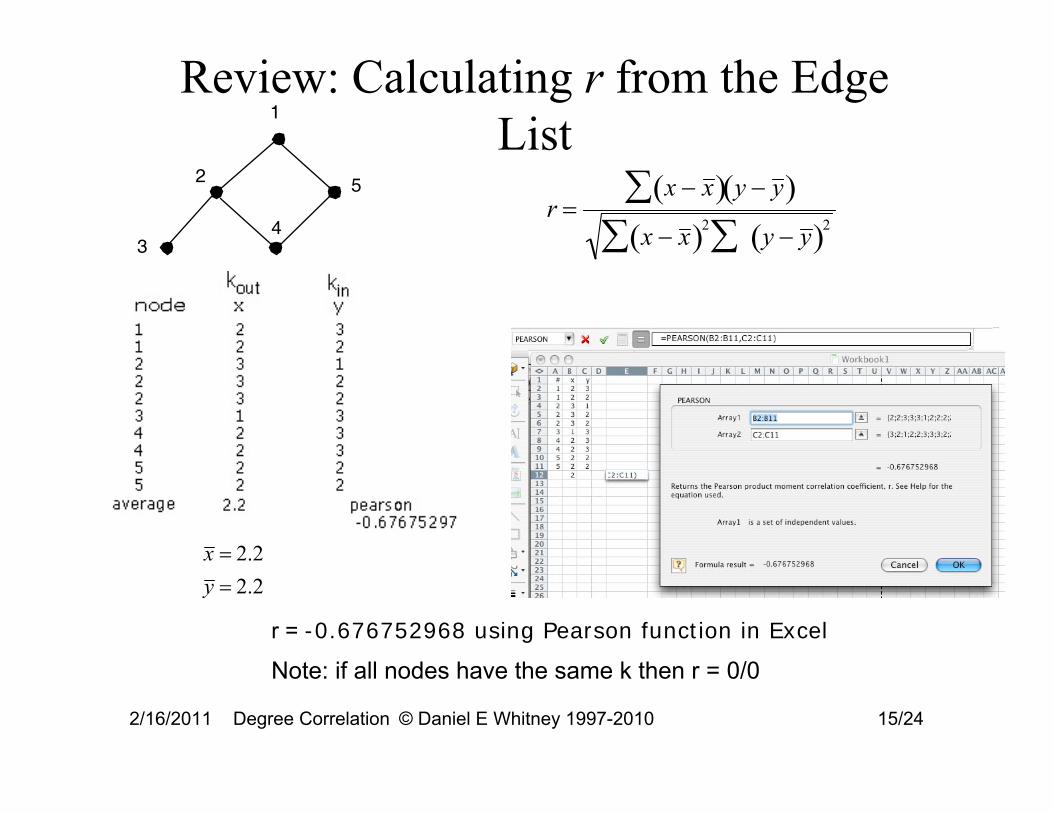
Review: Calculating r from the Edge1
4
List 5 ∑(x − x)(y − y)
r = ∑(x − x)2 ∑ (y − y)2
x = 2.2 y = 2.2
r = -0.676752968 using Pearson function in Excel
Note: if all nodes have the same k then r = 0/0
2/16/2011 Degree Correlation © Daniel E Whitney 1997-2010 15/24
n=1n=2
n=3
n=4
n=5
binary tree with n=5
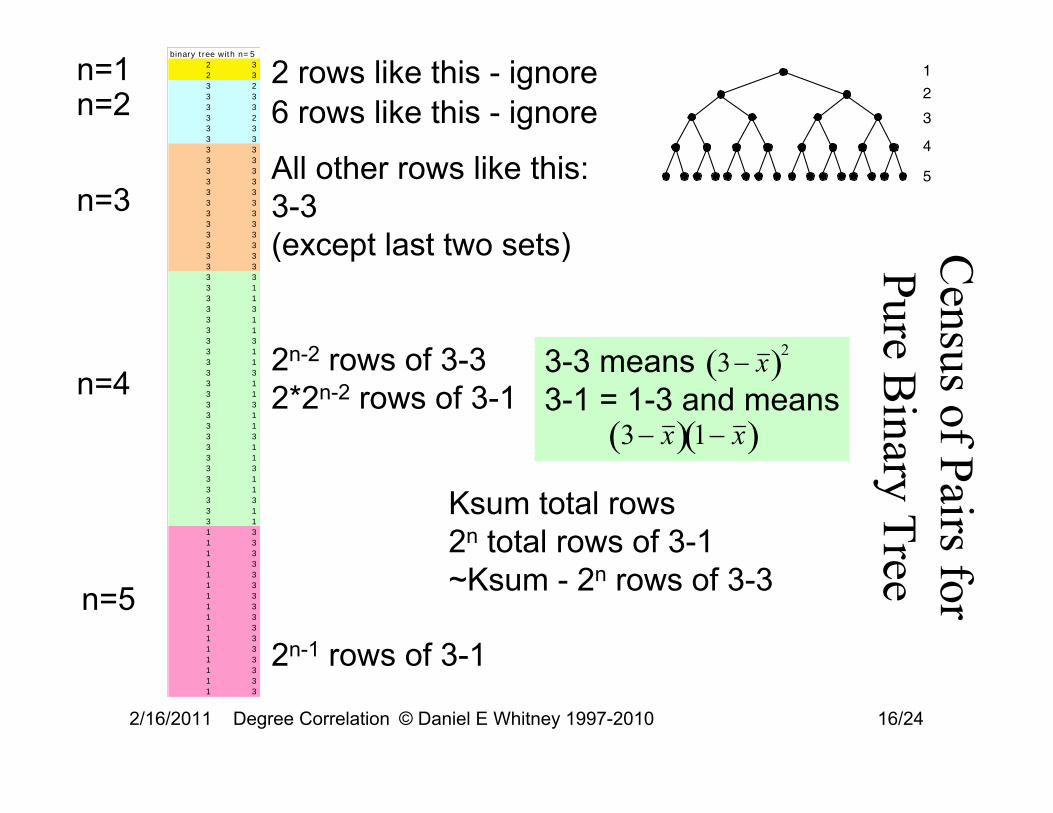
12 rows like this - ignore 2
6 rows like this - ignore 3
4
All other rows like this: 5
3-3(except last two sets)
2n-2 rows of 3-3 3-3 means (3 − x)2
2*2n-2 rows of 3-1 3-1 = 1-3 and means(3 − x)(1− x)
Ksum total rows2n total rows of 3-1~Ksum - 2n rows of 3-3
2n-1 rows of 3-1
2 3 2 3 3 2 3 3 3 3 3 2 3 3 3 3 3 3 3 3 3 3 3 3 3 3 3 3 3 3 3 3 3 3 3 3 3 3 3 3 3 3 3 1 3 1 3 3 3 1 3 1 3 3 3 1 3 1 3 3 3 1 3 1 3 3 3 1 3 1 3 3 3 1 3 1 3 3 3 1 3 1 3 3 3 1 3 1 1 3 1 3 1 3 1 3 1 3 1 3 1 3 1 3 1 3 1 3 1 3 1 3 1 3 1 3 1 3 1 3
Census of Pairs for
Pure Binary Tree
2/16/2011 Degree Correlation © Daniel E Whitney 1997-2010 16/24

Result of Census
Sum of row entries = ∑ki 2 = 10*2n−1 −14 = ksqsum
Total number of rows = ∑ki = 2n +1 + 4 = ksum
< k 2 > ∑k 2
∴ x = = = 2.5 in the limit of large n < k > ∑k
Also <k>=2
Total 2n rows of 3-1 Approx (ksum - 2n) rows of 3-3
Denominator = (x − x)2 (y − y)2 = (x − x)4 = (x − x)2
This is just one column’s entries squared
r = - 0.4122 for this tree with 5 layers2/16/2011 Degree Correlation © Daniel E Whitney 1997-2010 17/24
Closed Form Results1
2
3
4
5
1
2
3
4
5
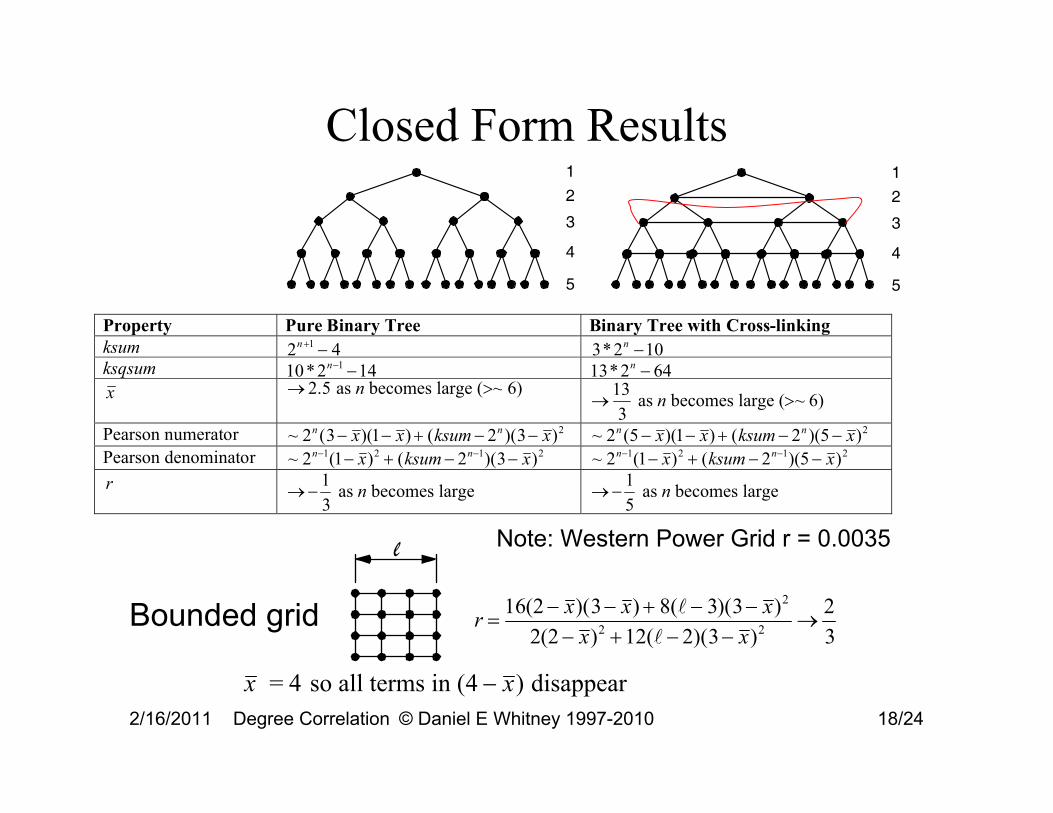
Property Pure Binary Tree Binary Tree with Cross-linking ksum 2n +1 − 4 3* 2n −10 ksqsum 10 * 2n−1 −14 13* 2n − 64 x → 2.5 as n becomes large (>~ 6)
→ 13 3
as n becomes large (>~ 6)
Pearson numerator ~ 2n (3 − x)(1− x) + (ksum − 2n )(3 − x)2 ~ 2n (5 − x)(1− x) + (ksum − 2n )(5 − x)2
Pearson denominator ~ 2n−1(1− x)2 + (ksum − 2n−1)(3 − x)2 ~ 2n−1(1− x)2 + (ksum − 2n−1)(5 − x)2
r → −1 3
as n becomes large → −1 5
as n becomes large
l Note: Western Power Grid r = 0.0035
16(2 − x)(3 − x) + 8( − 3)(3 − x)2 2Bounded grid r = →2(2 − x)2 +12( − 2)(3 − x)2 3
x = 4 so all terms in (4 − x) disappear2/16/2011 Degree Correlation © Daniel E Whitney 1997-2010 18/24
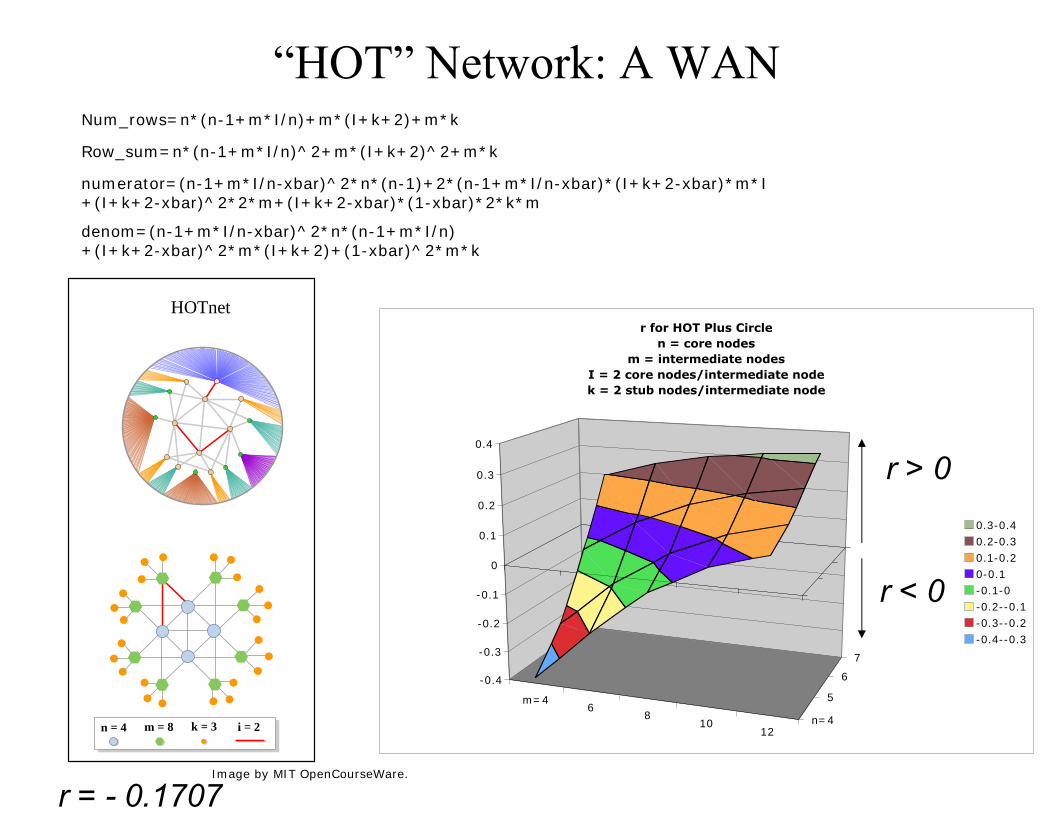
“HOT” Network: A WANNum_rows=n*(n-1+m*I/n)+m*(I+k+2)+m*k
Row_sum=n*(n-1+m*I/n)^2+m*(I+k+2)^2+m*k
numerator=(n-1+m*I/n-xbar)^2*n*(n-1)+2*(n-1+m*I/n-xbar)*(I+k+2-xbar)*m*I +(I+k+2-xbar)^2*2*m+(I+k+2-xbar)*(1-xbar)*2*k*m
denom=(n-1+m*I/n-xbar)^2*n*(n-1+m*I/n) +(I+k+2-xbar)^2*m*(I+k+2)+(1-xbar)^2*m*k
m=4 6
8 10
12 n=4
5
6
7
-0.4
-0.3
-0.2
-0.1
0
0.1
0.2
0.3
0.4
r for HOT Plus Circle n = core nodes
m = intermediate nodes I = 2 core nodes/intermediate node k = 2 stub nodes/intermediate node
0.3-0.4 0.2-0.3 0.1-0.2 0-0.1 -0.1-0 -0.2--0.1 -0.3--0.2 -0.4--0.3
r > 0
r < 0
n = 4 m = 8 k = 3 i = 2
HOTnet
r = - 0.1707 Image by MIT OpenCourseWare.
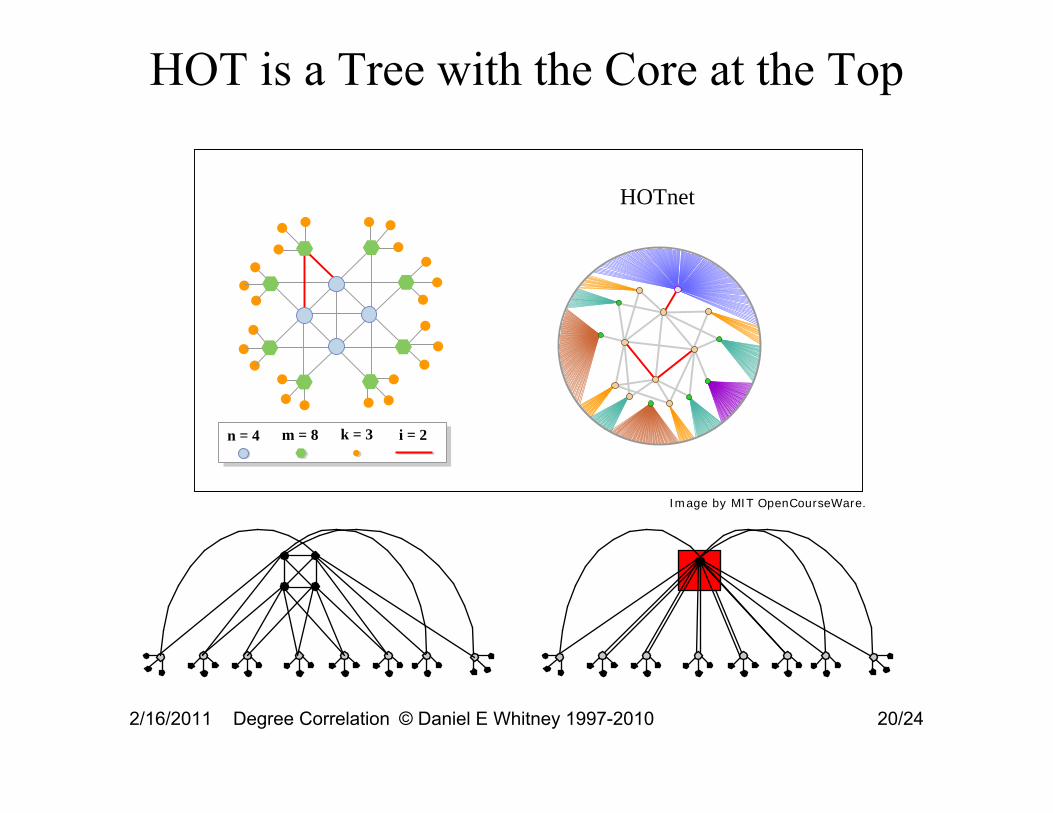
HOT is a Tree with the Core at the Top
2/16/2011 Degree Correlation © Daniel E Whitney 1997-2010 20/24
n = 4 m = 8 k = 3 i = 2
HOTnet
Image by MIT OpenCourseWare.
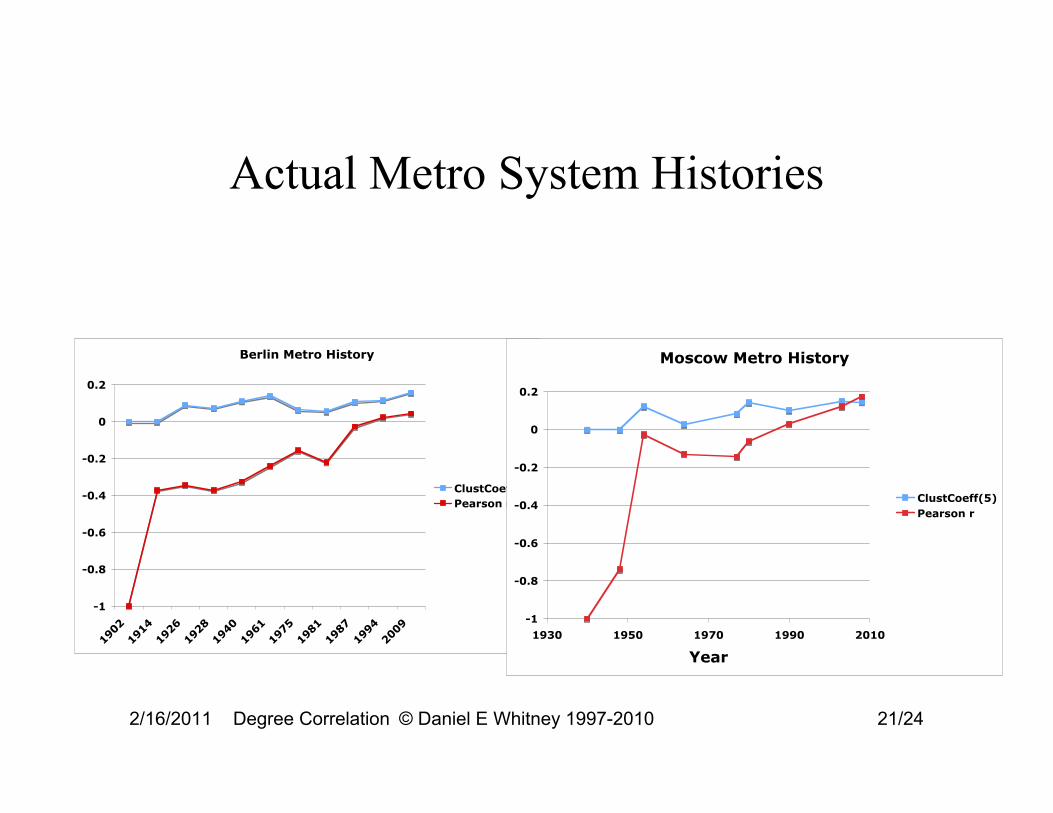
Actual Metro System Histories
Berlin Metro History
-1
-0.8
-0.6
-0.4
-0.2
0
0.2
1902
19
14
1926
19
28
1940
19
61
1975
19
81
1987
19
94
2009
ClustCoeff(5) Pearson r
Moscow Metro History
-1
-0.8
-0.6
-0.4
-0.2
0
0.2
1930 1950 1970 1990 2010
Year
ClustCoeff(5) Pearson r
2/16/2011 Degree Correlation © Daniel E Whitney 1997-2010 21/24
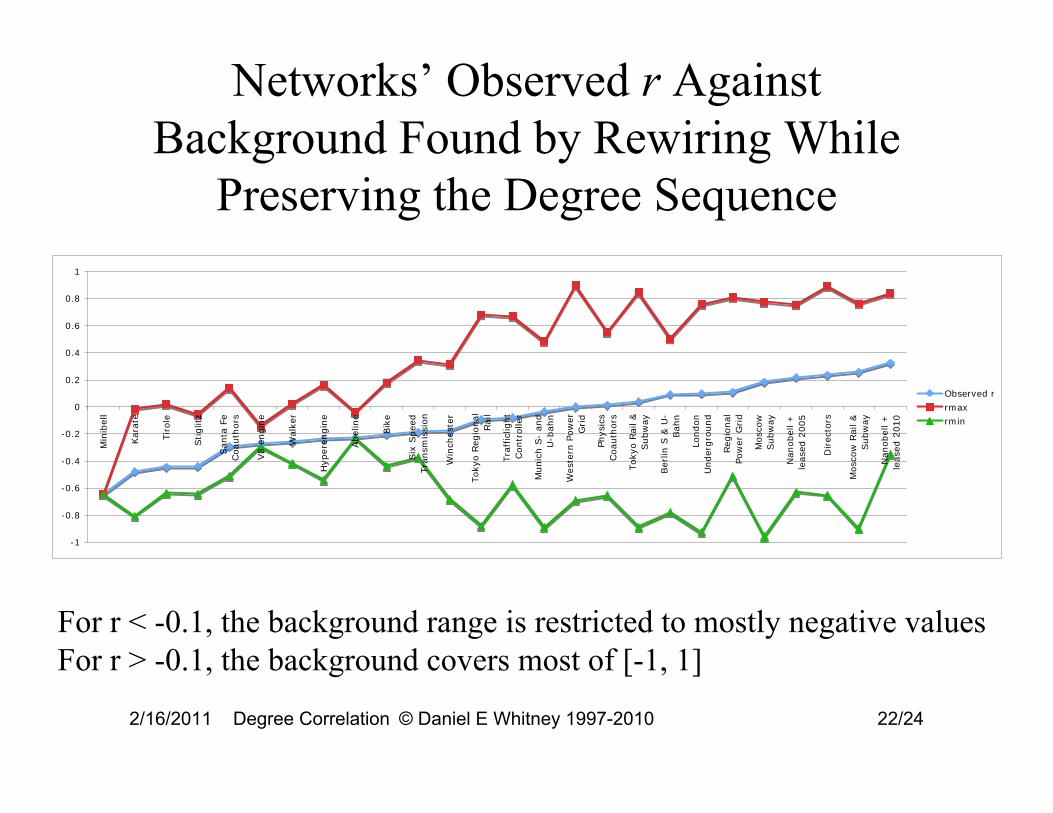
Networks’ Observed r Against Background Found by Rewiring While
Preserving the Degree Sequence
-1
-0.8
-0.6
-0.4
-0.2
0
0.2
0.4
0.6
0.8
1
Min
ibel
l
Kar
ate
Tirole
Stiglit
z
San
ta F
eCoau
thors
V8 e
ngin
e
Wal
ker
Hyp
eren
gin
e
Abel
ine
Bik
e
Six
Spee
dTra
nsm
issi
on
Win
ches
ter
Toky
o R
egio
nal
Rai
l
Tra
ffic
light
Contr
olle
r
Munic
h S
- an
dU
-bah
n
Wes
tern
Pow
erG
rid
Phys
ics
Coau
thors
Toky
o R
ail &
Subw
ay
Ber
lin S
& U
-Bah
n
London
Under
gro
und
Reg
ional
Pow
er G
rid
Mosc
ow
Subw
ay
Nan
obel
l +
leas
ed 2
005
Direc
tors
Mosc
ow
Rai
l &
Subw
ay
Nan
obel
l +
leas
ed 2
010
Observed r
rmax
rmin
For r < -0.1, the background range is restricted to mostly negative values For r > -0.1, the background covers most of [-1, 1]
2/16/2011 Degree Correlation © Daniel E Whitney 1997-2010 22/24
10
60
Nod
e D
egre
e
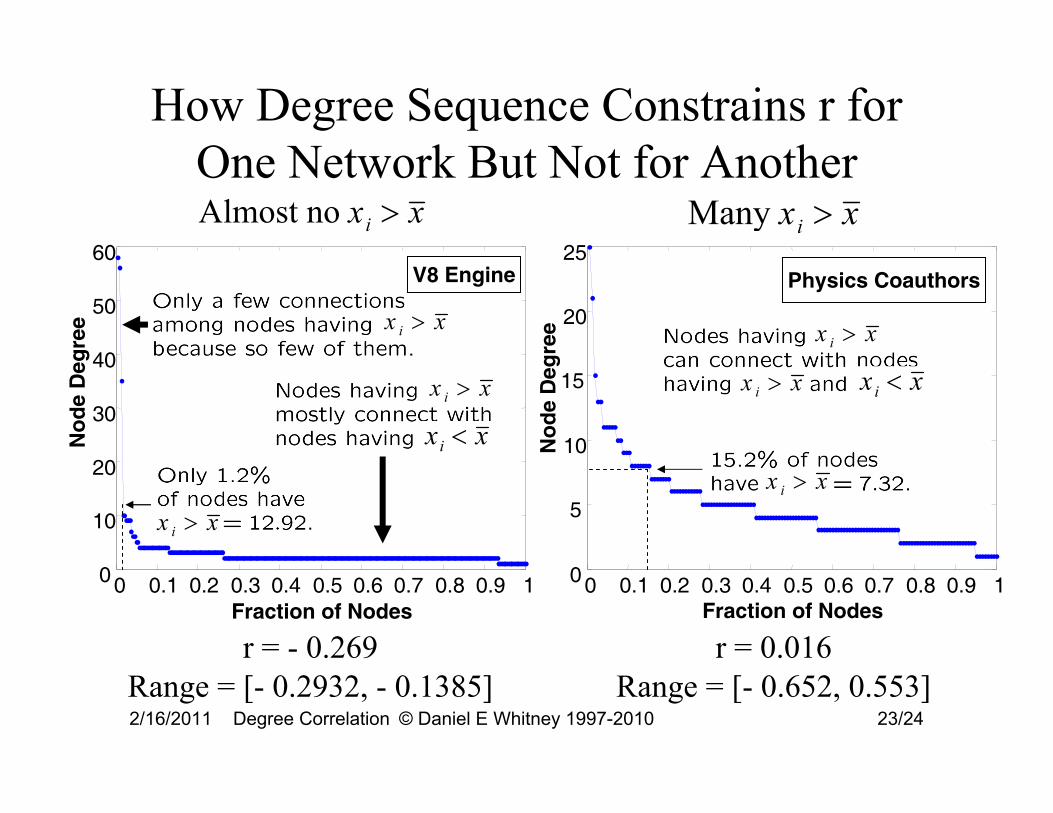
How Degree Sequence Constrains r for One Network But Not for AnotherAlmost no xi > x Many xi > x
25
0 0.1 0.2 0.3 0.4 0.5 0.6 0.7 0.8 0.9 10
V8 Engine
x i > x
x i > x
x i > x
xi < x
0 0.1 0.2 0.3 0.4 0.5 0.6 0.7 0.8 0.9 10
15
Physics Coauthors
Nod
e D
egre
e
x i > x
x i > x
x i > x
xi < x
50 20
40
30
1020
5
Fraction of Nodes Fraction of Nodes
r = - 0.269 r = 0.016Range = [- 0.2932, - 0.1385] Range = [- 0.652, 0.553]2/16/2011 Degree Correlation © Daniel E Whitney 1997-2010 23/24
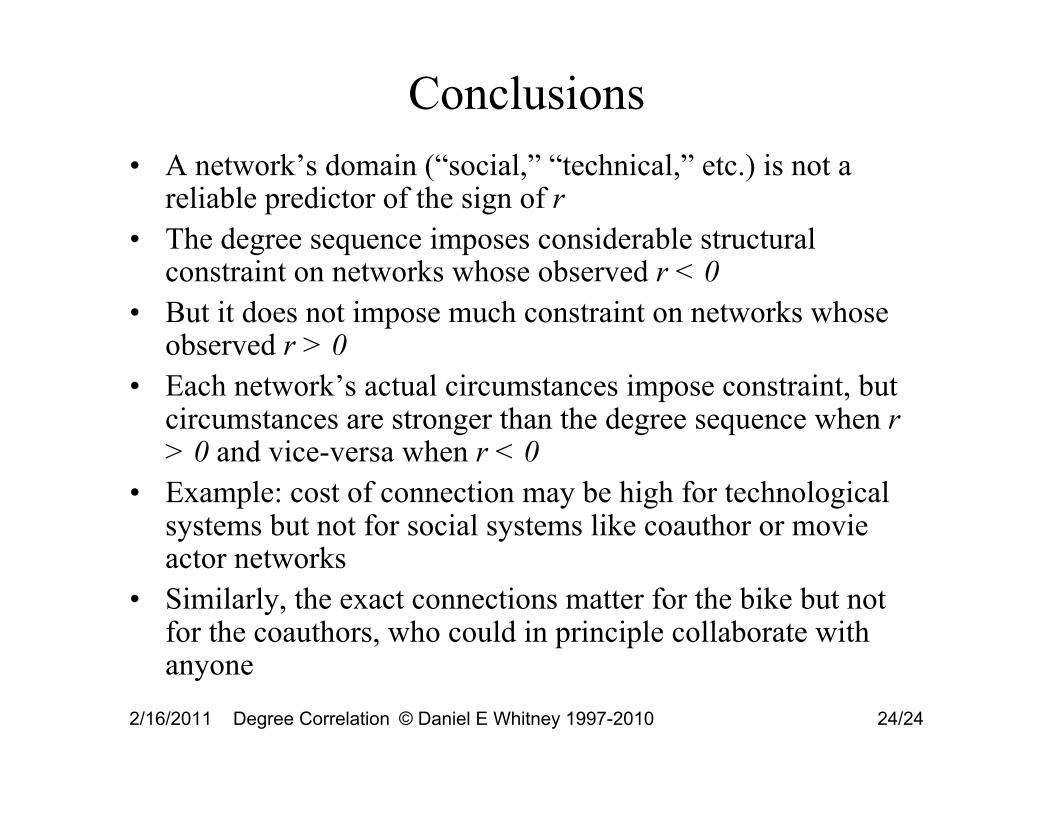
Conclusions• A network’s domain (“social,” “technical,” etc.) is not a
reliable predictor of the sign of r • The degree sequence imposes considerable structural
constraint on networks whose observed r < 0 • But it does not impose much constraint on networks whose
observed r > 0 • Each network’s actual circumstances impose constraint, but
circumstances are stronger than the degree sequence when r > 0 and vice-versa when r < 0
• Example: cost of connection may be high for technological systems but not for social systems like coauthor or movie actor networks
• Similarly, the exact connections matter for the bike but not for the coauthors, who could in principle collaborate with anyone
2/16/2011 Degree Correlation © Daniel E Whitney 1997-2010 24/24

Backups
2/16/2011 Degree Correlation © Daniel E Whitney 1997-2010 25/24
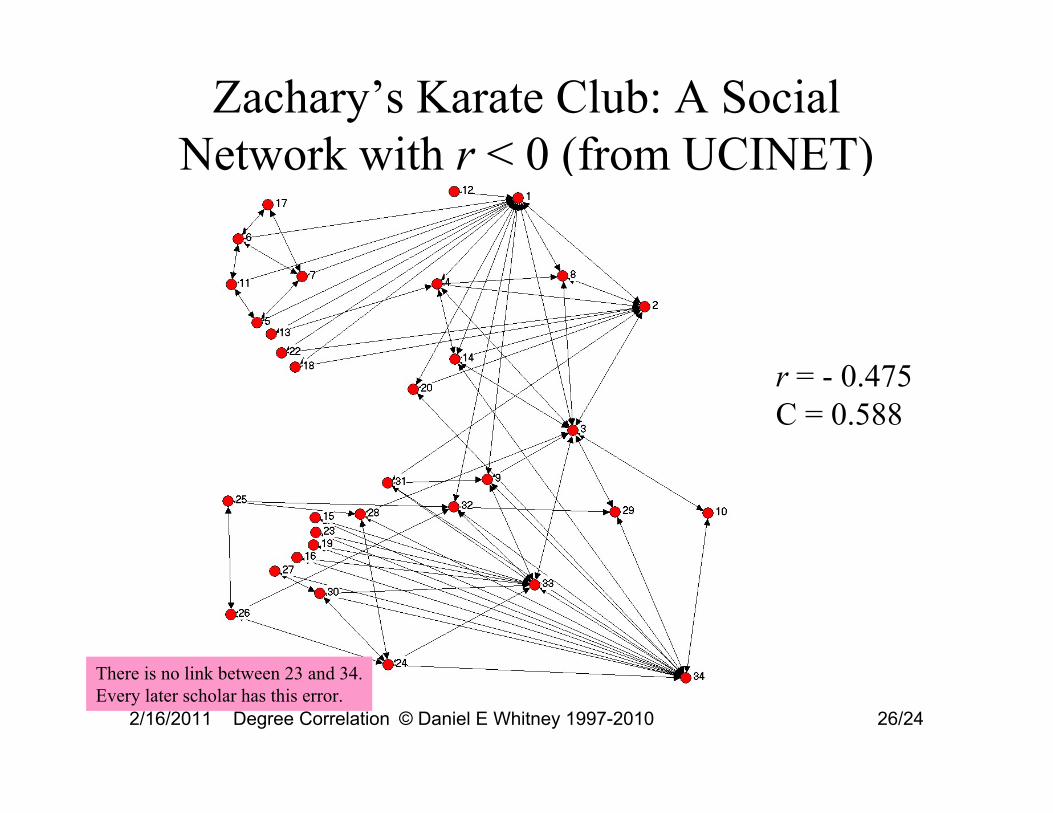
Zachary’s Karate Club: A Social Network with r < 0 (from UCINET)
2/16/2011 Degree Correlation © Daniel E Whitney 1997-2010 26/24
There is no link between 23 and 34. Every later scholar has this error.
r = - 0.475 C = 0.588
Moscow Metro
Image of Moscow Metro map removed due to copyright restrictions. See Moscow Metro.
2/16/2011 Degree Correlation © Daniel E Whitney 1997-2010 27/24
Moscow Regional Rail
Map of Moscow Regional Rail removed due to copyright restrictions. Please refer to: The Mappery
2/16/2011 Degree Correlation © Daniel E Whitney 1997-2010 28/24
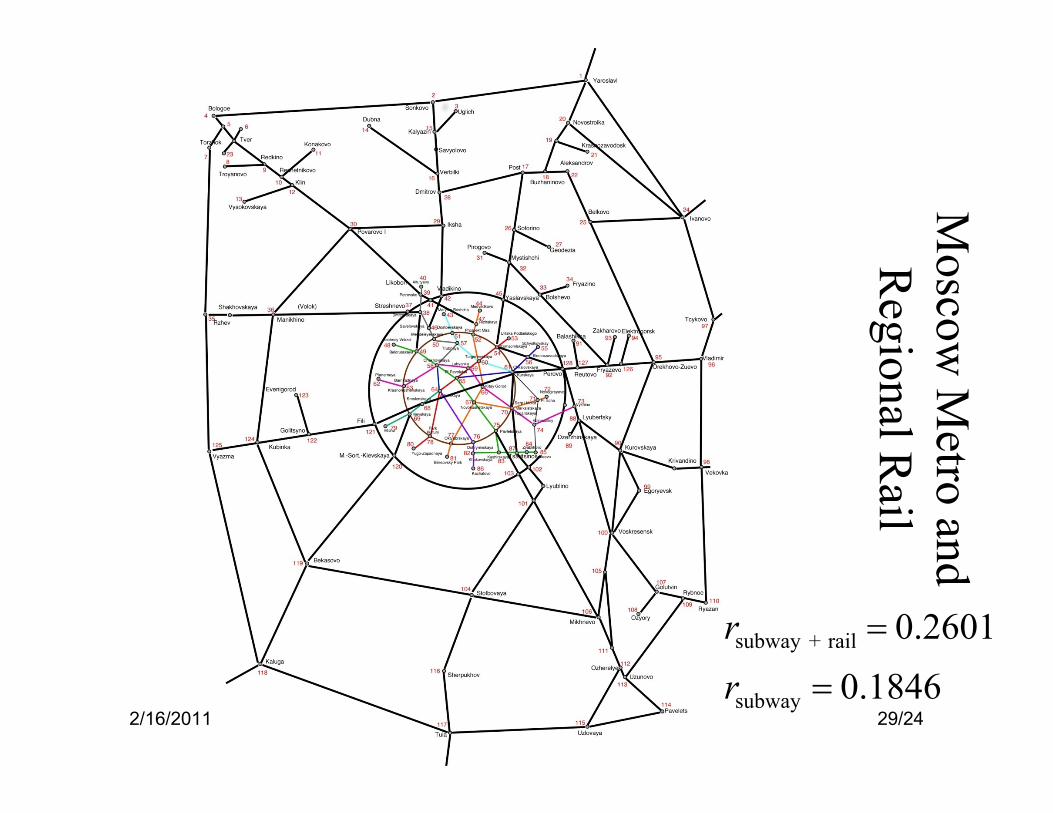
Degree Correlation © Daniel E Whitney 1997-2010
rsubway + rail
rsubway
Moscow
Metro and
Regional R
ail
= 0.2601 = 0.1846
2/16/2011 29/24
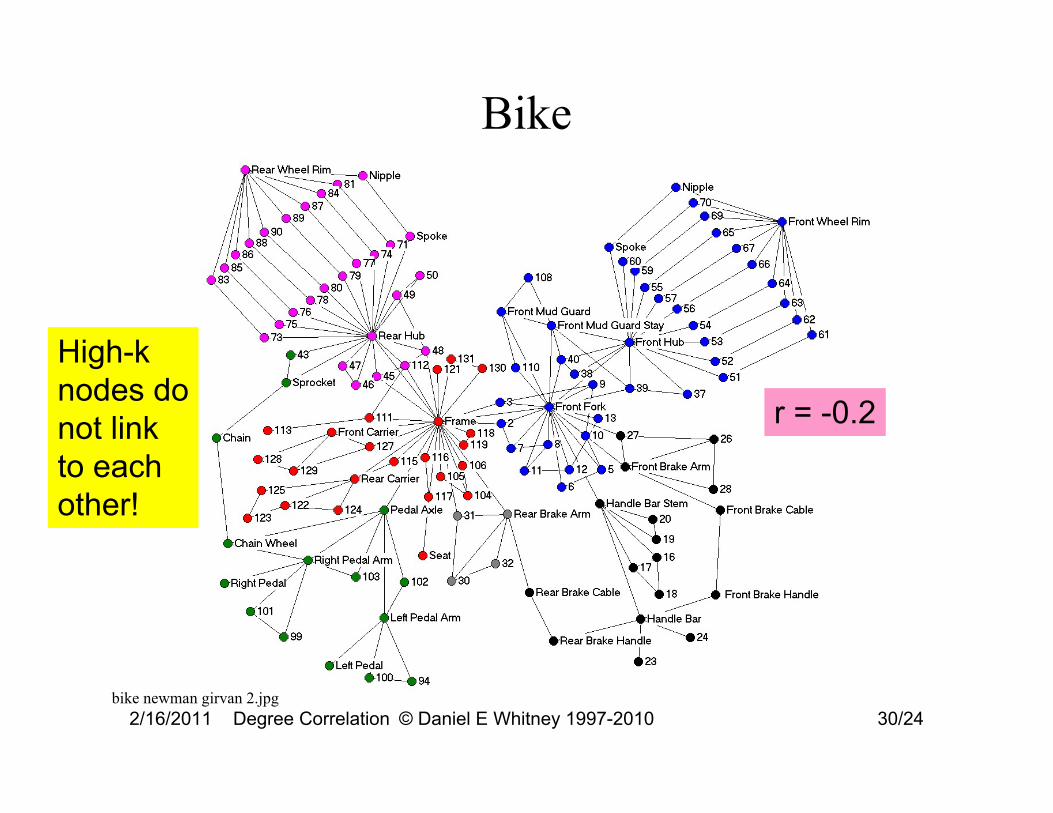
Bike
r = -0.2
High-k nodes do not link to each other!
bike newman girvan 2.jpg 2/16/2011 Degree Correlation © Daniel E Whitney 1997-2010 30/24
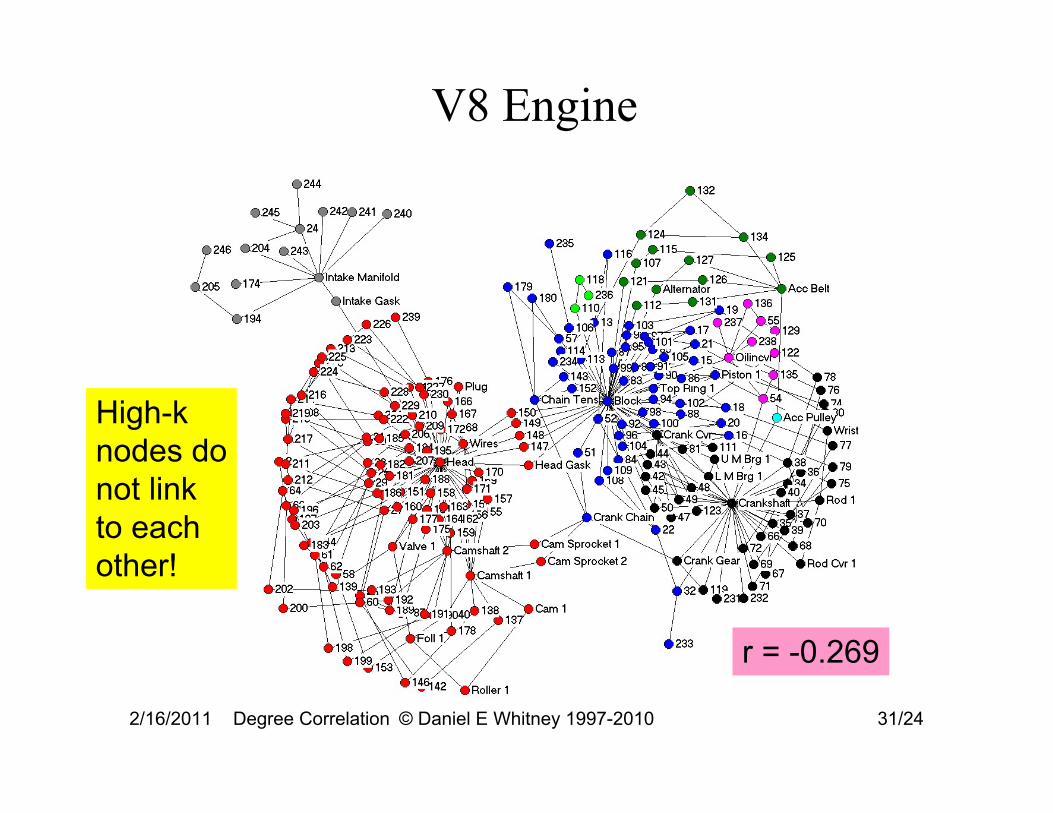
V8 Engine
r = -0.269
High-k nodes do not link to each other!
2/16/2011 Degree Correlation © Daniel E Whitney 1997-2010 31/24
Does a Network Have to Have a Particular Value of r Given its D?
• Technological networks have to perform a function, use scarce resources efficiently, or satisfy some other structural or functional constraint, so their observed wiring and r are probably necessary
• Social networks do not have to do any of these things so their structure is more subject to circumstances, such as communication or collaboration habits; thus their observed wiring and r are probably circumstantial
• We can test by seeing if rewired versions are plausible
2/16/2011 Degree Correlation © Daniel E Whitney 1997-2010 32/24
Example Domain Sources for Constraint in D Leading to r < 0
• High x with respect to x in mechanical assemblies
comes from need to provide a foundation part to absorb loads and locate other parts to each other–Engine block –Bike and walker frame
• High x with respect to x in some social networks reflects hierarchy or dominance – Karate instructor and club president in Zachary’s
club • Tree-like structure of wireline phone networks causes
them to have r < 0 because trees have r < 0 • These networks can’t be rewired plausibly 2/16/2011 Degree Correlation © Daniel E Whitney 1997-2010 33/24
Example Domain Sources for Constraint in D Leading to r > 0
• Planar transport networks are grid-like, and grids have r > 0
• Modern fiber-optic phone networks are built on loops or chains (trunks) that link clusters (central offices) leading to r > 0
2/16/2011 Degree Correlation © Daniel E Whitney 1997-2010 34/24

MIT OpenCourseWarehttp://ocw.mit.edu
ESD.342 Network Representations of Complex Engineering Systems Spring 2010
For information about citing these materials or our Terms of Use, visit: http://ocw.mit.edu/terms.