Embed Size (px)
Citation preview
© 2018 by The Enterprise Strategy Group, Inc. All Rights Reserved.
Using Data to Identify What Transformed IT Organizations Look Like, and How They Are Driving a Digital Advantage By Adam DeMattia, Director of Research; John McKnight, Vice President of Research and Analyst Services; Jennifer Gahm, Senior Project Manager; and Monya Keane, Senior Research Analyst March 2018 This ESG Research Insights Paper was commissioned by Dell EMC and Intel and is distributed under license from ESG.
Enterprise Strategy Group | Getting to the bigger truth.™
Research Proves IT Transformation’s Persistent Link to Agility, Innovation, and Business Value
ESG Research Insights Paper
Research Insights Paper: Research Proves IT Transformation’s Persistent Link to Agility, Innovation, and Business Value 2
© 2018 by The Enterprise Strategy Group, Inc. All Rights Reserved.
Contents
Introduction ..............................................................................................................................................................3
Market Overview .......................................................................................................................................................3
How ‘IT Transformation’ Differs from ‘Digital Transformation’.......................................................................................... 3
Real-world Results .............................................................................................................................................................. 3
Distinguishing IT Transformation Levels ............................................................................................................................. 4
The IT Maturity Curve ......................................................................................................................................................... 4
The Trend Is Positive, and It Should Accelerate .................................................................................................................. 5
Business Performance and Driving Growth .................................................................................................................6
Competing to Win: Speeding Time to Market Through Better IT Agility .......................................................................7
Using Data to Drive Decision Making .................................................................................................................................. 8
Timely Application Deployment .......................................................................................................................................... 8
Keeping IT Projects on Schedule ......................................................................................................................................... 8
Time to Provision VMs ........................................................................................................................................................ 9
Delivering Business Value: The Economics of IT ...........................................................................................................9
IT Projects Under, On, and Over Budget ............................................................................................................................. 9
Innovation versus Keeping the Lights On............................................................................................................................ 9
Cost Competitiveness versus the Public Cloud ................................................................................................................. 10
IT Spend per Business-critical Application ........................................................................................................................ 11
VMs per Server Administrator .......................................................................................................................................... 12
Aligning IT with the Business .................................................................................................................................... 12
Examining the Measures of IT Effectiveness According to Respondents’ IT Transformation Maturity Stage ................. 12
IT Involvement with Business Strategy ............................................................................................................................. 13
How Executive Leadership Evaluates the IT Organization’s Effectiveness ....................................................................... 14
IT/Line of Business Cooperation ....................................................................................................................................... 14
IT as a Competitive Differentiator..................................................................................................................................... 14
The Bigger Truth ...................................................................................................................................................... 15
Assess Your Own IT Transformation Maturity ........................................................................................................... 15
Appendices .............................................................................................................................................................. 16
Research Methodology ..................................................................................................................................................... 16
Criteria for Evaluating Respondent Organizations’ IT Transformation Maturity .............................................................. 16
Respondent Demographics ............................................................................................................................................... 23
Research Insights Paper: Research Proves IT Transformation’s Persistent Link to Agility, Innovation, and Business Value 3
© 2018 by The Enterprise Strategy Group, Inc. All Rights Reserved.
Introduction
IT Transformation is the act of modernizing and automating information technology systems and software holistically to improve IT operations and refine relevant business processes. It’s a major endeavor, but quantitative research shows it is well worth the effort to achieve real outcomes.
This report presents findings stemming from original ESG research based on a survey of 4,000 IT decision makers from around the globe.1 Where applicable, it includes year-over-year trending with similar research conducted one year prior. Use the findings to compare your company’s IT competencies against those that have achieved “fully transformed” status and get a clear sense of what they’re accomplishing.
You can also take advantage of a complimentary online IT Transformation self-assessment. It uses the same data to provide in-depth explanations of many benchmarks, and it offers customized recommendations on where you should focus based on your transformation status. Gauge your organization against others, get ideas to transform further, and position your company ahead of competitors.
Market Overview
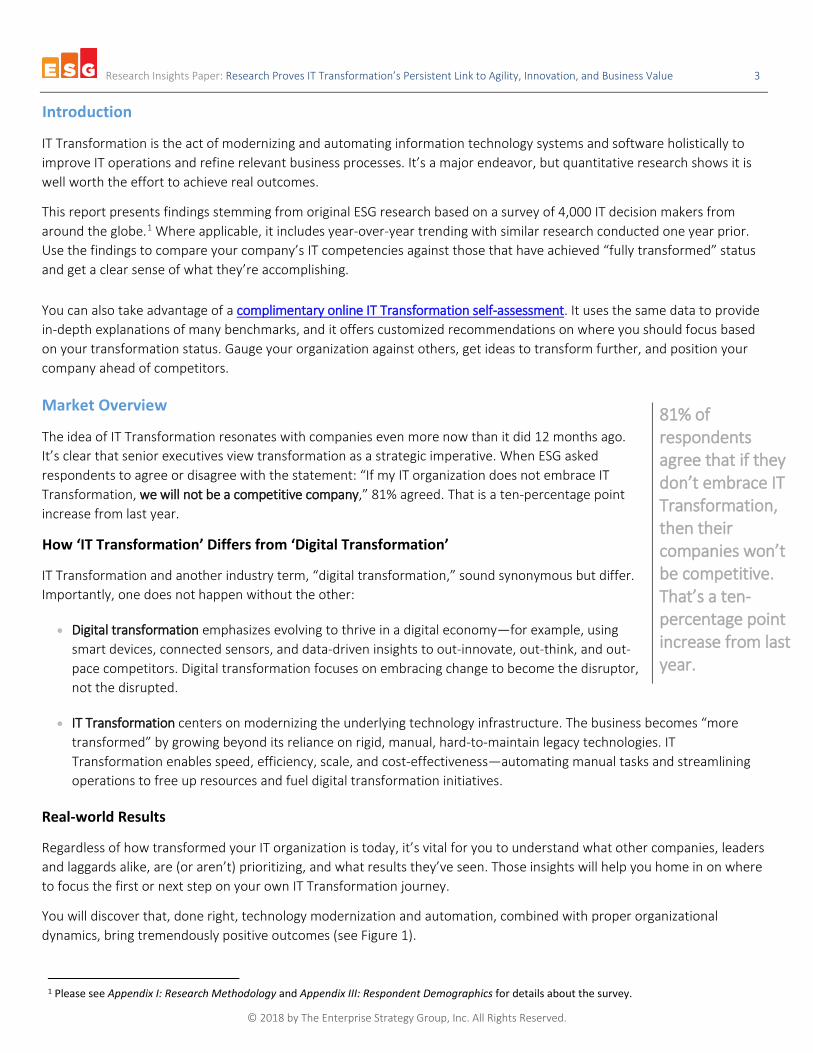
The idea of IT Transformation resonates with companies even more now than it did 12 months ago. It’s clear that senior executives view transformation as a strategic imperative. When ESG asked respondents to agree or disagree with the statement: “If my IT organization does not embrace IT Transformation, we will not be a competitive company,” 81% agreed. That is a ten-percentage point increase from last year.
How ‘IT Transformation’ Differs from ‘Digital Transformation’
IT Transformation and another industry term, “digital transformation,” sound synonymous but differ. Importantly, one does not happen without the other:
• Digital transformation emphasizes evolving to thrive in a digital economy—for example, using smart devices, connected sensors, and data-driven insights to out-innovate, out-think, and out-pace competitors. Digital transformation focuses on embracing change to become the disruptor, not the disrupted.
• IT Transformation centers on modernizing the underlying technology infrastructure. The business becomes “more transformed” by growing beyond its reliance on rigid, manual, hard-to-maintain legacy technologies. IT Transformation enables speed, efficiency, scale, and cost-effectiveness—automating manual tasks and streamlining operations to free up resources and fuel digital transformation initiatives.
Real-world Results
Regardless of how transformed your IT organization is today, it’s vital for you to understand what other companies, leaders and laggards alike, are (or aren’t) prioritizing, and what results they’ve seen. Those insights will help you home in on where to focus the first or next step on your own IT Transformation journey.
You will discover that, done right, technology modernization and automation, combined with proper organizational dynamics, bring tremendously positive outcomes (see Figure 1).
1 Please see Appendix I: Research Methodology and Appendix III: Respondent Demographics for details about the survey.
81% of respondents agree that if they don’t embrace IT Transformation, then their companies won’t be competitive. That’s a ten-percentage point increase from last year.
Research Insights Paper: Research Proves IT Transformation’s Persistent Link to Agility, Innovation, and Business Value 4
© 2018 by The Enterprise Strategy Group, Inc. All Rights Reserved.
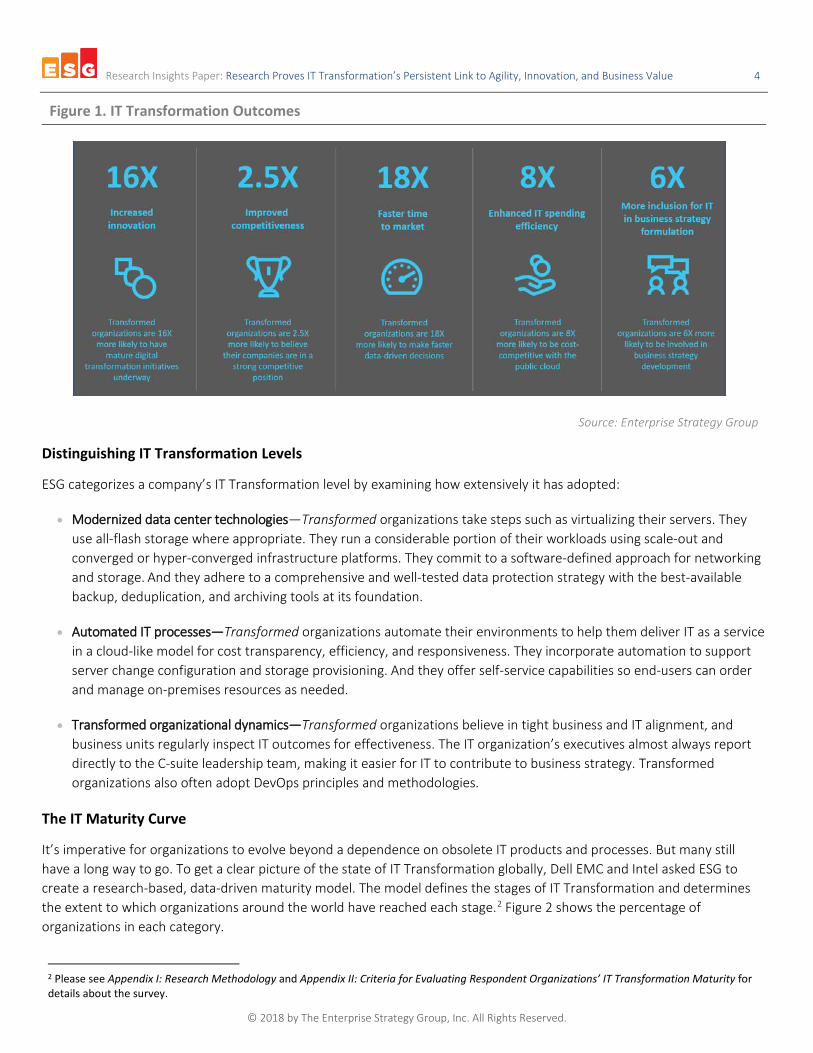
Figure 1. IT Transformation Outcomes
Source: Enterprise Strategy Group
Distinguishing IT Transformation Levels
ESG categorizes a company’s IT Transformation level by examining how extensively it has adopted:
• Modernized data center technologies—Transformed organizations take steps such as virtualizing their servers. They use all-flash storage where appropriate. They run a considerable portion of their workloads using scale-out and converged or hyper-converged infrastructure platforms. They commit to a software-defined approach for networking and storage. And they adhere to a comprehensive and well-tested data protection strategy with the best-available backup, deduplication, and archiving tools at its foundation.
• Automated IT processes—Transformed organizations automate their environments to help them deliver IT as a service in a cloud-like model for cost transparency, efficiency, and responsiveness. They incorporate automation to support server change configuration and storage provisioning. And they offer self-service capabilities so end-users can order and manage on-premises resources as needed.
• Transformed organizational dynamics—Transformed organizations believe in tight business and IT alignment, and business units regularly inspect IT outcomes for effectiveness. The IT organization’s executives almost always report directly to the C-suite leadership team, making it easier for IT to contribute to business strategy. Transformed organizations also often adopt DevOps principles and methodologies.
The IT Maturity Curve
It’s imperative for organizations to evolve beyond a dependence on obsolete IT products and processes. But many still have a long way to go. To get a clear picture of the state of IT Transformation globally, Dell EMC and Intel asked ESG to create a research-based, data-driven maturity model. The model defines the stages of IT Transformation and determines the extent to which organizations around the world have reached each stage.2 Figure 2 shows the percentage of organizations in each category.
2 Please see Appendix I: Research Methodology and Appendix II: Criteria for Evaluating Respondent Organizations’ IT Transformation Maturity for details about the survey.
Research Insights Paper: Research Proves IT Transformation’s Persistent Link to Agility, Innovation, and Business Value 5
© 2018 by The Enterprise Strategy Group, Inc. All Rights Reserved.
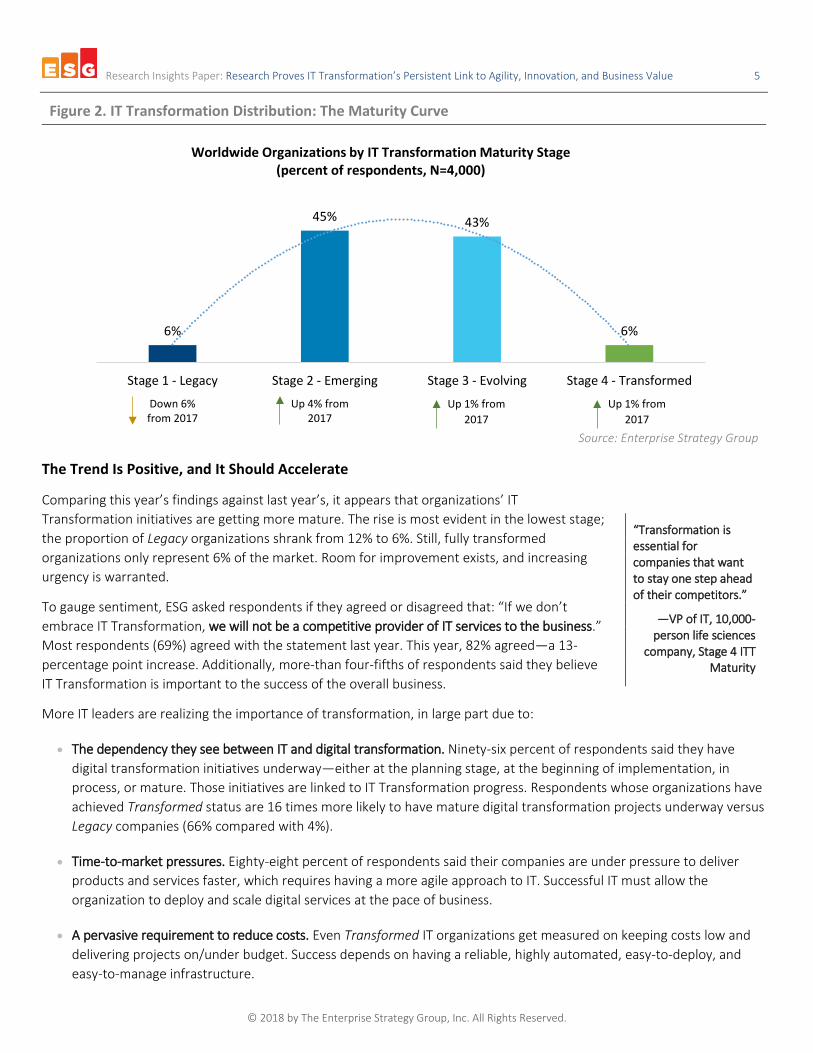
Figure 2. IT Transformation Distribution: The Maturity Curve
Source: Enterprise Strategy Group
The Trend Is Positive, and It Should Accelerate
Comparing this year’s findings against last year’s, it appears that organizations’ IT Transformation initiatives are getting more mature. The rise is most evident in the lowest stage; the proportion of Legacy organizations shrank from 12% to 6%. Still, fully transformed organizations only represent 6% of the market. Room for improvement exists, and increasing urgency is warranted.
To gauge sentiment, ESG asked respondents if they agreed or disagreed that: “If we don’t embrace IT Transformation, we will not be a competitive provider of IT services to the business.” Most respondents (69%) agreed with the statement last year. This year, 82% agreed—a 13-percentage point increase. Additionally, more-than four-fifths of respondents said they believe IT Transformation is important to the success of the overall business.
More IT leaders are realizing the importance of transformation, in large part due to:
• The dependency they see between IT and digital transformation. Ninety-six percent of respondents said they have digital transformation initiatives underway—either at the planning stage, at the beginning of implementation, in process, or mature. Those initiatives are linked to IT Transformation progress. Respondents whose organizations have achieved Transformed status are 16 times more likely to have mature digital transformation projects underway versus Legacy companies (66% compared with 4%).
• Time-to-market pressures. Eighty-eight percent of respondents said their companies are under pressure to deliver products and services faster, which requires having a more agile approach to IT. Successful IT must allow the organization to deploy and scale digital services at the pace of business.
• A pervasive requirement to reduce costs. Even Transformed IT organizations get measured on keeping costs low and delivering projects on/under budget. Success depends on having a reliable, highly automated, easy-to-deploy, and easy-to-manage infrastructure.
6%
45% 43%
6%
Stage 1 - Legacy Stage 2 - Emerging Stage 3 - Evolving Stage 4 - Transformed
Worldwide Organizations by IT Transformation Maturity Stage (percent of respondents, N=4,000)
“Transformation is essential for companies that want to stay one step ahead of their competitors.”
—VP of IT, 10,000-person life sciences
company, Stage 4 ITT Maturity
Down 6% from 2017
Up 4% from 2017
Up 1% from 2017
Up 1% from 2017
Research Insights Paper: Research Proves IT Transformation’s Persistent Link to Agility, Innovation, and Business Value 6
© 2018 by The Enterprise Strategy Group, Inc. All Rights Reserved.
The research also showed a strong link between digital transformation and business confidence. When ESG asked respondents to characterize their company’s forward-looking competitive position from “very strong” to “extremely poor,” 84% of respondents with mature digital transformation initiatives underway said they were in a strong/very strong position to compete and succeed: In fact, the respondent companies with digital transformation initiatives underway were 2.5 times more likely to be confident in their organization’s competitive position than companies that are not pursuing digital transformation initiatives (33%).
Business Performance and Driving Growth
Strong business performance means different things to different organizations. But typically, accelerating innovation, speeding development, outperforming industry peers, keeping customers happy, reducing costs, and driving revenue are good metrics.
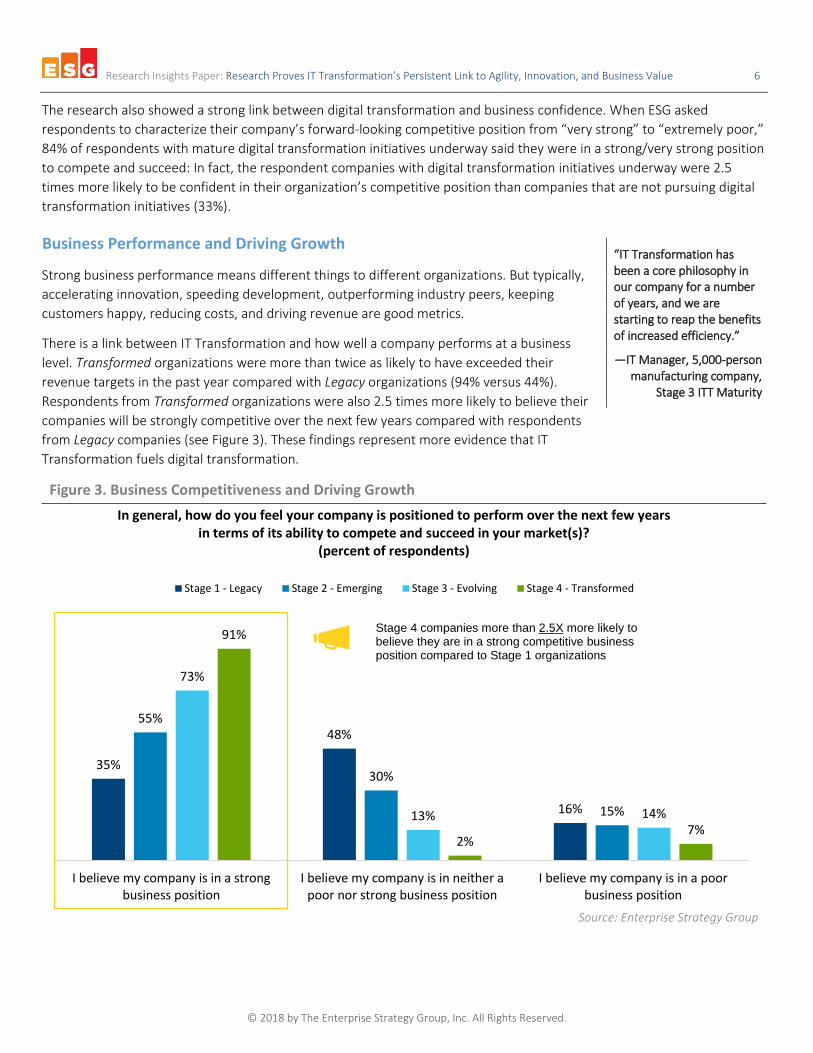
There is a link between IT Transformation and how well a company performs at a business level. Transformed organizations were more than twice as likely to have exceeded their revenue targets in the past year compared with Legacy organizations (94% versus 44%). Respondents from Transformed organizations were also 2.5 times more likely to believe their companies will be strongly competitive over the next few years compared with respondents from Legacy companies (see Figure 3). These findings represent more evidence that IT Transformation fuels digital transformation.
Figure 3. Business Competitiveness and Driving Growth
Source: Enterprise Strategy Group
35%
48%
16%
55%
30%
15%
73%
13% 14%
91%
2%7%
I believe my company is in a strongbusiness position
I believe my company is in neither apoor nor strong business position
I believe my company is in a poorbusiness position
In general, how do you feel your company is positioned to perform over the next few years in terms of its ability to compete and succeed in your market(s)?
(percent of respondents)
Stage 1 - Legacy Stage 2 - Emerging Stage 3 - Evolving Stage 4 - Transformed
“IT Transformation has been a core philosophy in our company for a number of years, and we are starting to reap the benefits of increased efficiency.”
—IT Manager, 5,000-person manufacturing company,
Stage 3 ITT Maturity
Stage 4 companies more than 2.5X more likely to believe they are in a strong competitive business position compared to Stage 1 organizations
Research Insights Paper: Research Proves IT Transformation’s Persistent Link to Agility, Innovation, and Business Value 7
© 2018 by The Enterprise Strategy Group, Inc. All Rights Reserved.
Competing to Win: Speeding Time to Market Through Better IT Agility
At many companies, the time it takes for a product or service to go from concept to general availability depends a lot on how transformed the company’s IT organization is. The IT group is responsible for making sure the applications employees use are performing reliably. IT also is responsible for giving the developers the right tools and capabilities to enable them to meet all product release target dates.
When IT gives internal end-users and partners what they need, when they need it, IT is also helping the business as a whole to give external customers what they want, when they want it.
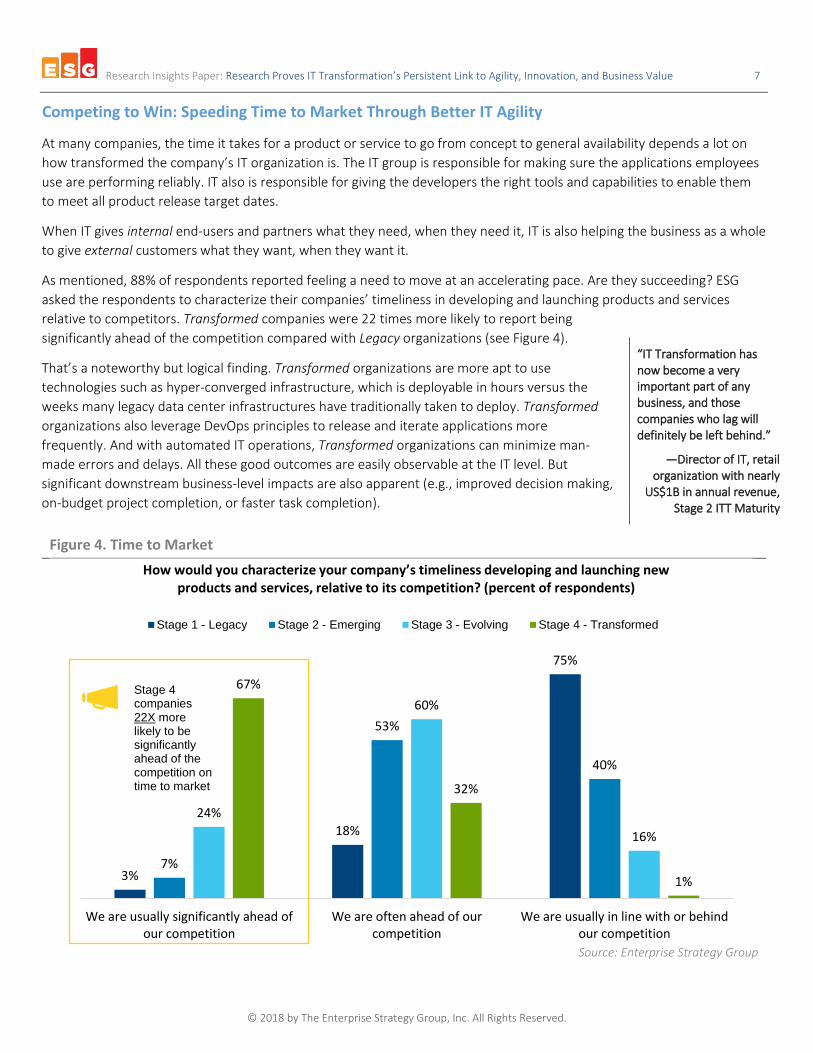
As mentioned, 88% of respondents reported feeling a need to move at an accelerating pace. Are they succeeding? ESG asked the respondents to characterize their companies’ timeliness in developing and launching products and services relative to competitors. Transformed companies were 22 times more likely to report being significantly ahead of the competition compared with Legacy organizations (see Figure 4).
That’s a noteworthy but logical finding. Transformed organizations are more apt to use technologies such as hyper-converged infrastructure, which is deployable in hours versus the weeks many legacy data center infrastructures have traditionally taken to deploy. Transformed organizations also leverage DevOps principles to release and iterate applications more frequently. And with automated IT operations, Transformed organizations can minimize man-made errors and delays. All these good outcomes are easily observable at the IT level. But significant downstream business-level impacts are also apparent (e.g., improved decision making, on-budget project completion, or faster task completion).
Figure 4. Time to Market
Source: Enterprise Strategy Group
3%
18%
75%
7%
53%
40%
24%
60%
16%
67%
32%
1%
We are usually significantly ahead ofour competition
We are often ahead of ourcompetition
We are usually in line with or behindour competition
How would you characterize your company’s timeliness developing and launching new products and services, relative to its competition? (percent of respondents)
Stage 1 - Legacy Stage 2 - Emerging Stage 3 - Evolving Stage 4 - Transformed
Stage 4 companies 22X more likely to be significantly ahead of the competition on time to market
“IT Transformation has now become a very important part of any business, and those companies who lag will definitely be left behind.”
—Director of IT, retail organization with nearly
US$1B in annual revenue, Stage 2 ITT Maturity
Research Insights Paper: Research Proves IT Transformation’s Persistent Link to Agility, Innovation, and Business Value 8
© 2018 by The Enterprise Strategy Group, Inc. All Rights Reserved.
Using Data to Drive Decision Making
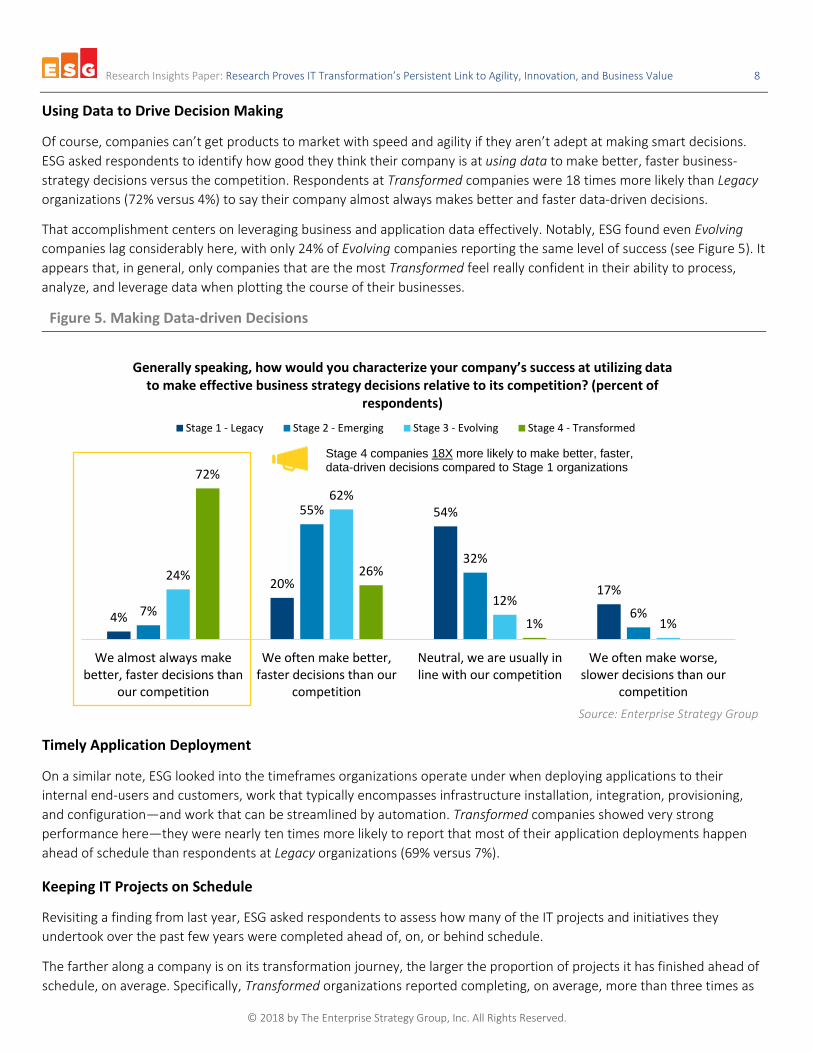
Of course, companies can’t get products to market with speed and agility if they aren’t adept at making smart decisions. ESG asked respondents to identify how good they think their company is at using data to make better, faster business-strategy decisions versus the competition. Respondents at Transformed companies were 18 times more likely than Legacy organizations (72% versus 4%) to say their company almost always makes better and faster data-driven decisions.
That accomplishment centers on leveraging business and application data effectively. Notably, ESG found even Evolving companies lag considerably here, with only 24% of Evolving companies reporting the same level of success (see Figure 5). It appears that, in general, only companies that are the most Transformed feel really confident in their ability to process, analyze, and leverage data when plotting the course of their businesses.
Figure 5. Making Data-driven Decisions
Source: Enterprise Strategy Group
Timely Application Deployment
On a similar note, ESG looked into the timeframes organizations operate under when deploying applications to their internal end-users and customers, work that typically encompasses infrastructure installation, integration, provisioning, and configuration—and work that can be streamlined by automation. Transformed companies showed very strong performance here—they were nearly ten times more likely to report that most of their application deployments happen ahead of schedule than respondents at Legacy organizations (69% versus 7%).
Keeping IT Projects on Schedule
Revisiting a finding from last year, ESG asked respondents to assess how many of the IT projects and initiatives they undertook over the past few years were completed ahead of, on, or behind schedule.
The farther along a company is on its transformation journey, the larger the proportion of projects it has finished ahead of schedule, on average. Specifically, Transformed organizations reported completing, on average, more than three times as
4%
20%
54%
17%7%
55%
32%
6%
24%
62%
12%
1%
72%
26%
1%
We almost always makebetter, faster decisions than
our competition
We often make better,faster decisions than our
competition
Neutral, we are usually inline with our competition
We often make worse,slower decisions than our
competition
Generally speaking, how would you characterize your company’s success at utilizing data to make effective business strategy decisions relative to its competition? (percent of
respondents)
Stage 1 - Legacy Stage 2 - Emerging Stage 3 - Evolving Stage 4 - Transformed
Stage 4 companies 18X more likely to make better, faster, data-driven decisions compared to Stage 1 organizations
Research Insights Paper: Research Proves IT Transformation’s Persistent Link to Agility, Innovation, and Business Value 9
© 2018 by The Enterprise Strategy Group, Inc. All Rights Reserved.
many of their IT projects ahead of schedule in the past few years versus Legacy organizations (34% of projects on average versus 10%).
Time to Provision VMs
The time needed to provision virtual machines (VMs) is a tactical but relevant measurement tied to agility. It’s certainly top-of-mind among IT practitioners, considering that the VM has become a core building block of the modern IT environment.
ESG asked respondents how long it takes them to spin up a VM, starting from the time they get the request. Respondents at Transformed companies were more than four times more likely to say that they fulfill VM provisioning requests in under four hours than Legacy organizations (33% compared with 8%).
Delivering Business Value: The Economics of IT
IT organizations have always had to operate effectively at the lowest possible cost. The research shows that organizations that have progressed farthest along the IT Transformation maturity curve are consistently achieving higher spending efficiency than less-mature organizations are.
This is an extremely promising finding; after all, reducing routine IT operational costs may allow organizations to fund new, business-critical digital transformation initiatives.
IT Projects Under, On, and Over Budget
ESG asked respondents what percentage of their IT projects over the last few years have been completed under, on, or over budget. Respondents at Transformed organizations said they are completing 14% more IT projects under budget than Legacy companies are (on average, 27% of projects versus 13%—more than twice as many projects).
Interestingly, it also looks like this trend is strengthening. Last year, the gap was just 10 percentage points, with Transformed companies reporting completing 25% of their IT projects under budget versus 14.9% for Legacy companies.
Innovation versus Keeping the Lights On
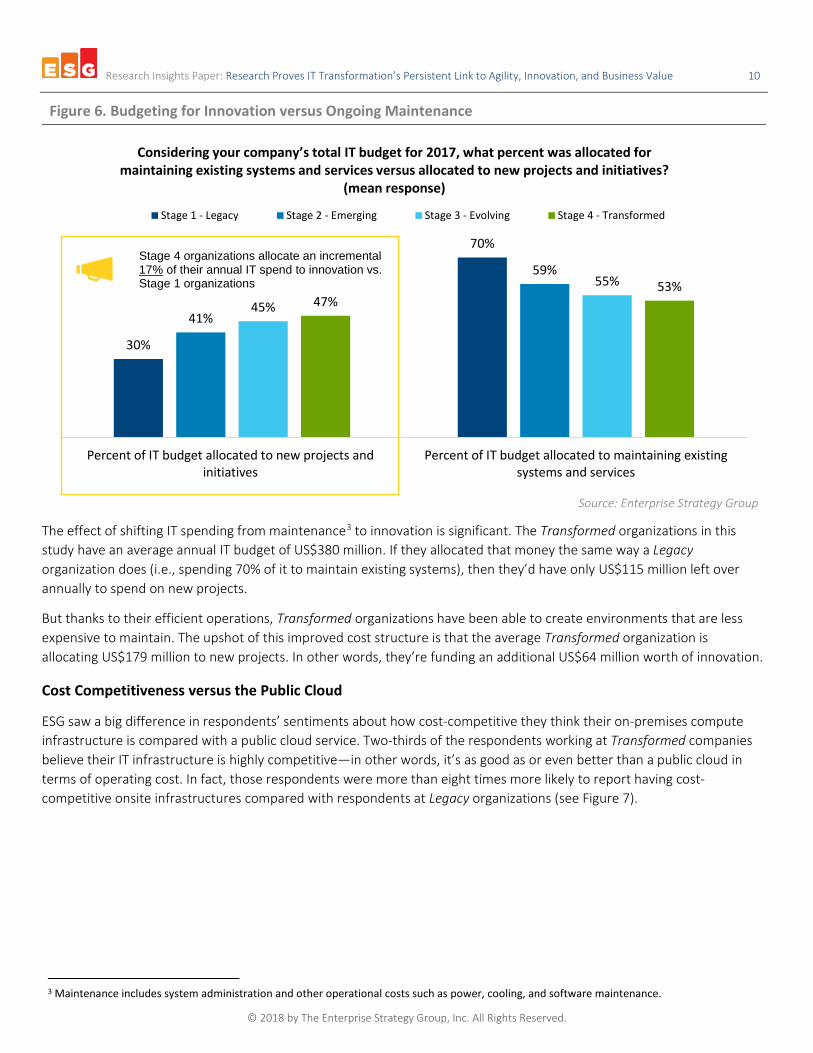
ESG asked respondents to split their IT budget into two categories: budget for new projects or initiatives, and budget for maintaining existing systems and services. On average, Transformed organizations are spending 47% of their annual IT budget on innovation. Legacy companies, on the other hand, are spending just 30% (see Figure 6).
Again, there is a clearer distinction this year between Legacy and Transformed organizations. In last year’s study, Transformed companies were allocating, on average, an incremental 12 percentage points of their annual IT budget to innovation versus this year’s 17 percentage point delta.
ESG views this finding to be yet more evidence of the increasing value associated with striving for full IT Transformation.
IT Staff Allocation
Transformed organizations don’t need to spend as much time maintaining existing infrastructure. They can shift staff from classic IT operations such as infrastructure deployment, management, and monitoring to higher-value activities such as strategic planning, architecture, and application development. ESG research shows that, on average, Transformed companies are able to shift an extra 12% of their IT staff to higher-value activities. ___________________ But what does that mean from a real-world standpoint?
Consider a 7,100-person company with a 355-person full-time IT staff. If it’s a Stage 1 Legacy company, 178 of those staffers are there just to keep the lights on.
If it’s a Stage 4 Transformed company, that number drops to 137—with 41 people instead dedicating themselves to strategic endeavors such as planning, application development, architecture enhancement, and digital transformation.
Research Insights Paper: Research Proves IT Transformation’s Persistent Link to Agility, Innovation, and Business Value 10
© 2018 by The Enterprise Strategy Group, Inc. All Rights Reserved.
Figure 6. Budgeting for Innovation versus Ongoing Maintenance
Source: Enterprise Strategy Group
The effect of shifting IT spending from maintenance3 to innovation is significant. The Transformed organizations in this study have an average annual IT budget of US$380 million. If they allocated that money the same way a Legacy organization does (i.e., spending 70% of it to maintain existing systems), then they’d have only US$115 million left over annually to spend on new projects.
But thanks to their efficient operations, Transformed organizations have been able to create environments that are less expensive to maintain. The upshot of this improved cost structure is that the average Transformed organization is allocating US$179 million to new projects. In other words, they’re funding an additional US$64 million worth of innovation.
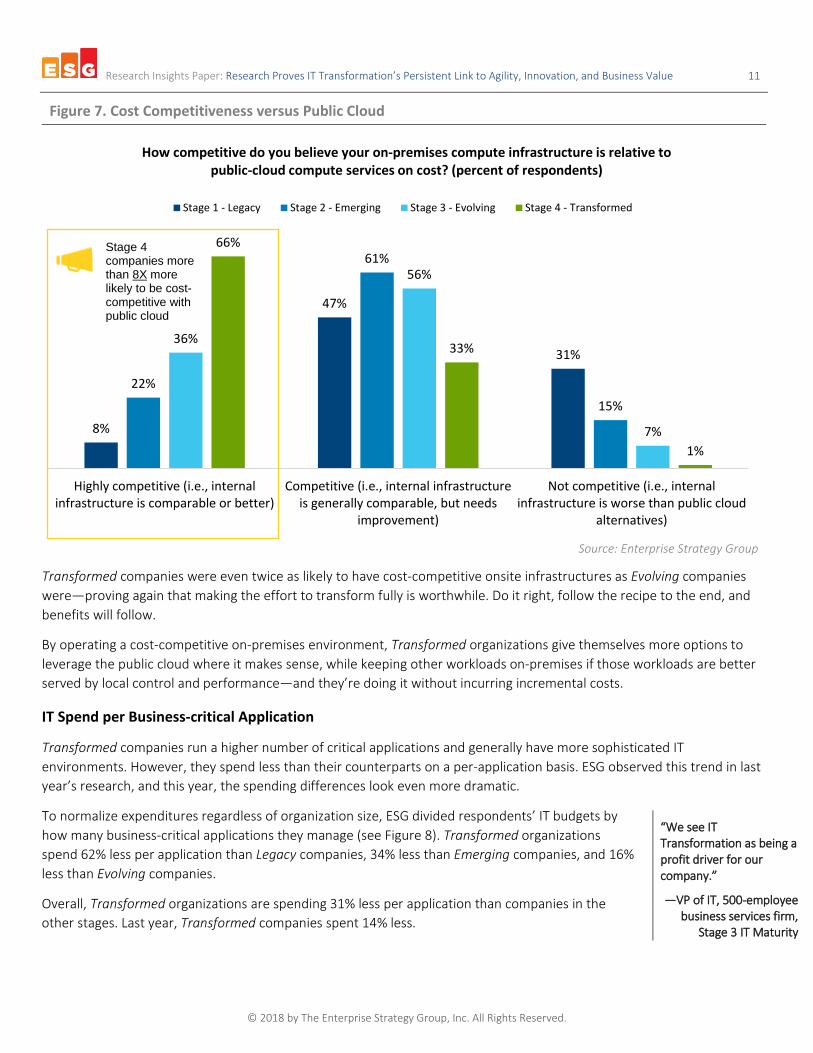
Cost Competitiveness versus the Public Cloud
ESG saw a big difference in respondents’ sentiments about how cost-competitive they think their on-premises compute infrastructure is compared with a public cloud service. Two-thirds of the respondents working at Transformed companies believe their IT infrastructure is highly competitive—in other words, it’s as good as or even better than a public cloud in terms of operating cost. In fact, those respondents were more than eight times more likely to report having cost-competitive onsite infrastructures compared with respondents at Legacy organizations (see Figure 7).
3 Maintenance includes system administration and other operational costs such as power, cooling, and software maintenance.
30%
70%
41%
59%
45%
55%47%
53%
Percent of IT budget allocated to new projects andinitiatives
Percent of IT budget allocated to maintaining existingsystems and services
Considering your company’s total IT budget for 2017, what percent was allocated for maintaining existing systems and services versus allocated to new projects and initiatives?
(mean response)
Stage 1 - Legacy Stage 2 - Emerging Stage 3 - Evolving Stage 4 - Transformed
Stage 4 organizations allocate an incremental 17% of their annual IT spend to innovation vs. Stage 1 organizations
Research Insights Paper: Research Proves IT Transformation’s Persistent Link to Agility, Innovation, and Business Value 11
© 2018 by The Enterprise Strategy Group, Inc. All Rights Reserved.
Figure 7. Cost Competitiveness versus Public Cloud
Source: Enterprise Strategy Group
Transformed companies were even twice as likely to have cost-competitive onsite infrastructures as Evolving companies were—proving again that making the effort to transform fully is worthwhile. Do it right, follow the recipe to the end, and benefits will follow.
By operating a cost-competitive on-premises environment, Transformed organizations give themselves more options to leverage the public cloud where it makes sense, while keeping other workloads on-premises if those workloads are better served by local control and performance—and they’re doing it without incurring incremental costs.
IT Spend per Business-critical Application
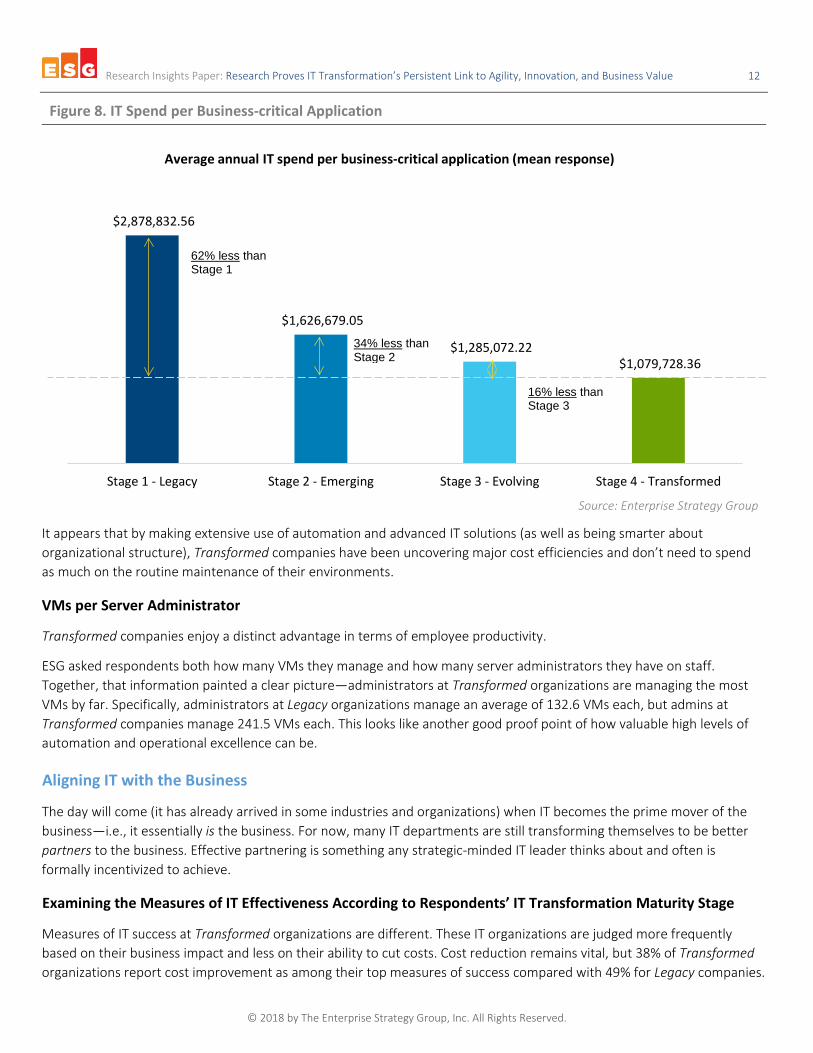
Transformed companies run a higher number of critical applications and generally have more sophisticated IT environments. However, they spend less than their counterparts on a per-application basis. ESG observed this trend in last year’s research, and this year, the spending differences look even more dramatic.
To normalize expenditures regardless of organization size, ESG divided respondents’ IT budgets by how many business-critical applications they manage (see Figure 8). Transformed organizations spend 62% less per application than Legacy companies, 34% less than Emerging companies, and 16% less than Evolving companies.
Overall, Transformed organizations are spending 31% less per application than companies in the other stages. Last year, Transformed companies spent 14% less.
8%
47%
31%
22%
61%
15%
36%
56%
7%
66%
33%
1%
Highly competitive (i.e., internalinfrastructure is comparable or better)
Competitive (i.e., internal infrastructureis generally comparable, but needs
improvement)
Not competitive (i.e., internalinfrastructure is worse than public cloud
alternatives)
How competitive do you believe your on-premises compute infrastructure is relative to public-cloud compute services on cost? (percent of respondents)
Stage 1 - Legacy Stage 2 - Emerging Stage 3 - Evolving Stage 4 - Transformed
“We see IT Transformation as being a profit driver for our company.”
—VP of IT, 500-employee business services firm,
Stage 3 IT Maturity
Stage 4 companies more than 8X more likely to be cost-competitive with public cloud
Research Insights Paper: Research Proves IT Transformation’s Persistent Link to Agility, Innovation, and Business Value 12
© 2018 by The Enterprise Strategy Group, Inc. All Rights Reserved.
Figure 8. IT Spend per Business-critical Application
Source: Enterprise Strategy Group
It appears that by making extensive use of automation and advanced IT solutions (as well as being smarter about organizational structure), Transformed companies have been uncovering major cost efficiencies and don’t need to spend as much on the routine maintenance of their environments.
VMs per Server Administrator
Transformed companies enjoy a distinct advantage in terms of employee productivity.
ESG asked respondents both how many VMs they manage and how many server administrators they have on staff. Together, that information painted a clear picture—administrators at Transformed organizations are managing the most VMs by far. Specifically, administrators at Legacy organizations manage an average of 132.6 VMs each, but admins at Transformed companies manage 241.5 VMs each. This looks like another good proof point of how valuable high levels of automation and operational excellence can be.
Aligning IT with the Business
The day will come (it has already arrived in some industries and organizations) when IT becomes the prime mover of the business—i.e., it essentially is the business. For now, many IT departments are still transforming themselves to be better partners to the business. Effective partnering is something any strategic-minded IT leader thinks about and often is formally incentivized to achieve.
Examining the Measures of IT Effectiveness According to Respondents’ IT Transformation Maturity Stage
Measures of IT success at Transformed organizations are different. These IT organizations are judged more frequently based on their business impact and less on their ability to cut costs. Cost reduction remains vital, but 38% of Transformed organizations report cost improvement as among their top measures of success compared with 49% for Legacy companies.
$2,878,832.56
$1,626,679.05
$1,285,072.22 $1,079,728.36
Stage 1 - Legacy Stage 2 - Emerging Stage 3 - Evolving Stage 4 - Transformed
Average annual IT spend per business-critical application (mean response)
62% less than Stage 1
34% less than Stage 2
16% less than Stage 3
Research Insights Paper: Research Proves IT Transformation’s Persistent Link to Agility, Innovation, and Business Value 13
© 2018 by The Enterprise Strategy Group, Inc. All Rights Reserved.
Business leaders at Transformed companies put more emphasis on measuring how the IT group supports new revenue streams. Thirty-one percent of Transformed IT organizations cite that as a top measurement metric compared with only 13% of Legacy companies.
As IT organizations progress in transforming themselves, the likelihood that they will be judged on how they enable and support revenue-generation efforts goes up, likely because they’ve already proven they understand budget optimization. For any IT executive hoping to be goaled on something more aspirational than “cost control,” the appeal of IT Transformation should be clear.
IT Involvement with Business Strategy
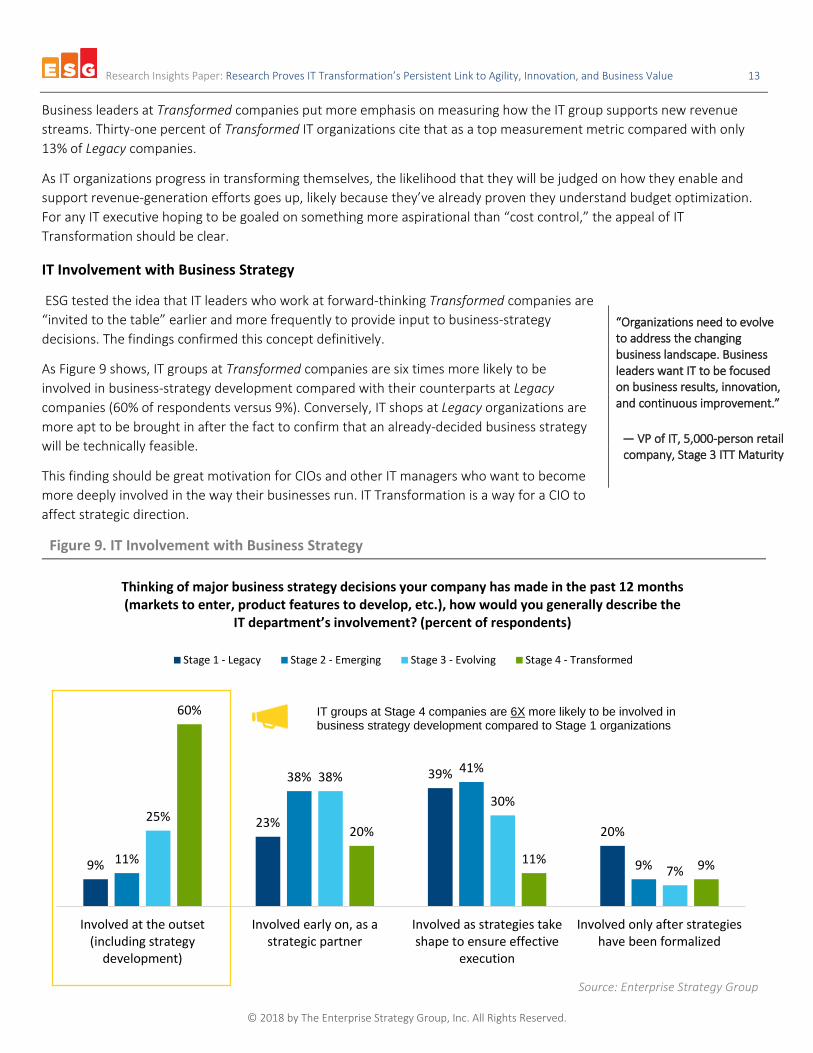
ESG tested the idea that IT leaders who work at forward-thinking Transformed companies are “invited to the table” earlier and more frequently to provide input to business-strategy decisions. The findings confirmed this concept definitively.
As Figure 9 shows, IT groups at Transformed companies are six times more likely to be involved in business-strategy development compared with their counterparts at Legacy companies (60% of respondents versus 9%). Conversely, IT shops at Legacy organizations are more apt to be brought in after the fact to confirm that an already-decided business strategy will be technically feasible.
This finding should be great motivation for CIOs and other IT managers who want to become more deeply involved in the way their businesses run. IT Transformation is a way for a CIO to affect strategic direction.
Figure 9. IT Involvement with Business Strategy
Source: Enterprise Strategy Group
9%
23%
39%
20%
11%
38%41%
9%
25%
38%
30%
7%
60%
20%
11% 9%
Involved at the outset(including strategy
development)
Involved early on, as astrategic partner
Involved as strategies takeshape to ensure effective
execution
Involved only after strategieshave been formalized
Thinking of major business strategy decisions your company has made in the past 12 months (markets to enter, product features to develop, etc.), how would you generally describe the
IT department’s involvement? (percent of respondents)
Stage 1 - Legacy Stage 2 - Emerging Stage 3 - Evolving Stage 4 - Transformed
IT groups at Stage 4 companies are 6X more likely to be involved in business strategy development compared to Stage 1 organizations
“Organizations need to evolve to address the changing business landscape. Business leaders want IT to be focused on business results, innovation, and continuous improvement.”
— VP of IT, 5,000-person retail company, Stage 3 ITT Maturity
Research Insights Paper: Research Proves IT Transformation’s Persistent Link to Agility, Innovation, and Business Value 14
© 2018 by The Enterprise Strategy Group, Inc. All Rights Reserved.
How Executive Leadership Evaluates the IT Organization’s Effectiveness
ESG asked all 4,000 respondents how their company measures the IT organization for success. Respondents across all the IT Transformation maturity levels reported cost reduction (42%) and on-budget/on-time project delivery (35%) were among the most frequently used measures. Other measurements included user satisfaction levels (34%), and IT’s ability to enable business process improvement (32%), ensure application uptime (29%), and enable new revenue streams (25%).
IT/Line of Business Cooperation
Respondents described the degree of cooperation and collaboration they believe exists between the IT department and lines of business. Decision makers at Transformed companies were more than 18 times more likely to report high levels of cooperation versus Legacy organizations (74% of respondents versus 4%). This is the second year ESG has asked that question, and the delta between Legacy and Transformed companies is widening. A year ago, it was 60 percentage points.
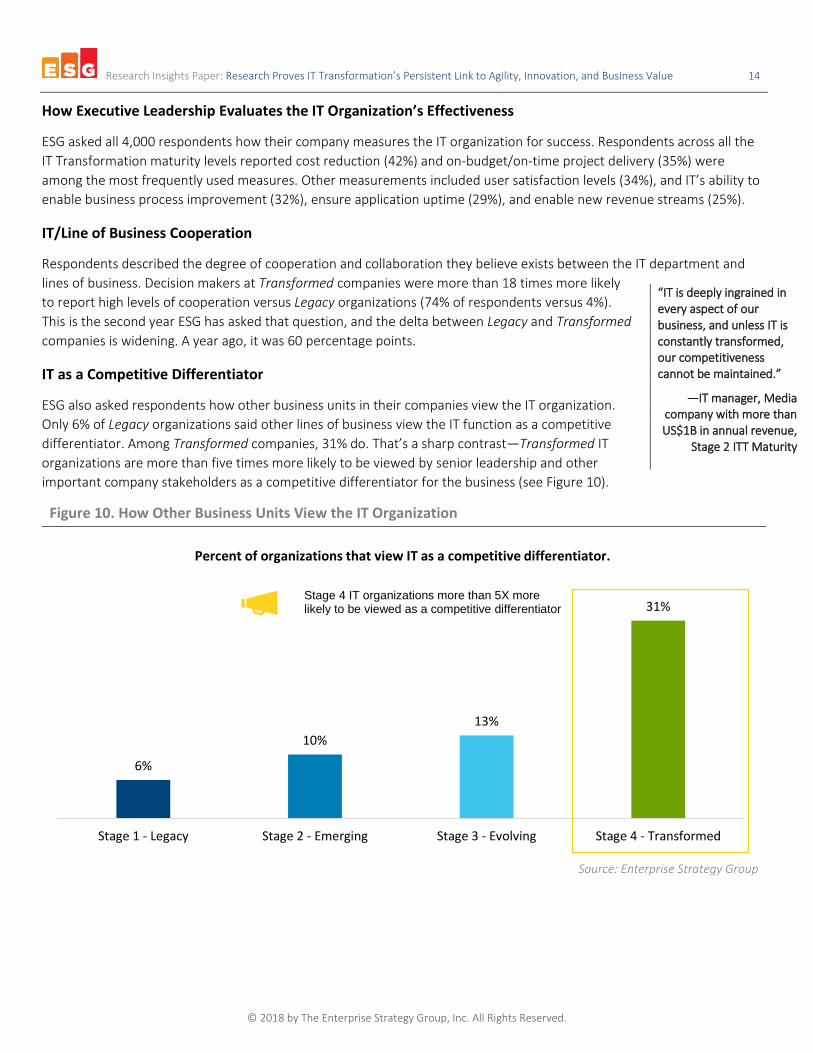
IT as a Competitive Differentiator
ESG also asked respondents how other business units in their companies view the IT organization. Only 6% of Legacy organizations said other lines of business view the IT function as a competitive differentiator. Among Transformed companies, 31% do. That’s a sharp contrast—Transformed IT organizations are more than five times more likely to be viewed by senior leadership and other important company stakeholders as a competitive differentiator for the business (see Figure 10).
Figure 10. How Other Business Units View the IT Organization
Source: Enterprise Strategy Group
6%
10%13%
31%
Stage 1 - Legacy Stage 2 - Emerging Stage 3 - Evolving Stage 4 - Transformed
Percent of organizations that view IT as a competitive differentiator.
“IT is deeply ingrained in every aspect of our business, and unless IT is constantly transformed, our competitiveness cannot be maintained.”
—IT manager, Media company with more than US$1B in annual revenue,
Stage 2 ITT Maturity
Stage 4 IT organizations more than 5X more likely to be viewed as a competitive differentiator
Research Insights Paper: Research Proves IT Transformation’s Persistent Link to Agility, Innovation, and Business Value 15
© 2018 by The Enterprise Strategy Group, Inc. All Rights Reserved.
The Bigger Truth
At this point, the business world has enthusiastically accepted that digital transformation is worthwhile for companies and for customers. ESG’s research data supports that position.
Select IT organizations have employed infrastructure technologies and processes broadly to make them more agile, flexible, innovative, user-oriented, and customer-focused. To put it another way, they are engaging in IT Transformation, and, by doing so, they are moving the conceptual digital transformation conversation from “ideal” to “real.”
These leaders implement high-performance all-flash arrays to support greater amounts of increasingly performance-sensitive, applications. They utilize scale-out architectures as scale-up solutions become depreciated, and roll out converged and hyper-converged platforms to speed deployment and lower the management burden. They incorporate software-defined networking and storage solutions to add flexibility to their environments while lowering costs. They deploy high-performance servers to run next-generation workloads and implement comprehensive data protection solutions to ensure always-on availability. They add automation for resource elasticity and enable self-service provisioning to provide users with public cloud-like experience. And they ensure that communication between IT and business stakeholders is meaningful to deliver results.
As this paper has shown, this is not transformation for transformation’s sake. The factors that collectively establish a company’s IT Transformation status, i.e., its place on ESG’s IT Transformation maturity curve, are numerous and diverse. But they share one theme—when taken together, they are strongly correlated to operating economically, productively, and responsively. Those achievements can help any organization out-innovate and outperform its competition.
Assess Your Own IT Transformation Maturity
To enable greater IT Transformation maturity, you must first understand where you stand today. Dell EMC, Intel, and ESG have made available an interactive online assessment based on this research. This free-of-charge tool allows you to see where you stand in relation to your peers and helps you understand your strengths and weaknesses.
Start the journey toward transforming your IT organization, accelerating the pace of innovation, and fueling tomorrow’s digital transformation initiatives today.
“IT Transformation means being able to transform a less flexible organization into a more proactive and agile team that can respond quickly to business needs.”
— CIO, retail company with more than $US5B in annual
revenue, Stage 4 IT Maturity
Launch Assessment Now!
Research Insights Paper: Research Proves IT Transformation’s Persistent Link to Agility, Innovation, and Business Value 16
© 2018 by The Enterprise Strategy Group, Inc. All Rights Reserved.
Appendices
Research Methodology
To gather data for this report, ESG conducted a comprehensive online survey of IT executives from private- and public-sector organizations in 16 countries: U.S. (13%), Canada (3%), U.K. (13%), France (10%), Germany (13%), Italy (2%), Netherlands (1%), Russia (1%), Australia/New Zealand (6%), Japan (12%), China (3%), India (10%), Hong Kong (3%), Brazil (5%), and Mexico (6%). The survey was fielded between September 19, 2017 and November 6, 2017.
To qualify for this survey, respondents were required to be familiar with their organizations’ current and future IT budget and spending plans and involved in their organizations’ infrastructure (e.g., storage, servers, networking, virtualization, and/or data protection) purchase processes.
After filtering out unqualified respondents, removing duplicate responses, and screening the remaining completed responses (on several criteria) for data integrity, a final sample of 4,000 respondents remained.
All respondents were provided an incentive to complete the survey in the form of cash awards and/or cash equivalents. Note: Totals in figures and tables throughout this report may not add up to 100% due to rounding.
To calculate maturity levels, ESG asked each respondent questions about their IT environment and processes—allocating a corresponding number of maturity points to each question and answer. The sum of the points represented an organization’s total maturity score.
An organization could earn 0 to 100 points. Those with 0 to 25 points were classified as Stage 1 (or Legacy) organizations. Organizations earning 25.5 to 50 points were Stage 2 (or Emerging) organizations. If they earned 50.5 to 75 points, they were Stage 3 (or Evolving) organizations, and if they earned 75.5 to 100 points, they were Stage 4 (or Transformed).
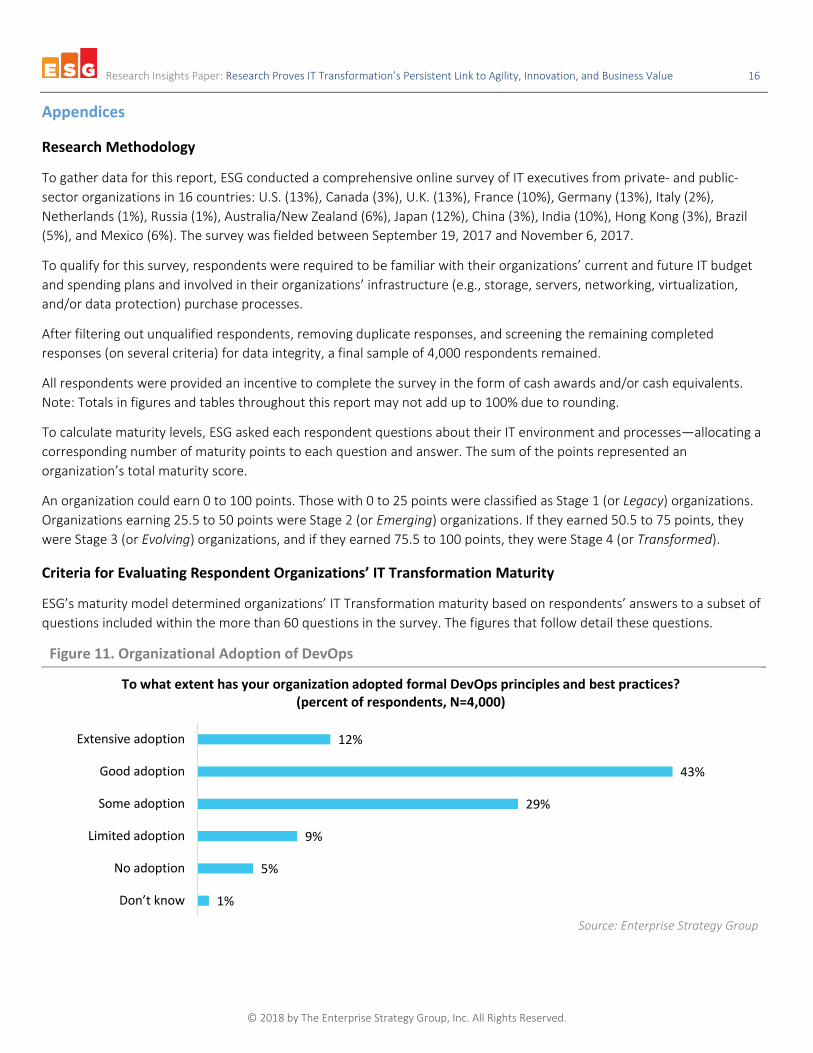
Criteria for Evaluating Respondent Organizations’ IT Transformation Maturity
ESG’s maturity model determined organizations’ IT Transformation maturity based on respondents’ answers to a subset of questions included within the more than 60 questions in the survey. The figures that follow detail these questions.
Figure 11. Organizational Adoption of DevOps
Source: Enterprise Strategy Group
1%
5%
9%
29%
43%
12%
Don’t know
No adoption
Limited adoption
Some adoption
Good adoption
Extensive adoption
To what extent has your organization adopted formal DevOps principles and best practices? (percent of respondents, N=4,000)
Research Insights Paper: Research Proves IT Transformation’s Persistent Link to Agility, Innovation, and Business Value 17
© 2018 by The Enterprise Strategy Group, Inc. All Rights Reserved.
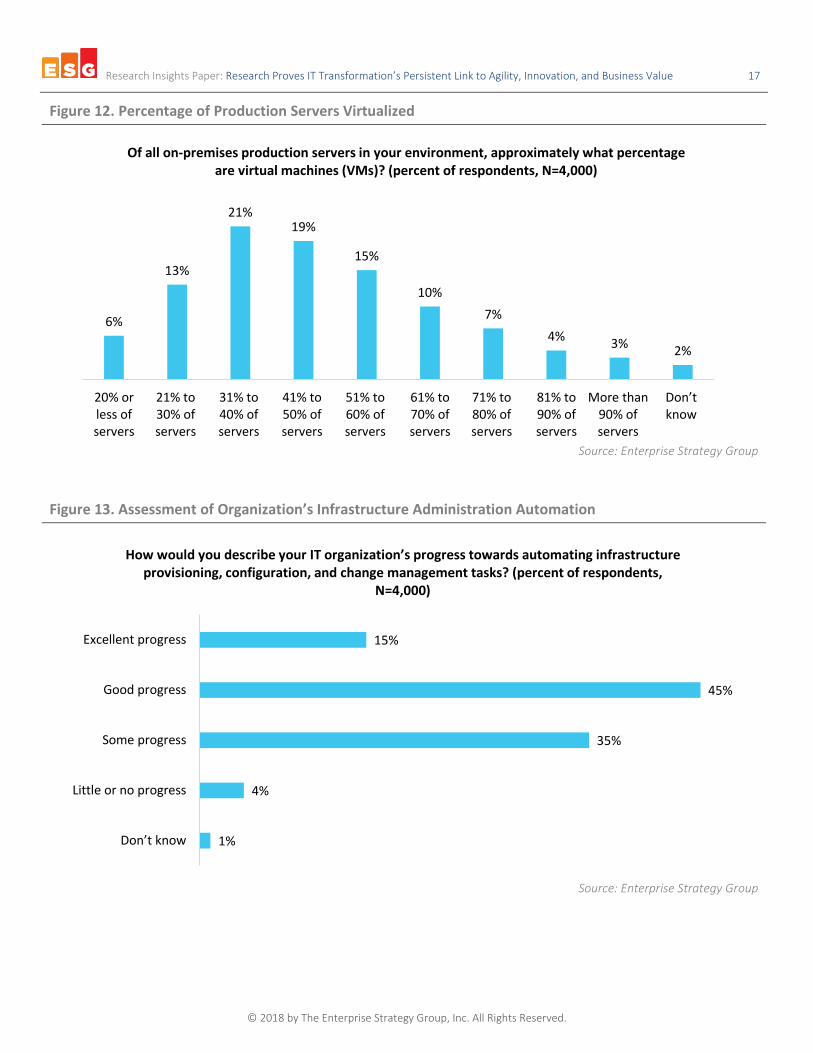
Figure 12. Percentage of Production Servers Virtualized
Source: Enterprise Strategy Group
Figure 13. Assessment of Organization’s Infrastructure Administration Automation
Source: Enterprise Strategy Group
6%
13%
21%19%
15%
10%7%
4% 3% 2%
20% orless ofservers
21% to30% ofservers
31% to40% ofservers
41% to50% ofservers
51% to60% ofservers
61% to70% ofservers
71% to80% ofservers
81% to90% ofservers
More than90% ofservers
Don’t know
Of all on-premises production servers in your environment, approximately what percentage are virtual machines (VMs)? (percent of respondents, N=4,000)
1%
4%
35%
45%
15%
Don’t know
Little or no progress
Some progress
Good progress
Excellent progress
How would you describe your IT organization’s progress towards automating infrastructure provisioning, configuration, and change management tasks? (percent of respondents,
N=4,000)
Research Insights Paper: Research Proves IT Transformation’s Persistent Link to Agility, Innovation, and Business Value 18
© 2018 by The Enterprise Strategy Group, Inc. All Rights Reserved.
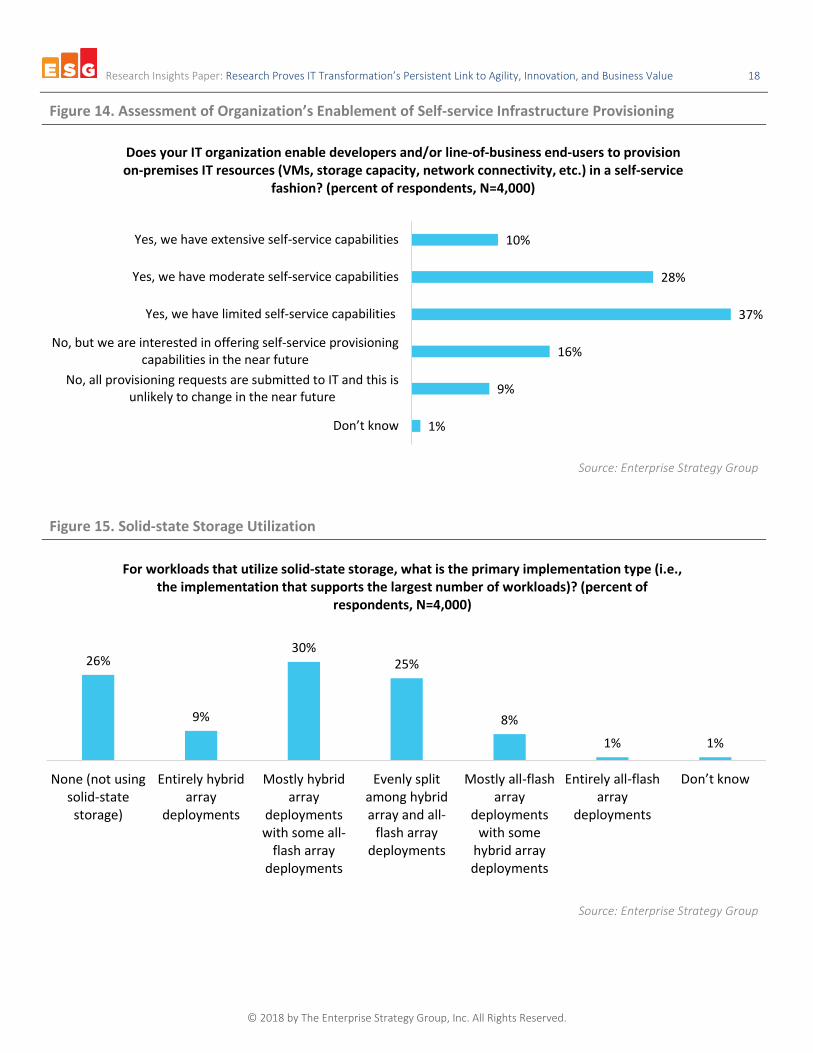
Figure 14. Assessment of Organization’s Enablement of Self-service Infrastructure Provisioning
Source: Enterprise Strategy Group
Figure 15. Solid-state Storage Utilization
Source: Enterprise Strategy Group
1%
9%
16%
37%
28%
10%
Don’t know
No, all provisioning requests are submitted to IT and this isunlikely to change in the near future
No, but we are interested in offering self-service provisioningcapabilities in the near future
Yes, we have limited self-service capabilities
Yes, we have moderate self-service capabilities
Yes, we have extensive self-service capabilities
Does your IT organization enable developers and/or line-of-business end-users to provision on-premises IT resources (VMs, storage capacity, network connectivity, etc.) in a self-service
fashion? (percent of respondents, N=4,000)
26%
9%
30%25%
8%
1% 1%
None (not usingsolid-statestorage)
Entirely hybridarray
deployments
Mostly hybridarray
deploymentswith some all-
flash arraydeployments
Evenly splitamong hybridarray and all-
flash arraydeployments
Mostly all-flasharray
deploymentswith some
hybrid arraydeployments
Entirely all-flasharray
deployments
Don’t know
For workloads that utilize solid-state storage, what is the primary implementation type (i.e., the implementation that supports the largest number of workloads)? (percent of
respondents, N=4,000)
Research Insights Paper: Research Proves IT Transformation’s Persistent Link to Agility, Innovation, and Business Value 19
© 2018 by The Enterprise Strategy Group, Inc. All Rights Reserved.
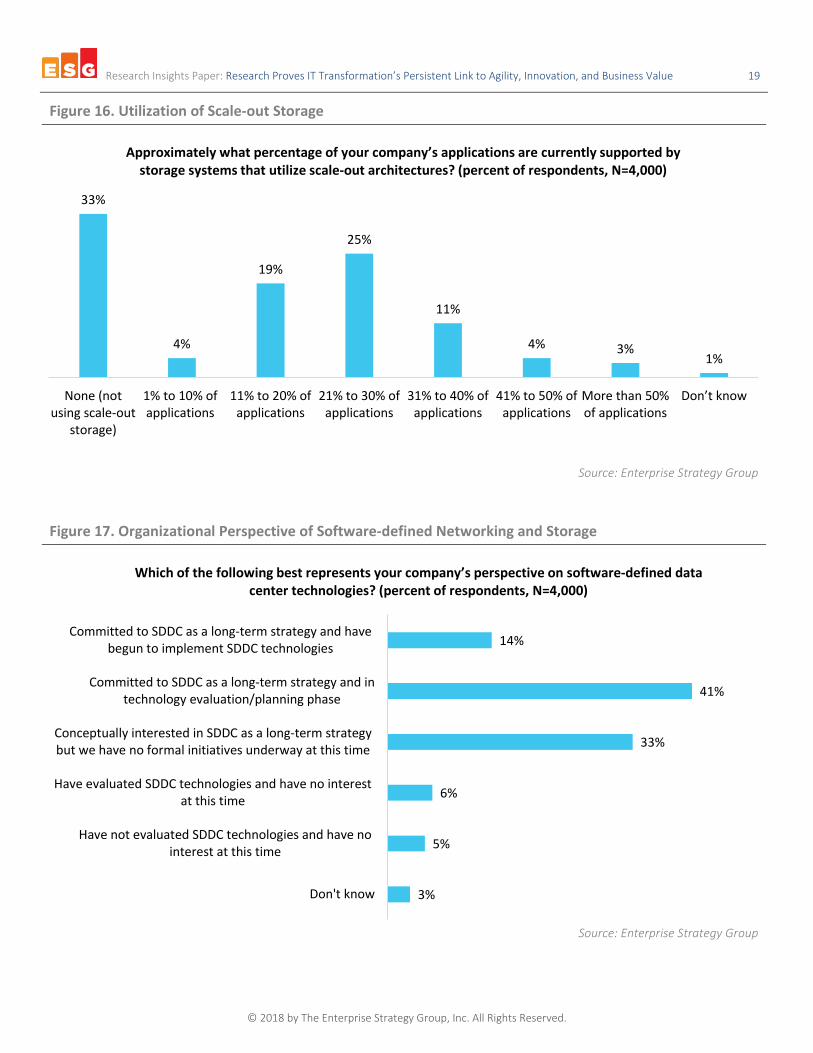
Figure 16. Utilization of Scale-out Storage
Source: Enterprise Strategy Group
Figure 17. Organizational Perspective of Software-defined Networking and Storage
Source: Enterprise Strategy Group
33%
4%
19%
25%
11%
4% 3%1%
None (notusing scale-out
storage)
1% to 10% ofapplications
11% to 20% ofapplications
21% to 30% ofapplications
31% to 40% ofapplications
41% to 50% ofapplications
More than 50%of applications
Don’t know
Approximately what percentage of your company’s applications are currently supported by storage systems that utilize scale-out architectures? (percent of respondents, N=4,000)
3%
5%
6%
33%
41%
14%
Don't know
Have not evaluated SDDC technologies and have nointerest at this time
Have evaluated SDDC technologies and have no interestat this time
Conceptually interested in SDDC as a long-term strategybut we have no formal initiatives underway at this time
Committed to SDDC as a long-term strategy and intechnology evaluation/planning phase
Committed to SDDC as a long-term strategy and havebegun to implement SDDC technologies
Which of the following best represents your company’s perspective on software-defined data center technologies? (percent of respondents, N=4,000)
Research Insights Paper: Research Proves IT Transformation’s Persistent Link to Agility, Innovation, and Business Value 20
© 2018 by The Enterprise Strategy Group, Inc. All Rights Reserved.
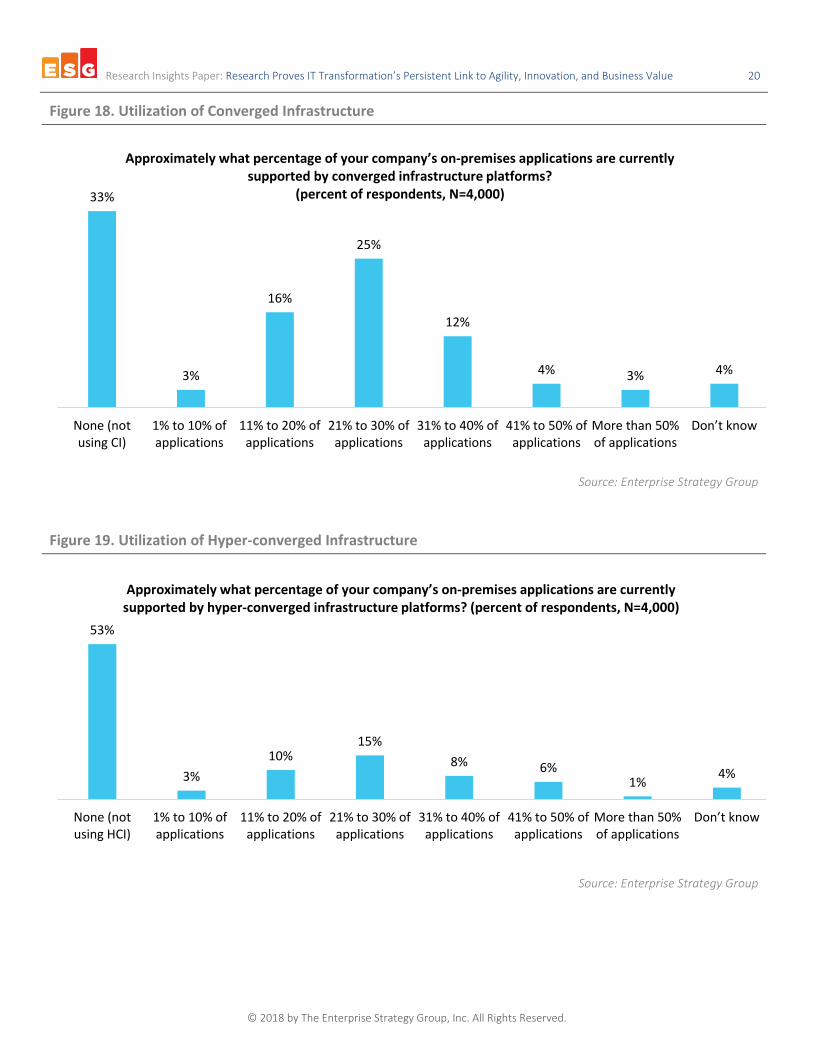
Figure 18. Utilization of Converged Infrastructure
Source: Enterprise Strategy Group
Figure 19. Utilization of Hyper-converged Infrastructure
Source: Enterprise Strategy Group
33%
3%
16%
25%
12%
4% 3% 4%
None (notusing CI)
1% to 10% ofapplications
11% to 20% ofapplications
21% to 30% ofapplications
31% to 40% ofapplications
41% to 50% ofapplications
More than 50%of applications
Don’t know
Approximately what percentage of your company’s on-premises applications are currently supported by converged infrastructure platforms?
(percent of respondents, N=4,000)
53%
3%10%
15%8% 6%
1% 4%
None (notusing HCI)
1% to 10% ofapplications
11% to 20% ofapplications
21% to 30% ofapplications
31% to 40% ofapplications
41% to 50% ofapplications
More than 50%of applications
Don’t know
Approximately what percentage of your company’s on-premises applications are currently supported by hyper-converged infrastructure platforms? (percent of respondents, N=4,000)
Research Insights Paper: Research Proves IT Transformation’s Persistent Link to Agility, Innovation, and Business Value 21
© 2018 by The Enterprise Strategy Group, Inc. All Rights Reserved.
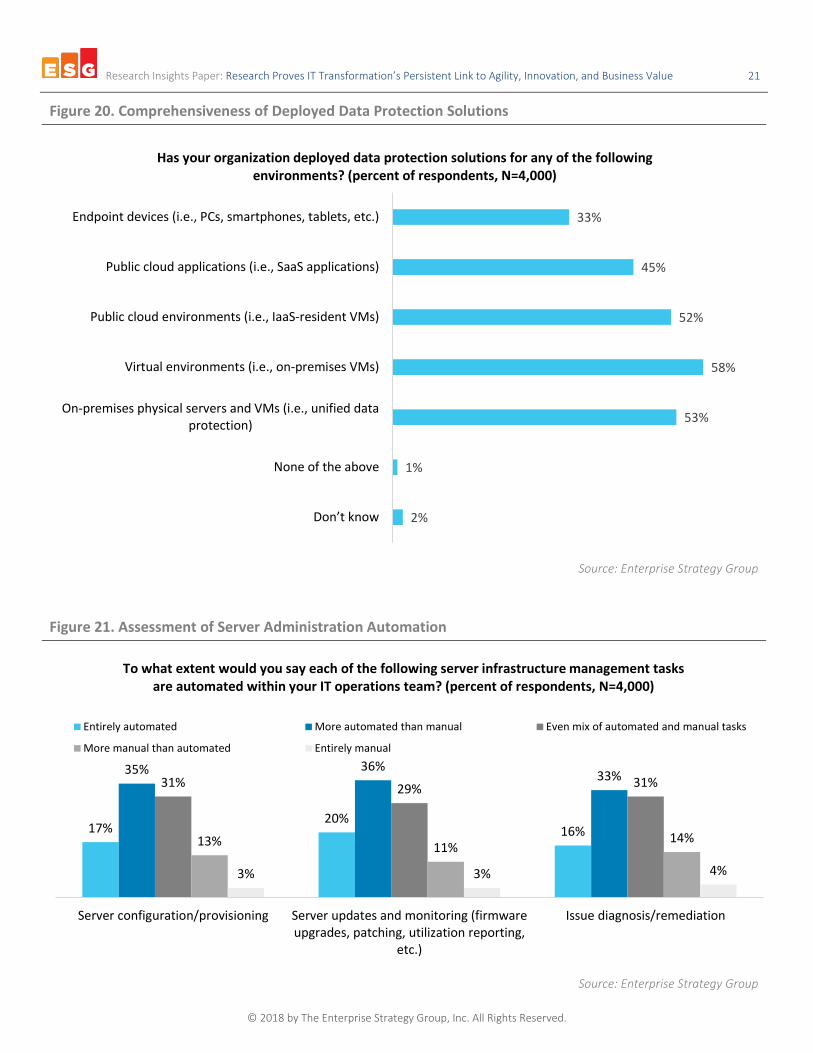
Figure 20. Comprehensiveness of Deployed Data Protection Solutions
Source: Enterprise Strategy Group
Figure 21. Assessment of Server Administration Automation
Source: Enterprise Strategy Group
2%
1%
53%
58%
52%
45%
33%
Don’t know
None of the above
On-premises physical servers and VMs (i.e., unified dataprotection)
Virtual environments (i.e., on-premises VMs)
Public cloud environments (i.e., IaaS-resident VMs)
Public cloud applications (i.e., SaaS applications)
Endpoint devices (i.e., PCs, smartphones, tablets, etc.)
Has your organization deployed data protection solutions for any of the following environments? (percent of respondents, N=4,000)
17%20%
16%
35% 36%33%31% 29% 31%
13% 11%14%
3% 3% 4%
Server configuration/provisioning Server updates and monitoring (firmwareupgrades, patching, utilization reporting,
etc.)
Issue diagnosis/remediation
To what extent would you say each of the following server infrastructure management tasks are automated within your IT operations team? (percent of respondents, N=4,000)
Entirely automated More automated than manual Even mix of automated and manual tasks
More manual than automated Entirely manual
Research Insights Paper: Research Proves IT Transformation’s Persistent Link to Agility, Innovation, and Business Value 22
© 2018 by The Enterprise Strategy Group, Inc. All Rights Reserved.
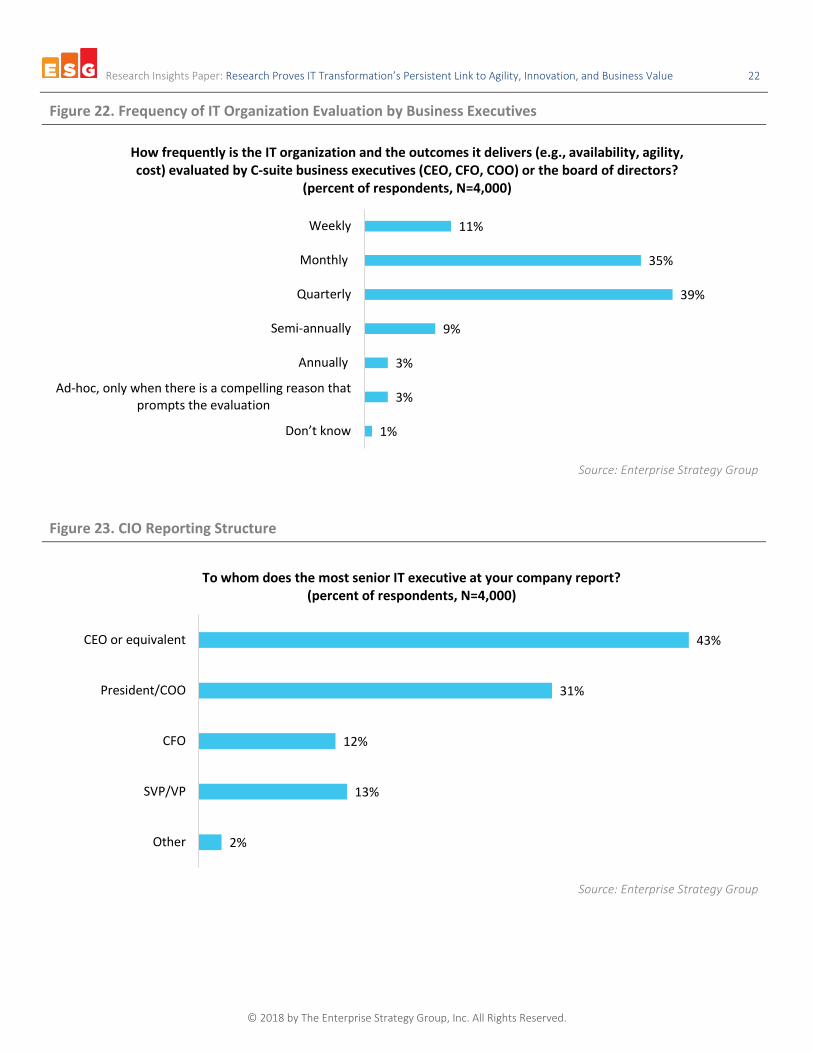
Figure 22. Frequency of IT Organization Evaluation by Business Executives
Source: Enterprise Strategy Group
Figure 23. CIO Reporting Structure
Source: Enterprise Strategy Group
1%
3%
3%
9%
39%
35%
11%
Don’t know
Ad-hoc, only when there is a compelling reason thatprompts the evaluation
Annually
Semi-annually
Quarterly
Monthly
Weekly
How frequently is the IT organization and the outcomes it delivers (e.g., availability, agility, cost) evaluated by C-suite business executives (CEO, CFO, COO) or the board of directors?
(percent of respondents, N=4,000)
2%
13%
12%
31%
43%
Other
SVP/VP
CFO
President/COO
CEO or equivalent
To whom does the most senior IT executive at your company report? (percent of respondents, N=4,000)
Research Insights Paper: Research Proves IT Transformation’s Persistent Link to Agility, Innovation, and Business Value 23
© 2018 by The Enterprise Strategy Group, Inc. All Rights Reserved.
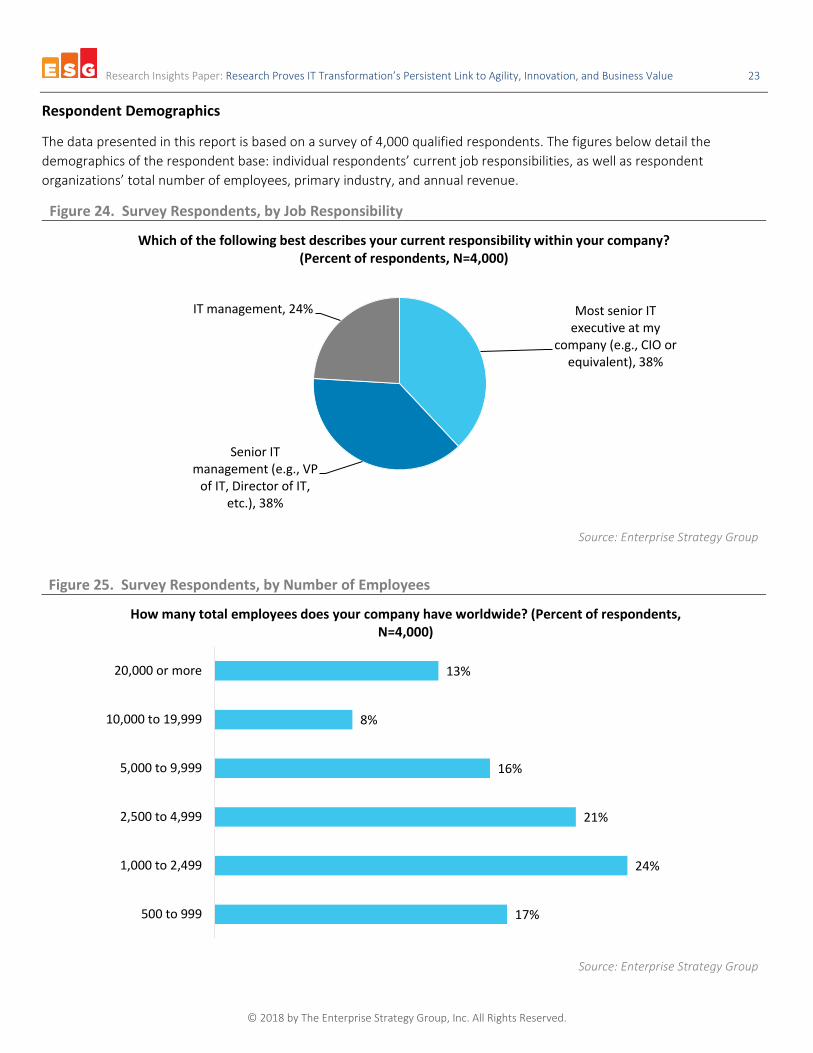
Respondent Demographics
The data presented in this report is based on a survey of 4,000 qualified respondents. The figures below detail the demographics of the respondent base: individual respondents’ current job responsibilities, as well as respondent organizations’ total number of employees, primary industry, and annual revenue.
Figure 24. Survey Respondents, by Job Responsibility
Source: Enterprise Strategy Group
Figure 25. Survey Respondents, by Number of Employees
Source: Enterprise Strategy Group
Most senior IT executive at my
company (e.g., CIO or equivalent), 38%
Senior IT management (e.g., VP
of IT, Director of IT, etc.), 38%
IT management, 24%
Which of the following best describes your current responsibility within your company? (Percent of respondents, N=4,000)
17%
24%
21%
16%
8%
13%
500 to 999
1,000 to 2,499
2,500 to 4,999
5,000 to 9,999
10,000 to 19,999
20,000 or more
How many total employees does your company have worldwide? (Percent of respondents, N=4,000)
Research Insights Paper: Research Proves IT Transformation’s Persistent Link to Agility, Innovation, and Business Value 24
© 2018 by The Enterprise Strategy Group, Inc. All Rights Reserved. www.esg-global.com [email protected] P.508.482.0188
© 2018 by The Enterprise Strategy Group, Inc. All Rights Reserved.
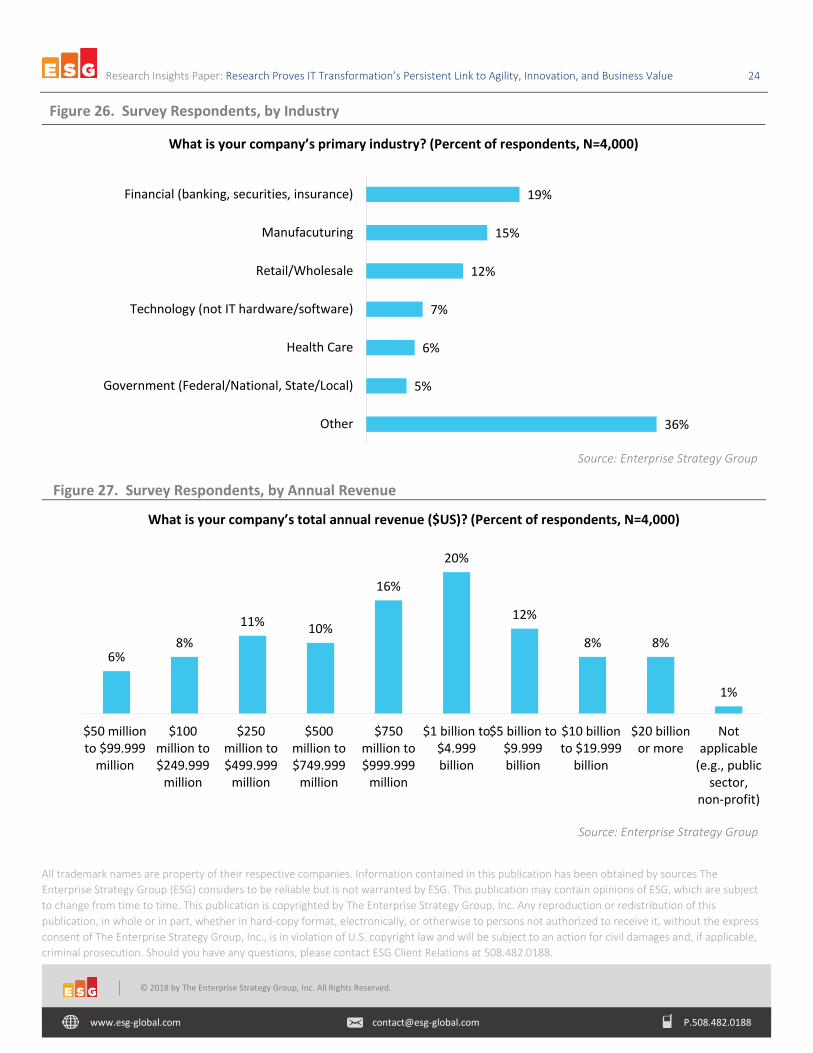
Figure 26. Survey Respondents, by Industry
Source: Enterprise Strategy Group
Figure 27. Survey Respondents, by Annual Revenue
Source: Enterprise Strategy Group
All trademark names are property of their respective companies. Information contained in this publication has been obtained by sources The Enterprise Strategy Group (ESG) considers to be reliable but is not warranted by ESG. This publication may contain opinions of ESG, which are subject to change from time to time. This publication is copyrighted by The Enterprise Strategy Group, Inc. Any reproduction or redistribution of this publication, in whole or in part, whether in hard-copy format, electronically, or otherwise to persons not authorized to receive it, without the express consent of The Enterprise Strategy Group, Inc., is in violation of U.S. copyright law and will be subject to an action for civil damages and, if applicable, criminal prosecution. Should you have any questions, please contact ESG Client Relations at 508.482.0188.
36%
5%
6%
7%
12%
15%
19%
Other
Government (Federal/National, State/Local)
Health Care
Technology (not IT hardware/software)
Retail/Wholesale
Manufacuturing
Financial (banking, securities, insurance)
What is your company’s primary industry? (Percent of respondents, N=4,000)
6%8%
11% 10%
16%
20%
12%
8% 8%
1%
$50 millionto $99.999
million
$100million to$249.999
million
$250million to$499.999
million
$500million to$749.999
million
$750million to$999.999
million
$1 billion to$4.999billion
$5 billion to$9.999billion
$10 billionto $19.999
billion
$20 billionor more
Notapplicable
(e.g., publicsector,
non-profit)
What is your company’s total annual revenue ($US)? (Percent of respondents, N=4,000)