Embed Size (px)
Citation preview
1
ESI Fast degenerate double proton transfer in the solid state between two indazolinone tautomers
Marta Pérez-Torralba, Concepción López, Carlos Pérez-Medina, Rosa Mª Claramunt, Elena Pinilla,
M. Rosario Torres, Ibon Alkorta and José Elguero
1S. X-Ray data collection and structure refinement
Prismatic colorless single crystals of 6 (C7H4F2N2O) suitable for X-ray diffraction experiments
were obtained by crystallization from methanol. Data collection were carried out at room
temperature on a Bruker Smart CCD diffractometer using graphite-monochromated Mo-Kα
radiation (λ= 0.71073 Å) operating at 50 kV and 30 mA. The data were collected over a hemisphere
of the reciprocal space by combination of three exposure sets. Each exposure of 30s covered 0.3 in
ω. The first 100 frames were recollected at the end of the data collection to monitor crystal decay.
No appreciable drop in the intensities of standard reflections was observed. The cell parameter were
determined and refined by a least-squares fit of all reflections.
A summary of the fundamental crystal and refinement data is given in Table 1. Full-matrix
least-squares refinements were carried out, minimizing ω(Fo2-Fc
2)2. Rw and goodness-of-fit are
based on F2. Most of the calculations were carried out with the Smart software for data collection
and reduction and SHELXTL-97 (G. M. Sheldrick, SHELXL-97, Program for refinement of crystal
structures, University of Gottingen, Germany, 1997) for structure solution and refinement.
Anisotropic parameters were used in the last cycles of refinement for all non-hydrogen atoms.
Hydrogen atoms bonded to the nitrogen and oxygen atoms have been located in a Fourier synthesis,
included and refined their coordinates and fixed the thermal parameters (H2a y H2b at 50%). The
remaining hydrogen atoms were included in calculated positions and refined as riding on their
respective carbon atoms. Final R(Rw) values were 0.0363(0.0825).
The supplementary crystallographic data have been passed to the Cambridge Crystallographic Data
Centre (CCDC deposition number ……….. ).
2
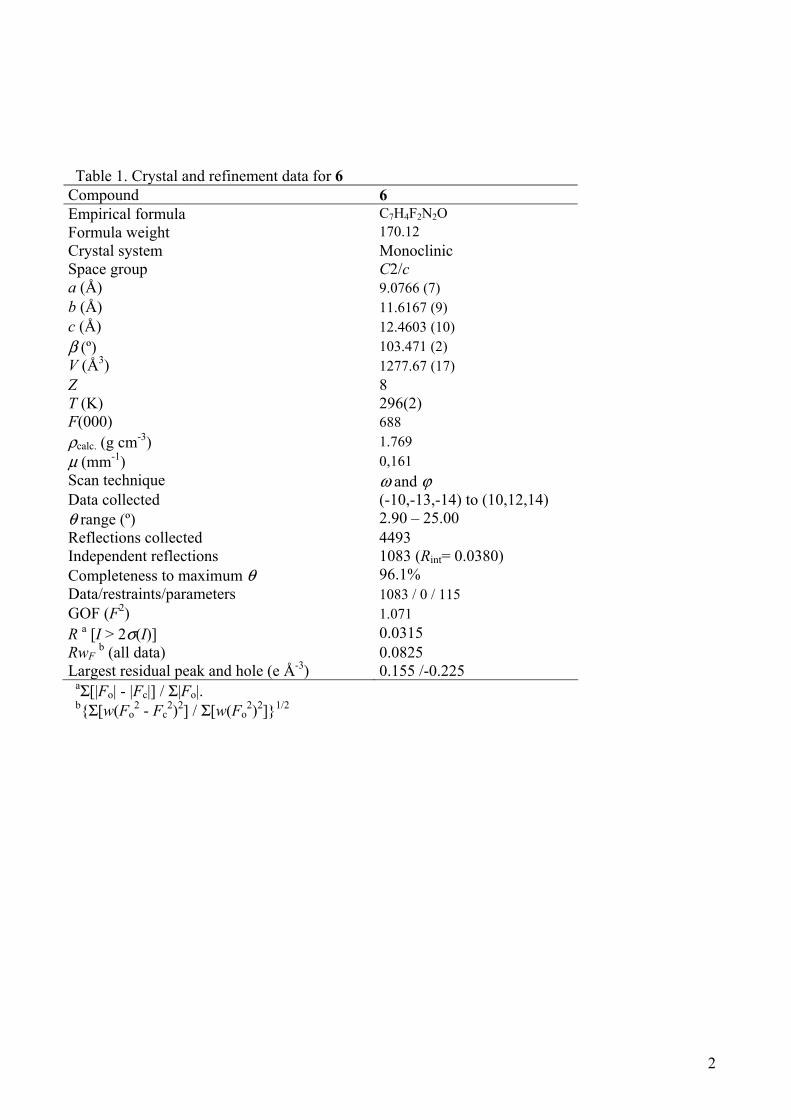
Table 1. Crystal and refinement data for 6
Compound 6 Empirical formula C7H4F2N2O Formula weight 170.12 Crystal system Monoclinic Space group C2/c a (Å) 9.0766 (7) b (Å) 11.6167 (9) c (Å) 12.4603 (10) β (º) 103.471 (2) V (Å3) 1277.67 (17) Z 8 T (K) 296(2) F(000) 688 ρcalc. (g cm-3) 1.769 μ (mm-1) 0,161 Scan technique ω and ϕ Data collected (-10,-13,-14) to (10,12,14) θ range (º) 2.90 – 25.00 Reflections collected 4493 Independent reflections 1083 (Rint= 0.0380) Completeness to maximum θ 96.1% Data/restraints/parameters 1083 / 0 / 115 GOF (F2) 1.071 R a [I > 2σ(I)] 0.0315 RwF b (all data) 0.0825 Largest residual peak and hole (e Å-3) 0.155 /-0.225
aΣ[|Fo| - |Fc|] / Σ|Fo|. b{Σ[w(Fo
2 - Fc2)2] / Σ[w(Fo
2)2]}1/2
3
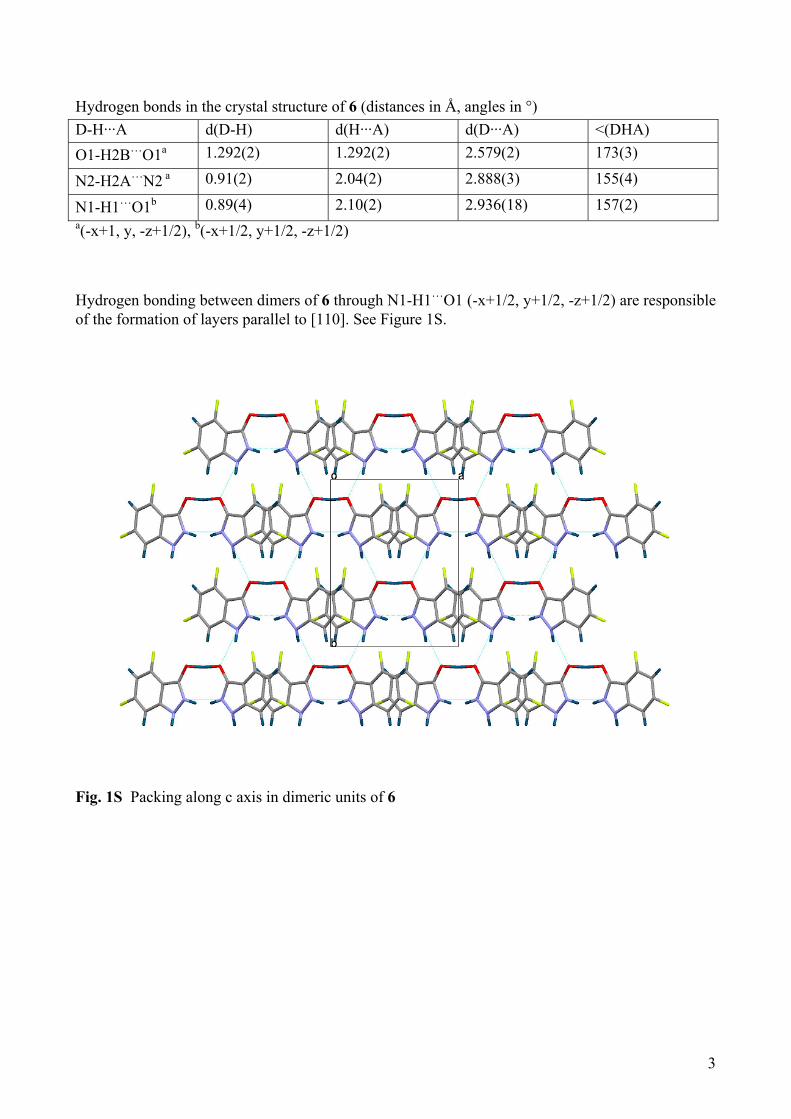
Hydrogen bonds in the crystal structure of 6 (distances in Å, angles in °) D-H···A d(D-H) d(H···A) d(D···A) <(DHA) O1-H2B…O1a 1.292(2) 1.292(2) 2.579(2) 173(3)
N2-H2A…N2 a 0.91(2) 2.04(2) 2.888(3) 155(4)
N1-H1…O1b 0.89(4) 2.10(2) 2.936(18) 157(2) a(-x+1, y, -z+1/2), b(-x+1/2, y+1/2, -z+1/2) Hydrogen bonding between dimers of 6 through N1-H1…O1 (-x+1/2, y+1/2, -z+1/2) are responsible of the formation of layers parallel to [110]. See Figure 1S.
Fig. 1S Packing along c axis in dimeric units of 6
4
2S. NMR spectroscopy. 2.1. Solution NMR spectra were recorded on a Bruker DRX 400 (9.4 Tesla, 400.13 MHz for 1H, 100.62 MHz for 13C and 40.56 MHz for 15N) spectrometer with a 5-mm inverse-detection H-X probehead equipped with a z-gradient coil, at the temperatures indicated in each case. Chemical shifts (δ in ppm) are given from internal solvent, DMSO-d6 2.49 for 1H and 39.5 for 13C, THF-d8, 3.58 for
1H and 67.4 for 13C; for 15N NMR nitromethane (0.00) was used as external standard. Typical resolution for 1H NMR spectra is 0.15-0.25 Hz per point and for 13C NMR spectra 0.6 Hz per point. 2D inverse proton detected heteronuclear shift correlation spectra, (1H-13C) gs-HMQC, (1H-13C) gs-HMBC and (1H-15N) gs-HMBC, were acquired and processed using standard Bruker NMR software and in non-phase-sensitive mode. Gradient selection was achieved through a 5% sine truncated shaped pulse gradient of 1 ms. Variable temperature experiments were recorded on the same spectrometer. A Bruker BVT300 temperature unit was used to control the temperature of the cooling gas stream and an exchanger to achieve low temperatures. 2.2. Solid state 13C (100.73 MHz) and 15N (40.60 MHz) CPMAS NMR spectra have been obtained on a Bruker WB 400 spectrometer at 300 K using a 4 mm DVT probehead and a 4-mm diameter cylindrical zirconia rotor with Kel-F end-caps. The non-quaternary suppression (NQS) technique to observe only the quaternary carbon atoms was employed. 13C spectra were originally referenced to a glycine sample and then the chemical shifts were recalculated to the Me4Si (for the carbonyl atom δ (glycine) = 176.1 ppm) and 15N spectra to 15NH4Cl and then converted to nitromethane scale using the relationship: δ 15N(nitromethane) = δ 15N(ammonium chloride) – 338.1 ppm. A Bruker BVT3000 temperature unit was used to control the temperature of the cooling gas stream an a exchanger to achieve low temperatures. To avoid problems at low temperatures caused by air moisture, pure nitrogen was used as bearing, driving and cooling gas. The rotational frequencies were of about 6 kHz and we used boron nitride caps.
5
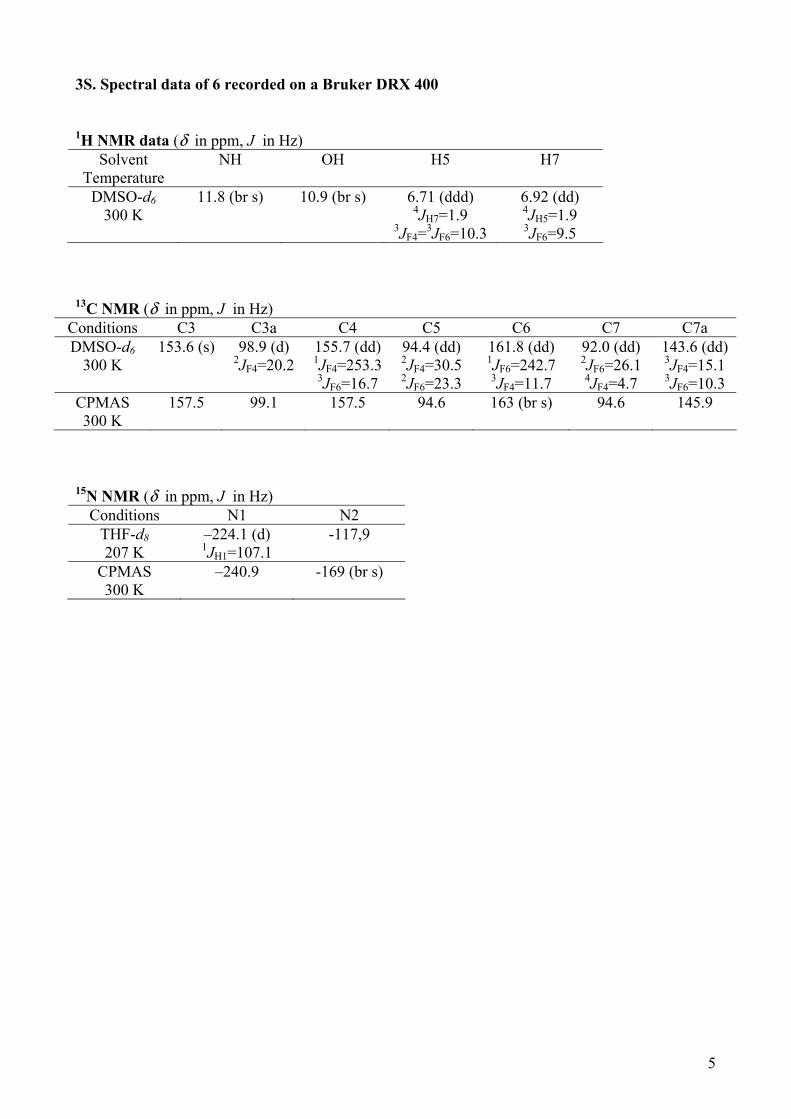
3S. Spectral data of 6 recorded on a Bruker DRX 400 1H NMR data (δ in ppm, J in Hz)
Solvent Temperature
NH OH H5 H7
DMSO-d6 300 K
11.8 (br s)
10.9 (br s) 6.71 (ddd) 4JH7=1.9
3JF4=3JF6=10.3
6.92 (dd) 4JH5=1.9 3JF6=9.5
13C NMR (δ in ppm, J in Hz)
Conditions C3 C3a C4 C5 C6 C7 C7a DMSO-d6
300 K 153.6 (s) 98.9 (d)
2JF4=20.2 155.7 (dd) 1JF4=253.3 3JF6=16.7
94.4 (dd) 2JF4=30.5 2JF6=23.3
161.8 (dd) 1JF6=242.7 3JF4=11.7
92.0 (dd) 2JF6=26.1 4JF4=4.7
143.6 (dd)
3JF4=15.1 3JF6=10.3
CPMAS 300 K
157.5 99.1 157.5 94.6 163 (br s) 94.6 145.9
15N NMR (δ in ppm, J in Hz)
Conditions N1 N2 THF-d8 207 K
–224.1 (d) 1JH1=107.1
-117,9
CPMAS 300 K
–240.9 -169 (br s)
6
4S. Spectral data of 6-15N2 recorded on a Bruker DRX 400 1H NMR (δ in ppm, J in Hz)
Solvent Temperature
NH OH H5 H7
DMSO-d6 300 K
11.8 (d) 1JN1=99
10.9 (s) 6.70 (ddd) 4JH7=1.9
3JF4=3JF6=10.3
6.91 (ddd) 4JH5=1.9 3JF6=9.4 3JN1=1.0
THF-d8 300K
11.1 (br s)
10.8 (br s) 6.48 (ddd) 4JH7=1.9
3JF4=3JF6=10.0
6.76 (ddd) 4JH5=1.9 3JF6=9.3 3JN1=1.2
THF-d8 193K
11.6 (ddd) 1JN1=108 2JN2=8.3 5JF4=1.9
10.8 (s) 6.77 (ddd) 4JH7=1.9
3JF4=3JF6=10.1
7.01 (ddd) 4JH5=1.9 3JF6=9.3 3JN1=1.1
13C NMR (δ in ppm, J in Hz) Solvent
Temperature C3 C3a C4 C5 C6 C7 C7a
DMSO-d6 300 K
153.6 (s) 99.0 (dd) 2JF4=20.2 2JN1=3.6
155.6 (dd) 1JF4=253.4 3JF6=16.5
94.4 (dd) 2JF4=30.3 2JF6=22.9
161.9 (ddd) 1JF6=242.6 3JF4=11.6 3JN1=2.6
92.2 (dd) 2JF6=26.1 4JF4=4.3
143.6 (m)
THF-d8 193 K
154.7 (s) 99.5 (dd) 2JF4=20.9 2JN1=3.4
157.0 (dd) 1JF4=253.9 3JF6=16.0
95.3 (dd) 2JF4=30.6 2JF6=23.1
163.5 (ddd) 1JF6=245.8 3JF4=11.0 3JN1=2.6
92.7 (dd) 2JF6=26.3 4JF4=3.5
144.5 (m)
15N NMR (δ in ppm, J in Hz) Conditions N1 N2 DMSO-d6
300 K –224.1 (d) 1JN2=10.9
-121.8
THF-d8 300 K
–229.5 (dd) 1JN2=12.1
-118.3 (d) 1JN1=12.1
THF-d8 193 K
–227.6 (d) 1JN2=10.6
-119.3 (d) 1JN1=10.6
CPMAS 300K
-241.2 -168.6
CPMAS 173 K
-241.8 -169.4
7
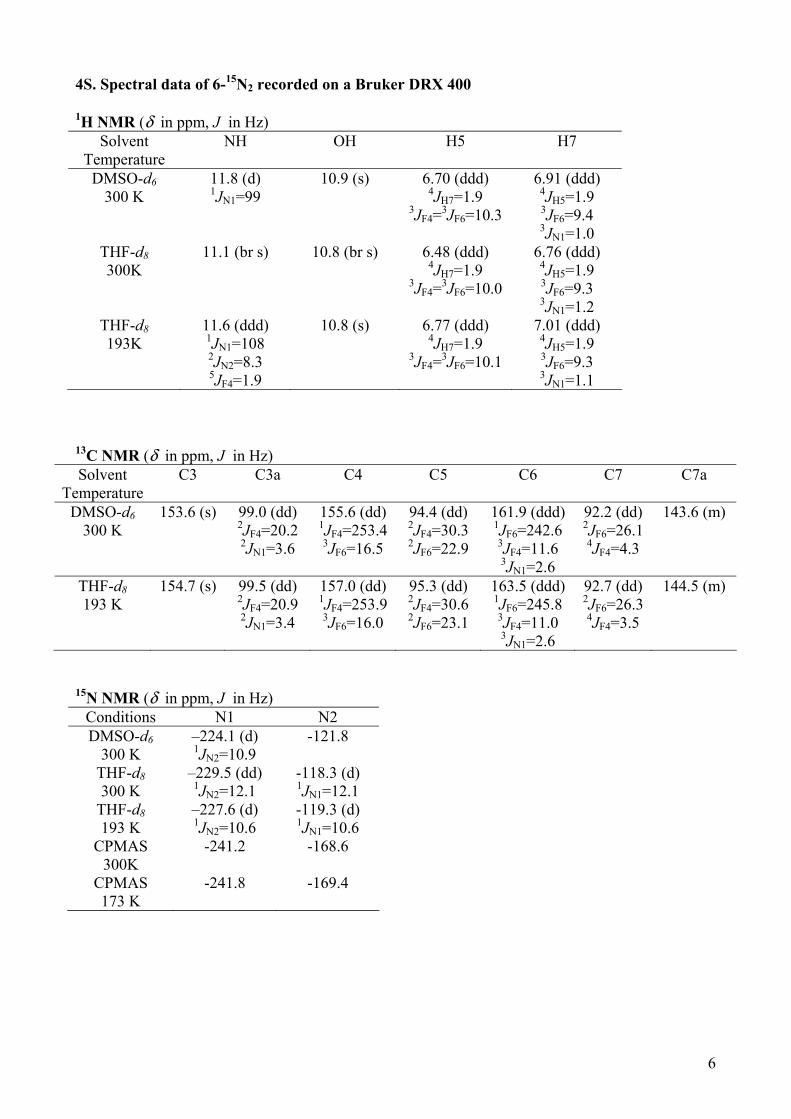
5S. Spectral data of 6- 15N2 recorded on a Bruker 600 MHz instrument
13C CPMAS NMR chemical shifts at 300 K (10 kHz) Peak Picking region: Start(ppm) Start(Hz) End(ppm) End(Hz) MI(%) MAXI(%) 277.40 41862.2 -53.84 -8125.6 -2.39 100.50 Peak Picking results: Peak Nr. Data Point Frequency PPM Intensity %Int. 1 588 34684.47 229.8397 11237517 3.9 2 682 33537.01 222.2360 28293396 9.9 3 826 31779.20 210.5877 61687496 21.5 4 1436 24332.91 161.2442 121734656 42.5 5 1501 23539.45 155.9863 286299936 100.0 6 1645 21781.64 144.3380 241848192 84.5 7 2224 14713.77 97.5021 154952768 54.1 8 2262 14249.90 94.4282 254037056 88.7 9 2279 14042.38 93.0531 284723680 99.4 10 2320 13541.89 89.7365 40217648 14.0 11 2464 11784.08 78.0882 41075864 14.3 12 3044 4704.00 31.1715 16056978 5.6 13 3098 4044.82 26.8034 31868780 11.1 14 3141 3519.92 23.3251 8967616 3.1 15 3283 1786.52 11.8385 15176869 5.3 16 3914 -5916.11 -39.2037 9195823 3.2
229.
8397
222.
2360
210.
5877
161.
2442
155.
9863
144.
3380
97.5
021
94.4
282
93.0
531
89.7
365
78.0
882
31.1
715
26.8
034
23.3
251
11.8
385
-39.
2037
( ppm)
-50050100150200250
8
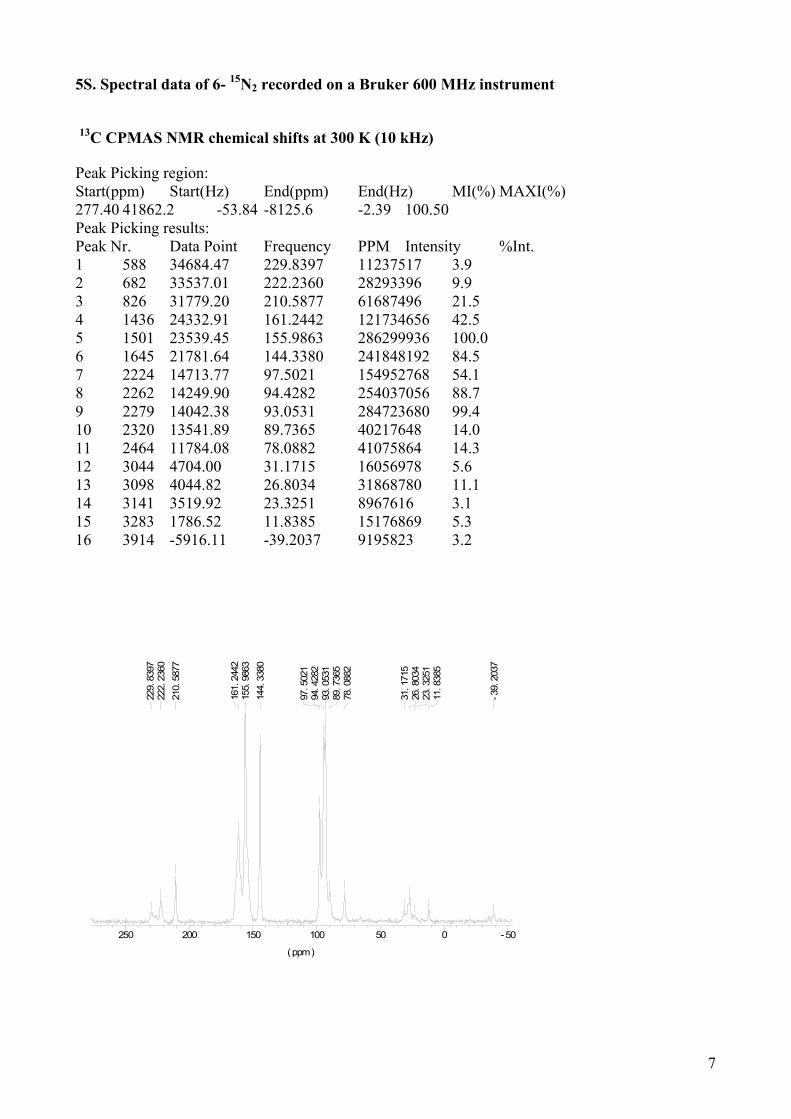
13C CPMAS NMR chemical shifts at 173 K (9 kHz) Peak Picking region: Start(ppm) Start(Hz) End(ppm) End(Hz) MI(%) MAXI(%) 277.40 41862.2 -53.84 -8125.6 -7.73 100.50 Peak Picking results: Peak Nr. Data Point Frequency PPM Intensity %Int. 1 773 32426.17 214.8749 44316092 9.5 2 913 30717.19 203.5501 100023744 21.4 3 1433 24369.53 161.4868 162202176 34.7 4 1506 23478.42 155.5818 356660640 76.3 5 1650 21720.60 143.9335 325195200 69.5 6 2165 15433.98 102.2746 38695616 8.3 7 2231 14628.32 96.9358 228235600 48.8 8 2267 14188.87 94.0238 449153376 96.0 9 2282 14005.76 92.8104 467660512 100.0 10 2386 12736.23 84.3977 78863488 16.9 11 3002 5216.70 34.5689 61615960 13.2
214.
8749
203.
5501
161.
4868
155.
5818
143.
9335
102.
2746
96.9
358
94.0
238
92.8
104
84.3
977
34.5
689
( ppm)
-50050100150200250
9
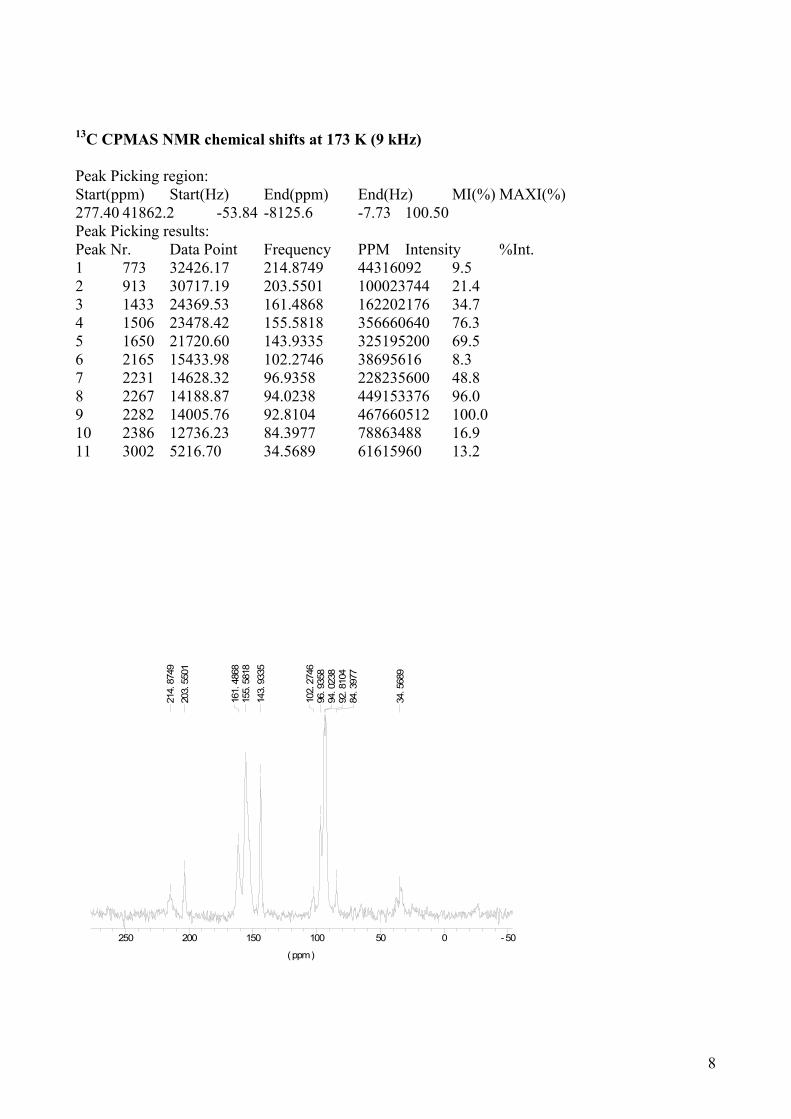
15N CPMAS NMR chemical shifts at 300 K (8 kHz) Peak Picking region: Start(ppm) Start(Hz) End(ppm) End(Hz) MI(%) MAXI(%) 574.63 34944.9 -247.47 -15049.0 -1.15 100.50 Peak Picking results: Peak Nr. Data Point Frequency PPM Intensity %Int. 1 3661 12599.91 207.1930 100447680 29.8 2 4378 8223.69 135.2304 337391904 100.0
207.
1930
135.
2304
( ppm)
-200-1000100200300400500
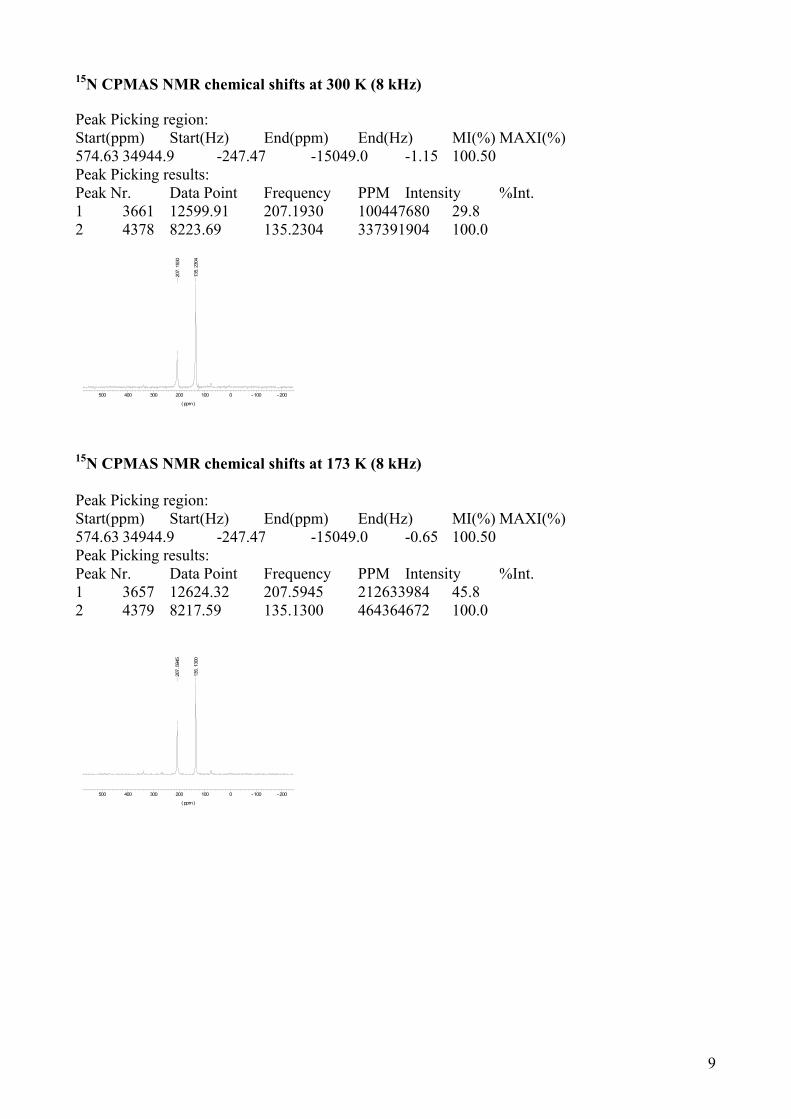
15N CPMAS NMR chemical shifts at 173 K (8 kHz) Peak Picking region: Start(ppm) Start(Hz) End(ppm) End(Hz) MI(%) MAXI(%) 574.63 34944.9 -247.47 -15049.0 -0.65 100.50 Peak Picking results: Peak Nr. Data Point Frequency PPM Intensity %Int. 1 3657 12624.32 207.5945 212633984 45.8 2 4379 8217.59 135.1300 464364672 100.0
207.
5945
135.
1300
( ppm)
-200-1000100200300400500
10
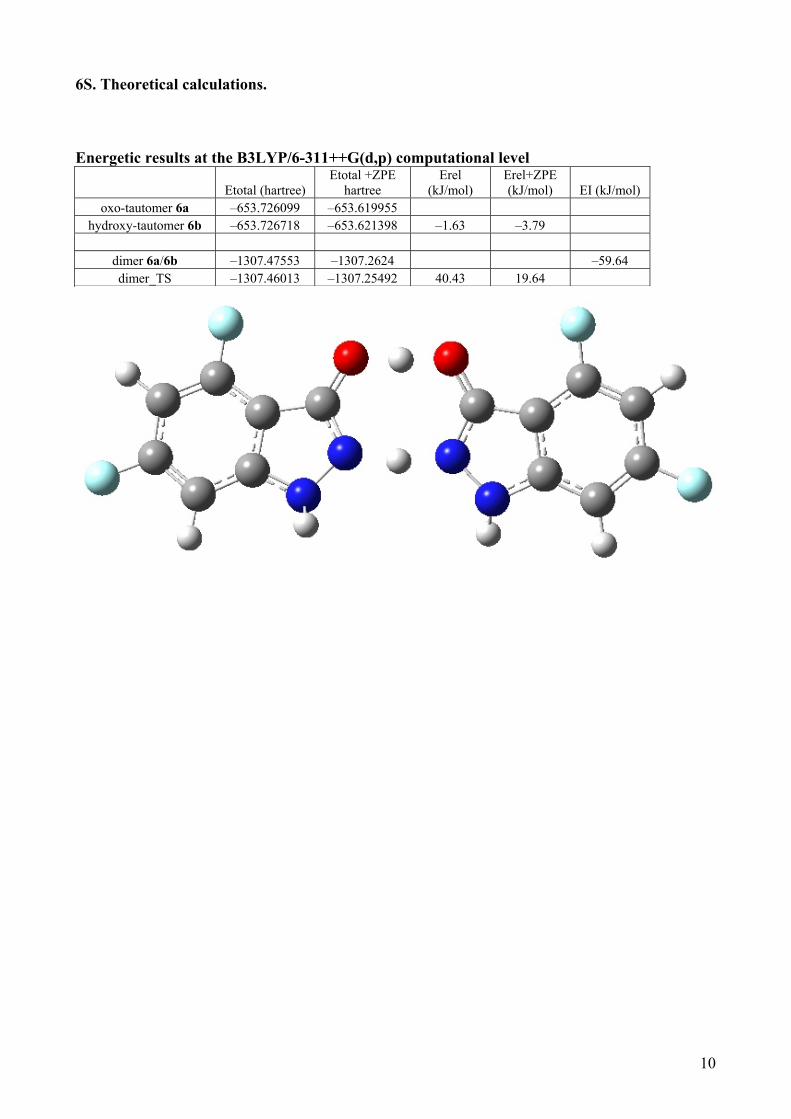
6S. Theoretical calculations. Energetic results at the B3LYP/6-311++G(d,p) computational level
Etotal (hartree) Etotal +ZPE
hartree Erel
(kJ/mol) Erel+ZPE (kJ/mol) EI (kJ/mol)
oxo-tautomer 6a –653.726099 –653.619955 hydroxy-tautomer 6b –653.726718 –653.621398 –1.63 –3.79
dimer 6a/6b –1307.47553 –1307.2624 –59.64 dimer_TS –1307.46013 –1307.25492 40.43 19.64
11
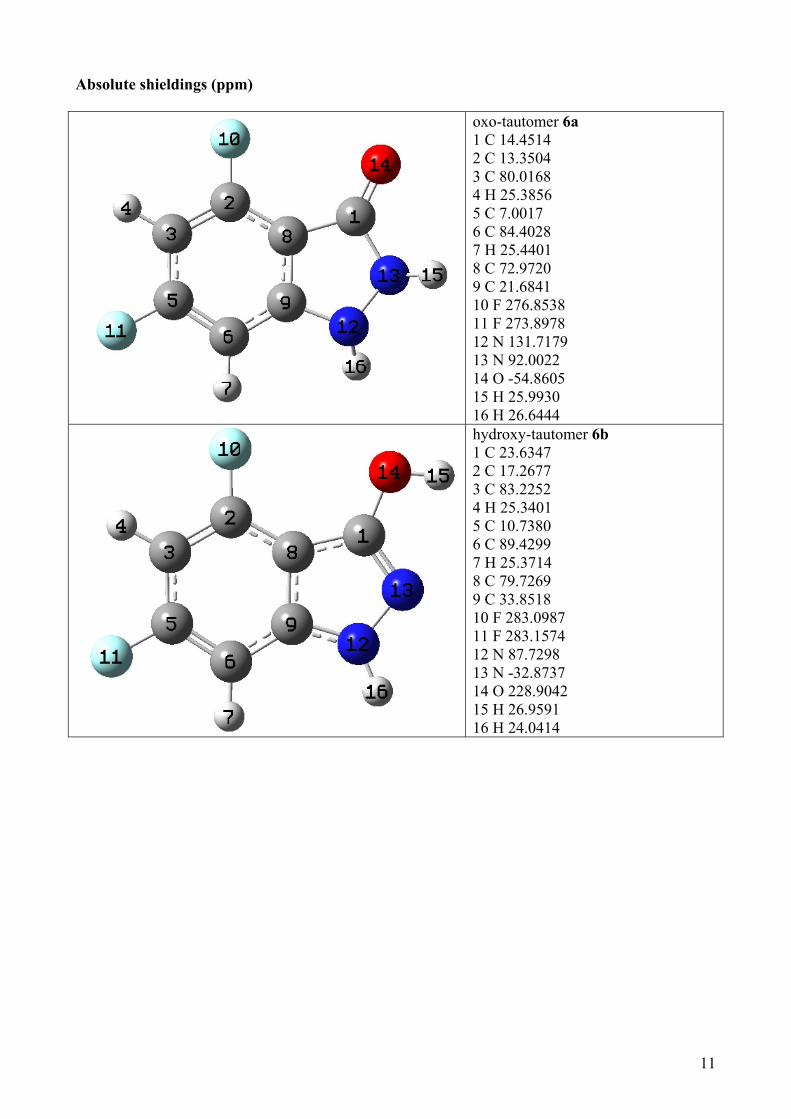
Absolute shieldings (ppm)
oxo-tautomer 6a 1 C 14.4514 2 C 13.3504 3 C 80.0168 4 H 25.3856 5 C 7.0017 6 C 84.4028 7 H 25.4401 8 C 72.9720 9 C 21.6841 10 F 276.8538 11 F 273.8978 12 N 131.7179 13 N 92.0022 14 O -54.8605 15 H 25.9930 16 H 26.6444 hydroxy-tautomer 6b 1 C 23.6347 2 C 17.2677 3 C 83.2252 4 H 25.3401 5 C 10.7380 6 C 89.4299 7 H 25.3714 8 C 79.7269 9 C 33.8518 10 F 283.0987 11 F 283.1574 12 N 87.7298 13 N -32.8737 14 O 228.9042 15 H 26.9591 16 H 24.0414
12
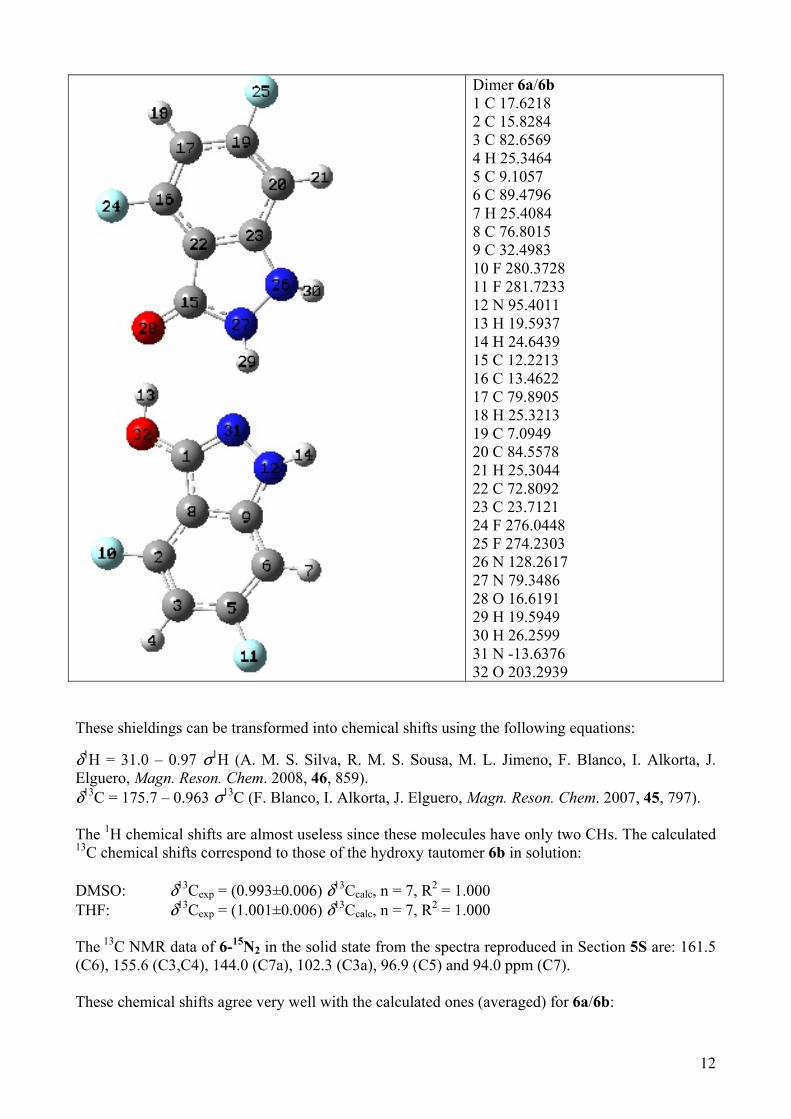
Dimer 6a/6b 1 C 17.6218 2 C 15.8284 3 C 82.6569 4 H 25.3464 5 C 9.1057 6 C 89.4796 7 H 25.4084 8 C 76.8015 9 C 32.4983 10 F 280.3728 11 F 281.7233 12 N 95.4011 13 H 19.5937 14 H 24.6439 15 C 12.2213 16 C 13.4622 17 C 79.8905 18 H 25.3213 19 C 7.0949 20 C 84.5578 21 H 25.3044 22 C 72.8092 23 C 23.7121 24 F 276.0448 25 F 274.2303 26 N 128.2617 27 N 79.3486 28 O 16.6191 29 H 19.5949 30 H 26.2599 31 N -13.6376 32 O 203.2939
These shieldings can be transformed into chemical shifts using the following equations:
δ1H = 31.0 – 0.97 σ1H (A. M. S. Silva, R. M. S. Sousa, M. L. Jimeno, F. Blanco, I. Alkorta, J. Elguero, Magn. Reson. Chem. 2008, 46, 859). δ13C = 175.7 – 0.963 σ13C (F. Blanco, I. Alkorta, J. Elguero, Magn. Reson. Chem. 2007, 45, 797). The 1H chemical shifts are almost useless since these molecules have only two CHs. The calculated 13C chemical shifts correspond to those of the hydroxy tautomer 6b in solution: DMSO: δ13Cexp = (0.993±0.006) δ13Ccalc, n = 7, R2 = 1.000 THF: δ13Cexp = (1.001±0.006) δ13Ccalc, n = 7, R2 = 1.000 The 13C NMR data of 6-15N2 in the solid state from the spectra reproduced in Section 5S are: 161.5 (C6), 155.6 (C3,C4), 144.0 (C7a), 102.3 (C3a), 96.9 (C5) and 94.0 ppm (C7). These chemical shifts agree very well with the calculated ones (averaged) for 6a/6b:

13
90
100
110
120
130
140
150
160
170
Exp
sol
id
90 100 110 120 130 140 150 160 170Aver OH/NH calc
The trendline corresponds to δ13Cexp = (9.4±1.4) +(0.905±0.010) δ13Ccalc, n = 7, R2 = 0.999.