Embed Size (px)
Citation preview

Eskom Holdings SOC Limited
Standard Presentation
December 2013

In support of
Disclaimer
2
This presentation does not constitute or form part of and should not be construed as, an offer to sell, or the solicitation or
invitation of any offer to buy or subscribe for or underwrite or otherwise acquire, securities of Eskom Holdings SOC Limited
(“Eskom”), any holding company or any of its subsidiaries in any jurisdiction or any other person, nor an inducement to enter
into any investment activity. No part of this presentation, nor the fact of its distribution, should form the basis of, or be relied
on in connection with, any contract or commitment or investment decision whatsoever. This presentation does not constitute
a recommendation regarding any securities of Eskom or any other person.
Certain statements in this presentation regarding Eskom’s business operations may constitute “forward looking statements”.
All statements other than statements of historical fact included in this presentation, including, without limitation, those
regarding the financial position, business strategy, management plans and objectives for future operations of Eskom are
forward looking statements.
Forward-looking statements are not intended to be a guarantee of future results, but instead constitute Eskom’s current
expectations based on reasonable assumptions. Forecasted financial information is based on certain material assumptions.
These assumptions include, but are not limited to continued normal levels of operating performance and electricity demand
in the Customer Services, Distribution and Transmission divisions and operational performance in the Generation and
Primary Energy divisions consistent with historical levels, and incremental capacity additions through the Group Capital
division at investment levels and rates of return consistent with prior experience, as well as achievements of planned
productivity improvements throughout the business activities.
Actual results could differ materially from those projected in any forward-looking statements due to risks, uncertainties and
other factors. Eskom neither intends to nor assumes any obligation to update or revise any forward-looking statements,
whether as a result of new information, future events or otherwise.
In preparation of this document certain publicly available data was used. While the sources used are generally regarded as
reliable the content has not been verified. Eskom does not accept any responsibility for using any such information.

In support of 3
Context of this presentation
• This presentation consists of a set of slides which provide an overview of Eskom and
are based on information contained in the 2013 Integrated and Interim Reports. Users
are encouraged to add, delete or adapt slides to suit the requirements of their particular
presentation.
• Figures are quoted in rands (SA), unless otherwise indicated. The exchange rate
applied was that which applied at the end of the financial year (31 March 2013).
• The presentation is updated annually to coincide with the release of Eskom’s annual
and interim financial results.
• The presentation is in a Power Point format and the design and colours have been
specifically selected to complement our corporate identity, and for legibility.
• Comments, suggestions or requests may be directed to the Corporate Affairs Division.

In support of 4
Content of the presentation
About Eskom
Preparing for sustainable growth
Business update
Construction
Financial performance
Outlook

In support of
About Eskom
• Strategic 100% state-owned electricity utility, strongly supported by the government
• Top 15 global electricity utility
• Africa’s largest electricity utility
• Supplies approximately 95% of South Africa’s electricity
• As at 30 September 2013:
– 46 624 group employees (2012: 44 913)
– 5.1 million customers (2012: 4.9 million)
– Net maximum generating capacity of 42.0GW (2012: 41.7GW)
– Approximately 354 000km of cables and power lines
– Moody’s and S&P stand-alone credit ratings: b1 and b- respectively with a negative outlook
– 17.1GW of new generation capacity being built, of which 6.1GW already commissioned
Nuclear
Gas
Coal
Hydro
Pumped Storage
Generation capacity – 30 September 2013
85.1%
5.7%
4.4%
3.4% 1.4%
42.0GW
of nominal
capacity
41 059
32 216
53 600
Sep-11 Sep-12 Sep-13
Number
Number of electrification connections
5

Eskom’s strategy
Our purpose:
To provide sustainable electricity
solutions to grow the economy and
improve the quality of life of people in
South Africa and the region
Leading and
partnering to
keep the
lights on
Reducing
Eskom’s
environmental
footprint and
pursuing low-
carbon growth
opportunities
Securing
future
resource
requirements
Implementing
coal haulage
and the
road-to-rail
migration plan
Pursuing
private sector
participation
Execute
strategic
pillars
Accomplis
h Eskom’s
purpose
Build
foundation
right, build
capacity
Transformation
Ensuring
Eskom’s financial
sustainability
Becoming a high-
performance
organisation
Foundation:
Long-term nation building • Electricity for all • Triple bottom-line
ZIISCE: Zero harm, Integrity, Innovation, Sinobuntu, Customer satisfaction, Excellence
6

In support of 7
Power station map

In support of
Electricity value chain
8

In support of 9
Board of Directors
Mr Zola Tsotsi (Chairman) Mr Zola Tsotsi is a chemical engineer who was a corporate
consultant at Eskom from 2000 to 2004 and a corporate strategy
manager at the utility between 1997 and 2000. He has also
headed the boards of the Lesotho Highlands Development
Authority and the Lesotho Electricity Corporation and is the head
of the Lesotho Electricity Authority
Mr Brian Dames (CEO) Mr Dames is currently a director of the following Group’s
subsidiaries: Eskom Enterprises, Rotek Industries (Pty) Ltd,
Roshcon (Pty) Ltd. He has a BSc (Hons), an MBA, and a
Graduate Diploma in Utility Management. He was appointed as
the Group’s chief executive on 1 July 2010.
Ms Caroline Henry (Acting Chief Financial Officer)
Ms Boni Mehlomakhulu Dr. Mehlomakulu is currently the chief executive officer of the
South African Bureau of Standards. She has a PhD in Chemical
Engineering from the University of Cape Town. She was
appointed to the Board in April 2010.

In support of
Board of Directors
Mr Bernard Lewis Fanaroff
Dr Fanaroff is currently the managing director of Fanaroff
Associates CC and project director at SKA SA. He has a PhD in
Radio Astronomy and Astrophysics. He was appointed to the
Board in May 2010.
Ms Neo Lesela
Ms Neo Lesela, who has an industrial engineering degree from
the University of Salford in the United Kingdom and formerly
worked for South African Breweries and Tiger Brands. She then
moved to Portnet (now the National Ports Authority) as a senior
engineer, joined Cell C in 2002 as the head of project
management and, in 2008, joined low-cost telecoms operator
Smile Communications as general manager.
Mr Mafika Mkhwanazi
Transnet chairman Mafika Mkwanazi was formerly chief executive
of the state-owned transport giant. He is currently also a chairman
of Letseng Diamond and a director at Nedbank. He previously sat
in the boards of SAA, Metrorail and Saatchi & Saatchi SA.
Mr Phenyane Sedibe
Mr Phenyane Sedibe, who is the owner of consultancy firm SPQ
Consulting, has a master's degree in social policy. His specialty is
small enterprise development, black empowerment and economic
transformation.
10
In support of
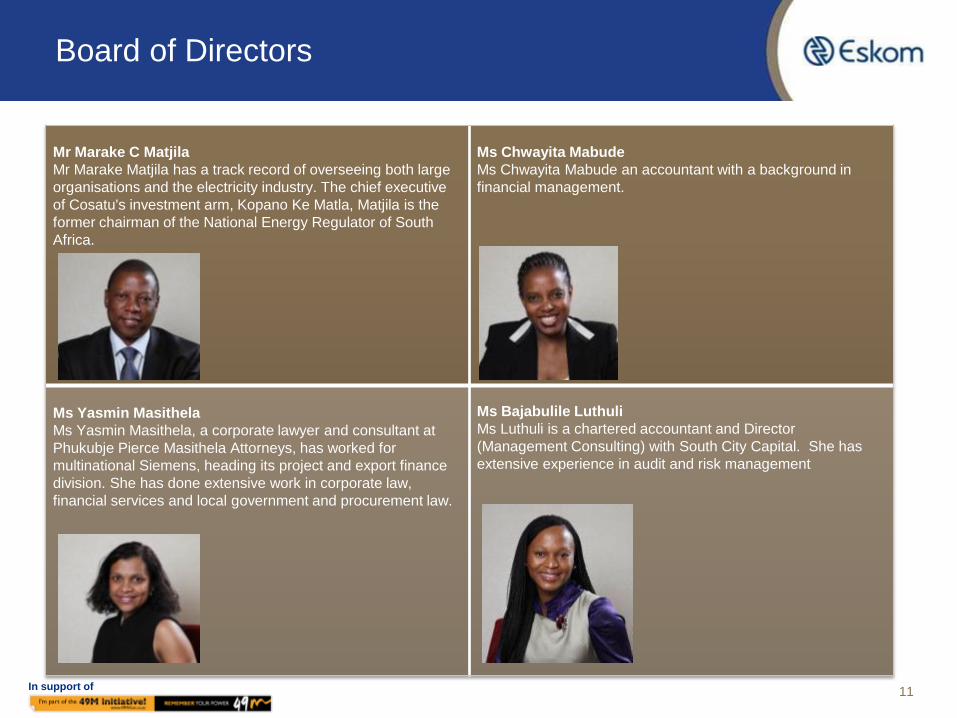
Board of Directors
Mr Marake C Matjila
Mr Marake Matjila has a track record of overseeing both large
organisations and the electricity industry. The chief executive
of Cosatu's investment arm, Kopano Ke Matla, Matjila is the
former chairman of the National Energy Regulator of South
Africa.
Ms Chwayita Mabude
Ms Chwayita Mabude an accountant with a background in
financial management.
Ms Yasmin Masithela
Ms Yasmin Masithela, a corporate lawyer and consultant at
Phukubje Pierce Masithela Attorneys, has worked for
multinational Siemens, heading its project and export finance
division. She has done extensive work in corporate law,
financial services and local government and procurement law.
Ms Bajabulile Luthuli
Ms Luthuli is a chartered accountant and Director
(Management Consulting) with South City Capital. She has
extensive experience in audit and risk management
11

In support of
Board of Directors
Ms Queendy Gungubele
Ms Gungubele specialises in labour relations with her current
position being a CCMA-accredited part-time commissioner and
arbitrator.
Ms Lily Zondo
Ms Zondo is currently General Manager: Business Risk
Management at MTN SA. She has served on many audit
committees, focusing on risk management frameworks and
internal controls.
12
In support of
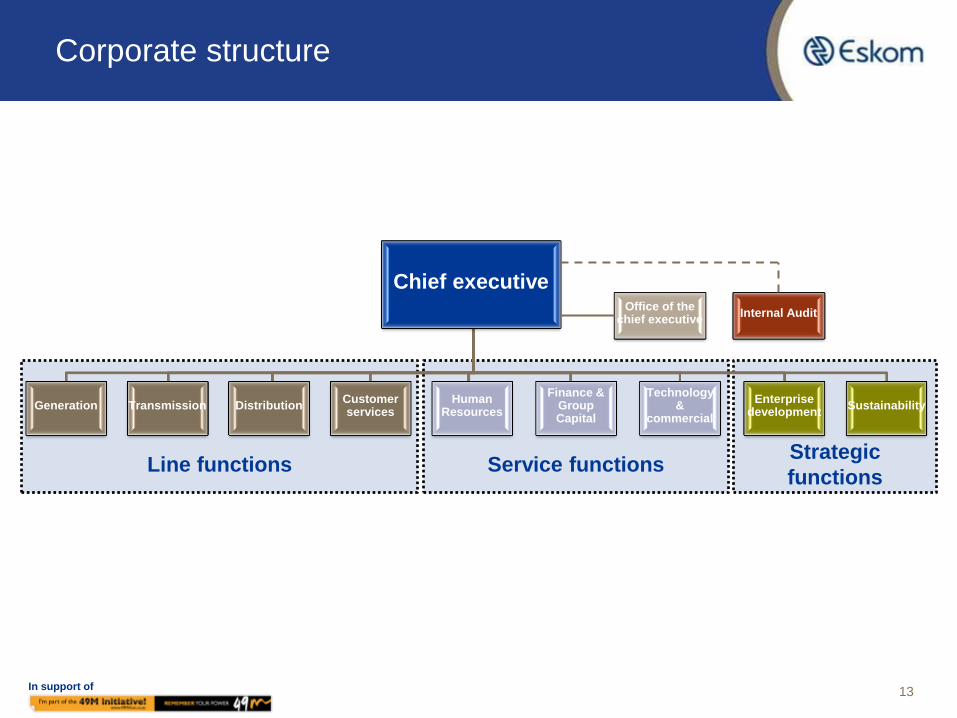
Service functions
Corporate structure
Strategic
functions
Line functions
Chief executive
Generation Transmission Distribution Customer services
Human Resources
Finance & Group Capital
Technology &
commercial
Enterprise development
Sustainability
Office of the chief executive
Internal Audit
13

In support of 14
Executive Management Committee
Brian Dames
Chief Executive
Erica Johnson
Enterprise Development
Bhabhalazi Bulunga
Human Resources
Caroline Henry
(Acting Chief Financial
Officer)
Thava Govender
Generation

In support of
Executive Management Committee
Dr Steve Lennon
Sustainability
Kannan Lakmeeharan (Acting)
Technology and Commercial
Tsholofelo Molefe
Customer Service
Ayanda Noah
Distribution
Mongezi Ntsokolo
Transmission
Dan Marokane (Acting)
Group Capital
15
In support of 16
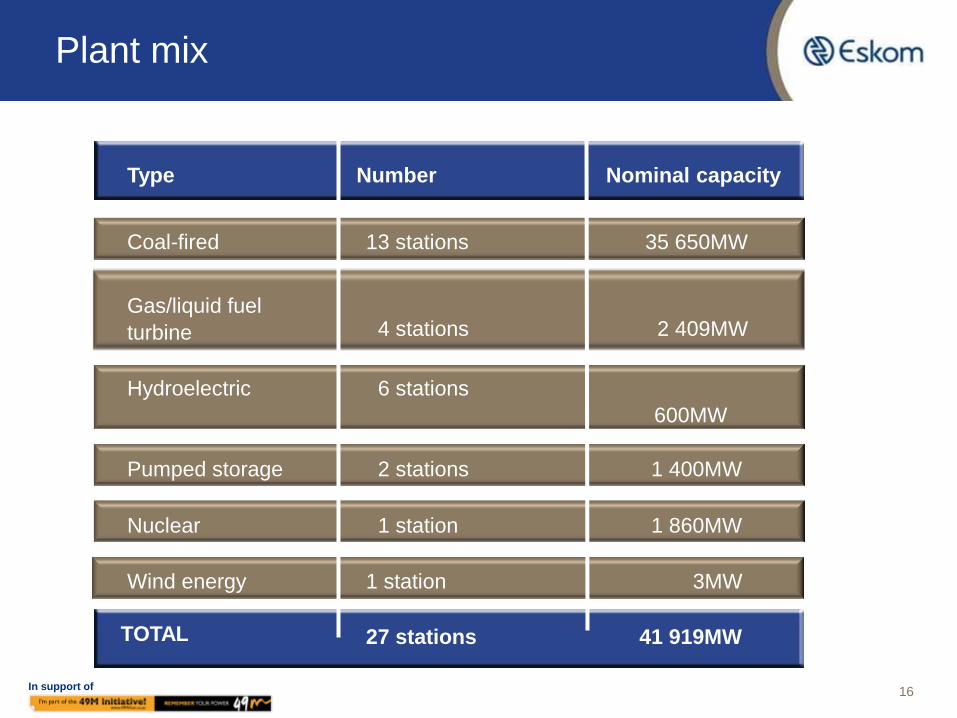
Plant mix
TOTAL
27 stations
41 919MW
Type Number Nominal capacity
Wind energy 1 station 3MW
Coal-fired
Gas/liquid fuel
turbine
Hydroelectric
Pumped storage
Nuclear
13 stations
4 stations
6 stations
2 stations
1 station
35 650MW
2 409MW
600MW
1 400MW
1 860MW

In support of 17
Power stations
Station Location Nominal capacity MW
Coal-fired stations (13) 35 650
Arnot Middelburg, Mpumalanga 2 232
Camden Ermelo 1 480
Duvha Witbank 3 450 Grootvlei Balfour 1 090
Hendrina Mpumalanga 1 865
Kendal Witbank 3 840
Komati Middelburg, Mpumalanga 791
Kriel Bethal 2 850
Lethabo Viljoensdrift 3 558
Majuba Volksrust 3 843
Matimba Lephalale 3 690
Matla Bethal 3 450
Tutuka Standerton 3 510

In support of 18
Power stations
Station Location Nominal capacity MW
Gas/liquid fuel turbine stations (4)
2 409
Acacia Cape Town 171
Ankerlig Atlantis 1 327
Gourikwa Mossel Bay 740
Port Rex East London 171
Hydroelectric stations (6) 600
Colley Wobbles Mbashe River 42
First Falls Umtata River 6
Gariep Norvalspont 360
Ncora Ncora River 2
Second Falls Umtata River 11
Vanderkloof Petrusville 240
In support of 19
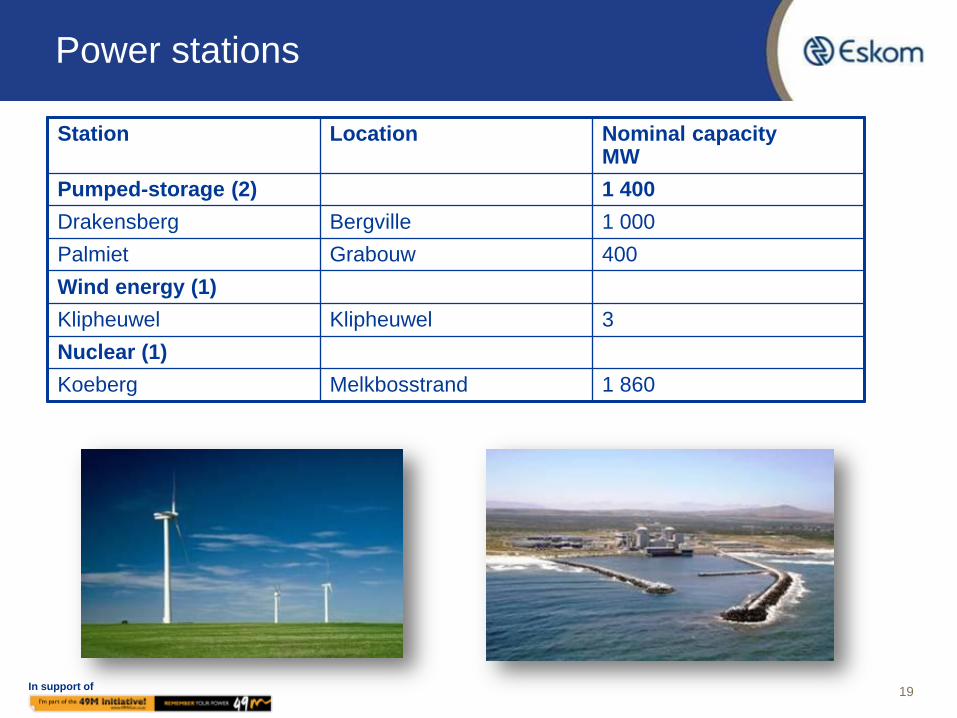
Power stations
Station Location Nominal capacity MW
Pumped-storage (2) 1 400
Drakensberg Bergville 1 000
Palmiet Grabouw 400
Wind energy (1)
Klipheuwel Klipheuwel 3
Nuclear (1)
Koeberg Melkbosstrand 1 860
In support of 20
Key facts (as at 31 March 2013)
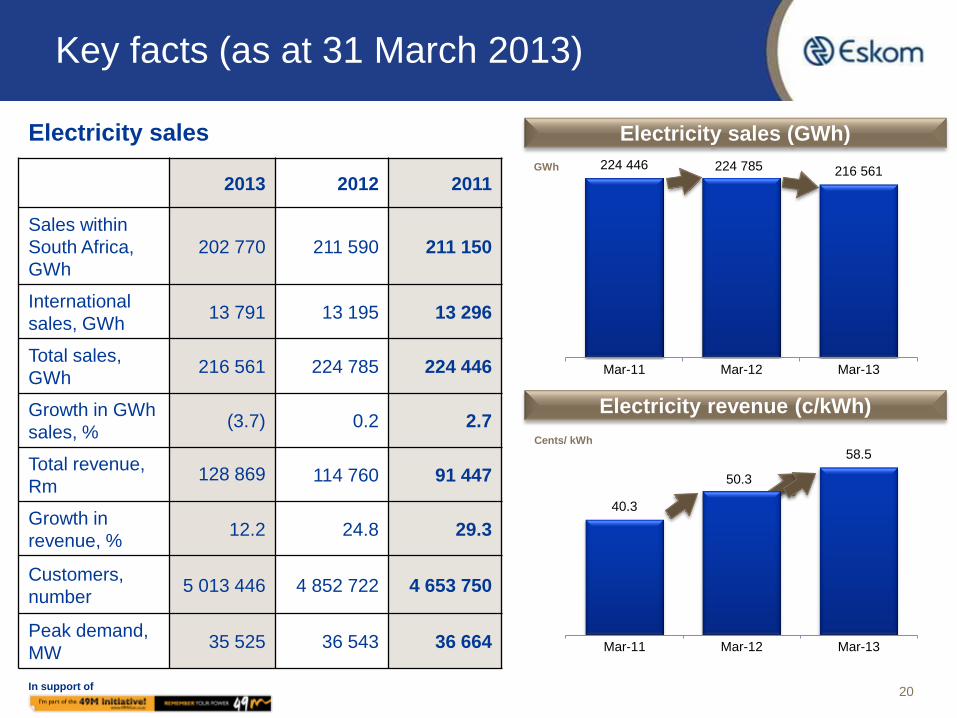
Electricity sales
2013 2012 2011
Sales within
South Africa,
GWh
202 770 211 590 211 150
International
sales, GWh 13 791 13 195 13 296
Total sales,
GWh 216 561 224 785 224 446
Growth in GWh
sales, % (3.7) 0.2 2.7
Total revenue,
Rm 128 869 114 760 91 447
Growth in
revenue, % 12.2 24.8 29.3
Customers,
number 5 013 446 4 852 722 4 653 750
Peak demand,
MW 35 525 36 543 36 664
224 446 224 785 216 561
Mar-11 Mar-12 Mar-13
GWh
40.3
50.3
58.5
Mar-11 Mar-12 Mar-13
Cents/ kWh
Electricity sales (GWh)
Electricity revenue (c/kWh)
In support of
Key facts (as at 31 March 2013)
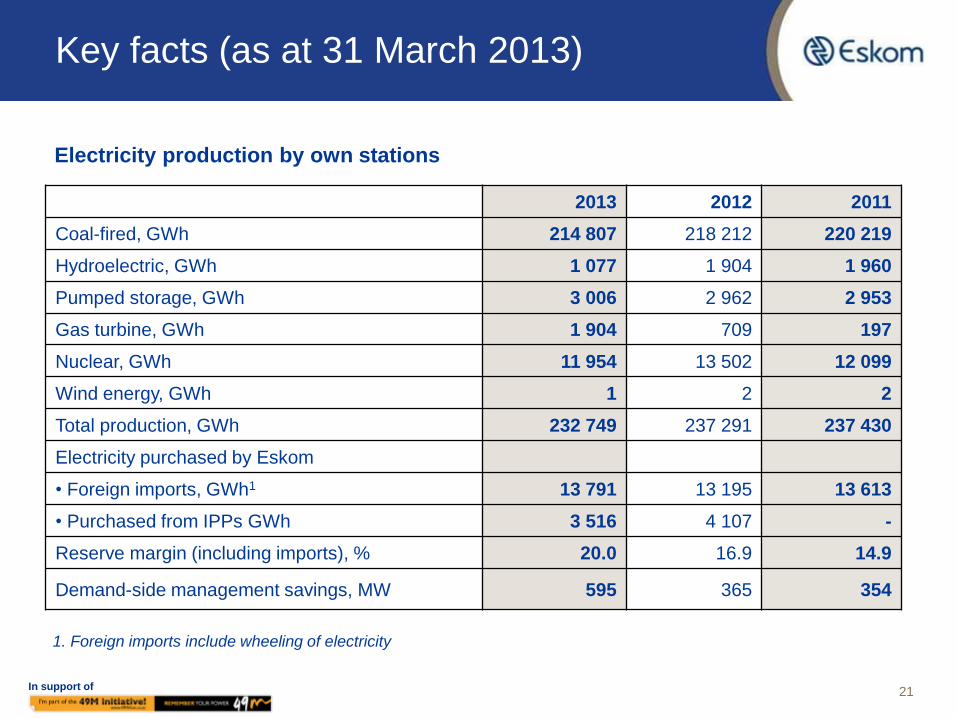
Electricity production by own stations
2013 2012 2011
Coal-fired, GWh 214 807 218 212 220 219
Hydroelectric, GWh 1 077 1 904 1 960
Pumped storage, GWh 3 006 2 962 2 953
Gas turbine, GWh 1 904 709 197
Nuclear, GWh 11 954 13 502 12 099
Wind energy, GWh 1 2 2
Total production, GWh 232 749 237 291 237 430
Electricity purchased by Eskom
• Foreign imports, GWh1 13 791 13 195 13 613
• Purchased from IPPs GWh 3 516 4 107 -
Reserve margin (including imports), % 20.0 16.9 14.9
Demand-side management savings, MW 595 365 354
1. Foreign imports include wheeling of electricity
21

In support of
Key facts (as at 31 March 2013)
Transmission and distribution equipment 2013 2012 2011
Transmission lines, km 29 297 28 995 28 790
Distribution lines, km 67 488 66 941
66 247
Reticulation lines, km 269 535 267 011
263 263
Underground cables, km 6 960 6 657
6 326
Transformer capacity, MVA
• Transmission 135 840 132 955 130 005
• Distribution 105 754 104 185 102 053
Capacity expansion 2013 2012 2011
Generation capacity installed and commissioned, MW 261 535 315
Transmission lines installed, km 787 631 443
Transmission transformer capacity installed, MVA 3 580 2 525 5 940
22
In support of
Key facts (as at 31 March 2013)
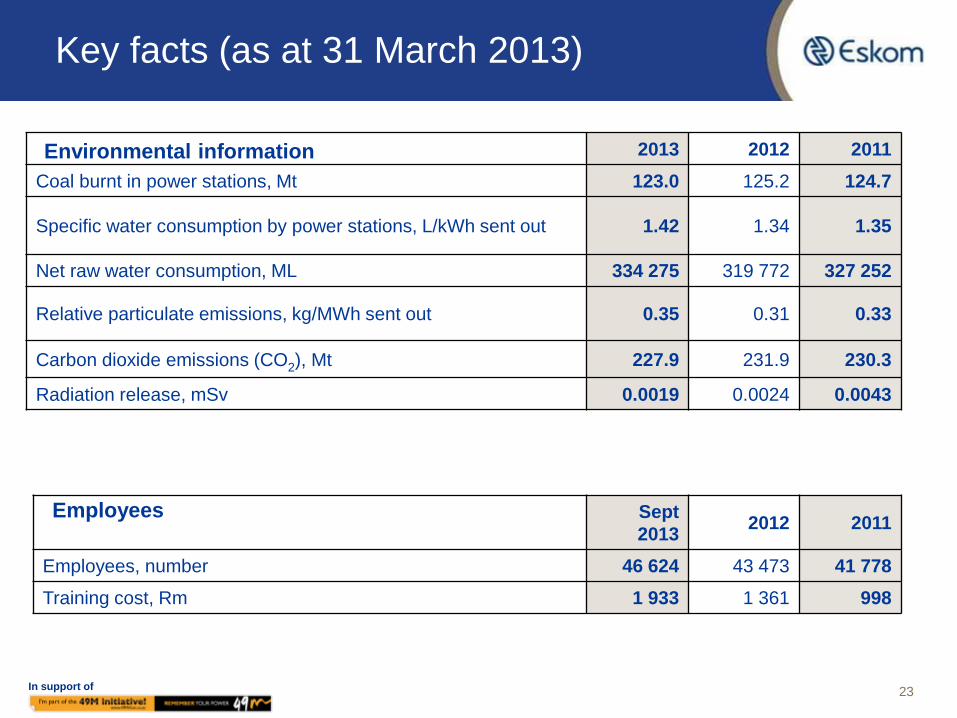
Environmental information 2013 2012 2011
Coal burnt in power stations, Mt 123.0 125.2 124.7
Specific water consumption by power stations, L/kWh sent out 1.42 1.34 1.35
Net raw water consumption, ML 334 275 319 772 327 252
Relative particulate emissions, kg/MWh sent out 0.35 0.31 0.33
Carbon dioxide emissions (CO2), Mt 227.9 231.9 230.3
Radiation release, mSv 0.0019 0.0024 0.0043
Employees Sept
2013 2012 2011
Employees, number 46 624 43 473 41 778
Training cost, Rm 1 933 1 361 998
23

In support of
Key facts (as at 31 March 2013)
Developmental initiatives
2013 2012 2011
B-BBEE attributable spend, R billion 103.4 72.1 41.9
B-BBEE attributable spend, % 86.3 73.2 52.3
Electrification, homes connected 144 558 155 213 149 914
Corporate social investment, Rm 194.3 87.9 62.3
Jobs created through capital expansion
projects cumulative 35 759 28 616 21 197
Eskom trainees / bursars (pipeline) 6 987 6 794 5 283
24

In support of
Staff profile (as at 31 March 2013)
25
Employee profiles Actual
2012/13
Actual
2011/12
Actual
2010/11
Racial equity in senior management, % of
black employees
58.32 53.90 52.52
Racial equity in professionals and middle
management, % of black
employees
69.57 65.69 64.05
Gender equity in senior management, % of
female employees
28.21 24.31 23.51
Gender equity in professionals and middle
management, % of female
employees
34.60 32.43 31.56

Partnering for sustainable growth
26

In support of
Procurement equity and localisation Transformation
1. Reflects the Eskom company’s Broad-Based Black Economic Empowerment (B-BBEE) expenditure
2. Measurement of the procurement from BYO entities only started in 2012
Procurement
from B-BBEE1
compliant
entities
Total measured
procurement spend for
the half year was
R65.9 billion of which
R57.7 billion or 87.6%
was attributable to B-
BBEE, exceeding
the target of 75%
28.6
52.3
73.2
86.3 87.6
Target: 75
10
20
30
40
50
60
70
80
90
100
Year to31 Mar2010
Year to31 Mar2011
Year to31 Mar2012
Year to31 Mar2013
Half year to30 Sep2013
% o
f B
-BB
EE
sp
en
d
14.8 16.1
25.5
3.6 4.0
6.2
0.9 1.0
Sep-11 Sep-12 Sep-13
Procurement from BO entities %
Procurement from BWO entities %
Procurement from BYO entities %
27
Procurement
from black
owned (BO),
black woman
owned (BWO)
and black
youth owned
(BYO) entities
%
n/a2

In support of
Procurement equity and localisation
(continued) Transformation
28
25 437
32 478
38 423
Sep-11 Sep-12 Sep-13
Number
Since 2005, 38 423
individuals (September
2012: 32 478) working on
new build project sites, of
which 18 939 (September
2012: 15 749) are employed
from the local districts
62.4% local content in the new build contracts placed for the financial
year (September 2012: 88.6%)
Local
sourcing
Job creation
Local skills
development
Since capital expansion contracts started being awarded, a total of 8 009
(September 2012: 6 397) contractor employees have been trained in
various trades
Job creation
In support of
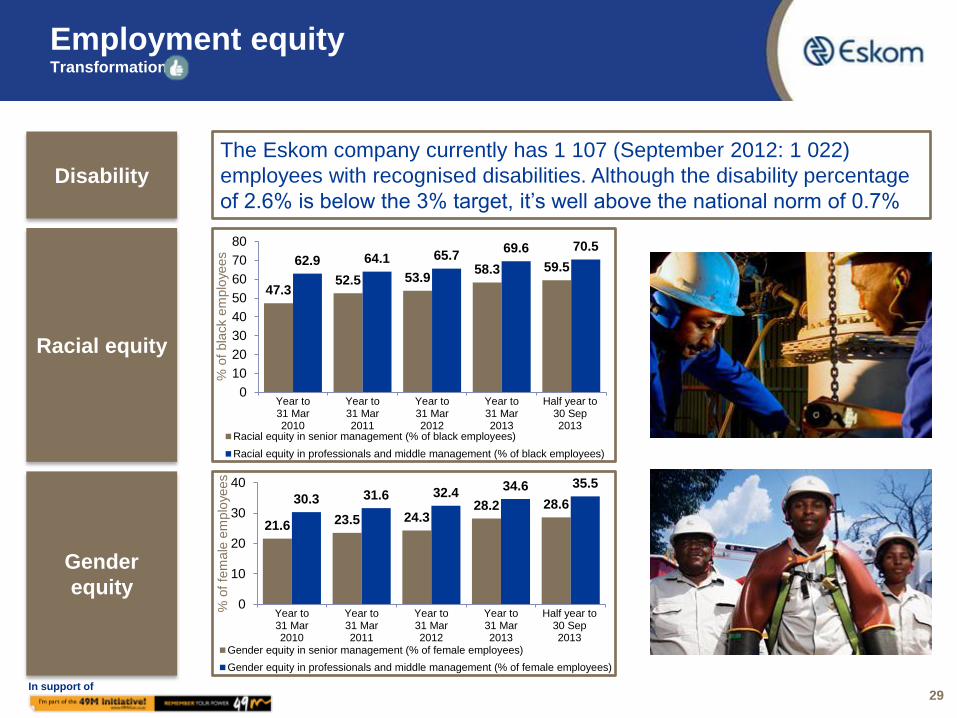
The Eskom company currently has 1 107 (September 2012: 1 022)
employees with recognised disabilities. Although the disability percentage
of 2.6% is below the 3% target, it’s well above the national norm of 0.7%
Employment equity Transformation
Racial equity
Gender
equity
Disability
47.3 52.5 53.9
58.3 59.5 62.9 64.1 65.7
69.6 70.5
0
10
20
30
40
50
60
70
80
Year to31 Mar2010
Year to31 Mar2011
Year to31 Mar2012
Year to31 Mar2013
Half year to30 Sep2013
% o
f bla
ck e
mplo
yees
Racial equity in senior management (% of black employees)
Racial equity in professionals and middle management (% of black employees)
21.6 23.5 24.3 28.2 28.6 30.3 31.6 32.4
34.6 35.5
0
10
20
30
40
Year to31 Mar2010
Year to31 Mar2011
Year to31 Mar2012
Year to31 Mar2013
Half year to30 Sep2013
% o
f fe
male
em
plo
yees
Gender equity in senior management (% of female employees)
Gender equity in professionals and middle management (% of female employees)
29

In support of
352 289
308 615 276 843
Sep-11 Sep-12 Sep-13
Maximise socio-economic contribution Transformation
1. Number of project beneficiaries impacted by Eskom’s corporate social initiatives per half year
A total of 53 600 homes were electrified during the
period to September 2013 (September 2012: 32 216)
Since inception of the electrification programme in
1991, a total of approximately 4.4 million homes
have been electrified
Electrification
Corporate
social
investment
Committed R81.6 million to corporate social
initiatives during the period to September 2013
(September 2012: R69.9 million)
30
Number of project beneficiaries1
Number

In support of
Triple bottom line: safety
31
Causes of fatalities(1): Electrical Contact
Vehicle Falls Violent assault
Other
Employees and contractors
5 4 4 2 42
Fatalities:
Year to 30 Sept 2013
Year to 31 March
2013
Year to 31
March 2012
Year to 31
March 2011
Employees 2 3 13 7
Contractors 6 16 112 18
Employee lost-time incident rate:
Index (target: 0.20) 0.39 0.41 0.47
Employee
and
contractor
fatalities
Causes of
fatalities
Employee
LTIR
1. Covers the period 1 Apr 2012 – 31 March 2013
2. A fatality recorded in 2011/12 has been re-classified as non-work related
3. Included in the four fatalities are two security guards who died from asphyxiation from a heating fire
On 31 October 2013, a gantry (platform) unexpectedly detached in the Incline High Pressure Shaft 3-4 at the Ingula pumped
storage scheme site. There were six fatalities and seven sustained injuries. Internal statutory investigations have been
conducted and the Mine Health and Safety Inspectorate is shortly to commence its investigation in terms of section 60 of the
Mine Health and Safety Act

In support of
Triple bottom line: environmental
32
Environmental
performance
Management
systems
The Generation division, Group Capital construction management, the telecommunications department, Rotek SOC Ltd, Roshcon SOC Ltd, Eskom Aviation and the Sustainability Systems departments obtained ISO 14001 certification during the year
Atmospheric emissions:
Year to 31 March
2013
Year to 31 March
2012
Year to 31 March
2011
Relative particulate emissions,
kg/MWh 0.35 0.31 0.33
Specific water consumption, L/kWh
sent out 1.42 1.34 1.35
CO2 emissions (relative), tons/MWh 0.98 0.99 0.99
CO2 emissions, Mt 227.9 231.9 230.3
Nitrogen oxide emissions, kt 964.8 977 977
Sulphur dioxide emissions, kt 1 843 1 849 1 810
Nitrous oxide emissions, t 2 980 2 967 2 906
Environmental legal contraventions,
number 47 50 63

Income statement for the six months ended 30 September 2013 Ensuring Eskom’s financial sustainability
• Group revenue of R77.8 billion
(September 2012: R73.4 billion),
an increase of 6.1%
• Revenue growth has been offset
by escalating operating
expenditures mainly due to an
increase in primary energy costs
• Effective tax rate of 28.4%
(September 2012: 28.5%)
• Embedded derivative gain is mainly
due to changes in the USD:ZAR
exchange rate and changes in
interest rates
• Finance costs of R6.1 billion were
capitalised during the six months to
30 September 2013 (September
2012: R13.9 billion)
Rm
Reviewed
half-year to
30 Sep
2013
Reviewed
half-year to
30 Sep
2012
Audited
year to
31 March
2013
Revenue 77 815 73 368 128 869
Other income 197 516 1 155
Primary energy (31 266) (24 973) (60 748)
Opex (including depreciation
and amortisation) (28 702) (26 881) (57 701)
Net fair value loss on financial
instruments (998) (1 292) (1 655)
Operating profit before
embedded derivatives 17 046 20 738 9 920
Embedded derivative gain /
(loss) 1 868 698 (5 942)
Operating profit 18 914 21 436 3 978
Net finance (cost) / income1 (1 853) (3 785) 3 027
Share of profit of equity -
accounted investees 26 22 35
Profit before tax 17 087 17 673 7 040
Income tax (4 846) (5 044) (1 857)
Net profit for the period 12 241 12 629 5 183
1. There was no remeasurement of the government loan during the six months to 30 September 2013, as there was no change in the
electricity tariff price path. In 2012/13 the effect of the re-measurement of the government loan was a R17.3 billion income and R9.6
billion cost for the half-year to 30 September 2012 33

Business update
34
In support of
Executive summary
35
Safety
– Sadly, a tragic accident at Ingula caused six fatalities in October 2013
– Employee lost time incident rate improved, but safety continues to be a primary focus
Power system
– The power system remains constrained and the lights were kept on
– On 19 November 2013, Eskom declared an emergency in terms of the approved regulatory
protocols in order to secure the power system. Eskom lifted the emergency declaration at
22:00 on 21 November 2013
– The Generation performance is a focus area in line with the 80:10:10 sustainability strategy
– More maintenance undertaken in winter and summer months
MYPD 3 determination
– Eskom’s response strategy aims to close the revenue gap with a view to increase productivity
and sustainability in the long run
– Certain strategic trade-offs and initiatives will require a change in the approach to the
operating and business model of Eskom
Capital expansion programme
– The return to service power station projects have been concluded with the successful
commissioning of the final unit at Komati power station
– Delivery of Medupi Unit 6 remains a key focal point – first synchronisation date is scheduled
for the second half of 2014
Primary Energy – operational performance
36
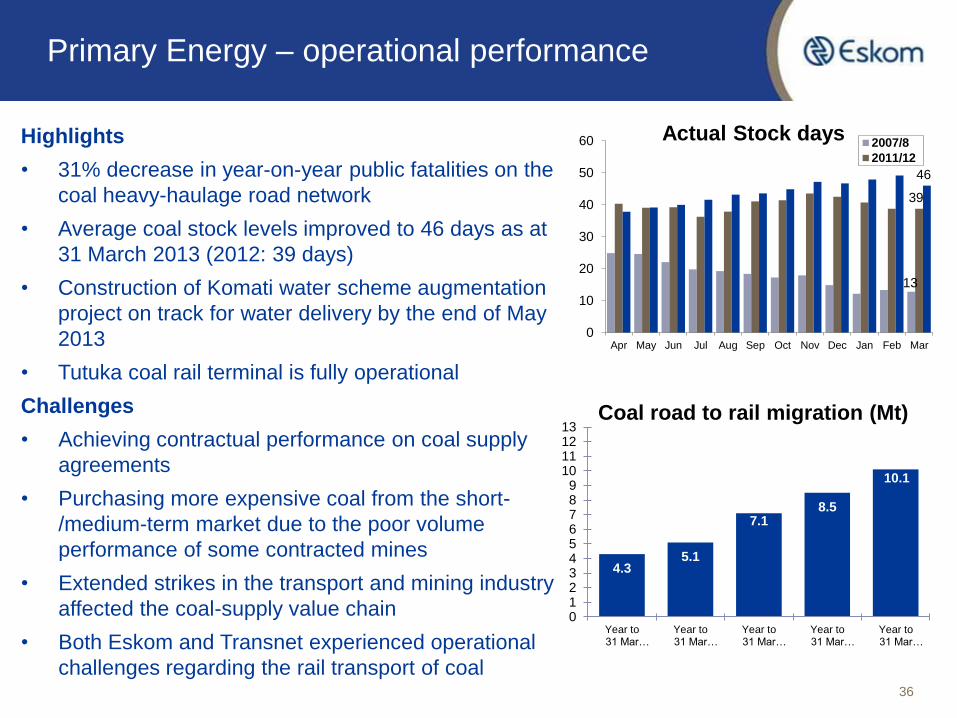
Highlights
• 31% decrease in year-on-year public fatalities on the
coal heavy-haulage road network
• Average coal stock levels improved to 46 days as at
31 March 2013 (2012: 39 days)
• Construction of Komati water scheme augmentation
project on track for water delivery by the end of May
2013
• Tutuka coal rail terminal is fully operational
Challenges
• Achieving contractual performance on coal supply
agreements
• Purchasing more expensive coal from the short-
/medium-term market due to the poor volume
performance of some contracted mines
• Extended strikes in the transport and mining industry
affected the coal-supply value chain
• Both Eskom and Transnet experienced operational
challenges regarding the rail transport of coal
13
39
46
0
10
20
30
40
50
60
Apr May Jun Jul Aug Sep Oct Nov Dec Jan Feb Mar
Actual Stock days 2007/8
2011/12
4.3 5.1
7.1 8.5
10.1
0123456789
10111213
Year to31 Mar…
Year to31 Mar…
Year to31 Mar…
Year to31 Mar…
Year to31 Mar…
Coal road to rail migration (Mt)

Generation – operational performance
37
Highlights
• At the end of September 2013 both
Koeberg units were online for 160 days
simultaneously, surpassing the previous
record which was set in 2004
• The Generation Sustainability Strategy
and the associated increased opportunity
for maintenance has enabled several
stations to significantly improve their
emissions performance
Challenges
• The higher UCLF percentage is an
indication of the deteriorating plant health
of an ageing power station fleet
• Executing the generation sustainability
strategy while keeping the lights on
85.2 84.6 82.0
77.7 78.4
35
45
55
65
75
85
95
Year to31 Mar2010
Year to31 Mar2011
Year to31 Mar2012
Year to31 Mar2013
Half year to30 Sep2013
80.0
Energy availability factor (EAF3) %
Actual Annual year-end target
5.1
6.1
8.0 8.7 8.1
0123456789
10111213
Year to31 Mar2010
Year to31 Mar2011
Year to31 Mar2012
Year to31 Mar2013
Half year to30 Sep2013
ConstrainedUCLF
10.0
11.52 12.1
Unplanned capability loss factor (UCLF1) %
1. UCLF measures the lost energy due to unplanned production interruptions
resulting from equipment failures and other plant conditions
2. The 11.53% normal UCLF consists of constrained UCLF of 3.45% and
underlying UCLF OF 8.08% (UCLF under Eskom’s control). Constrained
UCLF refers to emissions and short-term related UCLF due to system
constraints to meet the “Keep the lights on” objective
3. EAF measures plant availability, plus energy losses not under the control of
plant management

In support of
Strategy to ensure a sustainable generation fleet
• Eskom’s power stations are ageing and need focus to maintain and improve performance
• Planned maintenance has often had to be shifted or deferred to ensure we have the
capacity available to meet demand and keep the lights on
• This approach is not sustainable – it is essential that planned maintenance be done to
enable predictable and sustainable performance from Eskom’s power stations
• Eskom has put in place a five year strategy for generation sustainability which includes a
firm commitment not to postpone critical maintenance. This is based on an 80:10:10
principle – that is, on average, an Energy Availability Factor of 80%, planned maintenance
of 10% and a projected unplanned outage ratio of 10%
38
0
5
10
15
20
25
30
35
40
45
50
Years
Age of Eskom’s generation Fleet
Average age
Fleet average

Transmission – operational performance
39
Highlights
• The excellent line fault performance
attained during the 2012/13 year has
been sustained during the current period
Challenges
• Total number of system minutes lost
performance was impacted by a
combination of human errors, ageing
assets, as well as incidents triggered by
customer network faults which exposed
transmission system vulnerabilities
• Although no significant criminal incidents
have occurred during the period, it
remains a risk
1
0
1
3
0
2
0
1
2
3
4
Year to31 Mar2010
Year to31 Mar2011
Year to31 Mar2012
Year to31 Mar2013
Half year to30 Sep2013
Number of major incidents
System minutes1 lost < 1 system minute
4.1
2.6
4.7
3.5
1.6
3.4
0
1
2
3
4
5
Year to31 Mar2010
Year to31 Mar2011
Year to31 Mar2012
Year to31 Mar2013
Half year to30 Sep2013
Actual Annual year-end target

In support of
Independent power producers
• Eskom remains committed to facilitating the entry of IPPs into the South African
electricity market
• Renewable Energy Independent Power Producer Procurement (REIPP) Programme:
– Eskom supports Government's renewable energy programme, which aims to bring
3 725MW onto the national grid
– On 5 November 2012, Eskom signed 28 power purchase agreements for the first bid
totalling 1 441.7MW
– The procurement process for the second round of submissions has been concluded
and Eskom’s board approved the purchase of 1 043.8MW of renewable energy
capacity
• Department of Energy’s (DoE) open-cycle gas turbine (“Peakers”) programme
– Eskom is awaiting NERSA and PFMA approval to be the buyer of the 1 005MW of
capacity for this programme
• At 31 March 2013 Eskom contracted a total capacity of 1 135MW from IPPs
(2012: 1 008MW) on short- and medium-term programmes. Actual energy purchases
amounted to 3 516GWh (2012: 4 107GWh) and the amount paid to IPPs and municipal
purchases in the year to 31 March 2013 was R2.9 billion or 83.6 c/kWh (2012: R3.3
billion or 77 c/kWh)
40

Distribution – operational performance
41
Highlights
• Several safety initiatives have been
implemented
• The positive network performance
trend is driven by the overall
planning, coordination and disciplined
execution of Eskom’s network
reliability improvement plans and
other operational excellence
initiatives
Challenges
• Employee and contractor safety
performance and lost-time injuries
• Employee security remains a concern
in certain areas
54.4 52.6 45.8
41.9
37.3 45.0
0
10
20
30
40
50
60
Year to31 Mar2010
Year to31 Mar2011
Year to31 Mar2012
Year to31 Mar2013
Half year to30 Sep2013
SAIDI (hours/annum)1
SAIFI (number/annum)2
24.7 25.3 23.7
22.2 20.1
20.0
0
5
10
15
20
25
30
Year to31 Mar2010
Year to31 Mar2011
Year to31 Mar2012
Year to31 Mar2013
Half year to30 Sep2013
Actual Annual year-end target
In support of
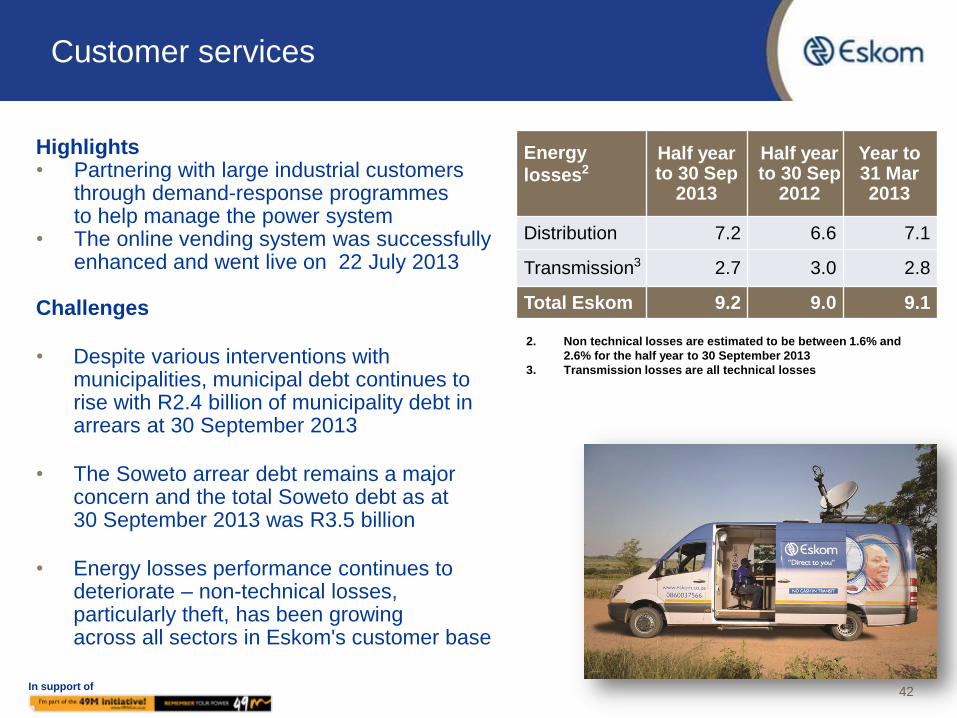
Highlights • Partnering with large industrial customers
through demand-response programmes to help manage the power system
• The online vending system was successfully enhanced and went live on 22 July 2013
Challenges
• Despite various interventions with municipalities, municipal debt continues to rise with R2.4 billion of municipality debt in arrears at 30 September 2013
• The Soweto arrear debt remains a major concern and the total Soweto debt as at 30 September 2013 was R3.5 billion
• Energy losses performance continues to deteriorate – non-technical losses, particularly theft, has been growing across all sectors in Eskom's customer base
Customer services
42
Energy
losses2
Half year to 30 Sep
2013
Half year to 30 Sep
2012
Year to 31 Mar 2013
Distribution 7.2 6.6 7.1
Transmission3 2.7 3.0 2.8
Total Eskom 9.2 9.0 9.1
2. Non technical losses are estimated to be between 1.6% and
2.6% for the half year to 30 September 2013
3. Transmission losses are all technical losses

In support of
• Achieved total evening peak demand
savings of 117MW (2012: 220MW) and
annualised energy savings of 306GWh
(2012: 813GWh)
• Continued the rollout of the demand
response rewards – currently Eskom has
the following available to the system
operator for its control and evening peak
reduction requirements
• 579MW of supplemental load
• 394MW of instantaneous load
• 8MW of standby generation
• The average weekday evening peak
impact of the power alert and power
bulletin for all colours (green, orange and
red) is 238MW, while the average impact
for the red flightings in the evening peak
on the worst constrained day is 324MW
Integrated Demand Management
0
500
1 000
1 500
2 000
2 500
3 000
3 500
4 000
Year to31 Mar2005
Year to31 Mar2006
Year to31 Mar2007
Year to31 Mar2008
Year to31 Mar2009
Year to31 Mar2010
Year to31 Mar2011
Year to31 Mar2012
Year to31 Mar2013
Halfyear to30 Sep2013
Dem
an
d s
avin
gs
(M
W)
Verified MW Eskom Target
Cumulative verified demand savings (MW)
43

In support of
Energy losses and theft
1. Transmission losses are all technical losses
44
• Energy losses reflect the difference between the quantity of energy sent out from the
power stations and the quantity sold to the various customers at the end of the value chain
• High levels of theft of copper and pylons persist, which are affecting plant performance
and increasing costs
• Implementation of the new Second Hand Goods Act on 30 April 2012, followed by
aggressive policing of the scrap industry by law enforcement agencies contributed to a
decrease in incidents and losses
• The joint industry working group formed by Eskom, Transnet, Telkom, SAPS, NPA, BAC
and SACCI continues to contribute positively in the fight against this crime
• The Operation Khanyisa strategy and initiatives have assisted to arrest and contain
energy losses within acceptable parameters despite the negative pressures of the general
economic climate and tariff increases
Energy losses Budget
31 Mar 2013
Actual
31 Mar 2013
Actual
31 Mar 2012
Distribution loss ≤6.1 7.1 6.3
Technical losses - 4.3 3.8
Non-technical losses - 2.8 2.5
Transmission loss1 ≤3.4 2.8 3.1
Total Eskom loss ≤8.9 9.1 8.7

Construction
45

0.0 290.0
1 351.0
1 043.0
1 769.9 452.5
315.0 535.0 261.0 120.0
6 137
659.0 237.0 430.0
480.0 418.3
600.3 443.4
631.3
787.1 511.1
5 198
5 280 1 090 1 000 1 355 1 375
1 630
5 940 2 525
3 580 290
24 065
2004/5 2005/6 2006/7 2007/8 2008/9 2009/10 2010/11 2011/12 2012/13 2013/14 Total
Delivering capacity expansion Leading and partnering to keep the lights on
Km line Transmission
MVAs Substations
MW of capacity Megawatts
To date, a large amount of construction work has been completed, adding
~ 6 137MW of capacity, ~ 5 198km of transmission network and ~ 24 065 of MVAs
46

Significant progress in build programme – began in 2005 with completion in 2020 Leading and partnering to keep the lights on
R71.3bn R60.1bn
R17.1bn R24.4bn R21.2bn
R33.7bn R58.4bn
R8.8bn R1.3bn R13.3bn
Medupi Kusile Ingula Return to service Transmission
Completed Remaining
In addition, Eskom incurs capital expenditure on
strengthening, refurbishing and expanding its
Distribution network
67.9%
65.9% 94.8% 61.5%
R105.0bn
R25.9bn
R118.5bn
R25.7bn1
R34.5bn2
% of estimated total cost spent as at 30 September 2013
50.7% R billion spent and to be spent on the capital expansion
programme (excluding borrowing costs capitalised)
1. Includes R0.6 billion for the Camden burner project, which was initiated after 31 March 2013
2. Includes transmission costs for Ingula, Kusile and Medupi 47

In support of
• ~ 17.1GW of new capacity (6 137MW installed and commissioned) • ~ 9 756 km of new transmission network (5 198km installed) • ~ 42 470 MVA of new transmission strengthening (24 065MVA installed)
New generation capacity and transmission lines Leading and partnering to keep the lights on
Un
der
co
nstr
ucti
on
In
dev
elo
pm
en
t
Return-to-service
(RTS) Base load
Peaking and
renewable
Mpumalanga
refurbishment Transmission
• None • Nuclear New Build Programme
• Next Coal (Coal 3) • Biomass • Majuba Underground Coal
Gasification Demo Plant (UCG)
• Primary Energy projects (Road and Rail)
• Pilot Concentrated Solar Power (100 MW)
• Open Cycle Gas Turbine Conversion Project – conversion of Ankerlig and Gourikwa OCGT power plants to a Combined Cycle Gas Turbine (CCGT)
• Photovoltaic (own use)
• Refurbishment and air quality projects
• >60 Grid strengthening projects
• Komati (1 000 MW) • Camden (1 520 MW) • Grootvlei (1 180 MW)
• Medupi (4 764 MW) • Kusile (4 800 MW)
• Ankerlig (1 338.3MW) • Gourikwa (746 MW) • Ingula (1 332 MW) • Sere (100 MW) • Acacia relocation • Solar PV installations:
MWP, Lethabo, Kendal (1.62 MW)
• Arnot capacity increase (300 MW)
• Matla refurbishment • Kriel refurbishment • Duvha refurbishment • Grootvlei Fabric Filter
Plant (FFP) • Kriel Retrofit
• 765kV projects • Central projects • Northern projects • Cape projects
Medupi is the first coal-generating plant in Africa to use supercritical power generation technology
Commissioning of new power stations1
First unit Last unit
Medupi 2014 2017
Kusile 2015 2019
Ingula 2014 2015
3 700 MW 9 564 MW 3 517.92 MW 300 MW 9 756 km
1. Refers to the first synchronisation date 48

Financial performance
49

Income statement for the six months ended 30 September 2013 Ensuring Eskom’s financial sustainability
• Group revenue of R77.8 billion
(September 2012: R73.4 billion),
an increase of 6.1%
• Revenue growth has been offset
by escalating operating
expenditures mainly due to an
increase in primary energy costs
• Effective tax rate of 28.4%
(September 2012: 28.5%)
• Embedded derivative gain is mainly
due to changes in the USD:ZAR
exchange rate and changes in
interest rates
• Finance costs of R6.1 billion were
capitalised during the six months to
30 September 2013 (September
2012: R13.9 billion)
Rm
Reviewed
half-year to
30 Sep
2013
Reviewed
half-year to
30 Sep
2012
Audited
year to
31 March
2013
Revenue 77 815 73 368 128 869
Other income 197 516 1 155
Primary energy (31 266) (24 973) (60 748)
Opex (including depreciation
and amortisation) (28 702) (26 881) (57 701)
Net fair value loss on financial
instruments (998) (1 292) (1 655)
Operating profit before
embedded derivatives 17 046 20 738 9 920
Embedded derivative gain /
(loss) 1 868 698 (5 942)
Operating profit 18 914 21 436 3 978
Net finance (cost) / income1 (1 853) (3 785) 3 027
Share of profit of equity -
accounted investees 26 22 35
Profit before tax 17 087 17 673 7 040
Income tax (4 846) (5 044) (1 857)
Net profit for the period 12 241 12 629 5 183
1. There was no remeasurement of the government loan during the six months to 30 September 2013, as there was no change in the
electricity tariff price path. In 2012/13 the effect of the re-measurement of the government loan was a R17.3 billion income and R9.6
billion cost for the half-year to 30 September 2012 50

55.3
64.9 69.0
Sep-11 Sep-12 Sep-13
Cents/ kWh
Sales and revenue Ensuring Eskom’s financial sustainability
114 043 110 766 110 659
Sep-11 Sep-12 Sep-13
GWh
Electricity sales (GWh)
Electricity revenue (c/kWh)
• Eskom achieves higher profits in the first
six months of the financial year due to
higher tariffs and energy demand in
winter
• Sales (in GWh) contracted by 0.1% when
compared to the same period last year,
mainly due to a warmer winter
• A small year-on-year sales growth of
0.6% is expected for the year ending
31 March 2014
Electricity sales by customer type1
6.5%, [6.5%]
14.5%, [14.7%]
5.1%, [4.9%]
5.7%, [6.5%]
23.9%, [23.0%]
42.8%, [43.0%]
Rail 1.4%,[1.4%] Residential
Industry
Foreign
Mining Commercial and agricultural
Municipalities
1. Percentages reflected for the sales achieved in the six months to 30 September
2013. Numbers in brackets are those for the six months to 30 September 2012
(2.9)% (0.1)%
6.3%
17.3%
51

Headcount:
( 19.2) ( 22.5) ( 28.3)
( 8.2) ( 10.5)
( 11.7) ( 4.1)
( 4.7)
( 6.0)
( 6.7)
( 9.1)
( 8.2)
Sep-11 Sep-12 Sep-13
Other operating expenses Depreciation and amortisation expense
Employee benefit expense Primary energy costs
7 597
10 045 9 111
6.7
9.1 8.2
Sep-11 Sep-12 Sep-13
36% (9)%
Operating expenses1
Ensuring Eskom’s financial sustainability
Rm
1. Cents/kWh figures are calculated based on total electricity sales numbers and group financials
2. Includes salaries, staff costs, post-retirement medical aid, pension benefits, relocation, training , temporary and contract employee
costs etc.
3. Including managerial, technical and other fees, research and development, auditor’s remuneration, integrated demand management,
and repairs and maintenance costs
Other operating expenses3
Cents/ kWh
Primary energy costs
Rm Cents/ kWh
21 858
24 973
31 266 19.2
22.5
28.3
Sep-11 Sep-12 Sep-13
18%
25%
Net employee benefit cost2
Cents/ kWh Rm
9 408
11 628 12 989
8.2
10.5 11.7
Sep-11 Sep-12 Sep-13
12% 27%
46 624 44 913 41 756
Operating costs
Cents/ kWh
52

• Primary energy costs increased by 25.3% from 22.5c/kWh (September 2012) to
28.3c/kWh for the half year to 30 September 2013 mainly due to the following:
0 5 10 15 20 25 30
Coal usage OCGTsEnvironmental levy Gas fuel start-up costsInternational purchases Other
Analysis of primary energy costs Ensuring Eskom’s financial sustainability
cents / kWh
Primary energy costs1 in c/kWh
as at 30 September 2013:
1. Primary energy costs in c/kWh based on electricity sales.
Costs on this slide are for the six months to 30 September
2013 and the comparatives are for the six months to 30
September 2012
2. Open cycle gas turbine (OCGT)
0.3
28.3
Primary energy costs1 in
c/kWh as at 30 September
2012:
2.1
1.9
0.5
22.5
0.5
OCGT2 costs increased by
R2.3 billion (231%)
Coal usage costs
increased by 13.3%
International purchase
costs increased by 53%
Other items in aggregate
Environmental levy
Gas fuel start-up costs
increased by 76% 0.5
53

In support of
7.6
9.5
4.9
Mar-11 Mar-12 Mar-13
Company EBIT before embedded derivatives
Total Revenue1 Operating costs
1. Includes non-electricity revenues
2. Includes other income and net fair value gains/losses on financial
instruments
3. This mainly consists of repairs and maintenance and IDM costs
4. Includes net impairment losses
EBIT before embedded derivatives2
40.5
50.5
58.8
Mar-11 Mar-12 Mar-13
( 16.0) ( 20.6)
( 28.1)
( 6.8)
( 7.9)
( 9.6)
( 3.5)
( 4.1)
( 5.0)
( 6.5)
( 8.7)
( 11.5)
Mar-11 Mar-12 Mar-13
Other operating expenses
Depreciation and amortisation expense
Employee benefit expense
Primary energy costs
Cents/ kWh Cents/ kWh
Cents/ kWh
(32.8)
(41.3)
(54.2)
3
4
54
10.88 10.68
13.60
8.10 8.28 10.05
Sep-11 Sep-12 Sep-13
Rand:Euro Rand:USD
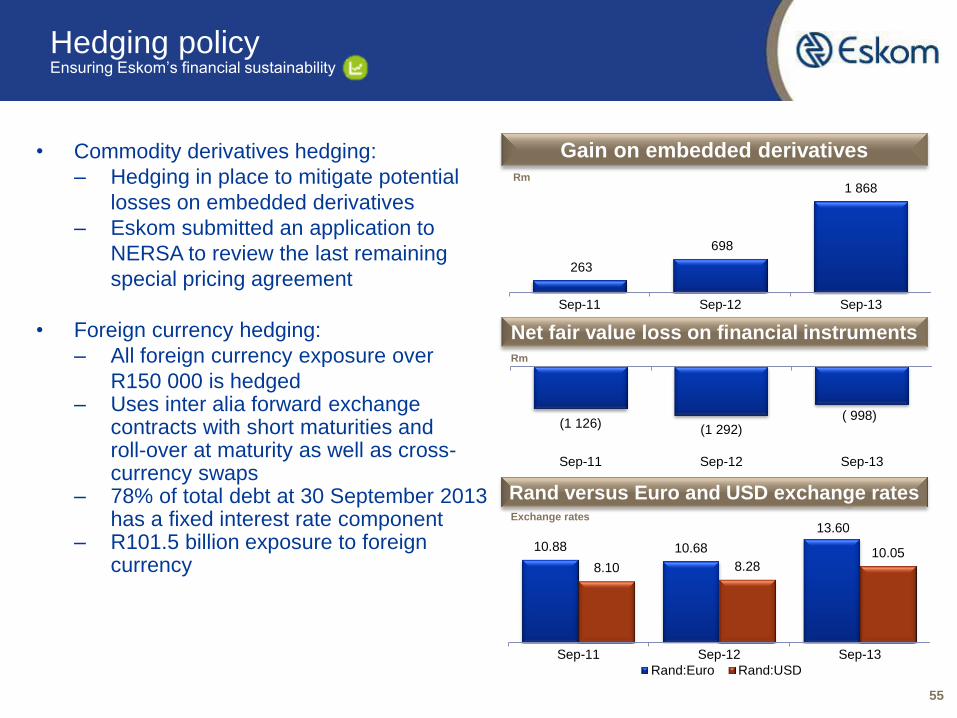
• Commodity derivatives hedging:
– Hedging in place to mitigate potential
losses on embedded derivatives
– Eskom submitted an application to
NERSA to review the last remaining
special pricing agreement
• Foreign currency hedging:
– All foreign currency exposure over
R150 000 is hedged – Uses inter alia forward exchange
contracts with short maturities and roll-over at maturity as well as cross-currency swaps
– 78% of total debt at 30 September 2013 has a fixed interest rate component
– R101.5 billion exposure to foreign currency
Hedging policy Ensuring Eskom’s financial sustainability
263
698
1 868
Sep-11 Sep-12 Sep-13
Gain on embedded derivatives Rm
(1 126) (1 292)
( 998)
Sep-11 Sep-12 Sep-13
Rm
Net fair value loss on financial instruments
Rand versus Euro and USD exchange rates Exchange rates
55
56
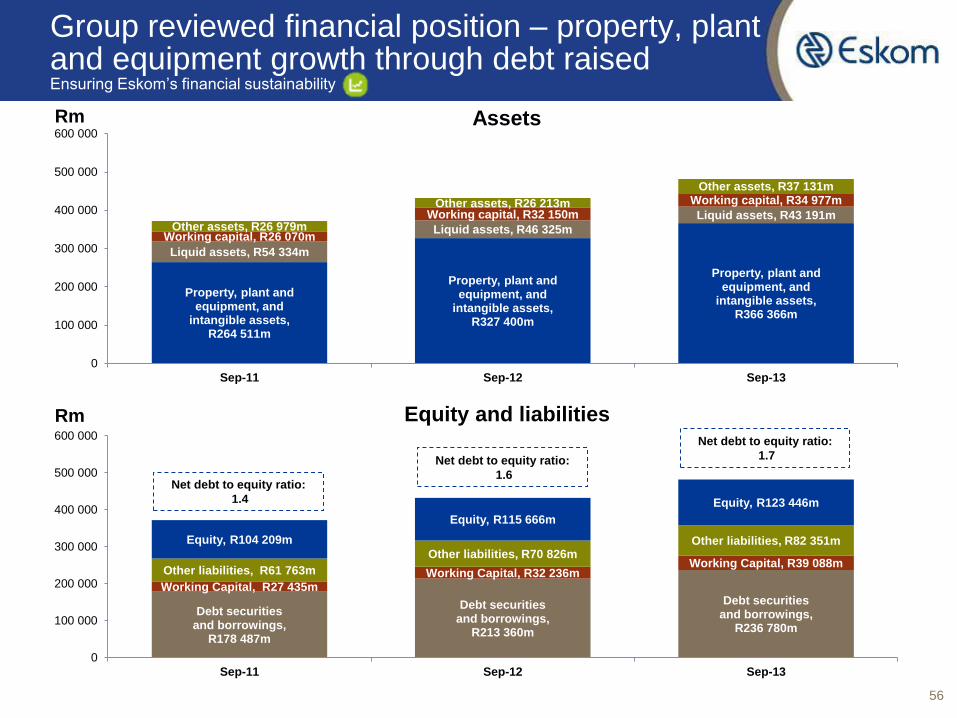
Group reviewed financial position – property, plant and equipment growth through debt raised Ensuring Eskom’s financial sustainability
Equity and liabilities
Assets Rm
Debt securities and borrowings,
R178 487m
Debt securities and borrowings,
R213 360m
Debt securities and borrowings,
R236 780m
Working Capital, R27 435m Working Capital, R32 236m
Working Capital, R39 088m Other liabilities, R61 763m
Other liabilities, R70 826m Other liabilities, R82 351m Equity, R104 209m
Equity, R115 666m
Equity, R123 446m
0
100 000
200 000
300 000
400 000
500 000
600 000
Sep-11 Sep-12 Sep-13
Rm
Property, plant and equipment, and
intangible assets, R264 511m
Property, plant and equipment, and
intangible assets, R327 400m
Property, plant and equipment, and
intangible assets, R366 366m
Liquid assets, R54 334m
Liquid assets, R46 325m
Liquid assets, R43 191m
Working capital, R26 070m
Working capital, R32 150m
Working capital, R34 977m
Other assets, R26 979m
Other assets, R26 213m
Other assets, R37 131m
0
100 000
200 000
300 000
400 000
500 000
600 000
Sep-11 Sep-12 Sep-13
Net debt to equity ratio:
1.6
Net debt to equity ratio:
1.7
Net debt to equity ratio:
1.4

26 053 26 020
23 440
Sep-11 Sep-12 Sep-13
Balance sheet Ensuring Eskom’s financial sustainability
Capital expenditure
1. Represents the repayment of nominal capital and interest in the strategic and trading portfolio. Data as at 30 September 2013
2. Reflects the 10 financial years starting 1 April 2014 and ending on 31 March 2024
Debt and borrowings maturity profile1
Within six months 3.1%
Six months to 10 years
44.5%
More than 10 years 52.3%
Debt securities and borrowings
14 610
27 400 30 193
39 724 18 925 12 998
Sep-11 Sep-12 Sep-13
Cash and cash equivalents Investment in securities
Rm
Liquid assets at period end
54 334
46 325 43 191
Rm
178 487
213 360
236 780
Sep-11 Sep-12 Sep-13
2
57

Debt maturity profile Ensuring Eskom’s financial sustainability
Strategic and trading portfolio nominal and interest cashflows as at 30 September 2013
Rbn Rbn
0
50
100
150
200
250
300
350
0
5
10
15
20
25
30
35
40
20
14
20
15
20
16
20
17
20
18
20
19
20
20
20
21
20
22
20
23
20
24
20
25
20
26
20
27
20
28
20
29
20
30
20
31
20
32
20
33
20
34
20
35
20
36
20
37
20
38
20
39
20
40
20
41
20
42
20
43
20
44
Total capital Total interest Cumulative nominal capital total
58
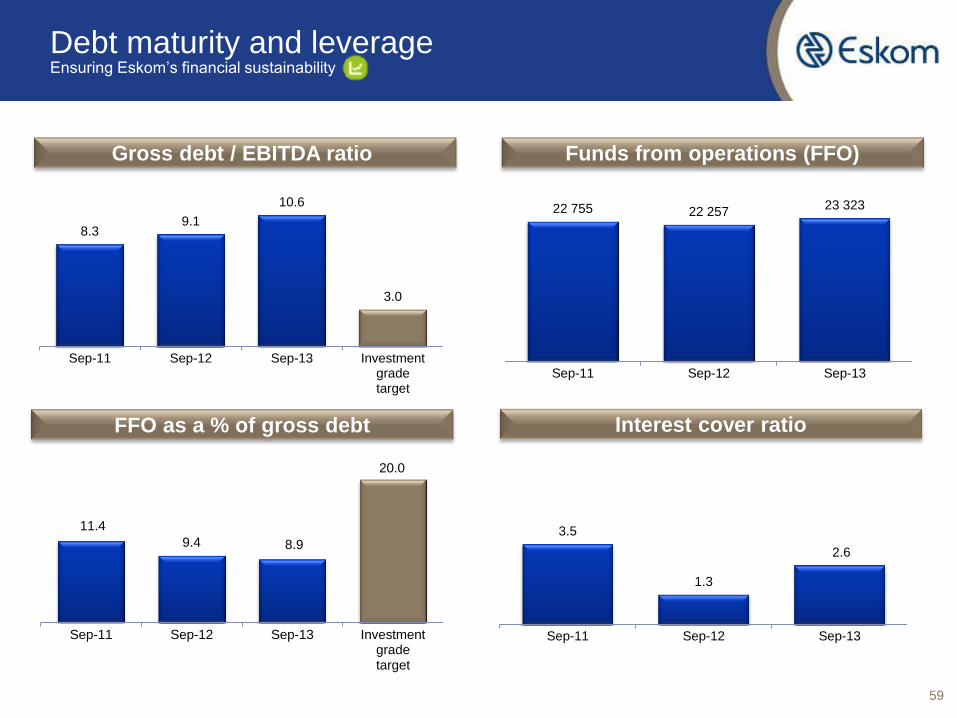
8.3 9.1
10.6
3.0
Sep-11 Sep-12 Sep-13 Investmentgradetarget
Debt maturity and leverage Ensuring Eskom’s financial sustainability
Gross debt / EBITDA ratio Funds from operations (FFO)
3.5
1.3
2.6
Sep-11 Sep-12 Sep-13
Interest cover ratio FFO as a % of gross debt
11.4
9.4 8.9
20.0
Sep-11 Sep-12 Sep-13 Investmentgradetarget
22 755 22 257 23 323
Sep-11 Sep-12 Sep-13
59

In support of
Financing
19 625
29 475
4 050 (23 083)
(1 437)
(4 819)
(4 224) (14)
10 620
30 193
31 Mar 2013cash and cash
equivalents
Cash generatedby operations
Capexexpenditure
Other investing Debt raised Debt repaid Net interestrepayments
Investment insecurities
Otherfinancingactivities
30 Sep 2013cash and cash
equivalents
Summary of reviewed cash flows Ensuring Eskom’s financial sustainability
Operations Investing Rm
60

Funding plan – R300 billion from 1 April 2010 to 31 March 2017 Ensuring Eskom’s financial sustainability
Source of funds
Funding
sourced
R billion
Currently
secured
R billion
Draw-downs
to date
R billion
Amount
supported by
government
R billion
Bonds 90.0 60.9 60.9 38.2
Commercial paper1 70.0 70.0 35.0 0.0
Export Credit Agencies 32.9 32.9 20.5 0.0
World Bank 27.8 27.8 10.3 27.8
AfDB 20.9 20.9 14.2 20.9
Development Bank of
Southern Africa 15.0 15.0 8.0 0.0
Shareholder Loan 20.0 20.0 20.0 20.0
Other / new sources 23.4 18.4 4.3 4.9
Totals 300.0 265.9 173.2 105.9
Percentages 88.6%2 65.1%3 42.1%3
1. Commercial paper is issued for up to one year and then redeemed and re-issued for the same net amount. The commercial paper is
thus by definition not fully secured for the full period, however, Eskom’s long term observations and past trends support a high
level of confidence that Eskom will be able to roll over the redemptions each year. For this reason, the gross value of the
commercial paper is shown under the “secured” column in the borrowing programme table above
2. As a percentage of the R300 billion funding sourced
3. As a percentage of the currently secured total
This plan was based on the assumption of a 16% MYPD 3 increase and will need
to be extended
61

Credit ratings Ensuring Eskom’s financial sustainability
Rating Standard &
Poor’s Moody’s
Fitch
Local Currency National Scale
Foreign currency BBB Baa3 - AA+
Local currency BBB Baa3 BBB+ F1+
Stand-alone b- b1 B None
Outlook Negative Negative Stable Stable
Action Date 14 Oct 2013 19 Jul 2013 11 Jan 2013 16 Jan 2013
Affirmation Date 14 Oct 2013 19 Jul 2013 2 Aug 2013 2 Aug 2013
62

Outlook
63

In support of
“New Build Programme”
• Eskom will ensure renewed focus on
delivering on capacity expansion
projects – on time, within budget, and
to the right quality
Eskom has defined three strategic agendas
Text
Text Text
Eskom
mandate
Transformation and
social sustainability
Building a
sustainable
skills base
Environ-
mental
sustain-
ability
Financial
sustainability
Opera-
tional
sus-
tain-
ability
Asset
creation
Eskom reputation
Eskom sustainability framework Eskom’s Integrated Delivery Plan (IDP) I
II
III
“Sustainable Asset Base and Meeting
Demand”
• Security of supply remains a key
concern calling for an integrated
perspective on energy conservation,
demand management, and use of
OCGTs
• Maintenance regime and refurbishment
of network critical
“Business Productivity Programme”
• The tightened financial environment
can only be dealt with through a
sustained productivity improvement in
all parts of the business – BPP
delivers this 64

65
Conclusion
• Power system
– Eskom has kept the lights on through a challenging year
– The power system will remain tight in summer. Summer is typically maintenance
season, but this summer maintenance will increase based on the generation
sustainability strategy as most of the maintenance is fixed and cannot be deferred
– We can all help to keep the lights on by “Living Lightly”
• MYPD 3 determination and the way forward
– The reduced capital allocation will still deliver the existing capital expansion
programme and the revised budget after reductions still aims to deliver on the eight
strategic imperatives and Eskom‘s mandate
– However, within the revised budget, there are certain strategic trade-offs and
initiatives that Eskom will have to consider. The trade-offs will require a change in
the approach to the operating and business model of Eskom
• Capacity expansion programme
– Special focus on bringing the first unit of Medupi online
• Transformation
– Initiatives have been implemented to transform Eskom and improve its operations

66
Awards and recognition
Most Desired Company to Work For Sunday Times
Second in Community Upliftment Sunday Times
Second top company that does the most to look after the environment
and natural resources
Sunday Times
Star Award for Operation Khanyisa Star Awards
Voted Top Engineering Company by engineering students; second best
by MBA and Professionals Mail & Guardian
Winner of the Human Resources team of the year category Institute of Personnel Management
Best presentation in market cap above R30 billion category Investment Analysts Society
Nkonki SOC integrated reporting awards winner and ranked “excellent”
by Ernst & Young
Nkonki SOC awards & E&Y integrated
reporting award
Fourth most popular brand in South Africa Finweek
Golden Key Award for best practice by a public institution SA Human Rights Commission
Stars of Africa 2013 Gold Award for Eskom Contractor Academy:
incubation category Stars of Africa 2013
Runner-up in 2013 Water Conservation and Water Demand Management
Sector awards (mining/industry/power) Department of Water Affairs
2013 Boss of the Year - Ayanda Nakedi, Senior General Manager of the
Renewables Business Unit Boss of the Year award
Visionary CIO award - Sal Laher, CIO and Divisional Executive for Group
IT division IT Professionals South Africa
General Counsel of the Year - Willie du Plessis, General Manager (Legal
Specialist) African Legal awards