Embed Size (px)
Citation preview
ESPEN Congress Istanbul 2006
A Patient's Journey through Complicated Pancreatitis
ESPEN Nutritional Support Recommendations
R. Meyer (Switzerland)
ESPEN ESPEN -- Nutritional Support Nutritional Support RecommendationsRecommendations(An Evidence based Approach and the (An Evidence based Approach and the Application in Europe)Application in Europe)
RRéémymy Meier MDMeier MDAssociate ProfessorAssociate ProfessorUniversity HospitalUniversity HospitalLiestalLiestal, Switzerland, Switzerland
ESPENESPEN--FELANPE Symposium Istanbul 2006FELANPE Symposium Istanbul 2006
NutritionalNutritional deficienciesdeficienciesand and malnutritionmalnutrition areare a a significantsignificant problemproblem in in clinicalclinical practicepractice
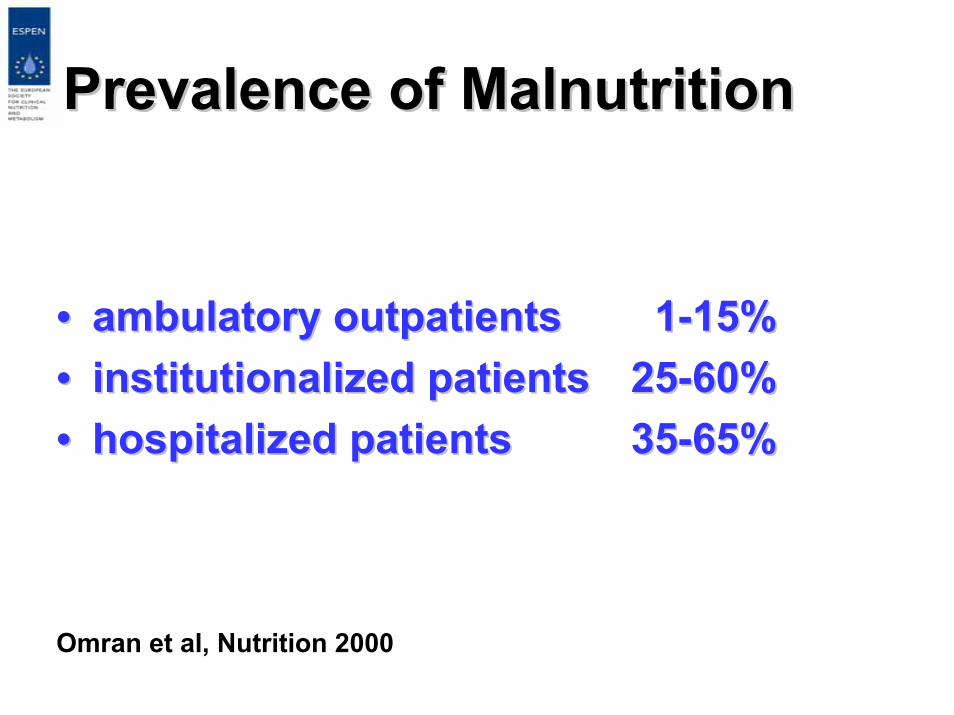
PrevalencePrevalence of of MalnutritionMalnutrition
•• ambulatoryambulatory outpatientsoutpatients 11--15%15%•• institutionalizedinstitutionalized patientspatients 2525--60%60%•• hospitalizedhospitalized patientspatients 3535--65%65%
Omran et al, Nutrition 2000
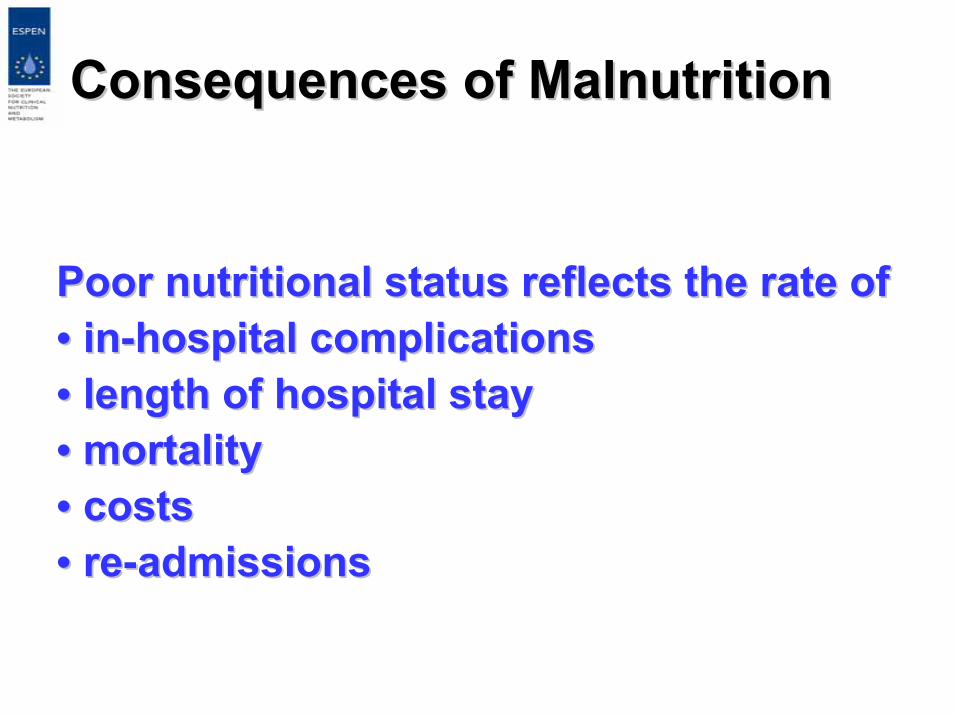
ConsequencesConsequences of of MalnutritionMalnutrition
PoorPoor nutritionalnutritional statusstatus reflectsreflects thethe rate ofrate of•• inin--hospitalhospital complicationscomplications•• lengthlength of of hospitalhospital staystay•• mortalitymortality•• costscosts•• rere--admissionsadmissions
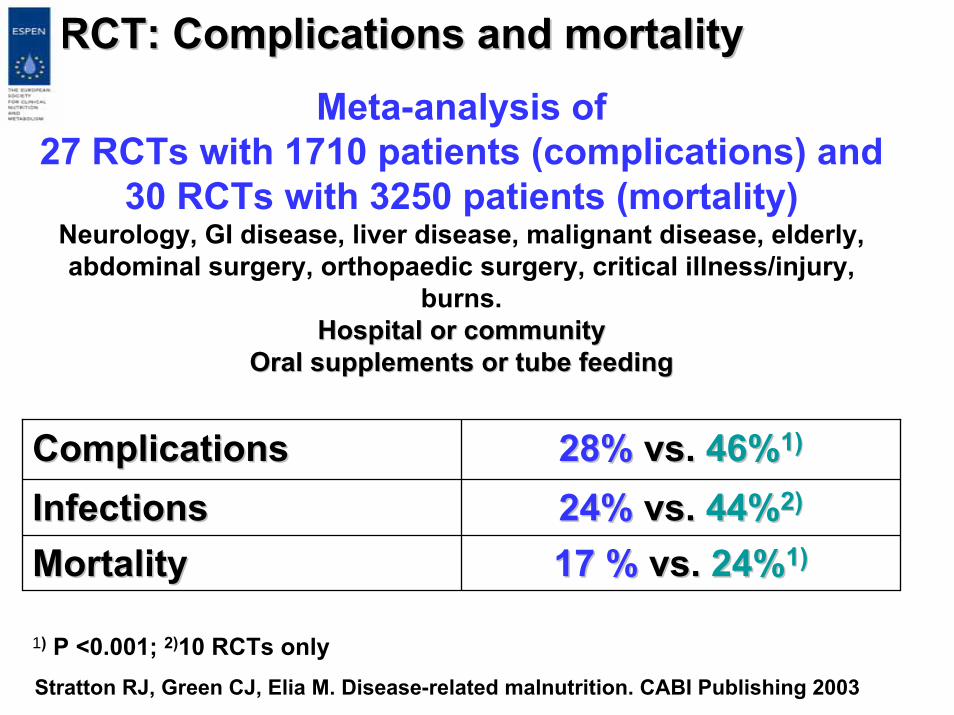
RCT: RCT: Complications andComplications and mortalitymortalityMeta-analysis of
27 RCTs with 1710 patients (complications) and 30 RCTs with 3250 patients (mortality)
Neurology, GI disease, liver disease, malignant disease, elderly, abdominal surgery, orthopaedic surgery, critical illness/injury,
burns.Hospital Hospital oror communitycommunity
Oral supplements Oral supplements oror tube tube feedingfeeding
ComplicationsComplications 28%28% vs. vs. 46%46%1)1)
InfectionsInfections 24%24% vs. vs. 44%44%2)2)
MortalityMortality 17 %17 % vs. vs. 24%24%1)1)
1) P <0.001; 2)10 RCTs onlyStratton RJ, Green CJ, Elia M. Disease-related malnutrition. CABI Publishing 2003
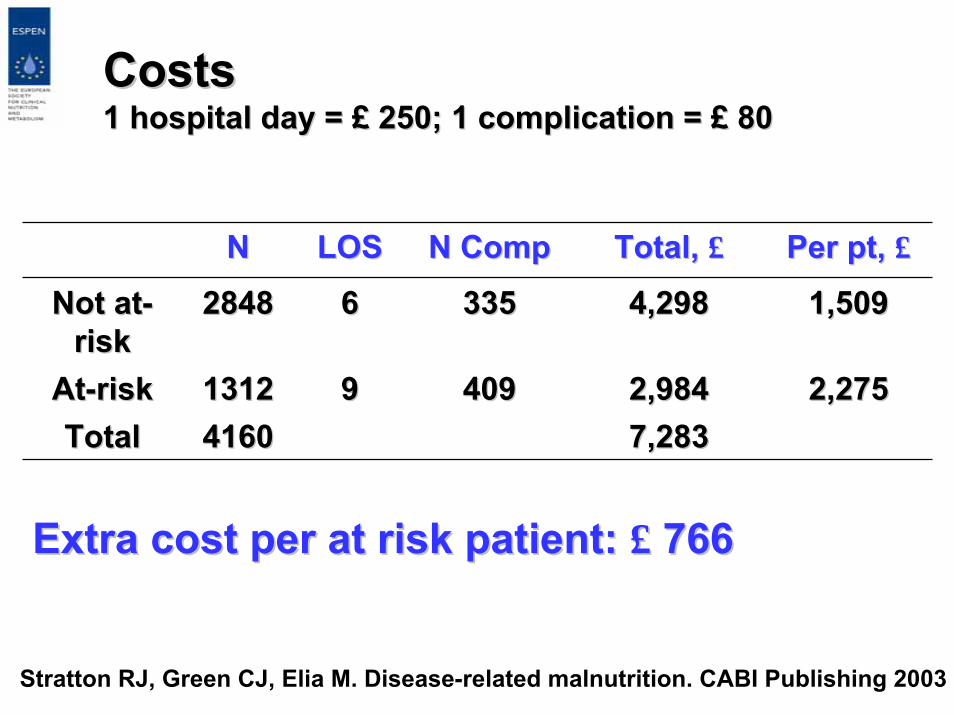
CostsCosts1 hospital 1 hospital day day = = ££ 250; 1 250; 1 complicationcomplication = = ££ 8080
NN LOSLOS NN CompComp Total, Total, ££ Per Per ptpt, , ££
Not atNot at--riskrisk
28482848 66 335335 4,2984,298 1,5091,509
AtAt--riskrisk 13121312 99 409409 2,9842,984 2,2752,275TotalTotal 41604160 7,2837,283
Extra cost Extra cost per per at riskat risk patient: patient: ££ 766766
Stratton RJ, Green CJ, Elia M. Disease-related malnutrition. CABI Publishing 2003
Important ImplicationImportant Implication
The nutritional statusThe nutritional statusmust be known inmust be known inall patientsall patients
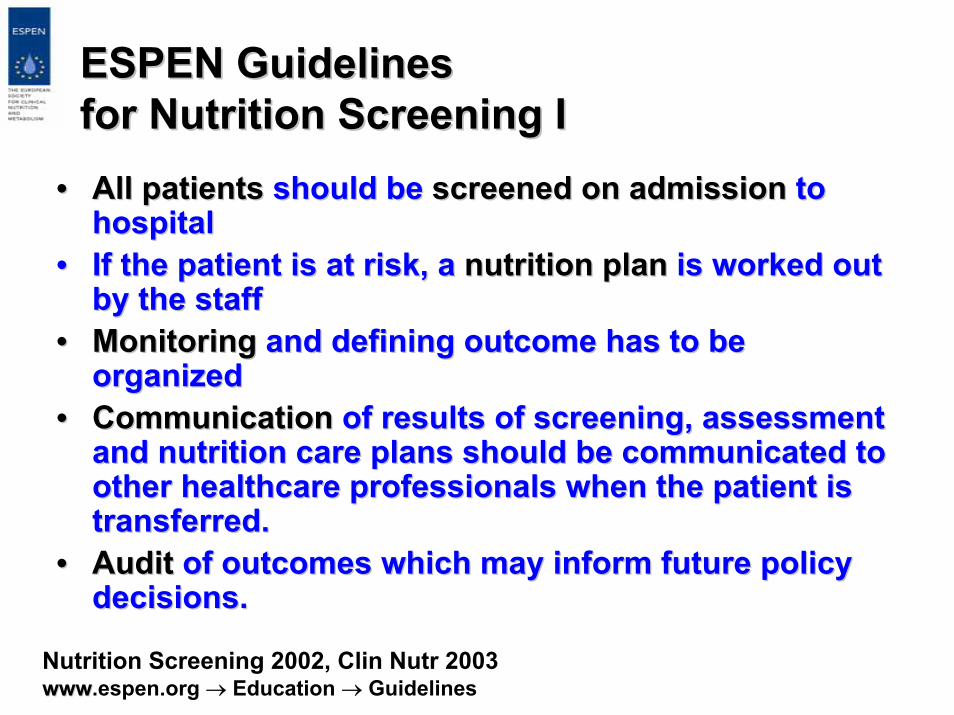
ESPEN Guidelines ESPEN Guidelines forfor NutritionNutrition Screening IScreening I
•• All patientsAll patients shouldshould bebe screenedscreened onon admissionadmission to to hospitalhospital
•• IfIf thethe patient is at patient is at riskrisk, a , a nutritionnutrition planplan is is workedworked out out by by thethe staffstaff
•• MonitoringMonitoring and and definingdefining outcome has tooutcome has to bebeorganizedorganized
•• CommunicationCommunication of of resultsresults of screening, assessment of screening, assessment and and nutritionnutrition carecare plans plans shouldshould bebe communicatedcommunicated to to otherother healthcarehealthcare professionals professionals whenwhen thethe patient is patient is transferredtransferred..
•• AuditAudit of of outcomesoutcomes whichwhich maymay informinform futurefuture policypolicydecisions.decisions.
Nutrition Screening 2002, Clin Nutr 2003wwwwww.espen.org → Education → Guidelines

ESPEN Guidelines for ESPEN Guidelines for NutritionNutrition Screening IIScreening II
1.1. TheThe patient is not at patient is not at riskrisk, but , but maymay needneed to to bebe rere--screenedscreened at at specifiedspecified intervals, e.g. intervals, e.g. weeklyweekly duringduringhospital hospital staystay
2.2. TheThe patient is at patient is at riskrisk and a and a nutritionnutrition plan is plan is workedworkedout by out by thethe staffstaff
3.3. TheThe patient is at patient is at riskrisk, but , but metabolicmetabolic oror functionalfunctionalproblems problems preventprevent a standard plan a standard plan beingbeing carriedcarried outout
4.4. ThereThere is is doubtdoubt as as whetherwhether thethe patient is patient is atat--riskrisk
Screening is a rapid and simple Screening is a rapid and simple processprocess conductedconducted by by admittingadmitting staffstaffTheThe outcomeoutcome of screening must of screening must bebe linkedlinked to to defineddefinedcoursescourses of action:of action:
In In thethe twotwo latter cases, latter cases, referralreferral shouldshould bebe made to an made to an expertexpertfor more for more detaileddetailed assessment.assessment.
Nutrition Screening 2002, Clin Nutr 2003
A A completecomplete nutritionnutrition assessmentassessmentconsistsconsists of a of a combinationcombination of of subjectivesubjective and and objectiveobjective parametersparametersbutbutno no singlesingle parameterparameter has has beenbeen shownshownto to bebe usefuluseful in all in all patientspatients
•• A A nutritionalnutritional assessmentassessment parameterparametershouldshould bebehighlyhighly sensitive and sensitive and specificspecific, , unaffectedunaffected bybyfactorsfactors unrelatedunrelated to to nutritionnutrition, and , and correlatecorrelatewithwith responseresponse to to nutritionalnutritional therapytherapy
•• Most Most nutritionalnutritional parametersparameters lack lack sensitivitysensitivity and and specificityspecificity;;thereforetherefore, , methodsmethods of of identifyingidentifyingmalnourishedmalnourished patientspatients areare notnot entirelyentirelysatisfactorysatisfactory
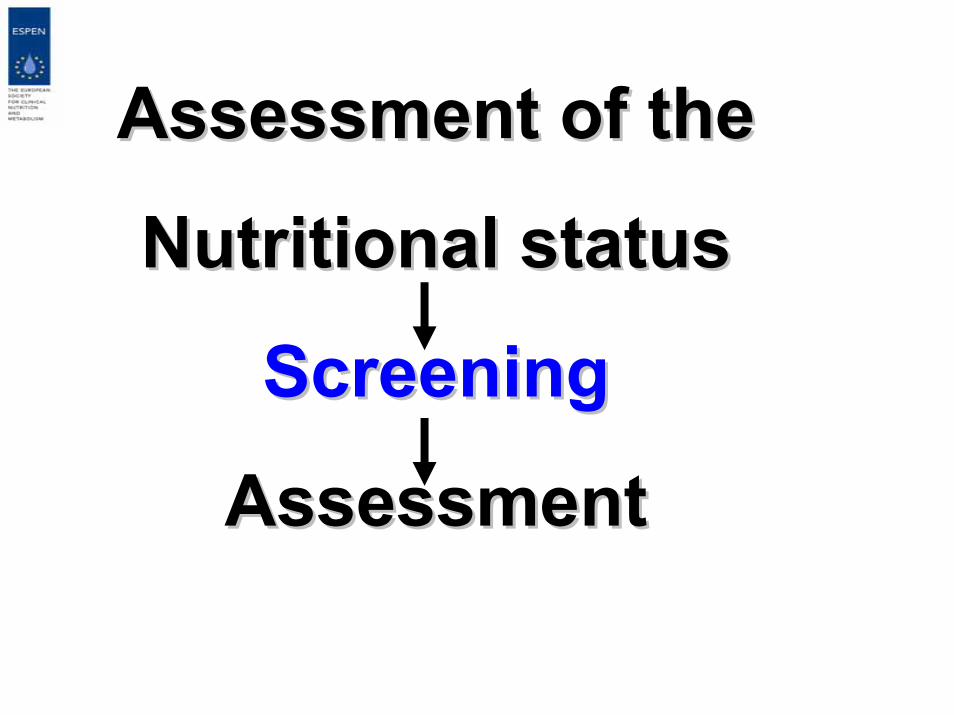
AssessmentAssessment of of thethe
NutritionalNutritional statusstatus
ScreeningScreening
AssessmentAssessment
Screening is Screening is thethe entryentry to to aastructuredstructured processprocess
NutritionalNutritional screeningscreening
Is a tool for rapid and simpleIs a tool for rapid and simpleevaluation of patients at risk ofevaluation of patients at risk ofundernutritionundernutrition
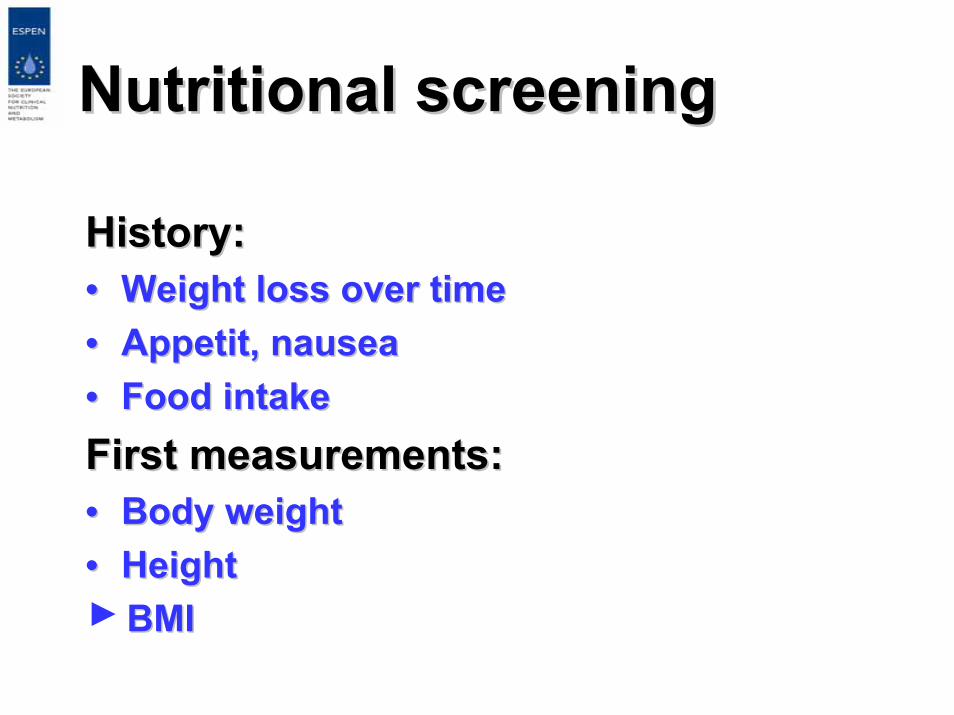
NutritionalNutritional screeningscreening
HistoryHistory::•• WeightWeight lossloss overover timetime•• Appetit, Appetit, nauseanausea•• Food Food intakeintakeFirst First measurementsmeasurements::•• Body Body weightweight•• HeightHeight
BMIBMI
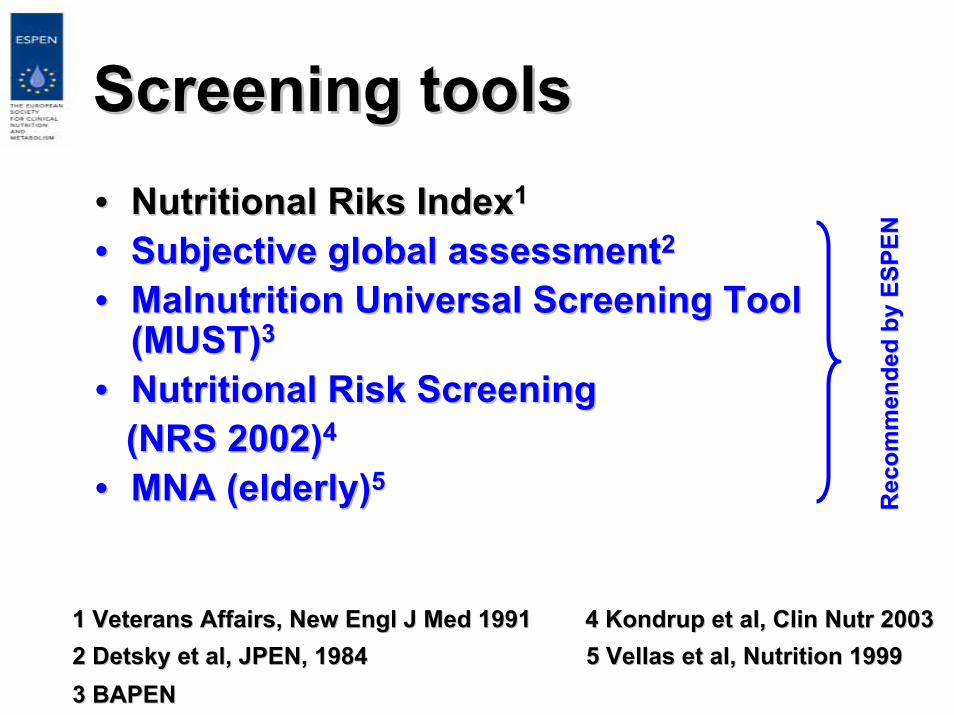
ScreeningScreening toolstools•• NutritionalNutritional RiksRiks IndexIndex11
•• SubjectiveSubjective global assessmentglobal assessment22
•• MalnutritionMalnutrition Universal Universal ScreeningScreening ToolTool(MUST)(MUST)33
•• NutritionalNutritional RiskRisk ScreeningScreening(NRS 2002)(NRS 2002)44
•• MNA (elderly)MNA (elderly)55
1 1 VeteransVeterans AffairsAffairs, New , New EnglEngl J J MedMed 199119912 2 DetskyDetsky et al, JPEN, 1984et al, JPEN, 19843 BAPEN3 BAPEN
4 4 KondrupKondrup et al, et al, ClinClin NutrNutr 200320035 5 VellasVellas et al, Nutrition 1999et al, Nutrition 1999
Rec
omm
ende
d by
ESP
ENR
ecom
men
ded
by E
SPEN
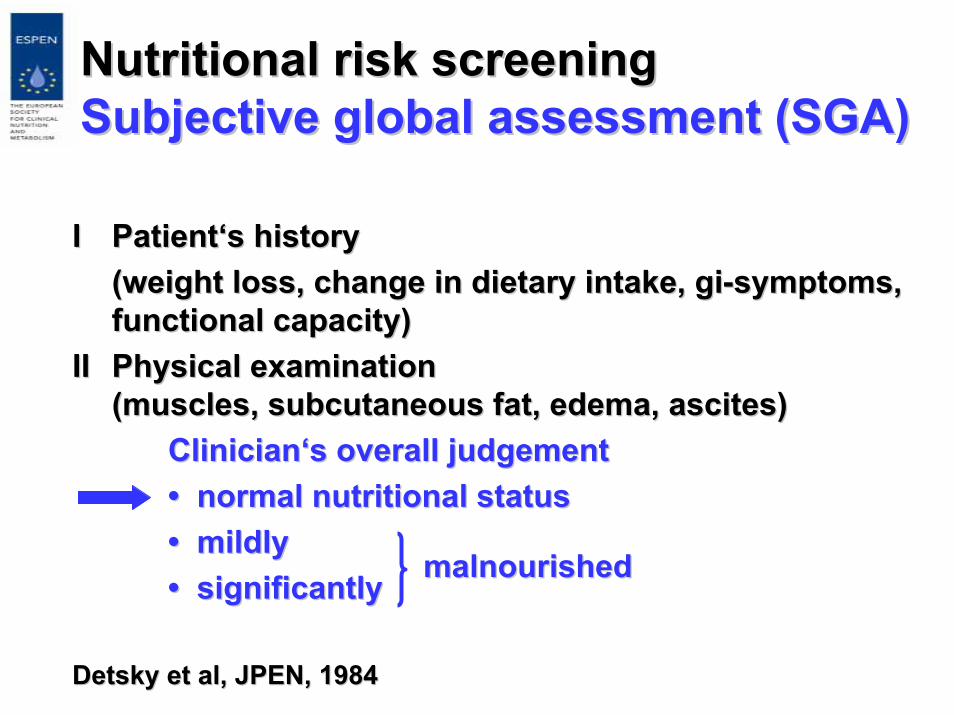
NutritionalNutritional riskrisk screeningscreeningSubjectiveSubjective global global assessmentassessment (SGA)(SGA)
II PatientPatient‘‘ss historyhistory((weightweight lossloss, , changechange in in dietarydietary intakeintake, , gigi--symptomssymptoms,,functionalfunctional capacitycapacity))
IIII PhysicalPhysical examinationexamination((musclesmuscles, , subcutaneoussubcutaneous fatfat, , edemaedema, , ascitesascites))
ClinicianClinician‘‘ss overalloverall judgementjudgement•• normal normal nutritionalnutritional statusstatus•• mildlymildly•• significantlysignificantly
DetskyDetsky et al, JPEN, 1984et al, JPEN, 1984
malnourishedmalnourished
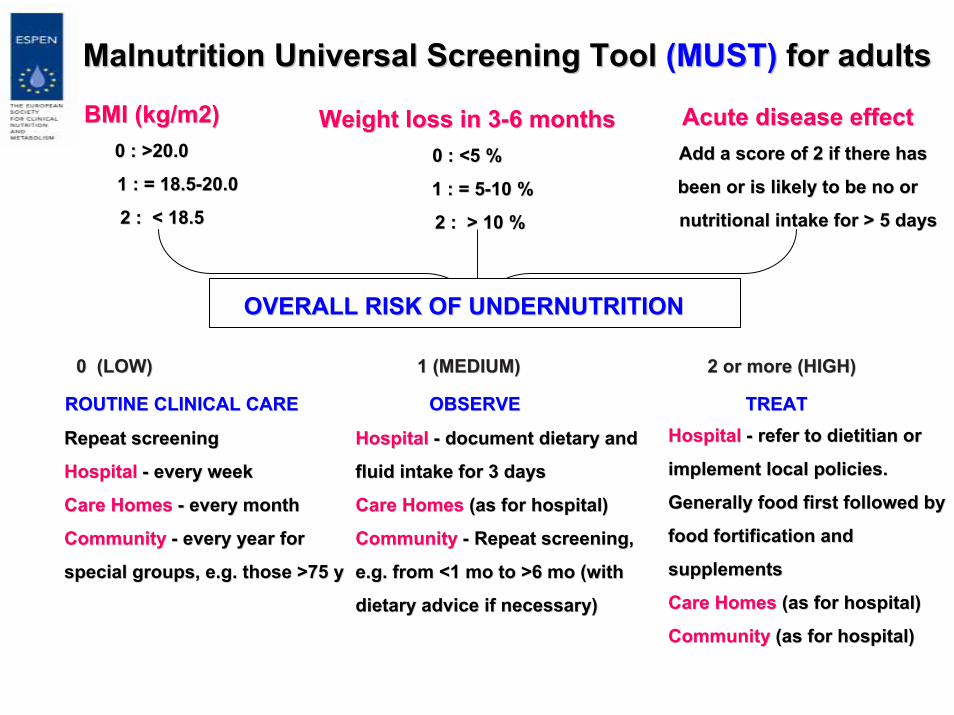
0 (LOW) 0 (LOW) 1 (MEDIUM) 1 (MEDIUM) 2 2 or more or more (HIGH)(HIGH)
ROUTINE CLINICAL CAREROUTINE CLINICAL CARE OBSERVE OBSERVE TREAT TREAT
Acute disease effectAcute disease effectAddAdd aa scorescore of 2of 2 if thereif there hashas
been orbeen or isis likely tolikely to be nobe no oror
nutritional intake fornutritional intake for > 5 > 5 daysdays
HospitalHospital -- refer to dietitian orrefer to dietitian or
implement local policiesimplement local policies..
Generally food first followed byGenerally food first followed by
food fortification and food fortification and
supplementssupplements
Care HomesCare Homes (as(as for hospitalfor hospital))
CommunityCommunity (as(as for hospitalfor hospital))
Malnutrition Universal Screening ToolMalnutrition Universal Screening Tool (MUST)(MUST) for adultsfor adults
BMI (kg/m2)BMI (kg/m2)0 : >20.00 : >20.0
11 : = : = 18.518.5--20.020.0
2 : 2 : << 18.518.5
Weight lossWeight loss in 3in 3--66 monthsmonths0 : 0 : <<5 %5 %
11 : = 5: = 5--10 %10 %
22 :: >> 10 %10 %
HospitalHospital -- document dietary anddocument dietary and
fluid intake forfluid intake for 33 daysdays
Care HomesCare Homes (as(as for hospitalfor hospital))
CommunityCommunity -- Repeat screeningRepeat screening,,
e.g.e.g. fromfrom <1<1 mo tomo to >6>6 momo ((withwith
dietary advice if necessarydietary advice if necessary))
Repeat screeningRepeat screening
HospitalHospital -- every weekevery week
Care HomesCare Homes -- every monthevery month
CommunityCommunity -- every year forevery year for
special groupsspecial groups, e.g., e.g. thosethose >75 y>75 y
OVERALL RISK OF UNDERNUTRITIONOVERALL RISK OF UNDERNUTRITION
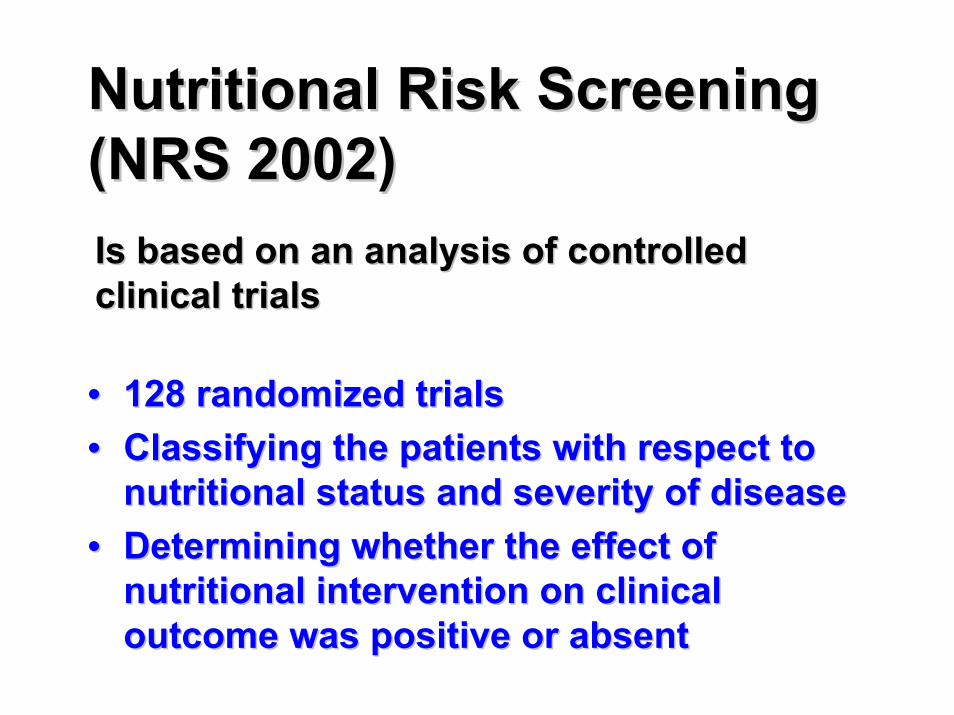
NutritionalNutritional RiskRisk ScreeningScreening(NRS 2002) (NRS 2002)
•• 128 128 randomizedrandomized trialstrials•• ClassifyingClassifying thethe patientspatients withwith respectrespect to to
nutritionalnutritional statusstatus and and severityseverity of of diseasedisease•• DeterminingDetermining whetherwhether thethe effecteffect of of
nutritionalnutritional interventionintervention on on clinicalclinicaloutcomeoutcome was positive was positive oror absentabsent
IsIs basedbased on an on an analysisanalysis of of controlledcontrolledclinicalclinical trialstrials
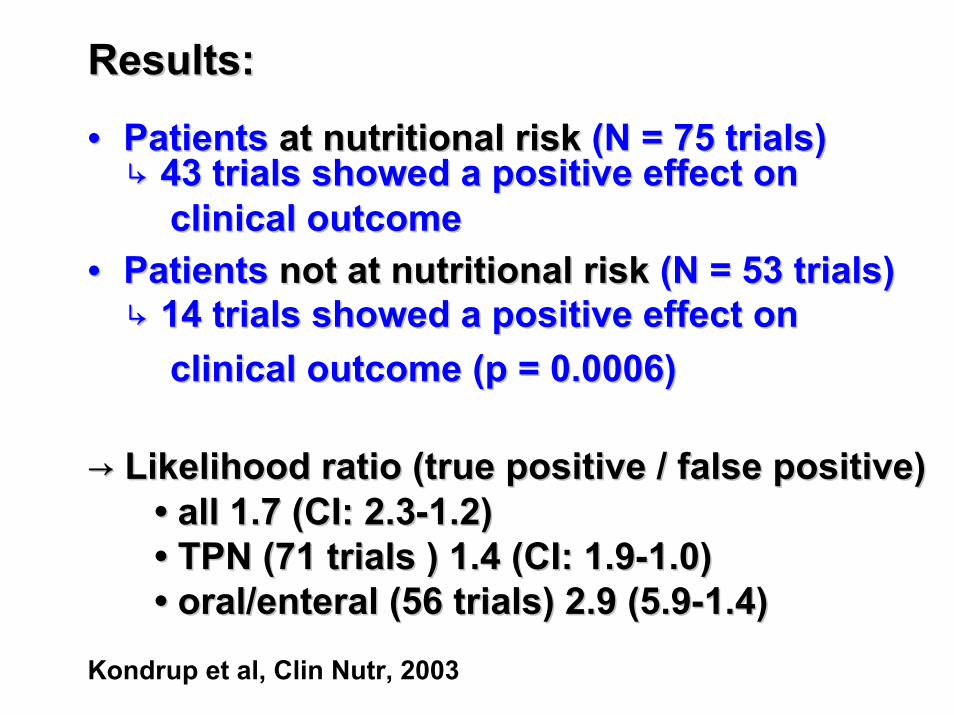
•• PatientsPatients at at nutritionalnutritional riskrisk (N = 75 (N = 75 trialstrials))↳↳ 43 43 trialstrials showedshowed a positive a positive effecteffect onon
clinicalclinical outcomeoutcome•• PatientsPatients notnot at at nutritionalnutritional riskrisk (N = 53 (N = 53 trialstrials))
↳↳ 14 14 trialstrials showedshowed a positive a positive effecteffect ononclinicalclinical outcomeoutcome (p = 0.0006)(p = 0.0006)
→→ LikelihoodLikelihood ratio (ratio (truetrue positive / positive / falsefalse positive)positive)•• all 1.7 (CI: 2.3all 1.7 (CI: 2.3--1.2) 1.2) •• TPN (71 TPN (71 trialstrials ) 1.4 (CI: 1.9) 1.4 (CI: 1.9--1.0)1.0)•• oral/enteral (56 oral/enteral (56 trialstrials) 2.9 (5.9) 2.9 (5.9--1.4)1.4)
Kondrup et al, Clin Nutr, 2003
ResultsResults::
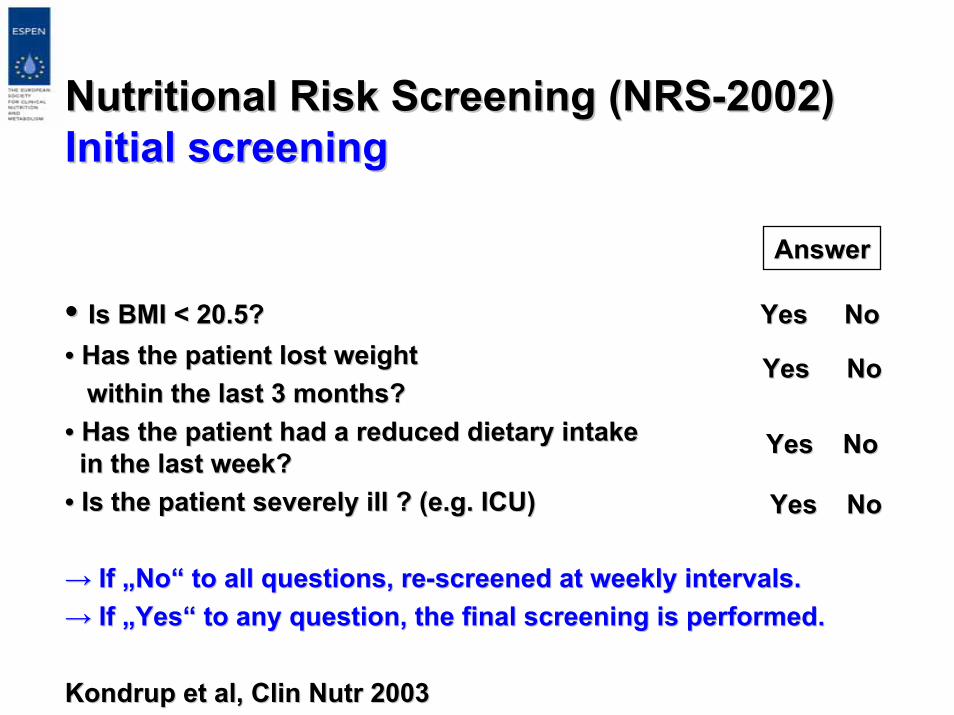
NutritionalNutritional RiskRisk ScreeningScreening (NRS(NRS--2002)2002)Initial Initial screeningscreening
•• IsIs BMI < 20.5? BMI < 20.5? YesYes NoNo•• Has Has thethe patientpatient lost lost weightweight
withinwithin thethe last 3 last 3 monthsmonths??•• Has Has thethe patientpatient hadhad a a reducedreduced dietarydietary intakeintakein in thethe last last weekweek??
•• IsIs thethe patientpatient severelyseverely illill ? (? (e.ge.g. ICU). ICU)
→→ IfIf „„NoNo““ to all to all questionsquestions, , rere--screenedscreened at at weeklyweekly intervalsintervals..→→ IfIf „„YesYes““ to to anyany questionquestion, , thethe final final screeningscreening isis performedperformed..
KondrupKondrup et al, et al, ClinClin NutrNutr 20032003
AnswerAnswer
YesYes NoNo
YesYes NoNo
YesYes NoNo
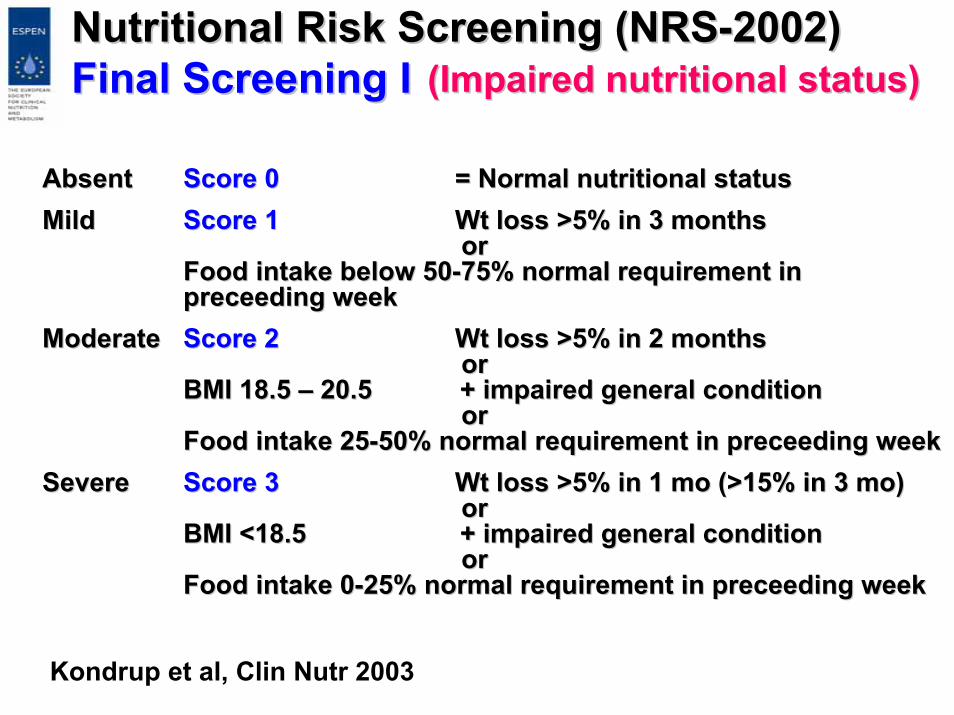
NutritionalNutritional RiskRisk ScreeningScreening (NRS(NRS--2002)2002)Final Final ScreeningScreening II
AbsentAbsent Score 0Score 0 = Normal = Normal nutritionalnutritional statusstatusMildMild Score 1Score 1 WtWt lossloss >5% in 3 >5% in 3 monthsmonths
ororFood Food intakeintake belowbelow 5050--75% normal 75% normal requirementrequirement ininpreceedingpreceeding weekweek
ModerateModerate Score 2 Score 2 WtWt lossloss >5% in 2 >5% in 2 monthsmonthsoror
BMI 18.5 BMI 18.5 –– 20.5 + 20.5 + impairedimpaired generalgeneral conditionconditionoror
Food Food intakeintake 2525--50% normal 50% normal requirementrequirement in in preceedingpreceeding weekweekSevereSevere Score 3 Score 3 WtWt lossloss >5% in 1 >5% in 1 momo (>15% in 3 (>15% in 3 momo))
ororBMI <18.5 + BMI <18.5 + impairedimpaired generalgeneral conditioncondition
ororFood Food intakeintake 00--25% normal 25% normal requirementrequirement in in preceedingpreceeding weekweek
((ImpairedImpaired nutritionalnutritional statusstatus))
Kondrup et al, Clin Nutr 2003
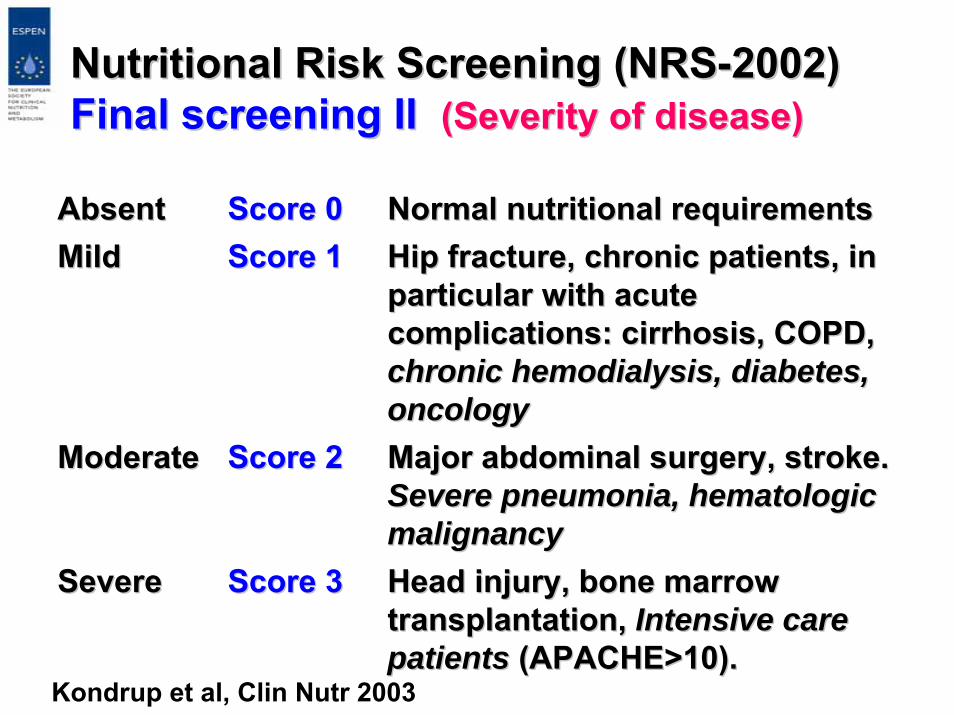
NutritionalNutritional RiskRisk ScreeningScreening (NRS(NRS--2002)2002)Final Final screeningscreening IIII ((SeveritySeverity of of diseasedisease))
AbsentAbsent Score 0Score 0 Normal Normal nutritionalnutritional requirementsrequirementsMildMild Score 1Score 1 Hip Hip fracturefracture, , chronicchronic patientspatients, in , in
particularparticular withwith acuteacutecomplicationscomplications: : cirrhosiscirrhosis, COPD, , COPD, chronicchronic hemodialysishemodialysis, , diabetesdiabetes, , oncologyoncology
ModerateModerate Score 2Score 2 Major Major abdominalabdominal surgerysurgery, , strokestroke..SevereSevere pneumoniapneumonia, , hematologichematologicmalignancymalignancy
SevereSevere Score 3Score 3 HeadHead injuryinjury, , bonebone marrowmarrowtransplantationtransplantation, , Intensive Intensive carecarepatientspatients (APACHE>10).(APACHE>10).
Kondrup et al, Clin Nutr 2003
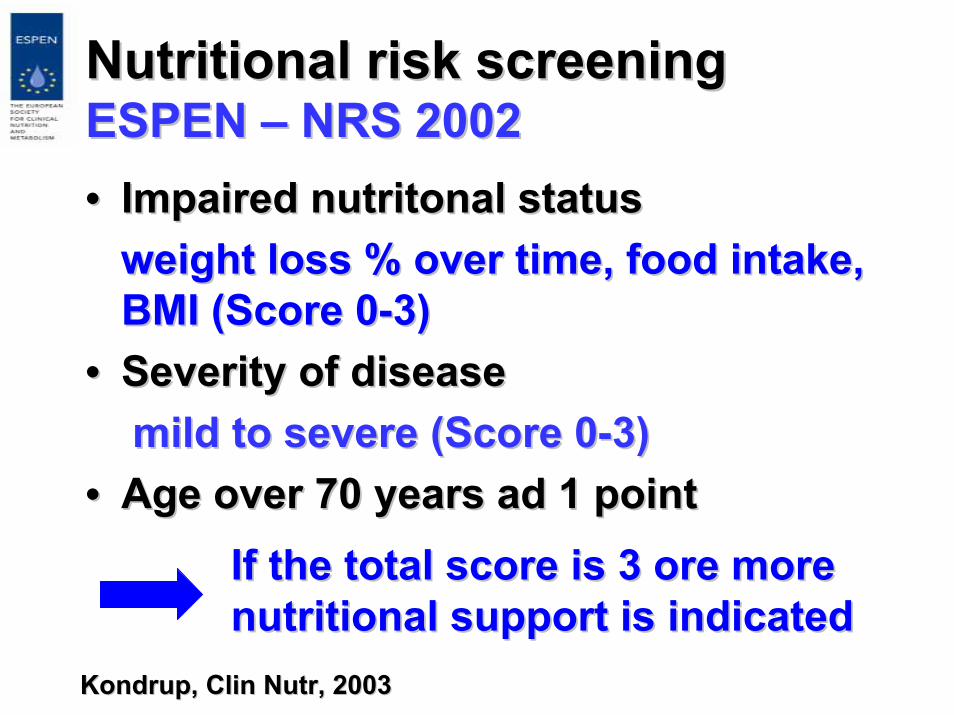
NutritionalNutritional riskrisk screeningscreeningESPEN ESPEN –– NRS 2002NRS 2002•• ImpairedImpaired nutritonalnutritonal statusstatus
weightweight lossloss % % overover time, time, foodfood intakeintake, , BMI (Score 0BMI (Score 0--3)3)
•• SeveritySeverity of of diseasediseasemild to mild to severesevere (Score 0(Score 0--3)3)
•• Age Age overover 70 70 yearsyears ad 1 pointad 1 point
KondrupKondrup, , ClinClin NutrNutr, 2003, 2003
IfIf thethe total total scorescore isis 3 3 oreore moremorenutritionalnutritional supportsupport isis indicatedindicated
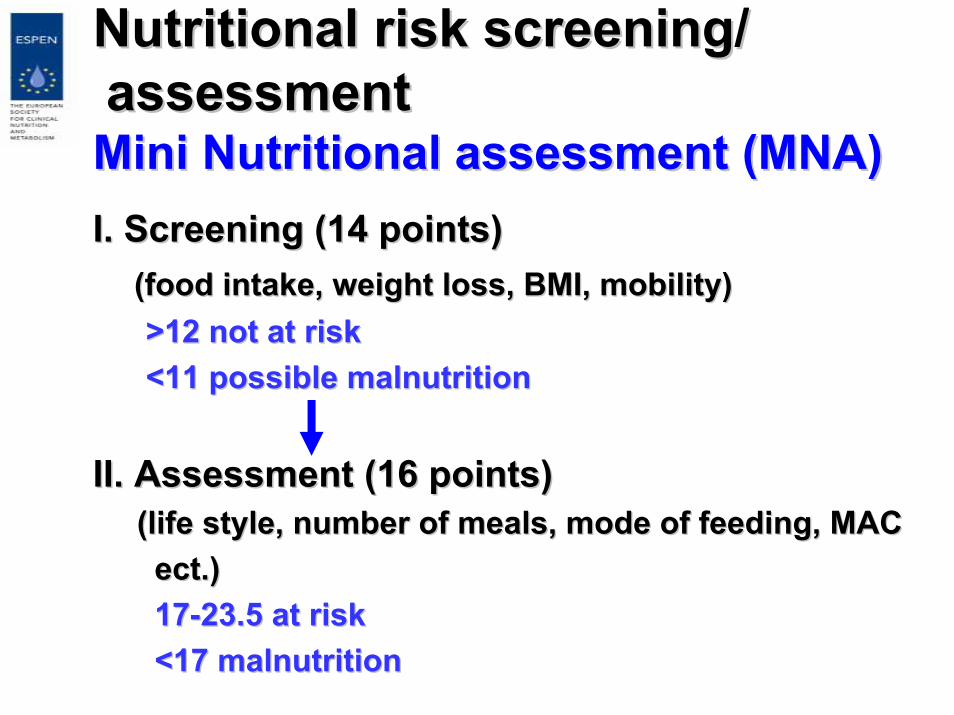
NutritionalNutritional riskrisk screeningscreening//assessmentassessment
Mini Mini NutritionalNutritional assessmentassessment (MNA)(MNA)I. I. ScreeningScreening (14 (14 pointspoints))
((foodfood intakeintake, , weightweight lossloss, BMI, , BMI, mobilitymobility))>12 >12 notnot at at riskrisk<11 <11 possiblepossible malnutritionmalnutrition
II. II. AssessmentAssessment (16 (16 pointspoints))(life style, (life style, numbernumber of of mealsmeals, mode of , mode of feedingfeeding, MAC, MACectect.) .) 1717--23.5 at 23.5 at riskrisk<17 <17 malnutritionmalnutrition
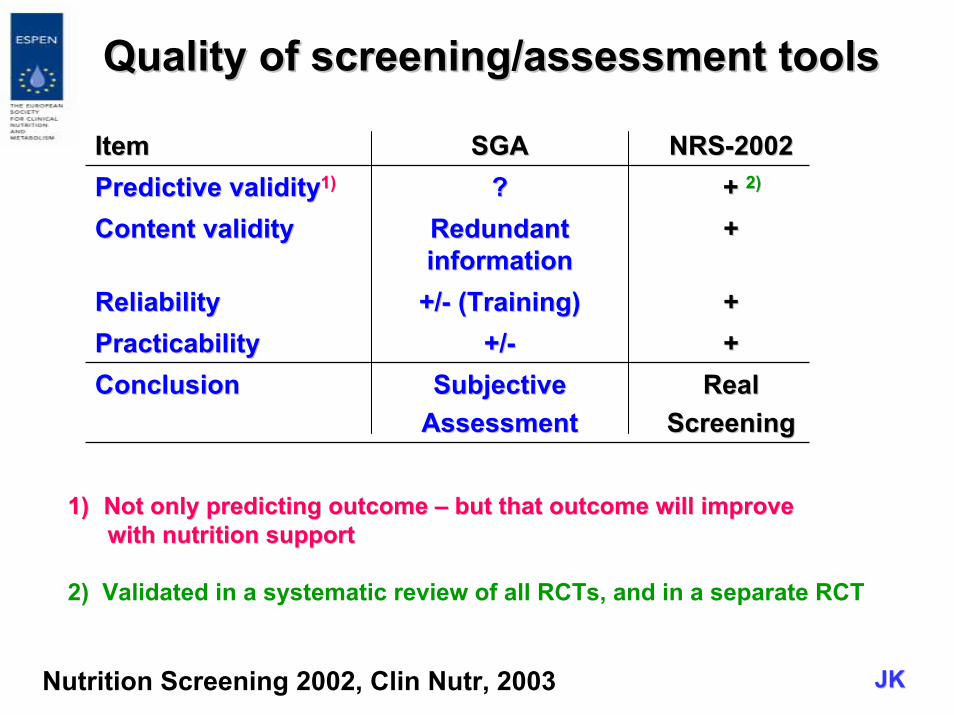
QualityQuality of screening/of screening/assessmentassessment toolstools
ItemItem SGASGA NRSNRS--20022002Predictive validityPredictive validity11)) ?? ++ 2)2)
ContentContent validity validity Redundant Redundant informationinformation
++
ReliabilityReliability +/+/-- ((TrainingTraining)) ++PracticabilityPracticability +/+/-- ++ConclusionConclusion SubjectiveSubjective
AssessmentAssessmentRealReal
ScreeningScreening
Nutrition Screening 2002, Clin Nutr, 2003
1)1) Not Not onlyonly predictingpredicting outcomeoutcome –– butbut thatthat outcomeoutcome willwill improveimprovewithwith nutritionnutrition supportsupport
2) Validated in a systematic review of all RCTs, and in a separate RCT
JKJK
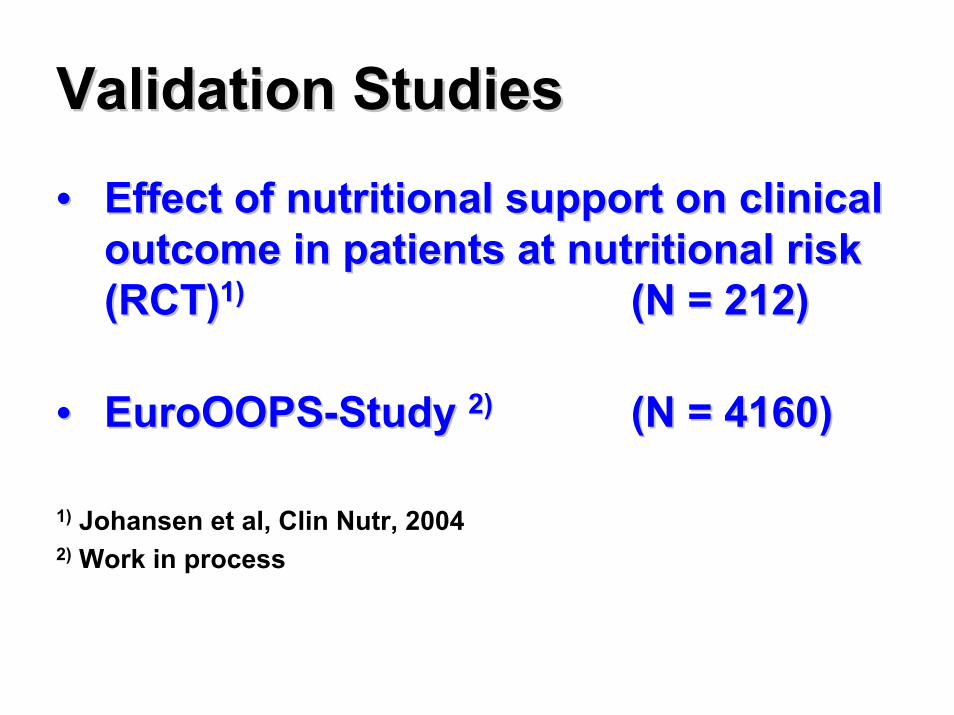
Validation Validation StudiesStudies
•• EffectEffect of of nutritionalnutritional supportsupport on on clinicalclinicaloutcomeoutcome in in patientspatients at at nutritionalnutritional riskrisk(RCT)(RCT)1)1) (N = 212)(N = 212)
•• EuroOOPSEuroOOPS--StudyStudy 2)2) (N = 4160)(N = 4160)
1) Johansen et al, Clin Nutr, 20042) Work in process

First First studystudy to to validatevalidate a a nutritionalnutritional screeningscreening system system in a RCTin a RCTN = 212N = 212•• PatientsPatients at at riskrisk (NRS 2002 (NRS 2002 ≥≥ 3) 3) improveimprove
clinicallyclinically fromfrom nutritionalnutritional interventionintervention-- severityseverity of of complicationcomplication ↓↓-- LOSLOSNDINDI ↓↓ LOS 28 LOS 28 ↓↓
•• Protein and Protein and energyenergy intakeintake of of nutritionallynutritionallyatat--riskrisk patientspatients increaseincrease
(NDI= Nutritional discharge index)(NDI= Nutritional discharge index)
Johansen et al, Clin Nutr, 2004

EuroOOPSEuroOOPS
AllAll Western Western EuropeEuropeNN
1715171514361436107107
Gsatroenterol.Gsatroenterol. 289289 3434ICUICU 279279 9595OncologyOncology 334334 2828
41604160
% % at riskat risk NN1919 11041104
399399107107
16101610
33335353
3232
% % at riskat riskSurgerySurgery 1818Internal Med.Internal Med. 1717GeriatricsGeriatrics 5353
TotalTotal 2020
JKJKJ. Kondrup, personal communication
% at risk according to NRS% at risk according to NRS--20022002
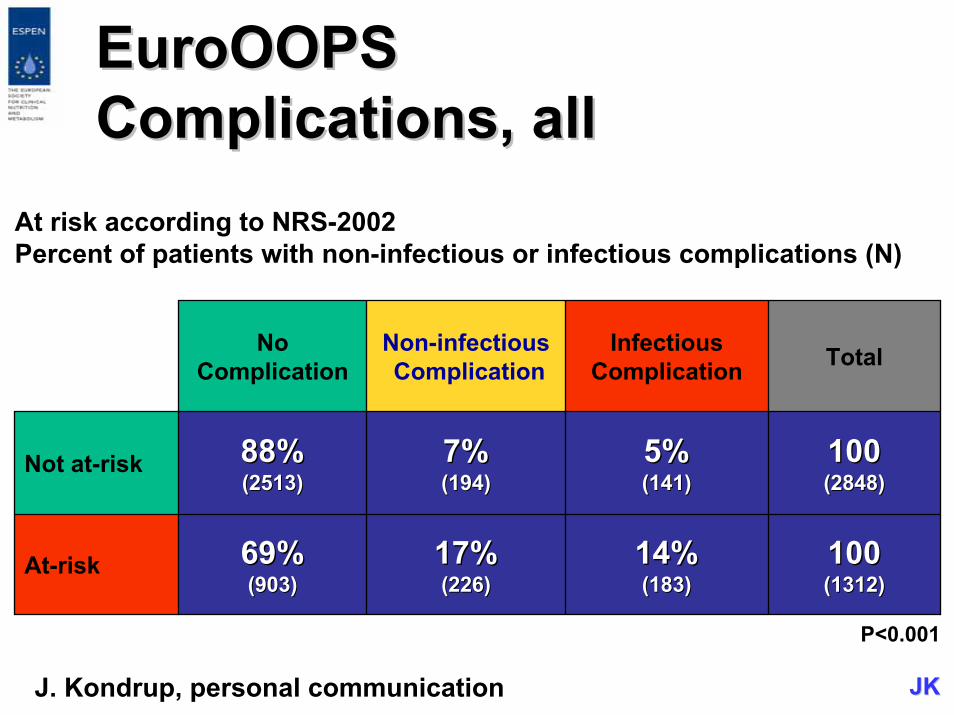
EuroOOPSEuroOOPSComplications, allComplications, all
At risk according to NRS-2002Percent of patients with non-infectious or infectious complications (N)
NoComplication
Non-infectiousComplication
InfectiousComplication Total
Not at-risk 88%88%(2513)(2513)
7%7%(194)(194)
5%5%(141)(141)
100100(2848)(2848)
At-risk 69%69%(903)(903)
17%17%(226)(226)
14%14%(183)(183)
100100(1312)(1312)
P<0.001
J. Kondrup, personal communication JKJK
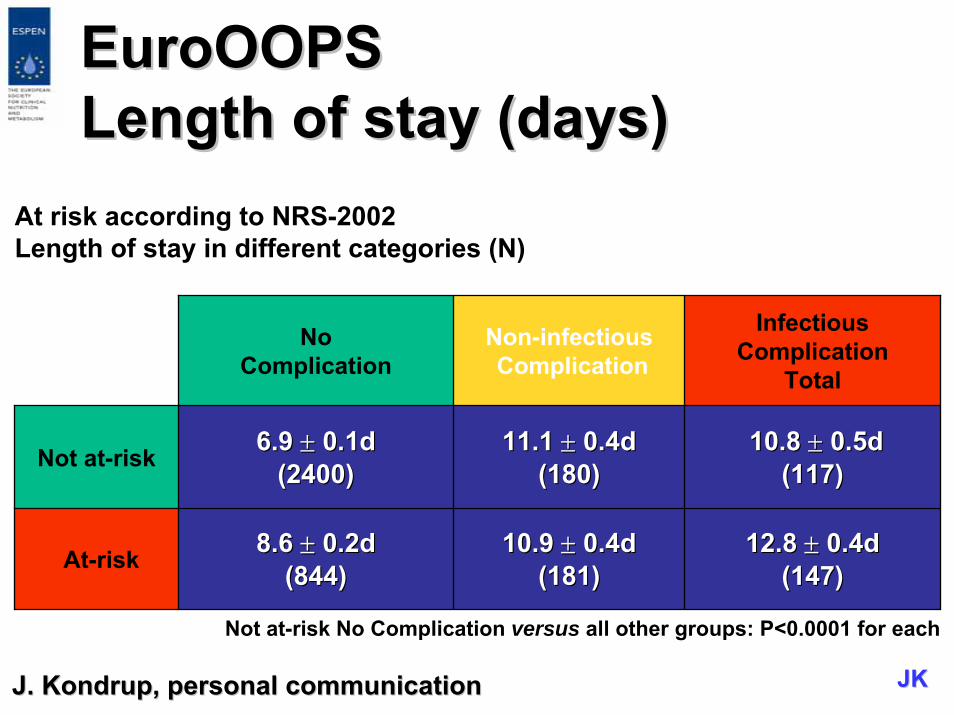
EuroOOPSEuroOOPSLength of stay (days)Length of stay (days)
At risk according to NRS-2002Length of stay in different categories (N)
NoComplication
Non-infectiousComplication
InfectiousComplication
Total
Not at-risk 6.9 6.9 ±± 0.1d0.1d(2400)(2400)
11.1 11.1 ±± 0.4d0.4d(180(180))
10.8 10.8 ±± 0.5d0.5d(117)(117)
At-risk 8.6 8.6 ±± 0.2d0.2d(844)(844)
10.9 10.9 ±± 0.4d0.4d(181)(181)
12.8 12.8 ±± 0.4d0.4d(147)(147)
Not at-risk No Complication versus all other groups: P<0.0001 for each
J. J. KondrupKondrup, personal , personal communicationcommunication JKJK
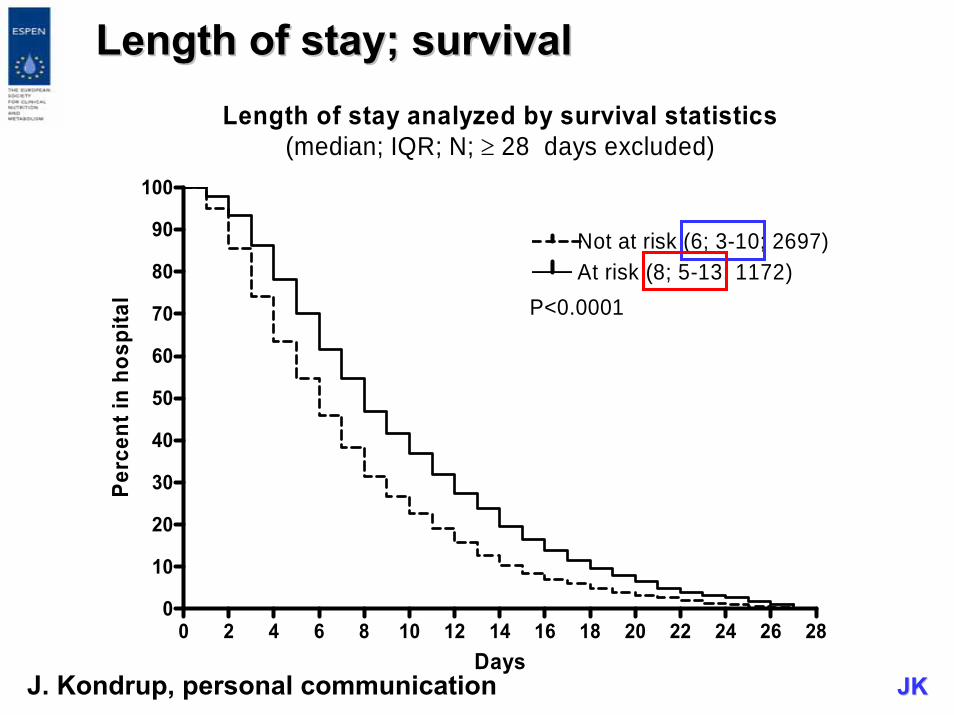
Length of stay; survivalLength of stay; survivalLength of stay analyzed by survival statistics
(median; IQR; N; ≥ 28 days excluded)
0 2 4 6 8 10 12 14 16 18 20 22 24 26 280
10
20
30
40
50
60
70
80
90
100
Not at risk (6; 3-10; 2697)At risk (8; 5-13; 1172)
P<0.0001
Days
Perc
ent i
n ho
spita
l
JKJKJ. Kondrup, personal communication
NRS 2002 NRS 2002 isis ableable to to distinguishdistinguishbetweenbetween trialstrials withwith positive positive effectseffectsvsvs no no effecteffect
↓↓IdentifyIdentify patientspatients whowho areare likelylikely to to benefitbenefit fromfrom nutritionalnutritional supportsupport

NRSNRS--2002 2002 isis thethe best best instrumentinstrument todaytoday becausebecause
thethe nutritionalnutritional riskrisk screeningscreening (NRS(NRS--2002) 2002) isis•• A A methodmethod basedbased on an on an analysisanalysis of of controlledcontrolled
clinicalclinical trialstrials•• RobustRobust (Consensus ESPEN)(Consensus ESPEN)•• ValidatedValidated in in interventionintervention studiesstudies•• Simple to Simple to useuse (3 (3 questionsquestions per per itemitem))•• QuicklyQuickly donedone
NutritionalNutritional AssessmentAssessment
IsIs a a moremore detaileddetailed processprocess andandhas to has to bebe donedone in in thosethosepatientspatients screenedscreened at at riskrisk ororwhenwhen metabolicmetabolic oror functionalfunctionalproblemsproblems preventprevent a a standardstandardplan plan beingbeing carriedcarried outout
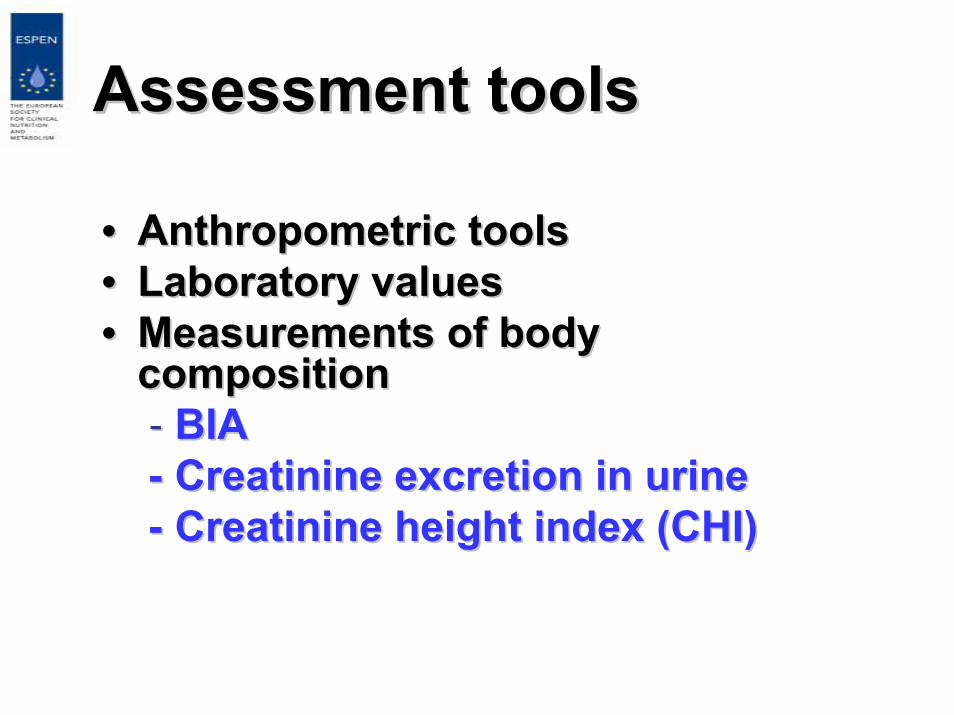
AssessmentAssessment toolstools
•• AnthropometricAnthropometric toolstools•• Laboratory Laboratory valuesvalues•• MeasurementsMeasurements of of bodybody
compositioncomposition-- BIABIA-- CreatinineCreatinine excretionexcretion in in urineurine-- CreatinineCreatinine heightheight indexindex (CHI)(CHI)
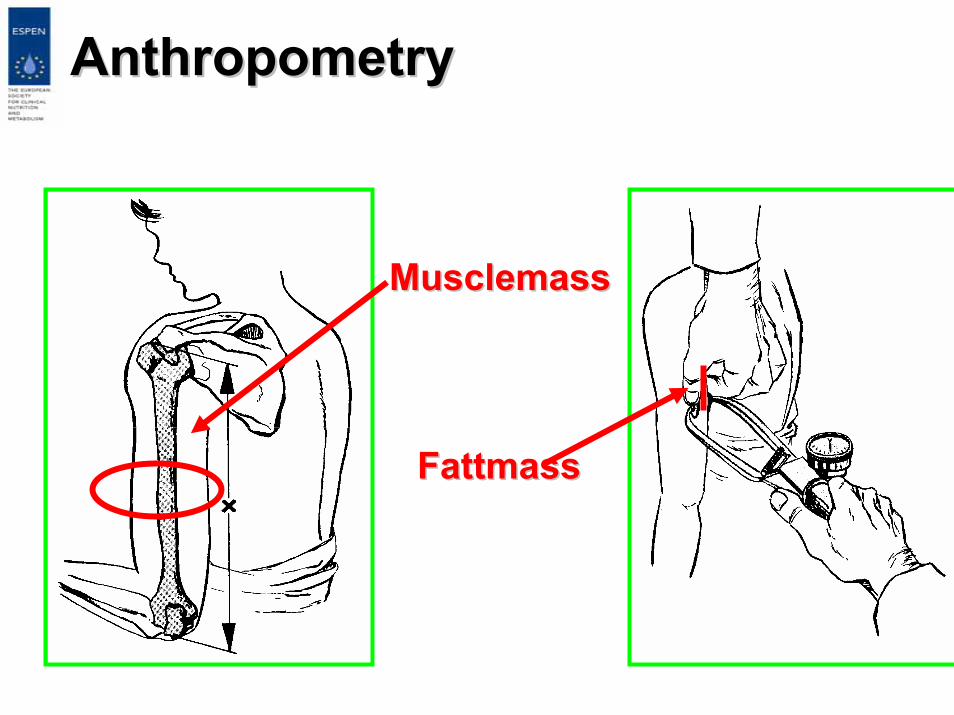
AAnthropometrynthropometry
MusclemassMusclemass
FattmassFattmass
Laboratory Laboratory testingtesting cancan bebe usefulusefulforfor
•• assessmentassessment of of thethe nutritionalnutritionalstatusstatus in in certaincertain conditionsconditionsandand
•• monitoringmonitoring nutritionalnutritionalinterventionsinterventions
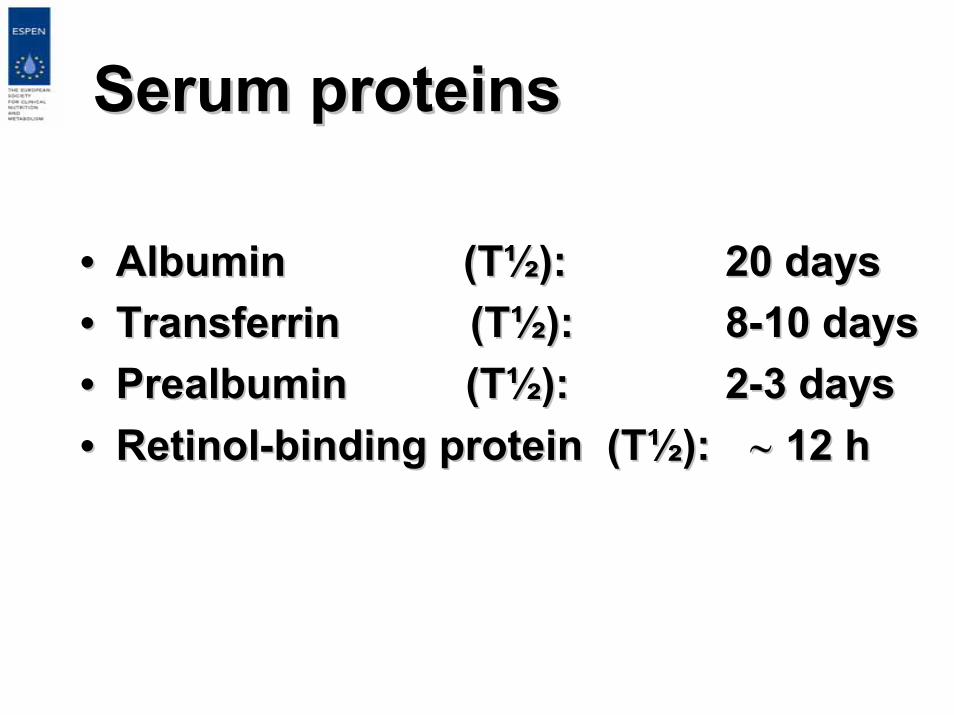
Serum Serum proteinsproteins
•• Albumin (TAlbumin (T½½)):: 20 20 daysdays•• TransferrinTransferrin (T(T½½)):: 88--10 10 daysdays•• PrealbuminPrealbumin (T(T½½)): : 22--3 3 daysdays•• RetinolRetinol--bindingbinding proteinprotein (T(T½½)): : ∼∼ 12 h12 h
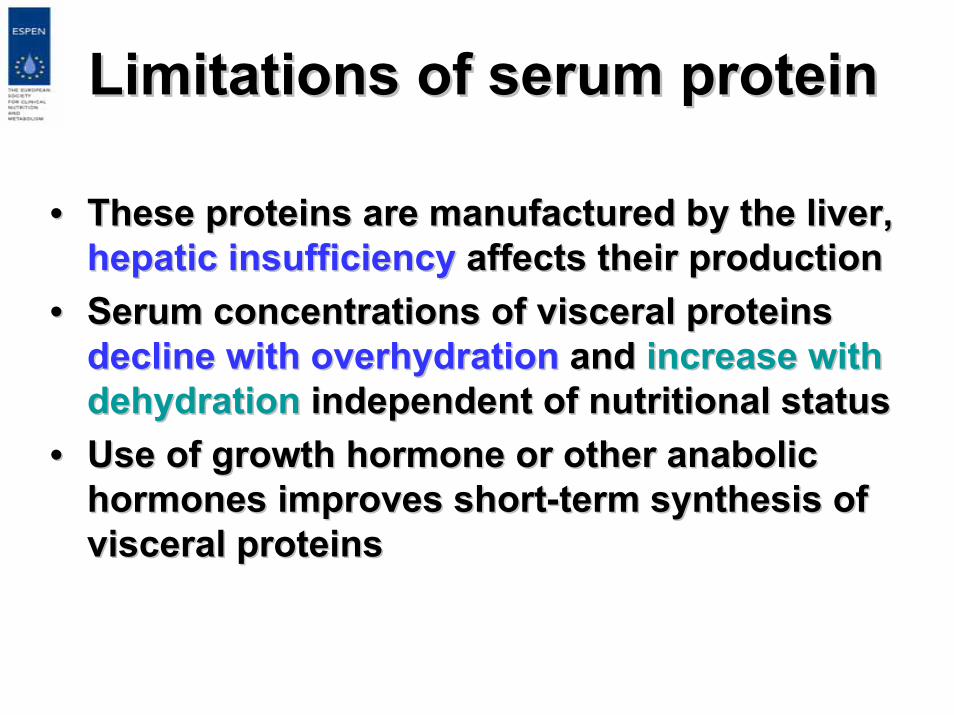
LimitationsLimitations of of serumserum proteinprotein
•• These These proteinsproteins areare manufacturedmanufactured byby thethe liverliver, , hepatichepatic insufficiencyinsufficiency affectsaffects theirtheir productionproduction
•• Serum Serum concentrationsconcentrations of of visceralvisceral proteinsproteinsdeclinedecline withwith overhydrationoverhydration and and increaseincrease withwithdehydrationdehydration independent of independent of nutritionalnutritional statusstatus
•• UseUse of growth of growth hormonehormone oror otherother anabolicanabolichormoneshormones improvesimproves shortshort--termterm synthesissynthesis of of visceralvisceral proteinsproteins
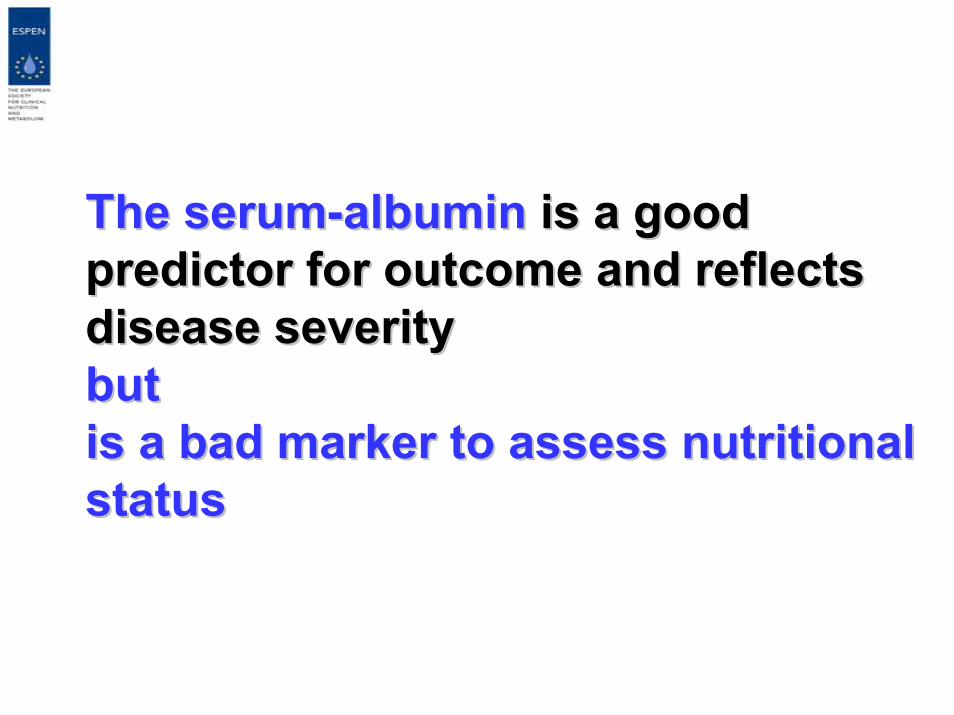
TheThe serumserum--albuminalbumin isis a good a good predictorpredictor forfor outcomeoutcome and and reflectsreflectsdiseasedisease severityseveritybutbutisis a bad a bad markermarker to to assessassess nutritionalnutritionalstatusstatus
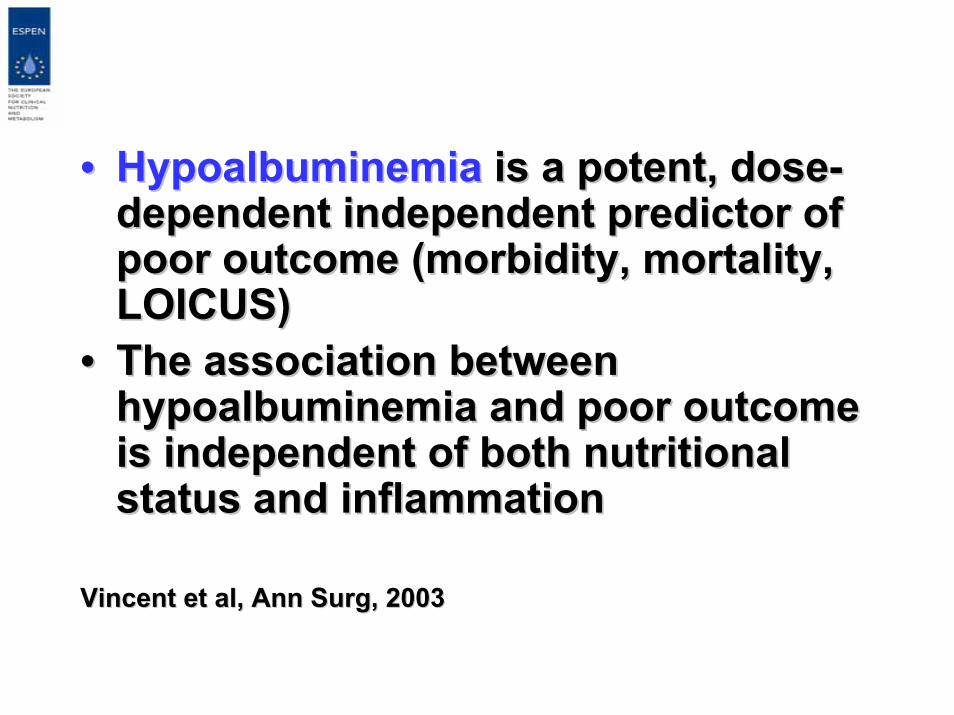
•• HypoalbuminemiaHypoalbuminemia isis a potent, a potent, dosedose--dependentdependent independent independent predictorpredictor of of poorpoor outcomeoutcome ((morbiditymorbidity, , mortalitymortality, , LOICUS)LOICUS)
•• TheThe associationassociation betweenbetweenhypoalbuminemiahypoalbuminemia and and poorpoor outcomeoutcomeisis independent of independent of bothboth nutritionalnutritionalstatusstatus and and inflammationinflammation
Vincent et al, Ann Vincent et al, Ann SurgSurg, 2003, 2003
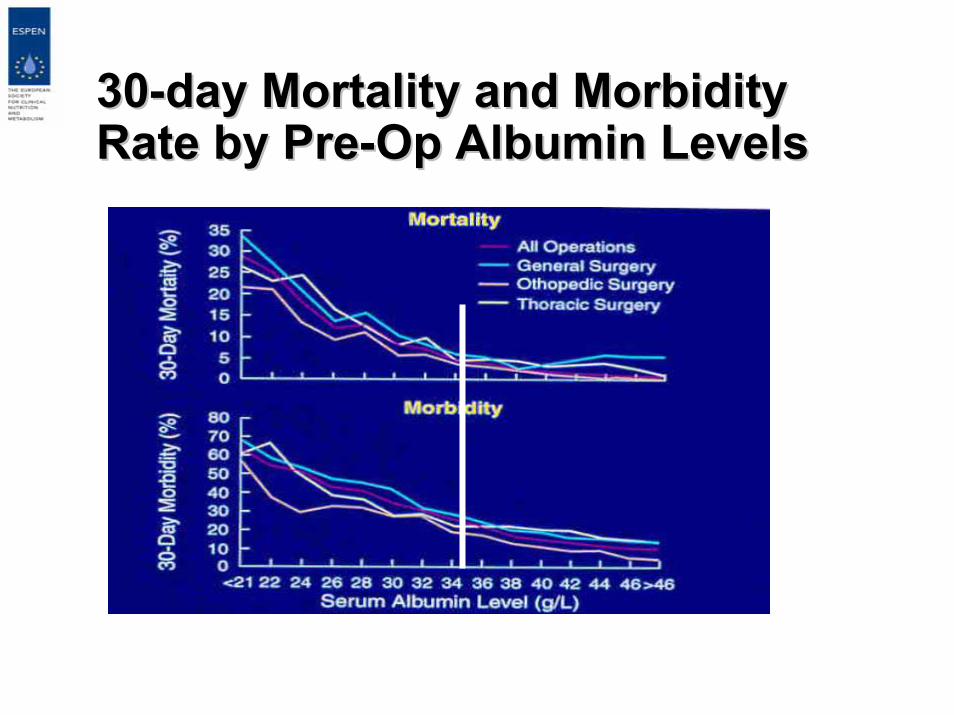
3030--day Mortality and Morbidity day Mortality and Morbidity Rate by PreRate by Pre--Op Albumin LevelsOp Albumin Levels
Gibbs et al. Ann Surg 1999; 134:36-42.
In In mostmost hospitalizedhospitalized patientspatientsDHR and TLC DHR and TLC areare notnot usefulusefulcomponentscomponents of a of a nutritionnutritionassessassess profileprofile
AssessmentAssessment somaticsomaticproteinprotein compartmentcompartment
•• AnthropometricAnthropometric assessmentassessment•• BIABIA•• Creatinine excretion in Creatinine excretion in urineurine•• Creatinine Creatinine heightheight indexindex (CHI)(CHI)
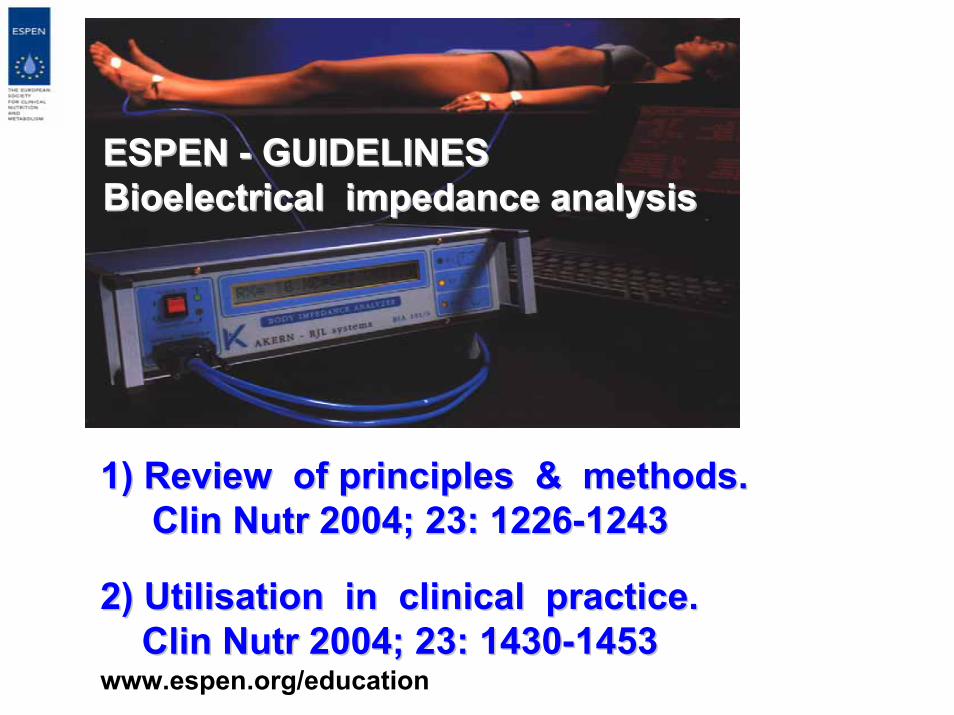
1) Review of principles & methods.1) Review of principles & methods.ClinClin NutrNutr 2004; 23: 12262004; 23: 1226--12431243
2) 2) UtilisationUtilisation in clinical practice.in clinical practice.ClinClin NutrNutr 2004; 23: 14302004; 23: 1430--14531453
www.espen.org/education
ESPEN ESPEN -- GUIDELINESGUIDELINESBioelectrical impedance analysisBioelectrical impedance analysis
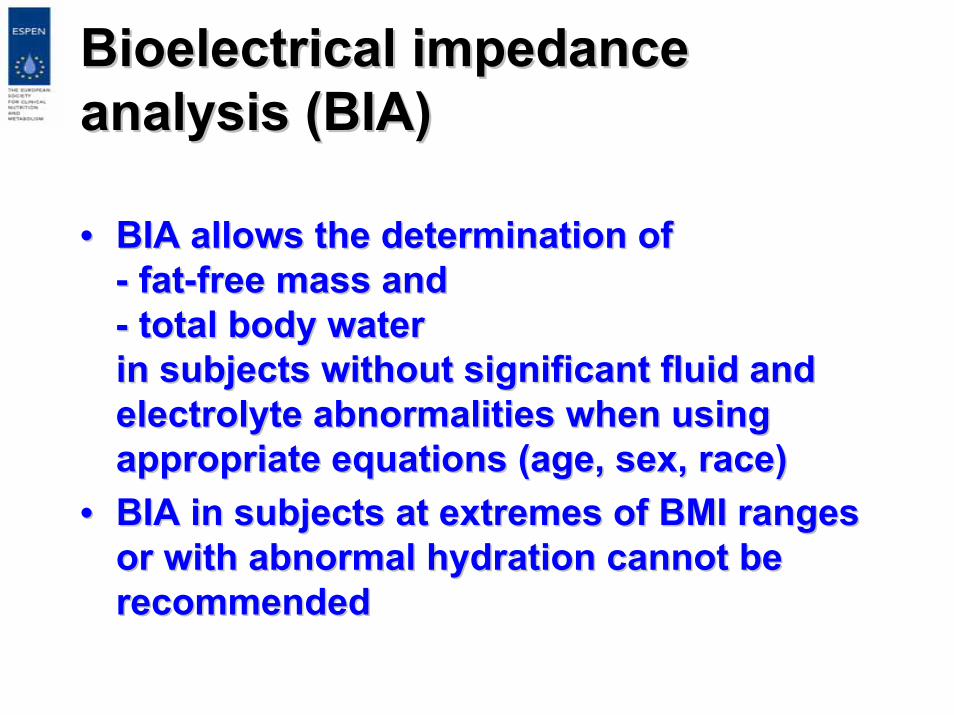
BioelectricalBioelectrical impedanceimpedanceanalysisanalysis (BIA)(BIA)
•• BIA BIA allowsallows thethe determinationdetermination of of -- fatfat--freefree mass andmass and-- total total bodybody waterwaterin in subjectssubjects withoutwithout significantsignificant fluidfluid and and electrolyteelectrolyte abnormalitiesabnormalities whenwhen usingusingappropriateappropriate equationsequations (age, sex, (age, sex, racerace))
•• BIA in BIA in subjectssubjects at extremes of BMI at extremes of BMI rangesrangesoror withwith abnormal abnormal hydrationhydration cannotcannot beberecommendedrecommended
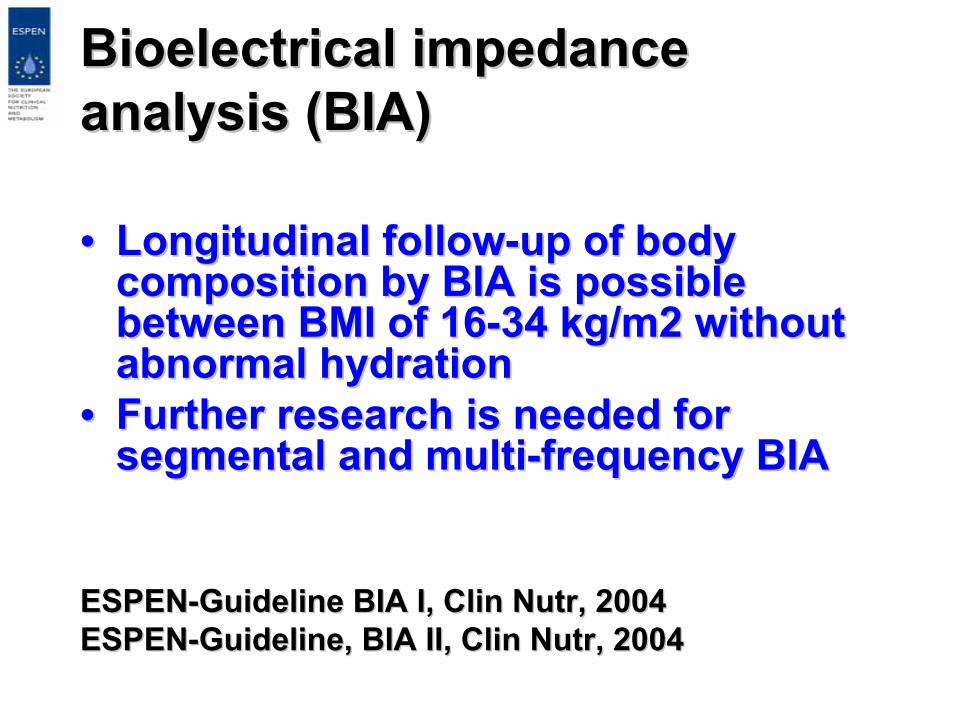
BioelectricalBioelectrical impedanceimpedanceanalysisanalysis (BIA)(BIA)
•• Longitudinal Longitudinal followfollow--upup of of bodybodycompositioncomposition byby BIA BIA isis possiblepossiblebetweenbetween BMI of 16BMI of 16--34 kg/m2 34 kg/m2 withoutwithoutabnormal abnormal hydrationhydration
•• FurtherFurther researchresearch isis neededneeded forforsegmental and segmental and multimulti--frequencyfrequency BIABIA
ESPENESPEN--GuidelineGuideline BIA I, BIA I, ClinClin NutrNutr, 2004, 2004ESPENESPEN--GuidelineGuideline, BIA II, , BIA II, ClinClin NutrNutr, 2004, 2004

ConclusionsConclusions
•• For screening and assessmentFor screening and assessment aa large arsenal large arsenal ofoftoolstools can be usedcan be used in in specificspecific steps steps inin aa structuredstructuredprocessprocess whenwhen thethe simple case simple case getsgets complicatedcomplicated
•• TheThe futurefuture willwill not not onlyonly askask, , ifif thethe patient is patient is malnourishedmalnourished oror nutritionallynutritionally atat--riskrisk for for adverseadverseoutcomeoutcome, but , but alsoalso: : atat riskrisk for for whatwhat??
•• TreatmentTreatment shouldshould bebe targetedtargeted to to treattreat thethe specificspecificriskrisk problem problem ofof thethe patientpatientscreeningscreening, , planning a nutritional therapy andplanning a nutritional therapy andmonitoringmonitoring the outcome has to be consideredthe outcome has to be considered
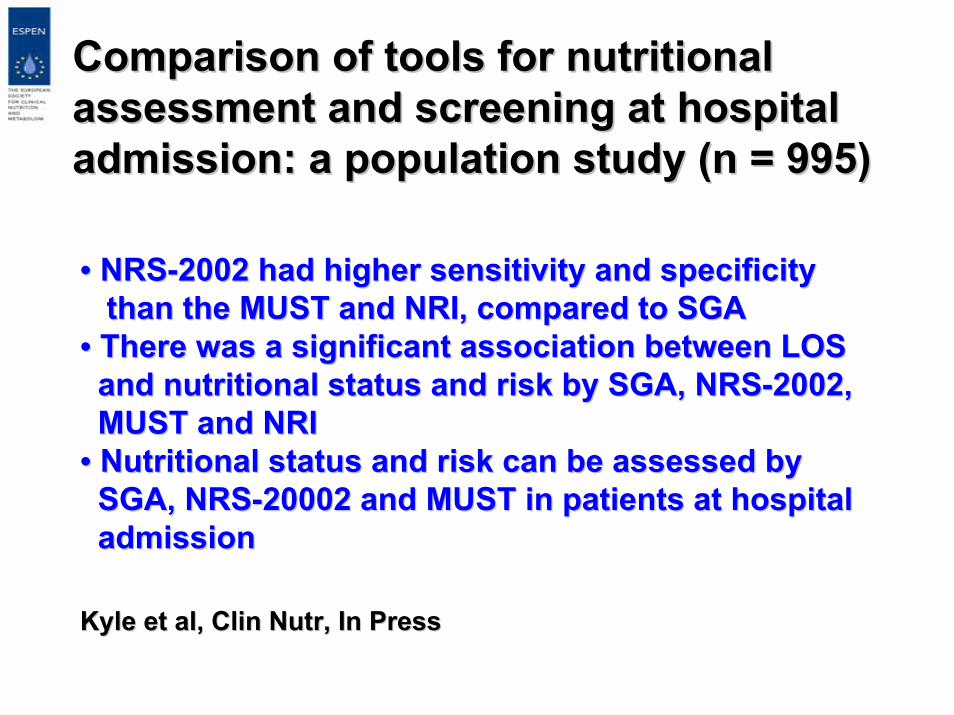
ComparisonComparison of of toolstools forfor nutritionalnutritionalassessmentassessment and and screeningscreening at at hospitalhospitaladmissionadmission: a : a populationpopulation studystudy (n = 995)(n = 995)
•• NRSNRS--2002 2002 hadhad higherhigher sensitivitysensitivity and and specificityspecificitythanthan thethe MUST and NRI, MUST and NRI, comparedcompared to SGAto SGA
•• ThereThere was a was a significantsignificant associationassociation betweenbetween LOSLOSand and nutritionalnutritional statusstatus and and riskrisk byby SGA, NRSSGA, NRS--2002, 2002, MUST and NRIMUST and NRI
•• NutritionalNutritional statusstatus and and riskrisk cancan bebe assessedassessed bybySGA, NRSSGA, NRS--20002 and MUST in 20002 and MUST in patientspatients at at hospitalhospitaladmissionadmission
KyleKyle et al, et al, ClinClin NutrNutr, In Press, In Press