Embed Size (px)
Citation preview

RESPONSE ANALYSIS OF WIND TURBINE SUPPORT STRUCTURES USING FEM AND WIND GENERATION METHOD LINKED TO TIME
SERIES OF MEASURED WIND SPEED Jeseong Yoon1, Takeshi Ishihara2 and Atsushi Yamaguchi 3
1Graduate Student, Department of Civil Engineering, University of Tokyo, 7-3-1 Hongo, Bunkyo, Tokyo, 113-8656, Japan, [email protected]
2Professor, Department of Civil Engineering, University of Tokyo, 7-3-1 Hongo, Bunkyo, Tokyo, 113-8656, Japan, [email protected]
3Research Associate, Department of Civil Engineering, University of Tokyo, 7-3-1 Hongo, Bunkyo, Tokyo,113-8656, Japan, [email protected]
ABSTRACT
A wind generation method linked to time series of measured wind speed is expanded and applied to FEM for the response analysis of wind turbine support structures. Results indicate that the mean, the standard deviation and the maximum of the tower bending moments with both conventional wind generation method and proposed method demonstrate a good agreement with the measurements, while correlation coefficients between observed and simulated moments increased from 0.067 to 0.488, when time series of measured wind speed was used.
KEYWORDS: WIND GENERATION METHOD USING TIME SERIES OF MEASURED WIND SPEED, RESPONSE ANALYSIS, FEM, WIND TURBINE SUPPORT STRUCTURE
1. Introduction
For offshore wind turbine, the costs for O&M (Operation and Maintenance) are estimated in the order of 30 to 35% of the costs of electricity and in between 10 and 15% for onshore wind turbine [Rademakers et al. (2003)]. The application of condition monitoring for early damage detection can be the feasible approach to reduce the cost for corrective maintenance. Detecting damage at an early stage enables to make the consequence damage reduce so that the costs of repair can be less expensive.
Among various condition monitoring techniques, measurements by additional equipments (e.g. strain gauge) can be the obvious way to get insight in the loading of wind turbine, however practically has insignificant drawbacks such as high cost of equipments and difficulty of sensor replacement. Instead, performance monitoring can be the promising technique for wind turbine, since wind turbines are essentially equipped with detecting devices for measurements of power, wind velocity, rotor speed and blade angle. A hybrid method, which is combined wind generation method based on the performance monitoring with FEM used for estimation of response, is expected to analyze loading of wind turbine tower with high reliability.
Conventional method for generation of wind turbulence based on given statistical parameters exists, e.g. the auto-regressive and moving average (ARMA) methods by Iwatani (1982). Iwatani method for generating wind fields uses statistical parameters such as mean wind speed, turbulence intensity, the spectrum of turbulence and spatial correlation. We subsequently applied generated wind fields to FEM to estimate response of the wind turbine

support structures. With this conventional method, static quantities such as the mean, the standard deviation and the maximum of the fluctuating response can be estimated accurately, whereas time-series of moment estimated with conventional methods are not correlated well with measurements.
This paper thus propose a new approach to generate wind, which is linked to measured wind speed in time-histories as well as using statistical parameters. Iwatani (1996) proposed wind generation method combined with time series of the measured wind speed at multi reference points, though dynamic analysis of structural response was not conducted quantitatively. It is additionally required that not only considering wind flow direction but also wind across and vertical directions for dynamic analysis of the turbine tower, since wind turbine has blades which generate significant aerodynamic loads to vertical wind direction. Consequently, a wind generation method linked to time series of measured wind speed is expanded and applied to FEM to estimate response of wind turbine. Static quantities (e.g. the mean, standard deviation and maximum of moment) and time series of the moments by conventional and proposed methods are compared with measurements to verify results.
2. FEM and Measurement
The FEM code for the response analysis of the wind loads acting on the wind turbine support structure will be described. Next, description of the field measurement is presented. These measurements will be compared with the results of conventional and proposed methods to verify them.
2.1. Finite Element Models Response analysis for the wind turbine tower is conducted with wind response
analysis program named CAsT (Computer-Aided Aerodynamic and Aeroelastic Technology) developed by the Bridge & Structure laboratory group in University of Tokyo, Japan [Ishihara et al. (2005)]. A brief description of the FEM code is summarized in Table 1. The code based on an aeroelastic calculation procedure to solve the equations of motion for a given arbitrary set of forces acting on the structure and for forces generated by the structure itself. The general formulation of the differential equation of motion for the structure is given at equation (1). fKxxCxM =++ &&& (1)
Where, M is a mass matrix, C is a damping matrix, K is a stiffness matrix, f is a force vector on the structure and typically varies with time, and x and its derivatives are unknown vectors containing translations and their derivatives. The quasi-steady aerodynamic theory is used for calculation of aerodynamic forces as an external force. In the quasi-steady aerodynamic theory, the drag and lift force are defined by the steady aerodynamic coefficients, the relative wind speed and effective angle of attack on coming flow as equation (2). The aerodynamic damping is automatically taken into account during the simulation, since the relative wind speed as well as aerodynamic force terms contains the velocity of the moving element body.
22 ))((21,))((
21 xuACFxuACF LLDD && −=−= αραρ (2)
Where, DF is drag force and LF is lift force, ρ is the air density, A is the area of the structure perpendicular to the mean wind direction, DC and LC are the drag coefficient and the lift coefficient, respectively, angle of attack and u is the wind velocity and x& is the velocity of the moving element body.
The Seventh Asia-Pacific Conference on Wind Engineering, November 8-12, 2009, Taipei, Taiwan

Table 1: Overview of CAsT program Dynamic analysis Direct numerical integration, the Newmark-β method
Eigenvalue analysis Subspace iteration procedure Element type Beam element Formulation Total Lagrangian formulation
Aerodynamic force Quasi-steady aerodynamic theory Damping Rayleigh damping
2.2. Measurement The field measurement for the characteristics of wind as well as acceleration responses
and strains of the stall regulated wind turbine with a rated power of 400kW at Karimata, Miyakojima Island was carried out from Jan. 16th 2004 to Mar. 16th 2004 by Ishihara et al. (2005). Measurement equipments such as the anemometer, accelerometers and strain gauges and their positions are shown in Figure 1. Measured wind speed in time-series at the nacelle will be used to generate wind and measured moments by strain gauge will be compared with the results of conventional and proposed methods to verify them.
Figure 1: Configuration of wind turbine and sensor positions
3. Generation of wind
Wind regeneration technique based on the auto-regressive and moving average is described in this section. Then, the expanded and modified approach, which is available to generate 3-dimensional wind velocity and combined with measured wind speed in time-histories at the nacelle as well as using statistical parameters of wind, will be examined.
3.1. Generation of Wind without Time Series of Measured Wind Speed Predicting future wind speeds at a target site using past data is conducted using linear
regression method. Linear regression is a popular industry method for constructing the
The Seventh Asia-Pacific Conference on Wind Engineering, November 8-12, 2009, Taipei, Taiwan
statistical model which will predict future values of a response time-series. Iwatani (1982) assumes that the wind speed can be represented as the sum of a linear combination of the past wind data (AR model part) and the random component, as follows:
∑=
+Δ−=M
mttmtmt
1)()()()( nuAu (3)
where, ( ))(,),(,)()( 21 tututut K
tL=u , ( ))(,),(,)()( 21 tttt K
t εεε L=n (4) where, M is the number of the past data, K is the number of the points, m is the index of time, tΔ is time interval of the data, )(tu and )(tn are the time series of wind fluctuations and random part of wind fluctuations, respectively. Based on this model, )(mA is obtained by auto-correlation and cross-correlation of the wind speed and then )(tn is obtained by spatial correlation.
[ ] [ ]⎥⎥⎥⎥
⎦
⎤
⎢⎢⎢⎢
⎣
⎡
−−
−−−
×=
)0()2()1(
)2()0()1()1()1()0(
)()2()1()()2()1(
RRR
RRRRRR
AAARRR
L
MOMM
L
L
LL
MM
MM
MM (5)
where, )(rR is a matrix, the component of which, )(rRij , is the cross correlation of fluctuating wind components of iu and ju , and can be written as, ))(()()( trmtutmturR jiij Δ+−×Δ−= (6)
It is possible to obtain )(rRij by only considering the statistical dependence between the turbulence components at two points because this technique assumes a stationary process. For example, if ji = , )(rRij can be obtained using inverse Fourier transform of power spectrum density function calculated by auto-correlation of wind speed at point i . And, if
ji ≠ , )(rRij is cross-correlation between the turbulence components at points i and j , which can be obtained by inverse Fourier transform of cross spectrum density function calculated from coherence, phase and power spectrum between two points. Using equation (4), )(mA can be calculated, thus the AR model part can be estimated.
The estimation of the random part )(tn can be calculated by )()( tt οLn ⋅= (7) Where, )(to is the random white noise process with the mean value of 0 and the standard deviation of 1 and L is the lower triangular matrix which satisfies
LLD t⋅= , where ∑=
−=M
m
t mm1
)()()0( RARD . (8)
With this equation, the random part can be calculated. In order to generate three components of wind at each point, in this study, equation (3) is expanded into the equation (9).
∑ ∑= =
+⎥⎦
⎤⎢⎣
⎡Δ−⋅=
3
1 1)()()()(
q
pM
m
qpqP ttmtmt nuAu (9)
Where, the power law exponent of )(tuP , p , denotes the component of wind speed, 3,2,1=p corresponds to the wind flow direction, perpendicular to wind flow direction and vertical direction, respectively. In addition, it is necessary to model for the correlations among the 3 components of wind fluctuations. In this research, however, correlations among the 3 components of wind speed are assumed to be negligible as following equation. 0))(()( =Δ+−×Δ− trmtutmtu qp )( qp ≠ (10) The effect of spatial correlation between wind flow direction and vertical direction will be examined in further research, as correlations between them are not insignificant in general.
The Seventh Asia-Pacific Conference on Wind Engineering, November 8-12, 2009, Taipei, Taiwan

3.2. Generation of Wind with Time Series of Measured Wind Speed In the previous section, how to generate artificial wind fields based on the model of
mean wind speed and characteristics of wind fluctuations was described. However anemometer is commonly installed on the wind turbine to measure instant wind speed persistently. It is expected that combination with wind speed data in time-series measured from anemometer enables to reduce uncertainty due to random number being used for simulation of wind fields. To verify this, in this section, time-series of wind speed measured from anemometer was linked to simulation and this generated wind will be used for dynamic analysis of structural response.
The matrix of random part in the AR model which represents wind speed is now combined with the wind speed data measured by a nacelle anemometer to improve the generation of wind field [Iwatani (1996)]. The only difference from conventional method is the calculation of the random part (equation (6) and (7)). It is assumed that wind speed is measured for the points of lk ,,1L= , whereas not for the points of Klk ,,1L+= , among all points of K . Equation (7) can be written using the components as
⎥⎥⎥⎥⎥⎥⎥⎥
⎦
⎤
⎢⎢⎢⎢⎢⎢⎢⎢
⎣
⎡
⎥⎥⎥⎥⎥⎥⎥⎥
⎦
⎤
⎢⎢⎢⎢⎢⎢⎢⎢
⎣
⎡
=
⎥⎥⎥⎥⎥⎥⎥⎥
⎦
⎤
⎢⎢⎢⎢⎢⎢⎢⎢
⎣
⎡
+
+
+++++
)(
)()(
)(0
)(
)()(
)(
1
1
11
11111
1
11
1
1
to
toto
to
LLLL
LLLLL
L
tn
tntn
tn
K
l
l
KKKlKlK
lllll
lll
K
l
l
M
M
LL
OMMOM
L
L
OM
M
M
(11)
If the time series of wind speed at the points of lk ,,1L= i.e. the random component, 1( ), , ( )ln t n tL is known, 1( ), , ( )lo t o tL can be calculated using the upper part of the equation (11).
Then 1( ), , ( )l Ko t o t+ L can be generated as white noise and the lower part of the equation (11) is used to calculate the rest of the random part, ( ), , ( )l Kn t n tL as follows.
)()()()()(
)()()()(
1111
111111111
toLtoLtoLtoLtn
toLtoLtoLtn
KKKlKllKlKK
lllllll
+++++=
+++=
++
++++++
LL
M
L
(12)
Now time-histories of the wind speed for the other points as well as measured points can be derived with )(,),(1 tntn Ki L+ . Updated random part, )(tn , is then applied to the equation (9) to come up with time-series of the wind speed for the 3 components linked to measured wind speed.
For the statistical parameters of wind, in this study, Von Karman power spectrum model of turbulence with phase of 0 and the exponent correlation for coherence function proposed by Davenport are used for fluctuating wind generation. Decay factor for exponent correlation are assumed to be 8. Turbulence Intensity uI for along wind direction, uv II 8.0= for across wind flow direction and uw II 5.0= for vertical wind flow direction are set by referring to Burton et al. (2001). In addition, the integral length scale was assumed as uv LL 33.0= and uw LL 08.0= for across and vertical wind direction, respectively [IEC-61400-1 (2005)]. The power law corresponding to the terrain subcategory I which is recommended by Architectural Institute Japan (2004) was used to estimate wind velocity, turbulence intensity and length scale profiles for the along wind component, U .
4. Results
To predict response of wind turbine, FEM was applied and verified by comparing static quantities (e.g. mean, standard deviation and maximum of moment) and time series of
The Seventh Asia-Pacific Conference on Wind Engineering, November 8-12, 2009, Taipei, Taiwan

the moments on the tower base. For the time series verification, we compared maximum moment and correlation coefficients as key indices of the time series correlation.
4.1. Verification of FEM Conventional researches assumed that turbulence intensity depends only on terrain
although turbulence intensity relies on mean wind speed as well. Thus turbulence intensities at the low mean wind speed region have been underestimated. In this research, the appropriate model of the turbulence intensity is proposed to estimate accurate response of structures. By the comparison of results, the prediction accuracy of the wind response of the wind turbine at support structures at low wind speed increased. Figure 2 shows that turbulence intensity is increased at lower mean wind speed and slowly decreased at higher wind speed and turbulence intensity is observed on the wind turbine with parked condition at Miyakojima Island, considering SSW (67.5 degree) wind direction. The class-C referring to the IEC61400-1 (2005) turbulence model was used for generation of wind in this paper.
In order to give a systematic evaluation, full dynamic simulations of wind turbine at hub have been performed using 6 types of mean wind speeds of 5, 10, 15, 20, 25 and 30 m/sec for SSW wind direction(67.5 deg) and each mean wind speed is used at different random number to acquire reliable results. Turbulence model of IEC class-C [IEC 61400-1 (2005)] was used to determine the appropriate turbulence intensity. Drag coefficient of 0.6 recommended by British Standard Institution (1972) was used for the tower. Drag and lift coefficients recommended by Noda et al. (2005) was used for the nacelle. In addition, drag coefficient and lift coefficient for each section of the blades were determined by interpolating the existing data from GH Bladed (2001) for a blade with thickness to chord ratio of 12% and from Somers (1997) for a blade with thickness to chord ratio of 21%. Structural damping ratios were assumed to be 1% and 0.6% in parallel and perpendicular to the nacelle direction respectively. In addition, the calculation was implemented in 700s by a time increment of 0.05 second. Since the first 100s is considered as dummy time to gain the stability in the dynamic analysis simulation, the first 100s results will be omitted. The remained 600sec (10 minutes) was used to compare with 10 minutes measured bending moments on the support of the wind turbine. Figure 3 shows the measured and simulated bending moment at the base of the tower. The static quantities, e.g. the mean and standard deviation of estimated moments, demonstrate well agreement with the measurements.
4.2. Verification of FEM Results in Time Series In order to show the performance of the proposed method, the time series of the
bending moment is predicted with the proposed and conventional models, and compared with the measurement. Figure 4 shows three time-history samples of tower base moment of (a)
10
100
1000
1 10 100
Ave(Obs.)
Std(Obs.)
Ave(Cal.)
Std(cal.)
Mom
ent (
Mxy
) [kN
m]
Mean Wind Speed [m/s]
Figure 2: Variation of turbulence intensities with mean wind speed
Figure 3: Moments at the Tower Base
0
0.05
0.1
0.15
0.2
0.25
0.3
0.35
0.4
0 5 10 15 20 25
Observed
IEC61400-1 (C)
90% quantile
Turb
ulenc
e Inte
nsity [
%]
Mean wind speed [m/s]
The Seventh Asia-Pacific Conference on Wind Engineering, November 8-12, 2009, Taipei, Taiwan

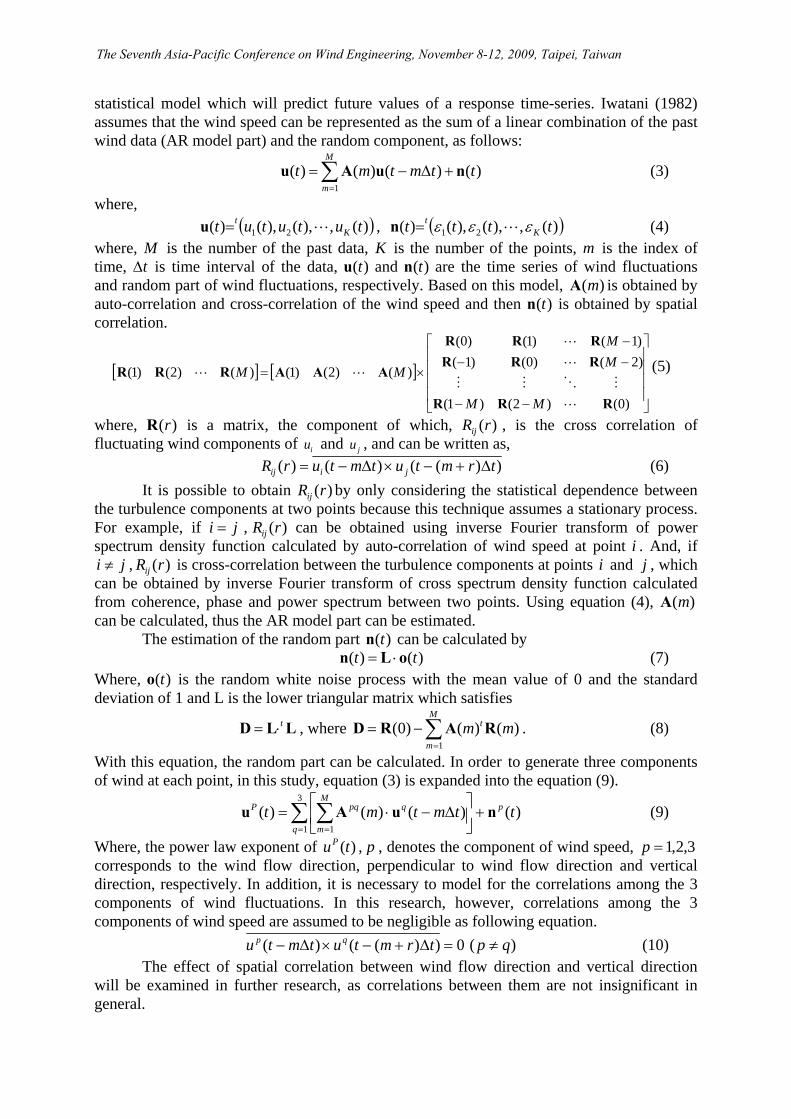
measurement, (b) simulation using the time series of measured wind speed at the nacelle and (c) simulated moment with conventional method. Clearly, the proposed method shows better agreement with the measurement showing the similarity in the low frequency component of the response. To quantitatively show this, the mean value, standard deviation, maximum value and the correlation coefficients with the measurement were calculated for these two simulations. Table 2 shows the results which indicates that mean, standard deviation and maximum moments for both simulations can be estimated equally well, comparing observed moment. However, it is proved that the proposed model improved the correlation with the measurement, comparing averages of the correlation coefficients for the simulations using six seed numbers, which is increased from 0.067 to 0.488. Figure 5 and 6 show the variation of the estimated maximum response and correlation coefficients for the cases of 6 different random seeds at the
generation of the wind field, respectively. Both moments estimated by proposed method and by conventional method shows well agreed with measurements and show stable results regardless of the seed numbers, whereas correlation coefficients is significantly increased, when we used wind generation method linked to time-series of measured wind speed. Those results shows that favorable agreements between observed moment and estimated moments are verified when time series of measured wind speed is linked to wind generation technique.
Table 2: Statistical quantities and correlation coefficients of estimated and measured moments
Case Ave (Mxy) Std (Mxy) Max (Mxy) Correlation Coefficient Observation 143.812 39.624 282.335 ·
seed1 147.575 36.744 270.862 0.476 seed2 147.440 36.720 263.732 0.505 seed3 148.261 40.102 289.756 0.447 seed4 147.839 37.158 269.933 0.477 seed5 147.843 38.578 292.354 0.483 seed6 147.708 39.387 289.903 0.541
Simulation (with time-series of measurement)
Standard error 3.974 2.001 11.86 · seed1 147.513 34.912 289.505 0.016 seed2 147.507 36.641 294.728 0.111 seed3 148.240 39.343 267.927 0.048 seed4 148.854 36.231 278.873 0.108 seed5 147.153 35.230 270.587 0.102 seed6 147.240 36.144 266.713 0.015
Simulation (without time-
series of measurement)
Standard error 3.985 3.514 11.60 ·
-600
0
600
1200
0 200 400 600
Mxy
Moment(kNm)
Tim e(s)
(b) Simulated Moment (with time-series of measurements)
-600
0
600
1200
0 200 400 600
Mxy
Moment(kNm)
Tim e(s)
(a) Observed Moment
-600
0
600
1200
0 200 400 600
Mxy
Moment(kN
m)
Time(s)
(c) Simulated Moment (without time-series of measurements)
Figure 4: Time-histories of measured and simulated moments
The Seventh Asia-Pacific Conference on Wind Engineering, November 8-12, 2009, Taipei, Taiwan
5. Conclusions
In this study, a wind generation method linked to time-series of measured wind speed was expanded and applied to FEM for the response analysis of the wind turbine support structures. Conclusions are summarized as follows.
1. We proposed a new approach of condition monitoring for wind turbine support structures, which is combined with FEM and wind generation method linked to time series of the measured wind velocity based on the performance monitoring.
2. The FEM code was used to estimate the mean, the standard deviation and the maximum of the tower bending moments with conventional wind generation method and proposed method, both results demonstrate a good agreement with the measurements.
3. The correlation coefficients between observed and simulated moments increased from 0.067 to 0.488, when time series of measured wind speed was used for the wind generation.
References
Architectural Institute of Japan (2004), Recommendation for loads on buildings.
British Standard Institution (1972), Code of basic data for the design of buildings, CP3, Chapter V, Part 2, Wind Loads.
Burton, T., Sharpe, D., Jenkins, N., Bossanyi, E. (2001), Wind Energy Handbook, Wiley, England.
GH Bladed (2001), Generic 2MW Offshore Turbine, GH Bladed Version3.51, Garrad Hassan and Partners Limited.
IEC 61400-1 (2005), Wind Turbines-Part 1: Design Requirements, International Electrotechnical Commision, 3rd Edition.
Ishihara, T., Phuc, P. V., Fujino, Y., Takahara, K. and Mekaru, T. (2005), “A Field Test and Full Dynamic Simulation on a Stall Regulated Wind Turbine”, Proc. of APCWE VI, 599-612.
Iwatani, Y. (1982), Simulation of Multidimensional Wind Turbulences Having Any Arbitrary Power Spectra and Cross Spectra, J. Wind Engineering, 11, 5-17 (in Japanese).
Iwatani, Y. (1996), Simulation of Multidimensional Wind Fluctuations Linked to Measured Data, J. Wind Engineering, 69, 1-13 (in Japanese).
Rademakers, L.W.M.M., Braam, H., Zaaijer, M.B. and Van Bussel, G.J.W. (2003), Assessment and Optimisation of Operation and Maintenance of Offshore Wind Turbines, Proceedings European Wind Energy Conference.
Noda, H., Shimada, K. and Ishihara, T. (2005), Wind Forces and Peak Wind Pressure Distributions on Wind Turbine Nacelle, Proceedings of the sixth Asia-Pacific Conference on Wind Engineering, Seoul, Korea.
Somers, D.M. (1997), Design and Experimental Results for the S809 Airfoil, NREL/SR-6918.Golden, Colorado, National Renewable Energy Laboratory.
Rat
io o
f Max
imum
Mom
ents
(Mxy
sim/M
xyob
s)
0
0.2
0.4
0.6
0.8
1
1.2
1.4
1 2 3 4 5 6
ConventionalModifiedObserved
Simulation Case
Cor
rela
tion
Coe
ffic
ient
s
0
0.2
0.4
0.6
0.8
1
1 2 3 4 5 6
Conventional
Modified
Simulation Case
Figure 5:The ratio of maximum moments to measurements for 6 seed cases
Figure 6: Correlation coefficients for 6 seed cases
The Seventh Asia-Pacific Conference on Wind Engineering, November 8-12, 2009, Taipei, Taiwan