Embed Size (px)
Citation preview
Espuno, N. 2004. Impact du loup (Canis lupus) sur les ongules sauvages et domestiques dans le massif du Mercantour. Thesis: 1-214. Université Montpellier II, France.
Keywords: 8FR/assessment/behaviour/Canis lupus/chamois/conflict/guarding dog/harvest/ hunters/husbandry/impact/livestock/Malme/measurement/Mercantour/model/models/mouflon/Ovis gmelini/predation/predation rate/predator-prey/predator prey/prey/recolonization/Rupicapra rupicapra/sheep/sheep husbandry/Ursus arctos/wolf/wolves
Abstract: Impact of wolves on wild and domestic ungulates in the Mercantour Mountains. Since wolves (Canis lupus) recolonized the Mercantour Mountains (France) in the early 1990.s, the impact of predation on both wild and domestic ungulates has been very controversial. The objective of this work was to assess the efficiency of preventive sheep husbandry methods, and to provide a first assessment of wolf predation impact on wild prey populations. We developed a wolf energy-consumption model to estimate the annual number of wolf-killed ungulates from 1993 to 2001, and integrated these estimates to age-structured models of mouflon (Ovis gmelini) and chamois (Rupicapra rupicapra) populations. Since predation rates may be affected by antipredatory defenses of prey, we studied the changes in mouflon and chamois vigilance behaviour following wolf recolonization. We show that the wolf energy-consumption model provides a valid alternative to the direct measurement of prey killing rates. Predation and harvest rates together probably exceeded the potential rate of increase of the mouflon population in 1994-2001, explaining its observed decline. The rate of chamois uptake by wolves and hunters always lied below the potential rate of increase of the chamois population. Following wolf recolonization, mouflons and chamois became more vigilant, and an increasing proportion of farmers implemented sheep protection measures. The joint use of livestock guarding dogs and sheep gathering at night was showed to be a very efficient way of preventing wolf attacks for the majority of herds. We discuss the variation of estimated predation rates between 1993 and 2001 in the light of these changes in prey vulnerability. Models developed in this work would be directly applicable to other study areas where a first broad assessment of wolf impact on wild ungulate populations is needed. Because of their general structure, our models may also be easily modified to be applied to other poorly-known large predator-prey systems.
UNIVERSITE MONTPELLIER II
SCIENCES ET TECHNIQUES DU LANGUEDOC
THESE
pour obtenir le grade de
DOCTEUR DE L'UNIVERSITE MONTPELLIER II Discipline : Biologie des Populations et Ecologie Formation Doctorale : Biologie de l�Evolution et Ecologie Ecole Doctorale : Biologie des Systèmes Intégrés - Agronomie - Environnement
IMPACT DU LOUP (CANIS LUPUS) SUR LES ONGULES SAUVAGES ET
DOMESTIQUES DANS LE MASSIF DU MERCANTOUR
présentée et soutenue publiquement
par
Nathalie ESPUNO
Le 15 septembre 2004
JURY
M. Pierre Migot, Rapporteur M. Jean-Michel Gaillard, Rapporteur M. Luigi Boitani, Examinateur M. Paul Lapeyronie, Examinateur M. Jean-Dominique Lebreton, Directeur de Thèse
M. Doyle McKey, Examinateur

2

3
REMERCIEMENTS
J�ai bénéficié tout au long de ce travail d�une bourse de thèse de l�Office National de la
Chasse et de la Faune Sauvage, et une partie de l�étude (Annexe 4 notamment) a été financée
dans le cadre du programme LIFE Loup.
Cette thèse n�aurait jamais vu le jour sans Marie-Lazarine Poulle, Pierre Migot, Benoît
Lequette et Jean-Dominique Lebreton, qui m�ont donné, chacun à leur façon, l�opportunité de
m�engager dans cette voie. Je les en remercie chaleureusement.
Merci aussi Jean-Do, Pierre, Benoît, Marie-Lazarine, et Philippe Stahl pour l�encadrement et
le soutien - scientifique, financier, logistique et moral - que vous m�avez fourni tout au long
de mon DEA puis de ma thèse. Merci à Jean-Michel Gaillard, Pierre Taberlet, Christophe
Duchamp, Eric Marboutin, Paul Lapeyronie, Luigi Boitani pour leur collaboration, leurs
conseils, et les échanges de données, et merci à Doyle McKey pour avoir accepté d�évaluer ce
travail.
Merci aux gardes du Parc National du Mercantour et à Gégé pour les connaissances qu�ils
m�ont transmises, les nombreuses discussions sur le sujet, les coups de main sur le terrain� et
les ballades, dans une ambiance toujours si amicale.
Un grand merci à tous les membres de l�équipe Biométrie, encore présents ou déjà ailleurs,
pour l�excellent environnement de travail, les discussions scientifiques, et tout le reste�
Merci Rémi, Mark, Olivier G., Olivier D., Laurène, Sophie, ainsi que Gwenaël, Marie-Hélène
et Didier, pour vos relectures et commentaires. Merci aussi l�équipe pour le coup de main
pour imprimer et déposer la thèse à distance...
Enfin, merci la Famille et merci Didier pour votre patience et votre soutien tout au long de ces
années de thèse !
4
SOMMAIRE
MEMOIRE DE SYNTHESE
I � Introduction p. 6
II � Cycle annuel et besoins énergétiques du loup p. 16
A. Une demande énergétique fortement saisonnière p. 17
B. Des ongulés sauvages particulièrement vulnérables en hiver p. 19
C. Une ressource saisonnière : les ongulés domestiques p. 21
III � Les proies face au risque de prédation p. 26
A. Un cheptel domestique de moins en moins vulnérable p. 26
B. Des ongulés sauvages de plus en plus vigilants p. 30
C. Conséquences potentielles d�une diminution de vulnérabilité des proies p. 33
IV � Impact de la prédation sur les populations de mouflons et de chamois p. 36
A. Mouflon p. 37
B. Chamois p. 42
V � Discussion � Conclusion p. 47
A. Validité de l�approche utilisée et futures priorités p. 47
B. Un scénario concernant les interactions loup-proies en 1993-2001 p. 49
C. Implications p. 51
D. Conclusion p. 53
VI � Références citées p. 55
ANNEXES 1 - Estimating prey killing rates by wolves with an energy-consumption model p. 66
2 - Assessing the impact of recolonizing wolves on ungulate populations
in Mercantour p.106
3 - Vigilance patterns of two ungulate species in response to different intensities
of wolf predation p.134 4 - Heterogeneous response to preventive sheep husbandry during wolf
recolonization of the French Alps p.170
5 - Estimation du régime alimentaire du loup dans le Mercantour p.205

5
Mémoire de Synthèse
6
I. INTRODUCTION
L�histoire de la biodiversité est constituée de radiations et de stabilisations, ponctuées par des
périodes d�extinctions massives (Signor 1990) qui révèlent que les systèmes vivants terrestres
et marins peuvent être vulnérables à certains stress environnementaux (Jablonski 1991).
Malgré ces périodes d�extinctions, la biodiversité a globalement augmenté depuis l�apparition
des premiers organismes jusqu�à l�homme (Signor 1990). Cependant, notre époque est un
temps de régression de la diversité, coïncidant avec des changements climatiques et avec
l�apparition d�activités humaines à grande échelle (Gaston and Spicer 1998). Nos ancêtres ont
probablement été directement ou indirectement responsables de l�extinction de nombreuses
espèces à la fin du Pléistocène (Owen-Smith 1987), puis le taux d�extinction a augmenté
rapidement depuis le XVIIe siècle de notre ère, particulièrement au XIXe siècle sous l�effet de
l�expansion coloniale Européenne (Smith et al. 1993). Les principales causes admises pour le
recul contemporain de la biodiversité sont les changements d�habitats (Diamond 1989,
Lawton and May 1995), les changements climatiques (Sala et al. 2000), ainsi que les
invasions d�espèces et les surexploitations (Diamond 1989).
L�extinction de populations et le déclin local de l�abondance d�une espèce représentent des
formes potentiellement insidieuses d�érosion de la biodiversité (Erlich et Daily 1993), car les
pertes de populations tendent à réduire la diversité taxonomique, génétique et fonctionnelle
des sites, et sont ainsi susceptibles d�affecter le fonctionnement des écosystèmes (Gaston et
Spicer 1998). Les espèces de grande taille qui se situent à des niveaux trophiques élevés et qui
existent donc à faible densité, comme les grands carnivores, sont particulièrement vulnérables
(Purvis et al. 2001, Woodroffe et al. 2001). Au cours des derniers siècles, de nombreuses
espèces de grands carnivores ont subi des déclins dramatiques, probablement causés
directement ou indirectement par l�homme. De nombreuses espèces autrefois très répandues
comme le loup (Canis lupus), le lion (Panthera leo), le tigre (Panthera tigris) ou l�ours brun
(Ursus arctos) ont ainsi vu leur aire de distribution se contracter de façon importante
(Woodroffe 2001). Certaines, comme le loup des Iles Falkland (Dusicyon australis), se sont
même éteintes (Woodroffe 2001).
La plupart des espèces de grands carnivores entrent en conflit avec l�homme en raison de la
prédation qu�ils occasionnent sur le cheptel domestique ou sur les populations d�espèces
7
gibiers (Woodroffe 2001, Ginsberg and Mac Donald 1990, Nowell and Jackson 1996,
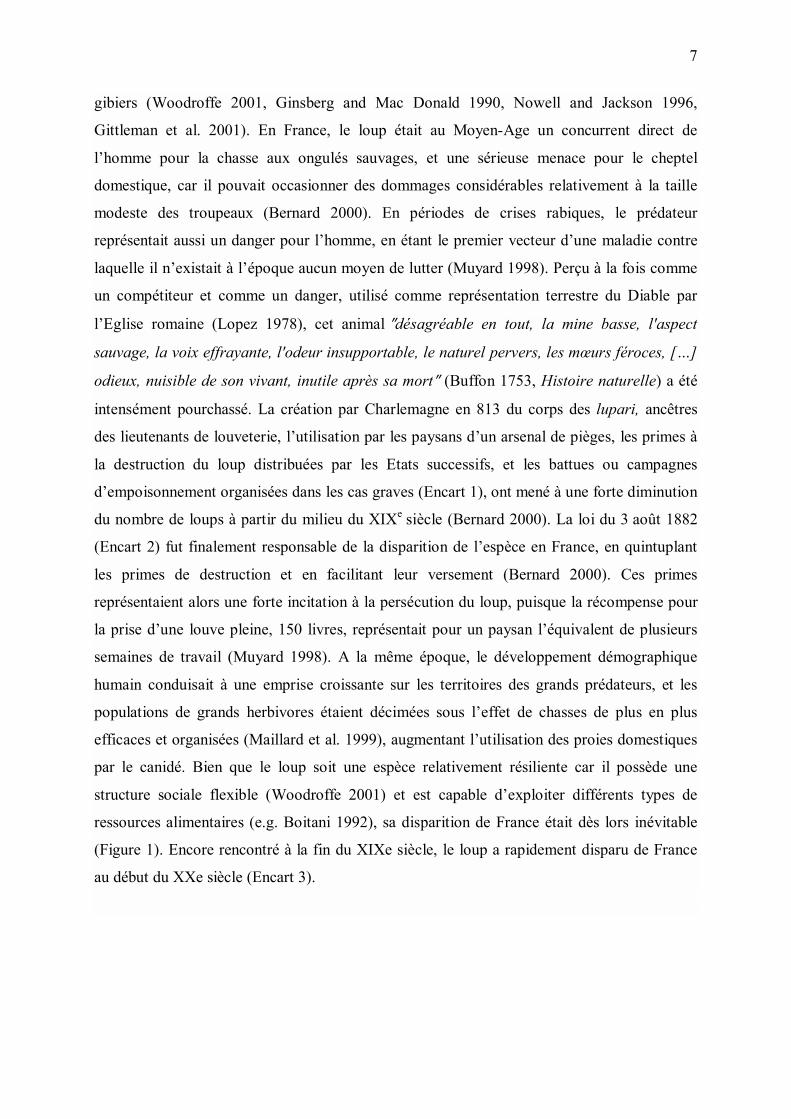
Gittleman et al. 2001). En France, le loup était au Moyen-Age un concurrent direct de
l�homme pour la chasse aux ongulés sauvages, et une sérieuse menace pour le cheptel
domestique, car il pouvait occasionner des dommages considérables relativement à la taille
modeste des troupeaux (Bernard 2000). En périodes de crises rabiques, le prédateur
représentait aussi un danger pour l�homme, en étant le premier vecteur d�une maladie contre
laquelle il n�existait à l�époque aucun moyen de lutter (Muyard 1998). Perçu à la fois comme
un compétiteur et comme un danger, utilisé comme représentation terrestre du Diable par
l�Eglise romaine (Lopez 1978), cet animal ″désagréable en tout, la mine basse, l'aspect
sauvage, la voix effrayante, l'odeur insupportable, le naturel pervers, les m�urs féroces, [�]
odieux, nuisible de son vivant, inutile après sa mort″ (Buffon 1753, Histoire naturelle) a été
intensément pourchassé. La création par Charlemagne en 813 du corps des lupari, ancêtres
des lieutenants de louveterie, l�utilisation par les paysans d�un arsenal de pièges, les primes à
la destruction du loup distribuées par les Etats successifs, et les battues ou campagnes
d�empoisonnement organisées dans les cas graves (Encart 1), ont mené à une forte diminution
du nombre de loups à partir du milieu du XIXe siècle (Bernard 2000). La loi du 3 août 1882
(Encart 2) fut finalement responsable de la disparition de l�espèce en France, en quintuplant
les primes de destruction et en facilitant leur versement (Bernard 2000). Ces primes
représentaient alors une forte incitation à la persécution du loup, puisque la récompense pour
la prise d�une louve pleine, 150 livres, représentait pour un paysan l�équivalent de plusieurs
semaines de travail (Muyard 1998). A la même époque, le développement démographique
humain conduisait à une emprise croissante sur les territoires des grands prédateurs, et les
populations de grands herbivores étaient décimées sous l�effet de chasses de plus en plus
efficaces et organisées (Maillard et al. 1999), augmentant l�utilisation des proies domestiques
par le canidé. Bien que le loup soit une espèce relativement résiliente car il possède une
structure sociale flexible (Woodroffe 2001) et est capable d�exploiter différents types de
ressources alimentaires (e.g. Boitani 1992), sa disparition de France était dès lors inévitable
(Figure 1). Encore rencontré à la fin du XIXe siècle, le loup a rapidement disparu de France
au début du XXe siècle (Encart 3).
8
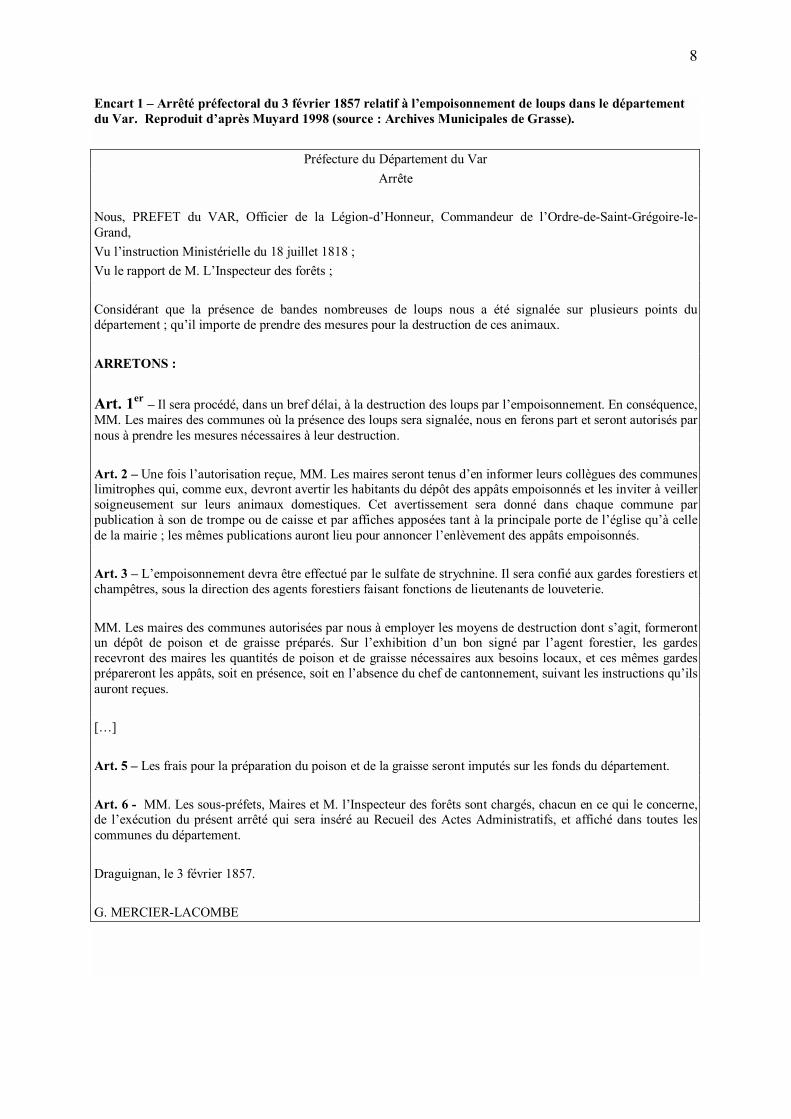
Encart 1 � Arrêté préfectoral du 3 février 1857 relatif à l�empoisonnement de loups dans le département du Var. Reproduit d�après Muyard 1998 (source : Archives Municipales de Grasse).
Préfecture du Département du Var Arrête
Nous, PREFET du VAR, Officier de la Légion-d�Honneur, Commandeur de l�Ordre-de-Saint-Grégoire-le-Grand, Vu l�instruction Ministérielle du 18 juillet 1818 ; Vu le rapport de M. L�Inspecteur des forêts ; Considérant que la présence de bandes nombreuses de loups nous a été signalée sur plusieurs points du département ; qu�il importe de prendre des mesures pour la destruction de ces animaux. ARRETONS :
Art. 1er � Il sera procédé, dans un bref délai, à la destruction des loups par l�empoisonnement. En conséquence, MM. Les maires des communes où la présence des loups sera signalée, nous en ferons part et seront autorisés par nous à prendre les mesures nécessaires à leur destruction. Art. 2 � Une fois l�autorisation reçue, MM. Les maires seront tenus d�en informer leurs collègues des communes limitrophes qui, comme eux, devront avertir les habitants du dépôt des appâts empoisonnés et les inviter à veiller soigneusement sur leurs animaux domestiques. Cet avertissement sera donné dans chaque commune par publication à son de trompe ou de caisse et par affiches apposées tant à la principale porte de l�église qu�à celle de la mairie ; les mêmes publications auront lieu pour annoncer l�enlèvement des appâts empoisonnés. Art. 3 � L�empoisonnement devra être effectué par le sulfate de strychnine. Il sera confié aux gardes forestiers et champêtres, sous la direction des agents forestiers faisant fonctions de lieutenants de louveterie. MM. Les maires des communes autorisées par nous à employer les moyens de destruction dont s�agit, formeront un dépôt de poison et de graisse préparés. Sur l�exhibition d�un bon signé par l�agent forestier, les gardes recevront des maires les quantités de poison et de graisse nécessaires aux besoins locaux, et ces mêmes gardes prépareront les appâts, soit en présence, soit en l�absence du chef de cantonnement, suivant les instructions qu�ils auront reçues. [�] Art. 5 � Les frais pour la préparation du poison et de la graisse seront imputés sur les fonds du département. Art. 6 - MM. Les sous-préfets, Maires et M. l�Inspecteur des forêts sont chargés, chacun en ce qui le concerne, de l�exécution du présent arrêté qui sera inséré au Recueil des Actes Administratifs, et affiché dans toutes les communes du département. Draguignan, le 3 février 1857. G. MERCIER-LACOMBE

9
Encart 2 � Texte de la loi du 3 août 1882 relative à la destruction des loups. Reproduit d�après Muyard 1998 (source : Archives Municipales de Grasse).
Loi relative à la destruction des loups
Le Sénat et la Chambre des députés ont adopté, Le Président de la République promulgue la loi dont la teneur suit : Art. 1er � Les primes pour la destruction des loups sont fixées de la manière suivante : Cent francs (100 fr.) par tête de loup ou de louve non pleine ; Cent cinquante francs (150 fr.) par tête de louve pleine ; Quarante francs (40 fr.) par tête de louveteau ; Est considéré comme louveteau l�animal dont le poids est inférieur à huit kilogrammes (8 kilogr.) ; Lorsqu�il sera prouvé qu�un loup s�est jeté sur des êtres humains, celui qui le tuera aura droit à une prime de deux cent francs (200 fr.). Art. 2 � Le paiement des primes pour la destruction des loups est à la charge de l�Etat. Un crédit spécial est ouvert, à cet effet, au budget du ministère de l�agriculture. Art. 3 � L�abattage sera constaté par le maire de la commune sur le territoire de laquelle le loup aura été abattu. Art. 4 � La prime sera payée au plus tard le quinzième jour qui suivra la constatation de l�abattage. [�] Fait à Paris, le 3 août 1882. JULES GREVY. Par le Président de la République : Le ministre de l�agriculture, DE MAHY.
10
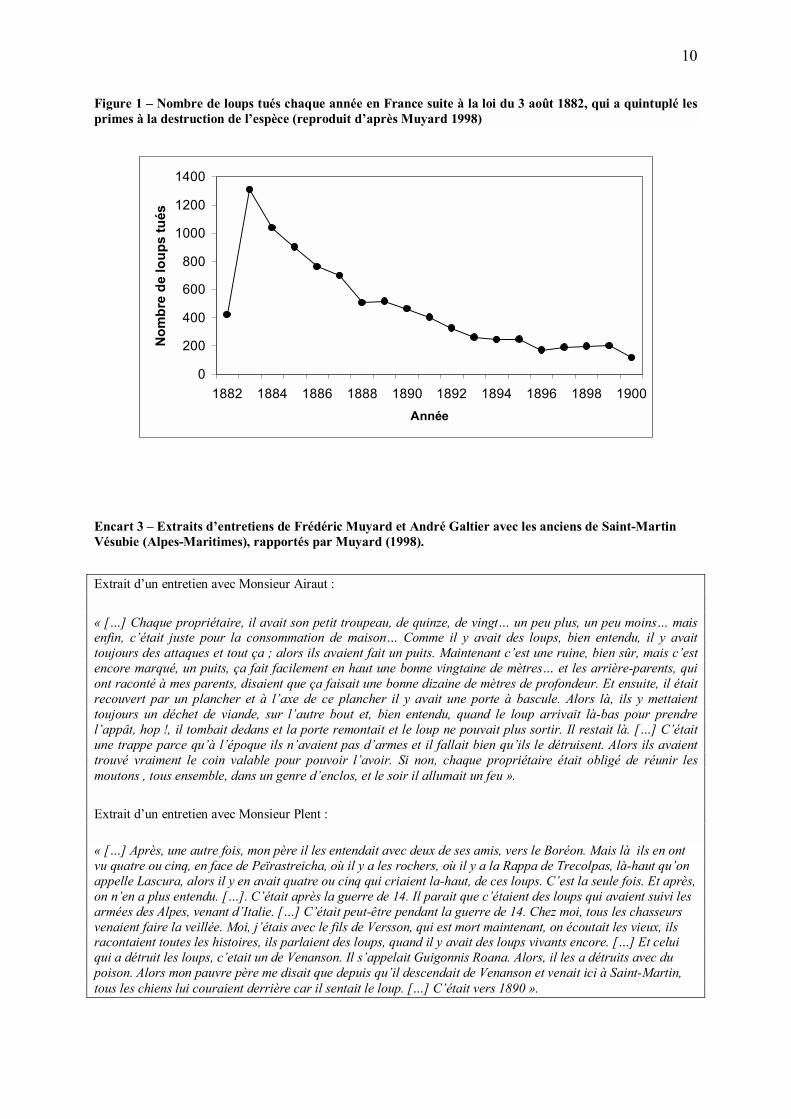
Figure 1 � Nombre de loups tués chaque année en France suite à la loi du 3 août 1882, qui a quintuplé les primes à la destruction de l�espèce (reproduit d�après Muyard 1998)
0
200
400
600
800
1000
1200
1400
1882 1884 1886 1888 1890 1892 1894 1896 1898 1900Année
Nom
bre
de lo
ups
tués
Encart 3 � Extraits d�entretiens de Frédéric Muyard et André Galtier avec les anciens de Saint-Martin Vésubie (Alpes-Maritimes), rapportés par Muyard (1998).
Extrait d�un entretien avec Monsieur Airaut : « [�] Chaque propriétaire, il avait son petit troupeau, de quinze, de vingt� un peu plus, un peu moins� mais enfin, c�était juste pour la consommation de maison� Comme il y avait des loups, bien entendu, il y avait toujours des attaques et tout ça ; alors ils avaient fait un puits. Maintenant c�est une ruine, bien sûr, mais c�est encore marqué, un puits, ça fait facilement en haut une bonne vingtaine de mètres� et les arrière-parents, qui ont raconté à mes parents, disaient que ça faisait une bonne dizaine de mètres de profondeur. Et ensuite, il était recouvert par un plancher et à l�axe de ce plancher il y avait une porte à bascule. Alors là, ils y mettaient toujours un déchet de viande, sur l�autre bout et, bien entendu, quand le loup arrivait là-bas pour prendre l�appât, hop !, il tombait dedans et la porte remontait et le loup ne pouvait plus sortir. Il restait là. [�] C�était une trappe parce qu�à l�époque ils n�avaient pas d�armes et il fallait bien qu�ils le détruisent. Alors ils avaient trouvé vraiment le coin valable pour pouvoir l�avoir. Si non, chaque propriétaire était obligé de réunir les moutons , tous ensemble, dans un genre d�enclos, et le soir il allumait un feu ». Extrait d�un entretien avec Monsieur Plent : « [�] Après, une autre fois, mon père il les entendait avec deux de ses amis, vers le Boréon. Mais là ils en ont vu quatre ou cinq, en face de Peïrastreicha, où il y a les rochers, où il y a la Rappa de Trecolpas, là-haut qu�on appelle Lascura, alors il y en avait quatre ou cinq qui criaient la-haut, de ces loups. C�est la seule fois. Et après, on n�en a plus entendu. [�]. C�était après la guerre de 14. Il parait que c�étaient des loups qui avaient suivi les armées des Alpes, venant d�Italie. [�] C�était peut-être pendant la guerre de 14. Chez moi, tous les chasseurs venaient faire la veillée. Moi, j�étais avec le fils de Versson, qui est mort maintenant, on écoutait les vieux, ils racontaient toutes les histoires, ils parlaient des loups, quand il y avait des loups vivants encore. [�] Et celui qui a détruit les loups, c�etait un de Venanson. Il s�appelait Guigonnis Roana. Alors, il les a détruits avec du poison. Alors mon pauvre père me disait que depuis qu�il descendait de Venanson et venait ici à Saint-Martin, tous les chiens lui couraient derrière car il sentait le loup. [�] C�était vers 1890 ».
11
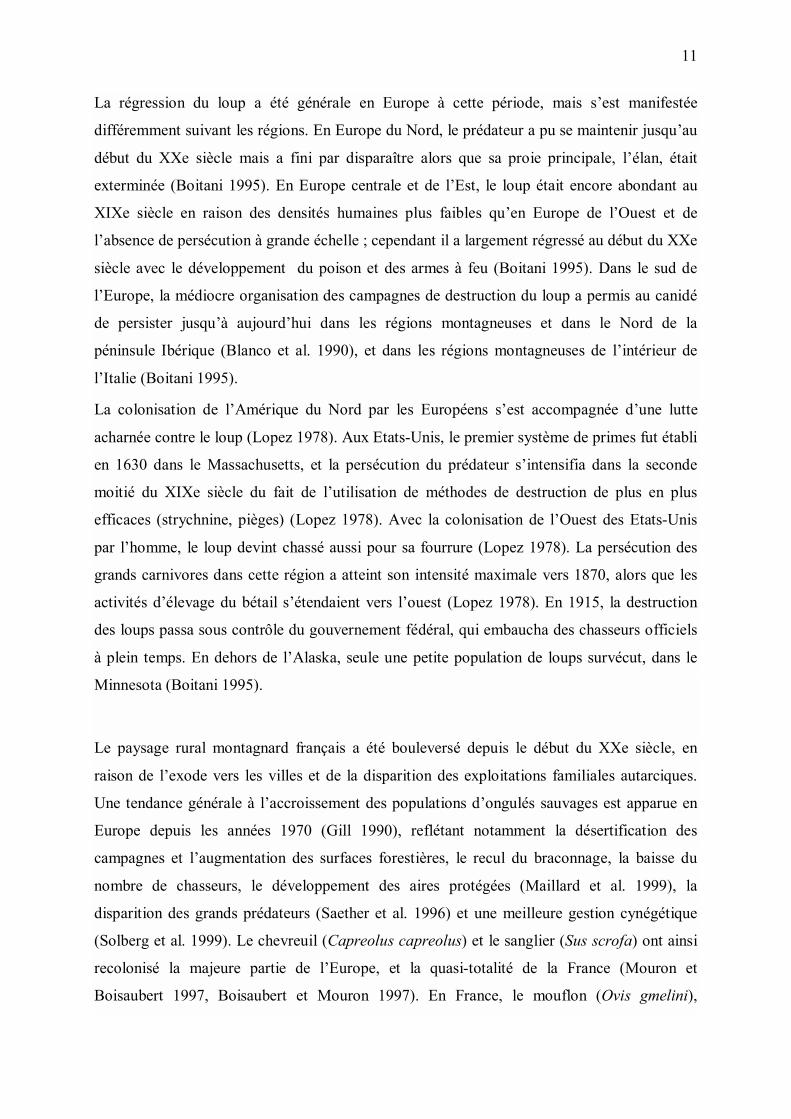
La régression du loup a été générale en Europe à cette période, mais s�est manifestée
différemment suivant les régions. En Europe du Nord, le prédateur a pu se maintenir jusqu�au
début du XXe siècle mais a fini par disparaître alors que sa proie principale, l�élan, était
exterminée (Boitani 1995). En Europe centrale et de l�Est, le loup était encore abondant au
XIXe siècle en raison des densités humaines plus faibles qu�en Europe de l�Ouest et de
l�absence de persécution à grande échelle ; cependant il a largement régressé au début du XXe
siècle avec le développement du poison et des armes à feu (Boitani 1995). Dans le sud de
l�Europe, la médiocre organisation des campagnes de destruction du loup a permis au canidé
de persister jusqu�à aujourd�hui dans les régions montagneuses et dans le Nord de la
péninsule Ibérique (Blanco et al. 1990), et dans les régions montagneuses de l�intérieur de
l�Italie (Boitani 1995).
La colonisation de l�Amérique du Nord par les Européens s�est accompagnée d�une lutte
acharnée contre le loup (Lopez 1978). Aux Etats-Unis, le premier système de primes fut établi
en 1630 dans le Massachusetts, et la persécution du prédateur s�intensifia dans la seconde
moitié du XIXe siècle du fait de l�utilisation de méthodes de destruction de plus en plus
efficaces (strychnine, pièges) (Lopez 1978). Avec la colonisation de l�Ouest des Etats-Unis
par l�homme, le loup devint chassé aussi pour sa fourrure (Lopez 1978). La persécution des
grands carnivores dans cette région a atteint son intensité maximale vers 1870, alors que les
activités d�élevage du bétail s�étendaient vers l�ouest (Lopez 1978). En 1915, la destruction
des loups passa sous contrôle du gouvernement fédéral, qui embaucha des chasseurs officiels
à plein temps. En dehors de l�Alaska, seule une petite population de loups survécut, dans le
Minnesota (Boitani 1995).
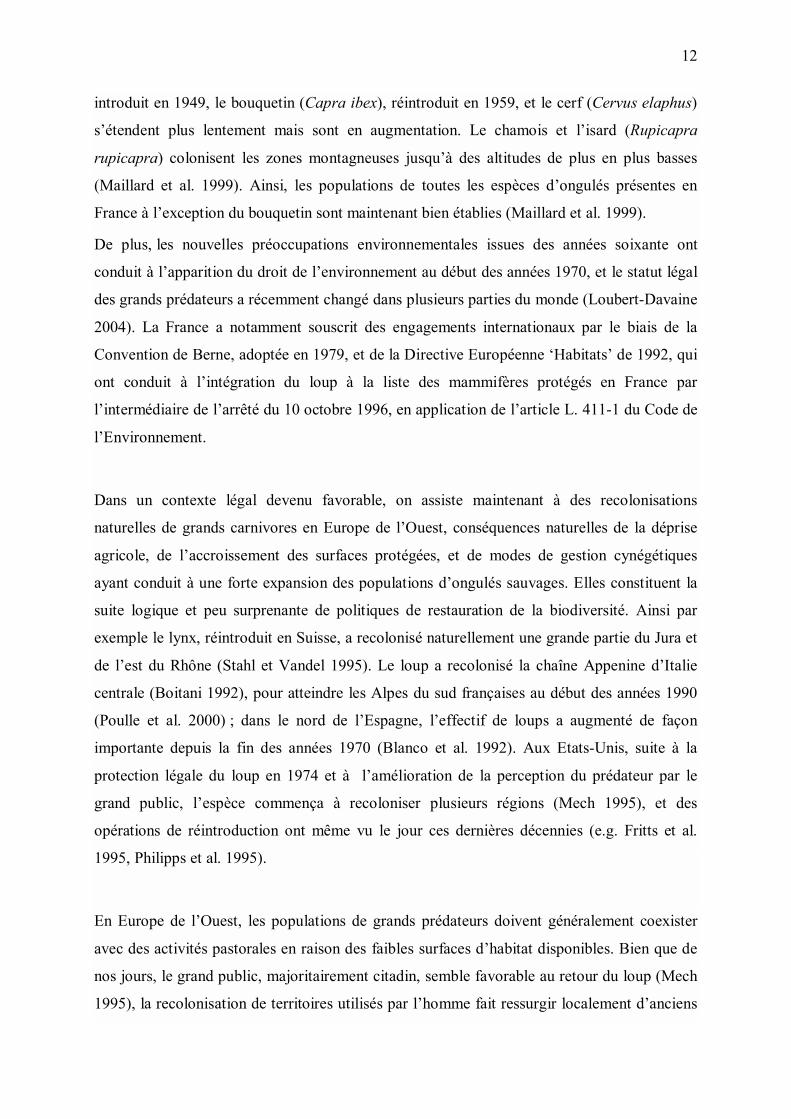
Le paysage rural montagnard français a été bouleversé depuis le début du XXe siècle, en
raison de l�exode vers les villes et de la disparition des exploitations familiales autarciques.
Une tendance générale à l�accroissement des populations d�ongulés sauvages est apparue en
Europe depuis les années 1970 (Gill 1990), reflétant notamment la désertification des
campagnes et l�augmentation des surfaces forestières, le recul du braconnage, la baisse du
nombre de chasseurs, le développement des aires protégées (Maillard et al. 1999), la
disparition des grands prédateurs (Saether et al. 1996) et une meilleure gestion cynégétique
(Solberg et al. 1999). Le chevreuil (Capreolus capreolus) et le sanglier (Sus scrofa) ont ainsi
recolonisé la majeure partie de l�Europe, et la quasi-totalité de la France (Mouron et
Boisaubert 1997, Boisaubert et Mouron 1997). En France, le mouflon (Ovis gmelini),
12
introduit en 1949, le bouquetin (Capra ibex), réintroduit en 1959, et le cerf (Cervus elaphus)
s�étendent plus lentement mais sont en augmentation. Le chamois et l�isard (Rupicapra
rupicapra) colonisent les zones montagneuses jusqu�à des altitudes de plus en plus basses
(Maillard et al. 1999). Ainsi, les populations de toutes les espèces d�ongulés présentes en
France à l�exception du bouquetin sont maintenant bien établies (Maillard et al. 1999).
De plus, les nouvelles préoccupations environnementales issues des années soixante ont
conduit à l�apparition du droit de l�environnement au début des années 1970, et le statut légal
des grands prédateurs a récemment changé dans plusieurs parties du monde (Loubert-Davaine
2004). La France a notamment souscrit des engagements internationaux par le biais de la
Convention de Berne, adoptée en 1979, et de la Directive Européenne �Habitats� de 1992, qui
ont conduit à l�intégration du loup à la liste des mammifères protégés en France par
l�intermédiaire de l�arrêté du 10 octobre 1996, en application de l�article L. 411-1 du Code de
l�Environnement.
Dans un contexte légal devenu favorable, on assiste maintenant à des recolonisations
naturelles de grands carnivores en Europe de l�Ouest, conséquences naturelles de la déprise
agricole, de l�accroissement des surfaces protégées, et de modes de gestion cynégétiques
ayant conduit à une forte expansion des populations d�ongulés sauvages. Elles constituent la
suite logique et peu surprenante de politiques de restauration de la biodiversité. Ainsi par
exemple le lynx, réintroduit en Suisse, a recolonisé naturellement une grande partie du Jura et
de l�est du Rhône (Stahl et Vandel 1995). Le loup a recolonisé la chaîne Appenine d�Italie
centrale (Boitani 1992), pour atteindre les Alpes du sud françaises au début des années 1990
(Poulle et al. 2000) ; dans le nord de l�Espagne, l�effectif de loups a augmenté de façon
importante depuis la fin des années 1970 (Blanco et al. 1992). Aux Etats-Unis, suite à la
protection légale du loup en 1974 et à l�amélioration de la perception du prédateur par le
grand public, l�espèce commença à recoloniser plusieurs régions (Mech 1995), et des
opérations de réintroduction ont même vu le jour ces dernières décennies (e.g. Fritts et al.
1995, Philipps et al. 1995).
En Europe de l�Ouest, les populations de grands prédateurs doivent généralement coexister
avec des activités pastorales en raison des faibles surfaces d�habitat disponibles. Bien que de
nos jours, le grand public, majoritairement citadin, semble favorable au retour du loup (Mech
1995), la recolonisation de territoires utilisés par l�homme fait ressurgir localement d�anciens
13
conflits, exacerbés par le véritable folklore du loup élaboré au fil des siècles (Bernard 2000).
La protection de l�espèce reste donc souvent très controversée malgré son statut légal.
Dans les Alpes du sud françaises, les petits troupeaux familiaux ont disparu après la dernière
guerre, remplacés pour des raisons économiques par des troupeaux de moutons de plusieurs
milliers de têtes passant une grande partie de l�année en estive. Le retour du loup, au début
des années 1990, s�est accompagné de dommages importants sur les troupeaux ovins (Poulle
et al. 2000). Ces dégâts ont été à l�origine d�intenses controverses à l�échelle locale puis
nationale (Poulle et al. 2000). Malgré la protection légale du canidé, il existe dans le droit
codifié français de nombreux archaïsmes qui s�opposent à la protection de l�espèce (Loubert-
Davaine 2004). Ces contradictions sont à l�origine d�un flou juridique du statut du prédateur,
qui alimente les conflits (Loubert-Davaine 2004).
La recolonisation du massif du Mercantour par le loup a donné naissance à un système
prédateur-proies complexe, dans lequel plusieurs espèces d�ongulés sauvages ainsi que des
ovins domestiques constituent des proies potentielles. L�augmentation générale des
populations d�ongulés sauvages observée ces dernières décennies a des retombées
économiques positives sur le tourisme et la chasse (Cugnasse 1995), mais est aussi source de
dégâts pour l�agriculture, la sylviculture, les usagers de la route (collisions), et peut être à
l�origine de problèmes sanitaires, comme aux Etats-Unis où les cerfs sont considérés comme
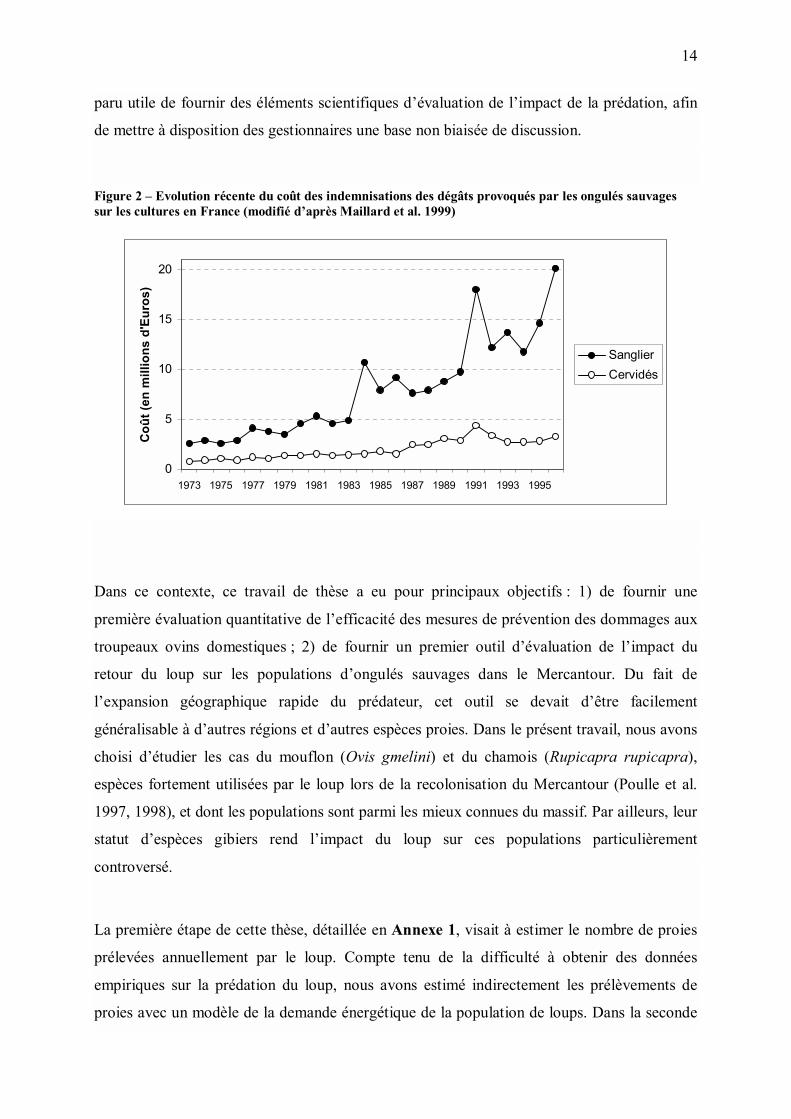
un réservoir pour la maladie de Lyme (Maillard et al. 1999). En France, l�impact des grands
herbivores sauvages sur le milieu forestier et sur les cultures est de plus en plus important
(Figure 2).
Principal prédateur des ongulés de l�hémisphère Nord, le loup est susceptible de limiter ou de
réguler leurs populations (Mech 1970). La recolonisation naturelle du prédateur dans des
régions où il avait été éradiqué rétablit donc un niveau trophique potentiellement important
pour le fonctionnement des écosystèmes. Cependant, l�impact du loup sur les populations
d�ongulés sauvages est controversé (Skogland 1991), dépendant non seulement de la
proportion de la population tuée, mais aussi de multiples autres facteurs dont la structure
d�âge des proies, les phénomènes densité-dépendants, ou le caractère plus ou moins
compensatoire de la mortalité due à la prédation. De plus, la perception de l�impact du loup
sur les populations de proies peut différer selon les groupes d�intérêt, alimentant les
controverses. Bien que peu de données soient à l�heure actuelle disponibles sur la
démographie des populations d�ongulés sauvages dans le massif du Mercantour, il a donc
14
paru utile de fournir des éléments scientifiques d�évaluation de l�impact de la prédation, afin
de mettre à disposition des gestionnaires une base non biaisée de discussion.
Figure 2 � Evolution récente du coût des indemnisations des dégâts provoqués par les ongulés sauvages sur les cultures en France (modifié d�après Maillard et al. 1999)
0
5
10
15
20
1973 1975 1977 1979 1981 1983 1985 1987 1989 1991 1993 1995
Coû
t (en
mill
ions
d'E
uros
)
SanglierCervidés
Dans ce contexte, ce travail de thèse a eu pour principaux objectifs : 1) de fournir une
première évaluation quantitative de l�efficacité des mesures de prévention des dommages aux
troupeaux ovins domestiques ; 2) de fournir un premier outil d�évaluation de l�impact du
retour du loup sur les populations d�ongulés sauvages dans le Mercantour. Du fait de
l�expansion géographique rapide du prédateur, cet outil se devait d�être facilement
généralisable à d�autres régions et d�autres espèces proies. Dans le présent travail, nous avons
choisi d�étudier les cas du mouflon (Ovis gmelini) et du chamois (Rupicapra rupicapra),
espèces fortement utilisées par le loup lors de la recolonisation du Mercantour (Poulle et al.
1997, 1998), et dont les populations sont parmi les mieux connues du massif. Par ailleurs, leur
statut d�espèces gibiers rend l�impact du loup sur ces populations particulièrement
controversé.
La première étape de cette thèse, détaillée en Annexe 1, visait à estimer le nombre de proies
prélevées annuellement par le loup. Compte tenu de la difficulté à obtenir des données
empiriques sur la prédation du loup, nous avons estimé indirectement les prélèvements de
proies avec un modèle de la demande énergétique de la population de loups. Dans la seconde
15
étape de ce travail, décrite en Annexe 2, nous avons intégré ces estimations des prélèvements
de proies avec des modèles de la dynamique des populations d�ongulés, pour estimer l�impact
de la prédation sur les populations de mouflons et de chamois. L�ensemble de ces modèles a
été paramétré selon des sources bibliographiques lorsque les données empiriques nécessaires
n�étaient pas disponibles, et nous avons étudié la façon dont les incertitudes dans les valeurs
des paramètres étaient transmises aux résultats des simulations. Nous avons par ailleurs
évalué la sensibilité des résultats de la modélisation aux différents paramètres des modèles,
afin de déterminer quelles devraient être les priorités de futures collectes de données de
terrain si l�objectif est d�affiner l�estimation de l�impact de la prédation.
En étant susceptibles d�agir sur le succès de capture des proies et les choix alimentaires du
loup, les défenses et les comportements anti-prédateurs des ongulés peuvent moduler l�impact
de la prédation. Dans la troisième partie de ce travail, détaillée en Annexe 3, nous avons
étudié le comportement de vigilance du chamois et du mouflon dans le Mercantour ainsi que
son évolution en présence du loup, et discuté la façon dont les variations observées de
vigilance pourraient avoir influencé l�utilisation de ces ongulés par le prédateur. Enfin, dans la
quatrième partie de ce travail, détaillée en Annexe 4, nous avons évalué l�effet de mesures de
protection, les chiens de protection et le parcage des troupeaux, sur l�utilisation des ongulés
domestiques par le loup dans le Mercantour. L�Annexe 5 présente la méthodologie utilisée
pour estimer le régime alimentaire du prédateur et les principaux résultats.
Ce mémoire est une discussion générale des résultats obtenus dans les différents volets que
nous venons de décrire. Suite à la présente introduction, la deuxième partie du mémoire est
une discussion de la saisonnalité des besoins énergétiques de la population de loups et de ses
conséquences. La troisième partie s�intéresse aux changements de vulnérabilité des proies
sauvages et domestiques suite au retour du loup, et discute les implications possibles de ces
changements. La quatrième partie concerne l�impact estimé de la prédation sur les populations
de chamois et de mouflon du Mercantour. Enfin, la cinquième partie du mémoire est une
conclusion générale, dans laquelle un scénario concernant l�évolution des interactions entre
loups et proies sauvages durant la recolonisation du Mercantour est proposé. Dans cette partie
sont aussi discutées la validité de notre approche, les implications de ce travail, et les futures
priorités de recherche si l�objectif est de préciser les résultats de cette étude.
16
II. CYCLE ANNUEL ET BESOINS ENERGETIQUES DU LOUP
Dans les écosystèmes, la saisonnalité de l�environnement abiotique (température,
ensoleillement�) induit une variation de la disponibilité des ressources pour les herbivores.
Les variations saisonnières de l�environnement peuvent donc avoir des conséquences sur les
interactions entre les ongulés et leurs prédateurs, par l�intermédiaire de modifications de la
physiologie et du comportement des proies (Sandvik et al. 2002). Ainsi, dans certaines
régions d�Afrique, le cycle annuel saison sèche/saison humide est à l�origine de fortes
variations saisonnières de la croissance végétale, qui induit chez certaines espèces d�ongulés
un comportement migratoire. De ce fait, les grands prédateurs territoriaux voient l�abondance
des ressources locales en nourritures varier fortement au cours de l�année dans cette région
(e.g., Schaller 1972). De même, dans le Nord du Canada, le caribou (Rangifer tarandus),
principale proie du loup, migre saisonnièrement entre des zones nordiques de mise bas, et des
régions d�hivernage plus au sud. Peu de ressources alternatives étant disponibles en l�absence
du caribou, les loups tendent à suivre les grands troupeaux de proies dans leurs déplacements
saisonniers (Calef 1995). Ces exemples illustrent les contraintes que peuvent subir les grands
prédateurs vivant en environnements saisonniers, qui leur imposent de modifier leur régime
alimentaire ou d�adopter des comportements migratoires lorsque la disponibilité locale des
proies principales diminue.
En parallèle à des changements de disponibilité de leurs ressources, les populations de grands
prédateurs peuvent voir leurs besoins énergétiques varier de façon saisonnière, en relation
avec le cycle de reproduction de l�espèce. Nous avons développé un modèle permettant
d�estimer la demande énergétique journalière d�une population stable de loup au cours d�une
année, en fonction de l�effectif de la population avant reproduction et de paramètres
biologiques et physiologiques de l�espèce (Annexe 1). Le modèle est basé sur la prise en
compte de différentes catégories d�individus dans la population, de différentes phases dans le
cycle annuel, et de différents types de besoins énergétiques. Ces éléments sont intégrés dans
une structure classique de modèle énergétique, couplant une description de la dynamique des
effectifs de loups avec un modèle de la demande énergétique individuelle (e.g., Furness 1978,
Philips et al. 1999, Stenson et al. 1997). Ce modèle a permis d�étudier les variations de la
demande énergétique de la population de loups dans le massif du Mercantour.
17
A. Une demande énergétique fortement saisonnière
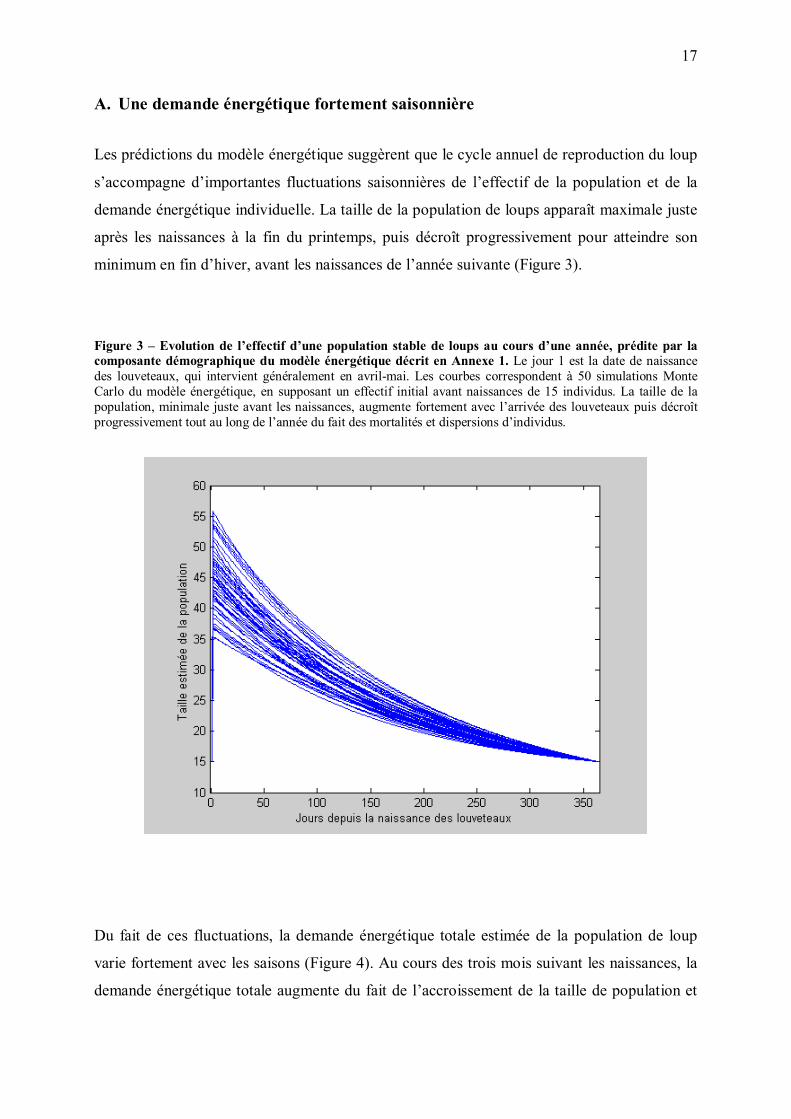
Les prédictions du modèle énergétique suggèrent que le cycle annuel de reproduction du loup
s�accompagne d�importantes fluctuations saisonnières de l�effectif de la population et de la
demande énergétique individuelle. La taille de la population de loups apparaît maximale juste
après les naissances à la fin du printemps, puis décroît progressivement pour atteindre son
minimum en fin d�hiver, avant les naissances de l�année suivante (Figure 3).
Figure 3 � Evolution de l�effectif d�une population stable de loups au cours d�une année, prédite par la composante démographique du modèle énergétique décrit en Annexe 1. Le jour 1 est la date de naissance des louveteaux, qui intervient généralement en avril-mai. Les courbes correspondent à 50 simulations Monte Carlo du modèle énergétique, en supposant un effectif initial avant naissances de 15 individus. La taille de la population, minimale juste avant les naissances, augmente fortement avec l�arrivée des louveteaux puis décroît progressivement tout au long de l�année du fait des mortalités et dispersions d�individus.
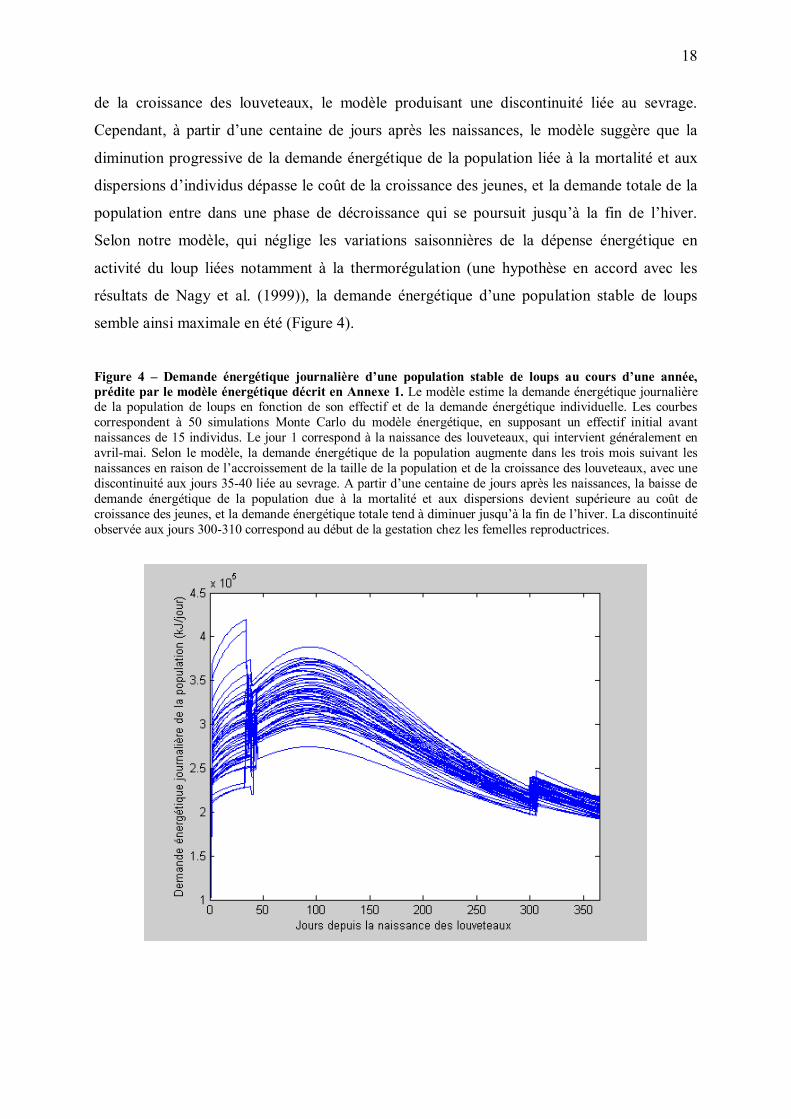
Du fait de ces fluctuations, la demande énergétique totale estimée de la population de loup
varie fortement avec les saisons (Figure 4). Au cours des trois mois suivant les naissances, la
demande énergétique totale augmente du fait de l�accroissement de la taille de population et
18
de la croissance des louveteaux, le modèle produisant une discontinuité liée au sevrage.
Cependant, à partir d�une centaine de jours après les naissances, le modèle suggère que la
diminution progressive de la demande énergétique de la population liée à la mortalité et aux
dispersions d�individus dépasse le coût de la croissance des jeunes, et la demande totale de la
population entre dans une phase de décroissance qui se poursuit jusqu�à la fin de l�hiver.
Selon notre modèle, qui néglige les variations saisonnières de la dépense énergétique en
activité du loup liées notamment à la thermorégulation (une hypothèse en accord avec les
résultats de Nagy et al. (1999)), la demande énergétique d�une population stable de loups
semble ainsi maximale en été (Figure 4).
Figure 4 � Demande énergétique journalière d�une population stable de loups au cours d�une année, prédite par le modèle énergétique décrit en Annexe 1. Le modèle estime la demande énergétique journalière de la population de loups en fonction de son effectif et de la demande énergétique individuelle. Les courbes correspondent à 50 simulations Monte Carlo du modèle énergétique, en supposant un effectif initial avant naissances de 15 individus. Le jour 1 correspond à la naissance des louveteaux, qui intervient généralement en avril-mai. Selon le modèle, la demande énergétique de la population augmente dans les trois mois suivant les naissances en raison de l�accroissement de la taille de la population et de la croissance des louveteaux, avec une discontinuité aux jours 35-40 liée au sevrage. A partir d�une centaine de jours après les naissances, la baisse de demande énergétique de la population due à la mortalité et aux dispersions devient supérieure au coût de croissance des jeunes, et la demande énergétique totale tend à diminuer jusqu�à la fin de l�hiver. La discontinuité observée aux jours 300-310 correspond au début de la gestation chez les femelles reproductrices.
19
B. Des ongulés sauvages particulièrement vulnérables en hiver
La condition physique des ongulés sauvages dépend notamment de leur efficacité dans la
recherche de nourriture, c'est-à-dire du rapport entre la quantité d�énergie ou de nutriments
absorbés et les dépenses énergétiques liées à l�alimentation (Parker et al. 1996). Dans les
régions où les hivers sont marqués, les ongulés voient leurs dépenses énergétiques augmenter
en cette saison, du fait de l�intensification de la thermorégulation et de l�augmentation du coût
des déplacements lorsque le sol est recouvert de neige. Simultanément, l�accès aux ressources
alimentaires est fortement réduit par la couverture neigeuse, et l�abondance des ressources
restées accessibles diminue progressivement au cours de l�hiver car les aliments consommés
ne sont pas remplacés du fait de l�arrêt saisonnier de la végétation. L�enneigement a donc
pour conséquences une diminution de l�apport nutritionnel par unité de temps (Turner et al.
1994) et une augmentation des dépenses énergétiques, qui se traduisent par une influence
négative majeure sur la condition des individus. Cet effet est si marqué que la consommation
de nourriture en hiver ne suffit généralement pas à combler les besoins énergétiques
hivernaux des ongulés dans les latitudes nordiques, et que ceux-ci doivent utiliser leurs
réserves corporelles et éventuellement réduire leur métabolisme par une hypothermie
ressemblant à une forme d�hibernation (Arnold et al. 2004). De ce fait, la masse corporelle
des ongulés dans les régions où les hivers sont marqués subit un cycle annuel durant lequel ils
gagnent du poids du printemps à l�automne, et en perdent en hiver (revue dans Mech et al.
1987). Il a été montré que, même lors d�hivers doux, 18 à 25% des besoins métaboliques
étaient comblés par les réserves corporelles chez le cerf à queue noire (Parker et al. 1999),
14% chez le caribou (Adamczewski et al. 1993), et 26% chez le renne du Svalbard (Tyler
1986). L�hiver constitue donc généralement un goulot d�étranglement énergétique pour les
grands herbivores en régions Nord-tempérées ou nordiques (Parker 2003, Potvin et al. 1981,
Dumont et al. 2000).
De fait, la mortalité des ongulés tend à augmenter avec le degré de sévérité de l�hiver
(Gonzalez and Crampe 2001, Potvin et al. 1981, Huggard 1993, Gese et al. 1996,
Jedrzejewski et al. 1992, Modafferi and Becker 1997), et on observe parfois des pics de
mortalité lors d�hivers particulièrement sévères (Okarma et al. 1995, Potvin et al. 1981,
Benoît Lequette, comm. pers. chez le mouflon dans le Mercantour), ou lors d�évènements de
pluie sur de la neige qui entraînent un gel de la surface du sol (Putkonen and Roe 2003). Alors
que les ongulés consomment progressivement des ressources qui ne se renouvellent pas, leur
20
degré de malnutrition tend à augmenter progressivement au cours de l�hiver (DelGiudice et al.
1991, 1994, 2001). C�est par conséquent en fin d�hiver que les ongulés des présentent la plus
mauvaise condition physique de l�année (Mech et al. 2001), ce qui explique par exemple la
mortalité maximale observée à la fin de l�hiver chez l�isard (Crampe et al. 2002) ou le cerf de
Virginie (DelGiucide et al. 2002).
Une mauvaise condition physique liée à un stress énergétique, en agissant sur la capacité de
fuite et de défense des individus, est un facteur direct évident de vulnérabilité à la prédation
en cas d�attaque (Gese et al. 1996). Une détérioration même modérée de la condition des
proies peut notamment conduire à une augmentation du temps qu�elles consacrent à la
recherche de nourriture, et de ce fait à une diminution de leur degré de vigilance (Bachman
1993). La prédation s�exerçant spontanément sur les proies les moins vigilantes (Fitzgibbon
1989, 1990, Illius and Fitzgibbon 1994), le succès de capture par les prédateurs augmente
probablement lorsque les ongulés subissent un stress alimentaire. En outre, chez les ongulés,
la présence de neige au sol pourrait être associée à une augmentation de l�effectif des groupes
(Jedrzejewski et al. 1992) ou au moins du degré d�agrégation des individus (Poszig and
Theberge 2000), induisant peut-être de ce fait une augmentation de la probabilité de rencontre
d�un prédateur (Hebblewhite and Pletscher 2002).
L�augmentation de la hauteur de neige au sol semble effectivement corrélée à une
augmentation de la fréquence des captures de proies, et à une diminution du taux de
consommation des carcasses par le loup (DelGiucide et al. 2002, Jedrzejewski et al. 2002,
Mech et al. 2001, Peterson and Allen 1974, Post et al. 1999, Boyd et al. 1994, Del Giudice
1998, Gese et al. 1996, Wilmers et al. 2003), suggérant que les ongulés deviennent plus
faciles à capturer. On observe notamment une augmentation de la prédation sur des individus
qui étaient d�autre part en bonne santé (Nelson and Mech 1986, Crête et Lemieux 1996,
Whitlaw et al. 1998, Post et al. 1999, Patterson and Messier 2000), et qui deviennent
accessibles aux prédateurs lorsqu�ils sont désavantagés par la couverture neigeuse (Patterson
and Messier 2003). En réponse à un accroissement de la hauteur de neige, les coyotes allouent
moins de temps aux déplacements et à la chasse (Gese at al. 1996), et les loups réduisent
l�amplitude de leurs déplacements (Fuller 1991), ce qui suggère que les proies deviennent
effectivement plus accessibles. La présence de neige au sol semble donc augmenter
l�efficacité des prédateurs (Post and Stenseth 1998, Post et al. 1999) en réduisant les distances
de recherche (Kunkel et al. 2004) et en augmentant la probabilité de succès des attaques
21
(Patterson and Messier 2000, Mech et al. 2001), ce qui leur permet d�économiser de l�énergie
en limitant leurs déplacements.
Ces éléments suggèrent donc que, dans le Mercantour, une région caractérisée par des hivers
marqués accompagnés d�un enneigement abondant, les ongulés sauvages pourraient être
particulièrement vulnérables à la prédation du loup en hiver. Cet élément, ainsi que la
prédiction par le modèle d�une demande énergétique du loup minimale en hiver, suggèrent
que la saison hivernale pourrait être relativement peu limitante du point de vue énergétique
pour la population de loups dans les conditions du Mercantour.
C. Une ressource saisonnière : les ongulés domestiques
Une ressource fortement saisonnière
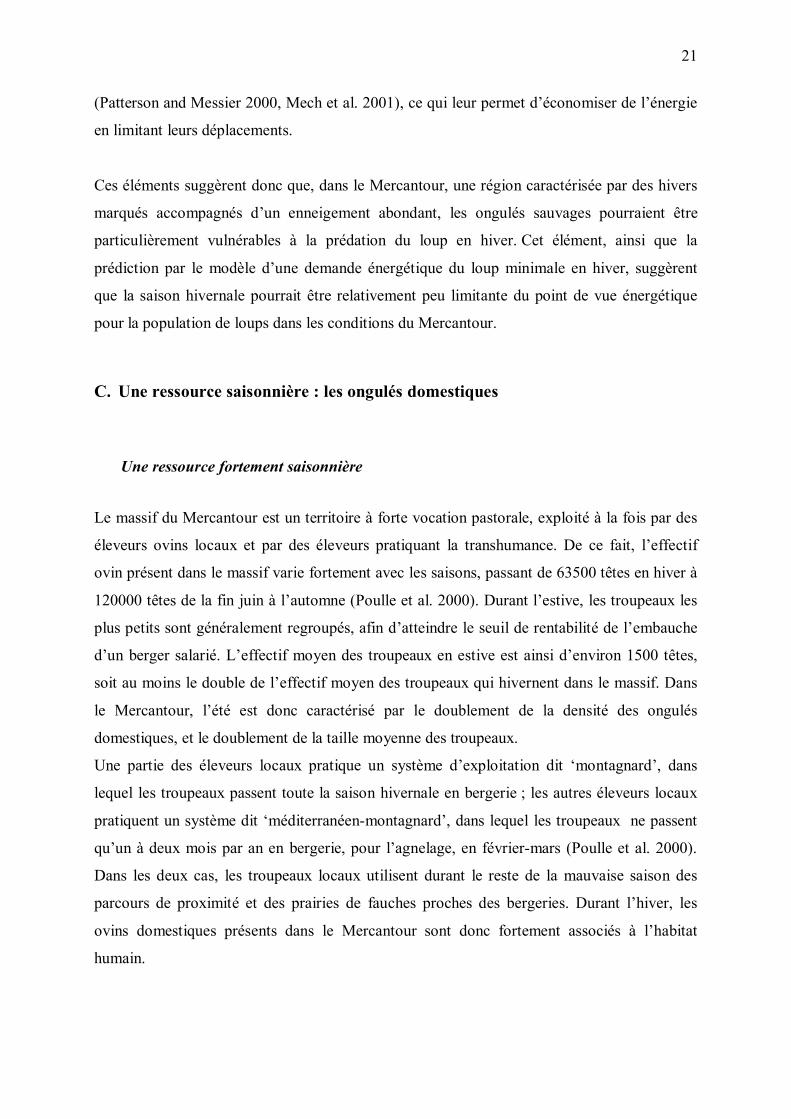
Le massif du Mercantour est un territoire à forte vocation pastorale, exploité à la fois par des
éleveurs ovins locaux et par des éleveurs pratiquant la transhumance. De ce fait, l�effectif
ovin présent dans le massif varie fortement avec les saisons, passant de 63500 têtes en hiver à
120000 têtes de la fin juin à l�automne (Poulle et al. 2000). Durant l�estive, les troupeaux les
plus petits sont généralement regroupés, afin d�atteindre le seuil de rentabilité de l�embauche
d�un berger salarié. L�effectif moyen des troupeaux en estive est ainsi d�environ 1500 têtes,
soit au moins le double de l�effectif moyen des troupeaux qui hivernent dans le massif. Dans
le Mercantour, l�été est donc caractérisé par le doublement de la densité des ongulés
domestiques, et le doublement de la taille moyenne des troupeaux.
Une partie des éleveurs locaux pratique un système d�exploitation dit �montagnard�, dans
lequel les troupeaux passent toute la saison hivernale en bergerie ; les autres éleveurs locaux
pratiquent un système dit �méditerranéen-montagnard�, dans lequel les troupeaux ne passent
qu�un à deux mois par an en bergerie, pour l�agnelage, en février-mars (Poulle et al. 2000).
Dans les deux cas, les troupeaux locaux utilisent durant le reste de la mauvaise saison des
parcours de proximité et des prairies de fauches proches des bergeries. Durant l�hiver, les
ovins domestiques présents dans le Mercantour sont donc fortement associés à l�habitat
humain.
22
Durant la période estivale, saison pour laquelle notre modèle des besoins énergétiques du loup
prédit une demande maximale, les ongulés domestiques sont ainsi à la fois plus abondants, et
probablement plus exposés à la prédation qu�en hiver (Figure 5). Ils ont par conséquent pu
constituer une ressource importante d�un point de vue énergétique pour la population de loups
au cours de la recolonisation du massif.
Figure 5 � Effectifs saisonniers approximatifs du cheptel ovin dans le Mercantour durant la période d�étude. Durant l�hiver, une partie du cheptel est gardé en bergerie, donc probablement inaccessible pour le prédateur.
0
50000
100000
150000
Hiver Eté
Effe
ctif
appr
oxim
atif
Conséquences immédiates sur la prédation des ongulés sauvages
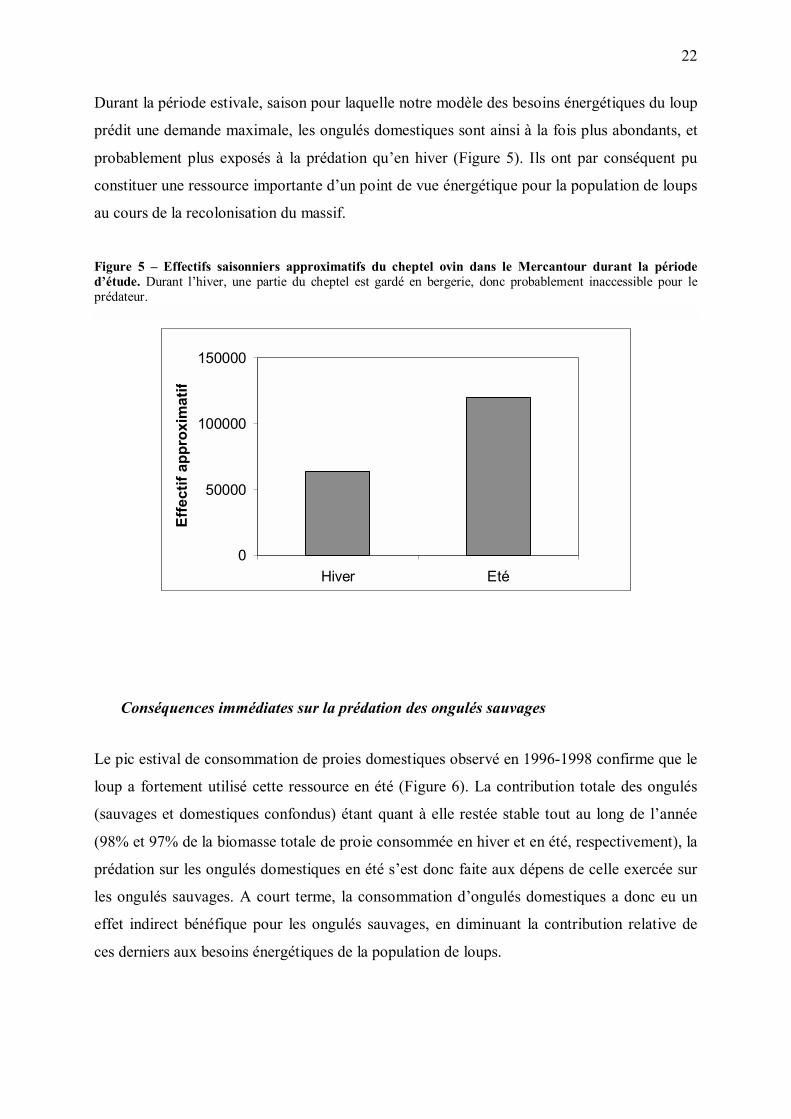
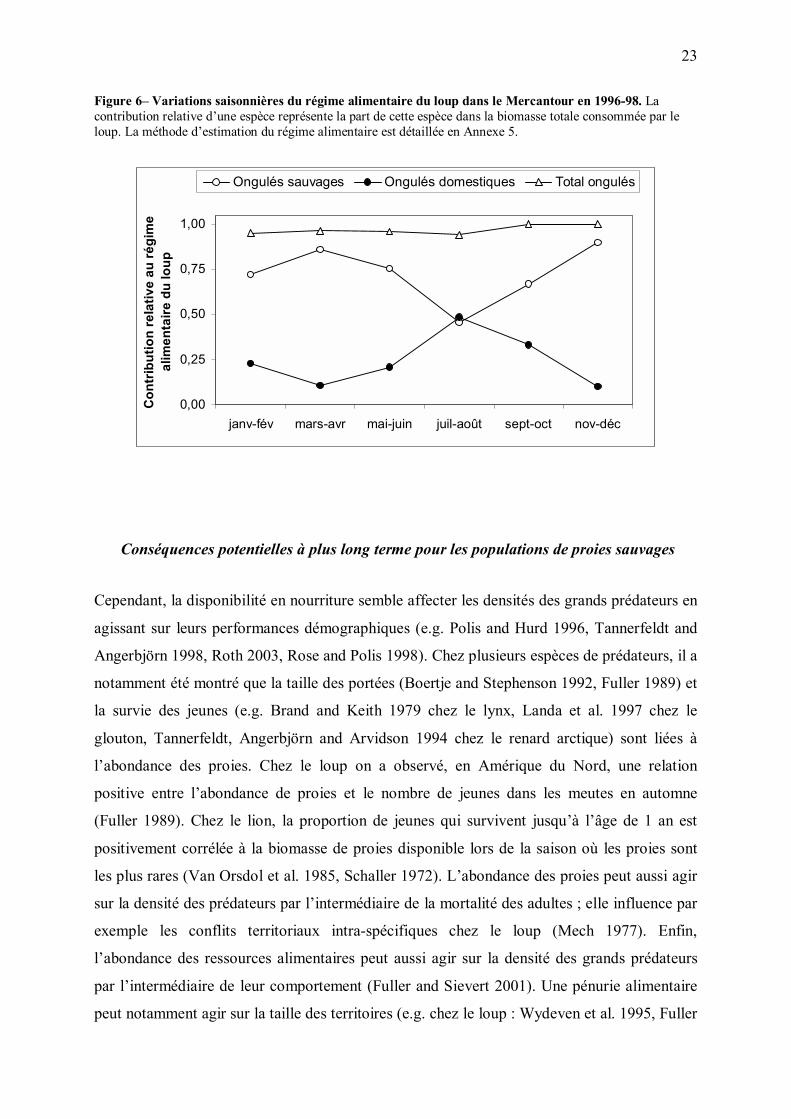
Le pic estival de consommation de proies domestiques observé en 1996-1998 confirme que le
loup a fortement utilisé cette ressource en été (Figure 6). La contribution totale des ongulés
(sauvages et domestiques confondus) étant quant à elle restée stable tout au long de l�année
(98% et 97% de la biomasse totale de proie consommée en hiver et en été, respectivement), la
prédation sur les ongulés domestiques en été s�est donc faite aux dépens de celle exercée sur
les ongulés sauvages. A court terme, la consommation d�ongulés domestiques a donc eu un
effet indirect bénéfique pour les ongulés sauvages, en diminuant la contribution relative de
ces derniers aux besoins énergétiques de la population de loups.
23
Figure 6� Variations saisonnières du régime alimentaire du loup dans le Mercantour en 1996-98. La contribution relative d�une espèce représente la part de cette espèce dans la biomasse totale consommée par le loup. La méthode d�estimation du régime alimentaire est détaillée en Annexe 5.
0,00
0,25
0,50
0,75
1,00
janv-fév mars-avr mai-juin juil-août sept-oct nov-déc
Con
trib
utio
n re
lativ
e au
régi
me
alim
enta
ire d
u lo
upOngulés sauvages Ongulés domestiques Total ongulés
Conséquences potentielles à plus long terme pour les populations de proies sauvages
Cependant, la disponibilité en nourriture semble affecter les densités des grands prédateurs en
agissant sur leurs performances démographiques (e.g. Polis and Hurd 1996, Tannerfeldt and
Angerbjörn 1998, Roth 2003, Rose and Polis 1998). Chez plusieurs espèces de prédateurs, il a
notamment été montré que la taille des portées (Boertje and Stephenson 1992, Fuller 1989) et
la survie des jeunes (e.g. Brand and Keith 1979 chez le lynx, Landa et al. 1997 chez le
glouton, Tannerfeldt, Angerbjörn and Arvidson 1994 chez le renard arctique) sont liées à
l�abondance des proies. Chez le loup on a observé, en Amérique du Nord, une relation
positive entre l�abondance de proies et le nombre de jeunes dans les meutes en automne
(Fuller 1989). Chez le lion, la proportion de jeunes qui survivent jusqu�à l�âge de 1 an est
positivement corrélée à la biomasse de proies disponible lors de la saison où les proies sont
les plus rares (Van Orsdol et al. 1985, Schaller 1972). L�abondance des proies peut aussi agir
sur la densité des prédateurs par l�intermédiaire de la mortalité des adultes ; elle influence par
exemple les conflits territoriaux intra-spécifiques chez le loup (Mech 1977). Enfin,
l�abondance des ressources alimentaires peut aussi agir sur la densité des grands prédateurs
par l�intermédiaire de leur comportement (Fuller and Sievert 2001). Une pénurie alimentaire
peut notamment agir sur la taille des territoires (e.g. chez le loup : Wydeven et al. 1995, Fuller
24
1989, chez le lynx : Ward and Krebs 1985, chez le lion : van Orsdol et al. 1985, chez les
mustélidés : Jedrzejewski et al. 1995, Norbury et al. 1998) ou augmenter le taux de dispersion
(e.g., chez le loup : Messier 1985, chez le lynx : Ward and Krebs 1985). Les individus en
dispersion ayant souvent un taux de reproduction plus faible et un taux de mortalité plus élevé
que les résidents, l�augmentation de leur proportion dans la population conduit à une
diminution de la densité de celle ci (Fuller and Sievert 2001).
Du fait de l�ensemble de ces mécanismes, on observe souvent une corrélation entre
l�abondance des grands carnivores et la biomasse de leurs proies à travers les aires de
répartition des prédateurs (voir revue dans Fuller et Sievert 2001. Chez le loup en Amérique
du Nord : Messier 1995, Forbes and Theberge 1996, Joly and Messier 2000). Au sein d�une
région donnée, on observe aussi une forte corrélation entre densité de carnivores et densités de
proies, la même année ou avec un décalage dans le temps (voir revue de Fuller et Sievert
2001). Bien qu�il n�y ait à l�heure actuelle pas de données à long terme disponibles dans le
Mercantour qui permettraient de déterminer s�il existe une relation entre effectif de loups et
abondance des ressources alimentaires, les éléments ci-dessus suggèrent que la limitation des
populations de loups par leurs ressources alimentaires est fréquente. Lorsque c�est le cas, la
taille de portée potentiellement importante et la grande flexibilité de l�effectif des meutes chez
le loup (Mech 1970) devraient permettre une réponse relativement rapide de la densité du
prédateur à des variations de disponibilité des proies.
Dans les écosystèmes terrestres, il est fréquent que la densité des consommateurs soit
influencée par des ressources saisonnières ou allochtones. Ainsi, les migrations saisonnières
de grands herbivores qui permettent le maintien de densités relativement élevées de grands
prédateurs dans certaines régions d�Afrique (Cooper 1990), ou l�apport de ressources marines
dans des écosystèmes terrestres (e.g. Polis et al. 1997, Rose and Polis 1998, Roth 2002, 2003),
sont des exemples typiques de subsides allochtones qui permettent au milieu de supporter de
grandes densités de consommateurs, affectant la dynamique et la structure des communautés
terrestres.
Puisque la demande énergétique de la population de loups dans le Mercantour est, selon notre
modèle, maximale en été, la disponibilité en proies durant cette saison pourrait être un facteur
important influençant la capacité d�accueil du milieu pour le loup. La présence d�une forte
abondance saisonnière d�ongulés domestiques a donc peut-être eu des conséquences positives
sur la dynamique de population du prédateur dans le Mercantour.
25
En supposant que la forte disponibilité estivale de proies domestiques ait pu induire un
découplage entre dynamique de population du loup et productivité locale en ongulés
sauvages, elle aurait par conséquent pu être un facteur indirect d�augmentation de la pression
de prédation sur les populations de proies sauvages. Ce type d�interaction indirecte, une forme
de « compétition apparente » (Holt 1977) entre ongulés sauvages et domestiques par le biais
de la densité de leur prédateur commun, est courant dans les communautés animales (Holt
1977). C�est ce type d�interactions indirectes entre espèces proies par l�intermédiaire d�un
prédateur commun qui est par exemple à l�origine des fluctuations cycliques parallèles entre
l�abondance de petits mammifères et le succès de reproduction de certaines espèces d�oiseaux
dans les communautés nordiques (Angelstam, Lindström and Widen 1984, Bêty et al. 2002).
Dans le Mercantour, la présence saisonnière d�ovins domestiques très vulnérables a donc pu
avoir, pour les populations d�ongulés sauvages, à la fois des conséquences positives à court
terme (diminution de la part des ongulés sauvages dans le régime alimentaire du loup), et des
conséquences négatives à plus long terme (par l�intermédiaire d�un effet positif sur la
dynamique de population du loup). L�existence de plusieurs types d�interactions indirectes
entre proies par le biais de leur prédateur commun est fréquente (e.g. Holt 1977, Holt and
Lawton 1994, Bêty et al. 2002), mais le résultat de ces effets antagonistes est difficile à
prédire (Abrams and Matsuda 1996). La collecte de données à long terme sur les populations
de loups et de proies pourrait à l�avenir permettre d�étudier la relation entre disponibilité en
proies et performances démographiques du prédateur dans le Mercantour.

26
III. LES PROIES FACE AU RISQUE DE PREDATION
La prédation peut affecter non seulement les effectifs de proies, mais aussi induire des
modifications adaptatives de leurs comportements, de leur physiologie ou de leurs traits
d�histoires de vie (voir la revue de Lima 1998a). La dynamique d�un système prédateur-proies
peut donc être fortement influencée par les interactions comportementales entre prédateur et
proies, liées notamment aux comportements d�évitement de la prédation par ces dernières.
A. Un cheptel domestique de moins en moins vulnérable
Bien que les moutons et les chèvres aient perdu une grande partie des comportements
antiprédateurs naturels des ongulés du fait de la domestication, le cheptel domestique peut
être protégé contre les prédateurs par des mesures mises en place par l�homme. En réponse
aux dommages occasionnés par le loup aux troupeaux domestiques dans le Mercantour, la
proportion de troupeaux regroupés ou parqués le soir et bénéficiant de la présence d�au moins
un chien de protection a fortement augmenté au cours de la recolonisation du massif par le
prédateur (Figure 7). Ces techniques ont permis une diminution significative des dommages
aux troupeaux (Annexe 4) lors de la recolonisation du massif du Mercantour par le loup
(Figure 8).
Figure 7 � Evolution de l�utilisation des chiens de protection et du regroupement ou parcage nocturne des troupeaux en estive dans le massif du Mercantour, 1994-2001. La proportion de troupeaux protégés a augmenté entre les estives 1994 et 2001 (nombre de troupeaux étudiés = 45).
0
0,1
0,2
0,3
0,4
0,5
0,6
0,7
0,8
0,9
estive1994
estive1995
estive1996
estive1997
estive1998
estive1999
estive2000
estive2001
Prop
ortio
n de
trou
peau
x
troupeaux regroupés avec aumoins 1 chientroupeaux parqués avec au moins1 chientroupeaux n'ayant qu'une seule ouaucune mesure de protection
27
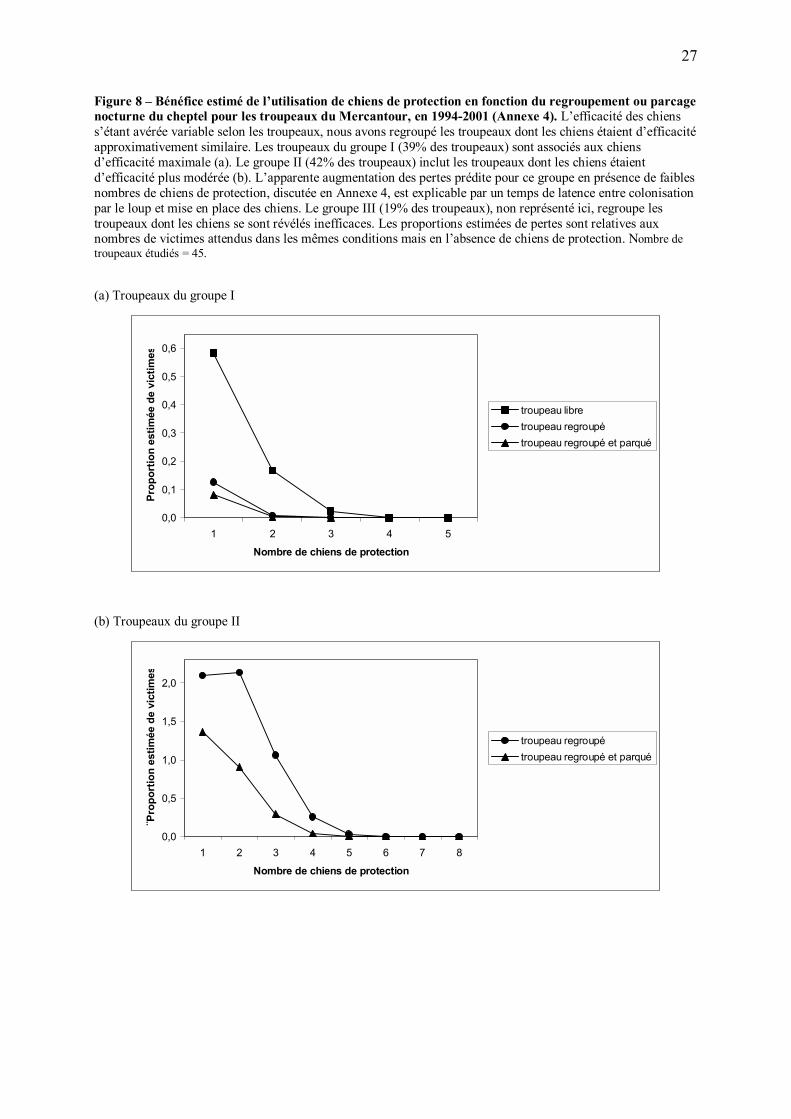
Figure 8 � Bénéfice estimé de l�utilisation de chiens de protection en fonction du regroupement ou parcage nocturne du cheptel pour les troupeaux du Mercantour, en 1994-2001 (Annexe 4). L�efficacité des chiens s�étant avérée variable selon les troupeaux, nous avons regroupé les troupeaux dont les chiens étaient d�efficacité approximativement similaire. Les troupeaux du groupe I (39% des troupeaux) sont associés aux chiens d�efficacité maximale (a). Le groupe II (42% des troupeaux) inclut les troupeaux dont les chiens étaient d�efficacité plus modérée (b). L�apparente augmentation des pertes prédite pour ce groupe en présence de faibles nombres de chiens de protection, discutée en Annexe 4, est explicable par un temps de latence entre colonisation par le loup et mise en place des chiens. Le groupe III (19% des troupeaux), non représenté ici, regroupe les troupeaux dont les chiens se sont révélés inefficaces. Les proportions estimées de pertes sont relatives aux nombres de victimes attendus dans les mêmes conditions mais en l�absence de chiens de protection. Nombre de troupeaux étudiés = 45. (a) Troupeaux du groupe I
0,0
0,1
0,2
0,3
0,4
0,5
0,6
1 2 3 4 5
Nombre de chiens de protection
Prop
ortio
n es
timée
de
vict
imes
troupeau libretroupeau regroupétroupeau regroupé et parqué
(b) Troupeaux du groupe II
0,0
0,5
1,0
1,5
2,0
1 2 3 4 5 6 7 8
Nombre de chiens de protection
¨Pro
port
ion
estim
ée d
e vi
ctim
es
troupeau regroupétroupeau regroupé et parqué
28
La profitabilité d�une espèce proie pour un prédateur, définie comme le rapport entre gain
énergétique net procuré par la consommation d�un individu et temps nécessaire à sa capture,
dépend notamment de sa masse corporelle, du taux de rencontre par le prédateur, et de sa
vulnérabilité. Selon les théories du régime alimentaire optimal (Stephen et Krebs 1986), la
stratégie optimale pour un prédateur est de parvenir au meilleur compromis entre gains
énergétiques et coûts d�acquisition de la nourriture, en sélectionnant les espèces proies les
plus profitables.
S�ils sont relativement peu coûteux à capturer par rapport aux proies sauvages, les ongulés
domestiques devraient constituer une ressource particulièrement profitable pour le loup. Selon
ce scénario, leur utilisation par le prédateur devrait alors notamment dépendre de leur
abondance, et on pourrait s�attendre dans ce cas à une forte augmentation de leur contribution
au régime alimentaire du loup en été, lorsque la densité du cheptel domestique double du fait
de la présence saisonnière des troupeaux transhumants.
Inversement, si les ongulés domestiques sont moins profitables que les proies sauvages du fait
d�un coût élevé de capture, on peut s�attendre à ce que le prédateur les utilise surtout lorsque
les proies sauvages sont rares ou inaccessibles. Dans ce cas, l�utilisation des proies
domestiques pourrait alors varier en fonction de l�abondance des proies sauvages. Sous ce
scénario, on peut par conséquent attendre une contribution relativement constante des ongulés
domestiques au régime alimentaire du loup au cours de l�année, puisque l�abondance de
proies sauvages varie probablement relativement peu avec les saisons dans le Mercantour par
rapport aux variations très importantes de disponibilité des ongulés domestiques.
Au cours de la période 1996-98, le doublement estival de l�abondance des ongulés
domestiques a coïncidé avec un pic de consommation de ces proies par le loup, reflétant une
consommation de proies domestiques approximativement deux fois plus importante en été que
le reste de l�année (Figure 6). Cette observation semblerait compatible avec le premier des
deux scénarios mentionnés ci-dessus, et suggèrerait donc que les ongulés domestiques étaient,
à cette période, moins coûteux à capturer et plus profitables que les proies sauvages pour le
loup.
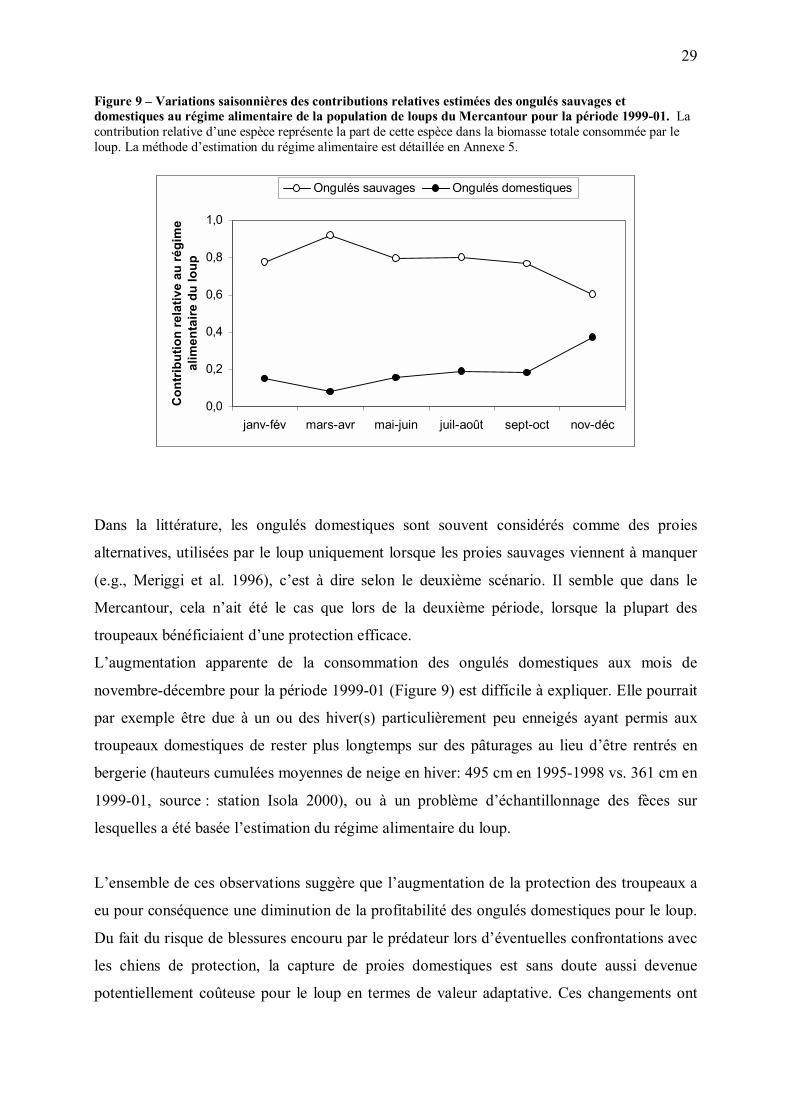
En 1999-01, le pic estival de consommation des proies domestique par le loup a disparu ; leur
consommation a semblé demeurer relativement stable au cours de l�année, malgré le
doublement estival de leur abondance (Figure 9). Cette utilisation approximativement
constante des proies domestiques semblerait plutôt compatible avec le second des deux
scénarios, suggérant que les ongulés domestiques ont pu, à cette période, devenir plus coûteux
à capturer et moins profitables que les ongulés sauvages pour le loup.
29
Figure 9 � Variations saisonnières des contributions relatives estimées des ongulés sauvages et domestiques au régime alimentaire de la population de loups du Mercantour pour la période 1999-01. La contribution relative d�une espèce représente la part de cette espèce dans la biomasse totale consommée par le loup. La méthode d�estimation du régime alimentaire est détaillée en Annexe 5.
0,0
0,2
0,4
0,6
0,8
1,0
janv-fév mars-avr mai-juin juil-août sept-oct nov-déc
Con
trib
utio
n re
lativ
e au
régi
me
alim
enta
ire d
u lo
upOngulés sauvages Ongulés domestiques
Dans la littérature, les ongulés domestiques sont souvent considérés comme des proies
alternatives, utilisées par le loup uniquement lorsque les proies sauvages viennent à manquer
(e.g., Meriggi et al. 1996), c�est à dire selon le deuxième scénario. Il semble que dans le
Mercantour, cela n�ait été le cas que lors de la deuxième période, lorsque la plupart des
troupeaux bénéficiaient d�une protection efficace.
L�augmentation apparente de la consommation des ongulés domestiques aux mois de
novembre-décembre pour la période 1999-01 (Figure 9) est difficile à expliquer. Elle pourrait
par exemple être due à un ou des hiver(s) particulièrement peu enneigés ayant permis aux
troupeaux domestiques de rester plus longtemps sur des pâturages au lieu d�être rentrés en
bergerie (hauteurs cumulées moyennes de neige en hiver: 495 cm en 1995-1998 vs. 361 cm en
1999-01, source : station Isola 2000), ou à un problème d�échantillonnage des fèces sur
lesquelles a été basée l�estimation du régime alimentaire du loup.
L�ensemble de ces observations suggère que l�augmentation de la protection des troupeaux a
eu pour conséquence une diminution de la profitabilité des ongulés domestiques pour le loup.
Du fait du risque de blessures encouru par le prédateur lors d�éventuelles confrontations avec
les chiens de protection, la capture de proies domestiques est sans doute aussi devenue
potentiellement coûteuse pour le loup en termes de valeur adaptative. Ces changements ont
30
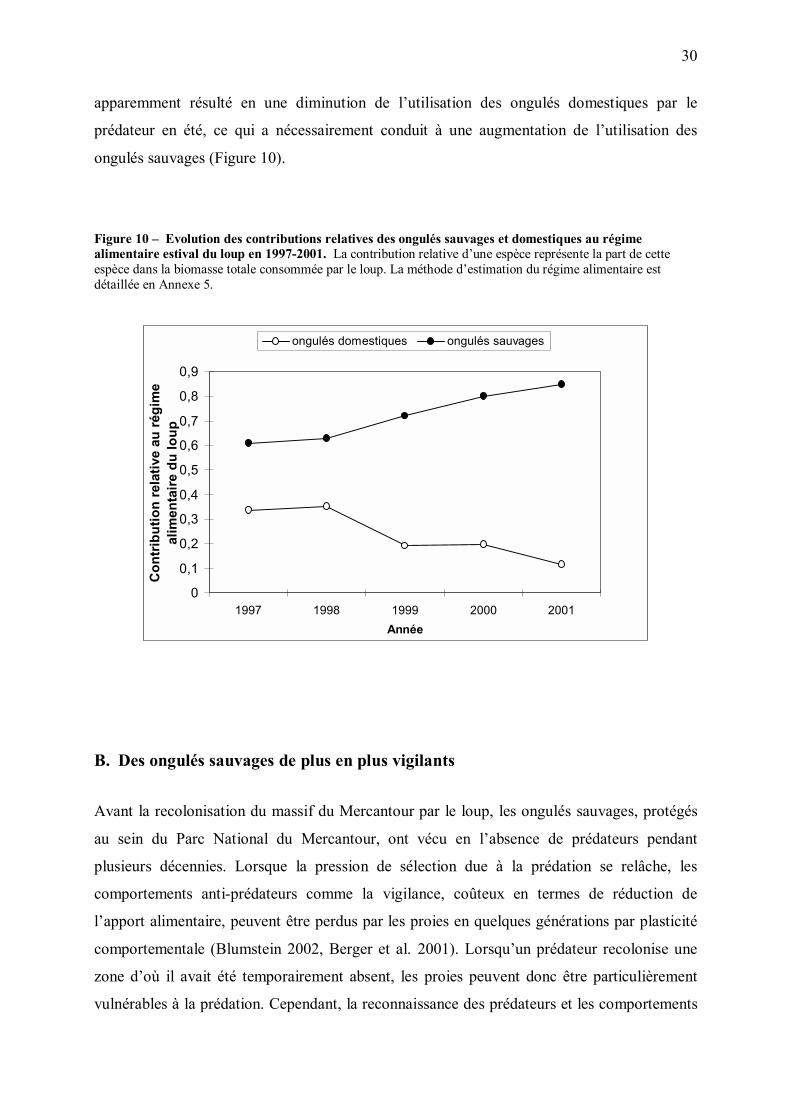
apparemment résulté en une diminution de l�utilisation des ongulés domestiques par le
prédateur en été, ce qui a nécessairement conduit à une augmentation de l�utilisation des
ongulés sauvages (Figure 10).
Figure 10 � Evolution des contributions relatives des ongulés sauvages et domestiques au régime alimentaire estival du loup en 1997-2001. La contribution relative d�une espèce représente la part de cette espèce dans la biomasse totale consommée par le loup. La méthode d�estimation du régime alimentaire est détaillée en Annexe 5.
0
0,1
0,2
0,3
0,4
0,5
0,6
0,7
0,8
0,9
1997 1998 1999 2000 2001Année
Con
trib
utio
n re
lativ
e au
régi
me
alim
enta
ire d
u lo
up
ongulés domestiques ongulés sauvages
B. Des ongulés sauvages de plus en plus vigilants
Avant la recolonisation du massif du Mercantour par le loup, les ongulés sauvages, protégés
au sein du Parc National du Mercantour, ont vécu en l�absence de prédateurs pendant
plusieurs décennies. Lorsque la pression de sélection due à la prédation se relâche, les
comportements anti-prédateurs comme la vigilance, coûteux en termes de réduction de
l�apport alimentaire, peuvent être perdus par les proies en quelques générations par plasticité
comportementale (Blumstein 2002, Berger et al. 2001). Lorsqu�un prédateur recolonise une
zone d�où il avait été temporairement absent, les proies peuvent donc être particulièrement
vulnérables à la prédation. Cependant, la reconnaissance des prédateurs et les comportements
31
anti-prédateurs peuvent se développer avec l�expérience (Griffin et al. 2000), surtout chez les
mammifères, qui ont des capacités cognitives complexes leur permettant de s�adapter aux
changements des caractéristiques de leur environnement (McLean et al. 1996). Lorsque des
proies qui étaient isolées de leurs prédateurs entrent à nouveau en contact avec eux, les
comportements antiprédateurs peuvent donc être rapidement retrouvés (Blumstein 2002),
parfois même en une seule génération (Berger et al. 2001).
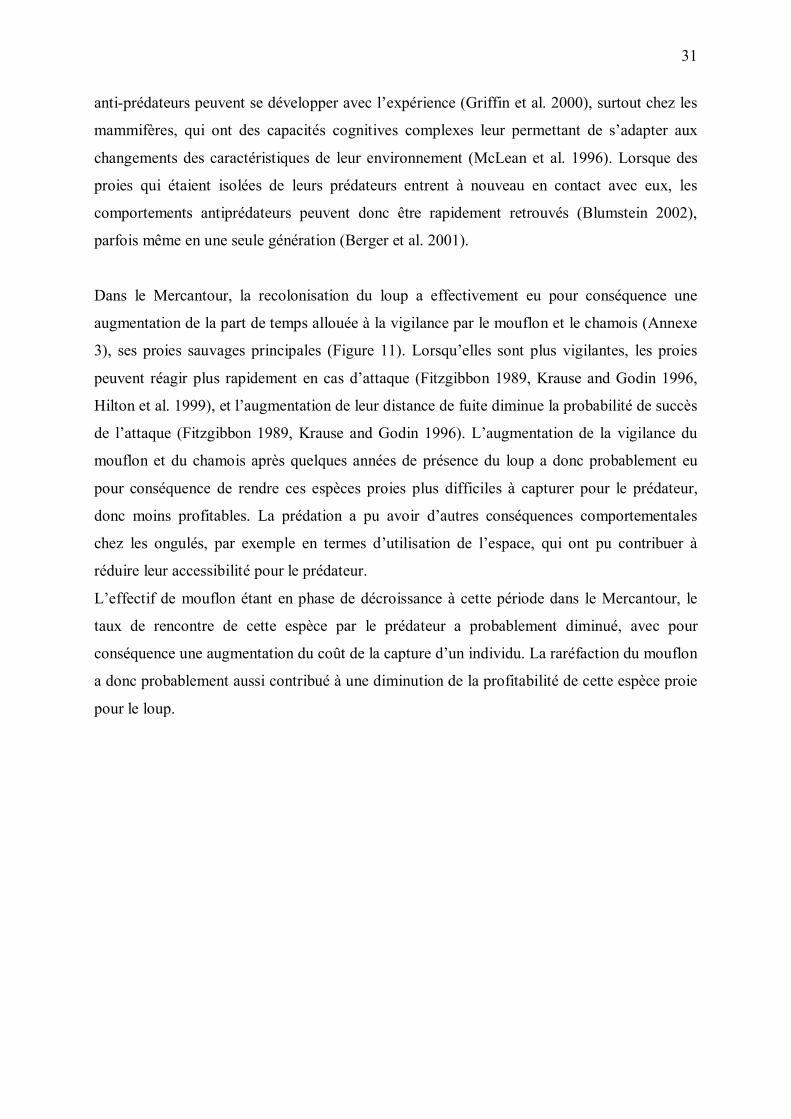
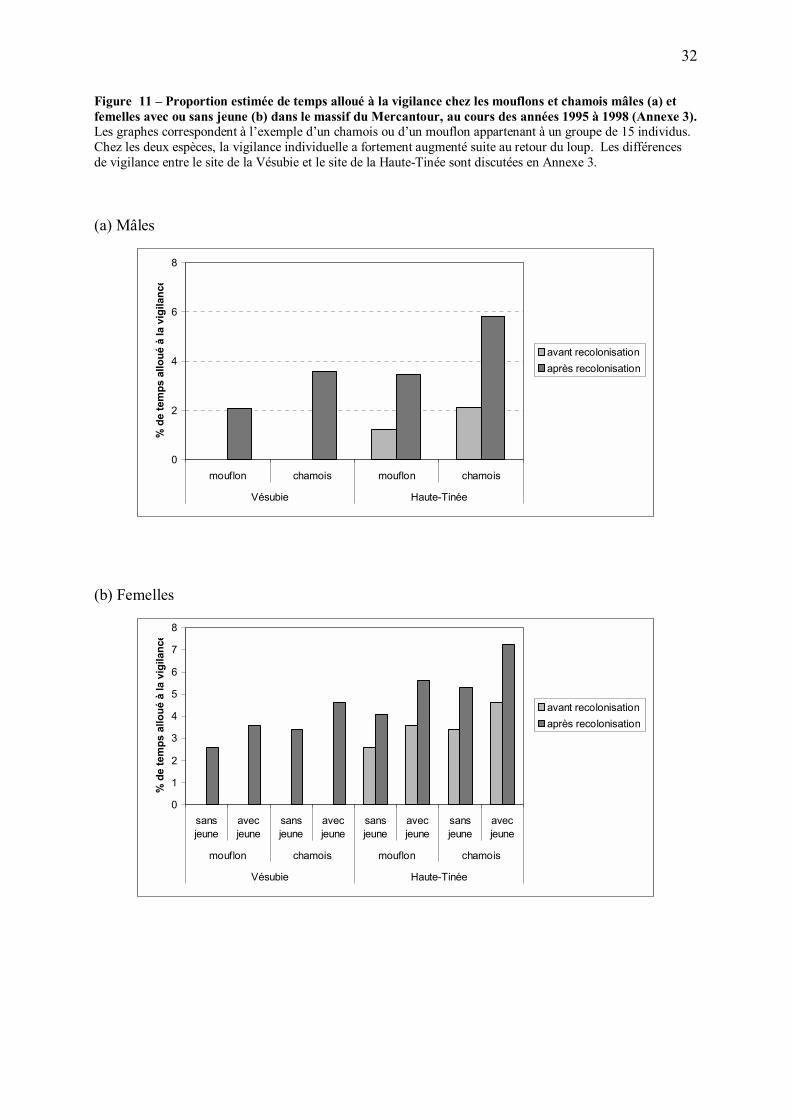
Dans le Mercantour, la recolonisation du loup a effectivement eu pour conséquence une
augmentation de la part de temps allouée à la vigilance par le mouflon et le chamois (Annexe
3), ses proies sauvages principales (Figure 11). Lorsqu�elles sont plus vigilantes, les proies
peuvent réagir plus rapidement en cas d�attaque (Fitzgibbon 1989, Krause and Godin 1996,
Hilton et al. 1999), et l�augmentation de leur distance de fuite diminue la probabilité de succès
de l�attaque (Fitzgibbon 1989, Krause and Godin 1996). L�augmentation de la vigilance du
mouflon et du chamois après quelques années de présence du loup a donc probablement eu
pour conséquence de rendre ces espèces proies plus difficiles à capturer pour le prédateur,
donc moins profitables. La prédation a pu avoir d�autres conséquences comportementales
chez les ongulés, par exemple en termes d�utilisation de l�espace, qui ont pu contribuer à
réduire leur accessibilité pour le prédateur.
L�effectif de mouflon étant en phase de décroissance à cette période dans le Mercantour, le
taux de rencontre de cette espèce par le prédateur a probablement diminué, avec pour
conséquence une augmentation du coût de la capture d�un individu. La raréfaction du mouflon
a donc probablement aussi contribué à une diminution de la profitabilité de cette espèce proie
pour le loup.
32
Figure 11 � Proportion estimée de temps alloué à la vigilance chez les mouflons et chamois mâles (a) et femelles avec ou sans jeune (b) dans le massif du Mercantour, au cours des années 1995 à 1998 (Annexe 3). Les graphes correspondent à l�exemple d�un chamois ou d�un mouflon appartenant à un groupe de 15 individus. Chez les deux espèces, la vigilance individuelle a fortement augmenté suite au retour du loup. Les différences de vigilance entre le site de la Vésubie et le site de la Haute-Tinée sont discutées en Annexe 3.
(a) Mâles
0
2
4
6
8
mouflon chamois mouflon chamois
Vésubie Haute-Tinée
% d
e te
mps
allo
ué à
la v
igila
nce
avant recolonisationaprès recolonisation
(b) Femelles
0
1
2
3
4
5
6
7
8
sansjeune
avecjeune
sansjeune
avecjeune
sansjeune
avecjeune
sansjeune
avecjeune
mouflon chamois mouflon chamois
Vésubie Haute-Tinée
% d
e te
mps
allo
ué à
la v
igila
nce
avant recolonisationaprès recolonisation
33
C. Conséquences potentielles d�une diminution de vulnérabilité des proies
Un bilan énergétique plus difficile à boucler pour le loup ?
Alors que les ongulés domestiques devenaient moins accessibles du fait de la protection des
troupeaux par l�homme, les principales espèces proies sauvages utilisées par le loup, mouflon
et chamois, sont probablement elles aussi devenues plus difficiles à capturer du fait de leur
vigilance accrue. Après quelques années de présence dans le Mercantour, la population de
loups a par conséquent peut-être rencontré de plus grandes difficultés pour boucler son bilan
énergétique annuel, du fait d�une diminution de profitabilité de ses proies principales.
Une prédation plus opportuniste
Selon les théories du régime alimentaire optimal, une diminution de profitabilité des proies
principales devrait conduire à une augmentation de l�opportunisme du prédateur, se traduisant
par une diminution de sélectivité et l�inclusion progressive dans le régime alimentaire de
nouvelles espèces proies (Stephen et Krebs 1986). Cette prédiction a été vérifiée dans de
nombreux systèmes (Perry and Pianka 1997). Dans le Mercantour, on a effectivement
constaté une diminution du degré de sélectivité du loup pour le mouflon (voir partie IV du
mémoire), alors que l�effectif de cette espèce proie régressait et que les survivants devenaient
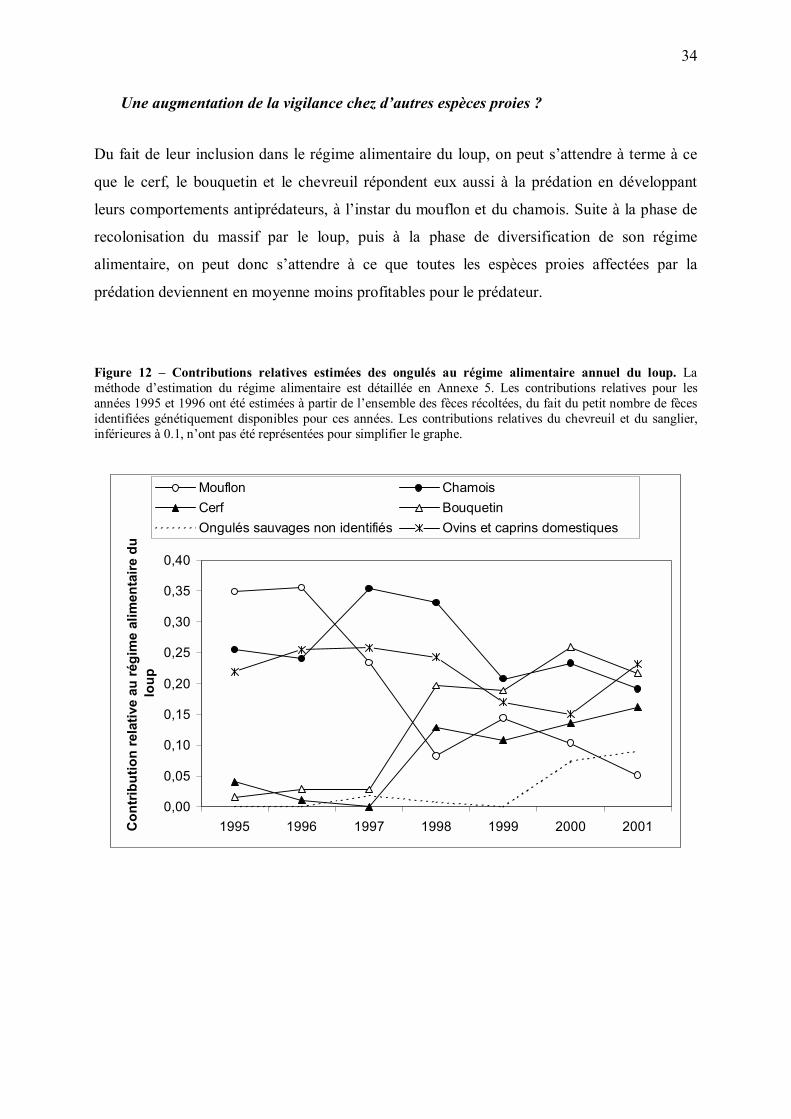
plus vigilants. La contribution d�autres espèces, notamment le cerf (Cervus elaphus) et le
bouquetin (Capra ibex), au régime alimentaire du loup semble avoir augmenté à partir de
1998-99 (Figure 12). L�augmentation de la contribution du cerf est sans doute partiellement
due à la colonisation progressive par le loup de zones où la densité de cet ongulé est
supérieure à celle des zones initialement colonisées. D�autre part, une forte consommation de
bouquetins par le loup semble surprenante (J.M Gaillard, comm. pers.), et ce résultat pourrait
avoir été en partie induit par des difficultés d�identification spécifique des poils de cette
espèce dans les fèces de loups (C. Duchamp, comm. pers.). Néanmoins, la diversification
apparente du régime alimentaire du loup après quelques années de recolonisation serait en
accord avec l�hypothèse d�une augmentation de la difficulté pour la population de loups à
boucler son bilan énergétique.
34
Une augmentation de la vigilance chez d�autres espèces proies ?
Du fait de leur inclusion dans le régime alimentaire du loup, on peut s�attendre à terme à ce
que le cerf, le bouquetin et le chevreuil répondent eux aussi à la prédation en développant
leurs comportements antiprédateurs, à l�instar du mouflon et du chamois. Suite à la phase de
recolonisation du massif par le loup, puis à la phase de diversification de son régime
alimentaire, on peut donc s�attendre à ce que toutes les espèces proies affectées par la
prédation deviennent en moyenne moins profitables pour le prédateur.
Figure 12 � Contributions relatives estimées des ongulés au régime alimentaire annuel du loup. La méthode d�estimation du régime alimentaire est détaillée en Annexe 5. Les contributions relatives pour les années 1995 et 1996 ont été estimées à partir de l�ensemble des fèces récoltées, du fait du petit nombre de fèces identifiées génétiquement disponibles pour ces années. Les contributions relatives du chevreuil et du sanglier, inférieures à 0.1, n�ont pas été représentées pour simplifier le graphe.
0,00
0,05
0,10
0,15
0,20
0,25
0,30
0,35
0,40
1995 1996 1997 1998 1999 2000 2001Con
trib
utio
n re
lativ
e au
régi
me
alim
enta
ire d
u lo
up
Mouflon ChamoisCerf BouquetinOngulés sauvages non identifiés Ovins et caprins domestiques
35
Une diminution de la capacité d�accueil du milieu pour le loup ?
Comme discuté plus haut, les restrictions alimentaires peuvent avoir des conséquences sur la
démographie de la population de loups, par exemple par l�intermédiaire d�une diminution de
la survie des jeunes (e.g., Brand and Keith 1979 chez le lynx, Landa et al. 1997 chez le
glouton, Tannerfeldt, Angerbjörn and Arvidson 1994 chez le renard arctique, Schaller 1972
chez le lion), d�une augmentation de la mortalité des adultes par conflits intra-spécifiques, ou
d�une augmentation de la taille des territoires et de la dispersion. Dans le Mercantour, la
protection accrue des troupeaux domestiques et une augmentation de la vigilance des proies
sauvages pourraient de ce fait avoir des conséquences sur la démographie de la population de
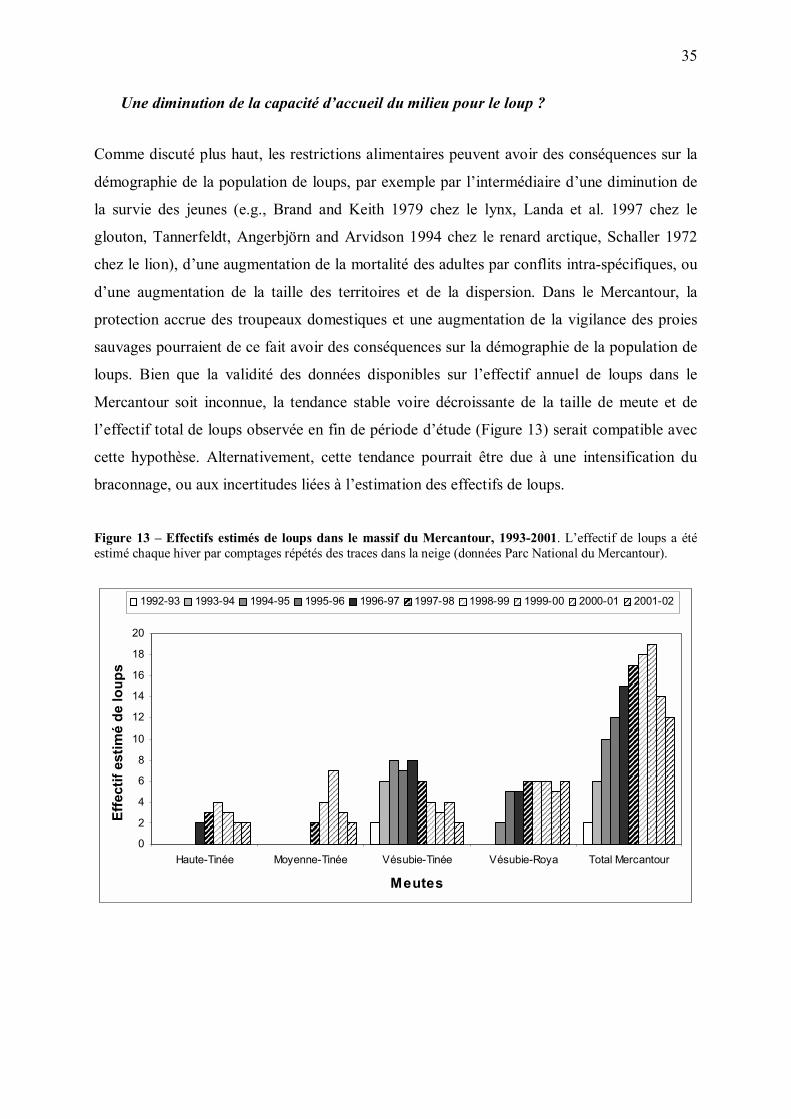
loups. Bien que la validité des données disponibles sur l�effectif annuel de loups dans le
Mercantour soit inconnue, la tendance stable voire décroissante de la taille de meute et de
l�effectif total de loups observée en fin de période d�étude (Figure 13) serait compatible avec
cette hypothèse. Alternativement, cette tendance pourrait être due à une intensification du
braconnage, ou aux incertitudes liées à l�estimation des effectifs de loups.
Figure 13 � Effectifs estimés de loups dans le massif du Mercantour, 1993-2001. L�effectif de loups a été estimé chaque hiver par comptages répétés des traces dans la neige (données Parc National du Mercantour).
0
2
4
6
8
10
12
14
16
18
20
Haute-Tinée Moyenne-Tinée Vésubie-Tinée Vésubie-Roya Total Mercantour
Meutes
Effe
ctif
estim
é de
loup
s
1992-93 1993-94 1994-95 1995-96 1996-97 1997-98 1998-99 1999-00 2000-01 2001-02
36
IV. IMPACT DE LA PREDATION SUR LES POPULATIONS DE
MOUFLONS ET DE CHAMOIS
Bien que la relation entre régime alimentaire du loup et prédation ne soit pas directe, l�analyse
d�élasticité du modèle énergétique (Annexe 1) a mis en évidence que toute variation de
l�effectif de loups ou du régime alimentaire du prédateur a une forte influence sur le nombre
estimé de proies tuées par an. Nous avons donc étudié les conséquences des variations
observées de ces paramètres entre 1993 et 2001 sur les taux de croissance des populations de
mouflons et de chamois. Nous avons pour cela couplé les estimations du modèle énergétique
avec des modèles matriciels des populations de proies (Annexe 2).
Les données disponibles concernant ces populations consistent en des dénombrements menés
à intervalles de deux à cinq ans par le Parc national du Mercantour depuis sa création. Ce type
de dénombrements sous-estimant généralement de façon importante les effectifs réels
d�ongulés (Gaillard et al. 2003), nous avons estimé un facteur de correction des effectifs
comptés de mouflons et de chamois. Cette approche est délicate car les taux de sous-
estimation des effectifs peuvent varier avec la densité des populations (Gaillard et al. 2003),
mais elle fournit néanmoins une première base de travail concernant les effectifs de proies.
Solomon (1949) a séparé la réponse des prédateurs à la densité de leurs ressources en deux
composantes. La première, appelée réponse fonctionnelle, décrit la façon dont le taux de
consommation d�un prédateur individuel change avec la densité de proies. La seconde
composante, appelée réponse numérique du prédateur, décrit la façon dont l�abondance du
prédateur change avec la densité de proies. La réponse totale du prédateur, c'est-à-dire la
variation du taux de prédation en fonction de l�abondance de proies, est le produit de la
réponse fonctionnelle et de la réponse numérique. Cette approche est classiquement utilisée
pour étudier les interactions entre prédateurs et proies.
Cependant, la présente étude porte sur une période très particulière, correspondant à la
recolonisation progressive d�une région par un prédateur. La variation observée de l�effectif
de loups entre 1993 et 2001 est donc largement liée au processus de recolonisation, et ne peut
par conséquent pas être utilisée pour évaluer la réponse numérique du prédateur à l�abondance
de proies. De plus, du fait de la forte augmentation de la vigilance des ongulés associée au
37
retour du loup, la relation observée entre 1993 et 2001 entre nombre de proies
prélevées/loup/an et effectif de proies n�est probablement pas représentative de la réponse
fonctionnelle du prédateur à l�abondance de proies dans d�autres circonstances.
Dans la présente étude, nous avons donc choisi d�étudier seulement la façon dont le nombre
de mouflons et de chamois tués par loup par an, ainsi que les taux de prédation et les taux de
croissance de ces populations d�ongulés ont varié avec les années. Nous avons ensuite discuté
ces variations à la lumière des changements d�abondance et de vulnérabilité des proies au
cours de la recolonisation du massif.
A. Mouflon
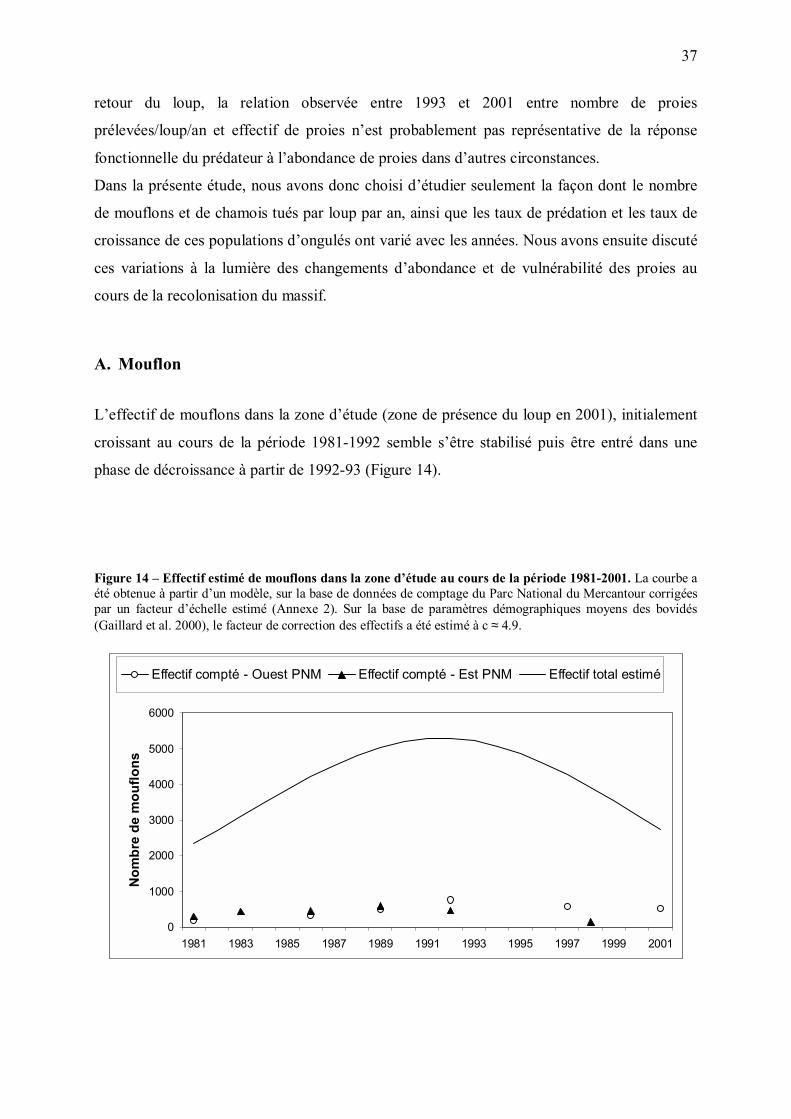
L�effectif de mouflons dans la zone d�étude (zone de présence du loup en 2001), initialement
croissant au cours de la période 1981-1992 semble s�être stabilisé puis être entré dans une
phase de décroissance à partir de 1992-93 (Figure 14).
Figure 14 � Effectif estimé de mouflons dans la zone d�étude au cours de la période 1981-2001. La courbe a été obtenue à partir d�un modèle, sur la base de données de comptage du Parc National du Mercantour corrigées par un facteur d�échelle estimé (Annexe 2). Sur la base de paramètres démographiques moyens des bovidés (Gaillard et al. 2000), le facteur de correction des effectifs a été estimé à c ≈ 4.9.
0
1000
2000
3000
4000
5000
6000
1981 1983 1985 1987 1989 1991 1993 1995 1997 1999 2001
Nom
bre
de m
ouflo
ns
Effectif compté - Ouest PNM Effectif compté - Est PNM Effectif total estimé
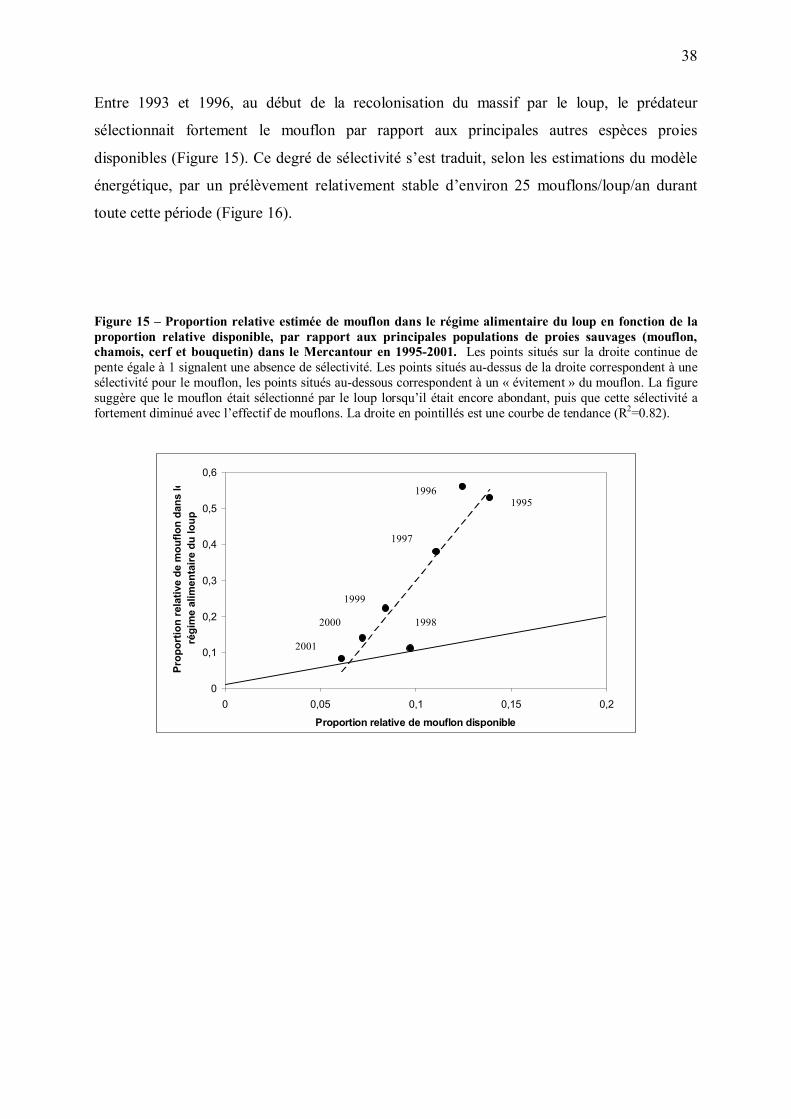
38
Entre 1993 et 1996, au début de la recolonisation du massif par le loup, le prédateur
sélectionnait fortement le mouflon par rapport aux principales autres espèces proies
disponibles (Figure 15). Ce degré de sélectivité s�est traduit, selon les estimations du modèle
énergétique, par un prélèvement relativement stable d�environ 25 mouflons/loup/an durant
toute cette période (Figure 16).
Figure 15 � Proportion relative estimée de mouflon dans le régime alimentaire du loup en fonction de la proportion relative disponible, par rapport aux principales populations de proies sauvages (mouflon, chamois, cerf et bouquetin) dans le Mercantour en 1995-2001. Les points situés sur la droite continue de pente égale à 1 signalent une absence de sélectivité. Les points situés au-dessus de la droite correspondent à une sélectivité pour le mouflon, les points situés au-dessous correspondent à un « évitement » du mouflon. La figure suggère que le mouflon était sélectionné par le loup lorsqu�il était encore abondant, puis que cette sélectivité a fortement diminué avec l�effectif de mouflons. La droite en pointillés est une courbe de tendance (R2=0.82).
0
0,1
0,2
0,3
0,4
0,5
0,6
0 0,05 0,1 0,15 0,2
Proportion relative de mouflon disponible
Prop
ortio
n re
lativ
e de
mou
flon
dans
leré
gim
e al
imen
taire
du
loup
2001
2000
1999
1998
1997
1996 1995
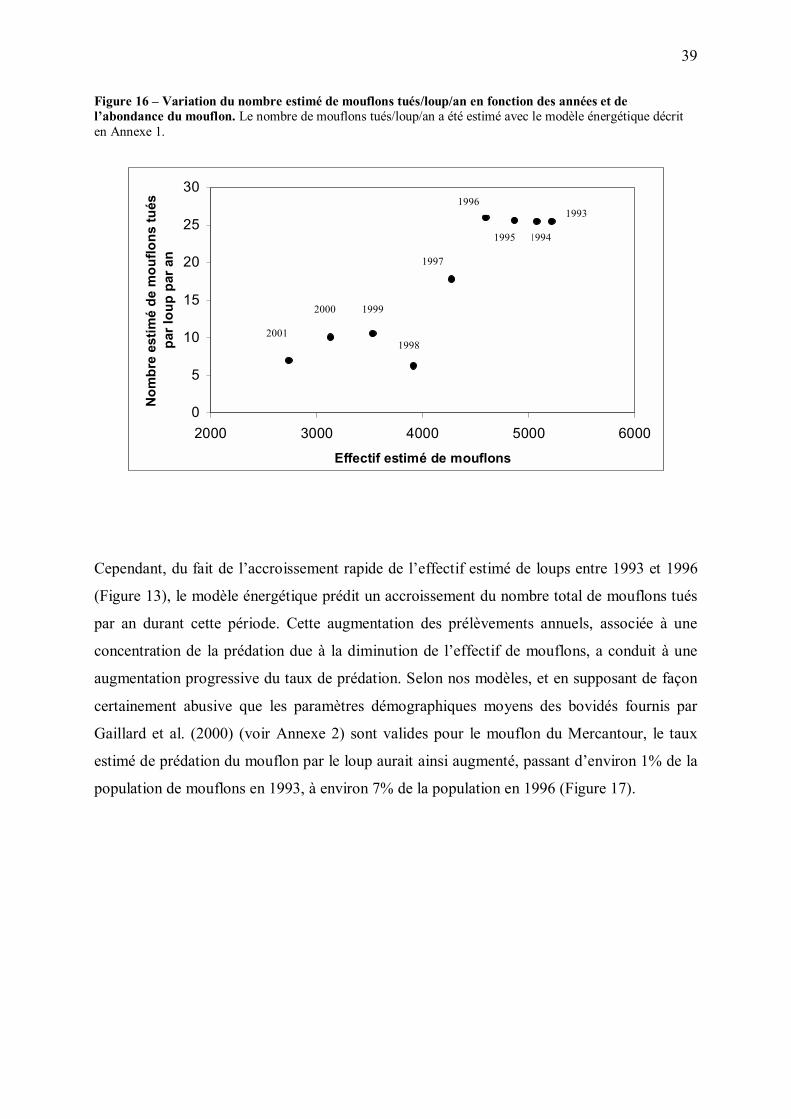
39
Figure 16 � Variation du nombre estimé de mouflons tués/loup/an en fonction des années et de l�abondance du mouflon. Le nombre de mouflons tués/loup/an a été estimé avec le modèle énergétique décrit en Annexe 1.
0
5
10
15
20
25
30
2000 3000 4000 5000 6000
Effectif estimé de mouflons
Nom
bre
estim
é de
mou
flons
tués
pa
r lou
p pa
r an
Cependant, du fait de l�accroissement rapide de l�effectif estimé de loups entre 1993 et 1996
(Figure 13), le modèle énergétique prédit un accroissement du nombre total de mouflons tués
par an durant cette période. Cette augmentation des prélèvements annuels, associée à une
concentration de la prédation due à la diminution de l�effectif de mouflons, a conduit à une
augmentation progressive du taux de prédation. Selon nos modèles, et en supposant de façon
certainement abusive que les paramètres démographiques moyens des bovidés fournis par
Gaillard et al. (2000) (voir Annexe 2) sont valides pour le mouflon du Mercantour, le taux
estimé de prédation du mouflon par le loup aurait ainsi augmenté, passant d�environ 1% de la
population de mouflons en 1993, à environ 7% de la population en 1996 (Figure 17).
1993
1994 1995
1996
1997
1998
1999 2000
2001
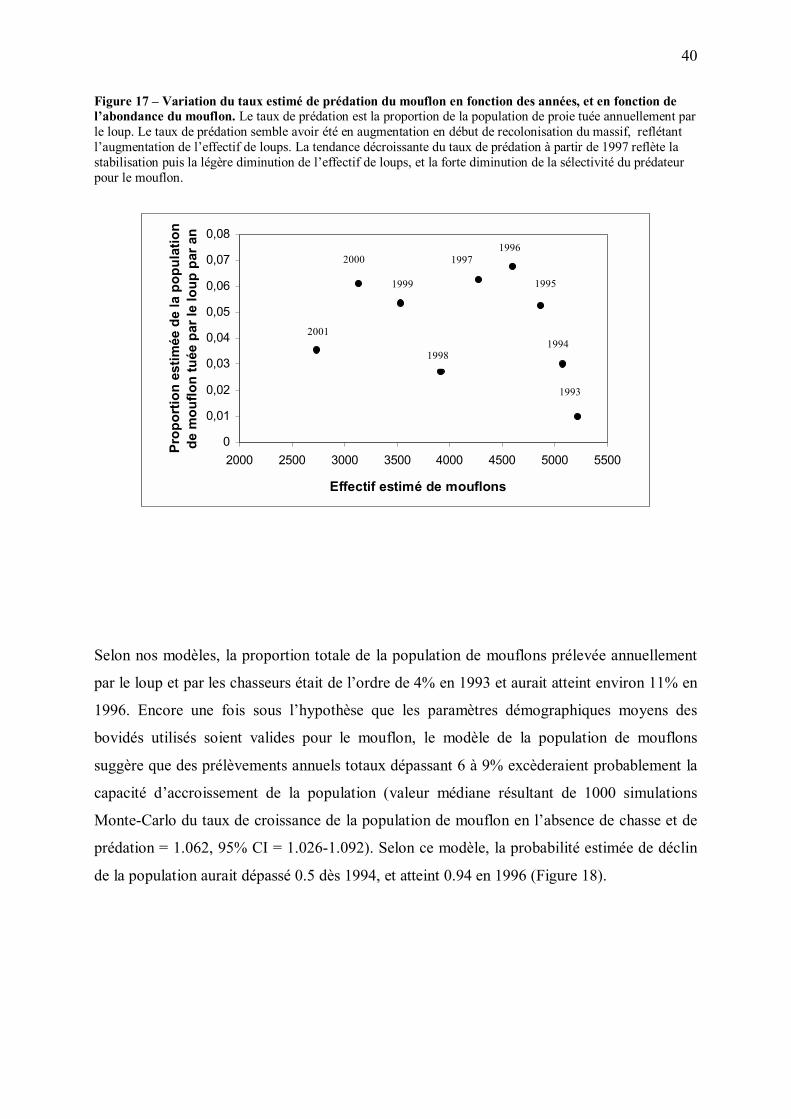
40
Figure 17 � Variation du taux estimé de prédation du mouflon en fonction des années, et en fonction de l�abondance du mouflon. Le taux de prédation est la proportion de la population de proie tuée annuellement par le loup. Le taux de prédation semble avoir été en augmentation en début de recolonisation du massif, reflétant l�augmentation de l�effectif de loups. La tendance décroissante du taux de prédation à partir de 1997 reflète la stabilisation puis la légère diminution de l�effectif de loups, et la forte diminution de la sélectivité du prédateur pour le mouflon.
0
0,01
0,02
0,03
0,04
0,05
0,06
0,07
0,08
2000 2500 3000 3500 4000 4500 5000 5500
Effectif estimé de mouflons
Prop
ortio
n es
timée
de
la p
opul
atio
n de
mou
flon
tuée
par
le lo
up p
ar a
n
Selon nos modèles, la proportion totale de la population de mouflons prélevée annuellement
par le loup et par les chasseurs était de l�ordre de 4% en 1993 et aurait atteint environ 11% en
1996. Encore une fois sous l�hypothèse que les paramètres démographiques moyens des
bovidés utilisés soient valides pour le mouflon, le modèle de la population de mouflons
suggère que des prélèvements annuels totaux dépassant 6 à 9% excèderaient probablement la
capacité d�accroissement de la population (valeur médiane résultant de 1000 simulations
Monte-Carlo du taux de croissance de la population de mouflon en l�absence de chasse et de
prédation = 1.062, 95% CI = 1.026-1.092). Selon ce modèle, la probabilité estimée de déclin
de la population aurait dépassé 0.5 dès 1994, et atteint 0.94 en 1996 (Figure 18).
1993
1994
1995
1996 1997
1998
1999
2000
2001
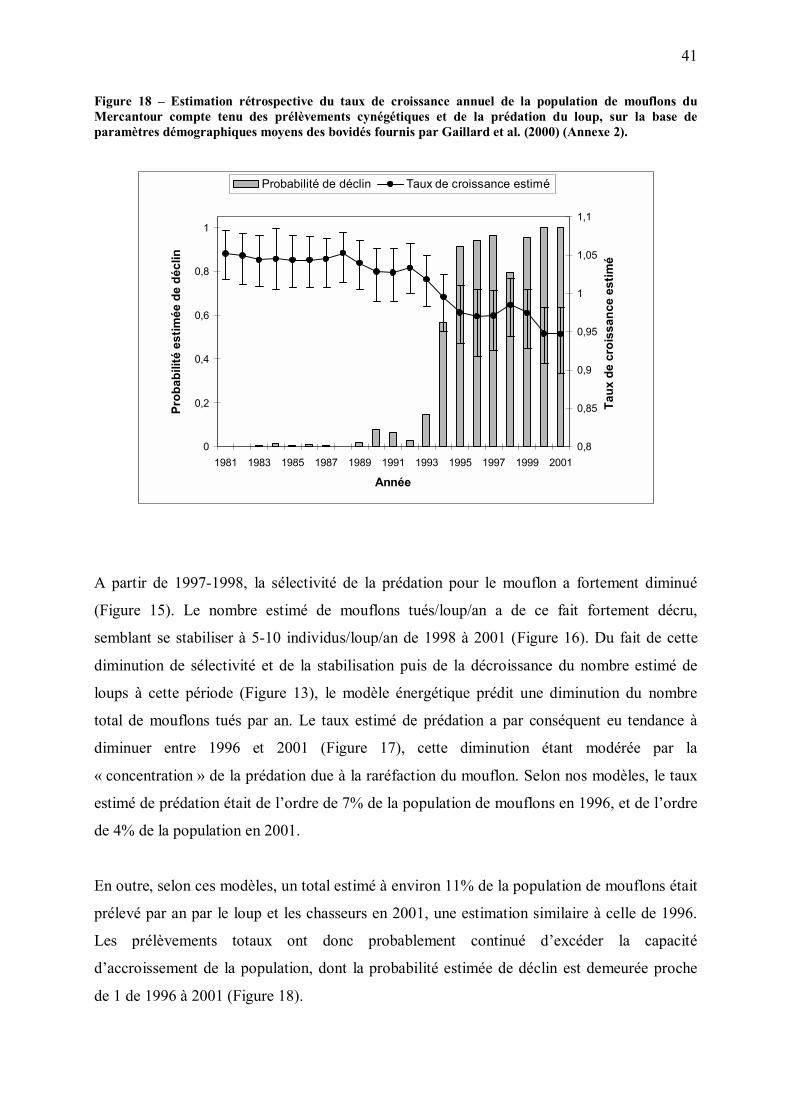
41
Figure 18 � Estimation rétrospective du taux de croissance annuel de la population de mouflons du Mercantour compte tenu des prélèvements cynégétiques et de la prédation du loup, sur la base de paramètres démographiques moyens des bovidés fournis par Gaillard et al. (2000) (Annexe 2).
0
0,2
0,4
0,6
0,8
1
1981 1983 1985 1987 1989 1991 1993 1995 1997 1999 2001
Année
Prob
abili
té e
stim
ée d
e dé
clin
0,8
0,85
0,9
0,95
1
1,05
1,1
Taux
de
croi
ssan
ce e
stim
é
Probabilité de déclin Taux de croissance estimé
A partir de 1997-1998, la sélectivité de la prédation pour le mouflon a fortement diminué
(Figure 15). Le nombre estimé de mouflons tués/loup/an a de ce fait fortement décru,
semblant se stabiliser à 5-10 individus/loup/an de 1998 à 2001 (Figure 16). Du fait de cette
diminution de sélectivité et de la stabilisation puis de la décroissance du nombre estimé de
loups à cette période (Figure 13), le modèle énergétique prédit une diminution du nombre
total de mouflons tués par an. Le taux estimé de prédation a par conséquent eu tendance à
diminuer entre 1996 et 2001 (Figure 17), cette diminution étant modérée par la
« concentration » de la prédation due à la raréfaction du mouflon. Selon nos modèles, le taux
estimé de prédation était de l�ordre de 7% de la population de mouflons en 1996, et de l�ordre
de 4% de la population en 2001.
En outre, selon ces modèles, un total estimé à environ 11% de la population de mouflons était
prélevé par an par le loup et les chasseurs en 2001, une estimation similaire à celle de 1996.
Les prélèvements totaux ont donc probablement continué d�excéder la capacité
d�accroissement de la population, dont la probabilité estimée de déclin est demeurée proche
de 1 de 1996 à 2001 (Figure 18).

42
Le facteur de correction des effectifs comptés de mouflons, estimé à c ≈ 4.9 sur la base de
paramètres démographiques moyens des bovidés, semble peu plausible. De plus, le taux de
croissance estimé de l�ordre de 1.06 semble bien inférieur au taux de croissance attendu pour
une population de mouflons (J.-M. Gaillard, communication personnelle). Ceci suggère que
les paramètres démographiques moyens des bovidés utilisés dans ce travail sont peu adéquats
pour la population de mouflon ; les estimations des taux de prédation et taux de croissance du
mouflon fournies par ce modèle dans son état actuel sont donc à prendre avec réserves.
Néanmoins, ces résultats sont cohérents avec la rapide régression du mouflon observée à
partir du milieu de la période d�étude, correspondant au début de la recolonisation du massif
par le loup (Figure 14).
B. Chamois
Le graphe de l�évolution des effectifs de chamois de 1981 à 2001 suggère en fin de période un
léger infléchissement de la croissance de la population, qui est néanmoins demeurée
largement positive malgré la présence du loup (Figure 19).
Tout au long de la période 1993-2001, le loup a consommé le chamois de façon
disproportionnellement faible par rapport à son abondance, montrant un degré
d� « évitement » relativement stable (Figure 20). Ce degré d� « évitement » a résulté en une
utilisation estimée de 20 à 40 individus/loup/an tout au long de la période de présence du
prédateur (Figure 21).
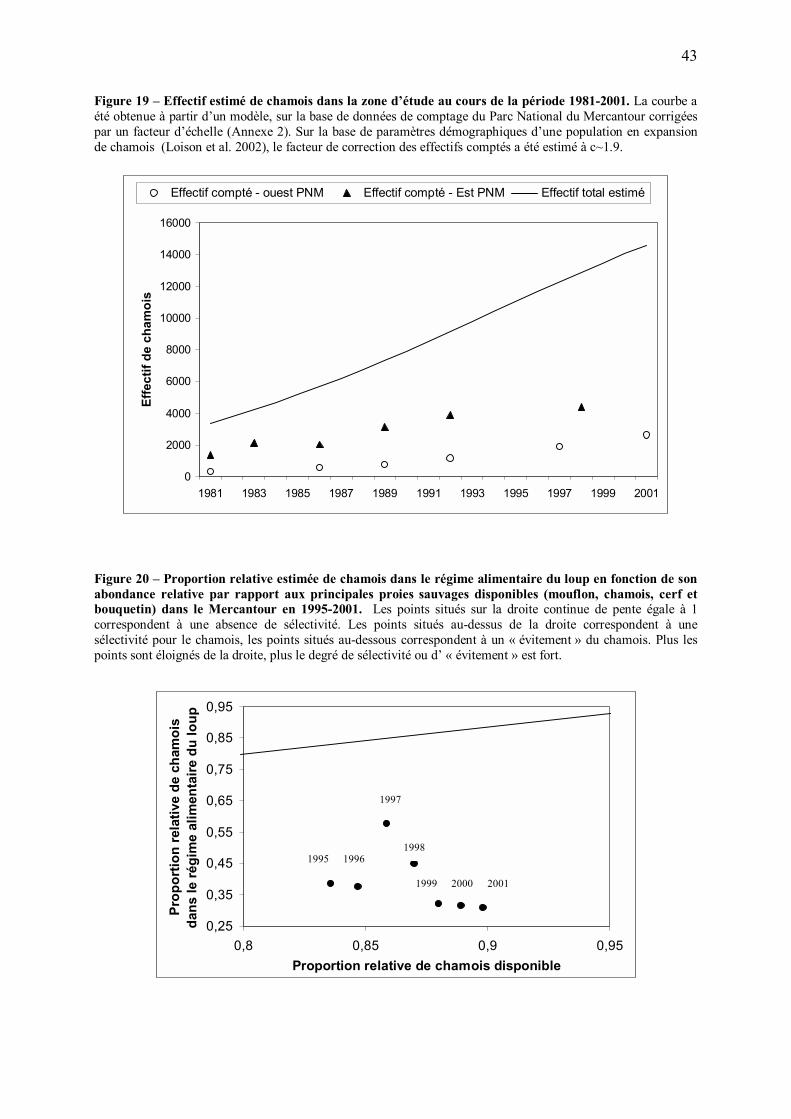
43
Figure 19 � Effectif estimé de chamois dans la zone d�étude au cours de la période 1981-2001. La courbe a été obtenue à partir d�un modèle, sur la base de données de comptage du Parc National du Mercantour corrigées par un facteur d�échelle (Annexe 2). Sur la base de paramètres démographiques d�une population en expansion de chamois (Loison et al. 2002), le facteur de correction des effectifs comptés a été estimé à c~1.9.
0
2000
4000
6000
8000
10000
12000
14000
16000
1981 1983 1985 1987 1989 1991 1993 1995 1997 1999 2001
Effe
ctif
de c
ham
ois
Effectif compté - ouest PNM Effectif compté - Est PNM Effectif total estimé
Figure 20 � Proportion relative estimée de chamois dans le régime alimentaire du loup en fonction de son abondance relative par rapport aux principales proies sauvages disponibles (mouflon, chamois, cerf et bouquetin) dans le Mercantour en 1995-2001. Les points situés sur la droite continue de pente égale à 1 correspondent à une absence de sélectivité. Les points situés au-dessus de la droite correspondent à une sélectivité pour le chamois, les points situés au-dessous correspondent à un « évitement » du chamois. Plus les points sont éloignés de la droite, plus le degré de sélectivité ou d� « évitement » est fort.
0,25
0,35
0,45
0,55
0,65
0,75
0,85
0,95
0,8 0,85 0,9 0,95Proportion relative de chamois disponible
Prop
ortio
n re
lativ
e de
cha
moi
s da
ns le
régi
me
alim
enta
ire d
u lo
up
1995 1996
1997
1998
1999 2000 2001
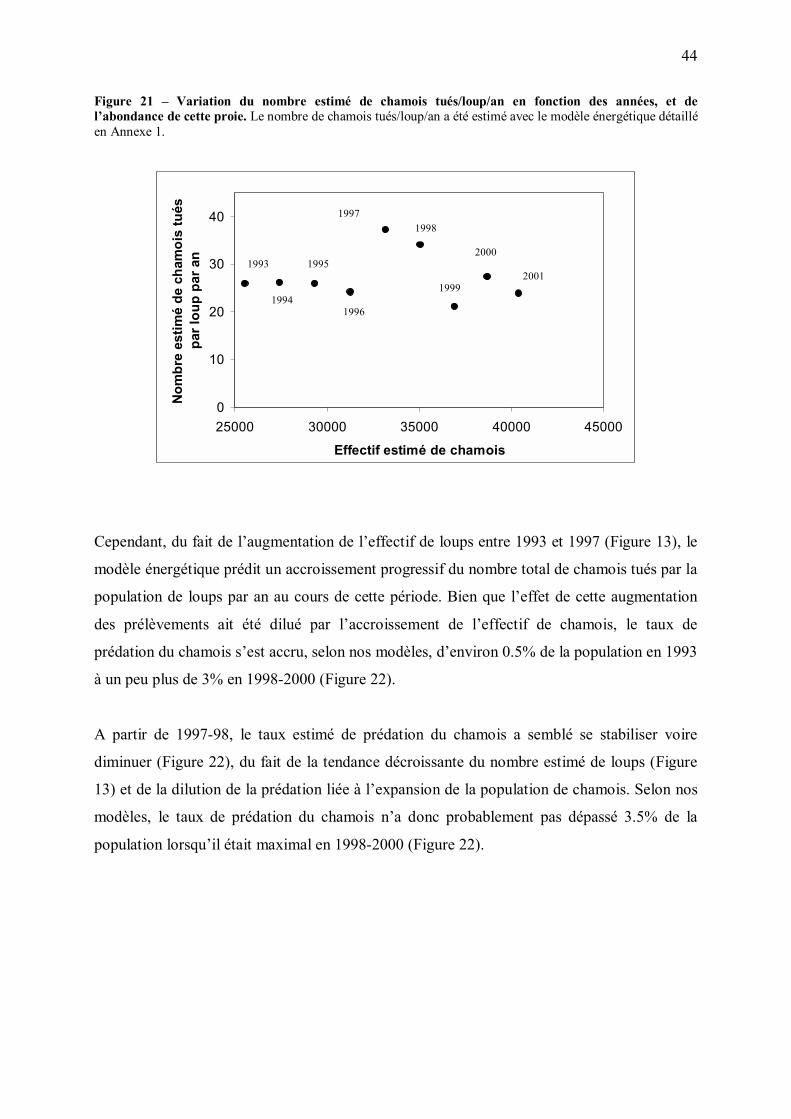
44
Figure 21 � Variation du nombre estimé de chamois tués/loup/an en fonction des années, et de l�abondance de cette proie. Le nombre de chamois tués/loup/an a été estimé avec le modèle énergétique détaillé en Annexe 1.
0
10
20
30
40
25000 30000 35000 40000 45000
Effectif estimé de chamois
Nom
bre
estim
é de
cha
moi
s tu
és
par l
oup
par a
n
Cependant, du fait de l�augmentation de l�effectif de loups entre 1993 et 1997 (Figure 13), le
modèle énergétique prédit un accroissement progressif du nombre total de chamois tués par la
population de loups par an au cours de cette période. Bien que l�effet de cette augmentation
des prélèvements ait été dilué par l�accroissement de l�effectif de chamois, le taux de
prédation du chamois s�est accru, selon nos modèles, d�environ 0.5% de la population en 1993
à un peu plus de 3% en 1998-2000 (Figure 22).
A partir de 1997-98, le taux estimé de prédation du chamois a semblé se stabiliser voire
diminuer (Figure 22), du fait de la tendance décroissante du nombre estimé de loups (Figure
13) et de la dilution de la prédation liée à l�expansion de la population de chamois. Selon nos
modèles, le taux de prédation du chamois n�a donc probablement pas dépassé 3.5% de la
population lorsqu�il était maximal en 1998-2000 (Figure 22).
1993
1994
1995
1996
1997 1998
1999
2000
2001
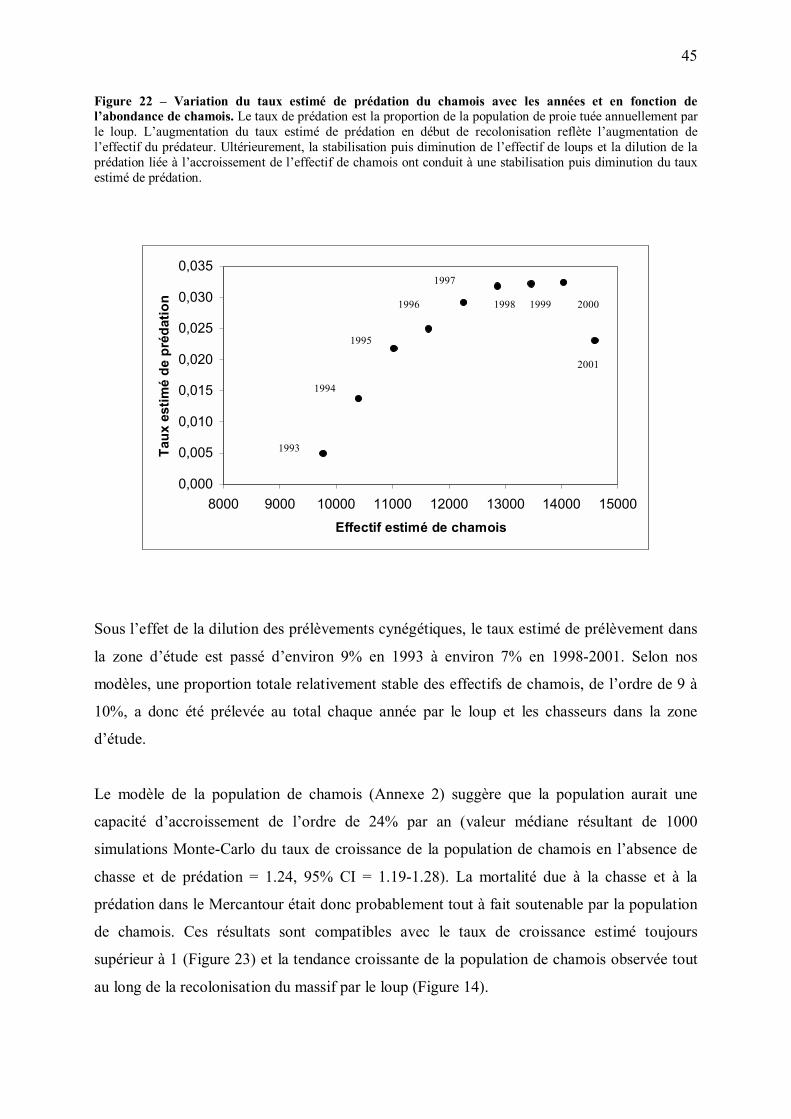
45
Figure 22 � Variation du taux estimé de prédation du chamois avec les années et en fonction de l�abondance de chamois. Le taux de prédation est la proportion de la population de proie tuée annuellement par le loup. L�augmentation du taux estimé de prédation en début de recolonisation reflète l�augmentation de l�effectif du prédateur. Ultérieurement, la stabilisation puis diminution de l�effectif de loups et la dilution de la prédation liée à l�accroissement de l�effectif de chamois ont conduit à une stabilisation puis diminution du taux estimé de prédation.
0,000
0,005
0,010
0,015
0,020
0,025
0,030
0,035
8000 9000 10000 11000 12000 13000 14000 15000
Effectif estimé de chamois
Taux
est
imé
de p
réda
tion
Sous l�effet de la dilution des prélèvements cynégétiques, le taux estimé de prélèvement dans
la zone d�étude est passé d�environ 9% en 1993 à environ 7% en 1998-2001. Selon nos
modèles, une proportion totale relativement stable des effectifs de chamois, de l�ordre de 9 à
10%, a donc été prélevée au total chaque année par le loup et les chasseurs dans la zone
d�étude.
Le modèle de la population de chamois (Annexe 2) suggère que la population aurait une
capacité d�accroissement de l�ordre de 24% par an (valeur médiane résultant de 1000
simulations Monte-Carlo du taux de croissance de la population de chamois en l�absence de
chasse et de prédation = 1.24, 95% CI = 1.19-1.28). La mortalité due à la chasse et à la
prédation dans le Mercantour était donc probablement tout à fait soutenable par la population
de chamois. Ces résultats sont compatibles avec le taux de croissance estimé toujours
supérieur à 1 (Figure 23) et la tendance croissante de la population de chamois observée tout
au long de la recolonisation du massif par le loup (Figure 14).
1993
1995
1996 1998 2000 1999
2001
1994
1997
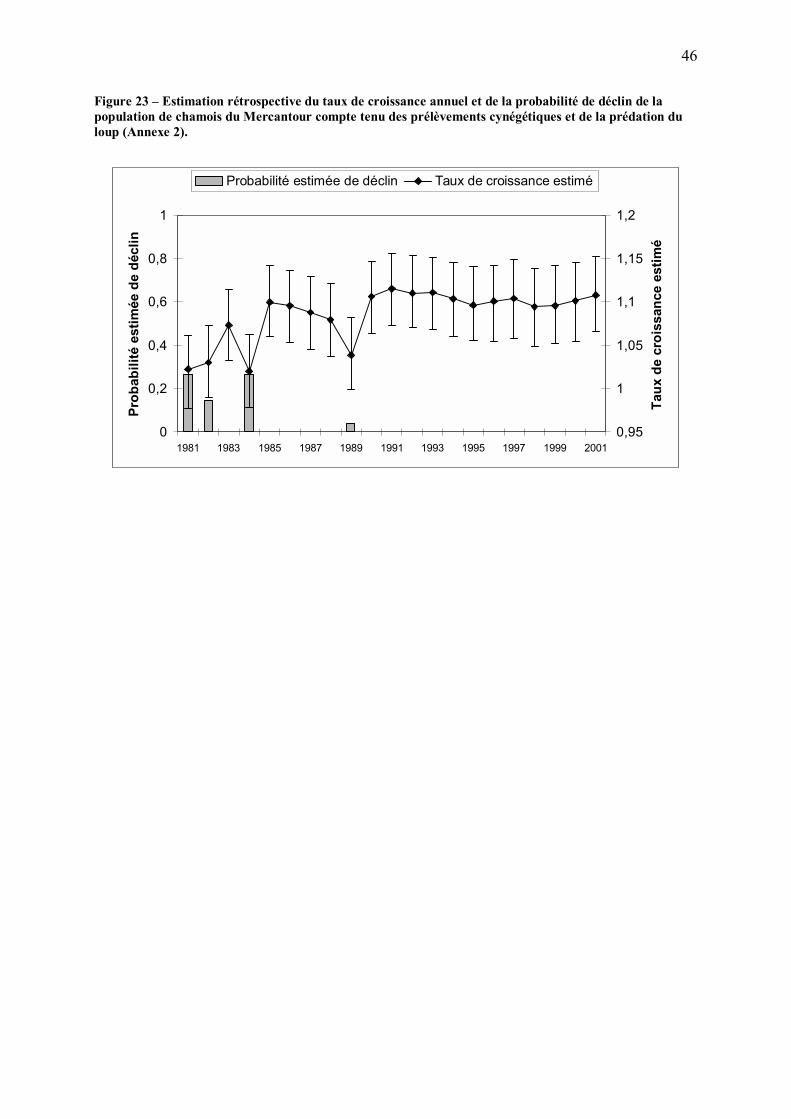
46
Figure 23 � Estimation rétrospective du taux de croissance annuel et de la probabilité de déclin de la population de chamois du Mercantour compte tenu des prélèvements cynégétiques et de la prédation du loup (Annexe 2).
0
0,2
0,4
0,6
0,8
1
1981 1983 1985 1987 1989 1991 1993 1995 1997 1999 2001
Prob
abili
té e
stim
ée d
e dé
clin
0,95
1
1,05
1,1
1,15
1,2
Taux
de
croi
ssan
ce e
stim
é
Probabilité estimée de déclin Taux de croissance estimé
47
V. DISCUSSION - CONCLUSION
A. Validité de l�approche utilisée et futures priorités
Le système loup/proies du Mercantour est particulièrement complexe en raison du grand
nombre d�espèces d�ongulés sauvages présentes et de la disponibilité saisonnière d�ongulés
domestiques. En outre, peu de données empiriques sont à l�heure actuelle disponibles sur la
prédation et sur les populations d�ongulés sauvages. Nous avons donc choisi une approche de
modélisation, permettant de synthétiser les diverses données empiriques disponibles et de les
compléter par des données bibliographiques, pour fournir une première estimation de l�impact
du loup sur les principales populations de proies dans le Mercantour.
Cette première évaluation repose sur plusieurs hypothèses simplificatrices, supposant
notamment que la composition du régime alimentaire du loup reflète la prédation ; la relation
entre régime alimentaire et prédation est en réalité probablement beaucoup plus complexe. De
plus, les résultats obtenus en ce qui concerne les effectifs de proies, les taux de croissance et
les taux de prédation sont conditionnels à la validité des valeurs utilisées pour les paramètres
des modèles. Toutefois, l�approche Monte-Carlo a permis de compenser en partie l�utilisation
de valeurs imprécises, puisqu�elle a permis de prendre en compte, pour chaque paramètre,
toute la gamme de valeurs considérées comme plausibles. Ainsi, malgré la relative simplicité
du modèle énergétique, la comparaison de différents résultats des simulations avec des valeurs
observées sur le terrain (e.g., nombre d�ongulés domestiques tués) ou des valeurs de la
littérature (e.g., demande énergétique individuelle, proportion de jeunes dans la population�)
montre qu�il a fourni des estimations tout à fait réalistes (Annexe 1). De plus, nous avons pu
reconstruire avec succès les tendances observées des effectifs de mouflon et de chamois
(Annexe 2), suggérant que nos modèles ont capturé une part importante de la dynamique du
système.
L�approche de modélisation que nous avons choisie permet d�autre part d�identifier les futures
priorités en termes de collecte de données pour évaluer plus précisément l�impact du loup sur
les populations de proies sauvages.
48
Ainsi, du fait de la structure du modèle énergétique, les estimations du nombre de proies tuées
par le prédateur sont apparues très sensibles aux variations d�effectif et de régime alimentaire
de la population de loups. La validation de ces deux types d�informations serait donc
prioritaire. Dans ce travail, nous avons utilisé des effectifs hivernaux de loups estimés par
comptage répétés de traces dans la neige (données du Parc National du Mercantour), mais
l�incertitude associée à ces estimations est inconnue. A l�avenir, des estimations plus fiables
des effectifs annuels de loups, obtenues à partir des résultats des travaux de typage génétique
des fèces menée par P. Taberlet (Université de Grenoble), pourraient être utilisées. Nous
avons d�autre part estimé le régime alimentaire du loup sur la base d�une partie des fèces
récoltées dont l�identité spécifique a été vérifiée par typage génétique (données P. Taberlet).
Bien que cette approche réduise le biais lié à l�inclusion de fèces de chien ou de renard pour
l�estimation du régime alimentaire, la taille d�échantillon en a été considérablement réduite
(Annexe 5). Le typage d�un plus grand nombre de fèces permettrait de préciser le régime
alimentaire du loup et notamment ses variations saisonnières. Le modèle de Weaver (Weaver
1993) que nous avons utilisé pour estimer la biomasse relative des différentes espèces proies
consommées a été obtenu sur la base de systèmes loup-proies Nord-américains, et sa validité
dans un contexte européen peut être questionnable (L. Boitani, comm. pers.). Le régime
alimentaire du loup devrait être réévalué sur la base de modèles européens pour valider les
résultats de ce travail.
Dans le modèle énergétique, les paramètres liés à la physiologie et à la biologie de la
population de loups se sont en revanche révélés peu influents sur l�estimation du nombre de
proies tuées, ce qui justifie notre choix d�utiliser une large gamme de valeurs (Annexes 1 et 2)
et révèle qu�il n�est pas prioritaire d�obtenir des données empiriques sur ces paramètres.
L�estimation d�un facteur de correction des effectifs comptés d�ongulés selon la méthode
décrite en Annexe 2 est apparue très sensible aux paramètres démographiques utilisés pour la
population étudiée. Pour préciser l�impact du loup, il serait donc nécessaire d�obtenir des
données empiriques sur la démographie des populations de proies dans la zone d�étude,
notamment en ce qui concerne le mouflon, pour lequel le facteur de correction estimé à c ≈
4.9 semble peu plausible.
Comme attendu chez les populations d�ongulés (Gaillard et al. 2000), la survie des adultes
s�est révélée être un paramètre particulièrement influent sur le taux de croissance des
populations. La répartition des prélèvements du loup entre les différentes classes d�âge des
populations de proies, inconnue à l�heure actuelle, a donc probablement une influence
relativement importante sur l�impact de la prédation.

49
Nous avons utilisé des modèles simples et déterministes des populations d�ongulés car nous
ne disposons pas à l�heure actuelle de données justifiant des modèles plus détaillés,
incorporant par exemple une densité-dépendance. En outre, nous avons dans ce travail
supposé que la prédation et la chasse étaient toutes deux des sources de mortalité additives.
L�observation de fortes mortalités chez le mouflon lors d�hivers sévères avant la
recolonisation du loup (B. Lequette, communication personnelle) suggère cependant que la
prédation a probablement été partiellement compensatoire au moins chez cette espèce. Des
scénarios impliquant divers degrés de compensation pourraient être envisagés, qui auraient
pour conséquence de diminuer l�impact estimé des prélèvements.
B. Un scénario concernant les interactions loup-proies en 1993-2001
Les résultats de ce travail suggèrent que le processus de recolonisation du massif par le
prédateur a provoqué des changements de vulnérabilité des proies sauvages (augmentation de
vigilance) et domestiques (augmentation du degré de protection des troupeaux), qui ont
ensuite pu agir rétroactivement sur l�utilisation des ongulés par le loup. De ce fait, la
recolonisation du massif du Mercantour semble s�être accompagnée de deux grandes phases
d�utilisation des proies par le prédateur.
Des proies très vulnérables au début de la recolonisation du massif par le loup
Lors du début de la recolonisation, les mouflons étaient en moyenne moins vigilants que les
chamois. Cette moindre vigilance les a probablement rendus plus vulnérables, puisque la
probabilité de succès d�une attaque augmente lorsque la distance de fuite des proies diminue,
et que, de ce fait, la prédation s�exerce spontanément sur les proies les moins vigilantes
(Fitzgibbon 1989, Krause & Godin 1996). Par ailleurs, le mouflon est relativement mal adapté
aux régions alpines, éprouvant notamment de la difficulté à se déplacer et à se nourrir lorsque
l�enneigement est important (Office National de la Chasse 1994). Ces facteurs de vulnérabilité
ont probablement été à l�origine de la forte sélectivité pour le mouflon que le loup exhibait au
début de la recolonisation du massif.
En début de recolonisation, les loups bénéficiaient par ailleurs de la présence saisonnière
d�ongulés domestiques abondants et très peu protégés, qui constituaient une part importante
50
de leur régime alimentaire estival. Ce subside temporaire de proies, advenant chaque année en
pleine saison d�élevage des louveteaux, a pu faciliter l�accroissement de la densité de loups
lors de la recolonisation du massif par le prédateur.
L�accroissement de l�effectif de loups associé au processus de recolonisation a conduit à une
augmentation progressive du taux de prédation du mouflon entre 1993 et 1996. La
combinaison de la mortalité due au loup et aux activités cynégétiques a rapidement excédé la
capacité d�accroissement de la population de mouflons, qui est entrée dans une phase de
décroissance dès le début de la recolonisation du massif par le loup. La diminution de
l�effectif de mouflon, en concentrant les pertes, a alors stimulé l�augmentation des taux de
prédation et de prélèvements cynégétiques avec les années, accélérant ainsi le recul de la
population de mouflons.
Durant la même période, le chamois était une espèce proie importante dans le régime
alimentaire du loup, mais néanmoins « évitée » par rapport aux autres espèces disponibles. Le
taux de prédation du chamois a augmenté progressivement entre 1993 et 1996 du fait de
l�augmentation de l�effectif de loups associée à la recolonisation du massif. En revanche, le
taux de prélèvements cynégétiques a eu tendance à diminuer, du fait de la dilution des pertes
induite par l�augmentation de l�effectif de chamois. Malgré l�augmentation du taux de
prédation, les prélèvements totaux subis par la population de chamois durant cette période
sont demeurés très inférieurs à sa capacité d�accroissement, et la population a donc continué
de croître.
Après quelques années de présence: un bilan énergétique plus difficile à boucler ?
Cependant, après quelques années de présence du loup, la vulnérabilité des ovins domestiques
en estive a diminué du fait de la mise en place progressive de mesures de protection efficaces
par les éleveurs. La ressource saisonnière qu�ils représentaient pour le loup lors de la période
la plus critique de leur cycle annuel est donc devenu de moins en moins accessible.
De plus, sous l�effet de la prédation, la vigilance individuelle du mouflon et du chamois a
progressivement augmenté, conduisant probablement à une diminution du succès de capture
du prédateur pour les deux espèces d�ongulés sauvages jusqu�ici les plus utilisées. En même

51
temps, la raréfaction du mouflon conduisait à une diminution progressive du taux de rencontre
du loup pour cette espèce, qui était jusque là fortement sélectionnée.
Après quelques années de présence du prédateur, les trois espèces proies qui composaient
jusque là la plus grande partie du régime alimentaire du loup sont donc probablement
devenues plus coûteuses à capturer. La population de loups a alors pu rencontrer plus de
difficultés pour boucler son bilan énergétique, notamment en période d�élevage des jeunes, où
les besoins sont les plus élevés de l�année et étaient jusque là largement comblés par les ovins
domestiques peu protégés.
A cette période, le loup a semblé diversifier son régime alimentaire, incluant d�autres espèces
telles le bouquetin et le cerf. Simultanément, la sélectivité pour le mouflon a fortement
diminué, probablement en relation avec l�augmentation de la vigilance et la raréfaction de
cette espèce proie. Du fait de cette moindre sélectivité et de la tendance décroissante du
nombre de loups, le taux de prédation a pu tendre à diminuer.
Le taux de prédation du chamois a eu lui aussi tendance à diminuer, du fait de la tendance
décroissante du nombre de loups et de l�augmentation de l�effectif de chamois.
Simultanément, le taux de prélèvements cynégétiques continuait de décroître, et l�addition de
ces deux sources de mortalité n�a, selon nos simulations, jamais excédé la capacité
d�accroissement de la population de chamois au cours de la période d�étude. Celle ci a par
conséquent poursuivi sa croissance.
C. Implications
Les modèles présentés dans ce travail ne permettent pas de faire des prédictions prospectives
concernant l�évolution des effectifs d�ongulés en présence du loup sous différents scénarios
de prélèvements cynégétiques. De telles prédictions nécessiteraient notamment de connaître
les réponses fonctionnelles et numériques du loup à différentes densités de proies. Une étude
des réponses du loup à court et à long terme à des variations d�abondance des proies, une fois
la population de loups bien établie, serait nécessaire pour mieux comprendre les mécanismes
de la prédation et pour pouvoir envisager des études de type plus prospectif.
52
L�approche et les modèles proposés, éventuellement améliorés par l�utilisation de paramètres
démographiques estimés empiriquement pour chaque population de proies, pourraient
toutefois être utilisés pour estimer les prélèvements cynégétiques compatibles avec le
maintien d�une population d�ongulés en présence d�une population de loups d�effectif donné.
L�observation de la réaction du système à l�application de ces prélèvements cynégétiques
(croissance, stabilité ou décroissance de la population d�ongulés, réponse numérique du
prédateur, variation de la sélectivité de la prédation) procurerait ensuite des données
utilisables pour améliorer les modèles, et réestimer les prélèvements cynégétiques
supportables par la population de proies sur cette nouvelle base. Ce type de démarche est une
forme de « gestion adaptative », une approche cyclique consistant à intégrer dans des modèles
les informations scientifiques disponibles sur un système, observer les conséquences des
décisions de gestion pour améliorer la connaissance de ce système, et intégrer ces nouvelles
informations dans les modèles pour améliorer éventuellement les choix de gestion (Walters
1986).
Le présent travail a par ailleurs fourni une évaluation de l�efficacité des principales méthodes
utilisées pour protéger les troupeaux ovins contre les attaques de loups. Le degré d�efficacité
des techniques de prévention a des implications importantes pour les gestionnaires, car il peut
constituer un critère de décision en termes par exemple d�allocation de ressources financières
à la prévention, du mode de compensation des dommages, ou du contrôle éventuel de la
population de loups.
L�utilisation de chiens de protection et le parcage ou le regroupement des troupeaux la nuit se
sont révélées des techniques efficaces dans la plupart des cas, permettant d�éviter une grande
partie des dommages. Ce résultat est un argument en faveur d�une compensation des
dommages conditionnelle à la mise en place effective de mesures de prévention par les
éleveurs. Cependant, l�efficacité des chiens s�est révélée variable selon les troupeaux, et les
raisons de cette hétérogénéité devraient être étudiées. Des causes potentielles pourraient par
exemple être le pedigree des chiens, la topographie et le couvert forestier caractérisant
l�estive, le degré d�attachement affectif des chiens aux troupeaux, etc..
En outre, l�utilisation des mesures de préventions peut être plus ou moins aisée selon les
pâturages. Par exemple, une forte pente peut rendre difficile l�utilisation d�enclos, et un
important couvert forestier est susceptible de retarder la détection de l�approche d�un loup par
les chiens de protection. Si la compensation des dommages aux troupeaux était effectivement
conditionnelle à l�utilisation de mesures de prévention par les éleveurs, il serait nécessaire de
53
déterminer si la faible efficacité des chiens de protection pour certains troupeaux peut être
améliorée (par exemple s�il s�agit d�un défaut d�attachement des chiens au troupeau) ou non
(par exemple si une topographie difficile de l�alpage est en cause), afin de prendre en compte
la faisabilité de la mise en place de ces méthodes.
La protection de certains troupeaux a pu conduire le loup à reporter les attaques sur d�autres
troupeaux en fonction de leur degré relatif de protection, et l�on ne sait pas ce qu�il
adviendrait si tous les troupeaux étaient protégés. Il est plausible que l�efficacité des mesures
de prévention puisse varier dans le temps, du fait par exemple de variations de la disponibilité
des ongulés sauvages, de modifications comportementales chez le loup, ou encore de
l�acquisition d�expérience par les éleveurs, les bergers et les chiens de protection. Il est
impossible de prédire l�évolution de l�efficacité des techniques de prévention des dommages
dans le futur, et il parait donc nécessaire de réévaluer périodiquement l�effet des méthodes
utilisées, dans une démarche adaptative permettant d�ajuster les choix de gestion à la capacité
des éleveurs à prévenir les dommages.
D. Conclusion
Depuis la recolonisation du massif du Mercantour par le loup, l�impact du prédateur sur les
ongulés sauvages et domestiques ainsi que la protection légale de l�espèce sont à l�origine de
violentes controverses, localement et à l�échelle nationale. L�intolérance pour le prédateur a
été à l�origine de braconnage et d�empoisonnements dans la région du Mercantour, qui sont
susceptibles de menacer la population locale de loups. Dans ce contexte caractérisé par de
violentes controverses, il a paru important d�étudier les possibilités de réduction des
dommages aux troupeaux par l�utilisation de mesures de prévention, et de fournir une
première évaluation objective de l�impact du loup sur les principales populations de proies
sauvages du massif.
Ce travail a concerné un système prédateur-proies très mal connu, pour lequel peu de données
empiriques sont à l�heure actuelle disponibles. L�objectif était d�assembler les différents
éléments disponibles de ce "puzzle" pour produire une première esquisse du fonctionnement
du système. L�ensemble obtenu constitue un premier outil de reflexion sur le système loup-
proies du Mercantour, qui peut être utilisé dans le cadre d�une réflexion globale sur la gestion
des conséquences écologiques, socio-économiques et humaines du retour du loup dans les
Alpes françaises. Cet outil serait applicable à d�autres zones d�études et d�autres populations

54
de loups et d�ongulés. De plus, du fait de leur structure générale, les modèles développés
pourraient être modifiés pour être adaptés à l�étude de systèmes prédateur-proies mal connus
impliquant d�autres espèces de grands carnivores.
55
VI. REFERENCES CITEES
Abrams, P.A. and H. Matsuda, 1993. Effects of adaptive predatory and anti-predator behaviour in a two-prey-one-predator system. Evol. Ecol. 7: 312-326. Abrams, P.A. and H. Matsuda, 1996. Positive indirect effects between prey species that share predators. Ecology 77: 610-616. Abrams, P.A. and H. Matsuda, 2004. Consequences of behavioral dynamics for the population dynamics of predator-prey systems with switching. Population ecology 46(1):13-25. Adamszewski, J.Z., R.J. Hudson and C.C. Gates, 1993. Winter energy balance and activity of female caribou on Coats island, Northwest Territories: the relative importance of foraging and body reserved. Can. J. Zool. 71: 1221-1229. Angelstam, P., E. Lindström and P. Widen, 1984. Role of predation in short-term population fluctuations of some birds and mammals in Fennoscandia. Oecologia 62: 199-208. Arnold W, T. Ruf, S. Reimoser, F. Tataruch, K. Onderscheka and F. Schober, 2004. Nocturnal hypometabolism as an overwintering strategy of red deer (Cervus elaphus). Am. J. Physiol. - Regul. Integr. Comp. Physiol. 286 (1): R174-R181. Bachman, G.C., 1993. The effect of body condition on the trade-off between vigilance and foraging in Belding�s ground squirrels. An. Behav., 46: 233-244. Berger, J., J.E. Swenson and I. Persson, 2001. Recolonizing carnivores and naïve prey: conservation lessons from the Pleistocene extinctions. Science 291: 1036-1039. Bernard, D., 2000. Des loups et des hommes. Histoires et traditions populaires. De Borée. Bêty, J., G. Gauthier, E. Korpimaki and J.-F. Giroux, 2002. Shared predators and indirect trophic interactions: lemming cycles and arctic-nesting geese. J. Anim. Ecol. 71: 88-98. Blanco, J. C., L. Cuesta, and S. Reig, eds, 1990. El lobo (Canis Lupus) en Espana : situacion, problematica y apuntes sobre su ecologia. Ministero de Agricultura Pesca y Alimentacion, Icona, Publicaciones del Instituto Nacional para la Conservacion de la Naturaleza, Madrid. Blanco, J.C., S. Reig and L. de la Cuesta, 1992. Distribution, status and conservation problems of the wolf Canis lupus in Spain. Biol. Cons. 60: 73-80. Blumstein, D. T., 2002. Moving to suburbia: ontogenetic and evolutionary consequences of life on predator-free islands. J. Biogeogr. 29:685-692. Boertje, R.D. and R.O. Stephenson, 1992. Effect of ungulate availability on wolf reproductive potential in Alaska. Can. J. Zool. 70: 2441-2443.

56
Boisaubert , B. et D. Mouron, 1997. La situation du chevreuil en France. Bull. Mens. ONC 218 : 22-25. Boitani, L., 1992. Wolf research and conservation in Italy. Biol. Cons. 61 : 125-132. Boitani, L., 1995. Ecological and cultural diversities in the evolution of wolf-human relationships. Pp. 3-12 in Carbyn, L.N., S.H. Fritts and D.R. Seip, eds. Ecology and conservation of wolves in a changing world. Canadian Circmpolar Institute. Occasional Publication n°35. 642 pp. Boyd, D.K., R.R. Ream, D.H. Pletscher and M.W. Fairchild, 1994. Prey taken by colonizing wolves and hunters in the Glacier National Park area. J. Wildl. Manage. 58: 289-295. Brand, C.J. and L.B. Keith, 1979. Lynx demography during a snowshoe hare decline in Alberta. J. Wildl. Manage. 43: 827-849. Calef, G., 1995. Caribou and the barren lands. Firefly, Toronto, Ontario Cooper, S.M., 1990. The hunting behaviour of spotted hyenas (Crocuta crocuta) in a region containing both sedentary and migratory populations of herbivores. Afr. J. Ecol. 28: 131-141. Crampe, J.-P., J.-M. Gaillard et A. Loison, 2002. L'enneigement hivernal : un facteur de variation du recrutement chez l'isard (Rupicapra pyrenaica pyrenaica). Can. J. Zool. 80(7) : 1306-1312
Crête, M. and R. Lemieux, 1996. Population dynamics of coyotes colonizing the boreal forest of southeastern Quebec. J. Wildl. Res. 1: 99-105. Cugnasse, J.-M., 1995. L�animal sauvage peut-il être un atout économique ? Bull. Mens. ONC 218 : 36-41. DelGiudice, G.D., 1998. Surplus killing of white-tailed deer by wolves in northcentral Minnesota. Journal of Mammalogy 78: 227-235. Del Giudice, G.D., F.J. Singer and U.S. Seal, 1991. Physiological assessment of winter nutritional deprivation in elk of Yellowstone National Park. J. Wildl. Manage. 55(4): 653-664. DelGiudice, G.D., F.J. Singer, U.S. Seal and G. Bowser, 1994. Physiological responses of Yellowstone bison to winter nutritional deprivation. J. Wildl. Manage. 58(1):24-34.
DelGiudice, G.D., R.A. Moen, F.J. Singer and M.R. Riggs, 2001. Winter nutritional restriction and simulated body condition of Yellowstone elk and bison before and after the fires of 1988. Wildl. Monogr. 147 DelGiudice GD, Riggs MR, Joly P, Pan W , 2002. Winter severity, survival, and cause-specific mortality of female white-tailed deer in north-central Minnesota. J. Wildl. Manage. 66 (3): 698-717.

57
Diamond, J.M., 1989. The present, past and future of human-caused extinctions. Phil. Trans. Roy. Soc. B. 325:469-477. Dumont, A., M. Crête, J.P. Ouellet et al., 2000. Population dynamics of northern white-tailed deer during mild winters: evidence of regulation by food competition. Can. J. Zool. 78(5): 764-776. Erlich, P.R. and C.G. Daily, 1993. Population extinction and saving biodiversity. Ambio 22: 64-68.
Fitzgibbon, C.D., 1989. A cost to individuals with reduced vigilance in groups of Thompson�s gazelles hunted by cheetah. An. Behav. 37: 508-510.
Fitzgibbon, C. D. 1990. Why do hunting cheetah prefer male gazelles? An. Behav. 40:837-845. Forbes, G.J. and J.B. Theberge, 1996. Response by wolves to prey variation in central Ontario. Can. J. Zool. 74: 1511-1520 Fritts, S. H., and Mech, L. D., 1981. Dynamics, movements, and feeding ecology of a newly protected wolf population in northwestern Minnesota. Wildl. Monogr. No. 80. Fritts, S.H., E.E. Bangs, J.A. Fontaine, W.G. Brewster and J.F. Gore, 1995. Restoring wolves to the northern Rocky Mountains of the United States. Pp 107-125 in L.N. Carbyn, S.H. Fritts and D.R. Seip, eds. Ecology and Conservation of Wolves in a Changing World. Can. Circumpolar Inst., Occas. Publ. 35, Univ. Alberta Edmonton, Canada. Fuller, T.K., 1989. Population dynamics of wolves in north-central Minnesota. Wildl. Mono. 105: 1-41.
Fuller, T.K. and P.R. Sievert, 2001. Carnivore demography and the consequences of changes in prey availability. In J.L. Gittleman, S.M. Funk, D. Macdonald and R.K. Wayne (eds), Carnivore Conservation. Cambridge Univ. Press, England. Fuller, T.K., 1991. Effect of snow depth on wolf activity and prey selection in north central Minnesota. Can J. Zool. 69 (2): 283-287. Furness, R. W., 1978. Energy requirements of seabird communities: a bioenergetics model. J. Anim. Ecol. 47:39-53. Gaillard, J.M., M. Festa-Bianchet, N.G. Yoccoz, A. Loison and C. Toïgo, 2000. Temporal variation in fitness components and population dynamics of large herbivores. Annu. Rev. Ecol. Syst. 31: 367-393 Gaillard, J.M., A. Loison and C. Toïgo, 2003. Variation in life-history traits and realistic population models for wildlife management: the case of ungulates. Chapter 8, p. 115-132 In Festa-Bianchet, M. and Apollonio, M., eds. Animal behaviour and wildlife conservation. Island Press.
58
Gaston, K.J. and J.I. Spicer, 1998. Biodiversity, an introduction. Blackwell Science. Gese, E.M., R.L. Ruff and R.L. Crabtree, 1996. Social and nutritional factors influencing the dispersal of resident coyotes. An. Behav. 52: 1025-1043 Part 5.Gill 1990 Gill, R.M.A., 1990. Monitoring the status of European and North American cervids. GEMS Information Series n°8, Global Environment Monitoring System, United Nation Environment Programme, Mairobi, Kenya, pp. 1-277. Ginsberg, J.R. and D.W. Mac Donald, eds. 1990. Foxes, wolves, jackals and dogs: an action plan for the conservation of canids. IUCN/SSC canid specialist group, Gland, Switzerland. Gittleman, J.L., S. M. Funk, D.W. Macdonald and R.K. Wayne, 2001. Why �carnivore conservation�? In Carnivore Conservation, Conservation Biology 5, Gittleman, J.L., Funk, S.M., Macdonald, D. and Wayne, R.K., eds. Cambridge Univ. Press. Gleeson, S.K. and D.S. Wilson, 1986. Equilibrium diet: optimal foraging and prey coexistence. Oikos 46: 139-144. Gonzalez, G. and J.P. Crampe, 2001. Mortality patterns in a protected population of isards (Rupicapra pyrenaica). Can. J. Zool. 79(11):2072-2079. Griffin, A.S., Blumstein, D.T. and Evans, C.S., 2000. Training captive-bred or translocated animals to avoid predators. Cons. Biol., 14(5): 1317-1326. Harrison, R.L., 1997. A comparison of gray fox ecology between residential and undeveloped rural landscapes. J. Wildl. Manage. 61: 112-122. Hebblewhite, M. and D.H. Pletscher, 2002. Effects of elk group size on predation by wolves. Can. J. Zool. 80:800-809. Hilton, G.M., Cresswell, W. and Ruxton, G.D., 1999. Intra-flock variation in the speed of response on attack by an avian predator. Behav. Ecol., 10:391-395. Holt, R.D., 1977. Predation, apparent competition, and the structure of prey communities. Theo. Pop. Biol. 12: 197-229. Holt, R.D., 1983. Optimal foraging and the form of the predator isocline. Am. Nat. 122: 521-541. Holt, R. D., and J. H. Lawton. 1994. The ecological consequences of shared natural enemies. Ann. Rev. Ecol. Syst. 25: 495�520. Huggard, D.J., 1993. Effect of snow depth on predation and scavenging by gray wolves. J. Wildl. Manage. 57(2): 382-388 Illius, A.W. and C. Fitzgibbon, 1994. Costs of vigilance in foraging ungulates. Anim. Behav. 47(2): 481-484. Jablonski, D., 1991. Extinctions: a paleontological perspective. Science 253 : 754-757.

59
Jedrzejewski W, B. Jedrzejewska, H. Okarma and A.L. Ruprecht, 1992. Wolf predation and snow cover as mortality factors in the ungulate community of the Bialowieza National Park, Poland. Oecologia 90(1):27-36. Jedrzejewski, W., B. Jedrzejewski and L. Szymura, 1995. Weasel population response, home range and predation on rodents in a deciduous forest in Poland. Ecology 76: 179-195. Jedrzejewski W, Schmidt K, Theuerkauf J, Jedrzejewska B, Selva N, Zub K, Szymura L, 2002. Kill rates and predation by wolves on ungulate populations in Bialowieza Primeval Forest (Poland). Ecology 83 (5): 1341-1356. Joly, D.O. and F. Messier, 2000. A numerical response of wolves to bison abundance in Wood Buffalo National Park, Canada. Can. J. Zool. 78: 1101-1104 Krause J. and Godin, J.-G.J., 1996. Influence of prey foraging posture on flight behavior and predation risk: predators take advantage of unwary prey. Behav. Ecol. 7:264-271. Kunkel KE, Pletscher DH, Boyd DK, Ream RR, Fairchild MW, 2004. Factors correlated with foraging behavior of wolves in and near Glacier National Park, Montana. J. Wildl. Manage. 68 (1): 167-178. Landa, A., O. Strand, J.E. Swenson and T. Skogland, 1997. Wolverines and their prey in southern norway. Can. J. Zool. 75: 1292-1299. Lawton, J.H. and R.M. May, 1995. Extinction rates. Oxford Univ. Press. Lima, S. L., 1998. Stress and decision making under the risk of predation: recent developments from behavioral, reproductive, and ecological perspectives. Adv. Study Behav. 27:215-290. Loison A., Toïgo, C., Appolinaire, J. and Michallet, J., 2002. Population dynamics and demographic processes in colonising populations of ungulates: chamois and ibex as case studies. Journal of Zoology, London, 256: 199-205. Lopez, B.H., 1978. Of Wolves and Men. Charles Scribner's Sons, New York. 309 pp Loubert-Davaine, X., 2004. Loup et droit. Les Cahiers du CRIDEAU n°10. PULIM, Limoges (ed). Maillard, D., P. Duncan, J.-M. Gaillard et P. Gaultier, 1999. Le retour des grands mammifères sauvages dans la région méditerranéenne française. Forêt Méditerranéenne, t. XX (1) : 9-15. McLean, I.G., Lundie-Jenkins, G. and Jarman, P.J., 1996. Teaching and endangered mammal to recognise predators. Biol. Cons. 56: 51-62. Mech, L.D., 1970. The wolf. Ecology and behaviour of an endangered species. Univ. of Minnesota Press.
60
Mech, L.D., 1977. Productivity, mortality and population trends of wolves in northeastern Minnesota. J. Mammal. 58: 559-574. Mech, L.D., 1995. The challenge and opportunity of recovering wolf populations. Cons. Biol. 270-278. Mech, L.D., R.E. McRoberts, R.O. Peterson and R.E. Page, 1987. Relationship of deer and moose populations to previous winters� snow. J. Anim. Ecol. 56: 615-627. Mech, L.D., D.W. Smith, K.M.Murphy and D.R. McNulty, 2001. Winter severity and wolf predation on a formerly wolf-free elk herd. J. Wildl. Manage. 65(4):998-1003. Meriggi, A., A. Brangi, C. Matteucci and O. Sacchi. 1996. The feeding habits of wolves in relation to large prey availability in northern Italy. Ecography. 19:287-295.
Messier, F., 1985. Solitary living and extraterritorial movements of wolves in relation to social status and prey abundance. Can. J. Zool. 63(2): 239-245.
Messier, F., 1994. Ungulate population models with predation � A case study with the north-American moose. Ecology 75(2): 478-488. Messier, F., 1995. Trophic interactions in two northern wolf-ungulate systems. Wildl. Res. 22 (1): 131-146. Modafferi, R.D. and E.F. Becker, 1997. Survival of radiocollared adult moose in lower Susitna River Valley, southcentral Alaska. J. Wildl. Manage. 61(2): 540-549. Mouron, D. et B. Boisaubert, 1997. Le sanglier en France. Bull. Mens. ONC 218 : 26-29. Muyard, F., 1998. Le loup et la Loi du XIVe siècle à nos jours. Histoire d�une hantise populaire. Tac Motifs, Spéracèdes. Nagy, K.A., I.A. Girard and T.K. Brown, 1999. Energetics of free-ranging mammals, reptiles and birds. Annu. Rev. Nutr. 19: 247-277. Nelson, E.H., C.E. Matthews and J.A. Rosenheim, 2004. Predators reduce prey population growth by inducing changes in prey behaviour. Ecology 85(7):1853-1858. Nelson, M.E., and L.D. Mech, 1986. Relationship between snow depth and gray wolf predation on white-tailed deer. J. Wildl. Manage. 50(3): 471-474. Norbury, G.L, D.C. Norbury and R.P. Heyward, 1998. Behavioral responses of two predator species to sudden declines in primary prey. J. Wildl. Manage. 62 (1): 45-58. Nowell, K. and P. Jackson, eds. 1996. The wild cats: status survey and conservation action plan. IUCN/SCC Cat Specialist Group, Gland, Switzerland. Office National de la Chasse, 1994. Le mouflon de Corse. Brochures techniques de l�Office National de la Chasse, n°21.
61
Okarma, H., B. Jedrzejewska, W. Jedrzejewski, Z.A. Krasinski and L. Milkowski, 1995. The roles of predation, snow cover, acorn crop and man-related factors on ungulate mortality in BialowiezaPrimeval Forest, Poland. Acta Therio. 40(2): 197-217. Owen-Smith, N., 1987. Pleistocene extinctions: the pivotal role of megaherbivores. Paleobiology 13:351-362. Parker, K.L., 2003. Advances in the nutritional ecology of cervids at different scales. Ecoscience 10(4) : 395-411. Parker, K.L., M.P.Gillingham, T.A. Hanley and C.T. Robbins, 1999. Energy and protein balance of free-ranging black-tailed deer in a natural forest environment. Wildl. Mono. 143 : 1-48. Patterson BR, Messier F, 2000. Factors influencing killing rates of white-tailed deer by coyotes in eastern Canada. J. Wildl. Manage. 64 (3): 721-732. Patterson, B.R. and F. Messier, 2003. Age and condition of deer killed by coyotes in Nova Scotia. Can. J. Zool. 81 (11): 1894-1898 Perry G and E.R. Pianka, 1997. Animal foraging: past, present and future. Trends Evol. Ecol. 12 (9): 360-364. Peterson, R.O. and D.L. Allen, 1974. Snow conditions as a parameter in moose-wolf relationships. Naturalist Canadien 101: 481-492. Polis, G.A. and S.D. Hurd, 1996. Linking marine and terrestrial food webs: allochtonous inputs from the ocean supports high secondary productivity on small island and coastal land communities. Am. Nat. 147: 396-423. Polis, G.A., W.B. Anderson and R.D. Holt, 1997. Toward an integration of landscape and food web ecology: the dynamics of spatially subsidized food webs. Ann. Rev. Ecol. Syst. 28: 289-316. Post, E., R.O. Peterson and N.C. Stenseth, 1999. Ecosystem consequences of wolf behavioural response to climate. Nature 401 (6756): 905-907. Post, E. and N.C. Stenseth, 1998. Large-scale climatic fluctuation and population dynamics of moose and white-tailed deer. J. Anim. Ecol. 67 (4): 537-543. Poszig, D. and J.B. Theberge, 2000. Gray wolf, Canis lupus lycaon, responses to shifts of white-tailed deer, Odocoileus virginianus, adjacent to Algonquin Provincial Park, Ontario. Can. Field Nat. 114(1): 62-71. Potvin, F., J. Huot and F. Duchesneau, 1981. Deer mortality in the Pohenegamook wintering area, Quebec. Can. Field Nat. 95(1) 80-84.
62
Poulle, M.-L., Carles, L. and B. Lequette, 1997. Significance of ungulates in the diet of recently settled wolves in the Mercantour mountains (southeastern France). Revue d�Ecologie (Terre Vie), 52:357-368. Poulle, M.-L, Houard, T. and B. Lequette, 1998. Prédation exercée par le loup sur le mouflon et le chamois dans le massif du Mercantour (sud-est de la France). Gibier Faune Sauvage, Game Wildlife, 15 (Hors série Tome 1). Poulle, M.-L., T. Dahier, R. de Beaufort and C. Durand, 2000. Le loup en France. Programme Life Nature. Rapport Final 1997-1999. Purvis, A., G.M. Mace and J.L. Gittleman, 2001. Past and future carnivore extinctions: a phylogenetic perspective. In Carnivore Conservation, Conservation Biology 5, Gittleman, J.L., Funk, S.M., Macdonald, D. and Wayne, R.K., eds. Cambridge Univ. Press., Putkonen J and G. Roe, 2003. Rain-on-snow events impact soil temperatures and affect ungulate survival. Geophys. Res. Lett. 30 (4): Art. No. 1188. Rose, M.D. and G.A. Polis, 1998. The distribution and abundance of coyotes: the effects of allochtonous food subsidies from the sea. Ecology 79: 998-1007. Roth, J.-D., 2002. Temporal variability in arctic fox diet as reflected in stable-carbon isotopes: the importance of sea ice. Oecologia 133:70-77. Roth, J.-D., 2003. Variability in marine resources affects arctic fox population dynamics. J. Anim. Ecol. 72: 668-676. Saether, B.-E., R. Andersen, O. Hjeljord and M. Heim, 1996. Ecological correlates of regional variation in life history of the moose Alces alces. Ecology 77: 1493-1500. Sala, E.O., F.S. Chapin III, J.J. Amnesto et al., 2000. Global biodiversity scenarios for the year 2100. Science 287: 1770-1774. Sandvik, G., K.L. Seip and H. Pleym, 2002. An anatomy of interactions among species in a seasonal world. Oikos 99: 260-271. Schaller, G.B., 1972. The Serengeti Lion. A study of predator-prey relations. Wildlife Behavior and Ecology Series. The University of Chicago Press, Chicago. Signor, P.W., 1990. The geologic history of diversity. Ann. Rev. Ecol. Syst. 21: 509-539. Sinclair, A.R.E., R.P.Pech, C.R. Dickman, D. Hik, P. Mahon and A.E. Newsome, 1997. Predicting effects of predation on conservation of endangered prey. Cons. Biol. 12(3): 564-575.
Skogland, T., 1991. What are the effects of predators on large ungulate populations? Oikos 61: 401-411. Smith, F.D.M., R.M. May, R.Pellew, T.H. Johnson and K.R. Walter, 1993. How much do we know about the current extinction rate? Trends Ecol. Evol. 8(10): 375-378.
63
Solberg, E.-J., B.-E. Saether, O. Strand and A. Loison, 1999. Dynamics of a harvested moose population in a variable environment. J. Anim. Ecol. 68 : 186-204.
Solomon, M. E. 1949. The natural control of animal populations. J. Anim. Ecol. 18: 1-35.
Stahl, P. et J.-M. Vandel, 1995. La colonisation des Alpes françaises par le lynx. Bull. Mens. ONC 215 : 8-17. Stenson, G.B., M.O. Hammill and J.W. Lawson, 1997. Predation by harp seals in Atlantic Canada: preliminary consumption estimates for arctic cod, capelin and atlantic cod. J. Northw. Atl. Fish. Sci. 22:137-154. Stephen, D.W. and J. R. Krebs, 1986. Foraging Theory. Princeton University Press. Princeton, New Jersey. Tannerfeldt, M., A. Angerbjörn and B. Arvidson, 1994. The effect of summer feeding on juvenile arctic fox survival � a field experiment. Ecography 17 : 88-96. Tannerfeldt, M. and A. Angerbjörn, 1998. Fluctuating resources and the evolution of litter size in the arctic fox. Oikos 83: 545-559. Turner, M.G., Y. Wu, L.L. Wallace, W.H. Romme and A. Brenkert, 1994. Simulating winter interactions among ungulates, vegetation and fire in northern Yellowstone Park. Ecol. Appl. 4(3):472-486.
Tyler, N.J.C., 1986. The relationship between the fat content of Svalbard reindeer in autumn and their death from starvation in winter. Rangifer, special issue 1: 311-314.
Van Orsdol, K.G., J.P. Hanby and J.D. Bygott, 1985. Ecological correlates of lion social organization. J. Zool. (Lond.) 206: 97-112.
Walters, C., 1986. Adaptive management of renewable resources. McMillan, New York.
Ward, R.M.P. and C.J. Krebs, 1985. Behavioral response of lynx to declining snowshoe hare abundance. Can. J. Zool. 63(12): 2817-2824. Warren, R.J., 1997. Deer overabundance. Wildl. Soc. Bull. 25(2) : 213-568.
Whitlaw, H. A., W. B. Ballard, D. L. Sabine, S. J. Young, R. A. Jenkins, and G. J. Forbes, 1998. Survival and cause-specific mortality rates of adult white-tailed deer in New Brunswick. J. Wildl. Manage. 62:1335-1341 Wilmers, C.C., R.L. Crabtree, D.W. Smith, K.M. Murphy and W.M. Getz, 2003. Trophic facilitation by introduced top predators: grey wolf subsidies to scavengers in Yellowstone National Park. J. Anim. Ecol. 72(6): 909-916

64
Woodroffe, R., 2001. Strategies for carnivore conservation: lessons from contemporary extinctions. In Carnivore Conservation, Conservation Biology 5, Gittleman, J.L., Funk, S.M., Macdonald, D. and Wayne, R.K., eds. Cambridge Univ. Press Wydeven, A.P., R.N. Schultz and R.P. Thiel, 1995. Monitoring of a recovering gray wolf population in Wisconsin, 1979-1991. pp. 147-156 In Ecology and Conservation of Wolves in a Changing World, eds L.N. Carbyn, S.H. Fritts and D.R. Seip. Canadian Circumpolar Institute, Edmonton, Alberta.

65
Annexe 1
66
Estimating prey killing rates by wolves with an energy-consumption model
Nathalie Espuno, Equipe Biométrie et Biologie des Populations, Centre d�Ecologie
Fonctionnelle et Evolutive, Centre National de la Recherche Scientifique, 1919 route de
Mende, 34293 Montpellier cedex 5, France.
David Grémillet, Centre d�Ecologie et Physiologie Energétiques, Centre National de la
Recherche Scientifique, Campus Cronenbourg, 23 rue Becquerel, 67087 Strasbourg
cedex 2, France.
Benoit Lequette, Parc National du Mercantour, 23 rue d�Italie, 06000 Nice, France.
Pierre Migot, Office National de la Chasse et de la Faune Sauvage, Direction des Etudes et de
la Recherche, Saint-Benoit, 78610 Auffargis, France.
Jean-Dominique Lebreton, Equipe Biométrie et Biologie des Populations, Centre d�Ecologie
Fonctionnelle et Evolutive, Centre National de la Recherche Scientifique, 1919 route de
Mende, 34293 Montpellier cedex 5, France.
Soumis au
Journal of Applied Ecology
67
INTRODUCTION
The co-exploitation of resources by large carnivores and men is a major source of controversy
(e.g. Boyd 2002, Yodzis 2001). Controversial interactions of predators and men is a general
problem, particularly frequent in Western Europe where, owing to increased legal protection
and improved habitat conditions, some populations of large carnivores are currently
expanding into areas from which they were extirpated decades ago (Breitenmoser 1998). Due
to the limited areas of suitable habitat available in Western Europe, recolonizing predators
and humans must often coexist. Such a multiple land-use is a source of conflicts, in particular
when the impact of carnivores on prey may affect hunters or livestock producers. Assessing
how predators meet their requirements for survival is thus critical in efforts to preserve
species of conservation interest and manage exploited prey populations. In this context,
scientific studies can provide unbiased bases on which managers, public stakeholders and
decision-makers can focus to identify and evaluate alternative management options (Messmer
et al. 2001).
Recolonization of the Mercantour range of the Southern French Alps by wolves, Canis lupus,
is a typical example of a conflictual co-exploitation of resources by predators and men (Poulle
et al. 2000, Duchamp et al. 2001). Since they returned to Mercantour National Park and
adjacent areas in the early 1990�s, wolves have preyed mainly upon domestic sheep and
goats, chamois Rupicapra rupicapra, mouflon Ovis gmelini, red deer Cervus elaphus and ibex
Capra ibex (Poulle et al. 2000, Duchamp et al. 2001). While the latter has been reintroduced
to the area and is of high conservation interest, chamois, mouflon and red deer are valued
game ungulates, hunted outside the core area of Mercantour national Park. The number of
wolf-killed domestic prey is relatively straightforward to evaluate based on the numbers of
kills reported as part of a damage compensation scheme, but the demographic impact of
wolves on wild ungulates in Mercantour has been a constant source of debate. There are
concerns about the sustainability of this novel predator-prey system involving wolves, hunters
and ungulates, and work is needed to assess whether the combination of current harvest
quotas and predation rates may be able to produce population declines in wild ungulates.
Assessing the impact of a predator population on the dynamics of a prey population requires
data on the number of individual prey killed by the predator population per unit time ('kill
rate'), which, integrated with data on prey population size, allows to obtain the proportion of
68
the prey population killed by the predator population per unit time (�predation rate�). This rate
of incidental mortality can then be integrated to a prey population model in order to evaluate
the reduction in growth rate attributable to predation.
However, gathering data on large carnivore populations is often difficult and costly because
of typically low densities and elusiveness of these species. Direct estimation of kill rates often
provides only season-specific rates, and may lead to biased estimates of prey consumption
due to scavenging of the kills and to the difficulty to account for extended periods of fasting
between periods of kills (Bobek and Nowicki 1996). As a result, conclusions from several
studies of wolves that involved direct calculation of food intake from pack size and carcass
use (e.g. Peterson et al. 1984, Ballard et al. 1987, Fuller 1989) were extremely disparate
(Bobek and Nowicki 1996). Other studies have assessed the daily food consumption of large
carnivores in the wild by measuring food consumption in captive individuals and adjusting for
average distances travelled in the wild (e.g. Bobek and Nowicki 1996). This method allows
controlling the fasting periods and avoiding the bias due to scavenging, but its accuracy is
conditional on the knowledge of travel distances of the predators in the wild, which may be
difficult to obtain, and highly variable.
Alternatively, the number of individual prey needed by a large carnivore population can be
estimated indirectly with a model of its energy requirements. In earlier studies that used this
approach, energy demand of a predator population was classically modelled as population size
multiplied by individual basal metabolic rate obtained as a power function of body mass,
corrected by a multiplicative factor reflecting the increase in energy needs due to activity
(e.g., Holmes and Sturges 1973, Wiens and Innis 1974, Wiens and Nussbaum 1975). In this
case, elasticity of the estimated energy demand to the activity coefficient is thus one, meaning
that each proportional change in this coefficient results in a change of a similar magnitude in
energy demand. The scarcity of information available to estimate the cost of activity thus
made precise adjustments of energy demands impossible (Wiens and Innis 1974). Some other
bioenergetics models used estimates of field metabolic rates based on time budgets and
specific costs of different activities obtained from laboratory respirometric measurements
(e.g. Furness 1978, Gremillet et al. 1995) or doubly labelled water techniques (Lifson et al.
1955). However, these models did not account for the energy cost of pup growth, and for the
seasonal variation of population size due to births and deaths.
69
In this study, we aimed at developing a general model of the energy and prey requirements of
a wolf population, and apply it to estimate the energy needs and rates of prey uptake by
Mercantour wolves. We modelled the daily energy demand of the population over a year with
a classical model structure involving a population component coupled to an energy
component (e.g. Furness 1978, Philips et al. 1999, Shelton et al. 1997, Stenson et al. 1997).
The population component describes the size of different population compartments each day
of the year, integrating changes in the number of individuals due to births and deaths. The
energy component provides daily estimates of the energy needs of an individual of each
compartment. For a basic estimate of large carnivore field metabolic rate, we used the
allometric equations that Nagy et al. (1999) derived from a synthesis of doubly-labelled water
studies of carnivores. By explicitly modelling seasonal variations in population size and
energy costs of reproduction and growth, we expected to produce higher, more realistic
estimates of prey requirements than the published estimates based on direct measurement of
food intake. Since physiological and life-history parameters of large carnivore populations are
difficult to estimate, we used a Monte-Carlo approach to assess how the uncertainty in
parameter estimates translated into uncertainty on estimated wolf energy and prey
requirements, as suggested by Furness (1978), Warren et al. (1997) and Shelton et al. (1997).
Bioenergetics models have been widely used to assess food requirements of populations or
communities of avian and mammalian marine predators (e.g. Furness 1978, Montevecchi et
al. 1992, Grémillet et al. 1995, Phillips et al. 1999, Boyd 2002) but have rarely been applied
to terrestrial large carnivores. We show that energetic modelling can be an alternative
approach to the direct measurement of prey killing rates by terrestrial large carnivores, and
may thus be a useful tool for the management and conservation of predator-prey systems
involving elusive large predators such as wolves.
METHODS
Study area
The study was conducted in an area of the French Southern Alps recolonized by wolves in the
early 1990�s, the Mercantour Mountains, partly protected by Mercantour National Park.
Altitude in the park ranges from 800 to 3,143 m, with pastures covering about 60 % of the
70
area. Picea excelsa, Abies alba, Pinus sylvestris, Pinus cembra, and Larix decidua are the
main tree species making up the dense forest cover generally found below 2,000 m. Snow
often persists from December to late April above 1,200 m, with an average snow depth
ranging from 0.5 m to more than 2 m depending on the year. Six species of wild ungulates
coexist within the core area of the national park. Recent censuses suggest that at least
approximately 10,000 chamois (5 to 10 per 100 ha), 500 mouflon (0.8 to 4 per 100 ha), 1,200
ibex in summer, some of which emigrate seasonally to winter grounds located outside the
study area, 1,000 red deer and unknown numbers of roe deer Capreolus capreolus and wild
boar Sus scrofa occupy the area. Ungulates are fully protected within the core area of the
park, but harvested outside its boundaries. The Mercantour Mountains are also home to
extensive pastoral activities, mainly devoted to the production of lamb meat.
Model structure
We built a general model of energy and prey requirements of a wolf population, based on a
time step of one day and assuming a stable pre-breeding wolf population size N. Each run of
the model covers a year, beginning at the date of birth of pups. The model structure is based
on several compartments, each containing a different category of individuals (Table 1),
several stages within the year, and different types of energy demands associated with each
category of individuals during each stage. Finally, all types of energy demands are summed to
obtain the total energy needs of the population. Assuming that wolf pups are born on day 1 of
the model run and that weaning occurs over a single day, the lactation stage runs from day 1
to the last day before weaning, the inter-breeding stage runs from the weaning day to the last
day before fecundation of breeding females, and the gestation stage runs from the day of
fecundation to day 365 of the run. Since wolves reach their adult body mass approximately at
the age of one year (Mech 1970), sub-adults (i.e. almost 2-years old at the beginning of a run)
were assumed to have the same energy needs as adults and were not allocated a separate
model compartment. Transient (i.e. non-resident) wolves were distinguished from residents by
their likely lower survival (Peterson et al. 1984, Messier 1985). Gestating and lactating
females were distinguished from non-breeding females to account for the increased energy
needs associated with reproduction. Although pup survival is known to vary through the first
year of life (Mech 1970), we considered only an average first-year survival for the sake of
simplicity. We assumed an even sex ratio, which is often found in natural wolf populations
(Mech 1970). We implemented the model in MATLAB 6.1.

71
Projection of wolf numbers over a year (population component of the model)
For each stage we defined equations giving the daily number of individuals in each model
compartment based on the initial pre-breeding population size N and on parameters of wolf
biology and physiology (parameters are listed in the first column of Table 2, and equations are
summarized in Table 3). The daily survival of adult resident wolves resφ and the daily survival
of adult transient wolves trφ are calculated from their yearly survivals resΦ and trΦ as:
364/1resres Φ=φ Eqn 1
364/1
trtr Φ=φ Eqn 2
Resident males and females, equally represented, are affected by the daily resident survival.
The number of lactating females during the lactation stage, affected by daily resident survival,
is deduced from the proportion of breeding females among adult females. It is subtracted from
the compartment of resident non-lactating non-gestating females during that stage, and
returned to that compartment on the day of weaning. The number of gestating females on the
first day of the gestation stage (day FEC) is calculated as the number of lactating females on
day 1 of the run, plus those that died during gestation, plus those that died during the 24h
period between day 365 and day 1 of the following year. Gestating females are affected by
daily resident survival, and the number igfN of gestating females on day i during the gestation
stage is thus:
FECires
FEC
res
igf REPRNN −
−
⋅
⋅⋅⋅= φ
φ
36615.0 Eqn 3
Gestating females are subtracted from the number of non-lactating, non-gestating resident
females during the gestation stage. Transient males and females, equally represented, are
affected by daily transient survival. The number of pups at birth is deduced from the number
of breeding females and litter size. On the day of weaning, pups move from the compartment
of milk-fed pups to the compartment of weaned pups. Throughout the year, pups are affected
by daily pup survival, which is obtained from adult survivals as follows. For the population to
be at equilibrium, the number of adults that disappear in one year due to death or dispersion
72
(left term of equation 4) must equal the number of pups still alive on day 365 (right term of
equation 4):
( ) puptrres LITSIZREPRNTRANSNRESNN Φ⋅⋅⋅⋅=Φ⋅⋅+Φ⋅⋅− 5.0 Eqn 4
The yearly pup survival is thus:
3641
5.01
⋅⋅Φ⋅−Φ⋅−
=LITSIZREPR
TRANSRES trrespupφ Eqn 5
Individual daily body mass
Adult male body mass is assumed similar for all adult male compartments, and adult female
mass is assumed similar for all adult female compartments, since the increase in metabolism
of gestating females, including additional needs due to mass gain, is accounted for elsewhere.
No seasonal mass change due to fat accumulation or depletion is accounted for due to a lack
of data, and the model considers only an average yearly body mass. No mass loss is
considered in lactating females, since the energy cost of lactation is assumed to be met
through increased food intake and reduced activity. All body masses mentioned in equations
are in kg. The daily mass of wolf pups is modelled following a logistic growth curve of the
form
ciipup be
aW −+=
1
with ipupW the pup body mass on day i, e= the base of natural logarithms (~2.718) and a, b, and
c constants, parameterized on the basis of observations of the growth of captive wolf pups by
Pulliainen (1965).

73
Daily energy demand
We then built equations estimating the individual daily energy demand in each compartment,
during each stage (Table 4). We used Nagy�s equation for order Carnivora (equation 5 in
Nagy et al. 1999) to calculate the daily Field Metabolic Rates (FMR) of individual wolves:
( ) ( ) 869.0100067.1/ ii WdaykJFMR ⋅⋅= (Nagy et al. 1999)
with iW the individual body mass on day i. This FMR includes the costs of body maintenance,
thermoregulation and activity, but not the costs related to growth or reproduction. The energy
demands on day i of non-breeding adult females (and of breeding females outside of the
gestating and lactating stages) inbfE and of adult males i
mE are estimated from this equation,
but additional energy costs are considered for pups, gestating and lactating females. Energy
demand during gestation increases due to the production of foetal, placental, uterine and
mammary tissue, plus the costs of producing and maintaining these new tissues (Gittleman
and Thompson 1988). The FMR of gestating females is thus increased by a percentage GEST
to account for these costs in the model. The estimated energy demand igfE of a gestating
female on day i is thus :
( ) ( ) ( ) 869.067.11/ i
figf WGESTdaykJE ⋅⋅+= Eqn 6
with fW the body mass of adult females.
The daily biomass of tissue deposited in one pup equals pup body mass on day i minus pup
mass on day (i-1). Body composition of pups is assumed constant and similar to that
estimated by Scantlebury et al. (2000) for dog pups, i.e. 22.7% lean tissue and 3.8% fat tissue.
The energy content of 1g of deposited pup tissue (PC) is thus 6.93 kJ, assuming that proteins
contain 23.86 kJ/g and fat contains 39.77 kJ/g. The cost of growth (kJ/day) of one pup on day
i is thus:
( ) ( )11000/ −−⋅⋅= ipup
ipup
igrowth WWPCdaykJE Eqn 7
In weaned pups, the cost of tissue deposition is added to pup FMR. The energy demand of a
weaned pup on day i is thus:

74
( ) ( ) igrowth
ipup
iwp EWdaykJE +⋅=
869.067.1/ Eqn 8
Assuming that the costs of activity and of thermoregulation are negligible in milk-fed pups at
the den, the energy demand of one pup on day i is assumed to be pup BMR calculated from
the Kleiber�s equation for mammals (Kleiber 1932):
( ) ( ) 75.013.293/ i
pupWdaykJBMR ⋅= (Kleiber 1932)
with ipupW the body mass of one pup on day i in kg, plus the cost of growth calculated above,
affected by a coefficient ASSM accounting for milk assimilation efficiency. The energy
demand of a pup before weaning on day i is thus estimated to be:
( ) ( )ASSM
EWdaykJE
igrowth
ipupi
mfp
+⋅=
75.013.293/ Eqn 9
with ipupW the body mass of a pup in kg on day i.
The energy demand of pups before weaning is fully allocated to lactating females in the
model. As a result, the energy needed by a lactating female to feed its litter on day i equals the
energy demand of one pup, multiplied by litter size on day i, affected by a coefficient LEFF to
account for lactation efficiency. Litter size on day i is obtained by dividing the total number of
pups still alive on day i ipupN by the total number of lactating females still alive on day i i
lfN .
The cost of lactation is added to FMR of lactating females, affected by a coefficient ACT to
reflect partial compensation due to the probable reduction of activity in females that remain
sedentary near their dens during lactation. The energy demand of a lactating female on day i is
thus:
( ) ( )[ ]ilf
ipup
igrowth
ipup
filf NLEFFASSM
NEWWACTdaykJE
⋅⋅⋅+⋅
+⋅⋅=75.0
869.0 13.29367.1/ Eqn 10
75
Finally, the model estimates the total daily energy requirement of each compartment by
multiplying daily individual requirements by daily compartment size. The yearly energy
demand of the wolf population is then obtained by summing daily requirements over all
compartments and over 365 days.
Prey biomass required
Mammalian carnivores metabolize about 16.8kJ per g of dry matter of prey ingested (Nagy et
al. 1999). The energy content of prey matter is thus PREYC=16.8*0.3=5.04 kJ per g of fresh
matter of prey, given that animal prey are composed of approximately 70% water; this value
accounts for digestive efficiency of the predator (Nagy et al. 1999). Based on this energy
content, the model converts the yearly energy demand of the wolf population to a yearly
biomass consumption rate. Since wolves may consume only part of the edible matter available
from killed prey, the total biomass of edible matter needed (kg) equals the yearly energy
demand (kJ) divided by (1000*16.8*PCONS), with PCONS the consumption rate, i.e. the
proportion of killed edible matter that wolves actually consume. The model allows for
different consumption rates in wild (PCONS) and domestic (PCONSD) prey. Since parts of
the prey such as hair, hooves and some bones are inedible, the total biomass of prey killed
(kg) equals the biomass of edible matter needed divided by a coefficient EDB to account for
the proportion of edible biomass in killed prey.
Prey killing rates
The model then estimates the biomass of each prey species needed yearly by the wolf
population, by multiplying the yearly total biomass requirements by the relative biomass
contributions of each prey species to annual wolf diet. Since the biomass available from a
prey item varies with the age of prey, we considered selectivity of predation for different age
classes of prey in the model. When no selectivity is assumed, the relative contributions of
each age class to wolf diet in each species equals the relative proportions of age classes in the
population. However, wolf predation on ungulates was often shown to be selective towards
young individuals (e.g. Husseman et al. 2003 in mule deer, Husseman et al. 2003 and Kunkel
and Pletscher 1999 in elk, Ballard et al. 1991and Kunkel and Pletscher 1999 in moose,
Okarma 1991 in red deer). We thus considered two age classes, 0-1 year and >1 year, and a
76
range of plausible selectivity patterns. Selectivity of predation for young in a prey species was
expressed using a modified version of Ivlev�s electivity index:
rpprprD2−+
−= (Jacobs 1974)
with r the relative proportion of young in the sample of killed individuals, and p the relative
proportion of young in the population. Extreme high and low plausible values of r were
calculated assuming two arbitrary scenarios for D: a scenario of weak selectivity for youngs
with D = 0.2, and a scenario of strong selectivity for youngs with D = 0.6. Based on these, the
model estimates the yearly killing rates experienced by each age class of each prey species, by
dividing the total killed biomass by the average body mass of killed individuals, for each age
class of each species.
Model parameterization
Wolf diet and population size
We used wolf numbers estimated from winter snow-tracking data by Mercantour National
Park (Table 6). We considered only the five main prey species of wolves in Mercantour:
chamois, mouflon, ibex, red deer and domestic livestock. Domestic sheep and goats were
pooled because of the same order of magnitude of their body masses and the very low
contribution of domestic goats to wolf diet relative to domestic sheep in Mercantour
(respectively <4% and 15-22% of wolf diet, Bertrand 2003). We assumed average proportions
of young of 25% in chamois, mouflon, ibex and red deer populations (J.-M. Gaillard, personal
communication.). The proportion of young in the sample of killed domestic livestock was
0.31 in damage reports of year 1996; in the present work, we assumed that it ranged from 0.26
to 0.36.
The relative contributions of each prey species to wolf diet was assessed using scats collected
opportunistically in Mercantour by experienced park wardens and field technicians during
1998-2001 (details of methods in Poulle et al. 1997) and positively identified as wolf scats by
DNA analysis (P. Taberlet, unpublished data). Scats were analyzed following the laboratory
procedure described by Ciucci et al. (1996). The relative proportion of individual prey species
in each scat was estimated visually. Biomass of each prey species ingested per collectable scat
was estimated from the linear regression model of Weaver (1993): y=0.439+0.008x, where x
77
is the average body mass of each prey species and y is the biomass ingested per collectable
scat. We used Weaver�s (1993) model rather than the linear regression of Floyd et al. (1978)
because Weaver (1993) incorporated large cervid prey such as elk, which is encountered in
our study site. Average live body masses of prey species, adjusted to account differences
between age classes and sexes, were taken from Ciucci et al. (1996). We used adjusted masses
of unidentified categories taken from Bertrand (2003), which calculated them from adjusted
masses of identified categories, assuming the relative contributions of prey species were the
same in the identified and unidentified sample, as recommended by Ciucci et al. (1996). To
account for scats containing more than one prey item, we applied the biomass model to the
equivalent number of scats containing a given prey species, as recommended by Floyd et al.
(1978).
We checked for variation in diet across years by modeling the �equivalent number of scats� of
each prey species collected in a year as a binomial process, with the total number of scats
collected in the same year as the binomial denominator. We used GLIM 4.09, which carries
out weighted regression using the individual sample sizes as weights and the logit link
function (Crawley 1993). For each prey species, the significance of yearly variation was
assessed by a χ2 test on the change in residual deviance following the addition of factor
YEAR to the null model (Crawley 1993). When the variation in diet between two years was
not significant, we pooled scats together and averaged diet over the two years.
Wolf biology and physiology parameters, prey body masses
We used literature data and expert knowledge to define plausible extreme low and extreme
high values for parameter estimates related to wolf biology, physiology, and average body
masses of prey (Table 2 and Table 5).
Elasticity analysis
To assess the relative influence of each model parameter on the estimated prey requirements,
the proportional effect of a 1% change in each parameter value on kill rate was studied in an
elasticity analysis, using mean values for all the other parameters. We expected an elasticity
of one for wolf population size, since this parameter acted in a direct multiplicative fashion in
the model.

78
Assessing the effect of uncertainty in parameter values
We used a Monte-Carlo approach to assess how the uncertainty in parameter estimates
translated into uncertainty in the estimates of energy and prey requirements (e.g. Boyd 2002).
The Monte Carlo uncertainty analysis requires assuming that each model parameter is a
random variable, and specifying a statistical distribution that characterizes the uncertainty in
this parameter (Caswell et al. 1998). Since we only had plausible ranges for the parameter
estimates, we used uniform distributions bounded by extreme low and extreme high values,
assuming that these distributions encompassed the actual values and their variation between
years (Tables 2 and 5). We ran 3000 Monte Carlo simulations, each of which involved
randomly generating a value for each parameter by sampling from its distributions, and
running the model to obtain an estimate of energy demand and kill rates (Caswell et al. 1998).
We thus obtained distributions of energy demand and prey killing rates incorporating
uncertainty in wolf biology and physiology parameters, uncertainty in age selectivity of
predation, and uncertainty in average body masses of prey. For each output estimate, we
calculated a median value and a 95% confidence interval (95% CI) given by the range from
the 2.5th to the 97.5th percentile of that distribution.
Model validation
We assessed the plausibility of our model by comparing 95% CI obtained from the 3000
Monte Carlo simulations to literature values for several different model outputs. In particular,
we checked that the energy demand of lactating females predicted by the model did not
exceed their maximum potential rate of energy expenditure, which has been suggested to be
about 7 times their basal metabolic rate (Weiner 1992, Hammond and Diamond 1997). We
compared pup/adult ratio in the population to age structures observed in natural wolf
populations. We compared the estimated prey biomass consumed daily per kg wolf to
literature values; we expected that our estimate would be higher than those for captive wolves,
and higher than those of Glowacinski and Profus (1997) and Bobek and Nowicki (1996),
since both studies did not account for the costs of growth and reproduction and for the
seasonal increase in wolf numbers. Finally, we compared the predicted number of domestic
livestock kills to the reported number of victims. We expected that the predicted number of
kills would tend to be lower than the observed number, because damage reports are classified
79
on the basis of a conservative criteria (whether or not the responsibility of wolves can be
excluded), i.e. some kills taken into account in reports may actually not be wolf damages. We
defined a plausible interval on the actual number of damages based on the classification of
damages in reports. The lower bound was defined as the number of individuals classified as
�probably killed by wolves�, and the upper bound was that same number plus livestock killed
by unidentified predators plus claims impossible to check in the field.
RESULTS
Elasticity of kill rates to model parameters
As expected, elasticity of kill rates to pre-breeding wolf population size was equal to one,
reflecting model structure with N acting in a direct multiplicative fashion on the output. In
addition to wolf numbers, estimates of prey killing rates were most sensitive to parameters
related to the amount of energy obtained from prey (% biomass of each species in diet, energy
content of prey, % edible biomass, % edible biomass consumed, adult body masses of prey)
with elasticities ranging from 0.70 to 0.99 (Figure 1). On the other hand, survival rates and
body masses of adult wolves, % biomass consumed and body masses of young wild
ungulates, and parameters related to the number of wolf pups produced (% breeding females
and litter size) had a relatively weak effect on kill rates (elasticities of 0.20 to 0.30). Finally,
lamb body mass, proportion of transient wolves in the population and all parameters related to
the energetics of wolf reproduction had very little influence on prey killing rates, with
elasticities lower than 0.10.
Population projection
The equation retained to describe pup growth was
Wp = 28.2154/(1+7.2658e-0.0256i)
With Wp the body mass of a pup and i the number of days since birth. It appeared to provide a
good representation of the observations of Pulliainen (1965), although it overestimated the
mass of younger pups. For pups 38 days or younger, we thus chose to approximate growth by
the straight-line
80
Wp = 0.2624+0.1912 I
Estimated wolf population size decreased rapidly after births through the year (Figure 2, top
left graph), and this seemed to be mainly due to a very low estimated yearly pup survival
(median value = 0.102, 95% CI = 0.051-0.182) (Figure 2, bottom right graph). This was also
illustrated by the sharp decrease in the estimated proportion of pups in the wolf population
from births to day 365 (Figure 3). The average estimated proportion of pups during the year
was 42.50% (95% CI = 34.53-49.96%).
Prey requirements
Energy demand and edible biomass required
The estimated daily energy demand of the wolf population increased with days following the
birth of pups, and tended to peak about three months after births, with a discontinuity
attributable to pup weaning (Figure 4). From approximately 100 days after births, energy
demand decreased until late winter, with a discontinuity due to the beginning of gestation in
breeding females (Figure 4). The predicted consumption rate was 92.1 g edible matter/day/kg
wolf (95% CI=86.9-98 g), i.e. 2.76 kg edible matter/day (95% CI=2.61-2.94 kg) for a 30-kg
wolf.
The model predicted an annual energy demand of 6.551 x 10⁶ kJ (95% CI=5.883 x 10⁶ - 7.283
x 106 kJ) per wolf present in late winter before births (Figure 5). This value that does not only
reflect the individual needs, but also accounts for the seasonal increase in population size and
the costs of reproduction and pup growth. Based on wolf numbers estimated from winter track
counts, the estimated energy demand of the Mercantour wolf population ranged from 91.751 x
106 kJ /year (95% CI=82.49 x 10⁶ � 102.21 x 10⁶ kJ/year) to 124.60 x 10⁶ kJ/year (95%
CI=112.28 x 10⁶ to 139.07 x 10⁶ kJ/year) (Figure 6).
Wolf diet
The estimated relative biomass contributions of prey species to wolf diet between 1998 and
2001 are provided in Table 7. In no species did we find a significant variation of relative
81
contributions to wolf diet between years during that period of time (mouflon: χ2=2.937,
d.f.=3, p>0.1, chamois: χ2=6.908, d.f.=3, p>0.05, ibex: χ2=1.159, d.f.=3, p>0.1, red deer:
χ2=0.5296, d.f.=3, p>0.1, domestic livestock: χ2=2.787, d.f.=3, p>0.1). We thus pooled
together scats of all years and considered in the rest of the work that diet was represented by
the average contributions of species over 1998-2001 (Table 7, row �pooled�).
Some items were unidentified domestic ungulates (Table 7). These were most likely either
sheep or goat because depredations on other livestock species was extremely rare in
Mercantour, thus we pooled together the estimated relative contributions of sheep, goat and
unidentified domestic ungulates, to obtain the global relative contribution of domestic
livestock to wolf diet (0.207).
To account for the fact that some prey items were unidentified wild ungulates, we defined a
likely range for the contribution of each wild prey species. We defined the lower bound as the
contribution of the species obtained from scat analysis, and the upper bound as the same plus
the contribution (0.034) of unidentified wild ungulates (Table 7, last row). In the Monte-Carlo
analysis, we considered the contributions of wild ungulates to be drawn from uniform
distributions bounded by these lower and upper limits.
Assuming 25% of youngs in populations of wild ungulates, the scenarios of weak and strong
selectivity for youngs resulted in proportions of young in samples killed of r = 0.335 and r =
0.575, respectively. In the Monte-Carlo analysis, we considered the value of the parameter
corresponding to the proportion of young in the killed sample to be drawn from a uniform
distribution bounded by these lower and upper limits.
Prey killing rates
On the basis of this estimated diet, the model predicted that the energy demand of the
Mercantour wolf population was met by the killing of estimated numbers of chamois,
mouflon, ibex and red deer shown in Figure 7, and estimated numbers of domestic sheep and
goats shown in Figure 8. Estimates of the number of wolf-killed individuals of each wild prey
species did not seem to differ significantly between years. The predicted number of killed
livestock did not seem to differ from the reported number in 3 out of 4 years, and, when it
differed (year 2001), the predicted killing rate was, as expected, lower than the reported
killing rate (Figure 8).
82
DISCUSSION
We presented a general model predicting energy and prey requirements of a carnivore
population during an annual cycle. We considered several population compartments (i.e.,
categories of individuals), several stages within the year, and several types of energy needs.
We used a general model structure involving a population component, which provides the
daily numbers of individuals in each population compartment, coupled to an energy
component, which estimates the daily individual energy demand in each compartment.
Because of the generality of this approach, the model could easily be modified to be applied
to other large carnivore species.
The model allows partitioning the impact of predator populations between different prey
species, and between different age classes within each prey species. Age-specific mortality
rates due to predation can then be estimated by combining the estimated kill rates with data on
the size and structure of the prey populations. Predation mortality rates may then be used in
age-structured models of the prey populations to assess the potential reduction of the growth
rates of prey populations attributable to the predator. During 1998-2001, hunters harvested
yearly between 148 and 202 mouflons, and between 1161 and 1372 chamois in the study area.
Our model suggested that, during the same period, wolves probably killed each year as many
mouflons as hunters did, and half as many chamois as hunters did. Kill rates estimated with
the model will be used to assess the effect of predation mortality on the growth rates of
mouflon and chamois populations in Mercantour.
Relative importance of parameters
Estimated kill rates were most sensitive to pre-breeding wolf population size and to wolf diet
composition. Several previous studies have also concluded that estimates of prey consumption
are most sensitive to the variables representing population size (e.g. Furness 1978, Shelton et
al. 1997, Warren et al. 1997). Consequently, the reliability of estimated kill rates is strongly
conditional on the quality of the available data on predator numbers and diet composition.
Estimates of pre-breeding wolf population size used in this study were based on winter counts
of wolf tracks, with an unknown associated uncertainty. More accurate estimates of wolf
numbers may be used in a future stage, using results of the ongoing study of P. Taberlet
(University of Grenoble) involving non-invasive genetic sampling of wolves. Better diet

83
estimates could be obtained as well, if larger samples of DNA-identified wolf scats become
available.
Parameters related to the amount of energy obtained from prey had also a major influence on
kill rates (elasticities ranging from 0.70 to 0.99). The precision of kill rate estimates could
thus be greatly improved by a better knowledge of the energy content of prey, the % of edible
biomass in prey of different types, the proportion of edible biomass actually consumed on
kills, and the body masses of different types of prey. Among these important parameters, the
proportion of edible matter actually consumed on kills seems to be the most difficult estimate
to obtain.
All parameters related to the wolf population other than its pre-breeding size and its diet had a
relatively minor influence on the estimated kill rates. This result thus justifies the use of very
wide ranges of plausible values for these parameters. It does not seem necessary to obtain
more detailed data on wolf survival rates, body masses, proportion of transients in the
population, litter size, proportion of breeding females, and reproduction energetics, because
the uncertainty associated with the wide range of values we used probably does not add
substantially to the overall uncertainty associated with the estimates of kill rates (Boyd 2002).
Elasticities of kill rates to the model parameters would probably differ if the model was
applied to a different large carnivore species, but it is unlikely that the relative ranking of
elasticities would change dramatically. Overall, it should thus be possible to apply the model
to large carnivore species for which empirical data on physiology, survival rate, body masses,
and reproduction are lacking, by using an appropriately wide range of plausible values
obtained from literature estimates or educated guesses.
Model criticism and validation
Wolves may meet part of their energy demand from scavenging rather than predation, but we
had no data on scavenging which would have enabled us to incorporate this factor in the
model. If scavenging by wolves was very important, our model would tend to overestimate
prey killing rates. Moreover, part of the mortality due to predation may be compensatory, in
which case the impact of predation on the prey populations would tend to be overestimated by

84
the model. As a result, kill rates estimated by the model can probably be considered maximum
potential prey killing rates, if we assume that no surplus killing occurs.
Energy demand of wolves may vary with many non-modelled factors, including temperature
and atmospheric conditions, or seasonal mass variations due to accumulation or depletion of
fat reserves. We did not account for specific costs of thermoregulation in Mercantour in
winter because we lacked relevant data. However, winters are relatively mild in this temperate
region, and behavioural thermoregulation (e.g. Long et al. 2003) may reduce the impact of
winter weather on the energy demand of wolves. Locomotion in deep snow increased coyote
heart rate by 4-6% compared to locomotion on hard surfaces (Crête and Larivière 2003). In
the present work, we chose to neglect the additional cost of movement due to snow on the
ground, which seemed reasonable because wolves may make extensive use of groomed or
packed trails in periods of heavy snows.
We assessed the validity of our model by comparing various outputs with values reported for
natural wolf populations. Okarma and Koteja (1987) measured a basal metabolic rate of 4848
kJ/day in a 32.1-kg female wolf. Assuming that lactating females can spend up to 7 times
their BMR, the maximum sustained energy budget for a lactating female of the same body
mass would thus be 4848*7=33936 kJ/day. When setting female body mass to 32.1 kg in the
model and running 3000 Monte Carlo simulations, the maximal estimated energy demand of
lactating females, which occurs the day before weaning, was 30398 kJ/day (95% CI=19618-
48362 kJ/day), a plausible value below 7 BMR. Gittleman and Thompson (1988) suggested
based on a literature review that caloric intake is 66-188% greater in lactating females than in
non-breeding females. Median value of the maximal energy demand of lactating females was
121% higher than FMR of non-breeding females of the same body mass predicted by Nagy�s
equation for Carnivora (13768 kJ/day for a 32.1-kg female). Lower and upper limits of the
plausibility interval were 42% higher and 251% higher than FMR of non-breeding females,
respectively. In addition to lying below the maximum sustainable ceiling of 7 BMR, our
estimate of the energy demand of lactating females was thus consistent with the range
suggested in the literature.
The very low survival of pups predicted by our model (0.102, 95% CI=0.051-0.182) is
consistent with results of various studies that found apparent pup survival rates of 6 to 43% in
pups between birth and age of 5 to 10 months in natural populations (review in Mech 1970).
85
The winter proportion of pups in the population predicted by our model (Figure 3) was
consistent with winter proportions of pups in several natural populations of wolves in North
America, which varied from 13 to 31% (review in Mech 1970).
Daily food consumption in wild wolves has often been estimated from data on pack sizes and
carcass use in the range of 60-210 g per kg wolf body mass (e.g. Kolenosky 1972, Fuller and
Keith 1980, Carbyn 1983, Peterson et al. 1984, Ballard et al. 1987, Fuller 1989). However,
these values are probably overestimates because they do not account for days of fasting
between periods of feeding on kills (Bobek and Nowicki 1996). The difficulty of assessing the
biomass of kills lost to scavengers is also probably reflected in the large variability of feeding
rates obtained by this approach. Average meat consumption of boneless meat by captive adult
wolves originating from north-America, Siberia and Poland was 1.7kg/day in summer and 2.1
kg/day in winter (S. Macchi, Parc du Gévaudan, personal communication), i.e. 40-50 g food
per kg body mass per day, assuming an average body mass of 40 to 45 kg. Average daily meat
consumption of a 45-kg captive adult female was 1.6 kg boneless meat plus half a cup of
dried dog food (P. Tucker, Wild Sentry, personal communication), which also translates into
approximately 40-50 g per kg body mass per day. As expected, our estimate is much higher
than these values of food biomass consumed by captive wolves.
Glowacinski and Profus (1997) estimated a consumption of 2.77 kg of prey per day for a 35-
kg wolf in the wild in Poland. Bobek and Nowicki (1996) found that the average consumption
of mixed food (boneless meat, internal organs, bones and hide) was 31g fresh mass per kg
wolf body mass in metabolic cages. When wolves were captive in enclosures, this
consumption increased for each km travelled by 4.78 kJ per kg wolf body mass. Assuming an
average travel distance of 25.7 km per day (Goszczynski 1986), food requirements would
reach 55.4 g prey per kg wolf per day. If an average daily travel distance of 67 km is assumed
following Bobek and Nowicki (1996), the daily estimated consumption reaches 74.2 g prey
per g wolf body mass. As expected, the consumption rate estimated by our model was
substantially higher than the estimates of Bobek and Nowicki (1996) and Glowacinski and
Profus (1997). The difference between our estimate and theirs might be attributed to the
seasonal increase in population size and the costs of growth and reproduction that we took
into account in our model.
Predicted livestock killing rates were broadly consistent with the reported losses of sheep and
goats. Predicted values similar to or lower than reported losses were expected because
damage reports are classified based on a conservative criteria (whether or not the

86
responsibility of wolves can be excluded). Consequently, some of the kills taken into account
in reports may actually not be wolf damages, which might explain why more kills were
reported than predicted for year 2001. Alternatively, the average consumption rate for
livestock may have been much lower in 2001 than in 1996, the value that we used for all years
in the model. Or, the difference between reported and predicted number of kills in 2001 may
be related to an underestimation of wolf numbers in that year.
The consistency of these different model outputs with published estimates, and the
consistency of estimated livestock killing rates with the reported rates of losses suggested that
our model provided realistic estimates of prey killing rates by wolves in Mercantour.
When little empirical information on a large carnivore population is available, the model we
propose allows combining the existing data with literature values and expert knowledge about
the predator biology and physiology to obtain confidence intervals on prey killing rate. This
approach represents a low-cost alternative to the direct measurement of prey killing rates by
elusive large predators, that may in many cases be sufficient for conservation and
management purposes.
87
LITERATURE CITED
Ballard, W.B., J.S. Whitman and C.L. Gardner, 1987. Ecology of an exploited wolf
population in south-central Alaska. Wildl. Mono. 98: 1-54.
Ballard, W.B., J.S. Whitman and C.L. Gardner, 1991. Ecology of an exploited wolf
population in south-central Alaska. Wildl. Monogr. 98:1-54.
Bertrand, A., 2003. Etude du régime alimentaire des loups du Parc national du Mercantour et
de leur impact potentiel sur les populations d�ongulés sauvages. Unpublished report.
Université Louis Pasteur, Strasbourg.
Bobek, B. and P. Nowicki, 1996. Food intake and digestibility of various natural diets in
wolves. J. Wildl. Res. 1(2):148-154.
Boyd, D.K. and D.H. Pletscher, 1999. Characteristics of dispersal in a colonizing wolf
population in the central Rocky Mountains. 63(4):1094-1108.
Boyd, I. L., 2002. Estimating food consumption of marine predators: Antarctic fur seals and
macaroni pinguins. J. Appl. Ecol. 39:103-119.
Breitenmoser, U., 1998. Large predators in the Alps: the fall and rise of man�s competitors.
Biological Conservation 83(3):279-289.
Carbyn, L.N., 1983. Wolf predation on elk in Riding Mountain National Park, Manitoba. J.
Wildl. Manage. 47 (4): 963-976.
Caswell, H., S. Brault, A.J. Read and T.D. Smith, 1998. Harbor porpoise and fisheries: an
uncertainty analysis of incidental mortality. Ecol. Appl. 8(4): 1126-1238.
Ciucci, P., L. Boitani, E.R. Pelliccioni, M. Rocco and I. Guy,1996. A comparison of scat
analysis to assess diet of the wolf Canis lupus. Wildl. Biol. 2 : 37-48.
Crawley, M. J., 1993. GLIM for ecologists. Blackwell Science.

88
Crête, M. and Larivière, S.. 2003. Estimating the costs of locomotion in snow for coyotes. -
Can. J. Zool. 81: 1808-1814.
Duchamp, C., V. Genevey, F. Favier, T. Dahier, R. de Beaufort, C. Durand, P. Oléon et M.
Pion, 2001. Programme LIFE Nature : « Le retour du loup dans les Alpes Françaises ».
Rapport d�activité 2000, Ministère de l�Aménagement du Territoire et de l�Environnement.
Floyd TJ, Mech LD, Jordan PA 1978. Relating wolf scat content to prey consumed. J Wildl
Mgmt 42: 528- 532.
Fritts, S. H., and Mech, L. D. 1981. Dynamics, movements, and feeding ecology of a newly
protected wolf population in northwestern Minnesota. Wildl. Mono. No. 80.
Fuller, T. K. 1989. Population dynamics of wolves in north-central Minnesota. Wildl.
Monogr. No. 105.
Fuller, T. K., and L. B. Keith. 1980. Wolf population dynamics and prey relationships in
northeastern Alberta. Journal of Wildlife Management 44:583-602.
Furness, R. W., 1978. Energy requirements of seabird communities: a bioenergetics model. J.
Anim. Ecol. 47:39-53.
Gittleman, J. L. and Thompson, S. D. (1988). Energy allocation in mammalian reproduction.
Amer. Zool. 28,863 -875.
Glowacinski, Z. and P. Profus, 1997. Potential impact of wolves Canis lupus on prey
populations in Poland. Biol. Cons. 80:99-106.
Goszczynski, J. (1986). Locomotor activity of terrestrial predators and its consequences. Acta
Theriol. 31, 79�95.
Gremillet, D., D. Schmid and B. Culik, 1995. Energy requirements of breeding great
cormorants Phalacrocorax carbo sinensis. Mar. Ecol. Prog. Ser. 121:1-9.
89
Hammond, K. A. and Diamond, J., 1997. Maximal sustained energy budgets in humans and
animals. Nature 386, 457�462.
Holmes, R.T. and F.W. Sturges, 1973. Annual energy expenditure by the avifauna of a
northern hardwoods ecosystem. Oikos 24:24-29.
Husseman, J.S., D.L. Murray, G. Power, C. Mack, C.R. Wenger and H. Quigley, 2003.
Assessing differential prey selection patterns between two sympatric large carnivores. Oikos
101(3):591-601.
Keith, S.B. 1983. Population dynamics of wolves. pp. 66-77 in L.N. Carbyn, ed. Wolves in
Canada and Alaska: their status, biology, and management. Can. Wildl. Serv. Rep. Ser. No.
45.
Kleiber, M. 1932. Body size and metabolism. Hilgardia 6:315-353.
Kolenosky, G. B. 1972. Wolf predation on wintering deer in east-central Ontario. Journal of
Wildlife Management 36:357-369.
Kunkel, K. and D.H. Pletscher, 1999. Species-specific population dynamics of cervids in a
multipredator ecosystem. J. Wildl. Manage. 63(4):1082-1093.
Lifson, N., Gordon, G.B. and R. McClintock, 1955. Measurement of total carbon dioxide
production by means of D218O. Journal of Applied Physiology. 7:704-710.
Long, R.A., T.J. Martin and B.M. Barnes, 2003. Behavioral thermoregulation in free-living
arctic squirrels. 54th Arctic Science Conference. Artic Division, American Association for the
Advancement of Science.
Mech, L.D., 1970. The wolf, ecology and behaviour of an endangered species.
Messier, F. 1985. Solitary living and extra-territorial movements of wolves in relation to
social status and prey abundance. Can. J. Zool., 63:239-245.
90
Messmer, T.A., D. Reiter and B.C. West, 2001. Enhancing wildlife sciences linkage to public
policy: lessons from the predator-control pendulum. Wildlife Society Bulletin, 29(4):1253-
1259.
Montevecchi, W. A., V. L. Birt-Friesen and D. K. Cairns, 1992. Reproductive energetics and
prey harvest of Leach�s storm-petrels in the northwest Atlantic. Ecology 73(3):823-832.
Nagy, K.A., I.A. Girard, and T.K. Brown. 1999. Energetics of free-ranging mammals,
reptiles, and birds. Ann. Rev. Nutr. 19: 247-277.
Okarma, H.,1991. Marrow fat content, sex and age of red deer killed by wolves in winter in
the Carpathian Mountains. Holarctic ecology, 14(3):169-172.
Okarma, H. and P. Koteja, 1987. Basal metabolic rate in the gray wolf in Poland. J. Wildl.
Manage. 51 (4): 800-801.
Peterson RO, Woolington JD, Bailey TN, 1984. Wolves of the Kenai Peninsula, Alaska.
Wildl Monogr 88.
Phillips, R.A., D. R. Thompson and K. C. Hamer, 1999. The impact of great skua predation
on seabird populations at St Kilda: a bioenergetics model. J. Appl. Ecol. 36:218-232.
Pimlott, D.H., J.A. Shannon, and G.B. Kolenosky. 1969. The ecology of the timber wolf in
Algonquin Provincial Park. Can. Dep. Lands For. Res. Branch Res. Report. No. 87.
Pletscher, D.H., R.R. Ream, D.K. Boyd, M.W. Fairchild and K.E. Kunkel, 1997. Population
dynamics of a recolonizing wolf population. J. Wildl. Manage. 61(2):459-465.
Poulle, M.-L., Carles, L. and B. Lequette, 1997. Significance of ungulates in the diet of
recently settled wolves in the Mercantour mountains (southeastern France). Revue d�Ecologie
(Terre Vie), 52:357-368.
91
Poulle, M.-L., T. Dahier, R. de Beaufort and C. Durand, 2000. Le loup en France. Programme
Life Nature. Rapport Final 1997-1999.
Pulliainen, E. 1965. Studies on the wolf (Canis lupus L.) in Finland. Annales Zoologici
Fennici 2:215-259.
Scantlebury, M., R. Butterwick and J.R. Speakman, 2000. Energetics of lactation in domestic
dog breeds of two sizes. Comp. Biochem. Physiol. 125A: 197-210.
Shelton, P.A., W.G. Warren, G.B. Stenson and J.W. Lawson, 1997. Quantifying some of the
major sources of uncertainty associated with estimates of harp seal prey consumption. Part II:
uncertainty in consumption estimates associated with population size, residency, energy
requirement and diet. J. Northw. Atl. Fish. Sci. 22:303-315.
Stenson, G.B., M.O. Hammill and J.W. Lawson, 1997. Predation by harp seals in Atlantic
Canada: preliminary consumption estimates for arctic cod, capelin and atlantic cod. J.
Northw. Atl. Fish. Sci. 22:137-154.
Wabakken, P., H. Sand, O. Liberg and A. Bjarvall, 2001. The recovery, distribution, and
population dynamics of wolves on the Scandinavian peninsula, 1978-1998. Can. J. Zool.
79(4):710-725.
Warren, W.G., P.A. Shelton and G.B. Stenson, 1997. Quantifying some of the major sources
of uncertainty associated with estimates of harp seal prey consumption. Part I: uncertainty in
the estimates of harp seal population size. J. Northw. Atl. Fish. Sci. 22: 289-302.
Weaver, J.L., 1993. Refining the equation for interpreting prey occurrence in gray wolf scats.
J. Wildl. Manage. 57: 534-538.
Weiner, J., 1992. Physiological limits to sustainable energy budgets in birds and mammals:
ecological implications. Trends Ecol. Evol. 7: 384-388.
Wiens, J.A. and G.S. Innis, 1974. Estimation of energy flow in bird communities: a
population bioenergetic model. Ecology, 55:730-746.

92
Wiens, J.A. and R.A. Nussbaum, 1975. Model estimation of energy flow in northwestern
coniferous forest bird communities. Ecology 56: 547-561.
Yodzis, P., 2001. Must top predators be culled for the sake of fisheries? Trends in Ecology
and Evolution 16(2): 78-84.

93
TABLES
Table 1 � Population compartments in the model of wolf energy and prey requirements. Each category contains individuals considered homogeneous in their energy demand.
Code Category of individuals RM Adult resident males LF Breeding females - lactating GF Breeding females - gestating RF Adult non-lactating non-gestating resident
females TM Adult transient males TF Adult transient females MP Milk-fed pups WP Weaned pups
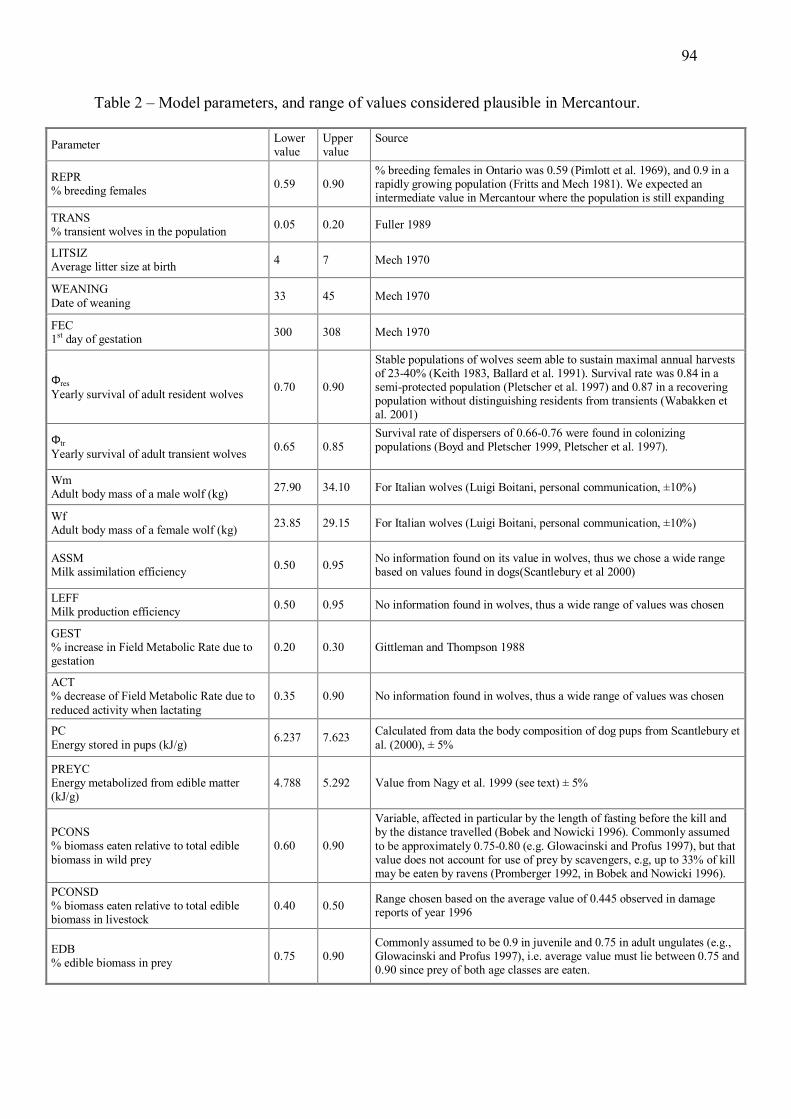
94
Table 2 � Model parameters, and range of values considered plausible in Mercantour.
Parameter Lower value
Upper value
Source
REPR % breeding females 0.59 0.90
% breeding females in Ontario was 0.59 (Pimlott et al. 1969), and 0.9 in a rapidly growing population (Fritts and Mech 1981). We expected an intermediate value in Mercantour where the population is still expanding
TRANS % transient wolves in the population 0.05 0.20 Fuller 1989
LITSIZ Average litter size at birth 4 7 Mech 1970
WEANING Date of weaning 33 45 Mech 1970
FEC 1st day of gestation 300 308 Mech 1970
Φres Yearly survival of adult resident wolves 0.70 0.90
Stable populations of wolves seem able to sustain maximal annual harvests of 23-40% (Keith 1983, Ballard et al. 1991). Survival rate was 0.84 in a semi-protected population (Pletscher et al. 1997) and 0.87 in a recovering population without distinguishing residents from transients (Wabakken et al. 2001)
Φtr Yearly survival of adult transient wolves 0.65 0.85
Survival rate of dispersers of 0.66-0.76 were found in colonizing populations (Boyd and Pletscher 1999, Pletscher et al. 1997).
Wm Adult body mass of a male wolf (kg) 27.90 34.10 For Italian wolves (Luigi Boitani, personal communication, ±10%)
Wf Adult body mass of a female wolf (kg) 23.85 29.15 For Italian wolves (Luigi Boitani, personal communication, ±10%)
ASSM Milk assimilation efficiency 0.50 0.95 No information found on its value in wolves, thus we chose a wide range
based on values found in dogs(Scantlebury et al 2000)
LEFF Milk production efficiency 0.50 0.95 No information found in wolves, thus a wide range of values was chosen
GEST % increase in Field Metabolic Rate due to gestation
0.20 0.30 Gittleman and Thompson 1988
ACT % decrease of Field Metabolic Rate due to reduced activity when lactating
0.35 0.90 No information found in wolves, thus a wide range of values was chosen
PC Energy stored in pups (kJ/g) 6.237 7.623 Calculated from data the body composition of dog pups from Scantlebury et
al. (2000), ± 5%
PREYC Energy metabolized from edible matter (kJ/g)
4.788 5.292 Value from Nagy et al. 1999 (see text) ± 5%
PCONS % biomass eaten relative to total edible biomass in wild prey
0.60 0.90
Variable, affected in particular by the length of fasting before the kill and by the distance travelled (Bobek and Nowicki 1996). Commonly assumed to be approximately 0.75-0.80 (e.g. Glowacinski and Profus 1997), but that value does not account for use of prey by scavengers, e.g, up to 33% of kill may be eaten by ravens (Promberger 1992, in Bobek and Nowicki 1996).
PCONSD % biomass eaten relative to total edible biomass in livestock
0.40 0.50 Range chosen based on the average value of 0.445 observed in damage reports of year 1996
EDB % edible biomass in prey 0.75 0.90
Commonly assumed to be 0.9 in juvenile and 0.75 in adult ungulates (e.g., Glowacinski and Profus 1997), i.e. average value must lie between 0.75 and 0.90 since prey of both age classes are eaten.

95
Table 3 � Recursion equations providing the number ni of individuals on day i in each compartment, during each stage
Lactation Inter-breeding Gestation
RM 0.5*N*RES*φres i-1 0.5*N*RES*φres i-1 0.5*N*RES*φres i-1
LF 0.5*N*REPR* φres i-1 0 0
GF 0 0 [0.5*N*REPR*(1/φres) 366-FEC] *φres i-FEC
RF 0.5*N*(RES-REPR)* φres i-1 0.5*N*RES*φres i-1 0.5*N*RES*φres i-1-[0.5*N*REPR*(1/φres)366-FEC]*φres i-FEC
TM 0.5*N*TRANS* φtr i-1 0.5*N*TRANS* φtr
i-1 0.5*N*TRANS* φtr i-1
TF 0.5*N*TRANS* φtr i-1 0.5*N*TRANS* φtr
i-1 0.5*N*TRANS* φtr i-1
MP 0.5*N*REPR*LITSIZ* φpup i-1 0 0
WP 0 0.5*N*REPR*LITSIZ*φpup i-1 0.5*N*REPR*LITSIZ*φpup
i-1
Table 4 - Equations providing the energy demand ei of one individual on day i in each compartment, during each stage
Lactation Inter-breeding Gestation
RM 1.67*Wm0.869 1.67*Wm
0.869 1.67*Wm0.869
LF ACT*1.67*Wf0.869+ [293.13*(Wp
i/1000)0.75 +
PC*(Wpi � Wp
i-1)]*( NiMP / Ni
LF )/(ASSM*LEFF) 0 0
GF 0 0 (1+GEST)*1.67*Wf0.869
RF 1.67*Wf0.869 1.67*Wf
0.869 1.67*Wf0.869
TM 1.67*Wm0.869 1.67*Wm
0.869 1.67*Wm0.869
TF 1.67*Wf0.869 1.67*Wf
0.869 1.67*Wf0.869
MP energy demand allocated to lactating females 0 0
WP 0 1.67*Wpi 0.869+PC*(Wp
i � Wpi-1) 1.67*Wp
i 0.869+PC*(Wpi - Wp
i-1)
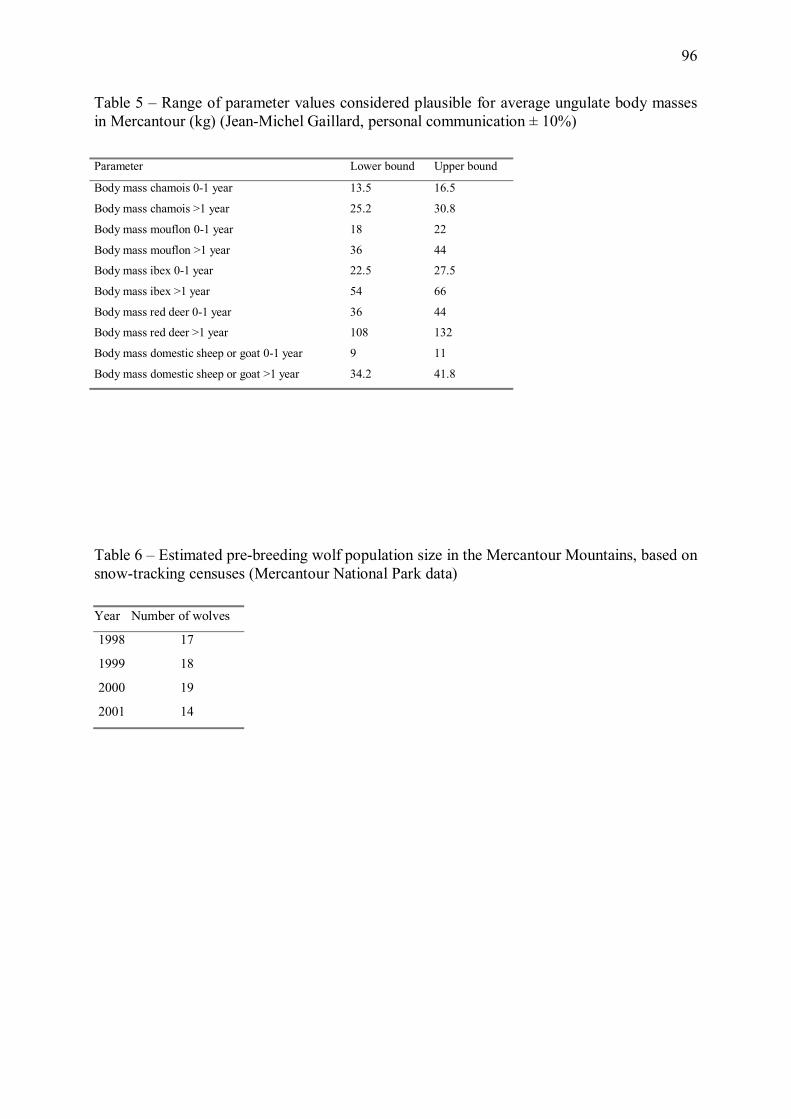
96
Table 5 � Range of parameter values considered plausible for average ungulate body masses in Mercantour (kg) (Jean-Michel Gaillard, personal communication ± 10%) Parameter Lower bound Upper bound
Body mass chamois 0-1 year 13.5 16.5
Body mass chamois >1 year 25.2 30.8
Body mass mouflon 0-1 year 18 22
Body mass mouflon >1 year 36 44
Body mass ibex 0-1 year 22.5 27.5
Body mass ibex >1 year 54 66
Body mass red deer 0-1 year 36 44
Body mass red deer >1 year 108 132
Body mass domestic sheep or goat 0-1 year 9 11
Body mass domestic sheep or goat >1 year 34.2 41.8
Table 6 � Estimated pre-breeding wolf population size in the Mercantour Mountains, based on snow-tracking censuses (Mercantour National Park data)
Year Number of wolves
1998 17
1999 18
2000 19
2001 14
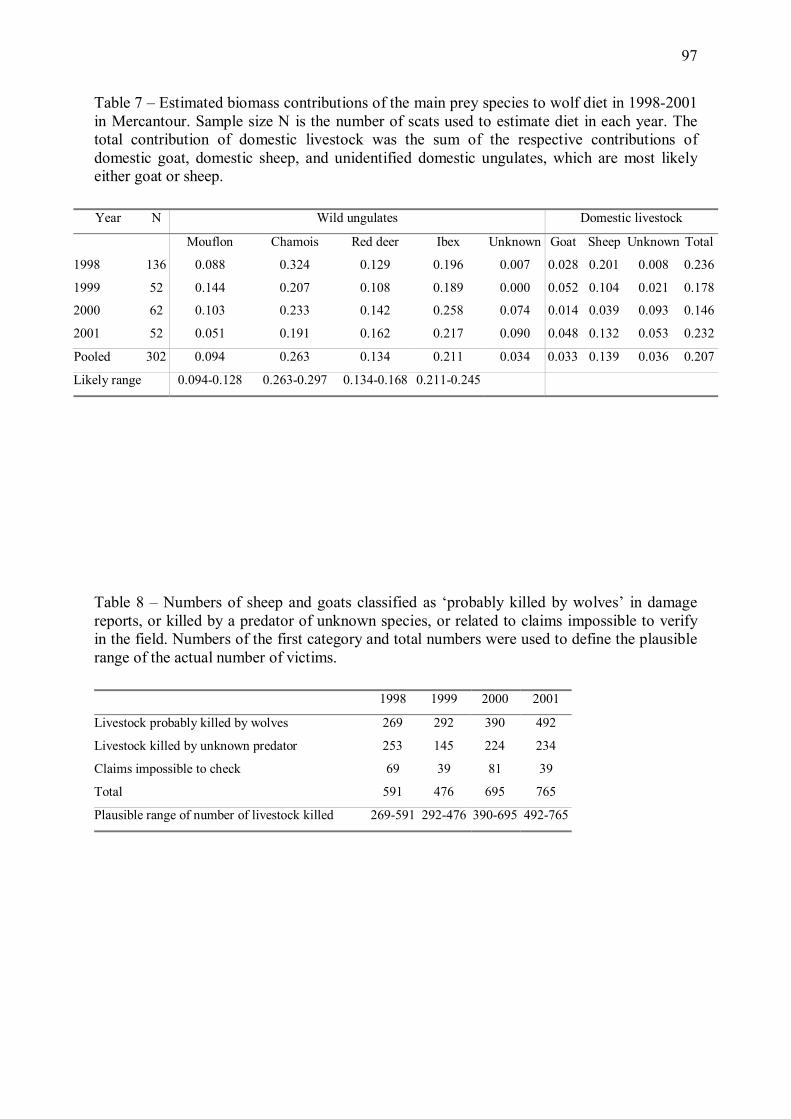
97
Table 7 � Estimated biomass contributions of the main prey species to wolf diet in 1998-2001 in Mercantour. Sample size N is the number of scats used to estimate diet in each year. The total contribution of domestic livestock was the sum of the respective contributions of domestic goat, domestic sheep, and unidentified domestic ungulates, which are most likely either goat or sheep.
Year N Wild ungulates Domestic livestock
Mouflon Chamois Red deer Ibex Unknown Goat Sheep Unknown Total
1998 136 0.088 0.324 0.129 0.196 0.007 0.028 0.201 0.008 0.236
1999 52 0.144 0.207 0.108 0.189 0.000 0.052 0.104 0.021 0.178
2000 62 0.103 0.233 0.142 0.258 0.074 0.014 0.039 0.093 0.146
2001 52 0.051 0.191 0.162 0.217 0.090 0.048 0.132 0.053 0.232
Pooled 302 0.094 0.263 0.134 0.211 0.034 0.033 0.139 0.036 0.207
Likely range 0.094-0.128 0.263-0.297 0.134-0.168 0.211-0.245
Table 8 � Numbers of sheep and goats classified as �probably killed by wolves� in damage reports, or killed by a predator of unknown species, or related to claims impossible to verify in the field. Numbers of the first category and total numbers were used to define the plausible range of the actual number of victims.
1998 1999 2000 2001
Livestock probably killed by wolves 269 292 390 492
Livestock killed by unknown predator 253 145 224 234
Claims impossible to check 69 39 81 39
Total 591 476 695 765
Plausible range of number of livestock killed 269-591 292-476 390-695 492-765
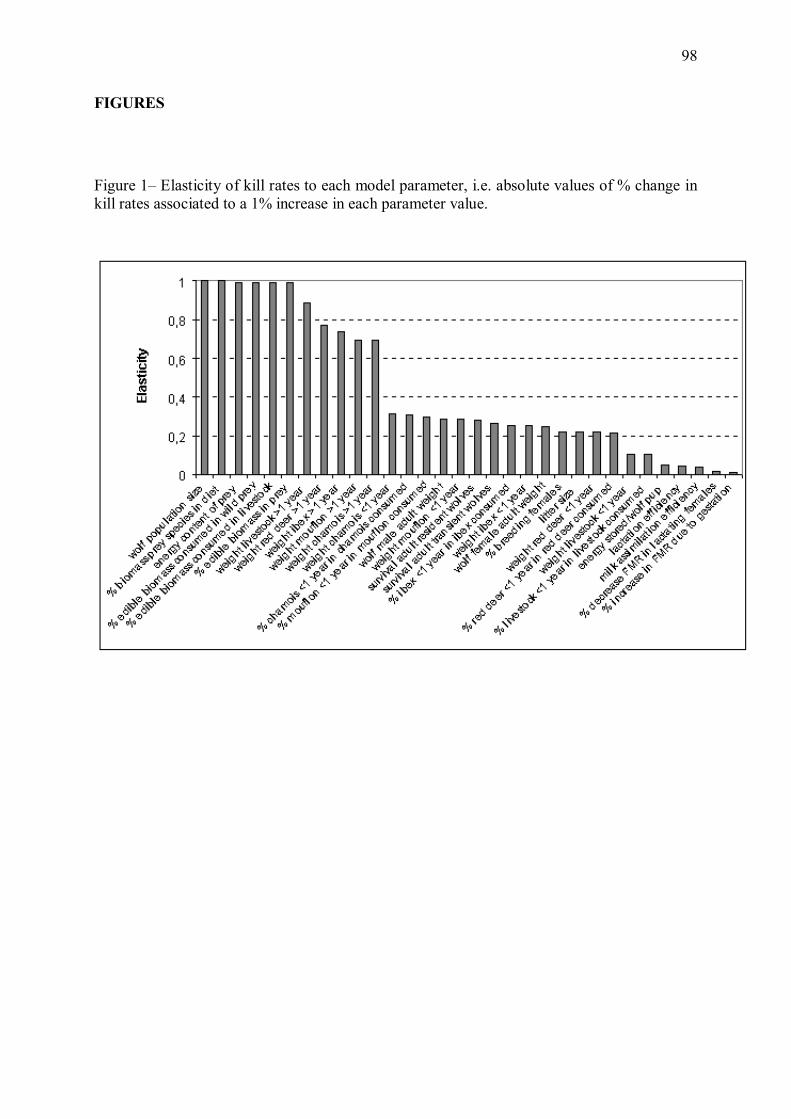
98
FIGURES
Figure 1� Elasticity of kill rates to each model parameter, i.e. absolute values of % change in kill rates associated to a 1% increase in each parameter value.
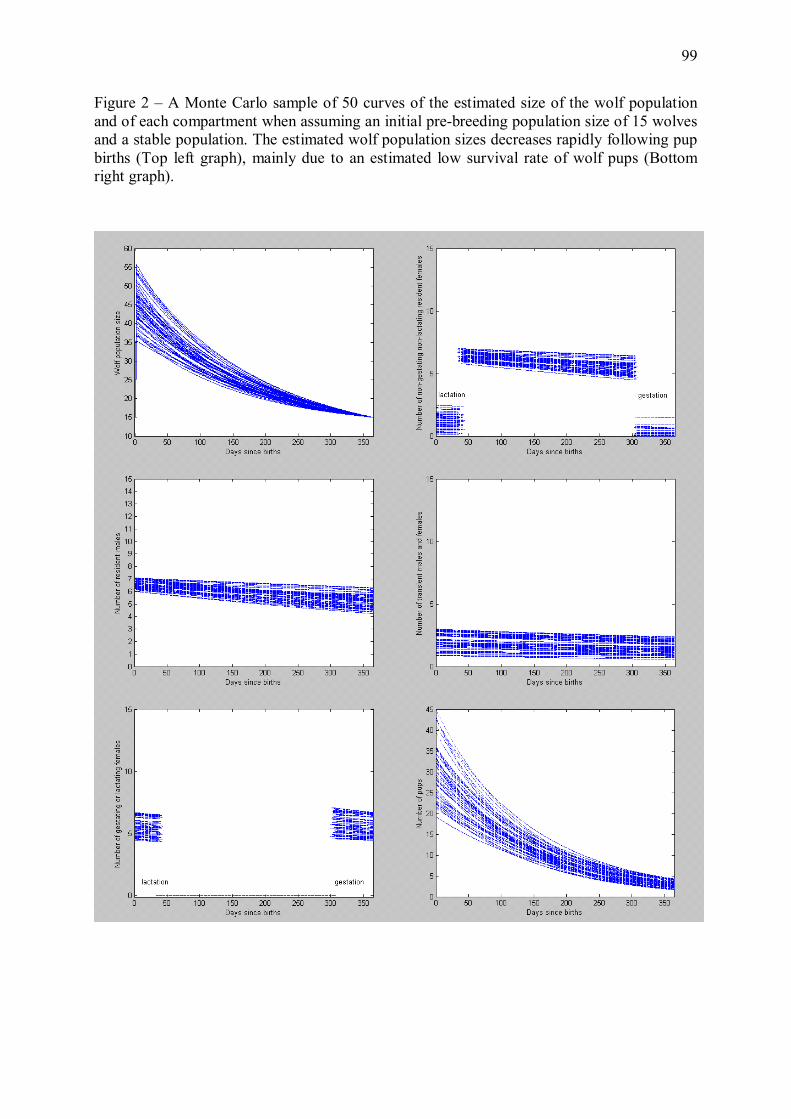
99
Figure 2 � A Monte Carlo sample of 50 curves of the estimated size of the wolf population and of each compartment when assuming an initial pre-breeding population size of 15 wolves and a stable population. The estimated wolf population sizes decreases rapidly following pup births (Top left graph), mainly due to an estimated low survival rate of wolf pups (Bottom right graph).
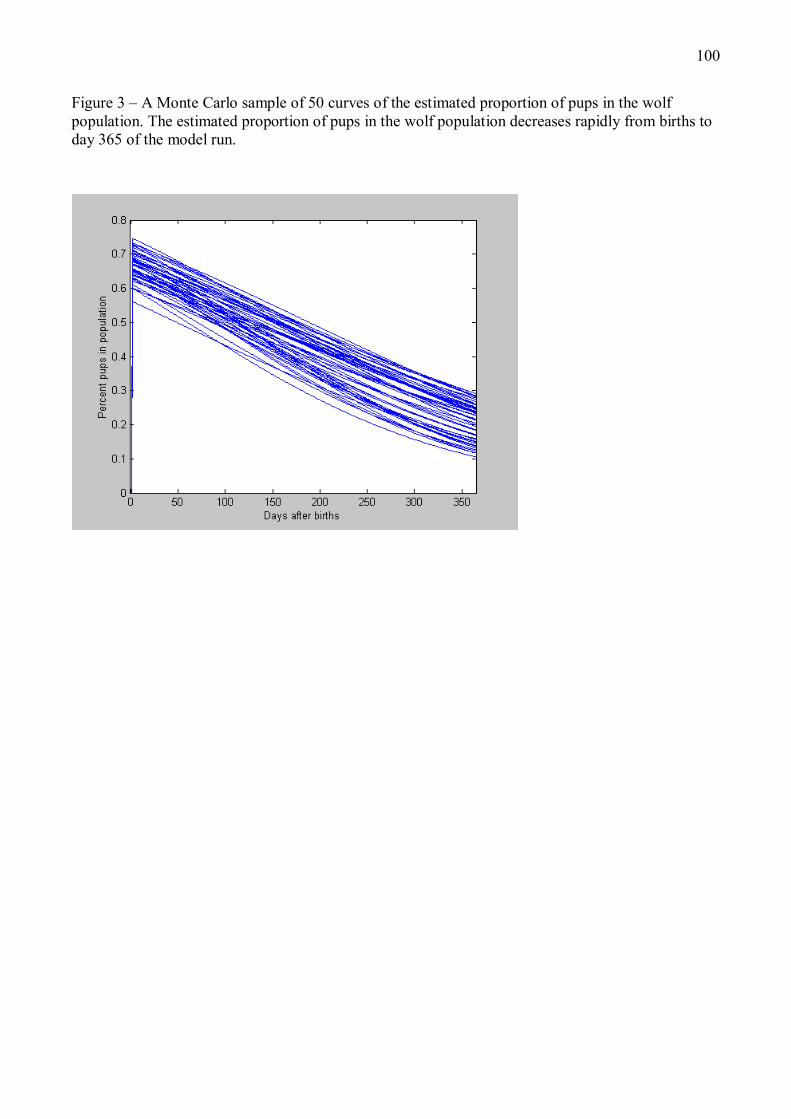
100
Figure 3 � A Monte Carlo sample of 50 curves of the estimated proportion of pups in the wolf population. The estimated proportion of pups in the wolf population decreases rapidly from births to day 365 of the model run.
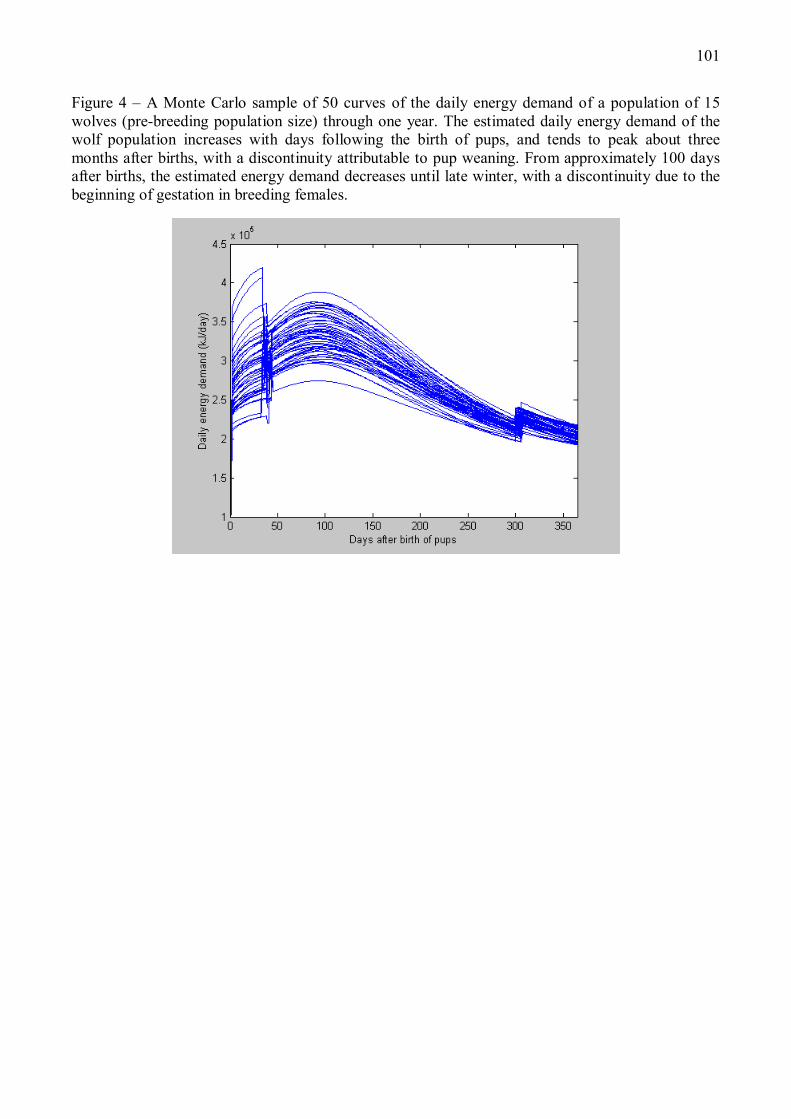
101
Figure 4 � A Monte Carlo sample of 50 curves of the daily energy demand of a population of 15 wolves (pre-breeding population size) through one year. The estimated daily energy demand of the wolf population increases with days following the birth of pups, and tends to peak about three months after births, with a discontinuity attributable to pup weaning. From approximately 100 days after births, the estimated energy demand decreases until late winter, with a discontinuity due to the beginning of gestation in breeding females.
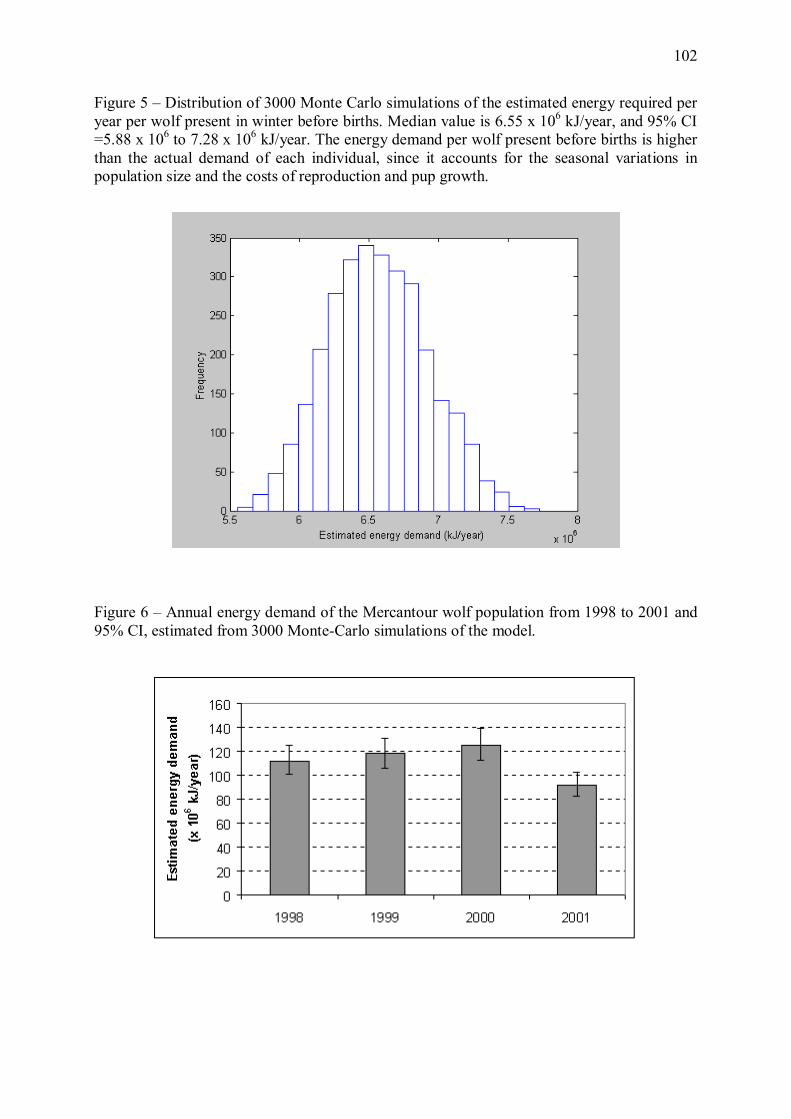
102
Figure 5 � Distribution of 3000 Monte Carlo simulations of the estimated energy required per year per wolf present in winter before births. Median value is 6.55 x 10⁶ kJ/year, and 95% CI =5.88 x 10⁶ to 7.28 x 10⁶ kJ/year. The energy demand per wolf present before births is higher than the actual demand of each individual, since it accounts for the seasonal variations in population size and the costs of reproduction and pup growth.
Figure 6 � Annual energy demand of the Mercantour wolf population from 1998 to 2001 and 95% CI, estimated from 3000 Monte-Carlo simulations of the model.
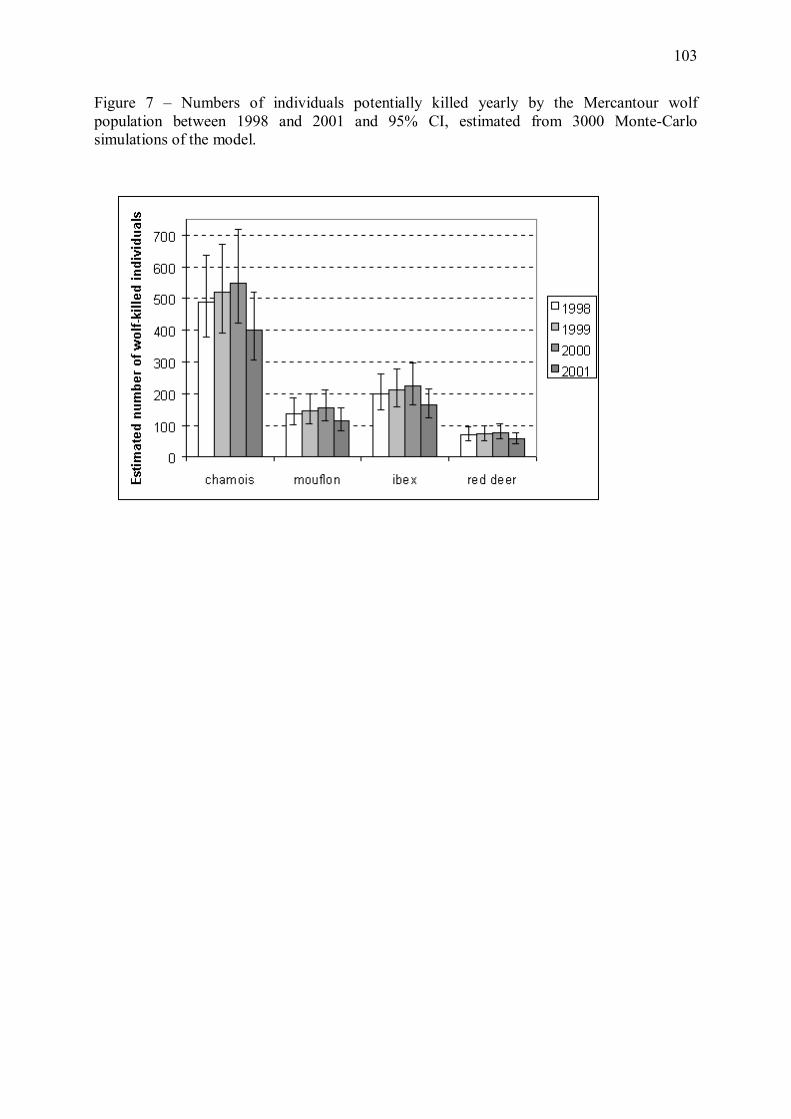
103
Figure 7 � Numbers of individuals potentially killed yearly by the Mercantour wolf population between 1998 and 2001 and 95% CI, estimated from 3000 Monte-Carlo simulations of the model.
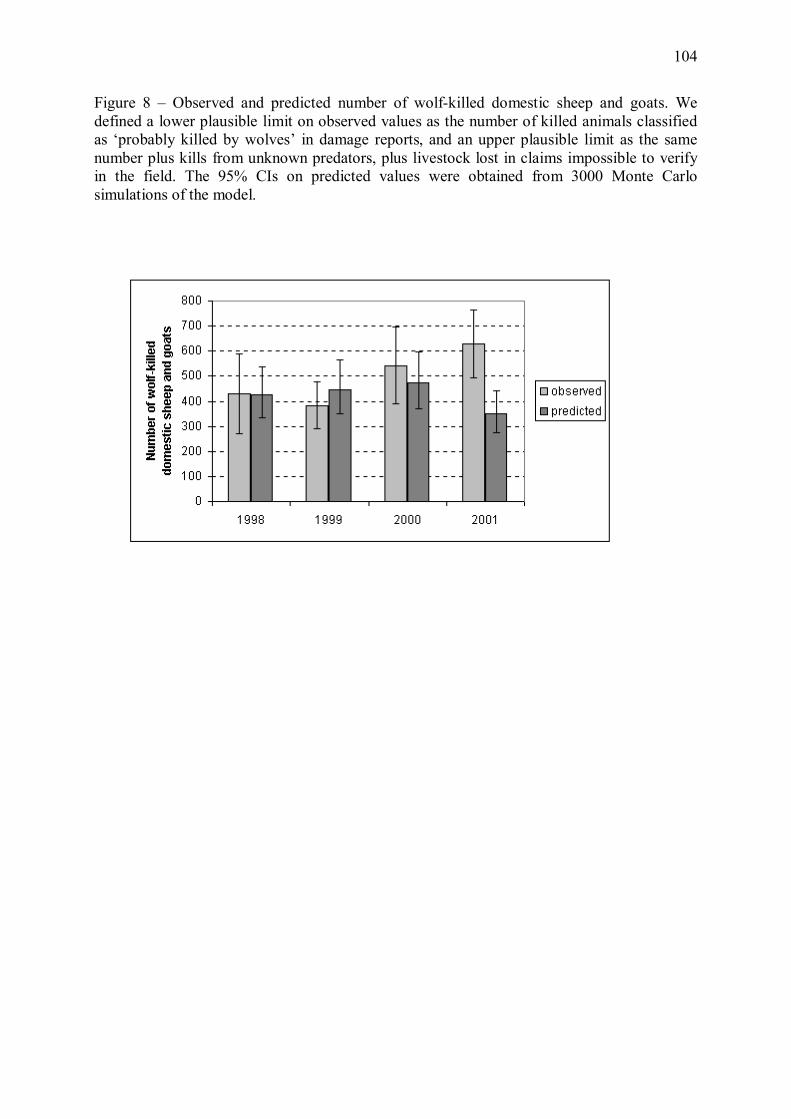
104
Figure 8 � Observed and predicted number of wolf-killed domestic sheep and goats. We defined a lower plausible limit on observed values as the number of killed animals classified as �probably killed by wolves� in damage reports, and an upper plausible limit as the same number plus kills from unknown predators, plus livestock lost in claims impossible to verify in the field. The 95% CIs on predicted values were obtained from 3000 Monte Carlo simulations of the model.

105
Annexe 2
106
Assessing the impact of recolonizing wolves on ungulate populations in
Mercantour
Nathalie Espuno, Benoit Lequette, Olivier Gimenez,
Pierre Migot and Jean-Dominique Lebreton
En préparation pour soumission au
Journal of Wildlife Management
107
INTRODUCTION
The co-exploitation of resources by large carnivores and men is a major source of controversy
(e.g. Boyd 2002, Yodzis 2001), and strong conflicts can arise when the predators are
perceived as competitors because they exploit livestock or game species. Such interactions are
particularly frequent in Western Europe where, owing to increased legal protection and
improved habitat conditions, some large carnivore populations are currently expanding into
areas from which they were extirpated decades ago (Breitenmoser 1998).
Recolonization of the Mercantour range of the Southern French Alps by wolves Canis lupus
(Poulle et al. 2000, Duchamp et al. 2001, Valière et al. 2003) lead to a typical example of
conflict between a population of large carnivores and human activities. Since wolves returned
to Mercantour National Park and surrounding area in the early 1990�s, they have been preying
mainly upon domestic sheep, chamois Rupicapra rupicapra and mouflon Ovis gmelini (Poulle
et al. 1997, 1998, 2000, Duchamp et al. 2001). Both chamois and mouflon are valued game
ungulates, hunted outside the core area of Mercantour national Park, and the impact of wolves
on these species has been a constant source of debate.
The objective of the present work was to synthesize the available information on Mercantour
wolf and prey populations in a modeling framework, to provide a first assessment of the
impact of wolf predation on the mouflon and chamois populations during wolf recolonization
of the area. Due to the difficulty of obtaining field data on prey killing rates, we used an
alternative approach and estimated kill rates with a wolf energy-consumption model that was
previously developed (Annexe 1). In this work, we integrated the bioenergetics model with a
general age-structured matrix model (Caswell 2001) of an ungulate population, to assess
retrospectively the effect of wolf predation on mouflon and chamois population growth rates
between 1993 and 2001. Since little empirical data were available, the models were
parameterized with published estimates or expert knowledge of wolf physiological and
biological parameters and of ungulate vital rates. We assessed how the uncertainty in
parameter estimates translated into uncertainty in ungulate growth rates using Monte-Carlo
simulations (Caswell et al. 1998). We assessed the validity of our models by comparing the
projected ungulate population trends with the observed trends. When the models were
validated by this approach, we used them to estimate the number of wolves that could be
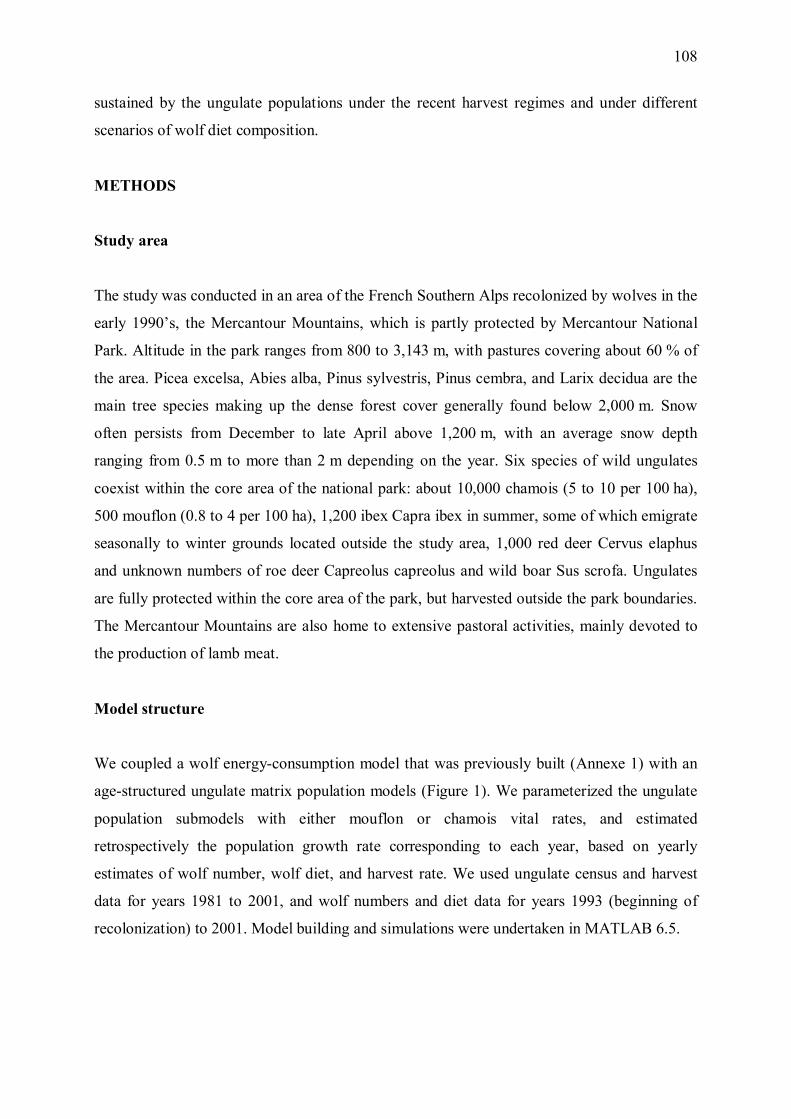
108
sustained by the ungulate populations under the recent harvest regimes and under different
scenarios of wolf diet composition.
METHODS
Study area
The study was conducted in an area of the French Southern Alps recolonized by wolves in the
early 1990�s, the Mercantour Mountains, which is partly protected by Mercantour National
Park. Altitude in the park ranges from 800 to 3,143 m, with pastures covering about 60 % of
the area. Picea excelsa, Abies alba, Pinus sylvestris, Pinus cembra, and Larix decidua are the
main tree species making up the dense forest cover generally found below 2,000 m. Snow
often persists from December to late April above 1,200 m, with an average snow depth
ranging from 0.5 m to more than 2 m depending on the year. Six species of wild ungulates
coexist within the core area of the national park: about 10,000 chamois (5 to 10 per 100 ha),
500 mouflon (0.8 to 4 per 100 ha), 1,200 ibex Capra ibex in summer, some of which emigrate
seasonally to winter grounds located outside the study area, 1,000 red deer Cervus elaphus
and unknown numbers of roe deer Capreolus capreolus and wild boar Sus scrofa. Ungulates
are fully protected within the core area of the park, but harvested outside the park boundaries.
The Mercantour Mountains are also home to extensive pastoral activities, mainly devoted to
the production of lamb meat.
Model structure
We coupled a wolf energy-consumption model that was previously built (Annexe 1) with an
age-structured ungulate matrix population models (Figure 1). We parameterized the ungulate
population submodels with either mouflon or chamois vital rates, and estimated
retrospectively the population growth rate corresponding to each year, based on yearly
estimates of wolf number, wolf diet, and harvest rate. We used ungulate census and harvest
data for years 1981 to 2001, and wolf numbers and diet data for years 1993 (beginning of
recolonization) to 2001. Model building and simulations were undertaken in MATLAB 6.5.

109
Wolf energy-consumption submodel
The energy-consumption submodel estimates the number of young and adult prey killed by
wolves in a year (kill rate), on the basis of wolf pre-breeding population size, wolf diet, and
wolf physiological and biological parameters (Annexe 1). It is composed of a component
describing the dynamics of wolf numbers through the year, coupled to a component
estimating the daily energy requirements of an individual wolf.
Mouflon and chamois population submodels
The ungulate population submodels are deterministic age-structured matrix models, based on
a time step of 1 year, which are modified versions of the matrix model presented by Gaillard
et al. (1998). The models assume pre-breeding censuses, and consider only the female
segments of the populations since a lack of males is unlikely to restrict population growth in
ungulates.
In the absence of empirical data on mouflon and chamois vital rates in Mercantour, we
parameterized the ungulate population submodels with estimates drawn from the literature.
For the Mercantour mouflon population, we assumed vital rates similar to the mean estimates
for bovids provided by Gaillard et al. (2000). We considered 4 age classes: class 1 (age 0 to 1
year) = juveniles, class 2 (age 1 to 2 years) = yearlings, class 3 (age 3 to 11 years) = prime-
aged females, class 4 (≥11 years) = senescent females. Each year a proportion m1 of yearling
females, a proportion m2 of prime-aged females, and a proportion m3 of senescent females
produce young. Assuming that each reproducing female produces f = 1 offspring per year and
that the sex ratio is even, each breeding female thus produces 0.5 female per year (Gaillard et
al. 1998). Each year, a proportion s0 of juveniles, a proportion s1 of yearlings, a proportion s2
of prime-aged females and a proportion s3 of senescent females survive. Prime-aged females
remain in age class 3 during nine successive years before moving to age class 4. Assuming
that the mean generation time for age class 3 is Ta=1/(1-(1-a)s2) (Jean-Dominique Lebreton,
personal communication), the probability that an individual remains in age class 3 from a year
to the next is (1-a)s2 and the probability that an individual of age class 3 moves to age class 4
is as2. The transition probabilities are then obtained by calculating a for Ta=9 years.
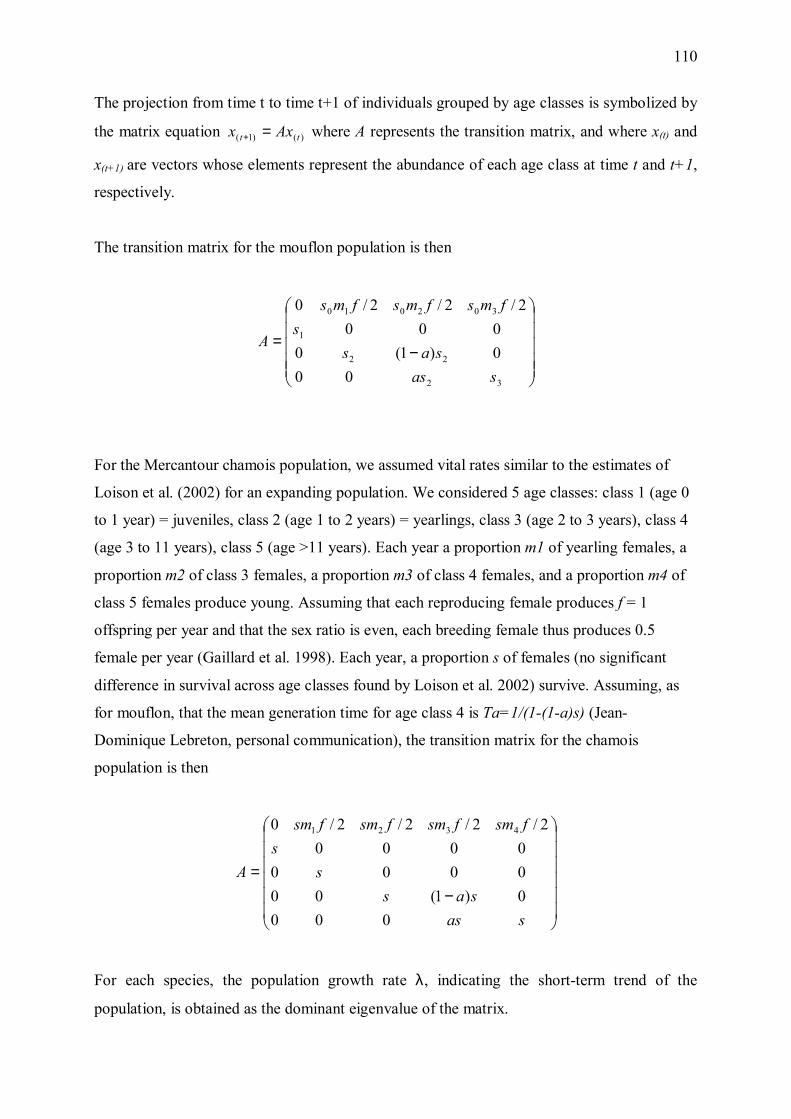
110
The projection from time t to time t+1 of individuals grouped by age classes is symbolized by
the matrix equation )()1( tt Axx =+ where A represents the transition matrix, and where x(t) and
x(t+1) are vectors whose elements represent the abundance of each age class at time t and t+1,
respectively.
The transition matrix for the mouflon population is then
−=
32
22
1
302010
000)1(0000
2/2/2/0
sassas
sfmsfmsfms
A
For the Mercantour chamois population, we assumed vital rates similar to the estimates of
Loison et al. (2002) for an expanding population. We considered 5 age classes: class 1 (age 0
to 1 year) = juveniles, class 2 (age 1 to 2 years) = yearlings, class 3 (age 2 to 3 years), class 4
(age 3 to 11 years), class 5 (age >11 years). Each year a proportion m1 of yearling females, a
proportion m2 of class 3 females, a proportion m3 of class 4 females, and a proportion m4 of
class 5 females produce young. Assuming that each reproducing female produces f = 1
offspring per year and that the sex ratio is even, each breeding female thus produces 0.5
female per year (Gaillard et al. 1998). Each year, a proportion s of females (no significant
difference in survival across age classes found by Loison et al. 2002) survive. Assuming, as
for mouflon, that the mean generation time for age class 4 is Ta=1/(1-(1-a)s) (Jean-
Dominique Lebreton, personal communication), the transition matrix for the chamois
population is then
−=
sassas
ss
fsmfsmfsmfsm
A
0000)1(0000000000
2/2/2/2/0 4321
For each species, the population growth rate λ, indicating the short-term trend of the
population, is obtained as the dominant eigenvalue of the matrix.
111
Coupling the wolf energy-consumption submodel and the ungulate population submodel
The wolf energy-consumption submodel provides estimates of prey killing rates, which are
combined with estimates of ungulate population size to obtain age-specific predation rates
(proportion of the population removed by wolves), assuming that juveniles compose on
average 25% of the mouflon and chamois populations (Jean-Michel Gaillard, personal
communication). Harvest rates are obtained from data on the yearly numbers of juveniles and
adults harvested and from estimates of ungulate population sizes. Predation and harvest rates
are then used to affect age-specific survivals in the ungulate population submodel.
Estimating mouflon and chamois population sizes
Estimates of yearly mouflon and chamois population sizes were based on ground censuses
performed during the fall, in the western and in the eastern part of Mercantour national Park,
separately, and at irregular time intervals (Mercantour national Park data, Tables 1 and 2).
Because censuses were incomplete in most years, we needed to interpolate existing estimates
to be able to produce estimates of total population sizes for each year. We thus modeled the
log(number of mouflons counted) and the log(number of chamois counted) as a function of
the year and the site (western vs. eastern part of the park). For each response variable, we
built a general model including main effects of factors YEAR, YEAR2, YEAR3, SITE, and
second-order interactions of YEAR and SITE, of YEAR2 and SITE and of YEAR3 and SITE.
We used a step-down procedure to model selection, suppressing interaction terms or main
effects from the general model to minimize the Akaike Information Criterion (AIC, Burnham
and Anderson 1998). When the difference in AIC between two models was smaller than 2, the
simpler model was preferred (Burnham and Anderson 1998). Goodness of fit of the preferred
models of mouflon and chamois counts was assessed visually by plotting model residuals
against fitted values. We calculated the proportion of deviance explained by effects included
in the preferred models, which is analogous to its coefficient of determination (Agresti 1990).
We used the preferred models to interpolate the total numbers of mouflons and chamois that
would have been counted each year in each site, and summed estimates of the two sites to
obtain estimated yearly counts of each species over the whole study area. For each ungulate
species, these estimates for year i were denoted Ni.
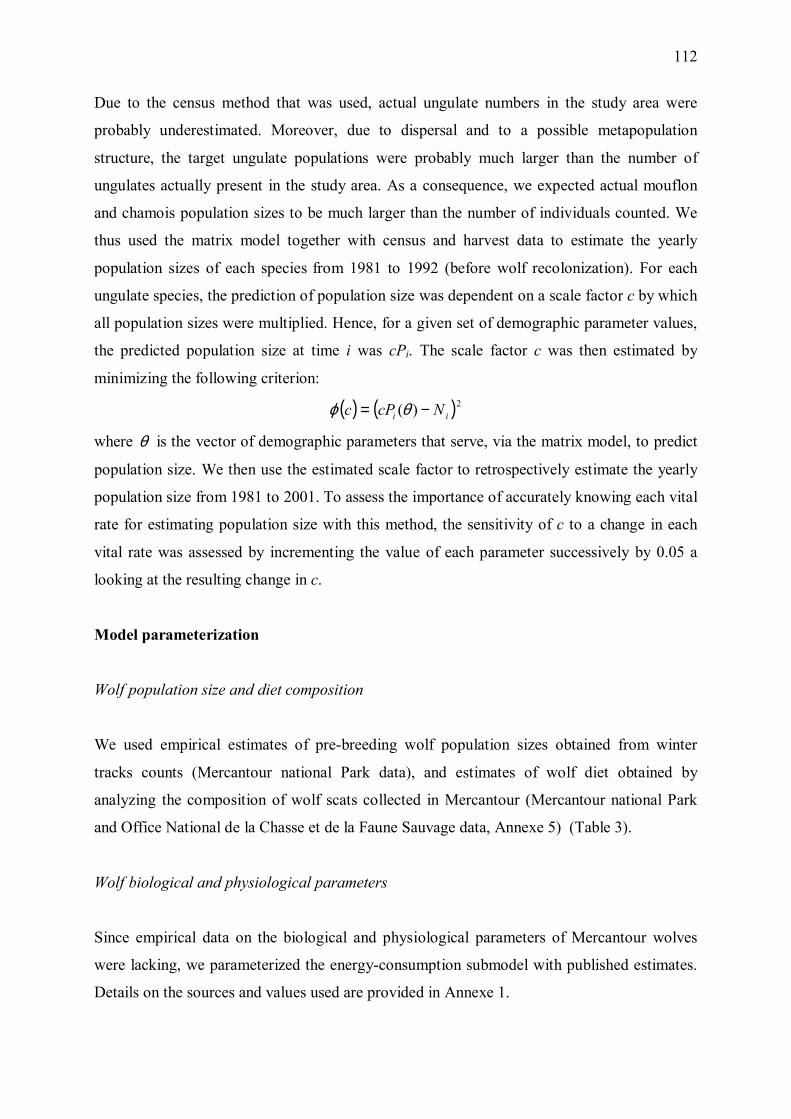
112
Due to the census method that was used, actual ungulate numbers in the study area were
probably underestimated. Moreover, due to dispersal and to a possible metapopulation
structure, the target ungulate populations were probably much larger than the number of
ungulates actually present in the study area. As a consequence, we expected actual mouflon
and chamois population sizes to be much larger than the number of individuals counted. We
thus used the matrix model together with census and harvest data to estimate the yearly
population sizes of each species from 1981 to 1992 (before wolf recolonization). For each
ungulate species, the prediction of population size was dependent on a scale factor c by which
all population sizes were multiplied. Hence, for a given set of demographic parameter values,
the predicted population size at time i was cPi. The scale factor c was then estimated by
minimizing the following criterion:
( ) ( )2)( ii NcPc −= θϕ
where θ is the vector of demographic parameters that serve, via the matrix model, to predict
population size. We then use the estimated scale factor to retrospectively estimate the yearly
population size from 1981 to 2001. To assess the importance of accurately knowing each vital
rate for estimating population size with this method, the sensitivity of c to a change in each
vital rate was assessed by incrementing the value of each parameter successively by 0.05 a
looking at the resulting change in c.
Model parameterization
Wolf population size and diet composition
We used empirical estimates of pre-breeding wolf population sizes obtained from winter
tracks counts (Mercantour national Park data), and estimates of wolf diet obtained by
analyzing the composition of wolf scats collected in Mercantour (Mercantour national Park
and Office National de la Chasse et de la Faune Sauvage data, Annexe 5) (Table 3).
Wolf biological and physiological parameters
Since empirical data on the biological and physiological parameters of Mercantour wolves
were lacking, we parameterized the energy-consumption submodel with published estimates.
Details on the sources and values used are provided in Annexe 1.
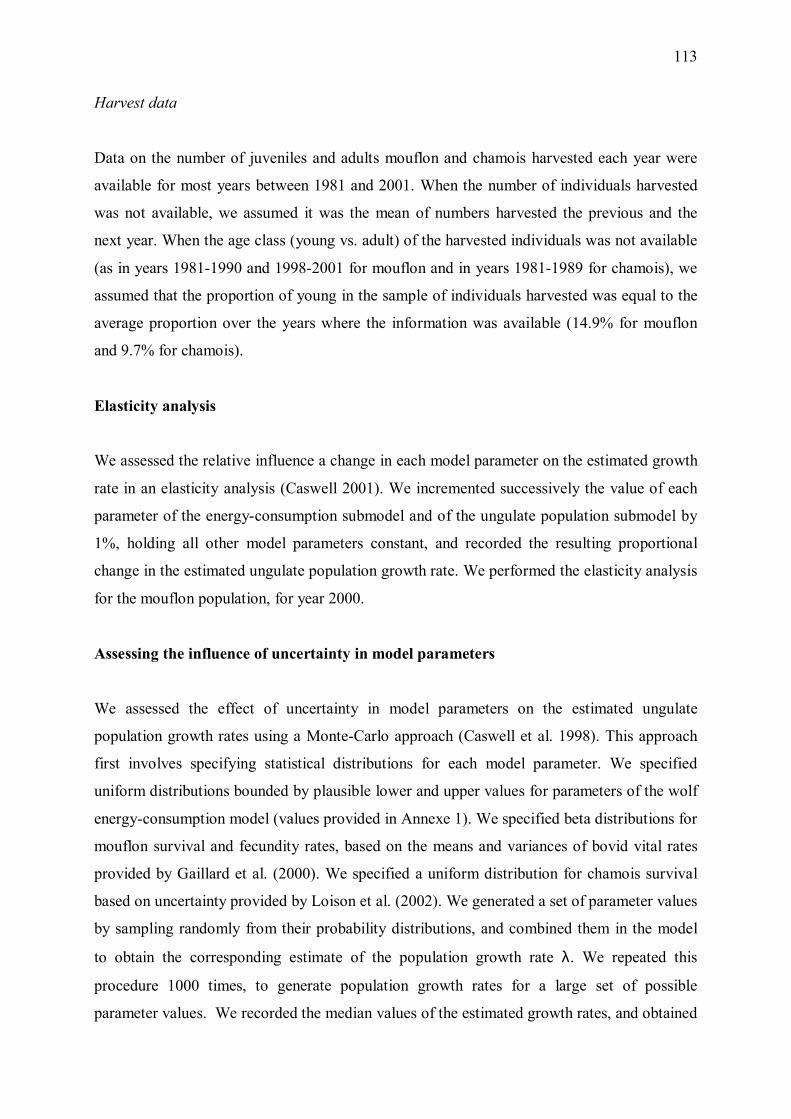
113
Harvest data
Data on the number of juveniles and adults mouflon and chamois harvested each year were
available for most years between 1981 and 2001. When the number of individuals harvested
was not available, we assumed it was the mean of numbers harvested the previous and the
next year. When the age class (young vs. adult) of the harvested individuals was not available
(as in years 1981-1990 and 1998-2001 for mouflon and in years 1981-1989 for chamois), we
assumed that the proportion of young in the sample of individuals harvested was equal to the
average proportion over the years where the information was available (14.9% for mouflon
and 9.7% for chamois).
Elasticity analysis
We assessed the relative influence a change in each model parameter on the estimated growth
rate in an elasticity analysis (Caswell 2001). We incremented successively the value of each
parameter of the energy-consumption submodel and of the ungulate population submodel by
1%, holding all other model parameters constant, and recorded the resulting proportional
change in the estimated ungulate population growth rate. We performed the elasticity analysis
for the mouflon population, for year 2000.
Assessing the influence of uncertainty in model parameters
We assessed the effect of uncertainty in model parameters on the estimated ungulate
population growth rates using a Monte-Carlo approach (Caswell et al. 1998). This approach
first involves specifying statistical distributions for each model parameter. We specified
uniform distributions bounded by plausible lower and upper values for parameters of the wolf
energy-consumption model (values provided in Annexe 1). We specified beta distributions for
mouflon survival and fecundity rates, based on the means and variances of bovid vital rates
provided by Gaillard et al. (2000). We specified a uniform distribution for chamois survival
based on uncertainty provided by Loison et al. (2002). We generated a set of parameter values
by sampling randomly from their probability distributions, and combined them in the model
to obtain the corresponding estimate of the population growth rate λ. We repeated this
procedure 1000 times, to generate population growth rates for a large set of possible
parameter values. We recorded the median values of the estimated growth rates, and obtained
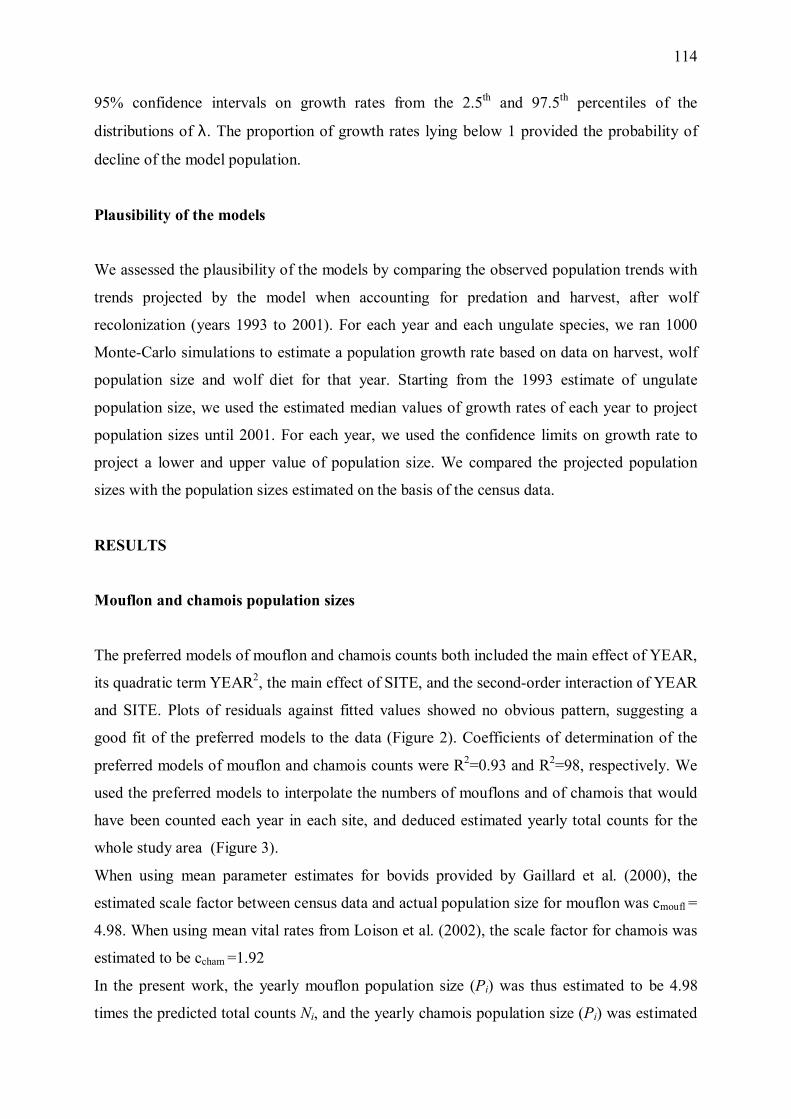
114
95% confidence intervals on growth rates from the 2.5th and 97.5th percentiles of the
distributions of λ. The proportion of growth rates lying below 1 provided the probability of
decline of the model population.
Plausibility of the models
We assessed the plausibility of the models by comparing the observed population trends with
trends projected by the model when accounting for predation and harvest, after wolf
recolonization (years 1993 to 2001). For each year and each ungulate species, we ran 1000
Monte-Carlo simulations to estimate a population growth rate based on data on harvest, wolf
population size and wolf diet for that year. Starting from the 1993 estimate of ungulate
population size, we used the estimated median values of growth rates of each year to project
population sizes until 2001. For each year, we used the confidence limits on growth rate to
project a lower and upper value of population size. We compared the projected population
sizes with the population sizes estimated on the basis of the census data.
RESULTS
Mouflon and chamois population sizes
The preferred models of mouflon and chamois counts both included the main effect of YEAR,
its quadratic term YEAR2, the main effect of SITE, and the second-order interaction of YEAR
and SITE. Plots of residuals against fitted values showed no obvious pattern, suggesting a
good fit of the preferred models to the data (Figure 2). Coefficients of determination of the
preferred models of mouflon and chamois counts were R2=0.93 and R2=98, respectively. We
used the preferred models to interpolate the numbers of mouflons and of chamois that would
have been counted each year in each site, and deduced estimated yearly total counts for the
whole study area (Figure 3).
When using mean parameter estimates for bovids provided by Gaillard et al. (2000), the
estimated scale factor between census data and actual population size for mouflon was cmoufl =
4.98. When using mean vital rates from Loison et al. (2002), the scale factor for chamois was
estimated to be ccham =1.92
In the present work, the yearly mouflon population size (Pi) was thus estimated to be 4.98
times the predicted total counts Ni, and the yearly chamois population size (Pi) was estimated
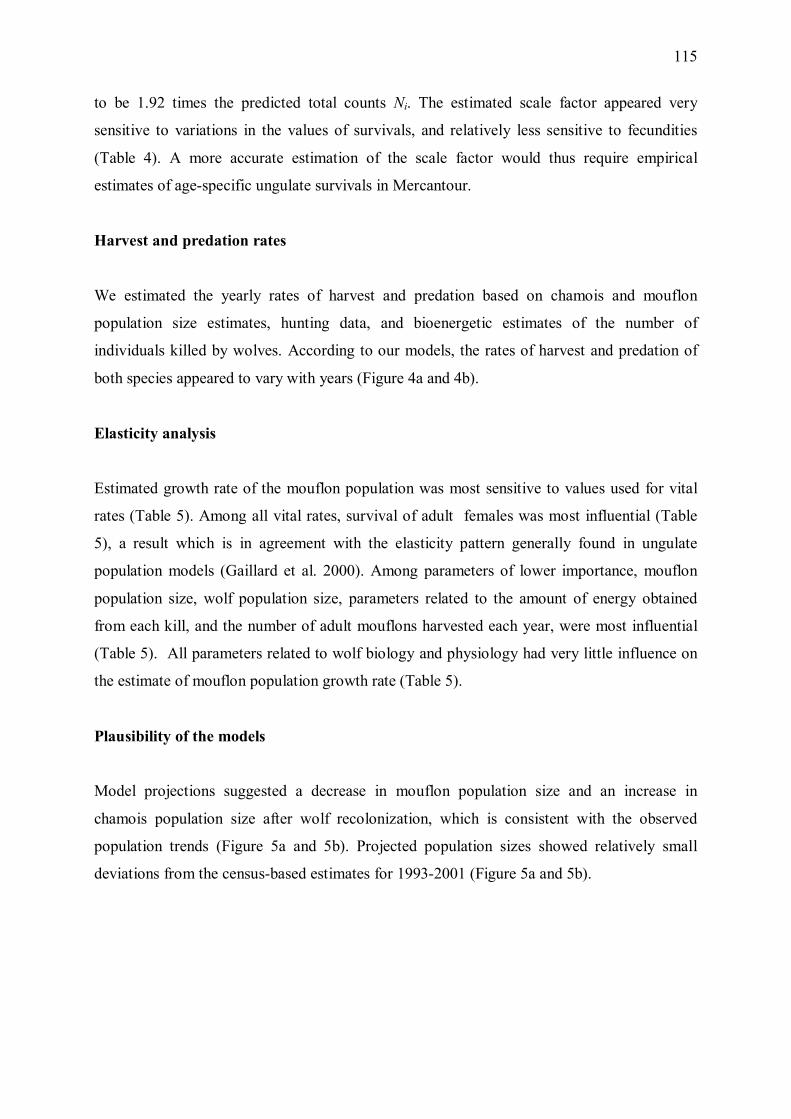
115
to be 1.92 times the predicted total counts Ni. The estimated scale factor appeared very
sensitive to variations in the values of survivals, and relatively less sensitive to fecundities
(Table 4). A more accurate estimation of the scale factor would thus require empirical
estimates of age-specific ungulate survivals in Mercantour.
Harvest and predation rates
We estimated the yearly rates of harvest and predation based on chamois and mouflon
population size estimates, hunting data, and bioenergetic estimates of the number of
individuals killed by wolves. According to our models, the rates of harvest and predation of
both species appeared to vary with years (Figure 4a and 4b).
Elasticity analysis
Estimated growth rate of the mouflon population was most sensitive to values used for vital
rates (Table 5). Among all vital rates, survival of adult females was most influential (Table
5), a result which is in agreement with the elasticity pattern generally found in ungulate
population models (Gaillard et al. 2000). Among parameters of lower importance, mouflon
population size, wolf population size, parameters related to the amount of energy obtained
from each kill, and the number of adult mouflons harvested each year, were most influential
(Table 5). All parameters related to wolf biology and physiology had very little influence on
the estimate of mouflon population growth rate (Table 5).
Plausibility of the models
Model projections suggested a decrease in mouflon population size and an increase in
chamois population size after wolf recolonization, which is consistent with the observed
population trends (Figure 5a and 5b). Projected population sizes showed relatively small
deviations from the census-based estimates for 1993-2001 (Figure 5a and 5b).

116
Model predictions
Mouflon
According to 1000 Monte-Carlo simulations of the model, potential growth rate of the
mouflon population without harvest and predation was λ = 1.062 (95%CI=1.026-1.092) based
on the average vital rates for bovids that were used.
Before wolf recolonization, the increasing rate of mouflon harvest resulted in a decreasing
trend of the population growth rate, with estimates of λ ranging from 1.052 (95%CI=1.021-
1.085) in 1981 to 1.027 (95%CI=0.988-1.058) in 1990. As a result, the estimated probability
of decline of the mouflon population reached 0.03 to 0.07 in 1990-1992.
After wolf recolonization, the estimated mouflon growth rate declined rapidly under the joint
effects of harvest and predation. Estimated probabilities of decline of the population were at
least 0.99 in all years except 1998 (Figure 6a). According to the model, the combination of
predation and harvest thus appeared clearly unsustainable from 1995 on. This result is
consistent with the observed decreasing trend in the mouflon population after wolf
recolonization (Figure 3a).
Chamois
Running 1000 Monte-Carlo simulations of the chamois population model without predation
and harvest yielded a chamois potential growth rate λ = 1.24 (95%CI=1.19-1.28).
Before wolf recolonization, the estimated growth rate of the chamois population remained
higher than 1, and followed an increasing trend over the years, ranging from 1.022 in 1981 to
1.110 in 1992 (Figure 6b).
After wolf recolonization, the combined effects of harvest and predation seemed to result in a
stabilization of the chamois population growth rate in the range 1.095-1.110 (Figure 6b). The
combined rates of harvest and predation thus seemed sustainable by the chamois population
117
during the whole study period. These results are consistent with the observed increasing trend
of the chamois population (Figure 3b).
DISCUSSION
The aim of the present work was to provide a synthesis of the available data on wolf and prey
populations in a modelling framework, in order to provide a first insight into the impact of
wolves on their main prey populations in Mercantour. The validity of results presented here is
conditional on the assumption that parameters estimates that we used were realistic for the
Mercantour wolf, chamois and mouflon populations. Using a Monte-Carlo approach allowed
to compensate in part for the potential use of inaccurate parameter values, because this
approach involved including a wide range of values to reflect uncertainty in these parameters,
randomizing the parameter values within these ranges, and simultaneously varying the values
of all parameters. The models allowed reconstructing the observed trends of the prey
populations, suggesting that they captured the essential dynamics of the system. However, the
scale factor estimated for the mouflon population (c ≈ 4.9) may not be plausible, suggesting
that actual mouflon vital rates in Mercantour may differ from average bovids parameters. The
present analysis may be improved in the future by using empirical estimates of mouflon vital
rates if they become available.
Our models suggested that the growth rate of the chamois population remained consistently
higher that 1 despite harvest and predation, i.e. the total rate of chamois uptake by wolves and
hunters was sustainable by the population during the whole study period. On the other hand,
the mouflon model suggested that the combination if harvest and predation was unsustainable,
and was likely responsible for the observed mouflon population decline between 1993 and
2001.
Elasticity of the estimated growth rate to adult ungulate survival was found to be 7 times
higher than elasticity to juvenile survival, a typical pattern of ungulate population models
(Gaillard et al. 2000), revealing that the loss of an adult would have a much greater impact on
the population growth rate than the loss of a young. According to our models and to our
assumptions regarding wolf selectivity for prey (Annexe 1), the ratio of the number of adults
to the number of young in the sample of ungulates killed by wolves was approximately 1.2.
However, that ratio was 5.5 for mouflon and 9.3 for chamois in the samples of ungulates
118
killed by hunters, suggesting that hunters were more selective for adult ungulates than were
wolves. As a result, the harvest of an individual by hunters may have had, on average, a
greater impact on the population than the kill of an individual by wolves. This elasticity
pattern also suggests that gaining information on the actual ratio adults/young in the sample of
ungulates killed by wolves would be particularly useful to make more accurate estimations of
wolf impact on prey populations.
Although the models predicted ungulate population trends that were consistent with the
observed trends, projected population sizes tended to be higher than census-based estimates.
This tendency might suggest that we underestimated the rates of wolf predation, possibly due
to problems with the estimation of wolf population size or diet, the most sensitive parameters
of the energy-consumption model (Annexe 1). Alternatively, this tendency could also suggest
that ungulate vital rates varied with years, since incorporating such a variability into the
models would tend to depress population trends relative to a population with no variability
and the same mean parameter values (Caswell 2001). Variation of vital rates among years as a
result of environmental variation is probably very common in natural systems, but we lacked
empirical data to explicitly account for environmental stochasticity and thus chose to ignore it
in this preliminary work.
Populations of chamois and mouflon were probably at different proportions of their maximum
carrying capacity in Mercantour, but we had no data allowing to assess the existence of
density-dependent effects and we thus chose to leave that feature out of the models. As a
result, our models assumed that variation in ungulate numbers could be described by density-
independent matrix models. The assumption of density independence seemed reasonable in
this case since we were able to correctly reconstruct the observed population trends.
Compensatory variation of vital rates, for example increases in fecundity or juvenile survival,
could partly offset the effect of decreased survival due to predation or harvest. Such a
phenomenon would lead to a lower impact of predation and harvest than predicted by the
models. Moreover, compensatory mortality, i.e. uptake of individuals that would otherwise
have died of other causes in the same year, would lead as well to an overestimation of the
impact of predation or harvest by the models. The tendency of the model projections to be
higher than census-based estimates of population size suggested that the effects of these
various forms of compensation were either of minor importance, or hidden by other effects
that we did not take into account.

119
In this work, we assumed that harvest and predation mortalities were additive. Different
scenarios reflecting various degrees of compensation, which will lead to a lower impact of
predation or harvest, should also be studied in the future.
The population models were kept simple because we did not have sufficient knowledge of the
mouflon and chamois population processes to justify more complex models at this point. This
work is a preliminary retrospective assessment of the impact of wolves on populations of their
main prey during wolf recolonisation of the Mercantour Mountains; the analysis could be
refined in the future, particularly if empirical data on ungulate vital rates become available.
However the present work showed that, in such a complex and poorly known predator-prey
system, the modelling approach we used allowed to provide information that may be useful
for management purposes, based on a synthesis of the available data.
120
REFERENCES CITED
Agresti, A., 1990. Categorical data analysis. John Wiley & Sons, New-York, USA.
Boyd, I. L., 2002. Estimating food consumption of marine predators: Antarctic fur seals and
macaroni pinguins. J. Appl. Ecol. 39:103-119.
Breitenmoser, U., 1998. Large predators in the Alps: the fall and rise of man�s competitors.
Biological Conservation 83(3):279-289.
Burnham, K. P. and D. R. Anderson, 1998. Model selection and inference, a practical
information-theoretic approach. Springer.
Caswell, H., S. Brault, A.J. Read and T.D. Smith, 1998. Harbor porpoise and fisheries: an
uncertainty analysis of incidental mortality. Ecol. Appl. 8(4): 1126-1238.
Caswell, H., 2001. Matrix population models. Construction, analysis and interpretation. 2nd
edition. Sinauer Associates Inc., publishers. Sunderland, USA.
Duchamp, C., V. Genevey, F. Favier, T. Dahier, R. de Beaufort, C. Durand, P. Oléon et M.
Pion, 2001. Programme LIFE Nature : « Le retour du loup dans les Alpes Françaises ».
Rapport d�activité 2000, Ministère de l�Aménagement du Territoire et de l�Environnement.
Espuno, N., 2004. Impact du loup sur les ongulés sauvages et domestiques dans le massif du
Mercantour. Thèse de doctorat. Université Montpellier II.
Gaillard, J.-M., Festa-Bianchet, M., Yoccoz, N.G., Loison, A. and Toïgo, C., 2000. Temporal
variation in fitness components and population dynamics of large herbivores. Annual Review
of Ecology and Systematics, 31: 367-393.
Loison A., Toïgo, C., Appolinaire, J. and Michallet, J., 2002. Population dynamics and
demographic processes in colonising populations of ungulates: chamois and ibex as case
studies. Journal of Zoology, London, 256: 199-205.
121
Poulle, M.-L., Carles, L. and Lequette, B., 1997. Significance of ungulates in the diet of
recently settled wolves in the Mercantour mountains (southeastern France). Revue d�Ecologie
(Terre Vie), 52:357-368.
Poulle, M.-L, Houard, T. and Lequette, B., 1998. Prédation exercée par le loup sur le mouflon
et le chamois dans le massif du Mercantour (sud-est de la France). Gibier Faune Sauvage,
Game Wildlife, 15 (Hors série Tome 1).
Poulle, M.-L., T. Dahier, R. de Beaufort and C. Durand, 2000. Le loup en France. Programme
Life Nature. Rapport Final 1997-1999.
Valière, N., L. Fumagalli, L. Gielly, C. Miquel, B. Lequette, M.-L. Poulle, J.-M. Weber, R.
Arlettaz and P. Taberlet, 2003. Long-distance wolf recolonization of France and Switzerland
inferred from non-invasive genetic sampling over a period of 10 years. Animal Conservation
6 Part I:83-92.
Yodzis, P., 2001. Must top predators be culled for the sake of fisheries? Trends in Ecology
and Evolution 16(2): 78-84.
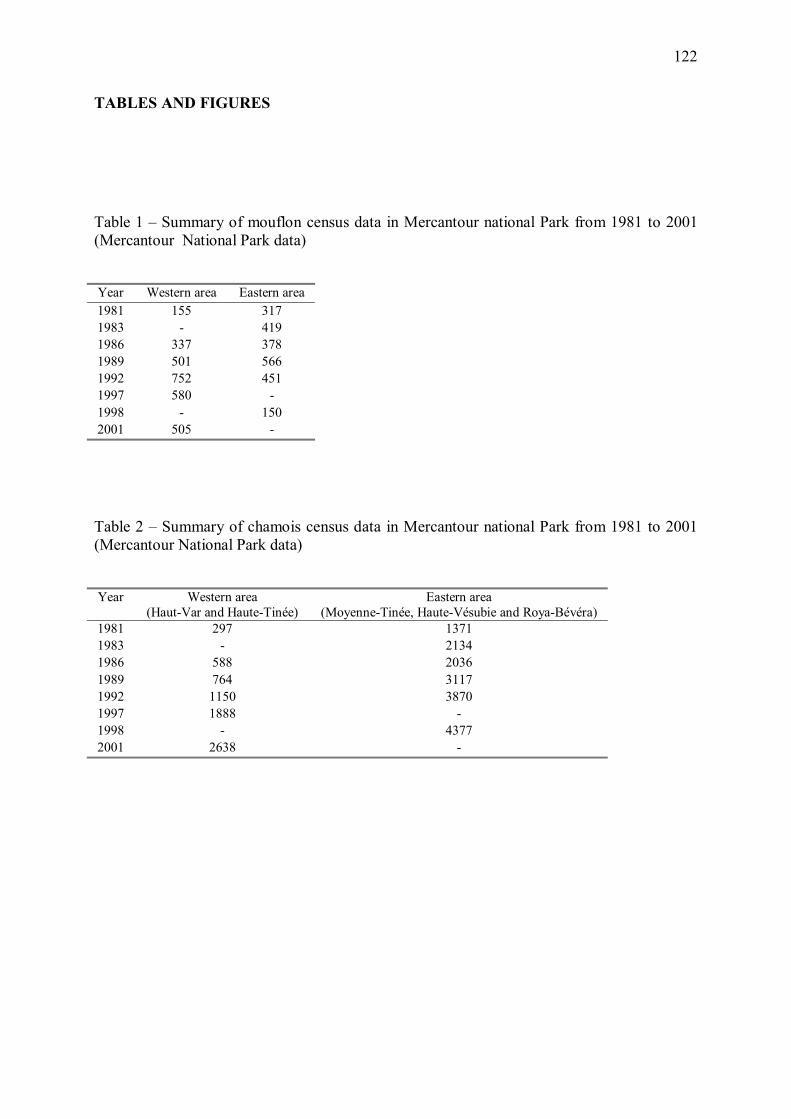
122
TABLES AND FIGURES
Table 1 � Summary of mouflon census data in Mercantour national Park from 1981 to 2001 (Mercantour National Park data) Year Western area Eastern area 1981 155 317 1983 - 419 1986 337 378 1989 501 566 1992 752 451 1997 580 - 1998 - 150 2001 505 - Table 2 � Summary of chamois census data in Mercantour national Park from 1981 to 2001 (Mercantour National Park data) Year Western area
(Haut-Var and Haute-Tinée) Eastern area
(Moyenne-Tinée, Haute-Vésubie and Roya-Bévéra) 1981 297 1371 1983 - 2134 1986 588 2036 1989 764 3117 1992 1150 3870 1997 1888 - 1998 - 4377 2001 2638 -
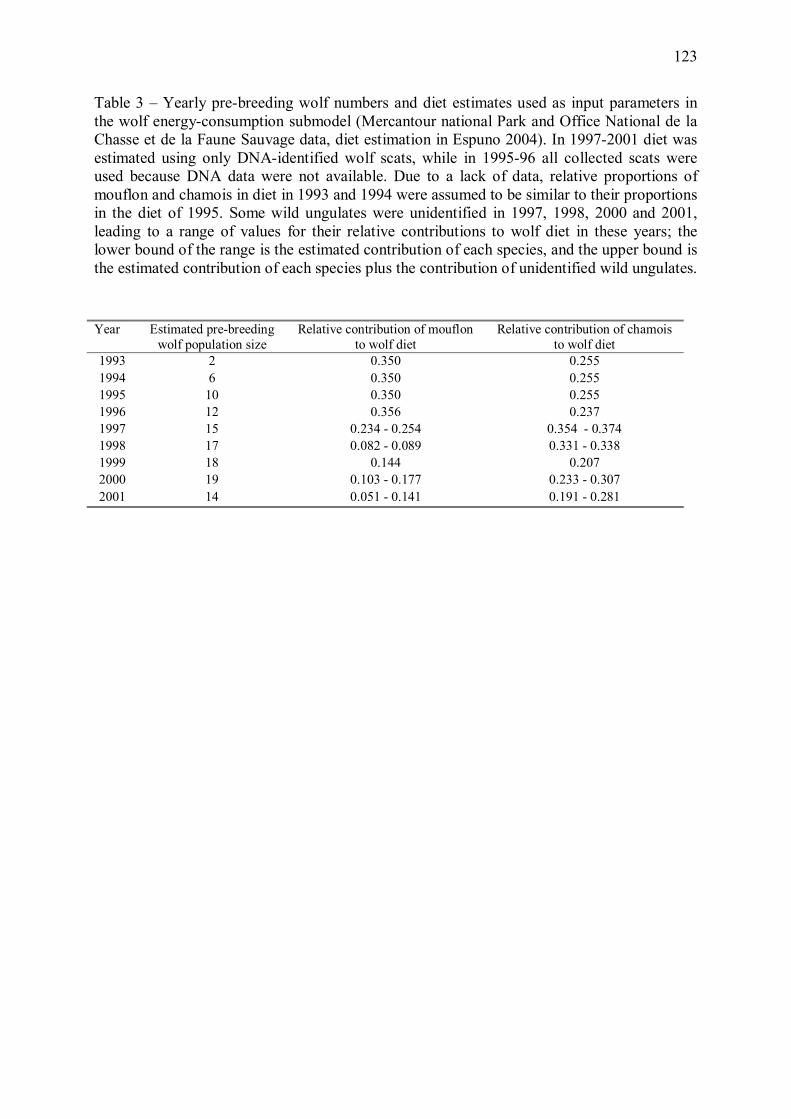
123
Table 3 � Yearly pre-breeding wolf numbers and diet estimates used as input parameters in the wolf energy-consumption submodel (Mercantour national Park and Office National de la Chasse et de la Faune Sauvage data, diet estimation in Espuno 2004). In 1997-2001 diet was estimated using only DNA-identified wolf scats, while in 1995-96 all collected scats were used because DNA data were not available. Due to a lack of data, relative proportions of mouflon and chamois in diet in 1993 and 1994 were assumed to be similar to their proportions in the diet of 1995. Some wild ungulates were unidentified in 1997, 1998, 2000 and 2001, leading to a range of values for their relative contributions to wolf diet in these years; the lower bound of the range is the estimated contribution of each species, and the upper bound is the estimated contribution of each species plus the contribution of unidentified wild ungulates. Year Estimated pre-breeding
wolf population size Relative contribution of mouflon
to wolf diet Relative contribution of chamois
to wolf diet 1993 2 0.350 0.255 1994 6 0.350 0.255 1995 10 0.350 0.255 1996 12 0.356 0.237 1997 15 0.234 - 0.254 0.354 - 0.374 1998 17 0.082 - 0.089 0.331 - 0.338 1999 18 0.144 0.207 2000 19 0.103 - 0.177 0.233 - 0.307 2001 14 0.051 - 0.141 0.191 - 0.281
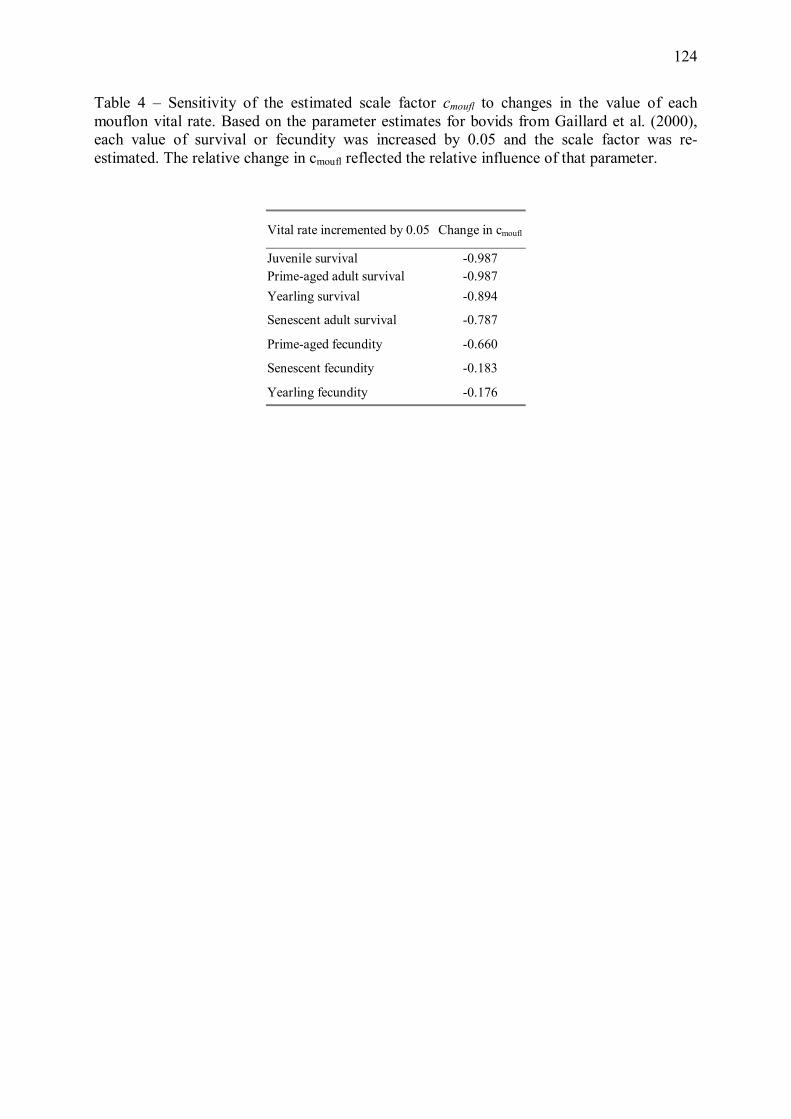
124
Table 4 � Sensitivity of the estimated scale factor cmoufl to changes in the value of each mouflon vital rate. Based on the parameter estimates for bovids from Gaillard et al. (2000), each value of survival or fecundity was increased by 0.05 and the scale factor was re-estimated. The relative change in cmoufl reflected the relative influence of that parameter.
Vital rate incremented by 0.05 Change in cmoufl
Juvenile survival -0.987 Prime-aged adult survival -0.987 Yearling survival -0.894
Senescent adult survival -0.787
Prime-aged fecundity -0.660
Senescent fecundity -0.183
Yearling fecundity -0.176
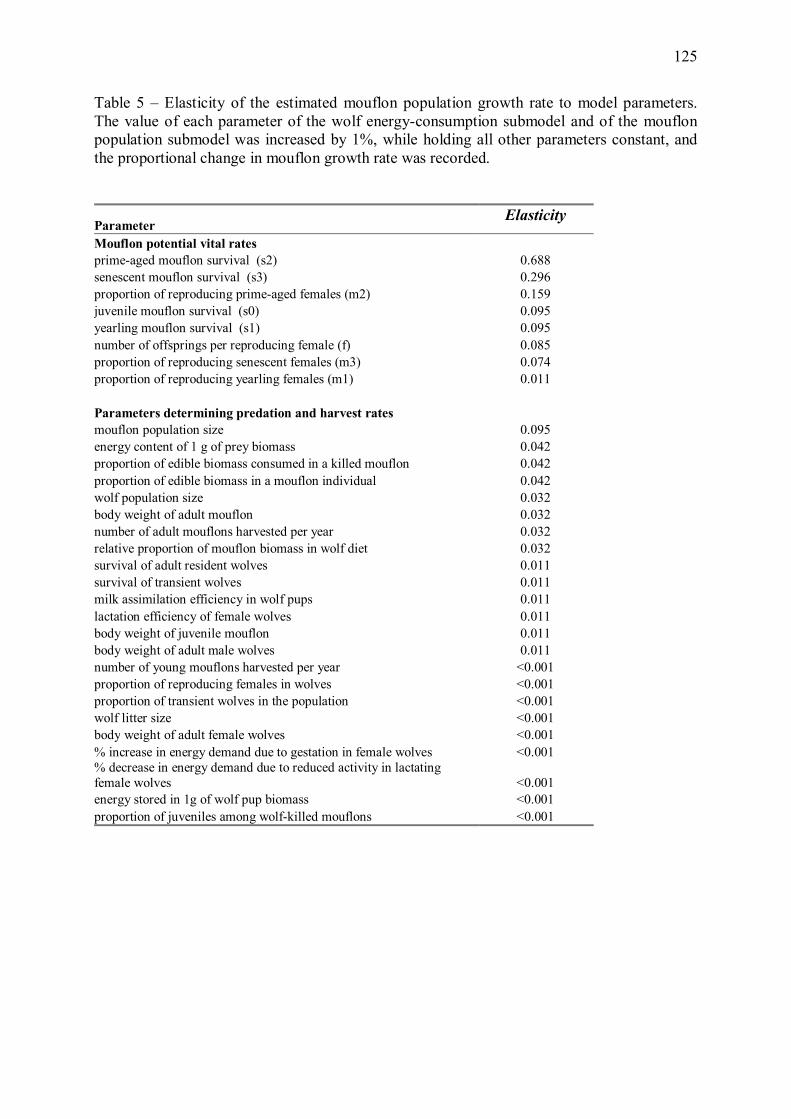
125
Table 5 � Elasticity of the estimated mouflon population growth rate to model parameters. The value of each parameter of the wolf energy-consumption submodel and of the mouflon population submodel was increased by 1%, while holding all other parameters constant, and the proportional change in mouflon growth rate was recorded.
Parameter Elasticity
Mouflon potential vital rates prime-aged mouflon survival (s2) 0.688 senescent mouflon survival (s3) 0.296 proportion of reproducing prime-aged females (m2) 0.159 juvenile mouflon survival (s0) 0.095 yearling mouflon survival (s1) 0.095 number of offsprings per reproducing female (f) 0.085 proportion of reproducing senescent females (m3) 0.074 proportion of reproducing yearling females (m1) 0.011 Parameters determining predation and harvest rates mouflon population size 0.095 energy content of 1 g of prey biomass 0.042 proportion of edible biomass consumed in a killed mouflon 0.042 proportion of edible biomass in a mouflon individual 0.042 wolf population size 0.032 body weight of adult mouflon 0.032 number of adult mouflons harvested per year 0.032 relative proportion of mouflon biomass in wolf diet 0.032 survival of adult resident wolves 0.011 survival of transient wolves 0.011 milk assimilation efficiency in wolf pups 0.011 lactation efficiency of female wolves 0.011 body weight of juvenile mouflon 0.011 body weight of adult male wolves 0.011 number of young mouflons harvested per year <0.001 proportion of reproducing females in wolves <0.001 proportion of transient wolves in the population <0.001 wolf litter size <0.001 body weight of adult female wolves <0.001 % increase in energy demand due to gestation in female wolves <0.001 % decrease in energy demand due to reduced activity in lactating female wolves <0.001 energy stored in 1g of wolf pup biomass <0.001 proportion of juveniles among wolf-killed mouflons <0.001
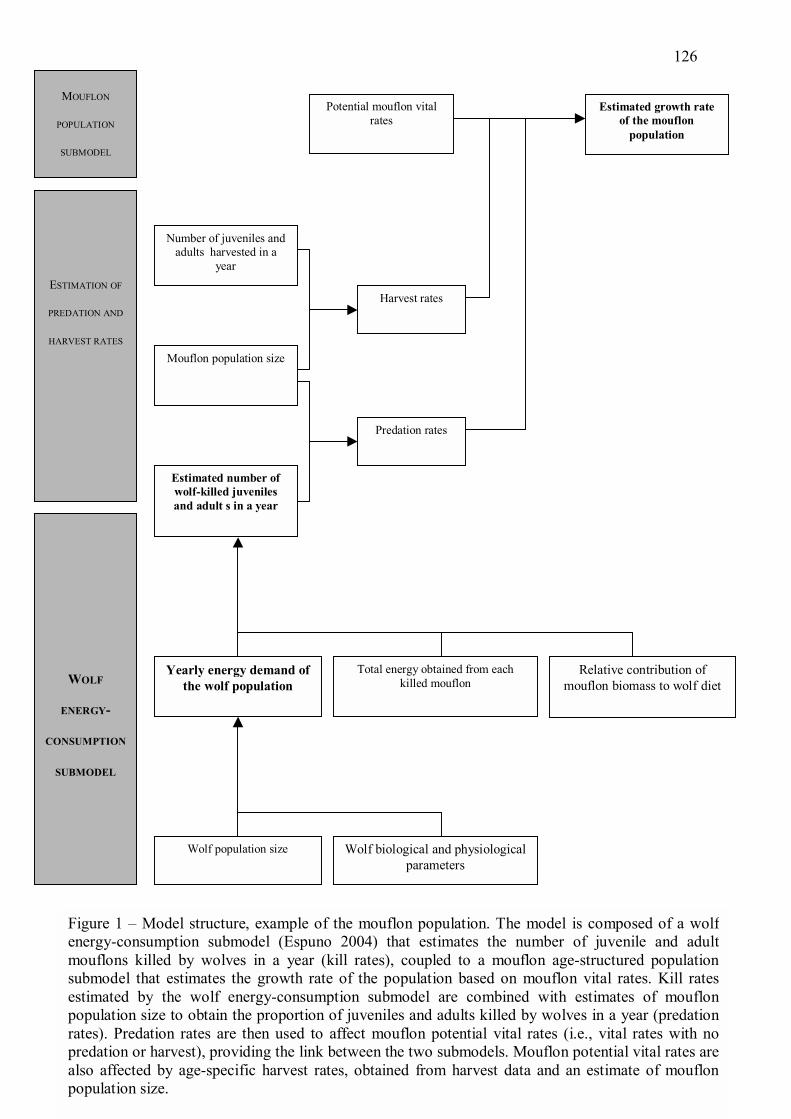
126
Estimated growth rate of the mouflon
population
Potential mouflon vital rates
Mouflon population size
Harvest rates
Predation rates
Number of juveniles and adults harvested in a
year
Estimated number of wolf-killed juveniles and adult s in a year
Wolf population size
Relative contribution of mouflon biomass to wolf diet
Wolf biological and physiological parameters
Total energy obtained from each killed mouflon
Yearly energy demand of the wolf population
MOUFLON
POPULATION
SUBMODEL
WOLF
ENERGY-
CONSUMPTION
SUBMODEL
ESTIMATION OF
PREDATION AND
HARVEST RATES
Figure 1 � Model structure, example of the mouflon population. The model is composed of a wolfenergy-consumption submodel (Espuno 2004) that estimates the number of juvenile and adultmouflons killed by wolves in a year (kill rates), coupled to a mouflon age-structured population submodel that estimates the growth rate of the population based on mouflon vital rates. Kill ratesestimated by the wolf energy-consumption submodel are combined with estimates of mouflonpopulation size to obtain the proportion of juveniles and adults killed by wolves in a year (predationrates). Predation rates are then used to affect mouflon potential vital rates (i.e., vital rates with nopredation or harvest), providing the link between the two submodels. Mouflon potential vital rates are also affected by age-specific harvest rates, obtained from harvest data and an estimate of mouflonpopulation size.
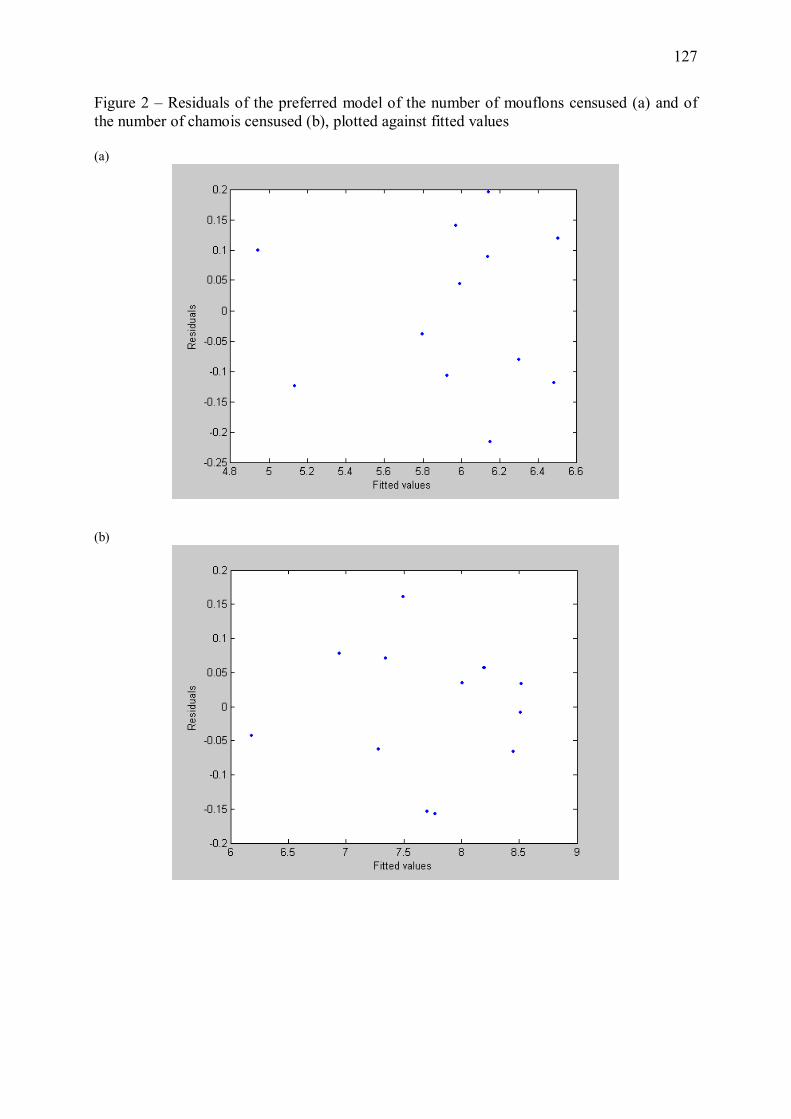
127
Figure 2 � Residuals of the preferred model of the number of mouflons censused (a) and of the number of chamois censused (b), plotted against fitted values (a)
(b)
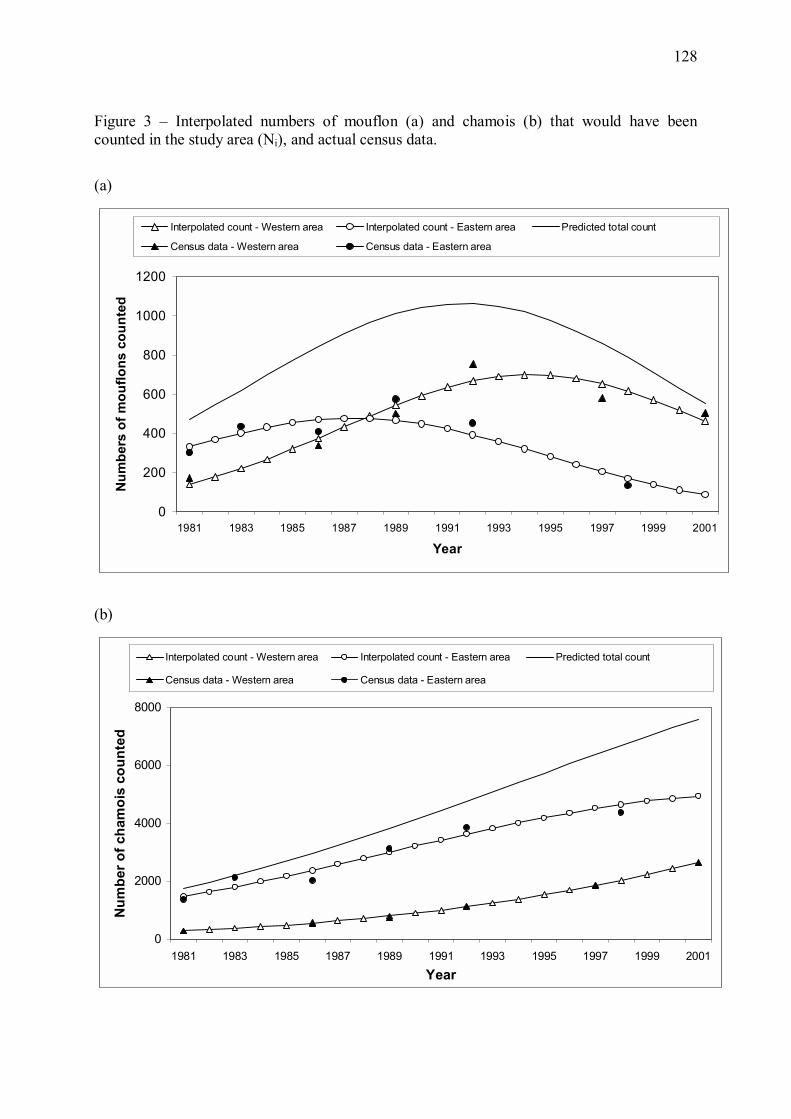
128
Figure 3 � Interpolated numbers of mouflon (a) and chamois (b) that would have been counted in the study area (Ni), and actual census data.
(a)
0
200
400
600
800
1000
1200
1981 1983 1985 1987 1989 1991 1993 1995 1997 1999 2001
Year
Num
bers
of m
ouflo
ns c
ount
ed
Interpolated count - Western area Interpolated count - Eastern area Predicted total count
Census data - Western area Census data - Eastern area
(b)
0
2000
4000
6000
8000
1981 1983 1985 1987 1989 1991 1993 1995 1997 1999 2001
Year
Num
ber o
f cha
moi
s co
unte
d
Interpolated count - Western area Interpolated count - Eastern area Predicted total count
Census data - Western area Census data - Eastern area
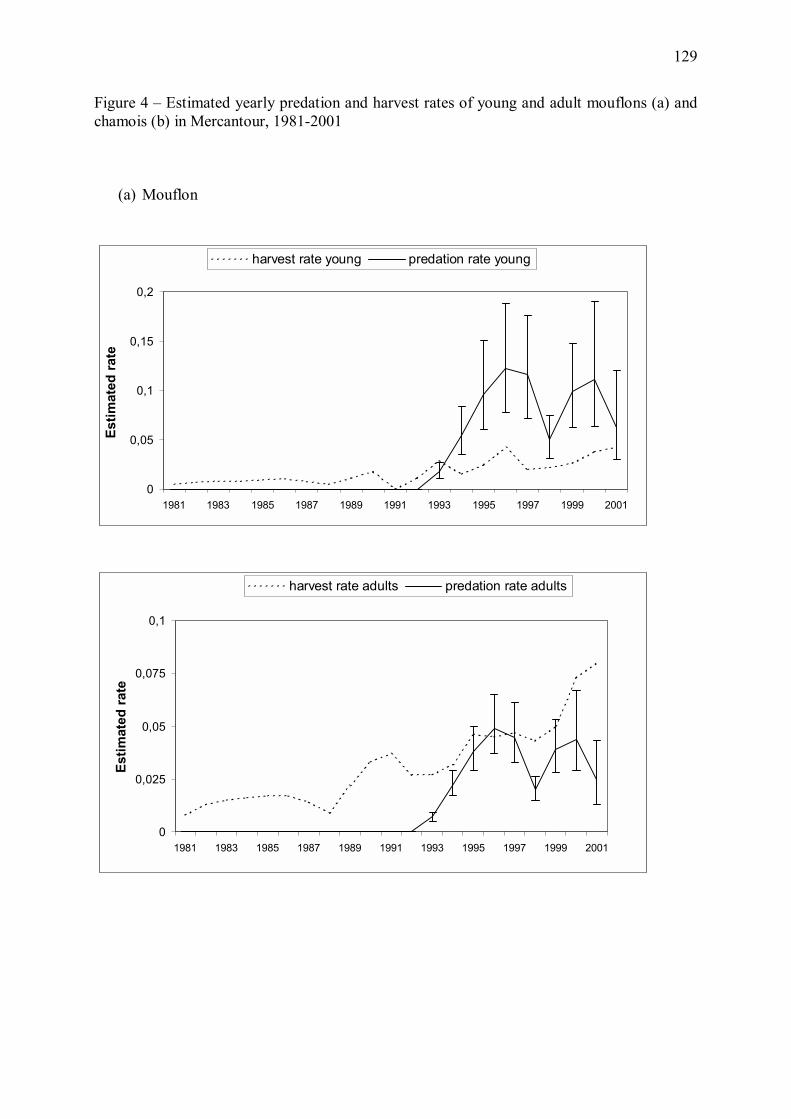
129
Figure 4 � Estimated yearly predation and harvest rates of young and adult mouflons (a) and chamois (b) in Mercantour, 1981-2001
(a) Mouflon
0
0,05
0,1
0,15
0,2
1981 1983 1985 1987 1989 1991 1993 1995 1997 1999 2001
Estim
ated
rate
harvest rate young predation rate young
0
0,025
0,05
0,075
0,1
1981 1983 1985 1987 1989 1991 1993 1995 1997 1999 2001
Estim
ated
rate
harvest rate adults predation rate adults
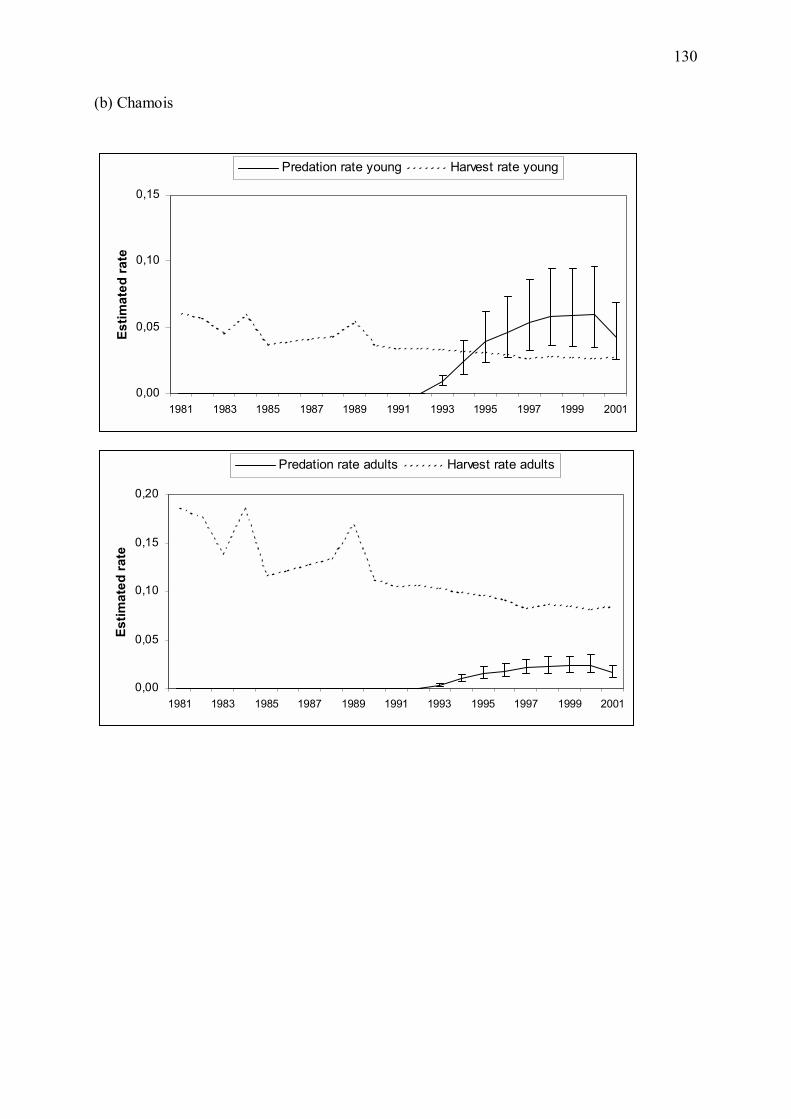
130
(b) Chamois
0,00
0,05
0,10
0,15
1981 1983 1985 1987 1989 1991 1993 1995 1997 1999 2001
Estim
ated
rate
Predation rate young Harvest rate young
0,00
0,05
0,10
0,15
0,20
1981 1983 1985 1987 1989 1991 1993 1995 1997 1999 2001
Estim
ated
rate
Predation rate adults Harvest rate adults
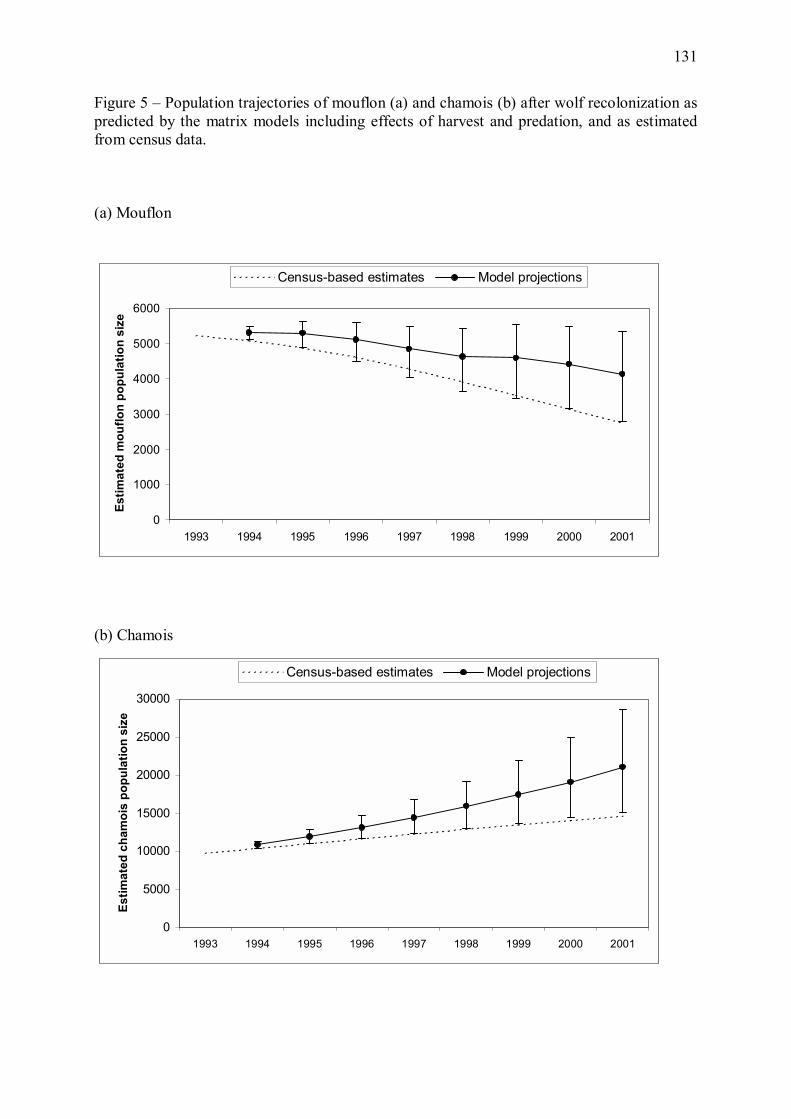
131
Figure 5 � Population trajectories of mouflon (a) and chamois (b) after wolf recolonization as predicted by the matrix models including effects of harvest and predation, and as estimated from census data.
(a) Mouflon
0
1000
2000
3000
4000
5000
6000
1993 1994 1995 1996 1997 1998 1999 2000 2001
Estim
ated
mou
flon
popu
latio
n si
ze
Census-based estimates Model projections
(b) Chamois
0
5000
10000
15000
20000
25000
30000
1993 1994 1995 1996 1997 1998 1999 2000 2001
Estim
ated
cha
moi
s po
pula
tion
size
Census-based estimates Model projections
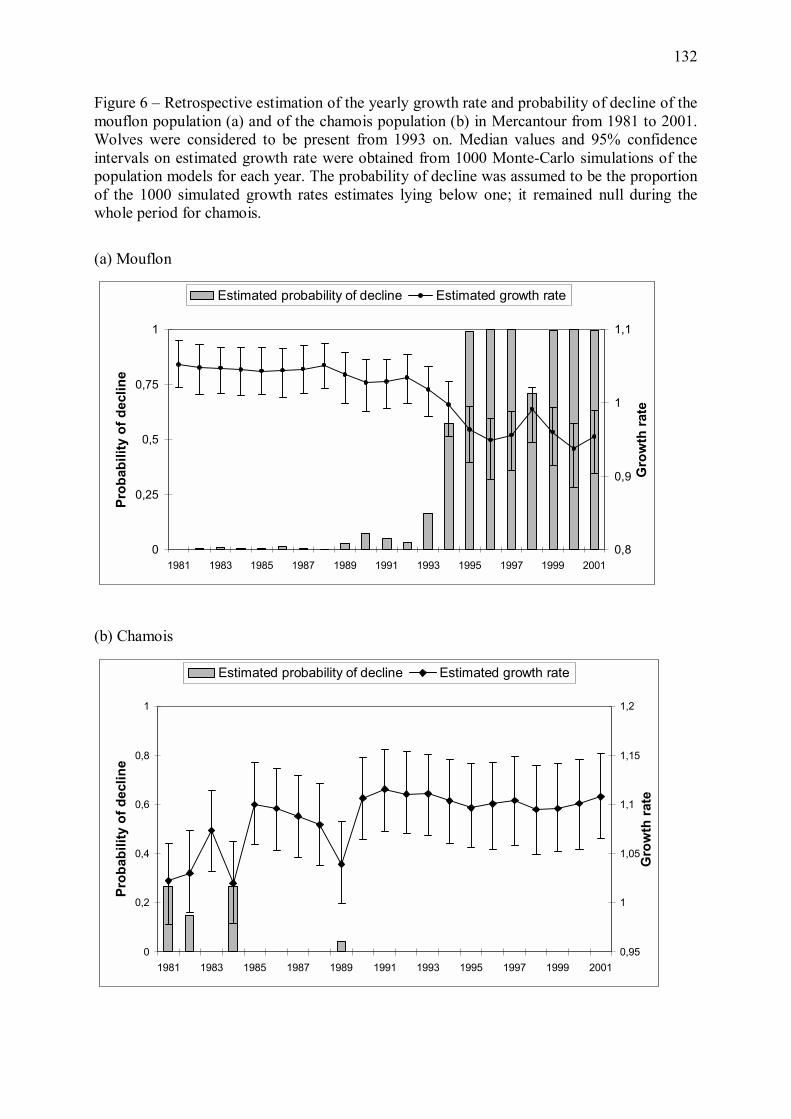
132
Figure 6 � Retrospective estimation of the yearly growth rate and probability of decline of the mouflon population (a) and of the chamois population (b) in Mercantour from 1981 to 2001. Wolves were considered to be present from 1993 on. Median values and 95% confidence intervals on estimated growth rate were obtained from 1000 Monte-Carlo simulations of the population models for each year. The probability of decline was assumed to be the proportion of the 1000 simulated growth rates estimates lying below one; it remained null during the whole period for chamois.
(a) Mouflon
0
0,25
0,5
0,75
1
1981 1983 1985 1987 1989 1991 1993 1995 1997 1999 2001
Prob
abili
ty o
f dec
line
0,8
0,9
1
1,1
Gro
wth
rate
Estimated probability of decline Estimated growth rate
(b) Chamois
0
0,2
0,4
0,6
0,8
1
1981 1983 1985 1987 1989 1991 1993 1995 1997 1999 2001
Prob
abili
ty o
f dec
line
0,95
1
1,05
1,1
1,15
1,2
Gro
wth
rate
Estimated probability of decline Estimated growth rate

133
Annexe 3
134
Vigilance patterns of two ungulate species in response to different
intensities of wolf predation
Nathalie ESPUNO1, Benoît LEQUETTE2, Gérard MILLISCHER2,
Jean-Michel GAILLARD3, Marie-Lazarine POULLE2, Pierre MIGOT4
and Jean-Dominique LEBRETON1
1Groupe Biométrie et Biologie des Populations, Centre d�Ecologie Fonctionnelle et Evolutive,
UMR CNRS 5175, France 2 Parc national du Mercantour, France 3 Laboratoire de Biométrie et Biologie Evolutive, UMR CNRS 5558, France 4 Office National de la Chasse et de la Faune Sauvage, Direction des Etudes et de la
Recherche, France
Soumis à
Biological Conservation
135
ABSTRACT
During 1995-1998, wolves (Canis lupus) recolonizing the Mercantour Mountains strongly
selected mouflon (Ovis gmelini), introduced in the 1950s and originating from feral sheep
inhabiting the predator-free Mediterranean islands, over chamois (Rupicapra rupicapra), a
native ungulate species. We hypothesized that a) a difference in anti-predator behaviour might
contribute to the observed difference of selectivity of wolves for the two ungulate species, and
that b) vigilance increased with predation risk following wolf recolonization. We studied the
vigilance behaviour of males and females of each species during foraging activities in the
spring and summer times in two areas of Mercantour national Park, accounting for group size
and reproductive status of females. Chamois scanned more often and allocated a greater
proportion of time to vigilance than mouflon. In both species, vigilance decreased as a linear
function of log group size, and females with offspring were more vigilant than barren females.
Vigilance was higher after wolf recolonization than before, and appeared to differ between the
two study sites.
INTRODUCTION
A number of behavioral traits may directly or indirectly affect animal populations by
changing vital rates that contribute to population growth (Anthony & Blumstein 2000).
Among them, the antipredator behaviours of a prey may indirectly influence its population
size by decreasing predation risk. Vigilance behaviour is generally considered to have an
antipredatory function (e.g. Elgar 1989, Fitzgibbon 1990) because vigilant preys have a lower
chance of being captured by a predator than those that are not vigilant (Fitzgibbon 1989,
1990, Illius & Fitzgibbon 1994). Less vigilant animals may be easier to catch by predators
because they are slower to react when the predator initiates a chase (Fitzgibbon 1989, Krause
& Godin 1996, Hilton et al. 1999) and individuals with shorter fleeing distances are more
likely to be killed on attack (Fitzgibbon 1989, Krause & Godin 1996).
As a consequence, predators are expected to select less vigilant animals to increase their
probability of making a successful kill (Fitzgibbon 1989). This prediction is supported by
several studies. For instance in the Serengeti, lions (Panthera leo) invested more hunting time
and obtained more food from the four species with the lowest scanning rates of eight species
commonly hunted (Scheel & Packer 1991). In groups of Thompson's gazelles (Gazella
136
thomsonii), cheetah (Acinonyx jubatus) selected individuals with lower vigilance levels than
their neighbours (Fitzgibbon 1989).
Categories of prey that scan less are thus expected to experience a greater predation pressure
than more vigilant prey types. While co-evolved predator-prey systems usually persist
because predators and prey are well matched (Short et al. 2002), the lack of adequate anti-
predator behaviour in a prey species may thus result in a particularly strong preference of
predators for that species, possibly leading to unsustainable predation rates and local
extinction of the prey (Short et al. 2002). Such situations are frequent when carnivores are
introduced into new areas where preys have never been exposed to them. Exposure of naïve
prey to novel predators often result in the prey being unable to respond to a predation pressure
that probably differed from that of their ancestors (e.g., native marsupials and introduced
carnivores in Australia, Berger 1998). A mismatch between prey anti-predator behaviour and
predator hunting skills can also be encountered in situations where a predator is returning to
an area from where it was absent for a period. Although such prey evolved with the predator,
they temporarily experience relaxed selection due to a reduction in predation risk in such
situations. Anti-predator behaviours such as vigilance, which bear immediate costs in terms of
reduced food intake, might then be lost within a few generations (Blumstein 2002, Berger et
al. 2001). Vigilance behaviour thus bears important implications for the management and
conservation of prey populations exposed to colonizing or recolonizing predators (Berger et
al. 2001, Blumstein 2002).
Wolves recolonized the Mercantour Mountains of the southern French Alps in the early
1990s, after several decades of absence (Dahier et al. 2002). Between 1994 and 1998, they
have been feeding primarily on chamois (Rupicapra rupicapra), mouflon (Ovis gmelini) and
domestic sheep (Ovis aries) (Poulle et al. 1997, 1998). Chamois and mouflon were
contributing about equally to wolf diet despite chamois was at least ten times more abundant
than mouflon, suggesting that mouflons were strongly selected over chamois by wolves
(Poulle et al. 1997, 1998). While chamois numbers kept increasing under exposure to wolf
predation, the mouflon population was drastically reduced between 1992 and 1997 (-40%),
likely as a result of unsustainable predation rates (Mercantour national Park, unpublished
data).
While chamois is native of the Alps, mouflon was introduced to the Mercantour Mountains in
the 1950�s as a game species. Origins of the introduced mouflons lie in the mouflon of
occidental Asia, which was domesticated in the Near East about 8500 B.P. and spread by
137
humans throughout the Mediterranean basin during the Neolithic (Poplin 1979, Blondel &
Vigne 1993). On the large Mediterranean islands (Chypre, Corse, Sardaigne), some
individuals escaped human control and became feral, sometimes giving rise to genetically
altered populations through a process whereby ancestral characters progressively revert in the
absence of human selection (Poplin 1979, Blondel & Aronson 1999). We thus tested the
prediction that, following a long history of isolation from predators on the large
Mediterranean islands, the Mercantour mouflon may exhibit weaker vigilance behaviour than
the native chamois (Prediction 1).
Predator recognition and anti-predator behaviour, although partly innate, may also develop as
a consequence of experience (Curio 1996, Griffin et al. 2000), particularly in mammals,
which use their complex cognitive abilities to learn about their environment (McLean et al.
1996). When formerly isolated prey species come again into contact with their historical
predators, such experience-based behaviours may thus be quickly regained (Blumstein 2002),
sometimes even within a single generation (Berger et al. 2001). Wolf recolonization of the
Mercantour Mountains provides a unique opportunity to assess the vigilance response of
ungulates isolated from large carnivores for several decades to an increase in predation risk.
We thus tested the prediction that both mouflon and chamois increased vigilance rates after
wolf recolonization (Prediction 2).
METHODS
Study Area
We studied the vigilance behaviour of chamois and mouflon in two sites of the Vésubie and
Haute-Tinée valleys of the Mercantour Mountains, within the 68,500-ha core area of
Mercantour national Park. In the park, altitude ranges from 800 to 3,143 m, with pastures
covering about 60 % of the area. Picea excelsa, Abies alba, Pinus sylvestris, Pinus cembra,
and Larix decidua are the main tree species making up the dense forest cover generally found
below 2,000 m. Snow often persists from December to late April above 1,200 m, with an
average snow depth ranging from 0.5 m to more than 2 m depending on the year. Six species
of wild ungulates coexist within the core area of the national park: about 10,000 chamois (5 to
10 per 100 ha), 500 mouflon (0.8 to 4 per 100 ha), 1,200 ibex Capra ibex in summer, some of
which emigrate seasonally to winter grounds located outside the study area, 1,000 red deer
138
Cervus elaphus and unknown numbers of roe deer Capreolus capreolus and wild boar Sus
scrofa. The Mercantour Mountains are also home to extensive pastoral activities, mainly
devoted to the production of lamb meat. Wolf presence in Mercantour was first detected in
1992, and 4 packs were occupying the area for an estimated total of 17-18 wolves in 1998
(Poulle et al. 2000). Wolves are considered permanently present in Vésubie since winter
1992-1993, and in Haute-Tinée since winter 1996-97. Minimum estimates of winter wolf
pack sizes were obtained by snow-tracking (Figure 1).
Ungulate Vigilance Behaviour
Vigilance behaviour of chamois and mouflon was surveyed in spring and summer 1995 to
1998 in the two study sites. The general method was based on the observation of focal
animals (sensu Altmann 1974), a classical approach to the study of ungulate vigilance
behaviour (e.g. Frid 1997, Hunter & Skinner 1998, Laundré et al. 2001). In each species,
males and females with or without young at heel were selected randomly and observed for 10-
min periods. The frequency and duration of grazing and vigilance bouts were recorded. A
vigilance bout started when the focal animal lifted its head above shoulder and finished when
the animal resumed feeding. For each observation, the species (mouflon vs. chamois), sex,
reproductive status of females (with vs. without young at heel), site, year and group size were
recorded. All three categories of sex and reproductive status were well represented in the data
set (Table 1). All observations where focal animal walked during more than one minute were
discarded. We tried to observe different groups every day, although some animals may have
been sampled more than once due to the difficulty of identifying individuals. The resulting
data set contained 1899 observations.
Modeling Vigilance
We studied the differences between species and the effect wolf recolonization on vigilance
behaviour of chamois and mouflon, while accounting for the potentially confounding effects
of group size and reproductive status of females, which were shown to affect vigilance in
ungulates (group size: Bednekoff & Ritter 1994 on springbok, Frid 1997 on Dall sheep,
Hunter & Skinner 1998 on impala and wildebeest, but see Wolf & Van Horn 2003 on elk;
reproductive status: Fitzgibbon 1993 on Thomson gazelles, Hunter & Skinner 1998 on impala
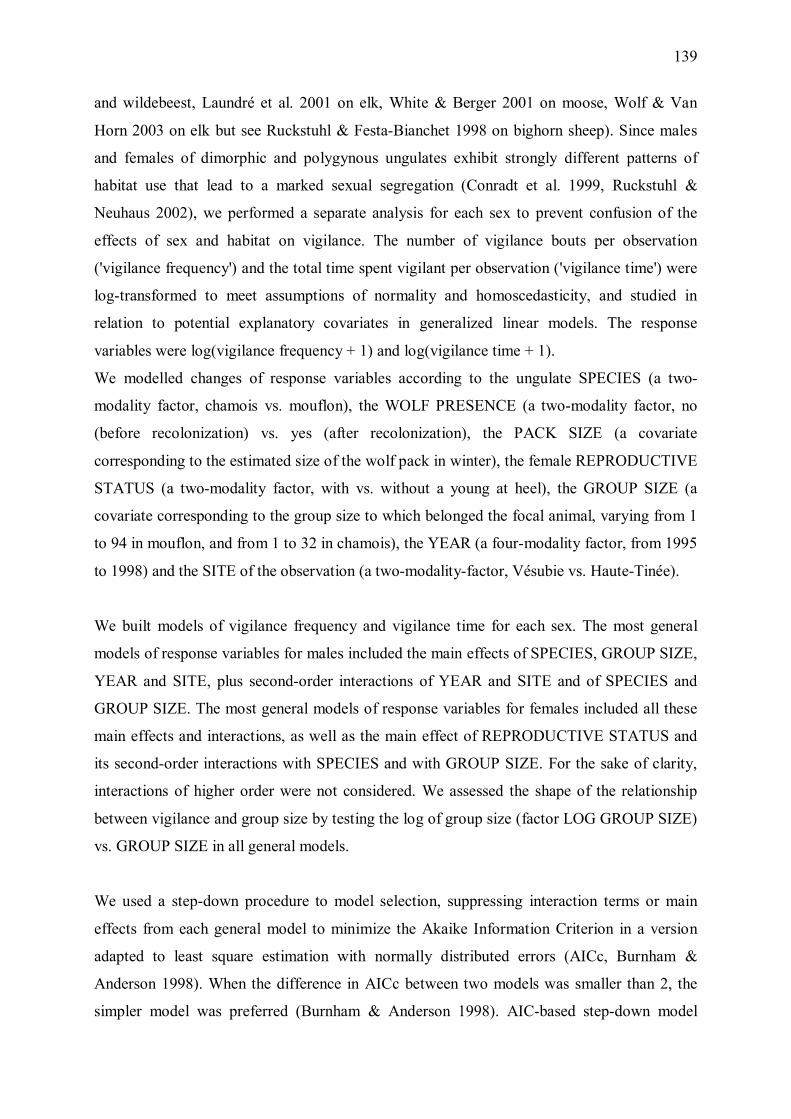
139
and wildebeest, Laundré et al. 2001 on elk, White & Berger 2001 on moose, Wolf & Van
Horn 2003 on elk but see Ruckstuhl & Festa-Bianchet 1998 on bighorn sheep). Since males
and females of dimorphic and polygynous ungulates exhibit strongly different patterns of
habitat use that lead to a marked sexual segregation (Conradt et al. 1999, Ruckstuhl &
Neuhaus 2002), we performed a separate analysis for each sex to prevent confusion of the
effects of sex and habitat on vigilance. The number of vigilance bouts per observation
('vigilance frequency') and the total time spent vigilant per observation ('vigilance time') were
log-transformed to meet assumptions of normality and homoscedasticity, and studied in
relation to potential explanatory covariates in generalized linear models. The response
variables were log(vigilance frequency + 1) and log(vigilance time + 1).
We modelled changes of response variables according to the ungulate SPECIES (a two-
modality factor, chamois vs. mouflon), the WOLF PRESENCE (a two-modality factor, no
(before recolonization) vs. yes (after recolonization), the PACK SIZE (a covariate
corresponding to the estimated size of the wolf pack in winter), the female REPRODUCTIVE
STATUS (a two-modality factor, with vs. without a young at heel), the GROUP SIZE (a
covariate corresponding to the group size to which belonged the focal animal, varying from 1
to 94 in mouflon, and from 1 to 32 in chamois), the YEAR (a four-modality factor, from 1995
to 1998) and the SITE of the observation (a two-modality-factor, Vésubie vs. Haute-Tinée).
We built models of vigilance frequency and vigilance time for each sex. The most general
models of response variables for males included the main effects of SPECIES, GROUP SIZE,
YEAR and SITE, plus second-order interactions of YEAR and SITE and of SPECIES and
GROUP SIZE. The most general models of response variables for females included all these
main effects and interactions, as well as the main effect of REPRODUCTIVE STATUS and
its second-order interactions with SPECIES and with GROUP SIZE. For the sake of clarity,
interactions of higher order were not considered. We assessed the shape of the relationship
between vigilance and group size by testing the log of group size (factor LOG GROUP SIZE)
vs. GROUP SIZE in all general models.
We used a step-down procedure to model selection, suppressing interaction terms or main
effects from each general model to minimize the Akaike Information Criterion in a version
adapted to least square estimation with normally distributed errors (AICc, Burnham &
Anderson 1998). When the difference in AICc between two models was smaller than 2, the
simpler model was preferred (Burnham & Anderson 1998). AIC-based step-down model
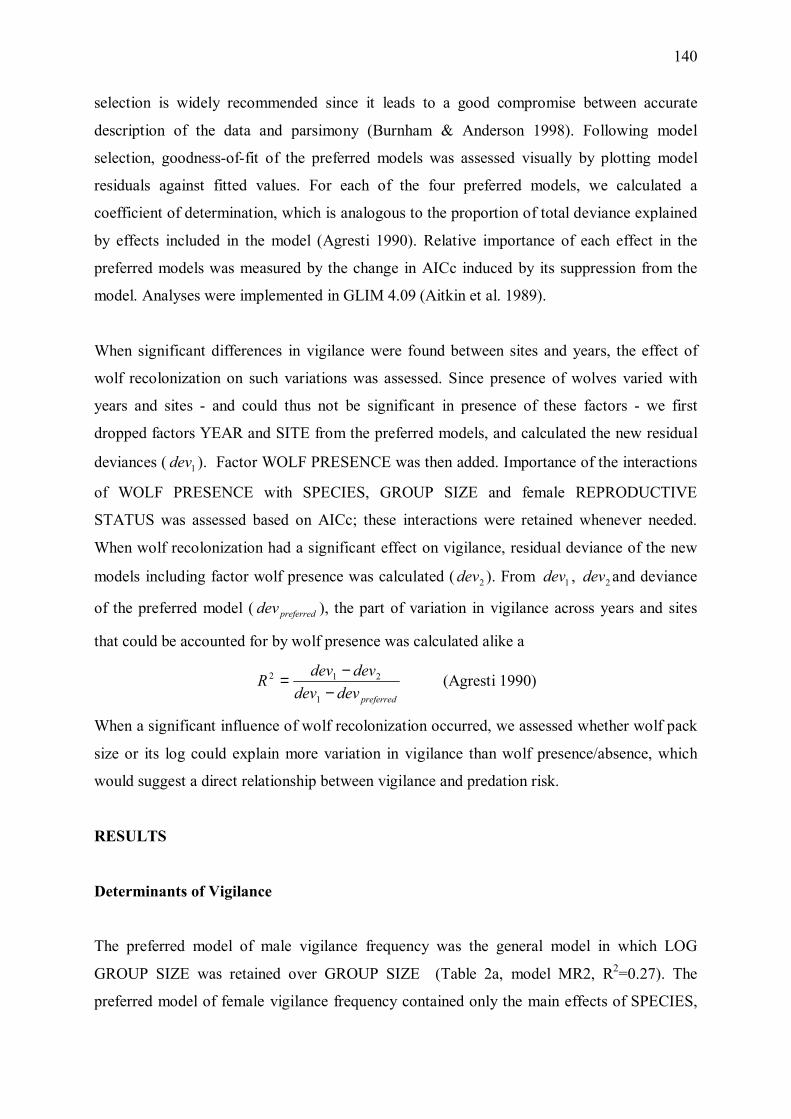
140
selection is widely recommended since it leads to a good compromise between accurate
description of the data and parsimony (Burnham & Anderson 1998). Following model
selection, goodness-of-fit of the preferred models was assessed visually by plotting model
residuals against fitted values. For each of the four preferred models, we calculated a
coefficient of determination, which is analogous to the proportion of total deviance explained
by effects included in the model (Agresti 1990). Relative importance of each effect in the
preferred models was measured by the change in AICc induced by its suppression from the
model. Analyses were implemented in GLIM 4.09 (Aitkin et al. 1989).
When significant differences in vigilance were found between sites and years, the effect of
wolf recolonization on such variations was assessed. Since presence of wolves varied with
years and sites - and could thus not be significant in presence of these factors - we first
dropped factors YEAR and SITE from the preferred models, and calculated the new residual
deviances ( 1dev ). Factor WOLF PRESENCE was then added. Importance of the interactions
of WOLF PRESENCE with SPECIES, GROUP SIZE and female REPRODUCTIVE
STATUS was assessed based on AICc; these interactions were retained whenever needed.
When wolf recolonization had a significant effect on vigilance, residual deviance of the new
models including factor wolf presence was calculated ( 2dev ). From 1dev , 2dev and deviance
of the preferred model ( preferreddev ), the part of variation in vigilance across years and sites
that could be accounted for by wolf presence was calculated alike a
preferreddevdevdevdevR
−−=
1
212 (Agresti 1990)
When a significant influence of wolf recolonization occurred, we assessed whether wolf pack
size or its log could explain more variation in vigilance than wolf presence/absence, which
would suggest a direct relationship between vigilance and predation risk.
RESULTS
Determinants of Vigilance
The preferred model of male vigilance frequency was the general model in which LOG
GROUP SIZE was retained over GROUP SIZE (Table 2a, model MR2, R2=0.27). The
preferred model of female vigilance frequency contained only the main effects of SPECIES,
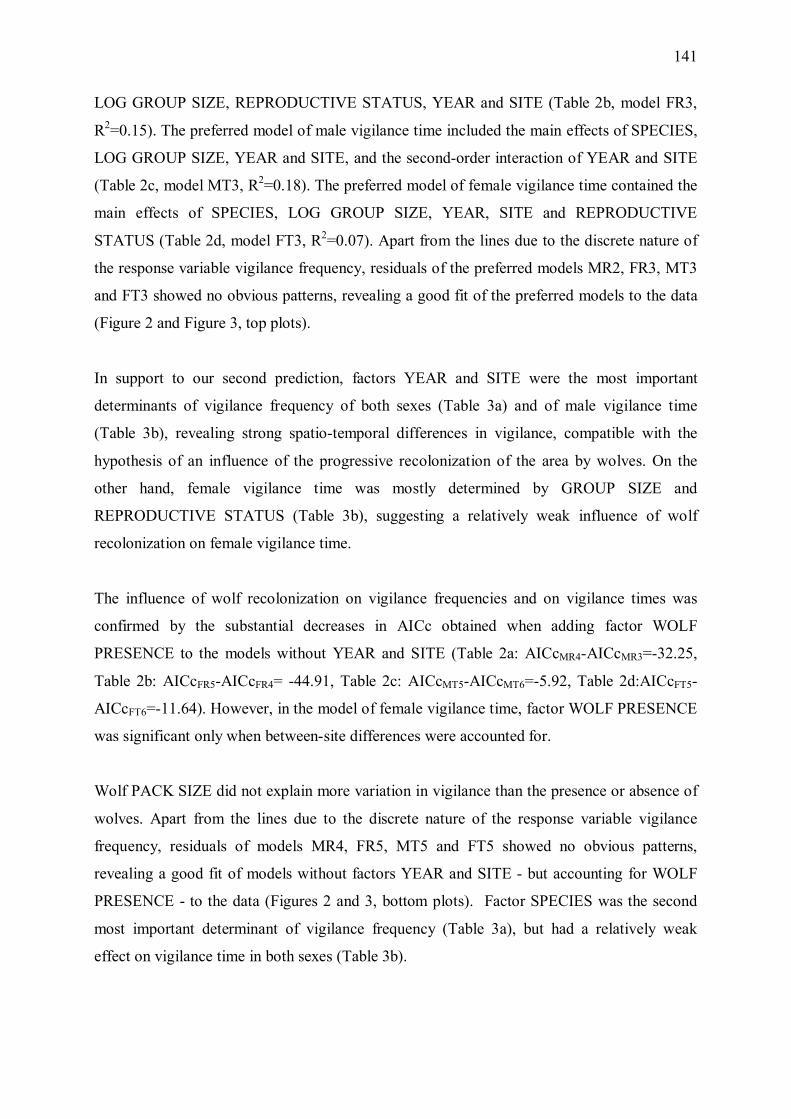
141
LOG GROUP SIZE, REPRODUCTIVE STATUS, YEAR and SITE (Table 2b, model FR3,
R2=0.15). The preferred model of male vigilance time included the main effects of SPECIES,
LOG GROUP SIZE, YEAR and SITE, and the second-order interaction of YEAR and SITE
(Table 2c, model MT3, R2=0.18). The preferred model of female vigilance time contained the
main effects of SPECIES, LOG GROUP SIZE, YEAR, SITE and REPRODUCTIVE
STATUS (Table 2d, model FT3, R2=0.07). Apart from the lines due to the discrete nature of
the response variable vigilance frequency, residuals of the preferred models MR2, FR3, MT3
and FT3 showed no obvious patterns, revealing a good fit of the preferred models to the data
(Figure 2 and Figure 3, top plots).
In support to our second prediction, factors YEAR and SITE were the most important
determinants of vigilance frequency of both sexes (Table 3a) and of male vigilance time
(Table 3b), revealing strong spatio-temporal differences in vigilance, compatible with the
hypothesis of an influence of the progressive recolonization of the area by wolves. On the
other hand, female vigilance time was mostly determined by GROUP SIZE and
REPRODUCTIVE STATUS (Table 3b), suggesting a relatively weak influence of wolf
recolonization on female vigilance time.
The influence of wolf recolonization on vigilance frequencies and on vigilance times was
confirmed by the substantial decreases in AICc obtained when adding factor WOLF
PRESENCE to the models without YEAR and SITE (Table 2a: AICcMR4-AICcMR3=-32.25,
Table 2b: AICcFR5-AICcFR4= -44.91, Table 2c: AICcMT5-AICcMT6=-5.92, Table 2d:AICcFT5-
AICcFT6=-11.64). However, in the model of female vigilance time, factor WOLF PRESENCE
was significant only when between-site differences were accounted for.
Wolf PACK SIZE did not explain more variation in vigilance than the presence or absence of
wolves. Apart from the lines due to the discrete nature of the response variable vigilance
frequency, residuals of models MR4, FR5, MT5 and FT5 showed no obvious patterns,
revealing a good fit of models without factors YEAR and SITE - but accounting for WOLF
PRESENCE - to the data (Figures 2 and 3, bottom plots). Factor SPECIES was the second
most important determinant of vigilance frequency (Table 3a), but had a relatively weak
effect on vigilance time in both sexes (Table 3b).
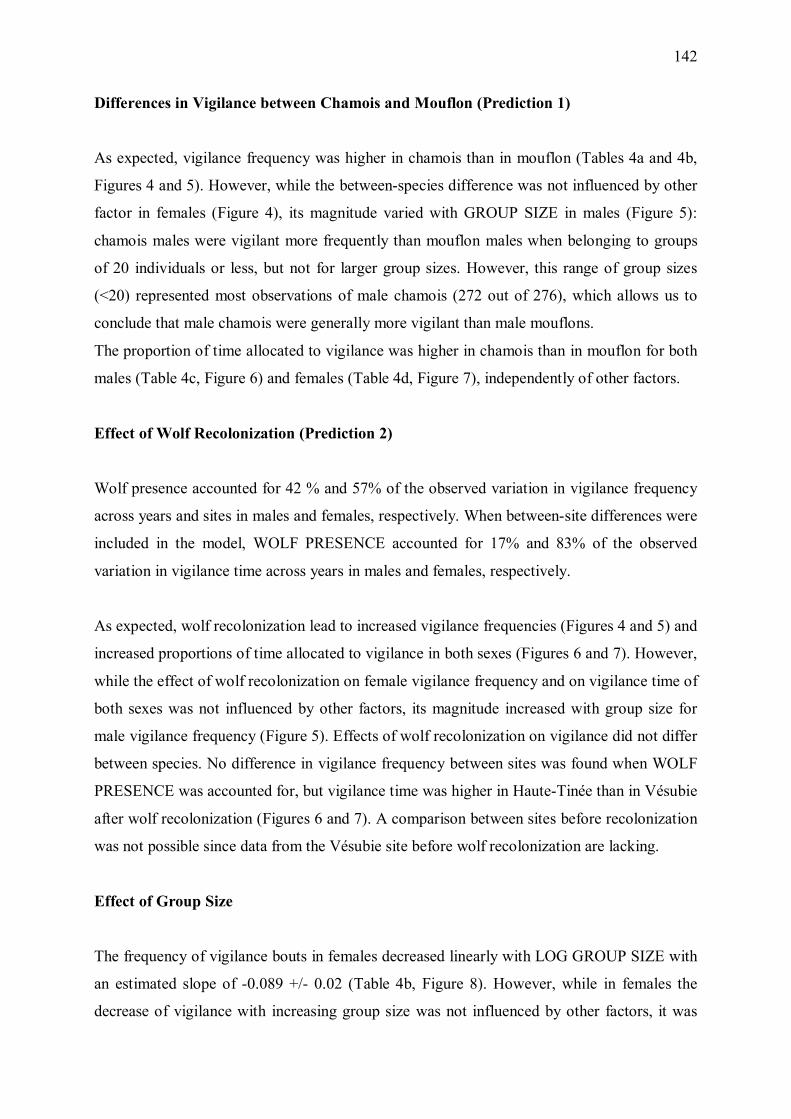
142
Differences in Vigilance between Chamois and Mouflon (Prediction 1)
As expected, vigilance frequency was higher in chamois than in mouflon (Tables 4a and 4b,
Figures 4 and 5). However, while the between-species difference was not influenced by other
factor in females (Figure 4), its magnitude varied with GROUP SIZE in males (Figure 5):
chamois males were vigilant more frequently than mouflon males when belonging to groups
of 20 individuals or less, but not for larger group sizes. However, this range of group sizes
(<20) represented most observations of male chamois (272 out of 276), which allows us to
conclude that male chamois were generally more vigilant than male mouflons.
The proportion of time allocated to vigilance was higher in chamois than in mouflon for both
males (Table 4c, Figure 6) and females (Table 4d, Figure 7), independently of other factors.
Effect of Wolf Recolonization (Prediction 2)
Wolf presence accounted for 42 % and 57% of the observed variation in vigilance frequency
across years and sites in males and females, respectively. When between-site differences were
included in the model, WOLF PRESENCE accounted for 17% and 83% of the observed
variation in vigilance time across years in males and females, respectively.
As expected, wolf recolonization lead to increased vigilance frequencies (Figures 4 and 5) and
increased proportions of time allocated to vigilance in both sexes (Figures 6 and 7). However,
while the effect of wolf recolonization on female vigilance frequency and on vigilance time of
both sexes was not influenced by other factors, its magnitude increased with group size for
male vigilance frequency (Figure 5). Effects of wolf recolonization on vigilance did not differ
between species. No difference in vigilance frequency between sites was found when WOLF
PRESENCE was accounted for, but vigilance time was higher in Haute-Tinée than in Vésubie
after wolf recolonization (Figures 6 and 7). A comparison between sites before recolonization
was not possible since data from the Vésubie site before wolf recolonization are lacking.
Effect of Group Size
The frequency of vigilance bouts in females decreased linearly with LOG GROUP SIZE with
an estimated slope of -0.089 +/- 0.02 (Table 4b, Figure 8). However, while in females the
decrease of vigilance with increasing group size was not influenced by other factors, it was
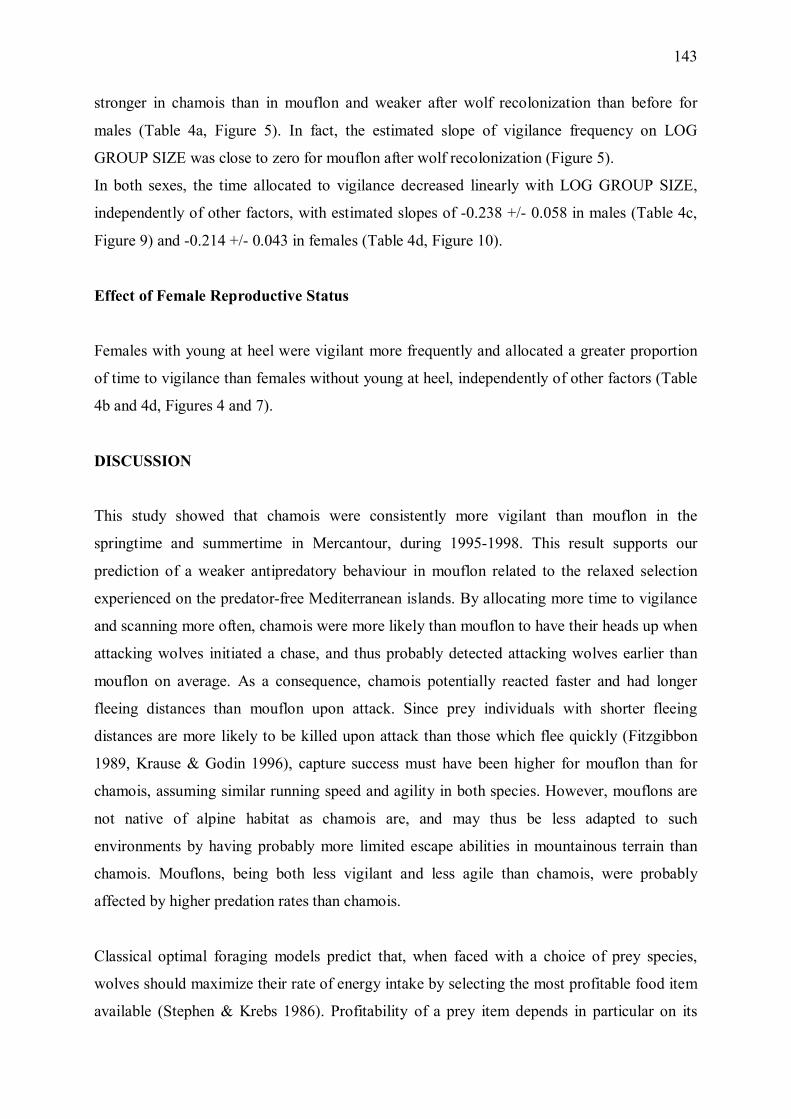
143
stronger in chamois than in mouflon and weaker after wolf recolonization than before for
males (Table 4a, Figure 5). In fact, the estimated slope of vigilance frequency on LOG
GROUP SIZE was close to zero for mouflon after wolf recolonization (Figure 5).
In both sexes, the time allocated to vigilance decreased linearly with LOG GROUP SIZE,
independently of other factors, with estimated slopes of -0.238 +/- 0.058 in males (Table 4c,
Figure 9) and -0.214 +/- 0.043 in females (Table 4d, Figure 10).
Effect of Female Reproductive Status
Females with young at heel were vigilant more frequently and allocated a greater proportion
of time to vigilance than females without young at heel, independently of other factors (Table
4b and 4d, Figures 4 and 7).
DISCUSSION
This study showed that chamois were consistently more vigilant than mouflon in the
springtime and summertime in Mercantour, during 1995-1998. This result supports our
prediction of a weaker antipredatory behaviour in mouflon related to the relaxed selection
experienced on the predator-free Mediterranean islands. By allocating more time to vigilance
and scanning more often, chamois were more likely than mouflon to have their heads up when
attacking wolves initiated a chase, and thus probably detected attacking wolves earlier than
mouflon on average. As a consequence, chamois potentially reacted faster and had longer
fleeing distances than mouflon upon attack. Since prey individuals with shorter fleeing
distances are more likely to be killed upon attack than those which flee quickly (Fitzgibbon
1989, Krause & Godin 1996), capture success must have been higher for mouflon than for
chamois, assuming similar running speed and agility in both species. However, mouflons are
not native of alpine habitat as chamois are, and may thus be less adapted to such
environments by having probably more limited escape abilities in mountainous terrain than
chamois. Mouflons, being both less vigilant and less agile than chamois, were probably
affected by higher predation rates than chamois.
Classical optimal foraging models predict that, when faced with a choice of prey species,
wolves should maximize their rate of energy intake by selecting the most profitable food item
available (Stephen & Krebs 1986). Profitability of a prey item depends in particular on its
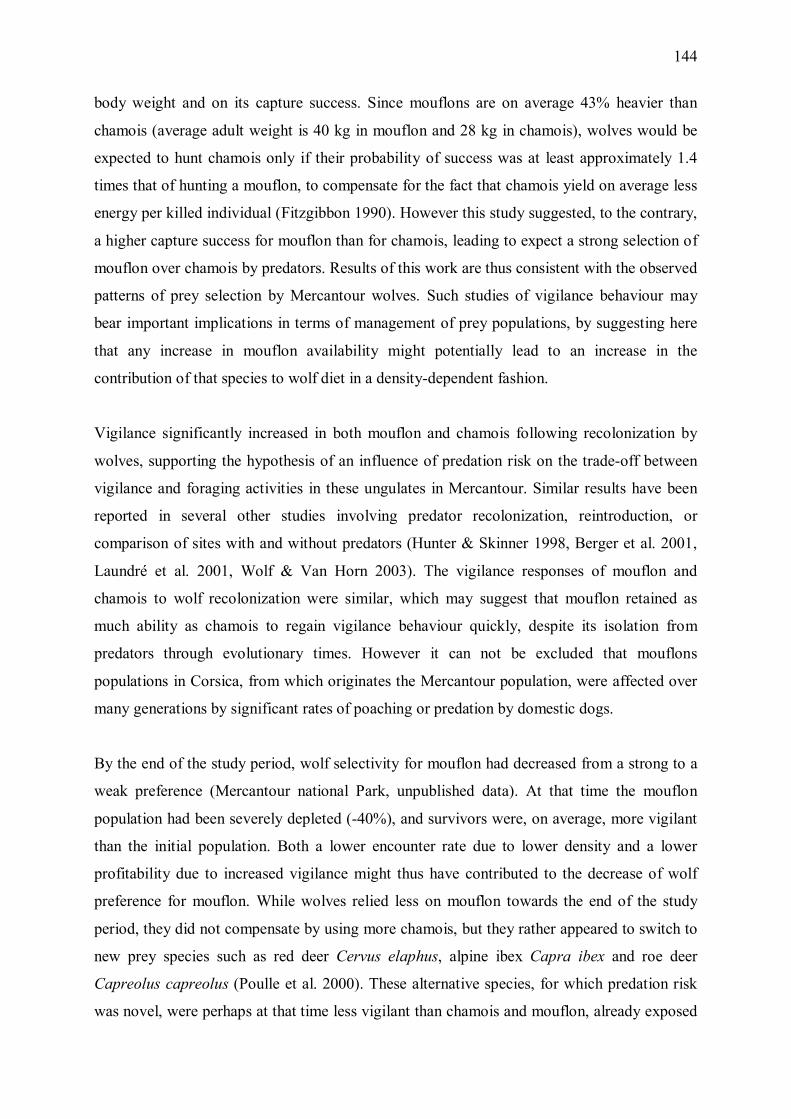
144
body weight and on its capture success. Since mouflons are on average 43% heavier than
chamois (average adult weight is 40 kg in mouflon and 28 kg in chamois), wolves would be
expected to hunt chamois only if their probability of success was at least approximately 1.4
times that of hunting a mouflon, to compensate for the fact that chamois yield on average less
energy per killed individual (Fitzgibbon 1990). However this study suggested, to the contrary,
a higher capture success for mouflon than for chamois, leading to expect a strong selection of
mouflon over chamois by predators. Results of this work are thus consistent with the observed
patterns of prey selection by Mercantour wolves. Such studies of vigilance behaviour may
bear important implications in terms of management of prey populations, by suggesting here
that any increase in mouflon availability might potentially lead to an increase in the
contribution of that species to wolf diet in a density-dependent fashion.
Vigilance significantly increased in both mouflon and chamois following recolonization by
wolves, supporting the hypothesis of an influence of predation risk on the trade-off between
vigilance and foraging activities in these ungulates in Mercantour. Similar results have been
reported in several other studies involving predator recolonization, reintroduction, or
comparison of sites with and without predators (Hunter & Skinner 1998, Berger et al. 2001,
Laundré et al. 2001, Wolf & Van Horn 2003). The vigilance responses of mouflon and
chamois to wolf recolonization were similar, which may suggest that mouflon retained as
much ability as chamois to regain vigilance behaviour quickly, despite its isolation from
predators through evolutionary times. However it can not be excluded that mouflons
populations in Corsica, from which originates the Mercantour population, were affected over
many generations by significant rates of poaching or predation by domestic dogs.
By the end of the study period, wolf selectivity for mouflon had decreased from a strong to a
weak preference (Mercantour national Park, unpublished data). At that time the mouflon
population had been severely depleted (-40%), and survivors were, on average, more vigilant
than the initial population. Both a lower encounter rate due to lower density and a lower
profitability due to increased vigilance might thus have contributed to the decrease of wolf
preference for mouflon. While wolves relied less on mouflon towards the end of the study
period, they did not compensate by using more chamois, but they rather appeared to switch to
new prey species such as red deer Cervus elaphus, alpine ibex Capra ibex and roe deer
Capreolus capreolus (Poulle et al. 2000). These alternative species, for which predation risk
was novel, were perhaps at that time less vigilant than chamois and mouflon, already exposed
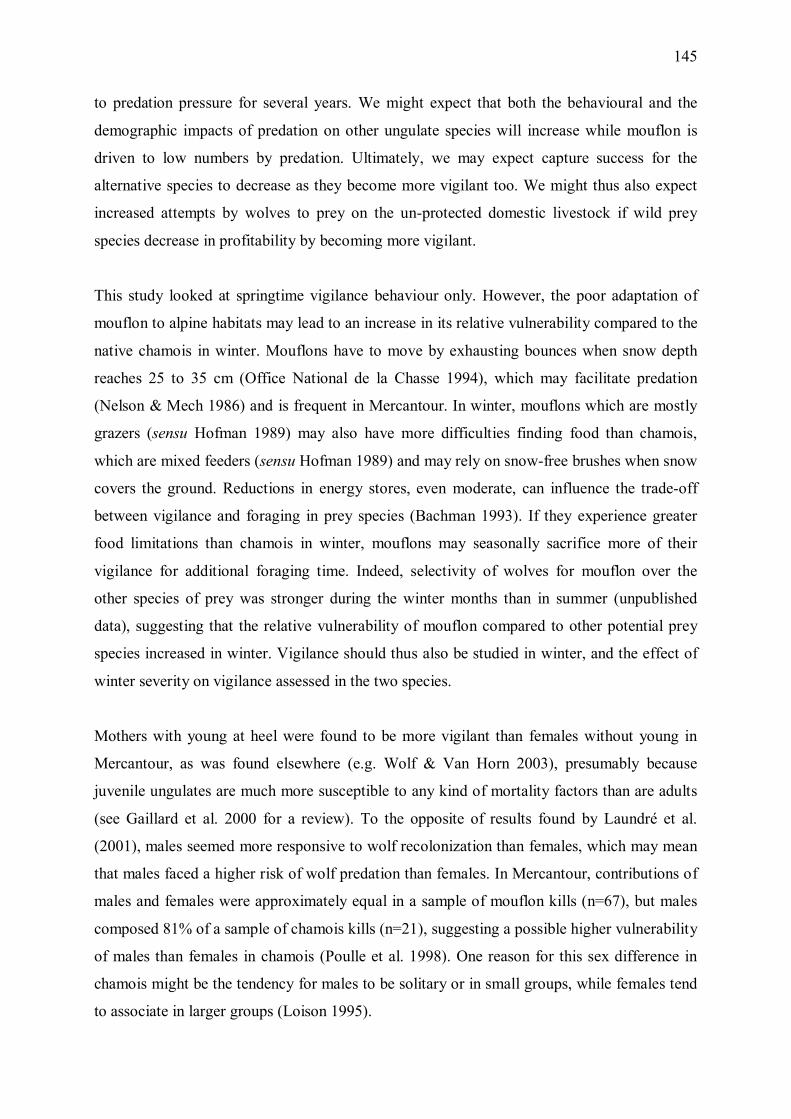
145
to predation pressure for several years. We might expect that both the behavioural and the
demographic impacts of predation on other ungulate species will increase while mouflon is
driven to low numbers by predation. Ultimately, we may expect capture success for the
alternative species to decrease as they become more vigilant too. We might thus also expect
increased attempts by wolves to prey on the un-protected domestic livestock if wild prey
species decrease in profitability by becoming more vigilant.
This study looked at springtime vigilance behaviour only. However, the poor adaptation of
mouflon to alpine habitats may lead to an increase in its relative vulnerability compared to the
native chamois in winter. Mouflons have to move by exhausting bounces when snow depth
reaches 25 to 35 cm (Office National de la Chasse 1994), which may facilitate predation
(Nelson & Mech 1986) and is frequent in Mercantour. In winter, mouflons which are mostly
grazers (sensu Hofman 1989) may also have more difficulties finding food than chamois,
which are mixed feeders (sensu Hofman 1989) and may rely on snow-free brushes when snow
covers the ground. Reductions in energy stores, even moderate, can influence the trade-off
between vigilance and foraging in prey species (Bachman 1993). If they experience greater
food limitations than chamois in winter, mouflons may seasonally sacrifice more of their
vigilance for additional foraging time. Indeed, selectivity of wolves for mouflon over the
other species of prey was stronger during the winter months than in summer (unpublished
data), suggesting that the relative vulnerability of mouflon compared to other potential prey
species increased in winter. Vigilance should thus also be studied in winter, and the effect of
winter severity on vigilance assessed in the two species.
Mothers with young at heel were found to be more vigilant than females without young in
Mercantour, as was found elsewhere (e.g. Wolf & Van Horn 2003), presumably because
juvenile ungulates are much more susceptible to any kind of mortality factors than are adults
(see Gaillard et al. 2000 for a review). To the opposite of results found by Laundré et al.
(2001), males seemed more responsive to wolf recolonization than females, which may mean
that males faced a higher risk of wolf predation than females. In Mercantour, contributions of
males and females were approximately equal in a sample of mouflon kills (n=67), but males
composed 81% of a sample of chamois kills (n=21), suggesting a possible higher vulnerability
of males than females in chamois (Poulle et al. 1998). One reason for this sex difference in
chamois might be the tendency for males to be solitary or in small groups, while females tend
to associate in larger groups (Loison 1995).
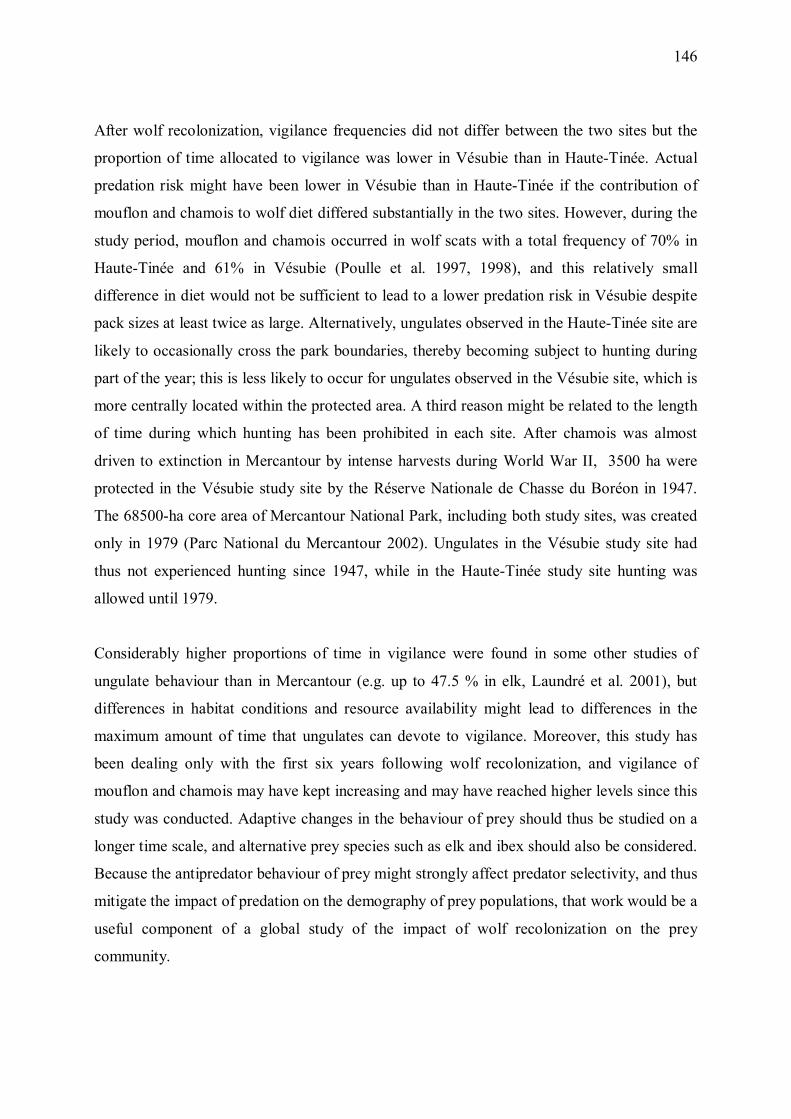
146
After wolf recolonization, vigilance frequencies did not differ between the two sites but the
proportion of time allocated to vigilance was lower in Vésubie than in Haute-Tinée. Actual
predation risk might have been lower in Vésubie than in Haute-Tinée if the contribution of
mouflon and chamois to wolf diet differed substantially in the two sites. However, during the
study period, mouflon and chamois occurred in wolf scats with a total frequency of 70% in
Haute-Tinée and 61% in Vésubie (Poulle et al. 1997, 1998), and this relatively small
difference in diet would not be sufficient to lead to a lower predation risk in Vésubie despite
pack sizes at least twice as large. Alternatively, ungulates observed in the Haute-Tinée site are
likely to occasionally cross the park boundaries, thereby becoming subject to hunting during
part of the year; this is less likely to occur for ungulates observed in the Vésubie site, which is
more centrally located within the protected area. A third reason might be related to the length
of time during which hunting has been prohibited in each site. After chamois was almost
driven to extinction in Mercantour by intense harvests during World War II, 3500 ha were
protected in the Vésubie study site by the Réserve Nationale de Chasse du Boréon in 1947.
The 68500-ha core area of Mercantour National Park, including both study sites, was created
only in 1979 (Parc National du Mercantour 2002). Ungulates in the Vésubie study site had
thus not experienced hunting since 1947, while in the Haute-Tinée study site hunting was
allowed until 1979.
Considerably higher proportions of time in vigilance were found in some other studies of
ungulate behaviour than in Mercantour (e.g. up to 47.5 % in elk, Laundré et al. 2001), but
differences in habitat conditions and resource availability might lead to differences in the
maximum amount of time that ungulates can devote to vigilance. Moreover, this study has
been dealing only with the first six years following wolf recolonization, and vigilance of
mouflon and chamois may have kept increasing and may have reached higher levels since this
study was conducted. Adaptive changes in the behaviour of prey should thus be studied on a
longer time scale, and alternative prey species such as elk and ibex should also be considered.
Because the antipredator behaviour of prey might strongly affect predator selectivity, and thus
mitigate the impact of predation on the demography of prey populations, that work would be a
useful component of a global study of the impact of wolf recolonization on the prey
community.
147
ACKNOWLEDGEMENTS
We are grateful to the many interns who assisted with data collection in the field. N. Espuno
was supported by a PhD grant from Office National de la Chasse et de la Faune Sauvage.
REFERENCES
Agresti, A., 1990. Categorical data analysis. John Wiley & Sons, New-York, USA
Aitkin, M., Anderson, D., Francis, B. and Hinde, J., 1989. Statistical modelling in GLIM.
Clarendon Press, Oxford.
Altmann, J. 1974. Observational study of behavior : sampling method. Behaviour, 49 : 227-
265.
Anthony, L.L. and Blumstein, D.T., 2000. Integrating behaviour into wildlife conservation:
the multiple ways that behaviour can reduce Ne. Biological Conservation, 95: 303-315.
Bachman, G.C., 1993. The effect of body condition on the trade-off between vigilance and
foraging in Belding�s ground squirrels. Animal Behaviour, 46: 233-244.
Bednekoff, P.A. and Ritter, R., 1994. Vigilance in Nxai Pan springbok, Antidorcas
marsupialis. Behaviour, 129: 1-11.
Berger, J., 1998. Future prey: some consequences of the loss and restoration of large
carnivores. In: Behavioral Ecology and Conservation Biology. (Ed. by T. Caro), pp. 80-
100. Oxford University Press, NY, USA.
Berger, J., Swenson, J.E. and Persson, I.-L., 2001. Recolonizing carnivores and naïve prey:
conservation lessons from Pleistocene extinctions. Science, 291:1036-1039.
Blondel, J. and Aronson, J., 1999. Biology and wildlife of the Mediterranean region. Oxford
University Press, Oxford.
Blondel, J. and Vigne, J.-D., 1993. Space, time and man as determinants of diversity of birds
and mammals in the Mediterranean region. In: Species diversity in ecological
communities (Ed. by R.E. Ricklefs and D. Schluter), pp. 135-146. University of Chicago
Press, Chicago and London.
Blumstein, D. T. 2002. Moving to suburbia: ontogenetic and evolutionary consequences of
life on predator-free islands. Journal of Biogeography, 29:685-692.
Burnham, K. P. and Anderson, D.R., 1998. Model selection and inference, a practical
information-theoretic approach. Springer, New-York.
148
Conradt, L., Clutton-Brock, T., and Thompson, D., 1999. Habitat segregation in ungulates:
are males forced into suboptimal foraging habitats through indirect competition by
females? Oecologia, 119: 367-377.
Curio, E., 1996. Conservation needs ethology. Trends in Ecology and Evolution, 11: 260-263.
Dahier, T., Poulle, M.-L and Lequette, B., 2002. Le retour du loup dans les Alpes françaises :
méthodes de suivi et état des connaissances. In Actes du XXIIIe colloque francophone de
mammalogie « l�étude et la conservation des carnivores », Maison-Alfort, 23-24
octobre 1999 (Ed. by G. Chapron et F. Moutou), pp 10-15. SFEPM, Paris.
Elgar, M.A., 1989. Predator vigilance and group size in mammals and birds: a critical review
of the empirical evidence. Biological Reviews of the Cambridge Philosophical Society,
64:13-33.
Fitzgibbon, C.D., 1989. A cost to individuals with reduced vigilance in groups of Thompson�s
gazelles hunted by cheetah. Animal Behaviour, 37: 508-510.
Fitzgibbon, C. D. 1990. Why do hunting cheetah prefer male gazelles? Animal Behaviour,
40:837-845.
Fitzgibbon, C.D., 1993. Antipredator strategies of female Thomson�s gazelles with hidden
fawns. Journal of Mammalogy, 75: 758-762.
Frid, A., 1997. Vigilance by female Dall�s sheep: interactions between predation risk factors.
Animal Behaviour, 53:799-808.
Gaillard, J.-M., Festa-Bianchet, M., Yoccoz, N.G., Loison, A. and Toïgo, C., 2000. Temporal
variation in fitness components and population dynamics of large herbivores. Annual
Review of Ecology and Systematics, 31: 367-393.
Griffin, A.S., Blumstein, D.T. and Evans, C.S., 2000. Training captive-bred or translocated
animals to avoid predators. Conservation Biology, 14(5): 1317-1326.
Hilton, G.M., Cresswell, W. and Ruxton, G.D., 1999. Intra-flock variation in the speed of
response on attack by an avian predator. Behavioral Ecology, 10:391-395.
Hofman, R.R., 1989. Evolutionary steps of ecophysiological adaptation and diversification of
ruminants: a comparative view of their digestive system. Oecologia, 78: 443-457.
Hunter, L.T.B. and Skinner, J.D., 1998. Vigilance behaviour in African ungulates: the role of
predation pressure. Behaviour, 135: 195-211.
Illius, A.W. and Fitzgibbon, C.D., 1994. Costs of vigilance in foraging. Animal Behaviour,
47: 481-484.
149
Krause J. and Godin, J.-G.J., 1996. Influence of prey foraging posture on flight behavior and
predation risk: predators take advantage of unwary prey. Behavioral Ecology, 7:264-
271.
Laundré, J.W., Hernandez, L. and Altendorf, K.B., 2001. Wolves, elk and bison:
reestablishing the �landscape of fear� in Yellowstone National Park, USA. Canadian
Journal of Zoology, 79:1401-1409.
Loison, A. 1995. Approches intra- et inter-spécifiques de la dynamique des populations:
l�exemple du chamois. Thèse de Doctorat. Université Lyon I.
McLean, I.G., Lundie-Jenkins, G. and Jarman, P.J., 1996. Teaching and endangered mammal
to recognise predators. Biological Conservation, 56: 51-62.
Nelson, M.E. and Mech, L.D., 1986. Relationship between snow depth and gray wolf
predation on white-tailed deer. Journal of Wildlife Management, 50(3):471-474.
Office National de la Chasse, 1994. Le mouflon de Corse. Brochures techniques de l�Office
National de la Chasse, n°21.
Parc national du Mercantour, 2002. Atlas des Parcs nationaux de France, Parc national du
Mercantour. Ministère de l'Ecologie et du Développement Durable. © MEDD, Parc
national du Mercantour, Nice.
Poplin, F., 1979. Origine du mouflon de Corse dans une nouvelle perspective
paléontologique : par marronnage. Annales de Génétique et de Sélection Animale,
11(2):133-143.
Poulle, M.-L., Carles, L. and Lequette, B., 1997. Significance of ungulates in the diet of
recently settled wolves in the Mercantour mountains (southeastern France). Revue
d�Ecologie (Terre Vie), 52:357-368.
Poulle, M.-L, Houard, T. and Lequette, B., 1998. Prédation exercée par le loup sur le mouflon
et le chamois dans le massif du Mercantour (sud-est de la France). Gibier Faune
Sauvage, Game Wildlife, 15 (Hors série Tome 1).
Poulle, M.-L., Dahier, T., de Beaufort, R. and Durand, C., 2000. Le loup en France.
Programme Life Nature. Rapport Final 1997-1999.
Ruckstuhl, K.E. and Festa-Bianchet, M., 1998. Do reproductive status and lamb gender affect
the foraging behaviour of bighorn ewes? Ethology 104: 941-954.
Ruckstuhl, K.E. and Neuhaus, P., 2002. Sexual segregation in ungulates: a comparative test of
three hypotheses. Biological Reviews, 77: 77-96.
Scheel, D. and Packer, C., 1991. Group hunting behaviour of lions: a search for cooperation.
Animal Behaviour 41(4): 697-709.
150
Short, J., Kinnear, J.E. and Robley, A., 2002. Surplus killing by introduced predators in
Australia: evidence for ineffective anti-predator adaptations in native prey species?
Biological Conservation, 103(3) :283-301.
Stephen, D.W. and Krebs, J.R., 1986. Foraging theory. Princeton University Press. Princeton,
New Jersey.
White, K.S. and Berger, J., 2001. Antipredator strategies of Alaskan moose: are maternal
trade-offs influenced by offspring activity? Canadian Journal of Zoology, 79(11): 2055-
2062.
Wolf, J.O. and Van Horn, T., 2003. Vigilance and foraging patterns of American elk during
the rut in habitats with and without predators. Canadian Journal of Zoology, 81:266-
271.
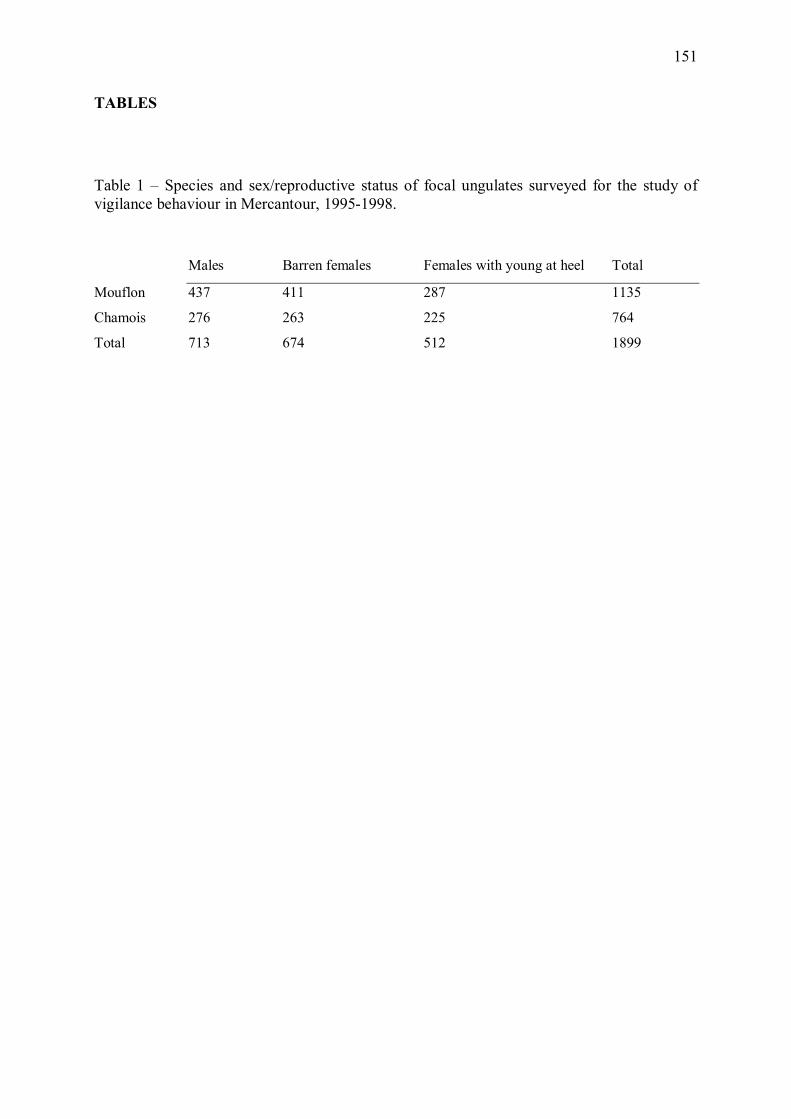
151
TABLES
Table 1 � Species and sex/reproductive status of focal ungulates surveyed for the study of vigilance behaviour in Mercantour, 1995-1998.
Males Barren females Females with young at heel Total
Mouflon 437 411 287 1135
Chamois 276 263 225 764
Total 713 674 512 1899
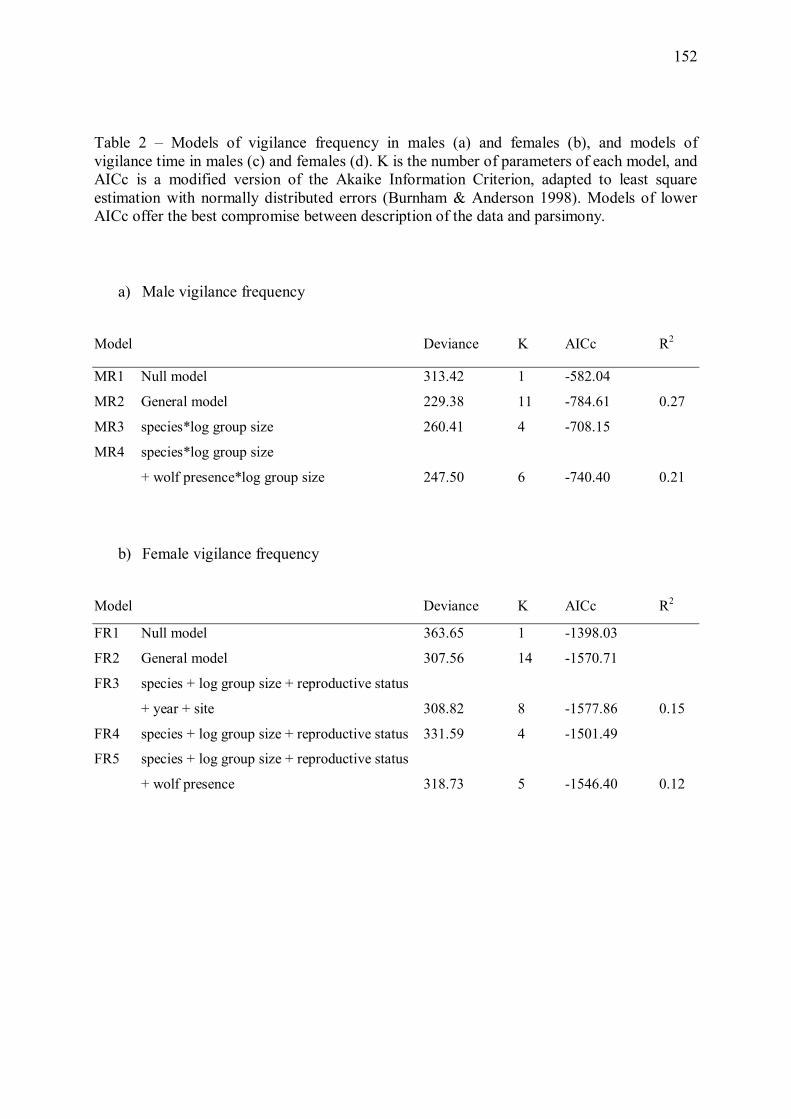
152
Table 2 � Models of vigilance frequency in males (a) and females (b), and models of vigilance time in males (c) and females (d). K is the number of parameters of each model, and AICc is a modified version of the Akaike Information Criterion, adapted to least square estimation with normally distributed errors (Burnham & Anderson 1998). Models of lower AICc offer the best compromise between description of the data and parsimony.
a) Male vigilance frequency
Model Deviance K AICc R2
MR1 Null model 313.42 1 -582.04
MR2 General model 229.38 11 -784.61 0.27
MR3 species*log group size 260.41 4 -708.15
MR4 species*log group size
+ wolf presence*log group size 247.50 6 -740.40 0.21
b) Female vigilance frequency
Model Deviance K AICc R2
FR1 Null model 363.65 1 -1398.03
FR2 General model 307.56 14 -1570.71
FR3 species + log group size + reproductive status
+ year + site 308.82 8 -1577.86 0.15
FR4 species + log group size + reproductive status 331.59 4 -1501.49
FR5 species + log group size + reproductive status
+ wolf presence 318.73 5 -1546.40 0.12
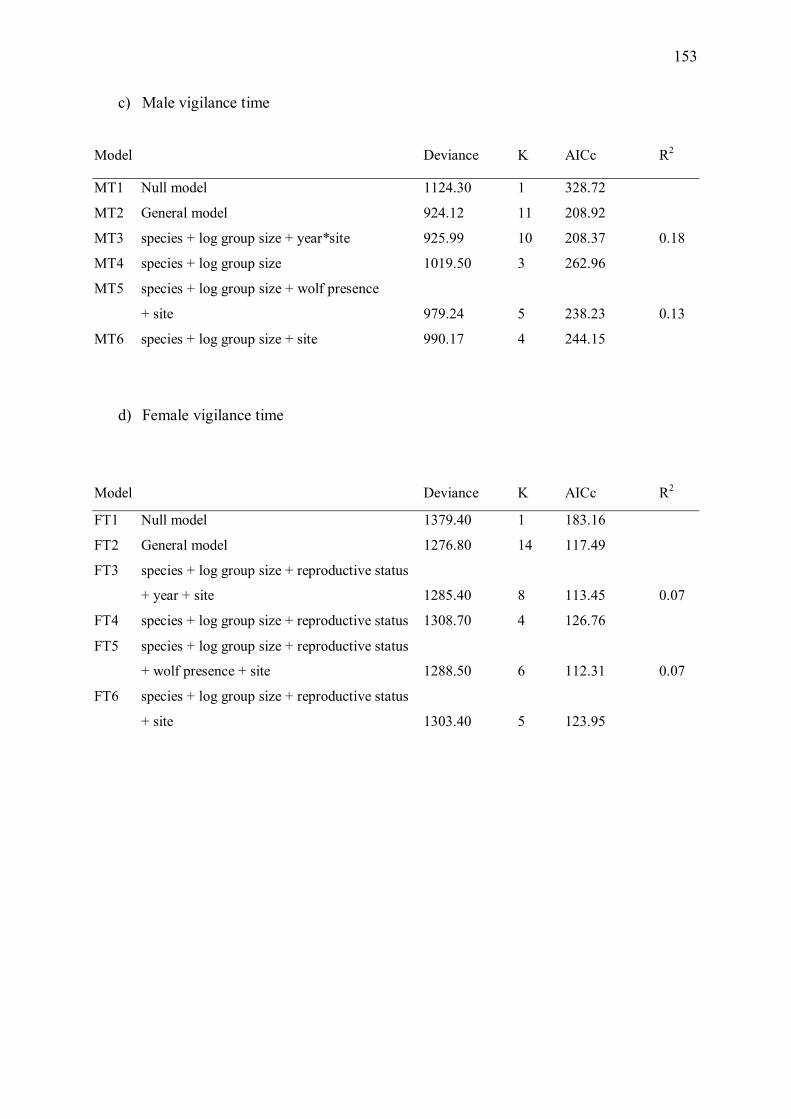
153
c) Male vigilance time
Model Deviance K AICc R2
MT1 Null model 1124.30 1 328.72
MT2 General model 924.12 11 208.92
MT3 species + log group size + year*site 925.99 10 208.37 0.18
MT4 species + log group size 1019.50 3 262.96
MT5 species + log group size + wolf presence
+ site 979.24 5 238.23 0.13
MT6 species + log group size + site 990.17 4 244.15
d) Female vigilance time
Model Deviance K AICc R2
FT1 Null model 1379.40 1 183.16
FT2 General model 1276.80 14 117.49
FT3 species + log group size + reproductive status
+ year + site 1285.40 8 113.45 0.07
FT4 species + log group size + reproductive status 1308.70 4 126.76
FT5 species + log group size + reproductive status
+ wolf presence + site 1288.50 6 112.31 0.07
FT6 species + log group size + reproductive status
+ site 1303.40 5 123.95
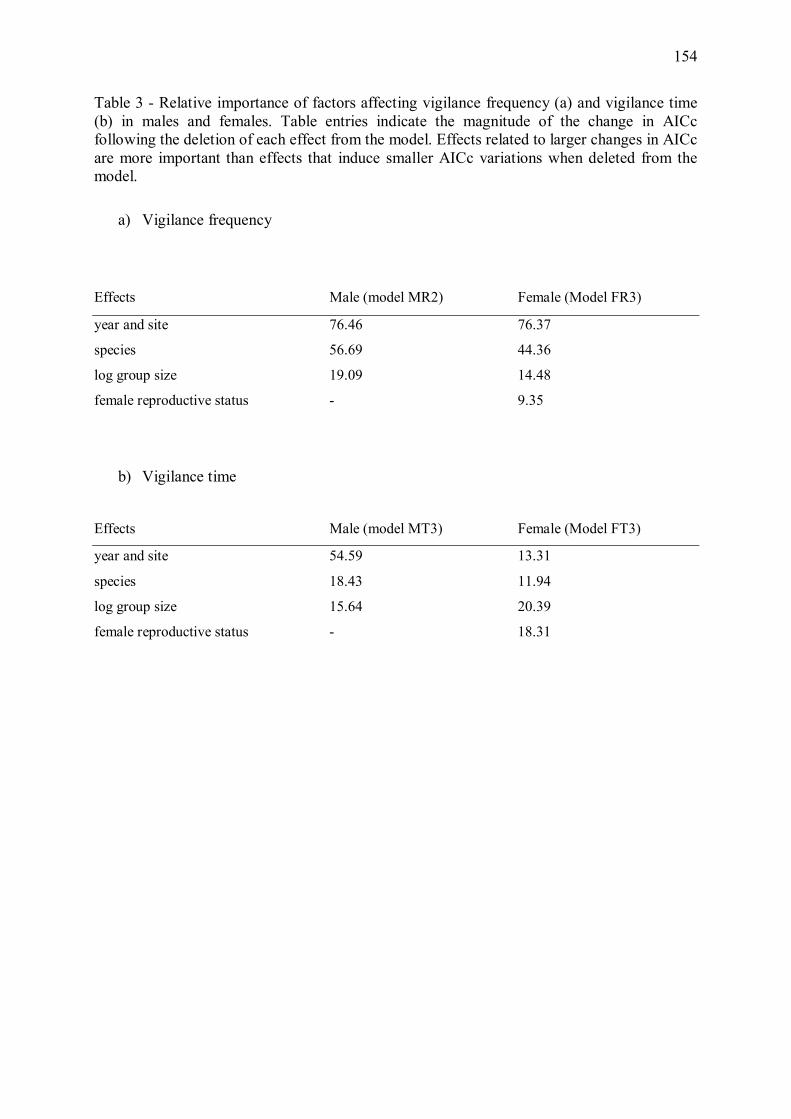
154
Table 3 - Relative importance of factors affecting vigilance frequency (a) and vigilance time (b) in males and females. Table entries indicate the magnitude of the change in AICc following the deletion of each effect from the model. Effects related to larger changes in AICc are more important than effects that induce smaller AICc variations when deleted from the model.
a) Vigilance frequency
Effects Male (model MR2) Female (Model FR3)
year and site 76.46 76.37
species 56.69 44.36
log group size 19.09 14.48
female reproductive status - 9.35
b) Vigilance time
Effects Male (model MT3) Female (Model FT3)
year and site 54.59 13.31
species 18.43 11.94
log group size 15.64 20.39
female reproductive status - 18.31
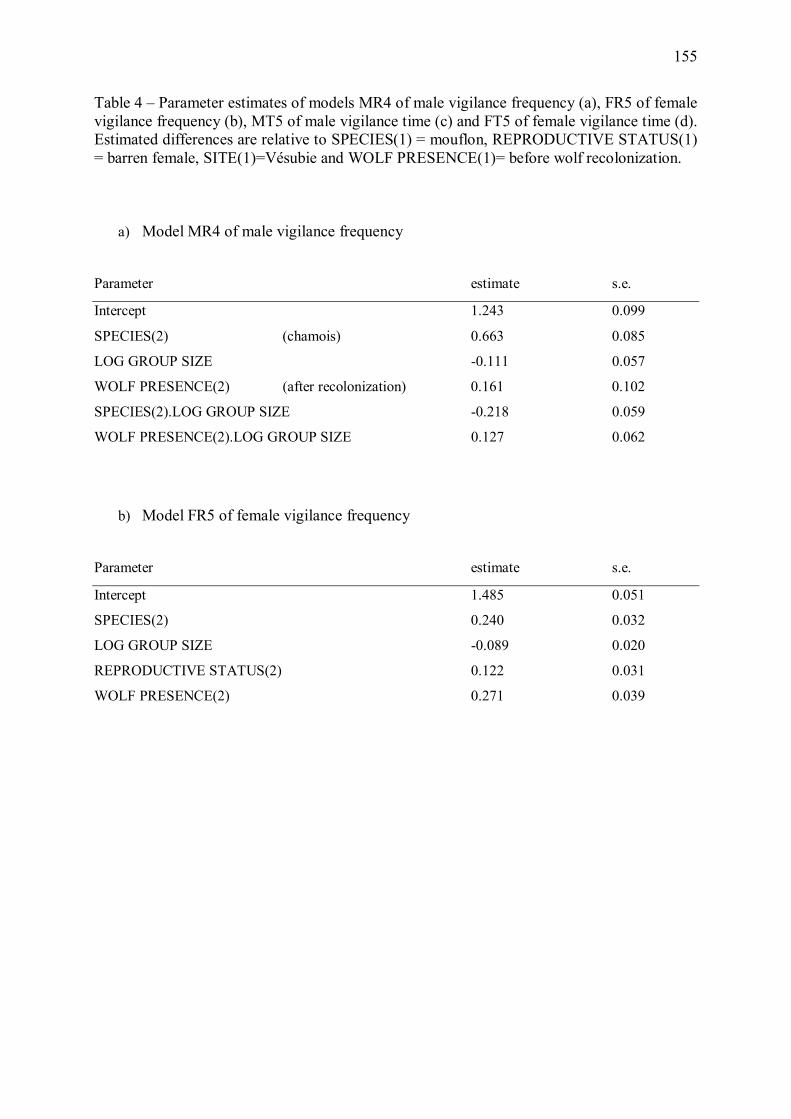
155
Table 4 � Parameter estimates of models MR4 of male vigilance frequency (a), FR5 of female vigilance frequency (b), MT5 of male vigilance time (c) and FT5 of female vigilance time (d). Estimated differences are relative to SPECIES(1) = mouflon, REPRODUCTIVE STATUS(1) = barren female, SITE(1)=Vésubie and WOLF PRESENCE(1)= before wolf recolonization.
a) Model MR4 of male vigilance frequency
Parameter estimate s.e.
Intercept 1.243 0.099
SPECIES(2) (chamois) 0.663 0.085
LOG GROUP SIZE -0.111 0.057
WOLF PRESENCE(2) (after recolonization) 0.161 0.102
SPECIES(2).LOG GROUP SIZE -0.218 0.059
WOLF PRESENCE(2).LOG GROUP SIZE 0.127 0.062
b) Model FR5 of female vigilance frequency
Parameter estimate s.e.
Intercept 1.485 0.051
SPECIES(2) 0.240 0.032
LOG GROUP SIZE -0.089 0.020
REPRODUCTIVE STATUS(2) 0.122 0.031
WOLF PRESENCE(2) 0.271 0.039
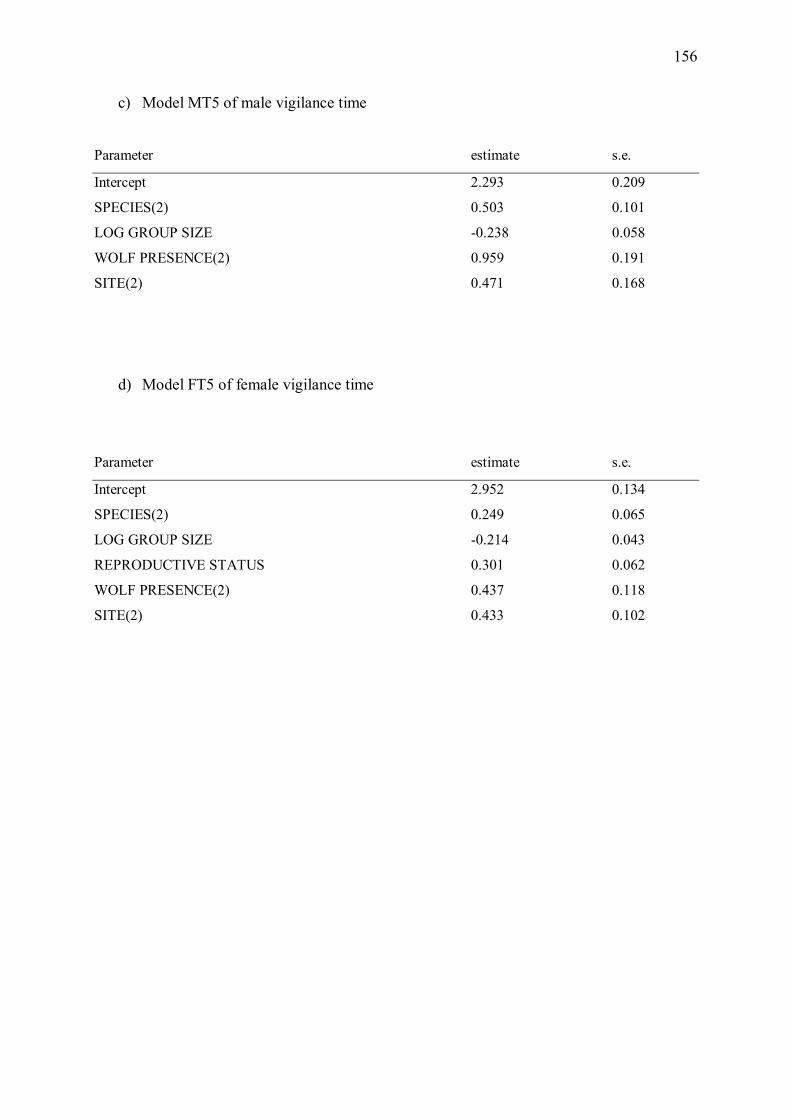
156
c) Model MT5 of male vigilance time
Parameter estimate s.e.
Intercept 2.293 0.209
SPECIES(2) 0.503 0.101
LOG GROUP SIZE -0.238 0.058
WOLF PRESENCE(2) 0.959 0.191
SITE(2) 0.471 0.168
d) Model FT5 of female vigilance time
Parameter estimate s.e.
Intercept 2.952 0.134
SPECIES(2) 0.249 0.065
LOG GROUP SIZE -0.214 0.043
REPRODUCTIVE STATUS 0.301 0.062
WOLF PRESENCE(2) 0.437 0.118
SITE(2) 0.433 0.102

157
FIGURE LEGENDS
Figure 1 � Estimated number of resident wolves using the Vésubie and Haute-Tinée study sites during the winters of 1994-95 to 1997-98. Pack sizes were estimated from snow-tracking data (Mercantour national Park). While the Vésubie pack had settled in the area as soon as 1993, resident wolves were detected only in 1996-97 in Haute-Tinée. Figure 2 � Residuals of the models of vigilance frequency plotted against fitted values. Left plots are from the models for males, right plots are from the models for females. For each sex, the top plot is from the preferred model, and the bottom plot is from the model without factors YEAR and SITE but accounting for the presence or absence of wolves. Apart from the lines due to the discrete nature of the response variable, the plots show no obvious patterns, suggesting a good fit of the models to the data. Figure 3 � Residuals of the models of vigilance time plotted against fitted values. Left plots are from the models for males, right plots are from the models for females. For each sex, the top plot is from the preferred model, and the bottom plot is from the model without factors YEAR and SITE but accounting for the presence or absence of wolves. The plots show no obvious patterns, suggesting a good fit of the models to the data. Figure 4 � Frequency of vigilance bouts in females, as predicted by model FR5 for a female belonging to a group of 15 individuals. According to the model, females with young at heel showed more frequent vigilance bouts than barren females, in both species. Moreover, according to the model, females of both species responded to wolf recolonization by increases in the frequency of vigilance bouts. Figure 5 � Effect of group size on the frequency of vigilance bouts in male mouflon and chamois as a function of species and wolf presence, as predicted by model MR4. According to the model, the frequency of vigilance bouts decreased linearly with log(group size) in male chamois, but showed little response to group size in male mouflon. Moreover, according to the model, males of both species responded to wolf recolonization by increases in the frequency of vigilance bouts. Figure 6 � Percent time allocated to vigilance by males, as predicted by model MT5 for a male belonging to a group of 15 individuals. According to the model, males of both species responded to wolf recolonization by allocating more time to vigilance. Figure 7 � Percent time allocated to vigilance by females, as predicted by model FT5 for a female belonging to a group of 15 individuals. According to the model, females with young at heel allocated more time to vigilance than barren females, in both species. Moreover, according to the model, females of both species responded to wolf recolonization by allocating more time to vigilance. Figure 8 � Shape of the relationship of group size and frequency of vigilance bouts in females (example of a barren female mouflon after wolf recolonization). According to the model, the frequency of vigilance bouts decreased linearly with log(group size).

158
Figure 9 - Shape of the relationship of group size and percent time allocated to vigilance by males (example of a male mouflon in the Haute-Tinée site after wolf recolonization). According to the model, the frequency of vigilance bouts decreased linearly with log(group size). Figure 10 - Shape of the relationship of group size and percent of time allocated to vigilance by females (example of a barren female mouflon in the Haute-Tinée site after wolf recolonization). According to the model, the frequency of vigilance bouts decreased linearly with log(group size).
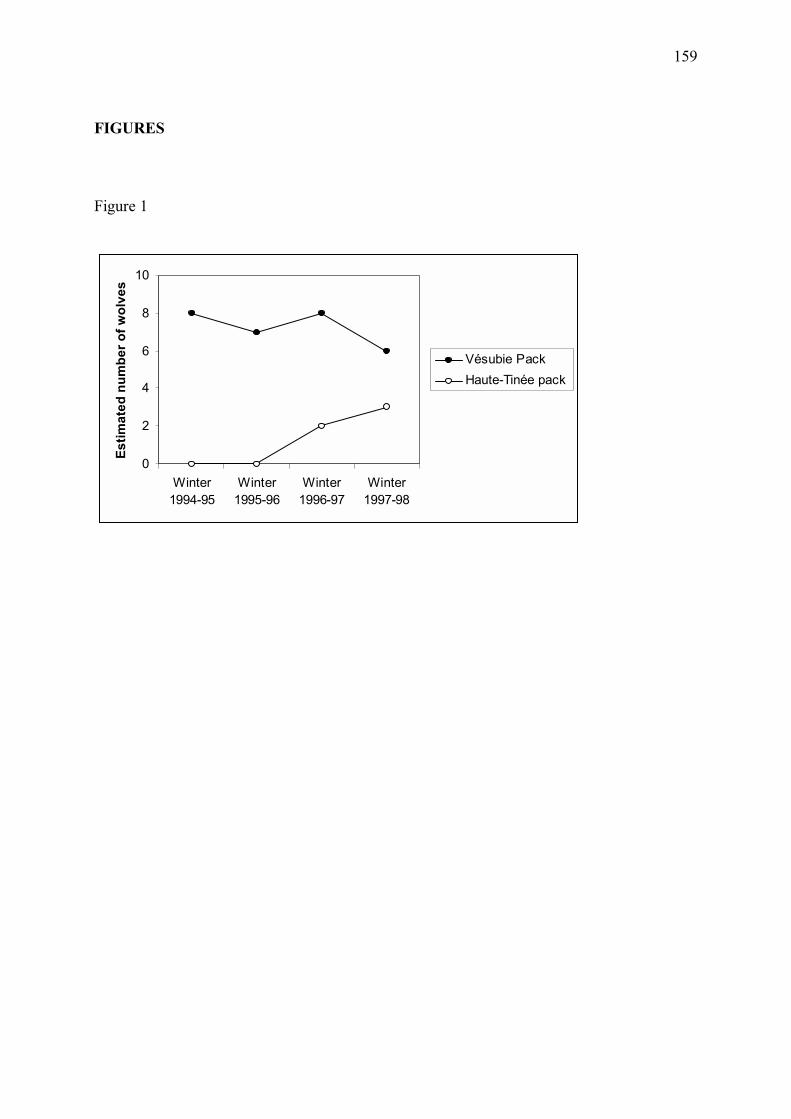
159
FIGURES
Figure 1
0
2
4
6
8
10
Winter1994-95
Winter1995-96
Winter1996-97
Winter1997-98
Estim
ated
num
ber o
f wol
ves
Vésubie PackHaute-Tinée pack
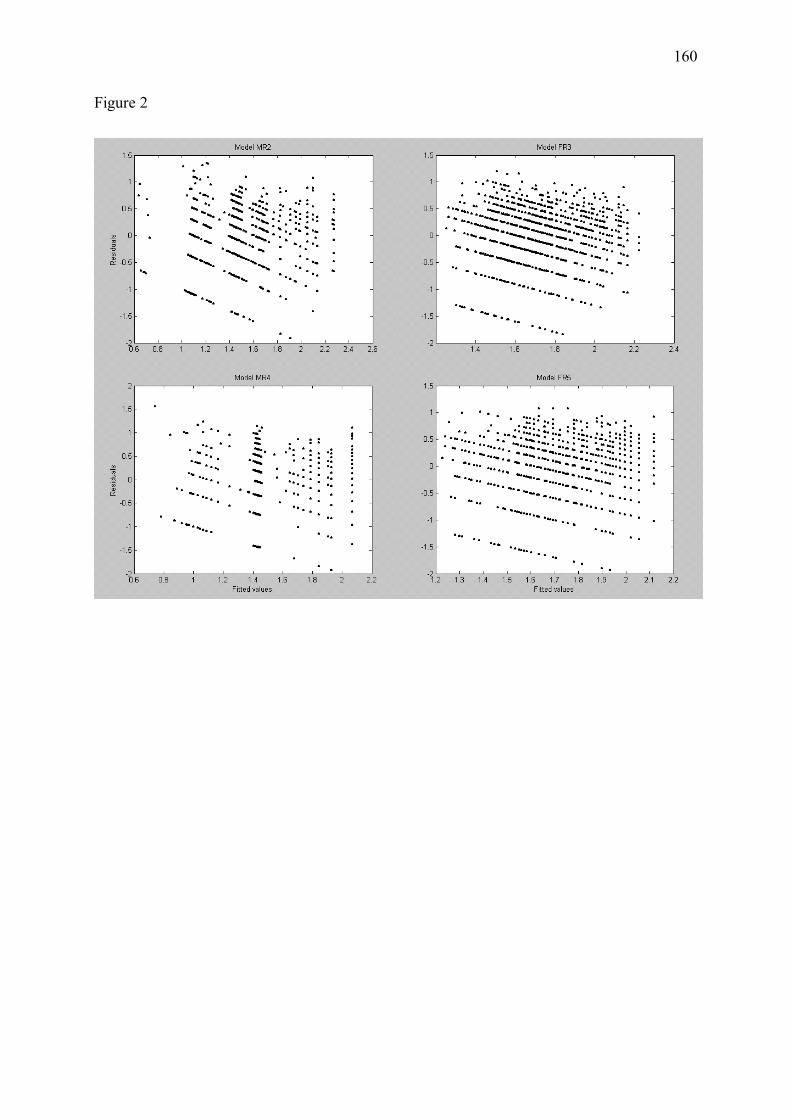
160
Figure 2
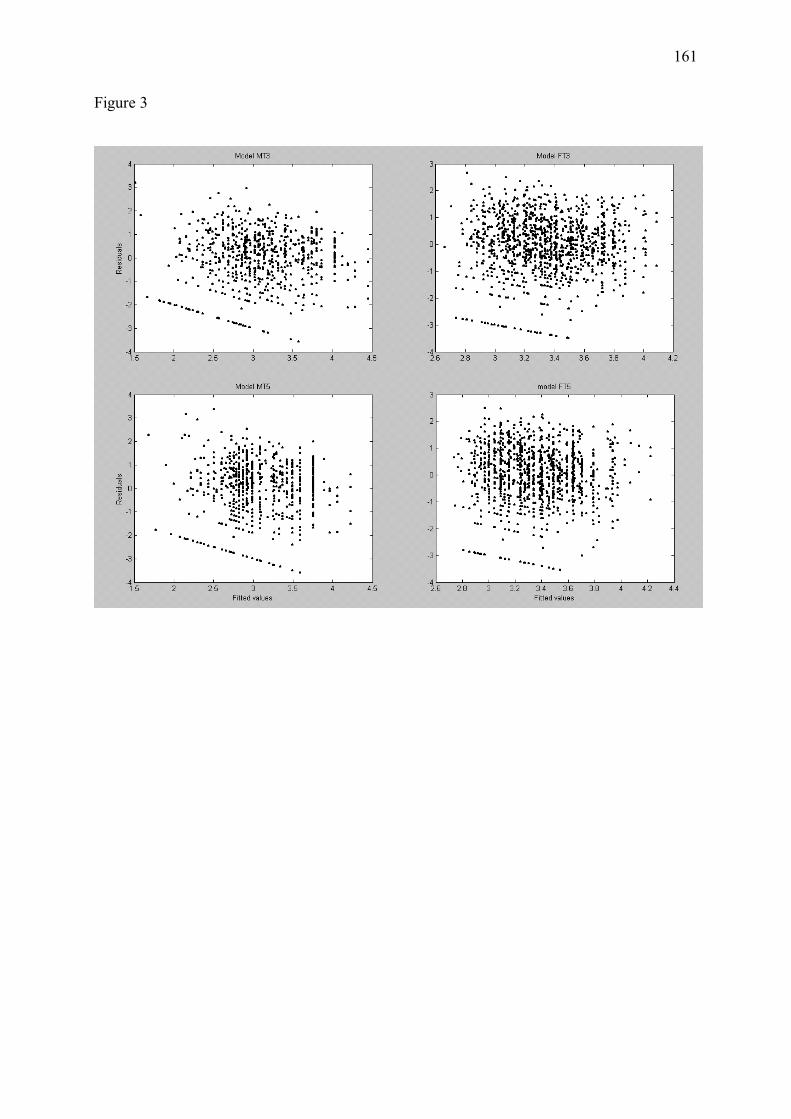
161
Figure 3
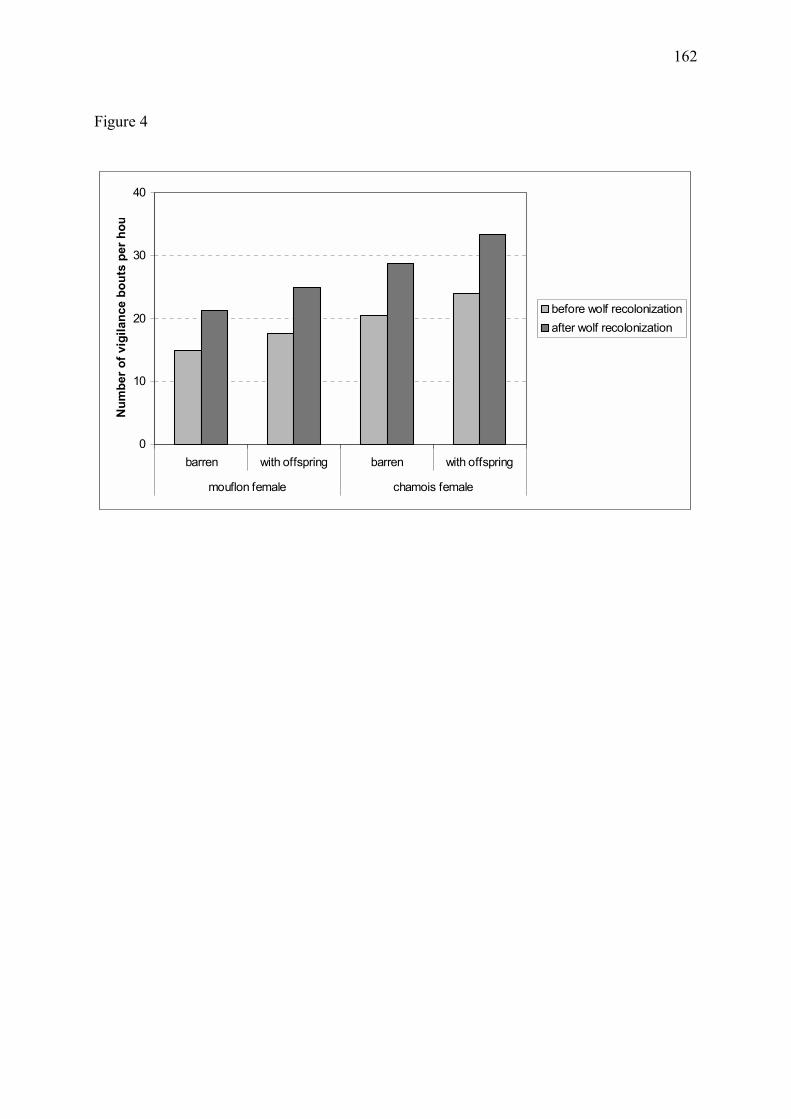
162
Figure 4
0
10
20
30
40
barren with offspring barren with offspring
mouflon female chamois female
Num
ber o
f vig
ilanc
e bo
uts
per h
ou
before wolf recolonizationafter wolf recolonization
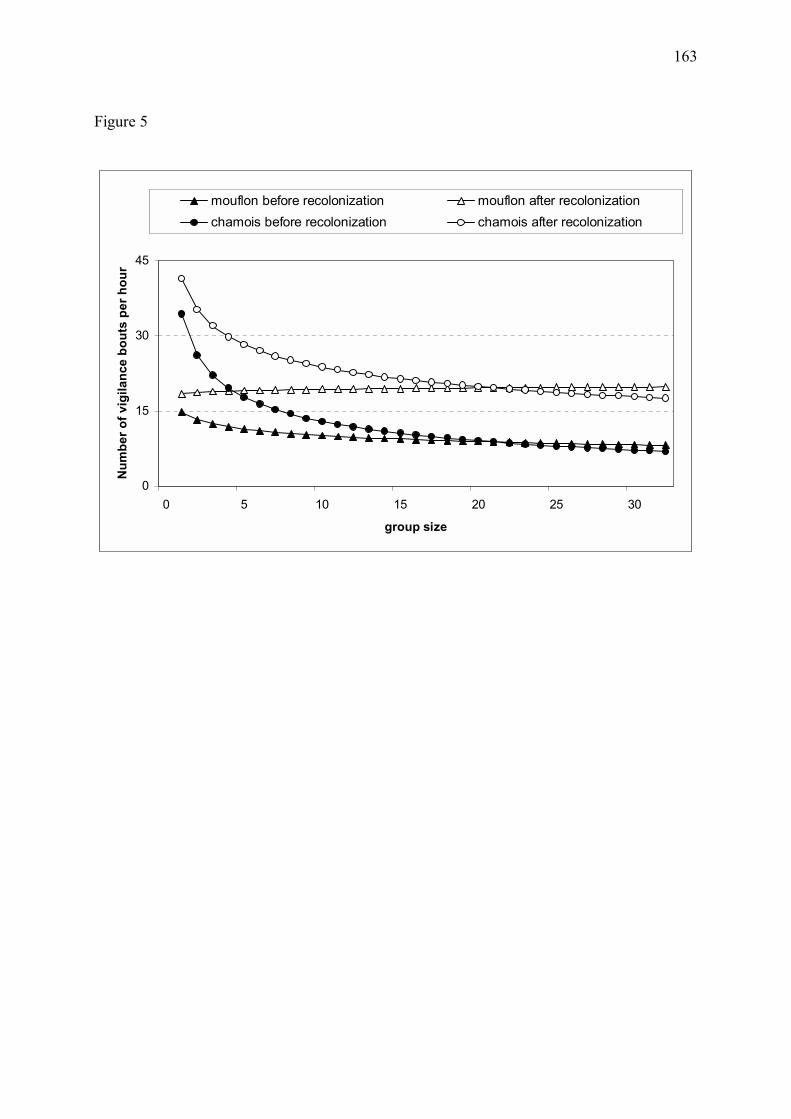
163
Figure 5
0
15
30
45
0 5 10 15 20 25 30
group size
Num
ber o
f vig
ilanc
e bo
uts
per h
our
mouflon before recolonization mouflon after recolonizationchamois before recolonization chamois after recolonization
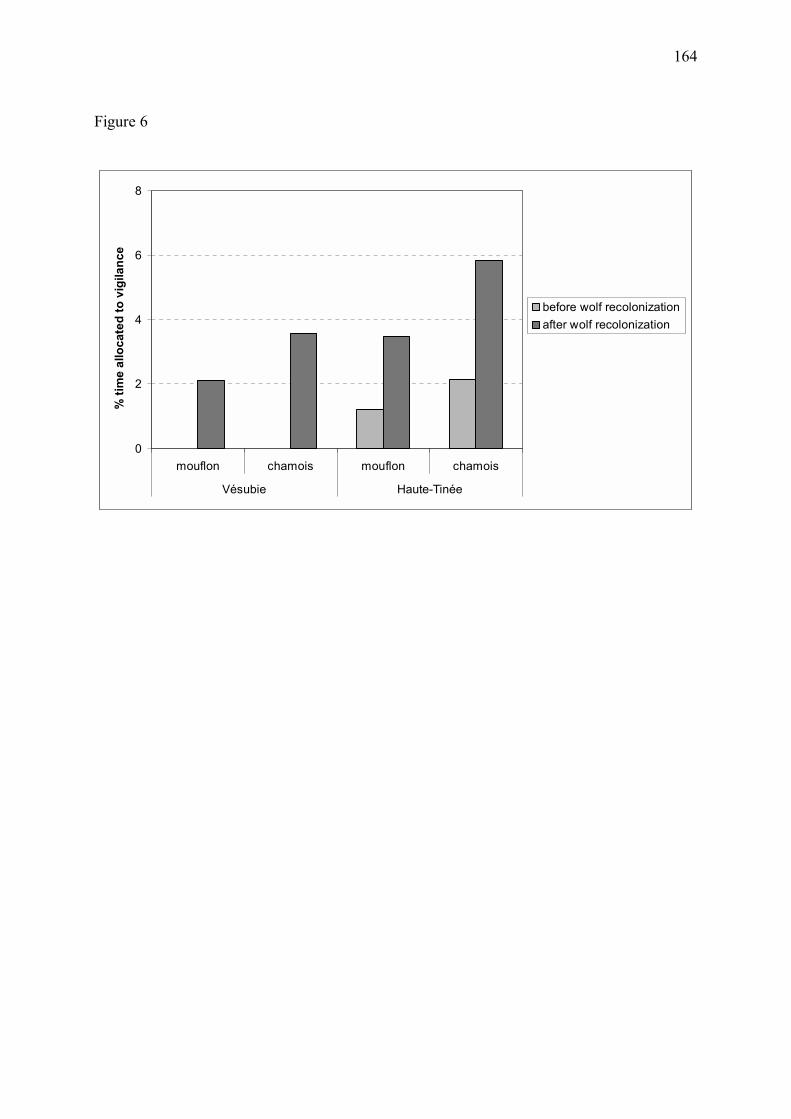
164
Figure 6
0
2
4
6
8
mouflon chamois mouflon chamois
Vésubie Haute-Tinée
% ti
me
allo
cate
d to
vig
ilanc
e
before wolf recolonizationafter wolf recolonization
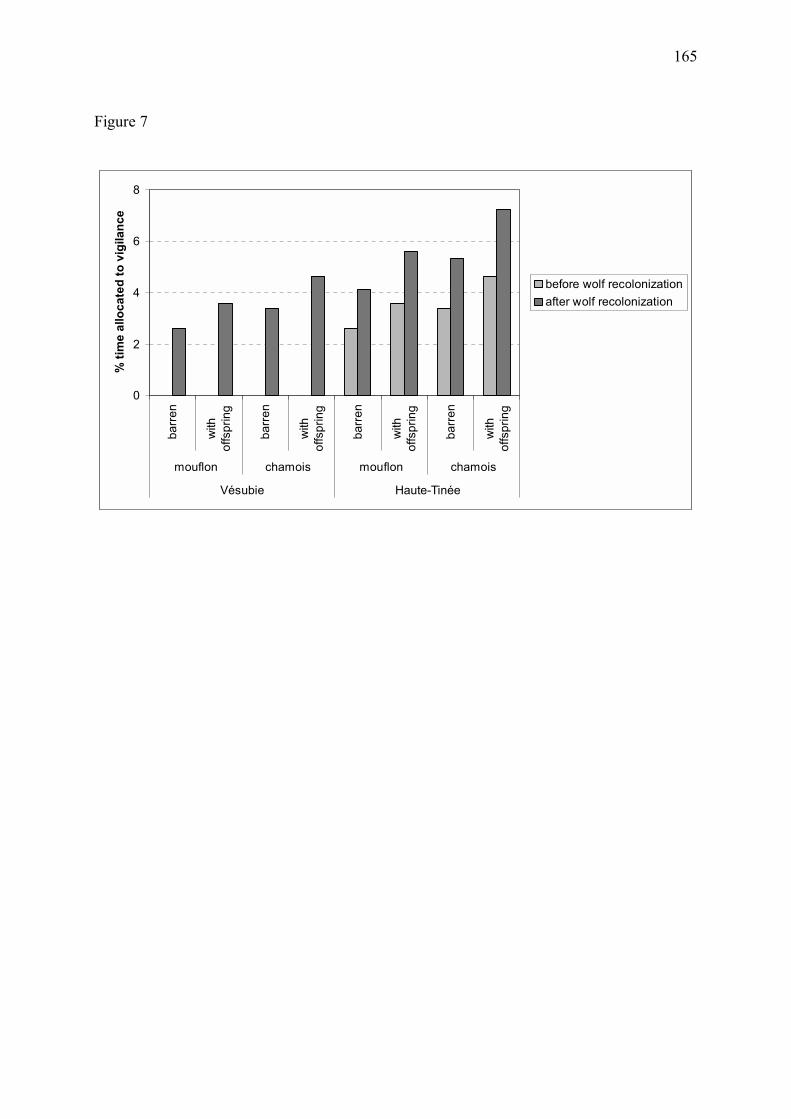
165
Figure 7
0
2
4
6
8ba
rren
with
offs
prin
g
barr
en
with
offs
prin
g
barr
en
with
offs
prin
g
barr
en
with
offs
prin
g
mouflon chamois mouflon chamois
Vésubie Haute-Tinée
% ti
me
allo
cate
d to
vig
ilanc
e
before wolf recolonizationafter wolf recolonization
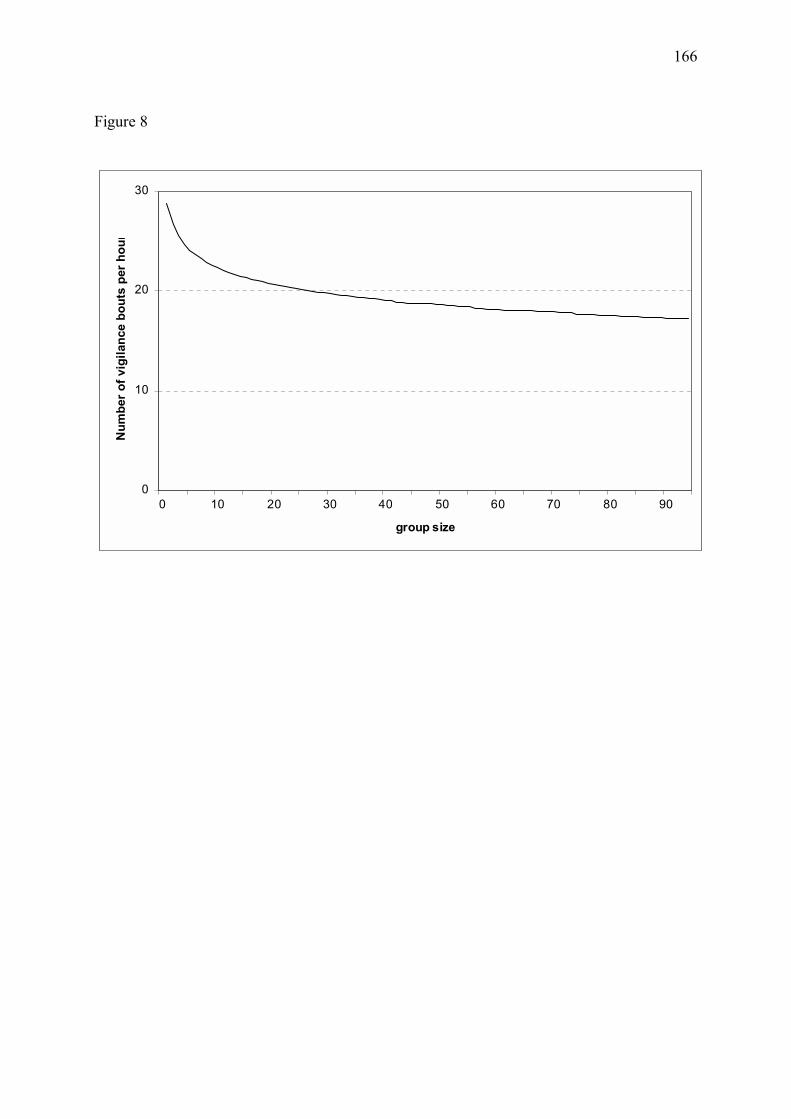
166
Figure 8
0
10
20
30
0 10 20 30 40 50 60 70 80 90
group size
Num
ber o
f vig
ilanc
e bo
uts
per h
our
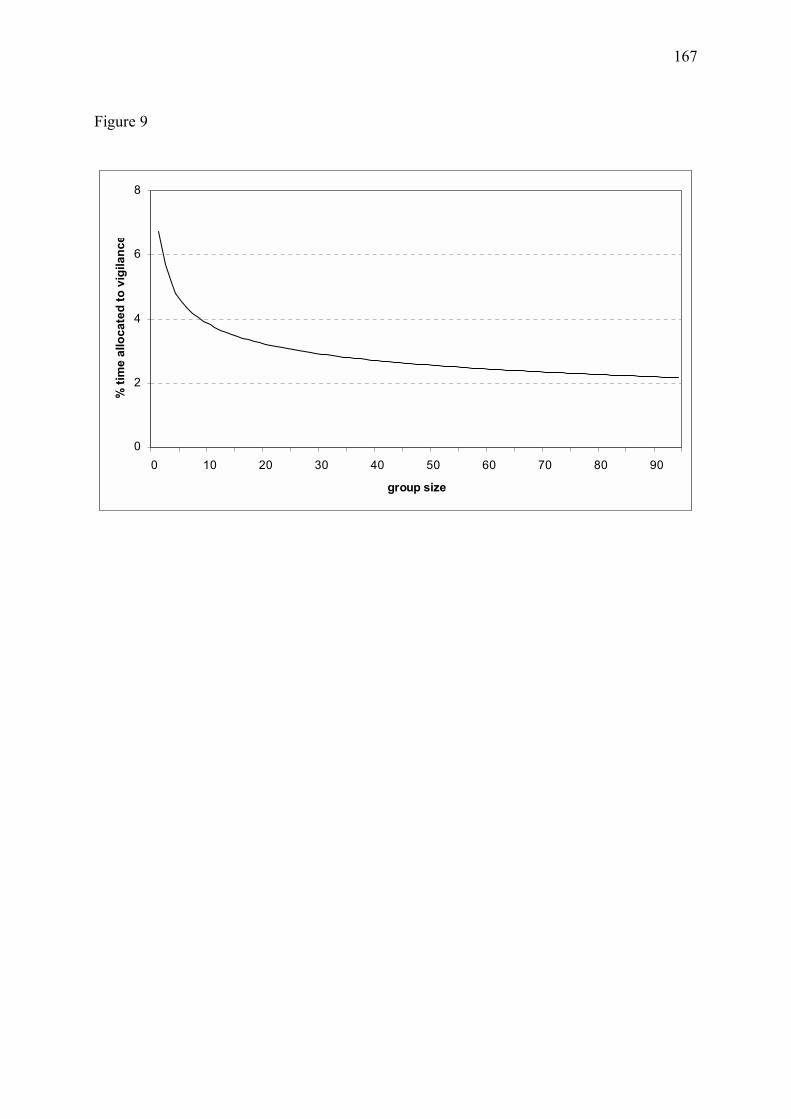
167
Figure 9
0
2
4
6
8
0 10 20 30 40 50 60 70 80 90
group size
% ti
me
allo
cate
d to
vig
ilanc
e
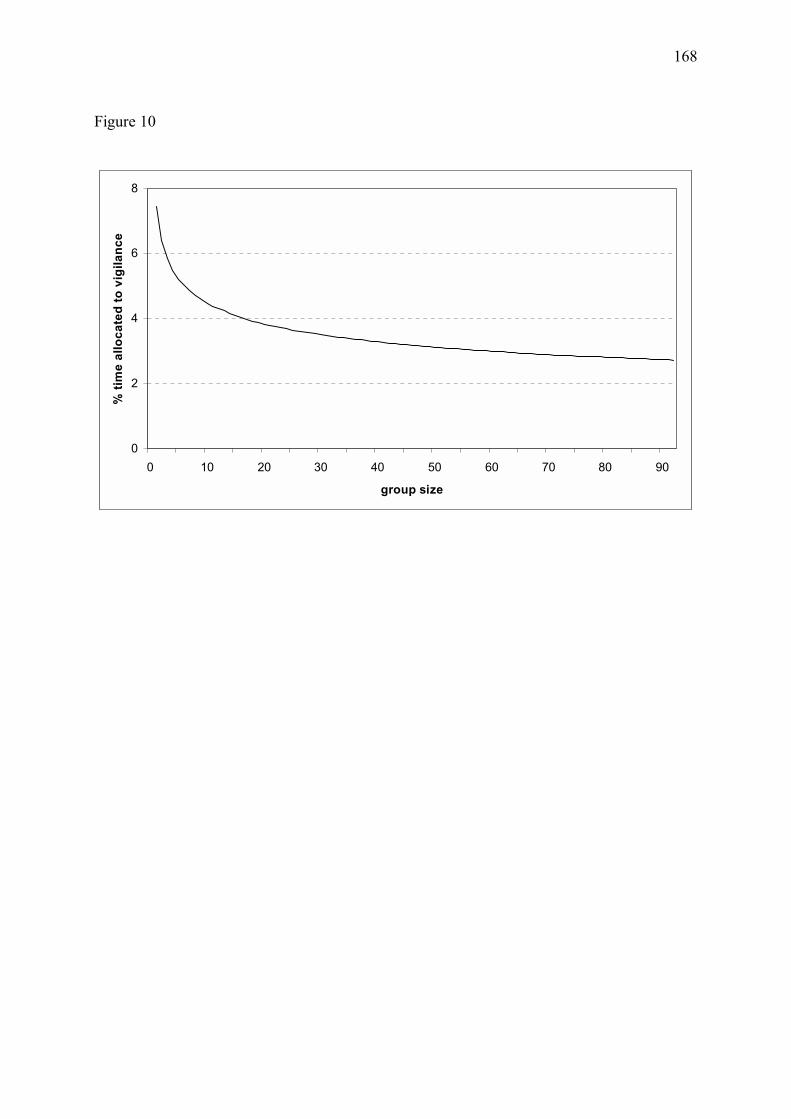
168
Figure 10
0
2
4
6
8
0 10 20 30 40 50 60 70 80 90
group size
% ti
me
allo
cate
d to
vig
ilanc
e

169
Annexe 4
170
Heterogeneous response to preventive sheep husbandry during wolf
recolonization of the French Alps
Nathalie Espuno, Equipe Biométrie et Biologie des Populations, Centre d�Ecologie
Fonctionnelle et Evolutive, Centre National de la Recherche Scientifique, 1919 route de
Mende, 34293 Montpellier cedex 5, France
Benoit Lequette, Parc national du Mercantour, 23 rue d�Italie, 06000 Nice, France
Marie-Lazarine Poulle,1 Antenne Life Loup, Office National de la Chasse et de la Faune
Sauvage, Micropolis, La Bérardie, 05000 Gap, France.
Pierre Migot, Office National de la Chasse et de la Faune Sauvage, Direction des Etudes et de
la Recherche, Saint-Benoit, 78610 Auffargis, France
Jean-Dominique Lebreton, Equipe Biométrie et Biologie des Populations, Centre d�Ecologie
Fonctionnelle et Evolutive, Centre National de la Recherche Scientifique, 1919 route de
Mende, 34293 Montpellier cedex 5, France
Wildlife Society Bulletin2004, 32(4) :000-000
sous presse
1 . Present adress : Centre d�Etude, de Recherche et de Formation en Ecoéthologie, 08240 Boult-aux-Bois, France
171
ABSTRACT
Recolonization by wolves (Canis lupus) of areas of extensive sheep breeding in the French
Alps in the early 1990s led to intense conflicts over losses of domestic livestock. We used
data on depredations and sheep herd management from 45 pastures of the Mercantour
Mountains of the French Alps to build models of attack and kill rates, and to quantify the
efficiency of using livestock guarding dogs and of gathering or confining herds at night for
preventing damages. Efficiency of livestock guarding dogs was lowest when the sheep were
ranging freely and highest when the sheep were confined at night. The effect of livestock
guarding dogs on depredations was heterogeneous across pastures. When sheep were confined
at night, presence of three to four dogs was predicted to prevent a large majority (>95 %) of
kills that would have occurred in the absence of dogs, for 81 % of pastures. No effect of dogs
was found for the other 19 % of pastures. Confining or simply gathering the sheep at night in
presence of five livestock guarding dogs was predicted to prevent most kills (94 % and 79 %
of kills, respectively) that would have occurred in similar conditions but with free ranging
sheep. Efficiency of each one of these two techniques was drastically reduced when they were
not used jointly. This study suggested that confining the sheep in presence of several livestock
guarding dogs can prevent a large majority of livestock losses to wolves in the Southern
French Alps.
KEYWORDS
Alps, Canis lupus, depredation, domestic sheep, France, livestock guarding dogs, preventive
husbandry methods, Mercantour Mountains, carnivore recolonization
172
INTRODUCTION
Predation on domestic livestock used to be a major factor affecting human welfare in rural
areas (Kaczensky 1996), and has often been a primary reason for past attempts to eradicate
large carnivores (Bangs et al. 1995, Muyard 1998). Today, protection of large predators
remains very controversial in areas where they are perceived as negatively affecting pastoral
economies (e.g., Johnson and Griffel 1982, Cozza et al. 1996, Kaczensky 1996, Mizutani and
Jewell 1998). Such controversies are particularly frequent nowadays in Western Europe,
where, owing to increased legal protection, growing densities of wild ungulates, and better
habitat conditions, the wolf (Canis lupus) is returning to areas from which it had been
extirpated several decades ago (Breitenmoser 1998). Recolonization of the French Alps by the
wolf (Poulle et al. 2000, Duchamp et al. 2001, Valière et al. 2003) lead to a typical example
of conflictual interactions between a predator and pastoral activities. In the main area
colonized by wolves, the Mercantour Mountains of the Southern French Alps, sheep-raising
for the production of lamb meat is the predominant land-use. Although wild prey are
abundant, damage to livestock has been frequent since wolves returned to the area in the early
1990�s (Poulle et al. 2000, Duchamp et al. 2001, Dahier et al. 2002). Techniques for reducing
losses were suggested and partly funded as part of a European LIFE-Nature program (Poulle
et al. 2000, Duchamp et al. 2001). The main measures proposed were mobile electrical fences
for confining the livestock at night, livestock guarding dogs, and increased human presence.
However, implementation of these prevention measures was very heterogeneous across the
sheep-raising operations. Nowadays, while the majority of herds are not, or only moderately,
affected by depredations, sheep losses to wolves still reach locally high levels in Mercantour
(Duchamp et al. 2001).
When predation on livestock is perceived as excessive, it might lead to illegal destruction of
individual predators. At least six wolves died from poaching or poisoning between 1992 and
2003 in the Mercantour area. Populations of large carnivores, which typically exist at low
densities, may be especially vulnerable to such incidental mortality (Boitani 1992, Bangs et
al. 1995, Fritts et al. 1995, Meriggi and Lovari 1996). However, in Western Europe, the
limited availability of suitable habitat often prevents spatial segregation of land-use between
large carnivores and humans. Consequently, any viable population of large carnivores
necessarily interferes with existing extensive livestock-raising activities (Linnell et al. 1996).
Tolerance by local people is then key to the persistence of large predator populations (Oli
173
1994, Bangs et al. 1995, Cozza et al. 1996, Sagor et al. 1997), and, consequently,
conservation programs must include the development of efficient strategies for limiting
depredations on livestock. Moreover, controversial management choices regarding damage
compensation, funding of prevention measures or predator control depend on whether
depredations can be reduced to an economically and socially acceptable level to sheep raisers.
However, although prevention of depredation by wolves has been widely described and
reviewed (e.g. Linnell et al. 1996, Smith et al. 2000a, 2000b, Fritts et al. in press), quantitative
assessments of the efficiency of different prevention techniques are still largely lacking. The
purpose of this study was to quantify the efficiency of husbandry methods used to prevent
sheep losses to wolves in Mercantour, using data on depredations and husbandry methods
implemented during the summer grazing seasons of 1994 to 2001.
METHODS
Study area
The study was conducted in the area of documented wolf presence in Mercantour between
1994 and 2001, which includes part of the 685-km2 core area of Mercantour National Park
(Figure 1). Altitude ranges from 800 to 3,143 m, with pastures covering about 60 % of the
area. There is generally a dense forest cover below 2,000 m, mainly composed of Picea
excelsa, Abies alba, Pinus sylvestris, Pinus cembra, and Larix decidua. Snow often persists on
the ground from December to late April above 1,200 m, with an average snow depth over the
winter ranging from 0.5 m to more than 2 m. Six species of wild ungulates coexist within the
core area of the National Park: chamois Rupicapra rupicapra (5 to 10 per km2), mouflon Ovis
gmelini (0.8 to 4 per km2), ibex Capra ibex (seasonally variable density) red deer Cervus
elaphus (<1 per km2), roe deer Capreolus capreolus and wild boar Sus scrofa (unknown
densities). In addition, about 63,500 domestic sheep are present year-round in the area, and
this number seasonally reaches up to 120,000 when transient herds are brought to large (8 to 9
km2) high-altitude pastures for summer grazing (Poulle et al. 2000). Domestic livestock herds
contain on average 1,200 to 1,500 sheep, sometimes associated to a few domestic goats, cows
or horses.
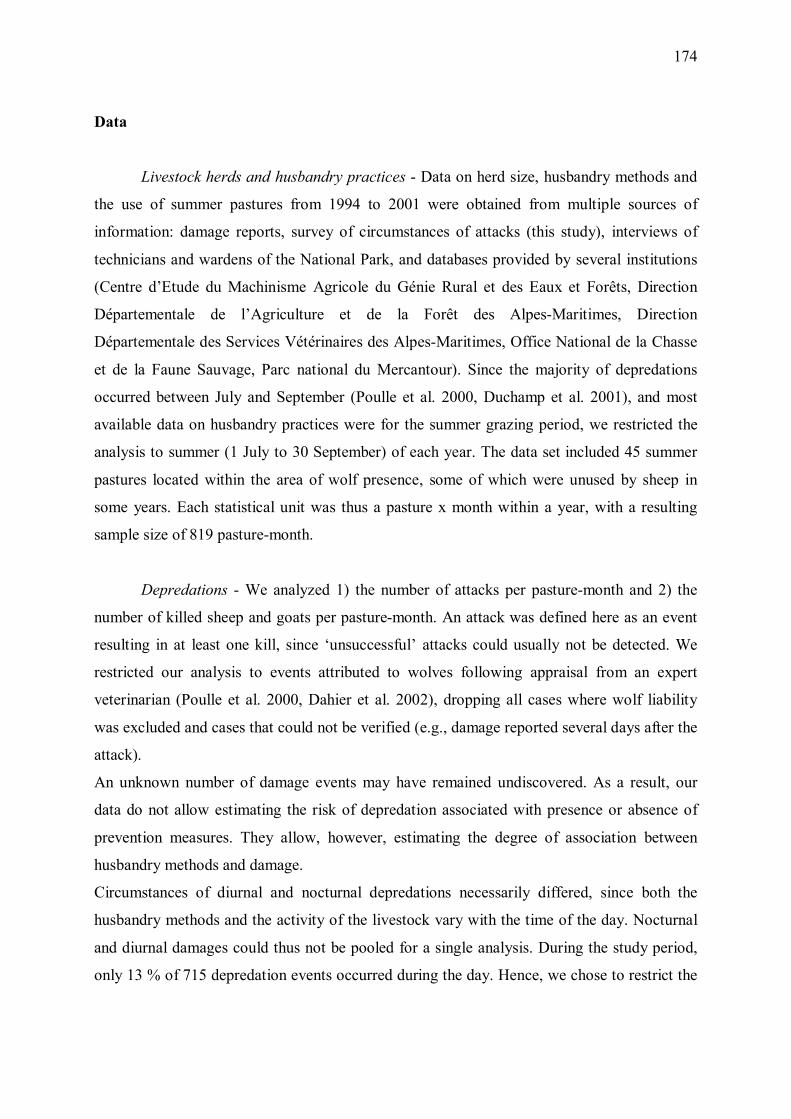
174
Data
Livestock herds and husbandry practices - Data on herd size, husbandry methods and
the use of summer pastures from 1994 to 2001 were obtained from multiple sources of
information: damage reports, survey of circumstances of attacks (this study), interviews of
technicians and wardens of the National Park, and databases provided by several institutions
(Centre d�Etude du Machinisme Agricole du Génie Rural et des Eaux et Forêts, Direction
Départementale de l�Agriculture et de la Forêt des Alpes-Maritimes, Direction
Départementale des Services Vétérinaires des Alpes-Maritimes, Office National de la Chasse
et de la Faune Sauvage, Parc national du Mercantour). Since the majority of depredations
occurred between July and September (Poulle et al. 2000, Duchamp et al. 2001), and most
available data on husbandry practices were for the summer grazing period, we restricted the
analysis to summer (1 July to 30 September) of each year. The data set included 45 summer
pastures located within the area of wolf presence, some of which were unused by sheep in
some years. Each statistical unit was thus a pasture x month within a year, with a resulting
sample size of 819 pasture-month.
Depredations - We analyzed 1) the number of attacks per pasture-month and 2) the
number of killed sheep and goats per pasture-month. An attack was defined here as an event
resulting in at least one kill, since �unsuccessful� attacks could usually not be detected. We
restricted our analysis to events attributed to wolves following appraisal from an expert
veterinarian (Poulle et al. 2000, Dahier et al. 2002), dropping all cases where wolf liability
was excluded and cases that could not be verified (e.g., damage reported several days after the
attack).
An unknown number of damage events may have remained undiscovered. As a result, our
data do not allow estimating the risk of depredation associated with presence or absence of
prevention measures. They allow, however, estimating the degree of association between
husbandry methods and damage.
Circumstances of diurnal and nocturnal depredations necessarily differed, since both the
husbandry methods and the activity of the livestock vary with the time of the day. Nocturnal
and diurnal damages could thus not be pooled for a single analysis. During the study period,
only 13 % of 715 depredation events occurred during the day. Hence, we chose to restrict the
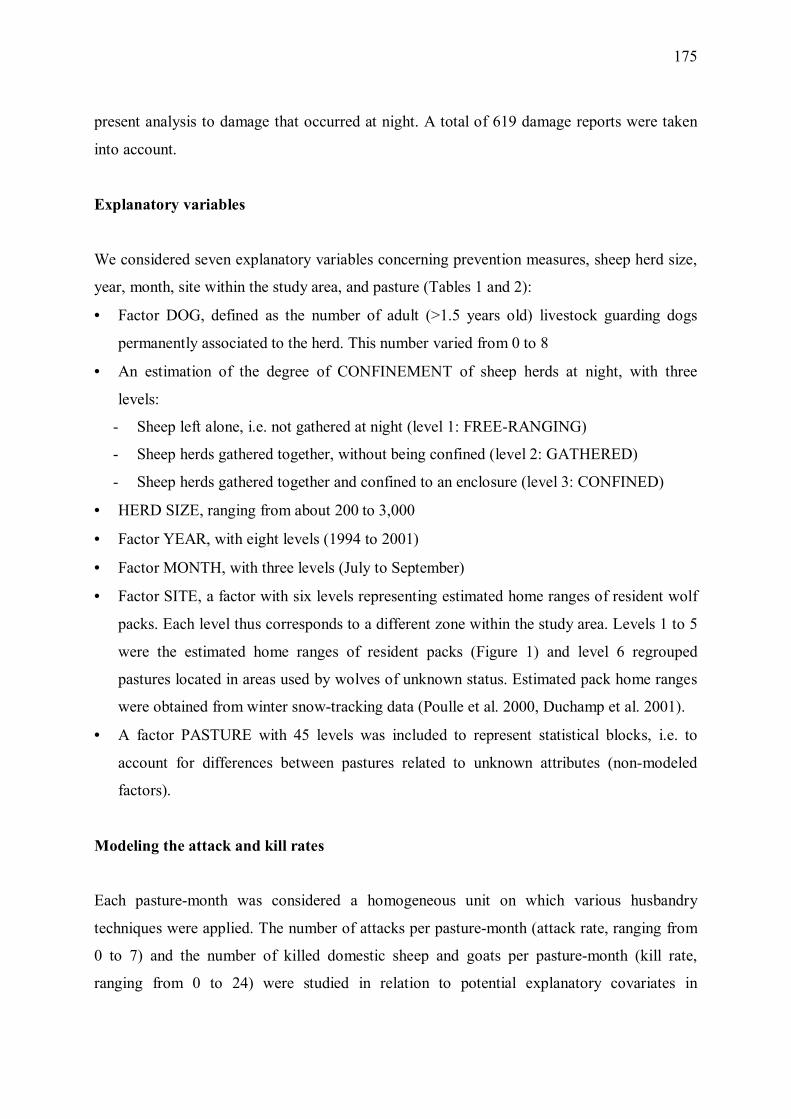
175
present analysis to damage that occurred at night. A total of 619 damage reports were taken
into account.
Explanatory variables
We considered seven explanatory variables concerning prevention measures, sheep herd size,
year, month, site within the study area, and pasture (Tables 1 and 2):
• Factor DOG, defined as the number of adult (>1.5 years old) livestock guarding dogs
permanently associated to the herd. This number varied from 0 to 8
• An estimation of the degree of CONFINEMENT of sheep herds at night, with three
levels:
- Sheep left alone, i.e. not gathered at night (level 1: FREE-RANGING)
- Sheep herds gathered together, without being confined (level 2: GATHERED)
- Sheep herds gathered together and confined to an enclosure (level 3: CONFINED)
• HERD SIZE, ranging from about 200 to 3,000
• Factor YEAR, with eight levels (1994 to 2001)
• Factor MONTH, with three levels (July to September)
• Factor SITE, a factor with six levels representing estimated home ranges of resident wolf
packs. Each level thus corresponds to a different zone within the study area. Levels 1 to 5
were the estimated home ranges of resident packs (Figure 1) and level 6 regrouped
pastures located in areas used by wolves of unknown status. Estimated pack home ranges
were obtained from winter snow-tracking data (Poulle et al. 2000, Duchamp et al. 2001).
• A factor PASTURE with 45 levels was included to represent statistical blocks, i.e. to
account for differences between pastures related to unknown attributes (non-modeled
factors).
Modeling the attack and kill rates
Each pasture-month was considered a homogeneous unit on which various husbandry
techniques were applied. The number of attacks per pasture-month (attack rate, ranging from
0 to 7) and the number of killed domestic sheep and goats per pasture-month (kill rate,
ranging from 0 to 24) were studied in relation to potential explanatory covariates in
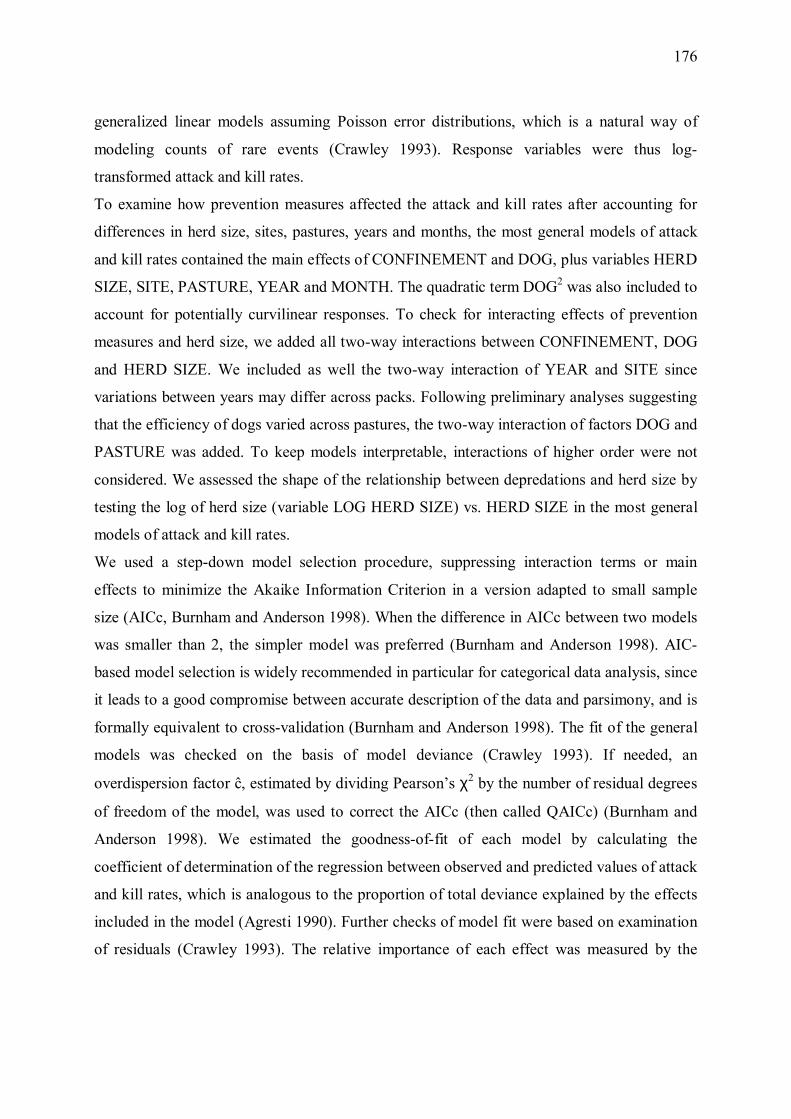
176
generalized linear models assuming Poisson error distributions, which is a natural way of
modeling counts of rare events (Crawley 1993). Response variables were thus log-
transformed attack and kill rates.
To examine how prevention measures affected the attack and kill rates after accounting for
differences in herd size, sites, pastures, years and months, the most general models of attack
and kill rates contained the main effects of CONFINEMENT and DOG, plus variables HERD
SIZE, SITE, PASTURE, YEAR and MONTH. The quadratic term DOG2 was also included to
account for potentially curvilinear responses. To check for interacting effects of prevention
measures and herd size, we added all two-way interactions between CONFINEMENT, DOG
and HERD SIZE. We included as well the two-way interaction of YEAR and SITE since
variations between years may differ across packs. Following preliminary analyses suggesting
that the efficiency of dogs varied across pastures, the two-way interaction of factors DOG and
PASTURE was added. To keep models interpretable, interactions of higher order were not
considered. We assessed the shape of the relationship between depredations and herd size by
testing the log of herd size (variable LOG HERD SIZE) vs. HERD SIZE in the most general
models of attack and kill rates.
We used a step-down model selection procedure, suppressing interaction terms or main
effects to minimize the Akaike Information Criterion in a version adapted to small sample
size (AICc, Burnham and Anderson 1998). When the difference in AICc between two models
was smaller than 2, the simpler model was preferred (Burnham and Anderson 1998). AIC-
based model selection is widely recommended in particular for categorical data analysis, since
it leads to a good compromise between accurate description of the data and parsimony, and is
formally equivalent to cross-validation (Burnham and Anderson 1998). The fit of the general
models was checked on the basis of model deviance (Crawley 1993). If needed, an
overdispersion factor ĉ, estimated by dividing Pearson�s χ2 by the number of residual degrees
of freedom of the model, was used to correct the AICc (then called QAICc) (Burnham and
Anderson 1998). We estimated the goodness-of-fit of each model by calculating the
coefficient of determination of the regression between observed and predicted values of attack
and kill rates, which is analogous to the proportion of total deviance explained by the effects
included in the model (Agresti 1990). Further checks of model fit were based on examination
of residuals (Crawley 1993). The relative importance of each effect was measured by the
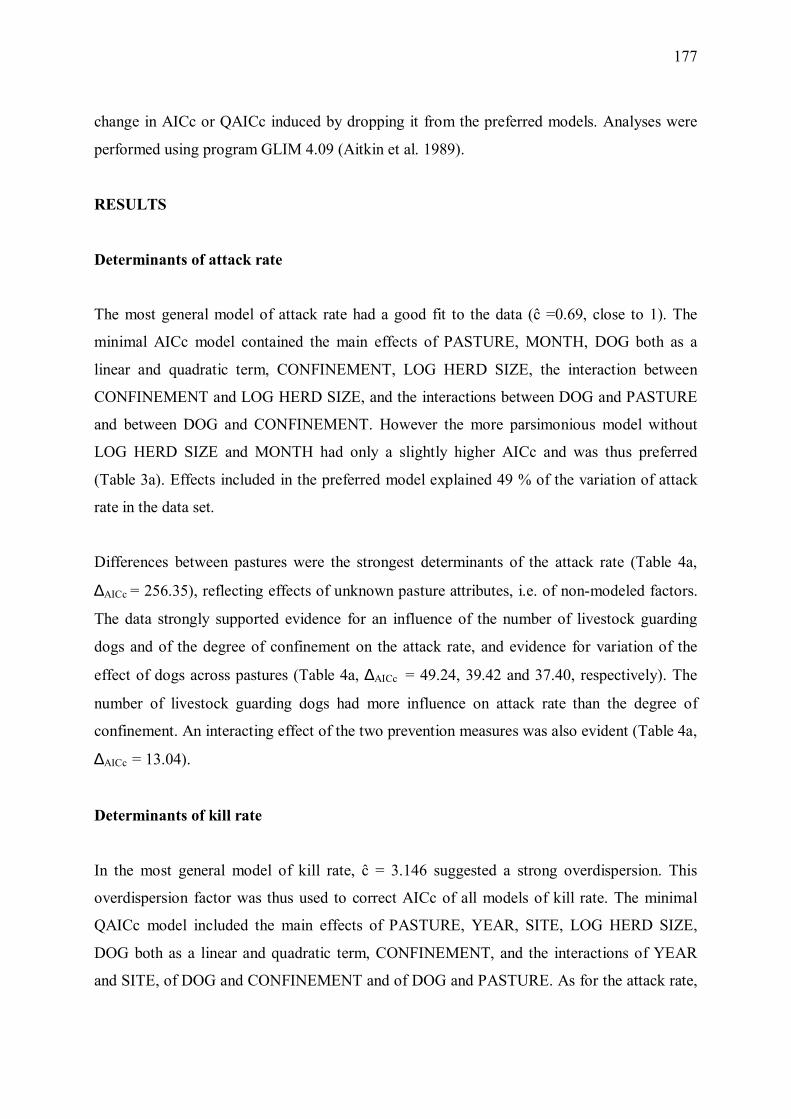
177
change in AICc or QAICc induced by dropping it from the preferred models. Analyses were
performed using program GLIM 4.09 (Aitkin et al. 1989).
RESULTS
Determinants of attack rate
The most general model of attack rate had a good fit to the data (ĉ =0.69, close to 1). The
minimal AICc model contained the main effects of PASTURE, MONTH, DOG both as a
linear and quadratic term, CONFINEMENT, LOG HERD SIZE, the interaction between
CONFINEMENT and LOG HERD SIZE, and the interactions between DOG and PASTURE
and between DOG and CONFINEMENT. However the more parsimonious model without
LOG HERD SIZE and MONTH had only a slightly higher AICc and was thus preferred
(Table 3a). Effects included in the preferred model explained 49 % of the variation of attack
rate in the data set.
Differences between pastures were the strongest determinants of the attack rate (Table 4a,
∆AICc = 256.35), reflecting effects of unknown pasture attributes, i.e. of non-modeled factors.
The data strongly supported evidence for an influence of the number of livestock guarding
dogs and of the degree of confinement on the attack rate, and evidence for variation of the
effect of dogs across pastures (Table 4a, ∆AICc = 49.24, 39.42 and 37.40, respectively). The
number of livestock guarding dogs had more influence on attack rate than the degree of
confinement. An interacting effect of the two prevention measures was also evident (Table 4a,
∆AICc = 13.04).
Determinants of kill rate
In the most general model of kill rate, ĉ = 3.146 suggested a strong overdispersion. This
overdispersion factor was thus used to correct AICc of all models of kill rate. The minimal
QAICc model included the main effects of PASTURE, YEAR, SITE, LOG HERD SIZE,
DOG both as a linear and quadratic term, CONFINEMENT, and the interactions of YEAR
and SITE, of DOG and CONFINEMENT and of DOG and PASTURE. As for the attack rate,
178
the simpler model without the effect of LOG HERD SIZE had only a slightly higher QAICc
and was thus preferred (Table 3b). Effects included in the preferred model explained 58 % of
the variation of kill rate in the data set.
As for the attack rate, kill rate was mostly determined by differences between pastures in
unknown attributes (Table 4b, ∆QAICc = 204.35). Variations across years and sites were also
important determinants of kill rate (∆QAICc = 44.24). As for the attack rate, the data strongly
supported evidence for an influence of both the number of livestock guarding dogs and the
degree of sheep confinement on kill rate, but the number of dogs was more influential than
the degree of confinement (∆QAICc = 30.41 and 18.29, respectively). There was also strong
evidence for a variation of the effect of livestock guarding dogs across pastures (∆QAICc =
23.25), and for an interacting effect of the two prevention measures (∆QAICc = 17.76).
Effect of prevention measures
For all pastures, confinement or gathering at night enhanced the efficiency of dogs, and,
conversely, presence of a large number of dogs increased the efficiency of confining or
gathering the sheep at night (see Appendix 1 for parameter estimates of the preferred models).
Effect of the degree of sheep confinement - Confining the sheep herds at night and, to a
lesser extent, simply gathering them, reduced the attack and kill rates in presence of large
numbers of dogs. For example with 5 dogs, gathering herds at night was predicted to prevent
33 % of attacks and 79 % of kills, and confining herds was predicted to prevent 81 % of
attacks and 94 % of kills that would have occurred in similar conditions but with free-ranging
herds (Figure 2). However, sheep gathering and confinement seemed associated to increases
in attack and kill rates when less than 5 or 4 dogs, respectively, were present.
Effect of the number of livestock guarding dogs - The effect of the number of dogs,
particularly on the attack rate, varied across pastures. Hence, the protective effect of livestock
guarding dogs, although clear, cannot be reduced to a simple and uniform effect independent
of other conditions. Differences in the effect of dogs could not be estimated for 19 out of the
45 studied pastures, because the number of dogs on these pastures did not vary during the

179
study period. The results concerning the effect of guarding dogs were thus based only on 26
pastures. The heterogeneity of dog efficiency among pastures could then be reduced to a
variation in the slope relating the log attack rate and log kill rate, respectively, to the number
of dogs. To the contrary, the estimated slopes with respect to the number of dogs squared
were similar for all pastures. This quadratic effect can be interpreted as a decrease in the
benefit of adding a dog as the number of dogs already present increases. The models thus
predicted that the greatest reduction in damages was provided by the first livestock guarding
dog introduced to a sheep herd, with additional dogs bringing progressively less and less
reductions in attack and kill rates. The constancy of the quadratic term across pastures means
that this relationship between the benefit brought by a dog and its rank of introduction held
for all pastures. Overall, the variation between pastures in the slope for the linear term and the
constancy of the slope for the quadratic term resulted in three main patterns of response to
dogs in the studied sample. Based on these patterns, three groups of pastures could be
distinguished:
GROUP I: The first group contained 10 pastures (39 %, n = 26) for which the pattern of
response to an increase in the number of dogs was a decrease in attack and kill rates, when the
sheep were confined at night (Figure 3a and 3b, filled triangles). The preferred models
predicted that, in presence of dogs, the number of attacks per month on herds of GROUP I
when the sheep were confined at night was multiplied on average by:
( )2190.0558.1exp DOGDOG −−
and the number of kills per month was multiplied on average by:
( )2360.0143.2exp DOGDOG −−
There was a non-significant tendency for the livestock guarding dogs to be more efficient
when herds were confined at night than when they were only gathered (Figure 4a and 4b).
When herds of GROUP I were ranging freely at night, the preferred models predicted that, in
presence of dogs, the number of attacks per month was multiplied on average by:
( )2190.0504.0exp DOGDOG −−
and the number of kills per month was multiplied on average by:
( )2360.0178.0exp DOGDOG −−

180
The preferred models thus predicted for instance that prevention of 99 % of attacks and of
kills on herds of GROUP I could be achieved by the use of 3 dogs when the sheep were
confined, or by the use of 5 dogs when the sheep were ranging freely at night (Figure 4a and
4b).
GROUP II: The second group contained 11 pastures (42 %, n = 26) for which the pattern of
response to an increase in the number of dogs was first an increase in attack and kill rates for
small numbers of dogs, then a decrease in attack and kill rates for larger numbers of dogs,
when the sheep were confined at night (Figure 3a and 3b, open circles). The preferred models
predicted that, in presence of dogs, the number of attacks per month on herds of GROUP II
when the sheep were confined at night was multiplied on average by:
( )2190.0650.0exp DOGDOG −
and the number of kills per month was multiplied on average by
( )2360.0670.0exp DOGDOG −
According to the preferred models, using a single livestock guarding dogs was associated to
an increase in both attack and kill rates, but the presence of 4 dogs was predicted to prevent
36 % of attacks and 95 % of kills on pastures of GROUP II when the sheep were confined at
night (Figures 4c and 4d). Attack and kill rates tended to be higher when herds of GROUP II
were only gathered than when they were confined; this difference became less marked as the
number of dogs increased (Figure 4c and 4d). When herds of GROUP II were ranging freely
at night, the preferred models predicted higher attack and kill rates in presence than in the
absence of dogs.
GROUP III: The third group contained the remaining 5 pastures (19 %, n = 26), for which the
predicted pattern of response to the presence of livestock guarding dogs was an increase in
attack and kill rates.
DISCUSSION
In the southern French Alps, livestock guarding dogs and gathering or confining the sheep at
night were efficient methods for reducing sheep losses to wolves, and were acting
synergistically. The presence of numbers of dogs that laid within the range commonly used in
181
the area (1 to 8 dogs) had the potential to prevent the major part of livestock losses expected
in the absence of dogs during the summer grazing season.
The benefit of using livestock guarding dogs was strongly increased by confining (or, to a
lesser extent, simply gathering) the sheep every night: for 39 % of pastures (i.e., pastures of
group I), a single dog was predicted to prevent on average 42 % of kills when the sheep were
ranging freely at night, but 92 % of kills if the sheep were confined (Figure 4b). In other
words, gathering and confining the sheep at night allowed reducing the number of livestock
guarding dogs needed to obtain a given reduction in damages: for instance dogs were
predicted to provide a similar reduction in attack rate for these herds when the sheep were
either ranging freely with 2 dogs, or confined with 1 dog (Figure 4a). Confining and, to a
lesser extent, simply gathering the sheep at night were shown to strongly reduce damages
when at least four dogs were present. The two prevention methods were predicted to reduce
kill rate more rapidly than attack rate, suggesting that they reduced the average number of
killed sheep per attack: when prevention was implemented, fewer attacks occurred, and those
that occurred resulted in fewer sheep being lost.
However, the efficiency of livestock guarding dogs was heterogeneous across pastures.
Although categorizing the pastures in three groups a posteriori may induce some pseudo-
replication, the largest two groups by far were those with an efficient protective effect of dogs
(groups I and II), and this result is robust to pseudo-replication. Livestock guarding dogs were
able to reduce depredations for 81 % of pastures (i.e., pastures of groups I and II when herds
were confined at night, but only for 39 % of pastures (i.e., pastures of group I only) when
herds were ranging freely. This result is consistent with what is known from the literature,
where the reported percentage of livestock guarding dogs that are successful guardians varies
from 66 to 90 % (reviewed in Smith et al. 2000a). Sources of variation in dog efficiency may
include the dog�s breed, age, experience, genetic lineage and degree of bonding to the sheep.
Bonding with the livestock is an important determinant of the protecting behavior of the adult
dog (Coppinger et al. 1983, Wick 1998, Hansen et Smith 1999). However, a study conducted
on a sample of 113 guarding dogs in Mercantour suggested that 25 % of them had not
developed a strong affective bond with their associated flock (Durand 2001). This lack of
bonding may reveal a sub-optimal use of guarding dogs, possibly related to a loss of
182
traditional knowledge and experience in the absence of predation threat for a long period
(Boitani 1992). In Mercantour, the rapid increase in the number of sheep-raising operations
affected by depredations, as wolves recolonized the area, has lead to an increasing demand for
prevention measures, and particularly dog pups, during the study period (Poulle et al. 2000).
Since the total resources available for the technical support of producers did not increase
proportionally during the same period, individual producers possibly benefited from
decreasing support and training, and the quality of the genetic lineage of introduced dog pups
might have decreased over the course of the study period (Paul Lapeyronie, personal
communication).
Alternatively, the heterogeneity of responses to livestock guarding dogs may be explained by
the patterns of wolf recolonization and of introduction of dogs to livestock herds. Based on
winter track counts and direct observations of wolves, there is evidence that the number and
the size of wolf packs in Mercantour increased during the study period (Mercantour National
Park, unpublished data). The first year of wolf presence in a new area always seemed
associated to occasional depredations in summer (Mercantour National Park, unpublished
data). Attack rates were usually higher the next year, probably in relation to larger average
pack sizes.
Positive correlation of the number of livestock guarding dogs per pasture during summer of
year n and the number of attacks per pasture during summer of year n-1 (r = 0.185, p < 0.01)
suggested that farmers tended to introduce livestock guarding dogs following the occurrence
of depredations on their own herds, rather than in a true preventive fashion. Moreover,
livestock guarding dogs were often introduced progressively, with the introduction of a first
dog following depredations of the first summer, introduction of one additional dog the next
year, etc. (Paul Lapeyronie, personal communication). Livestock guarding dogs may not be
fully efficient immediately after being introduced to a sheep herd, because they need time to
establish their territory (Coppinger and Coppinger 1995). Overall, within each pack territory,
we can thus speculate that the first summer of wolf presence was characterized by occasional
depredations and absence of livestock guarding dogs, while the second summer was
characterized by higher attack and kill rates and by the presence of a single, inexperienced
dog. Within each pack territory, the transition from 0 to 1 livestock guarding dog between the
first and the second summers of wolf presence may thus have been generally concurrent with
increases in attack and kill rates. The latency between the settlement of a new wolf pack and
183
the presence of experienced dogs with the sheep in the area recolonized is thus a potential
explanation for the increase in attack and kill rates associated to small numbers of dogs found
in this study for some pastures.
In this study, factor PASTURE reflected the effects of non-modeled factors that remain to be
investigated. Obvious candidate factors include human attendance, which was shown to affect
predation risk (e.g. Ciucci and Boitani 1998), and habitat attributes of the pastures.
Additionally, significant variations of kill rate across years and sites (i.e., across wolf pack
territories) were found, which might as well reflect the effect of non-modeled factors. An
important candidate for explaining these spatiotemporal differences in kill rate would be wolf
pack size, which varied with years and sites. Other potentially important factors may include
differences in sheep management methods across sites within the study area, degree of wolf
learning, local densities of wild prey, etc. Effects of these potentially important factors could
not be studied in the present work because reliable data were lacking. The difference in fit
between the preferred models of attack and kill rates (49 % vs. 58 % of variation in the data
set explained, respectively) might suggest that the number of attacks per month may be more
dependent on non-modeled factors than the number of kills per month. However, the potential
effects of non-modeled factors is not a problem in the present analysis since our objective was
not to predict the risk of depredation associated with different herd management methods, but
only to estimate the degree of association between some husbandry techniques and damages.
Moreover, we believe that our sample of 45 studied pastures, which covers a wide range of
sheep management choices and a wide array of habitats within five different wolf pack
territories, is representative of conditions encountered in Mercantour.
Some of the livestock guarding dogs were known to occasionally stray from the pastures. In
6.1 % of 295 depredation events that affected herds normally associated with dogs, the dogs
were known to be temporarily absent when the attack occurred. This is a minimum estimate
since in general, effective presence of dogs could not be checked. Similarly, herds classified
as confined may occasionally have spent the night ranging freely. Additionally, 42 % of
depredations whose circumstances were known (n = 498) occurred on sheep or goats that
were isolated from the main herd prior to the attack, and which could thus not benefit from
the presence of dogs. These biases in the data could not be avoided, but they lead to
184
conservative tests of the efficiency of guarding dogs and of night regrouping and
confinement. Actual efficiency of dogs and gathering or confinement at night is thus probably
higher than shown in this analysis.
MANAGEMENT IMPLICATIONS
Use of livestock guarding dogs, associated to human presence and confinement of the herd at
night, is a traditional method still commonly used in parts of Europe (e.g. Spain, Romania,
Italy) and which seems particularly efficient in areas where people have always been living
with large carnivores (Atelier Technique des Espaces Naturels 2002). However, the type of
production (milk vs. meat), as well as socio-economical factors such as the cost of labor may
put different constraints on sheep management methods depending on the country (Paul
Lapeyronie, personal communication). While livestock guarding dogs and sheep confinement
at night were shown to reduce damages to wolves in Mercantour, two major technical
limitations to the use of prevention measures in this context may be mentioned.
First, the use of large numbers of livestock guarding dogs may not be justified when the cost
of their year-round maintenance (300 to 450 � per dog per year) exceeds the economical
benefit of preventing losses. However, at the present time it still seems difficult to draw
conclusions about the efficiency of small numbers of dogs based solely on the data used in
this analysis, because the recolonization process resulted, as discussed above, in an
association of small numbers and inexperience in dogs. Further studies should thus look
specifically at the efficiency of small numbers of experienced livestock guarding dogs several
years after their introduction. It should also be mentioned that livestock guarding dogs may
efficiently prevent losses to domestic dogs as well as to wolves, and this secondary benefit
should be studied and included into any cost-benefit analysis of prevention measures.
Second, Mercantour is an ecologically vulnerable and protected area, where the question of
the innocuousness of prevention measures must be addressed. While the impact of livestock
guarding dogs on wildlife was shown to be generally non-significant in Mercantour, the
accumulation of nitrogenous wastes on high-altitude fragile and protected habitats due to the
night confinement of large herds of sheep on small surfaces of pastures is a cause of concern
(Lapeyronie and Moret 2003).
185
The efficiency of prevention methods in Mercantour would be an argument in favor of
making compensation of damages conditional on the effective use of livestock guarding dogs
and confinement by farmers. In 29 % of the studied pasture-months, livestock guarding dogs
were used without being associated with gathering or confinement of the sheep at night. The
present study suggests that this probably resulted in an efficiency of dogs well below what it
could potentially have been. However, implementation of dogs and night confinement might
be difficult on some pastures due to environmental conditions. In particular, a steep and
rugged topography or the use of forested areas might make difficult the use of enclosures for
confinement, and might delay the detection of approaching wolves by livestock guarding
dogs. If damage compensation was conditional on prevention, determining whether causes for
low efficiency of livestock guarding dogs on some pastures can be addressed (e.g., dogs not
sufficiently bonded to the sheep) or not (e.g., difficult topography precluding an efficient use
of guarding dogs and confinement) would be required, to design compensation schemes that
account for the feasibility of using prevention methods on each pasture.
Protecting some sheep herds may have lead wolves to switch, to some extent, from one herd
to the other depending on their relative degrees of protection, and it is not known what would
happen if prevention measures were implemented for all herds. For example, would wolves
switch to wild prey, or would the efficiency of prevention measures decrease? Changes in the
effect of prevention methods are unpredictable, and could only be assessed through
experimentation, e.g. protecting all herds, collecting additional data and re-estimating
parameters of the models. In the face of these uncertainties, it seems necessary to periodically
re-assess the efficiency of livestock guarding dogs and night confinement of the sheep, in
order to allow adapting the management choices to the ability of farmers to prevent damages.
ACKNOWLEDGEMENTS
This work is part of a graduate research project looking at the pattern of prey use by
recolonizing wolves and its impact on wild and domestic ungulates in Mercantour, funded by
the Office National de la Chasse et de la Faune Sauvage and a European LIFE-Nature
program �Le Retour du Loup dans les Alpes Françaises�. We used monitoring data collected
by Parc National du Mercantour, Office National de la Chasse et de la Faune Sauvage, Centre
d�Etude du Machinisme Agricole du Génie Rural et des Eaux et Forêts, Direction
186
Départementale de l�Agriculture et de la Forêt des Alpes-Maritimes, and Direction
Départementale des Services Vétérinaires des Alpes-Maritimes. We warmly thank wardens of
Parc National du Mercantour, wardens of Office National de la Chasse et de la Faune
Sauvage, Gérard Millischer and Jean-Michel Gusmeroli for sharing their knowledge of sheep-
raising practices in Mercantour, and for collecting data on the circumstances of depredations
for this study. We are grateful to Christèle Durand, Renaud de Beaufort and Thierry Dahier
for providing and commenting data on depredations and damage prevention techniques. Many
thanks go to Simone Ricci, Francesca Marucco and Luigi Boitani for sharing wolf monitoring
data from Italy. We are grateful to Philippe Stahl, Paul Lapeyronie and Marc Kery for
providing critical comments on this work. We thank Michel Crête and two anonymous
referees for substantially improving an earlier version of this article.
REFERENCES CITED
Agresti, A., 1990. Categorical data analysis. John Wiley & Sons, New-York, USA.
Aitkin, M., D. Anderson, B. Francis and J. Hinde, 1989. Statistical modeling in GLIM.
Clarendon Press, Oxford.
Atelier Technique des Espaces Naturels, 2002. Vivre avec le loup des Asturies aux Carpates.
Gestion des Milieux et des Espèces, Cahier Technique n°69.
Bangs, E. E., S. H. Fritts, D. R. Harms, J. A. Fontaine, M. D. Jimenez, W. G. Brewster, and
C. C. Niemeyer. 1995. Control of endangered gray wolves in Montana. in L. N. Carbyn, S. H.
Fritts, and D. R. Seip, eds., Ecology and conservation of wolves in a changing world.
Canadian Circumpolar Institute.
Boitani, L., 1992. Wolf research and conservation in Italy. Biological Conservation 61: 125-
132.
Breitenmoser, U., 1998. Large predators in the Alps: the fall and rise of man�s competitors.
Biological Conservation 83(3):279-289.
187
Burnham, K. P. and D. R. Anderson, 1998. Model selection and inference, a practical
information-theoretic approach. Springer.
Ciucci, P. and L. Boitani, 1998. Wolf and dog depredation on livestock in central Italy.
Wildlife Society Bulletin. 26(3):504-514.
Coppinger, R. and L. Coppinger, 1995. Interactions between livestock guarding dogs and
wolves. Pp 523-526 In L. N. Carbyn, S. H. Fritts and Seip, D.R. eds. Ecology and
conservation of wolves in a changing world. Canadian Circumpolar Institute, University of
Alberta, Edmonton.
Coppinger, R., J. Lorenz, J. Glendinning and P. Pinardi, 1983. Attentiveness of guarding dogs
for reducing predation in sheep. Journal of Range Management 36: 275-279.
Cozza, K., R. Fico, M.-L. Battistini, and E. Rogers, 1996. The damage-conservation interface
illustrated by predation on domestic livestock in central Italy. Biological Conservation 78:
329-336.
Crawley, M. J., 1993. GLIM for ecologists. Blackwell Science.
Dahier, T., M.-L. Poulle et B. Lequette, 2002. Le retour du loup dans les Alpes françaises :
méthodes de suivi et état des connaissances. pp 10-15 dans Actes du XXIIIe colloque
francophone de mammalogie « l�étude et la conservation des carnivores ». Maison-Alfort, 23-
24 octobre 1999. G. Chapron et F. Moutou (eds). SFEPM, Paris.
Duchamp, C., V. Genevey, F. Favier, T. Dahier, R. de Beaufort, C. Durand, P. Oléon et M.
Pion, 2001. Programme LIFE Nature : « Le retour du loup dans les Alpes Françaises ».
Rapport d�activité 2000, Ministère de l�Aménagement du Territoire et de l�Environnement.
Durand, C., 2001. Intégration pastorale des chiens de protection. Bilans 1988 à 1998. Rapport
ONCFS-Programme LIFE II.
188
Fritts, S. H., E. E. Bangs, J. A. Fontaine, W. G. Brewster, and J. F. Gore. 1995. Restoring
wolves to the Northern Rocky Mountains of the United States. in L. N. Carbyn, S. H. Fritts,
and D. R. Seip, eds. Ecology and conservation of wolves in a changing world. Canadian
Circumpolar Institute.
Fritts, S.H., R.O. Stephenson, R.D. Hayes and L. Boitani. In Press. Wolves and Humans �
Chapter 12 in Wolves: behavior, ecology and conservation. L.D. Mech and L. Boitani, eds.
The University of Chicago Press, Chicago and London.
Hansen, I. and M. E. Smith, 1999. Livestock-guarding dogs in Norway: part II. Different
working regimes. Journal of Range Management 52: 312-316.
Johnson, S. J., and D. E. Griffel. 1982. Sheep losses on grizzly bear range. Journal of Wildlife
Management 46: 786-790.
Kaczensky, P. 1996. Carnivores and sheep farming in Norway. 3. Large carnivore-livestock
conflicts in Europe. Wildbiologische Gesellschaft Munchen.
Lapeyronie, P., and A. Moret, 2003. Chiens de troupeaux dans le Parc national du Mercantour
(chiens de travail et chiens de protection) : étude comportementale, impact sur la faune
sauvage des estives. Rapport programme Life "Le Retour du Loup dans les Alpes Françaises",
126 p.
Linnell, J. D., M. E. Smith, J. Odden, P. Kaczensky, and J. Swenson. 1996. Carnivores and
sheep farming in Norway. 4. Strategies for the reduction of carnivores-livestock conflicts: a
review. NINA Oppdragsmelding 443 : 1-118.
Meriggi, A., and S. Lovari. 1996. A review of wolf predation in southern Europe: does the
wolf prefer wild prey to livestock? Journal of Applied Ecology 33: 1561-1571.
189
Mizutani, F., and P. A. Jewell. 1998. Home-range and movements of leopards on a livestock
ranch in Kenya. Journal of Zoology, London 244: 269-286.
Muyard, F. 1998. Les loups et la loi du XIV° siècle à nos jours. Histoire d'une hantise
populaire. TAC Motif.
Oli 1994. Snow leopard predation on livestock: an assessment of local perceptions in the
Annapurna Conservation Area, Nepal. Biological Conservation 68: 63-68.
Poulle, M.-L., T. Dahier, R. de Beaufort and C. Durand, 2000. Le loup en France. Programme
Life Nature. Rapport Final 1997-1999.
Sagor, J. T., J. E. Swenson, and E. Roskaft. 1997. Compatibility of brown bear Ursus arctos
and free-ranging sheep in Norway. Biological Conservation 81: 91-95.
Smith, M.E., J.D.C. Linnell, J. Odden and J.E. Swenson, 2000a. Review of methods to reduce
livestock depredations: I. Guardian animals. Acta Agriculturae Scandinavica, Sect. A, Animal
Sciences 50: 279-290.
Smith, M.E., J.D.C. Linnell, J. Odden and J.E. Swenson, 2000b. Review of methods to reduce
livestock depredations. II: Aversive conditioning, deterrents and repellents. Acta Agriculturae
Scandinavica, Sect. A, Animal Sciences 50: 304-315.
Valière, N., L. Fumagalli, L. Gielly, C. Miquel, B. Lequette, M.-L. Poulle, J.-M. Weber, R.
Arlettaz and P. Taberlet, 2003. Long-distance wolf recolonization of France and Switzerland
inferred from non-invasive genetic sampling over a period of 10 years. Animal Conservation
6 Part I: 83-92.
Wick, P. 1998. Le chien de protection sur troupeau ovin: utilisation et méthode de mis en
place. DIREN, Programme Life-Nature. Artus.
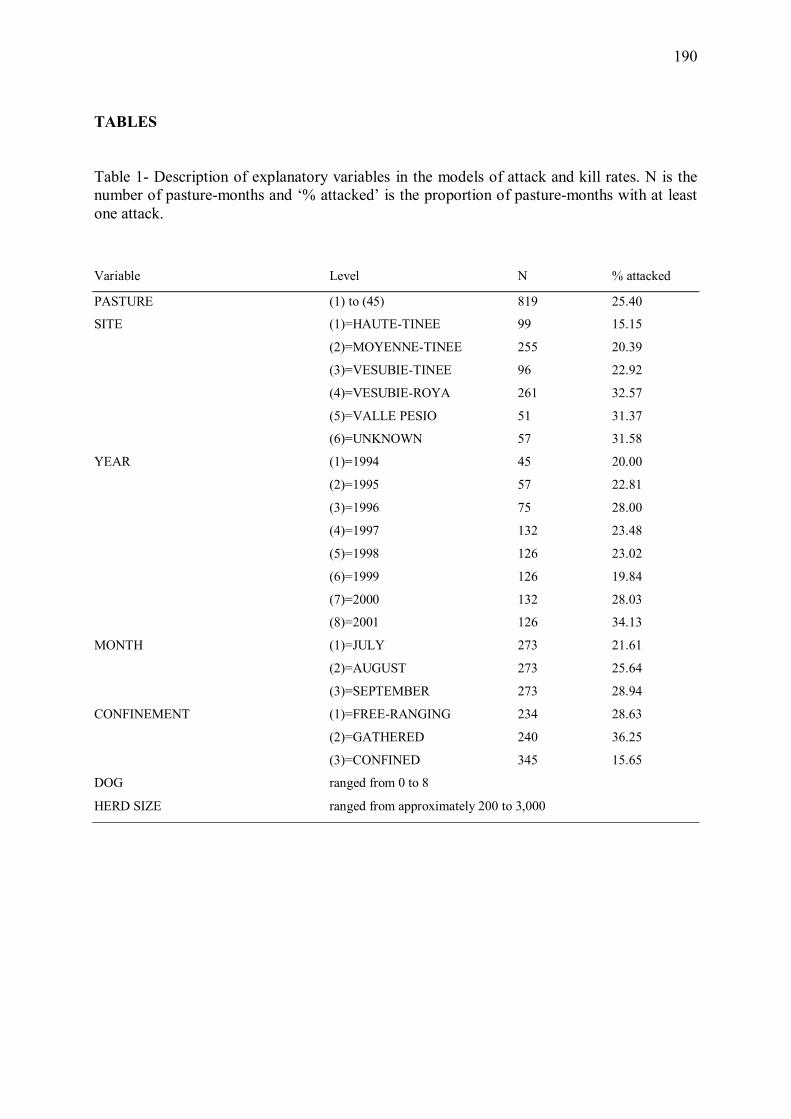
190
TABLES
Table 1- Description of explanatory variables in the models of attack and kill rates. N is the number of pasture-months and �% attacked� is the proportion of pasture-months with at least one attack. Variable Level N % attacked
PASTURE (1) to (45) 819 25.40
SITE (1)=HAUTE-TINEE 99 15.15
(2)=MOYENNE-TINEE 255 20.39
(3)=VESUBIE-TINEE 96 22.92
(4)=VESUBIE-ROYA 261 32.57
(5)=VALLE PESIO 51 31.37
(6)=UNKNOWN 57 31.58
YEAR (1)=1994 45 20.00
(2)=1995 57 22.81
(3)=1996 75 28.00
(4)=1997 132 23.48
(5)=1998 126 23.02
(6)=1999 126 19.84
(7)=2000 132 28.03
(8)=2001 126 34.13
MONTH (1)=JULY 273 21.61
(2)=AUGUST 273 25.64
(3)=SEPTEMBER 273 28.94
CONFINEMENT (1)=FREE-RANGING 234 28.63
(2)=GATHERED 240 36.25
(3)=CONFINED 345 15.65
DOG ranged from 0 to 8
HERD SIZE ranged from approximately 200 to 3,000
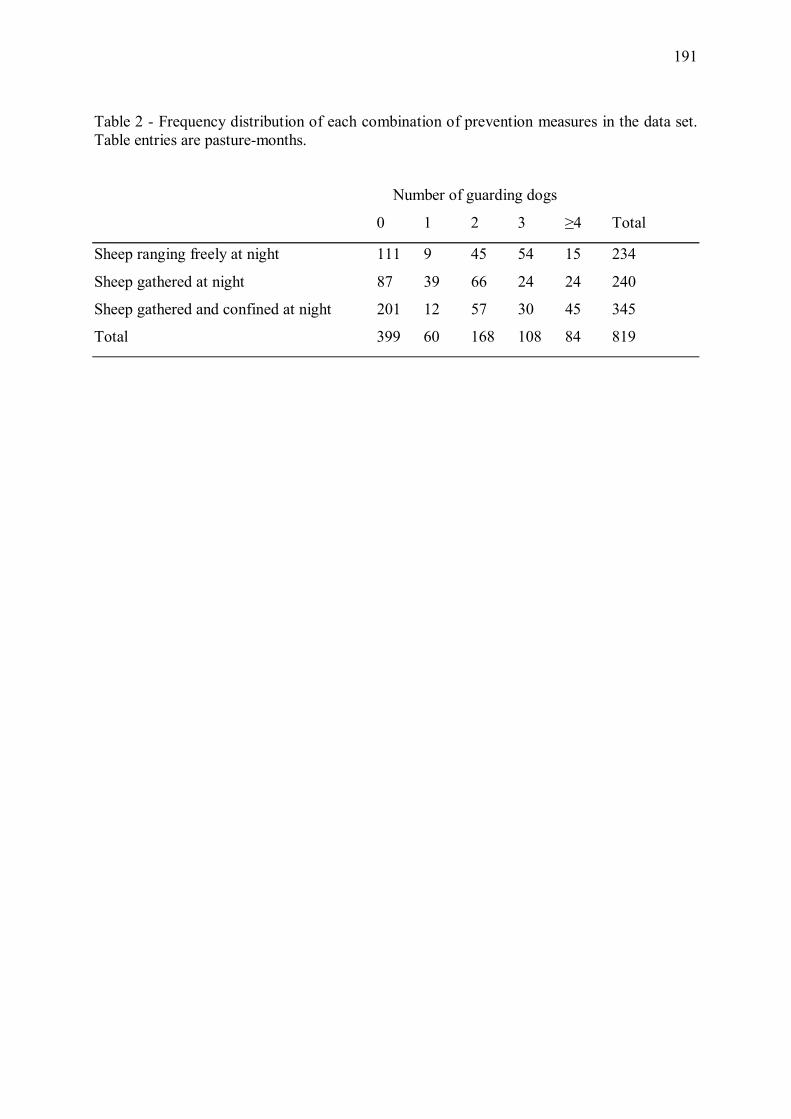
191
Table 2 - Frequency distribution of each combination of prevention measures in the data set. Table entries are pasture-months. Number of guarding dogs
0 1 2 3 ≥4 Total
Sheep ranging freely at night 111 9 45 54 15 234
Sheep gathered at night 87 39 66 24 24 240
Sheep gathered and confined at night 201 12 57 30 45 345
Total 399 60 168 108 84 819

192
Table 3 � Models of (a) attack rate and (b) kill rate. K is the number of parameters of the models. The null models contain only the intercept. The general models contain the main effects of the number of livestock guarding dogs and its quadratic term, the degree of sheep confinement at night, herd size, year, month, pasture, site, and two-way interactions between prevention measures and herd size, between year and site, and between the number of dogs and pasture.
(a) Models of attack rate Terms Deviance K AICc R2
Null model 1165.90 1 1167.90
General model 475.05 133 793.09 0.59
Preferred model PASTURE 598.91 76 766.68 0.49
DOG
DOG2
CONFINEMENT
DOG × PASTURE
DOG × CONFINEMENT
(b) Models of kill rate Terms Deviance K QAICc R2
Null model 1224.20 1 1226.20
General model 489.30 133 807.34 0.60
Preferred model PASTURE 517.02 111 774.19 0.58
YEAR
SITE
DOG
DOG2
CONFINEMENT
YEAR × SITE
DOG × PASTURE
DOG × CONFINEMENT
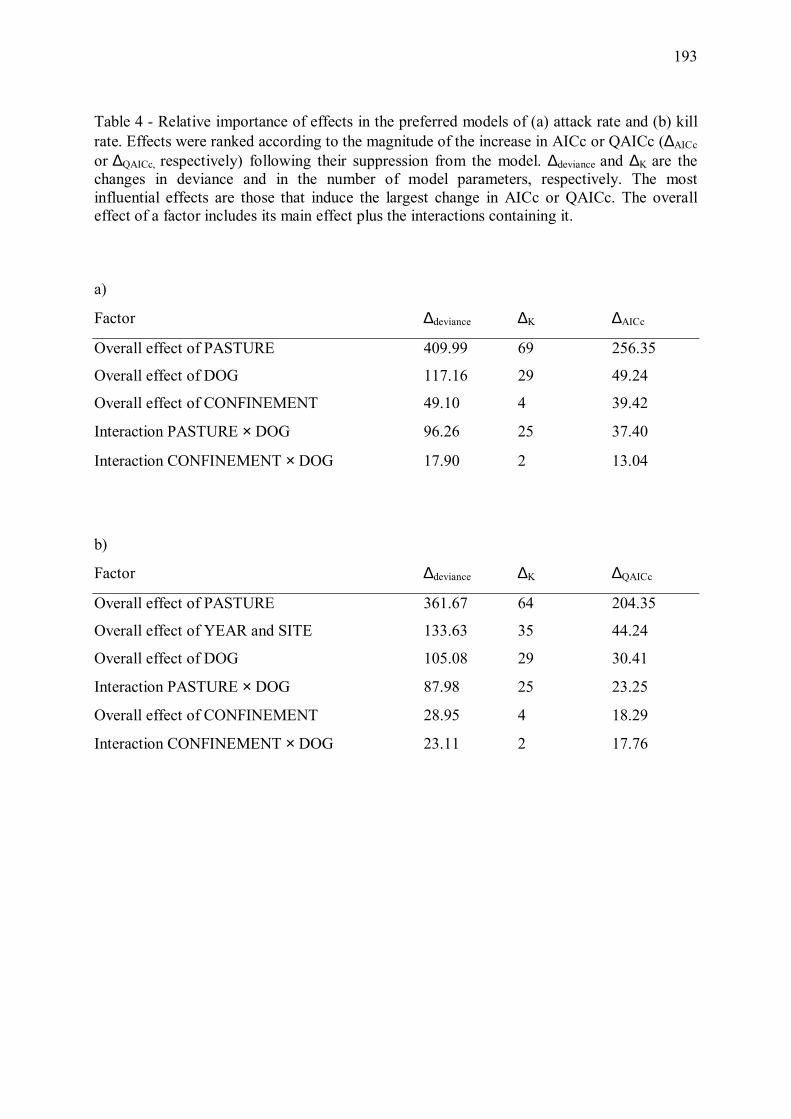
193
Table 4 - Relative importance of effects in the preferred models of (a) attack rate and (b) kill rate. Effects were ranked according to the magnitude of the increase in AICc or QAICc (∆AICc
or ∆QAICc, respectively) following their suppression from the model. ∆deviance and ∆K are the changes in deviance and in the number of model parameters, respectively. The most influential effects are those that induce the largest change in AICc or QAICc. The overall effect of a factor includes its main effect plus the interactions containing it.
a)
Factor ∆deviance ∆K ∆AICc
Overall effect of PASTURE 409.99 69 256.35
Overall effect of DOG 117.16 29 49.24
Overall effect of CONFINEMENT 49.10 4 39.42
Interaction PASTURE × DOG 96.26 25 37.40
Interaction CONFINEMENT × DOG 17.90 2 13.04
b)
Factor ∆deviance ∆K ∆QAICc
Overall effect of PASTURE 361.67 64 204.35
Overall effect of YEAR and SITE 133.63 35 44.24
Overall effect of DOG 105.08 29 30.41
Interaction PASTURE × DOG 87.98 25 23.25
Overall effect of CONFINEMENT 28.95 4 18.29
Interaction CONFINEMENT × DOG 23.11 2 17.76
194
FIGURE LEGENDS
Figure 1 � Study area and estimated home ranges of resident packs in the Mercantour range of the Southern French Alps in 2001 Figure 2 � Predicted effect of the degree of confinement on summer attack rate (a) and kill rate (b) as a function of the number of guarding dogs, when at least 5 or 4 dogs, respectively, were present. Estimated percent attacks and kills are relative to the numbers predicted to occur in similar conditions except for herds ranging freely at night. Estimated effect of the degree of confinement in presence of less than 5 or 4 dogs, which seemed associated to strong increases in attack and kill rates, was not represented here. Figure 3 � Main patterns of response of attack and kill rates to the number of dogs in the studied pastures. The graphs show the estimated proportions of successful attacks (a) and kills (b) predicted to occur as a function of the number of livestock guarding dogs for herds of groups I (39 % of pastures, n=26) and II (42 % of pastures, n=26) confined at night, relative to the numbers predicted in similar conditions except for the absence of dogs. Within each group, estimated effect of the number of dogs was averaged over pastures to show the general patterns of response of group I and II. Figure 4 - Average predicted benefit of using livestock guarding dogs on pastures of group I (39 %, n = 26) and II (42 %, n = 26) as a function of the degree of herd confinement at night. Estimated percent attacks and kills are relative to the numbers predicted to occur in similar conditions except for the absence of dogs: (a) estimated % attacks on pastures of group I, (b) estimated % kills on pastures of group I, (c) estimated % attacks on pastures of group II, (d) estimated % kills on pastures of group II. Effect of livestock guarding dogs on herds of group II when the sheep were ranging freely, which seemed associated to strong increases in attack and kill rates, was not represented here.
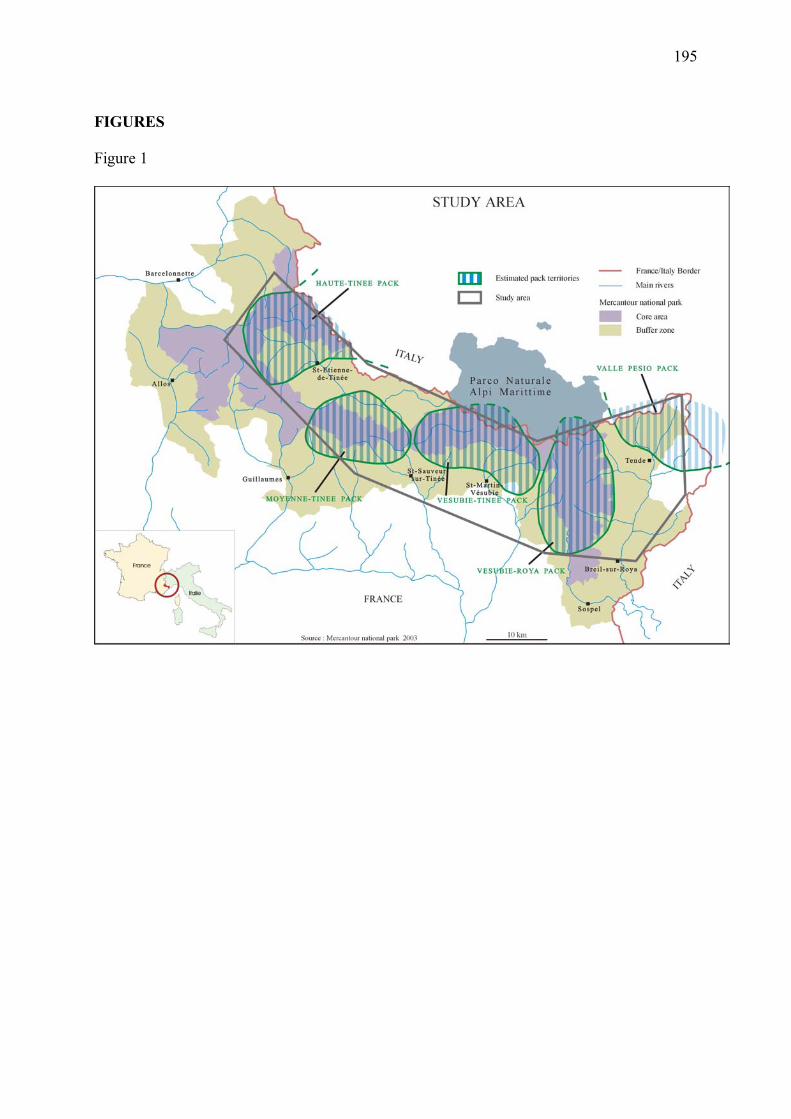
195
FIGURES Figure 1
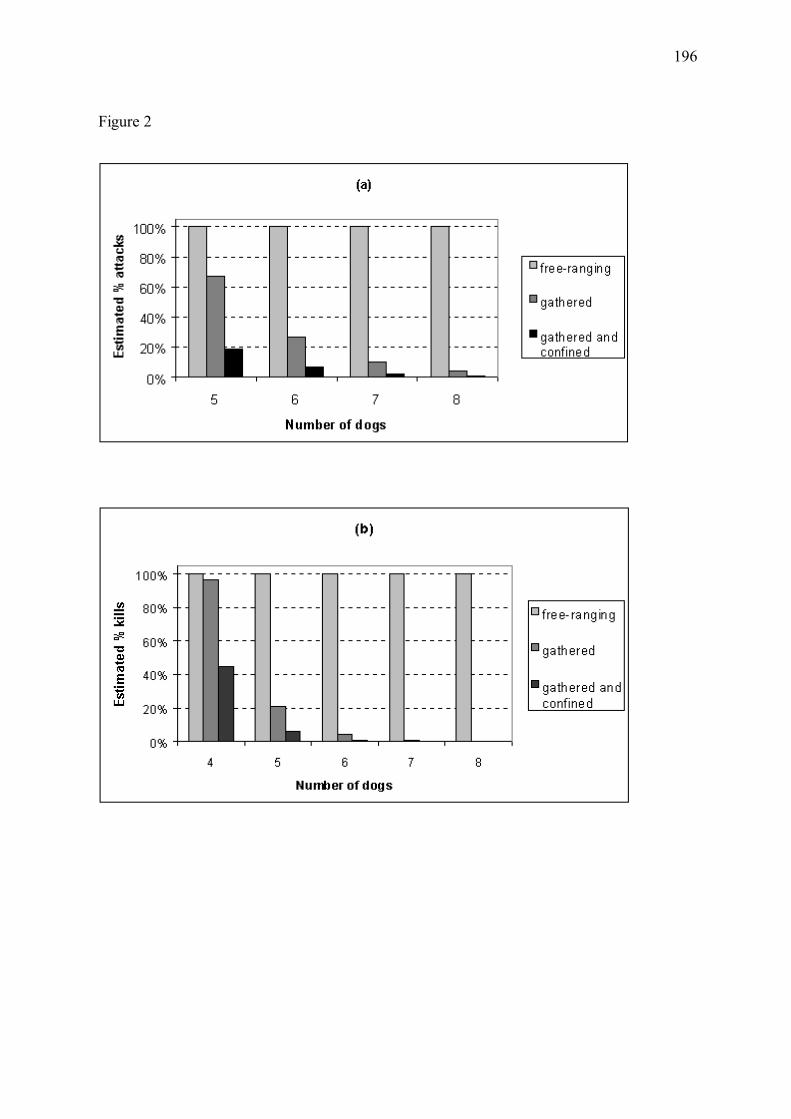
196
Figure 2
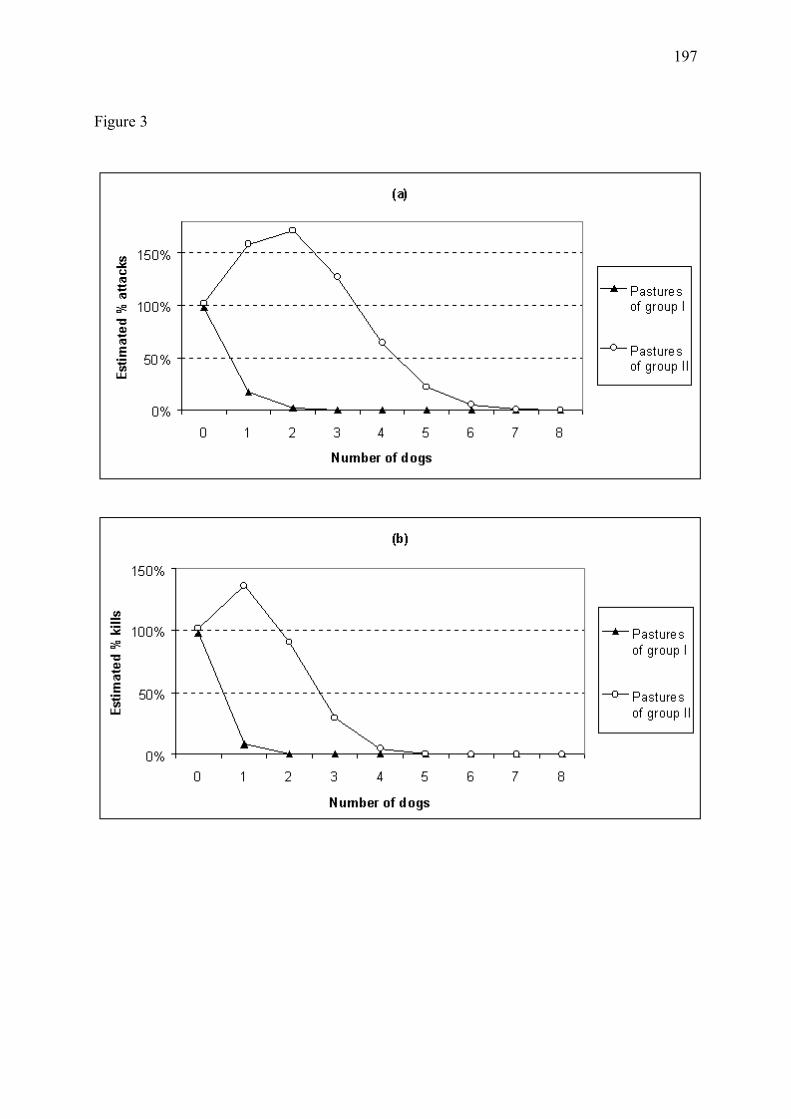
197
Figure 3
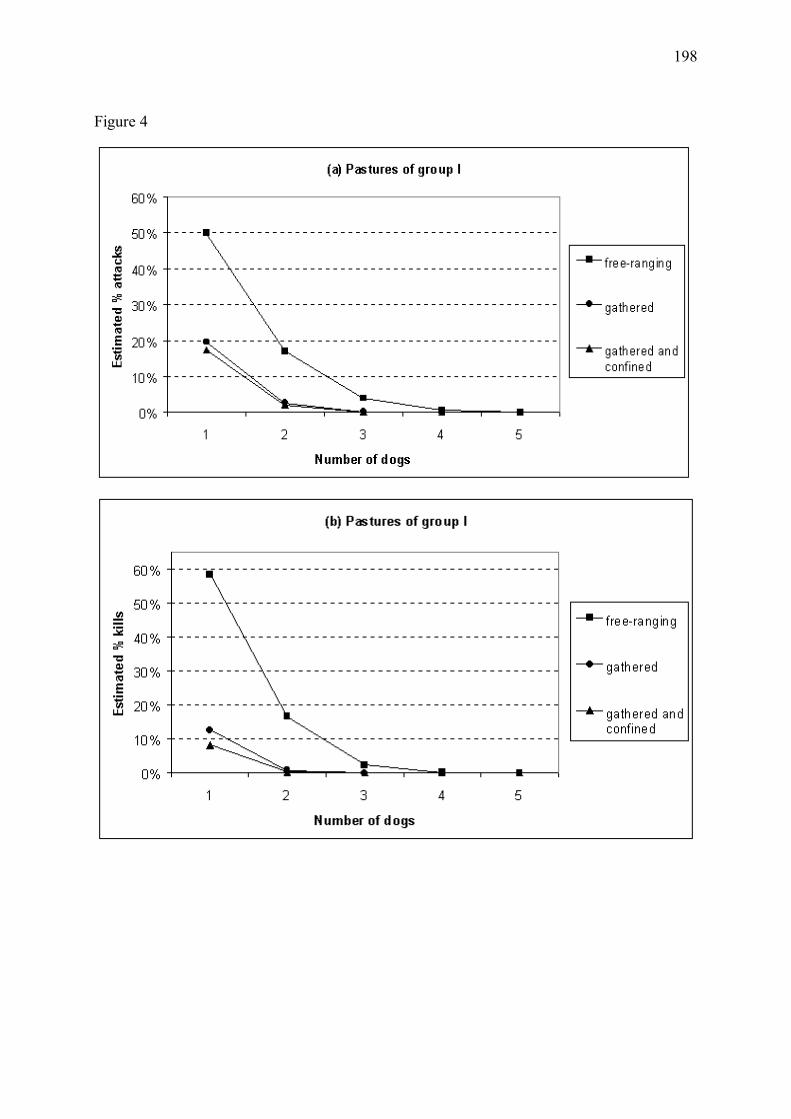
198
Figure 4
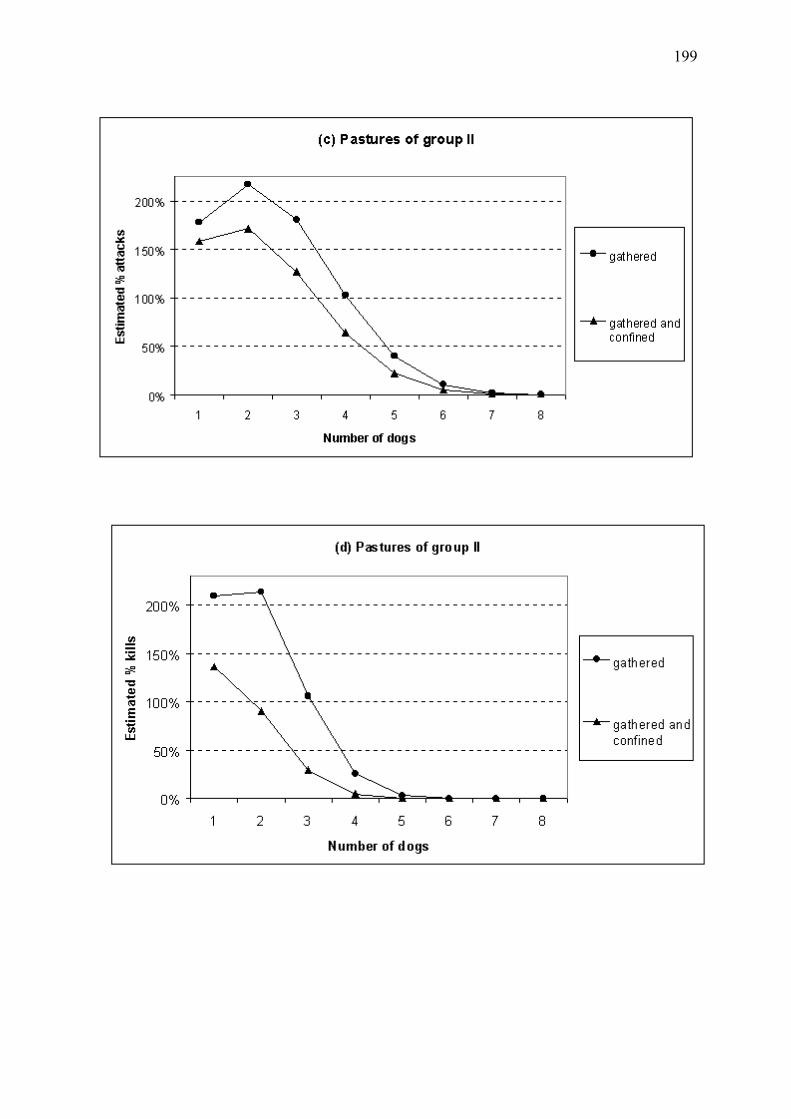
199

200
APPENDICES
Appendix 1 - Parameter estimates and associated standard errors in the preferred models of (a) attack rate and (b) kill rate. Estimates are relative to PASTURE(1), month JULY, year 1994, SITE (1), and degree of herd confinement FREE-RANGING. Interaction of the number of dogs with some of the pastures does not appear in the table because it could not be estimated, due to a lack of variation in the number of dogs during the study period on these pastures.
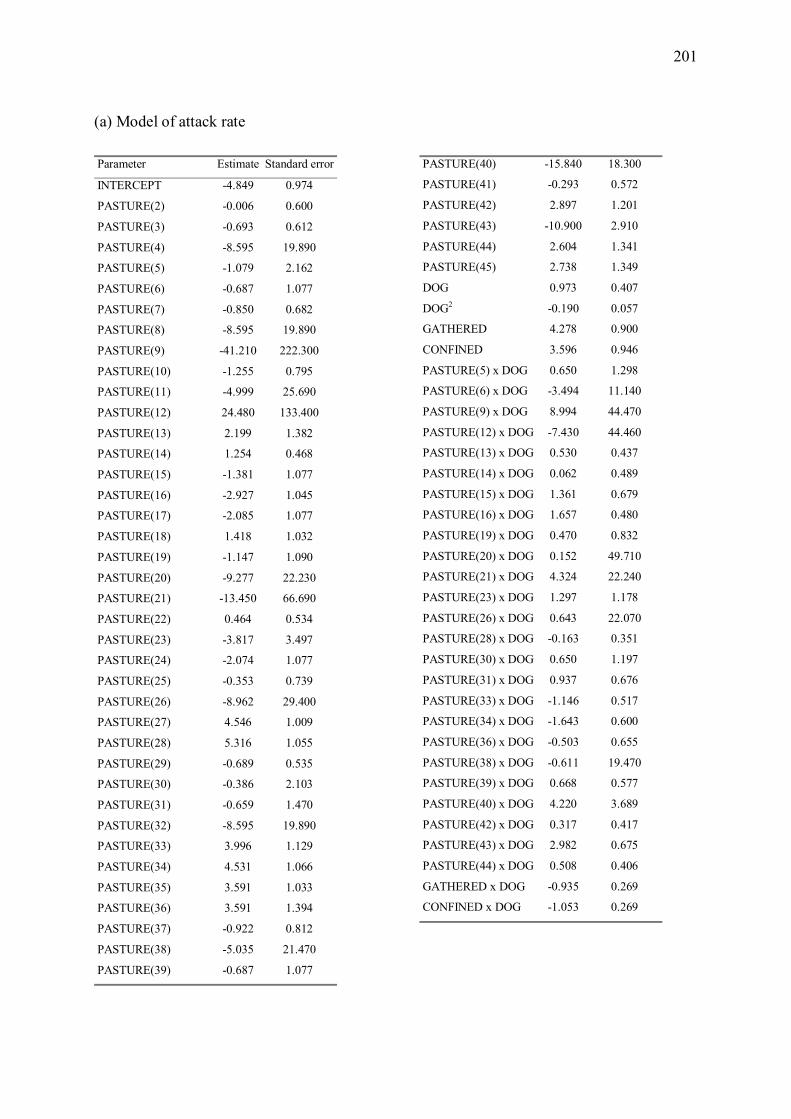
201
(a) Model of attack rate Parameter Estimate Standard error
INTERCEPT -4.849 0.974
PASTURE(2) -0.006 0.600
PASTURE(3) -0.693 0.612
PASTURE(4) -8.595 19.890
PASTURE(5) -1.079 2.162
PASTURE(6) -0.687 1.077
PASTURE(7) -0.850 0.682
PASTURE(8) -8.595 19.890
PASTURE(9) -41.210 222.300
PASTURE(10) -1.255 0.795
PASTURE(11) -4.999 25.690
PASTURE(12) 24.480 133.400
PASTURE(13) 2.199 1.382
PASTURE(14) 1.254 0.468
PASTURE(15) -1.381 1.077
PASTURE(16) -2.927 1.045
PASTURE(17) -2.085 1.077
PASTURE(18) 1.418 1.032
PASTURE(19) -1.147 1.090
PASTURE(20) -9.277 22.230
PASTURE(21) -13.450 66.690
PASTURE(22) 0.464 0.534
PASTURE(23) -3.817 3.497
PASTURE(24) -2.074 1.077
PASTURE(25) -0.353 0.739
PASTURE(26) -8.962 29.400
PASTURE(27) 4.546 1.009
PASTURE(28) 5.316 1.055
PASTURE(29) -0.689 0.535
PASTURE(30) -0.386 2.103
PASTURE(31) -0.659 1.470
PASTURE(32) -8.595 19.890
PASTURE(33) 3.996 1.129
PASTURE(34) 4.531 1.066
PASTURE(35) 3.591 1.033
PASTURE(36) 3.591 1.394
PASTURE(37) -0.922 0.812
PASTURE(38) -5.035 21.470
PASTURE(39) -0.687 1.077
PASTURE(40) -15.840 18.300
PASTURE(41) -0.293 0.572
PASTURE(42) 2.897 1.201
PASTURE(43) -10.900 2.910
PASTURE(44) 2.604 1.341
PASTURE(45) 2.738 1.349
DOG 0.973 0.407
DOG2 -0.190 0.057
GATHERED 4.278 0.900
CONFINED 3.596 0.946
PASTURE(5) x DOG 0.650 1.298
PASTURE(6) x DOG -3.494 11.140
PASTURE(9) x DOG 8.994 44.470
PASTURE(12) x DOG -7.430 44.460
PASTURE(13) x DOG 0.530 0.437
PASTURE(14) x DOG 0.062 0.489
PASTURE(15) x DOG 1.361 0.679
PASTURE(16) x DOG 1.657 0.480
PASTURE(19) x DOG 0.470 0.832
PASTURE(20) x DOG 0.152 49.710
PASTURE(21) x DOG 4.324 22.240
PASTURE(23) x DOG 1.297 1.178
PASTURE(26) x DOG 0.643 22.070
PASTURE(28) x DOG -0.163 0.351
PASTURE(30) x DOG 0.650 1.197
PASTURE(31) x DOG 0.937 0.676
PASTURE(33) x DOG -1.146 0.517
PASTURE(34) x DOG -1.643 0.600
PASTURE(36) x DOG -0.503 0.655
PASTURE(38) x DOG -0.611 19.470
PASTURE(39) x DOG 0.668 0.577
PASTURE(40) x DOG 4.220 3.689
PASTURE(42) x DOG 0.317 0.417
PASTURE(43) x DOG 2.982 0.675
PASTURE(44) x DOG 0.508 0.406
GATHERED x DOG -0.935 0.269
CONFINED x DOG -1.053 0.269
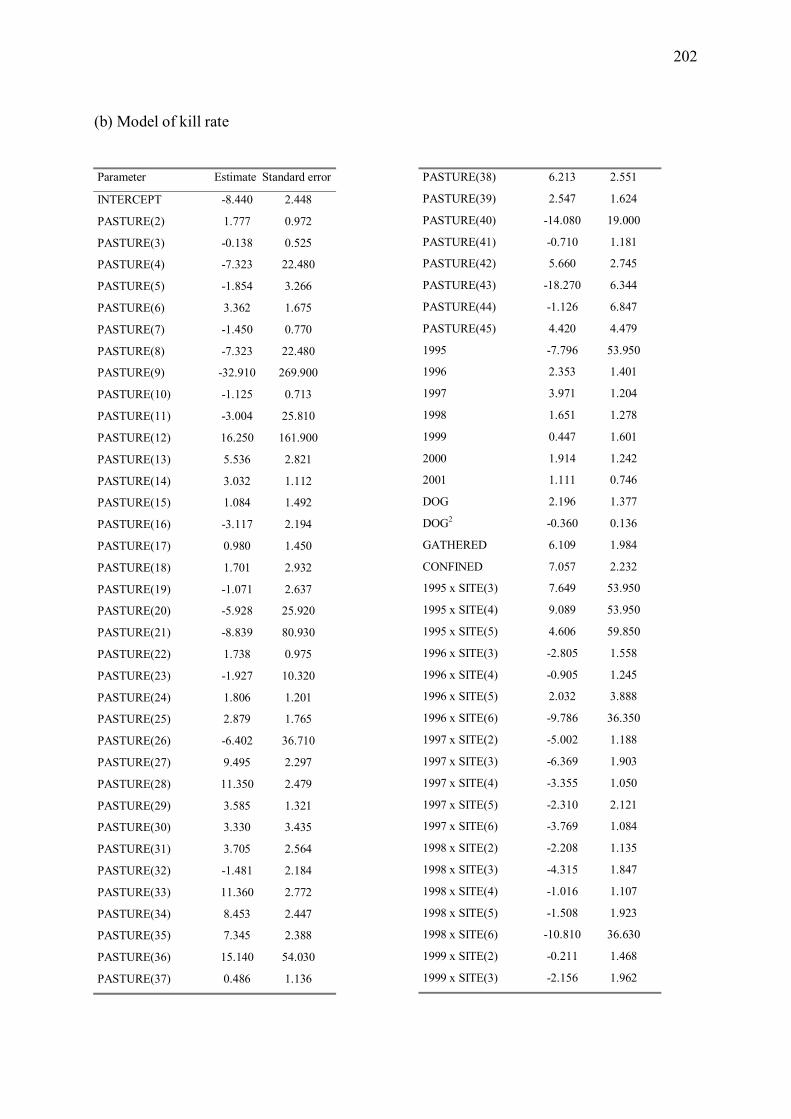
202
(b) Model of kill rate
Parameter Estimate Standard error
INTERCEPT -8.440 2.448
PASTURE(2) 1.777 0.972
PASTURE(3) -0.138 0.525
PASTURE(4) -7.323 22.480
PASTURE(5) -1.854 3.266
PASTURE(6) 3.362 1.675
PASTURE(7) -1.450 0.770
PASTURE(8) -7.323 22.480
PASTURE(9) -32.910 269.900
PASTURE(10) -1.125 0.713
PASTURE(11) -3.004 25.810
PASTURE(12) 16.250 161.900
PASTURE(13) 5.536 2.821
PASTURE(14) 3.032 1.112
PASTURE(15) 1.084 1.492
PASTURE(16) -3.117 2.194
PASTURE(17) 0.980 1.450
PASTURE(18) 1.701 2.932
PASTURE(19) -1.071 2.637
PASTURE(20) -5.928 25.920
PASTURE(21) -8.839 80.930
PASTURE(22) 1.738 0.975
PASTURE(23) -1.927 10.320
PASTURE(24) 1.806 1.201
PASTURE(25) 2.879 1.765
PASTURE(26) -6.402 36.710
PASTURE(27) 9.495 2.297
PASTURE(28) 11.350 2.479
PASTURE(29) 3.585 1.321
PASTURE(30) 3.330 3.435
PASTURE(31) 3.705 2.564
PASTURE(32) -1.481 2.184
PASTURE(33) 11.360 2.772
PASTURE(34) 8.453 2.447
PASTURE(35) 7.345 2.388
PASTURE(36) 15.140 54.030
PASTURE(37) 0.486 1.136
PASTURE(38) 6.213 2.551
PASTURE(39) 2.547 1.624
PASTURE(40) -14.080 19.000
PASTURE(41) -0.710 1.181
PASTURE(42) 5.660 2.745
PASTURE(43) -18.270 6.344
PASTURE(44) -1.126 6.847
PASTURE(45) 4.420 4.479
1995 -7.796 53.950
1996 2.353 1.401
1997 3.971 1.204
1998 1.651 1.278
1999 0.447 1.601
2000 1.914 1.242
2001 1.111 0.746
DOG 2.196 1.377
DOG2 -0.360 0.136
GATHERED 6.109 1.984
CONFINED 7.057 2.232
1995 x SITE(3) 7.649 53.950
1995 x SITE(4) 9.089 53.950
1995 x SITE(5) 4.606 59.850
1996 x SITE(3) -2.805 1.558
1996 x SITE(4) -0.905 1.245
1996 x SITE(5) 2.032 3.888
1996 x SITE(6) -9.786 36.350
1997 x SITE(2) -5.002 1.188
1997 x SITE(3) -6.369 1.903
1997 x SITE(4) -3.355 1.050
1997 x SITE(5) -2.310 2.121
1997 x SITE(6) -3.769 1.084
1998 x SITE(2) -2.208 1.135
1998 x SITE(3) -4.315 1.847
1998 x SITE(4) -1.016 1.107
1998 x SITE(5) -1.508 1.923
1998 x SITE(6) -10.810 36.630
1999 x SITE(2) -0.211 1.468
1999 x SITE(3) -2.156 1.962
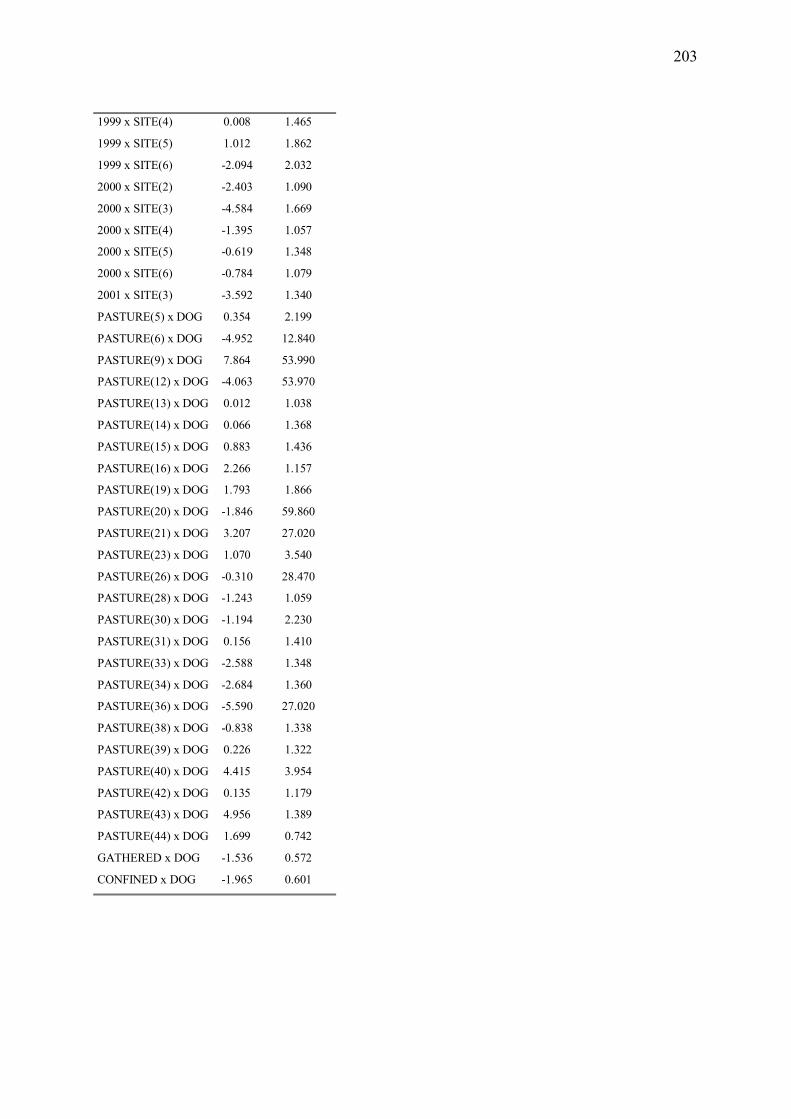
203
1999 x SITE(4) 0.008 1.465
1999 x SITE(5) 1.012 1.862
1999 x SITE(6) -2.094 2.032
2000 x SITE(2) -2.403 1.090
2000 x SITE(3) -4.584 1.669
2000 x SITE(4) -1.395 1.057
2000 x SITE(5) -0.619 1.348
2000 x SITE(6) -0.784 1.079
2001 x SITE(3) -3.592 1.340
PASTURE(5) x DOG 0.354 2.199
PASTURE(6) x DOG -4.952 12.840
PASTURE(9) x DOG 7.864 53.990
PASTURE(12) x DOG -4.063 53.970
PASTURE(13) x DOG 0.012 1.038
PASTURE(14) x DOG 0.066 1.368
PASTURE(15) x DOG 0.883 1.436
PASTURE(16) x DOG 2.266 1.157
PASTURE(19) x DOG 1.793 1.866
PASTURE(20) x DOG -1.846 59.860
PASTURE(21) x DOG 3.207 27.020
PASTURE(23) x DOG 1.070 3.540
PASTURE(26) x DOG -0.310 28.470
PASTURE(28) x DOG -1.243 1.059
PASTURE(30) x DOG -1.194 2.230
PASTURE(31) x DOG 0.156 1.410
PASTURE(33) x DOG -2.588 1.348
PASTURE(34) x DOG -2.684 1.360
PASTURE(36) x DOG -5.590 27.020
PASTURE(38) x DOG -0.838 1.338
PASTURE(39) x DOG 0.226 1.322
PASTURE(40) x DOG 4.415 3.954
PASTURE(42) x DOG 0.135 1.179
PASTURE(43) x DOG 4.956 1.389
PASTURE(44) x DOG 1.699 0.742
GATHERED x DOG -1.536 0.572
CONFINED x DOG -1.965 0.601

204
Annexe 5
205
ANNEXE METHODOLOGIQUE :
Estimation du régime alimentaire du loup (Canis lupus) dans le Mercantour
Le régime alimentaire du loup est classiquement étudié par analyse de la composition de fèces
récoltées dans la zone d�étude concernée (e.g. Meriggi et al. 1991, Poulle et al. 1997, 1998,
Bertrand 2003). Poulle et al. (1997, 1998) ont déterminé les fréquences d�apparition des
différentes espèces proies dans le régime alimentaire du loup du Mercantour en 1996-1998.
Bertrand (2003) a ensuite utilisé les résultats d�analyse de composition des fèces réalisées par
M.-L. Poulle et par l�Office National de la Chasse et de la Faune Sauvage (ONCFS) pour
estimer la contribution relative de chaque espèce proie a la biomasse totale consommée par la
population de loups du Mercantour, au cours des périodes 1996-1998 et 1999-2001.
La validité de ces approches repose sur l�hypothèse d�une absence d�erreurs d�identification
spécifique des fèces collectées, puisque l�inclusion éventuelle de fèces d�autres espèces peut
biaiser l�estimation du régime alimentaire du loup. Dans le massif du Mercantour, la présence
de nombreux chiens domestiques (Canis familiaris) associés aux troupeaux ovins dans la zone
fréquentée par les loups rend peu plausible cette supposition, particulièrement en période
d�estive.
Les travaux de typage génétique de fèces menés par P. Taberlet (Université de Grenoble)
fournissent l�opportunité d�éliminer le biais probable dû aux erreurs d�identification
spécifique dans l�estimation du régime alimentaire du loup du Mercantour. Nous avons utilisé
les résultats de ces travaux, couplés aux résultats d�analyse de composition des fèces menées
par M.-L. Poulle et par l�ONCFS, pour fournir une nouvelle estimation du régime alimentaire
du loup du Mercantour entre 1997 et 2001, basée sur un échantillon de fèces dont l�identité
spécifique a été validée.
206
METHODES
Echantillon de fèces considéré
De 1996 à 2001, 944 fèces visuellement attribuées au loup ont été collectées de façon
opportuniste par le personnel du Parc national du Mercantour et les correspondants du Réseau
Loup de l�ONCFS (voir Poulle et al. 1997 pour des détails de la méthode de collecte). Parmi
elles, 440 fèces ont été identifiées spécifiquement par typage génétique (P. Taberlet, données
non publiées). Les fèces attribuées au loup représentaient de 70% a 94% des fèces typées
selon la période et la saison (Tableau 1).
Estimation de la composition du régime alimentaire du loup
Les proportions relatives des différentes espèces proies dans chaque fèces ont été estimées
visuellement par M.L. Poulle et par l�Office National de la Chasse et de la Faune Sauvage,
suivant la procédure de laboratoire décrite par Ciucci et al. (1996), qui repose sur la
détermination spécifique des poils des proies. La biomasse ingérée correspondant à une fèces
a été estimée en utilisant, pour chaque espèce proie, la régression linéaire de Weaver (1993) :
y=0.439+0.008x, où x est la masse corporelle moyenne de l�espèce proie considérée, et y est la
biomasse ingérée de cette espèce que représente chaque fèces. Nous avons préféré le modèle
de Weaver (1993) à celui de Floyd et al. (1978) car le premier a utilisé des grands cervidés
pour construire son modèle, proies que l�on rencontre dans le Mercantour. Nous avons utilisé
les masses corporelles moyennes pondérées selon les structures d�age et de sexe des
populations fournies par Ciucci et al. (1996) pour les différentes espèces proies. Pour les
espèces rencontrées dans le Mercantour mais non mentionnées par Ciucci et al. (1996), nous
avons utilisé les estimations de Bertrand (2003). Nous avons aussi utilisé les résultats de
Bertrand (2003) pour les masses corporelles ajustées des ongulés sauvages et domestiques
non identifiés, calculées comme suggéré par Ciucci et al. (1996) en supposant que les
proportions relatives de chaque espèce dans les échantillons identifiés et non identifiés étaient
les mêmes. Lorsqu�une fèces contenait les poils de plusieurs espèces proies, nous avons
évalué le nombre d�équivalents-fèces correspondant à chacune d�entre elles en fonction des
proportions relatives de poils appartenant à chaque espèce. Nous avons appliqué le modèle de
Weaver (1993) au nombre d�équivalents-fèces pour chaque espèce. Poulle et al. (1997) ayant
montré que les fréquences d�apparition des espèces proies dans le régime alimentaire du loup
207
variaient saisonnièrement dans le Mercantour, nous avons analyse séparément les fèces
collectées en hiver (novembre-avril) et en été (mai-octobre). En raison de différences
méthodologiques d�échantillonnage (tri visuel des fèces collectées en 1997-98 par la
biologiste M.L. Poulle avant analyse, vs. analyse de l�ensemble des fèces collectées en 1999-
2001) nous avons analysé séparément les fèces des périodes 1997-1998 et 1999-2001. Toutes
les analyses réalisées dans ce travail ont été basées sur des données de composition des fèces
fournies par l�ONCFS.
RESULTATS ET DISCUSSION
Les données fournies par P. Taberlet ont permis de montrer que, dans le Mercantour, le taux
d�erreur d�identification spécifique des fèces de loup était plus élevé en été qu�en hiver (16%
vs. 6% en 1997-98, et 30% vs. 16% en 1999-01) (Tableau 1). Ils ont par ailleurs montré que la
proportion de fèces de chien domestique parmi les fèces collectées était plus élevée en été
qu�en hiver (7% vs. 2% en 1997-98, et 24% vs. 11% en 1999-01), une observation en accord
avec l�hypothèse d�une augmentation du risque d�erreur en été avec l�augmentation de la
densité de chiens domestiques associes aux troupeaux ovins dans la zone fréquentée par les
loups (Tableau 1).
Les données fournies par P. Taberlet ont en oûtre permis de mettre en évidence que la
proportion de fèces correctement identifiées était plus élevée en 1997-98 qu�en 1999-01 (84%
vs. 70% en été, et 94% vs. 84% en hiver), suggérant que le tri des fèces collectées réalisé par
M.-L. Poulle pendant la première période a permis de réduire de façon importante le taux
d�erreur d�identification (Tableau 1). Néanmoins, les taux importants d�erreur d�identification
spécifique pour les deux périodes suggèrent qu�il est important de procéder à une validation
génétique des fèces collectées pour estimer le régime alimentaire des loups dans le
Mercantour.
Les valeurs des contributions estimées des différentes espèces d�ongulés aux régimes
alimentaires annuel et saisonnier du loup dans le Mercantour en 1997-2001 sont présentées
dans les tableaux 2 et 3, respectivement. Les contributions relatives des ongulés domestiques
et du chamois (Rupicapra rupicapra) au régime alimentaire estival du loup ont semblé
fortement décroître entre l�été 1997 et l�été 2001 (Figure 1a). Inversement, les contributions
relatives du cerf (Cervus elaphus) et du bouquetin (Capra ibex) en été ont eu tendance à
208
augmenter au cours de la même période (Figure 1a). Entre les étés 1997 et 2001, les loups ont
donc semblé passer d�un régime alimentaire estival composé essentiellement d�ongulés
domestiques et de chamois à un régime plus diversifié. En revanche, les contributions
relatives des principales espèces proies au régime alimentaire hivernal du loup n�ont pas
semblé suivre de tendances significatives entre les hivers 1997-98 et 2000-01 (Figure 1b). Ces
résultats saisonniers, basés pour l�instant sur des tailles d�échantillon relativement faibles
(Tableau 3, colonne 2), pourraient être validés par le typage génétique d�un plus grand
nombre de fèces pour chaque saison.
Devant le nombre relativement faible de fèces typées génétiquement, nous avons choisi dans
le présent travail d�étudier le régime alimentaire du loup uniquement à l�échelle de la
population. Cependant, Poulle et al. (1998) ont mis en évidence une variation du régime
alimentaire entre meutes de loups dans le Mercantour. Par conséquent, afin que le régime
alimentaire estimé soit représentatif de la population, le ratio nombre de fèces
analysées/effectif de meute devrait idéalement être le même pour chaque meute. La
représentativité des résultats de la présente analyse pourrait être vérifiée à l�avenir si
l�approche génétique permet d�identifier la meute d�origine de chaque fèces.
209
REFERENCES CITEES
Bertrand, A., 2003. Etude du régime alimentaire du loup (Canis lupus) du Parc National du
Mercantour et de leur impact potentiel sur les populations d�ongulés sauvages. Mémoire de
D.E.A., Université Louis Pasteur � Strasbourg.
Ciucci, P., L. Boitani, E. Raganella-Pelliccioni, M. Rocco and I. Guy, 1996. A comparison of
scat-analysis methods to assess the diet of the wolf. Wildlife Biology 2: 267-278.
Floyd, T.J., L.D. Mech and P.A. Jordan, 1978. Relating wolf scat content to prey consumed.
Journal of Wildlife Management 42(3): 528-532.
Meriggi, A., P. Rosa, A. Brangi and C. Matteucci, 1991. Habitat use and diet of the wolf in
Northern Italy. Acta Theriologica 36 (1-2) : 141-151.
Poulle, M.-L., Carles, L. and Lequette, B., 1997. Significance of ungulates in the diet of
recently settled wolves in the Mercantour mountains (southeastern France). Revue d�Ecologie
(Terre Vie), 52:357-368.
Poulle, M.-L, Houard, T. and Lequette, B., 1998. Prédation exercée par le loup sur le mouflon
et le chamois dans le massif du Mercantour (sud-est de la France). Gibier Faune Sauvage,
Game Wildlife, 15 (Hors série Tome 1).
Weaver, J.L., 1993. Refining the equation for interpreting prey occurrence in gray wolf scats.
Journal of Wildlife Management 57(3): 534-538.
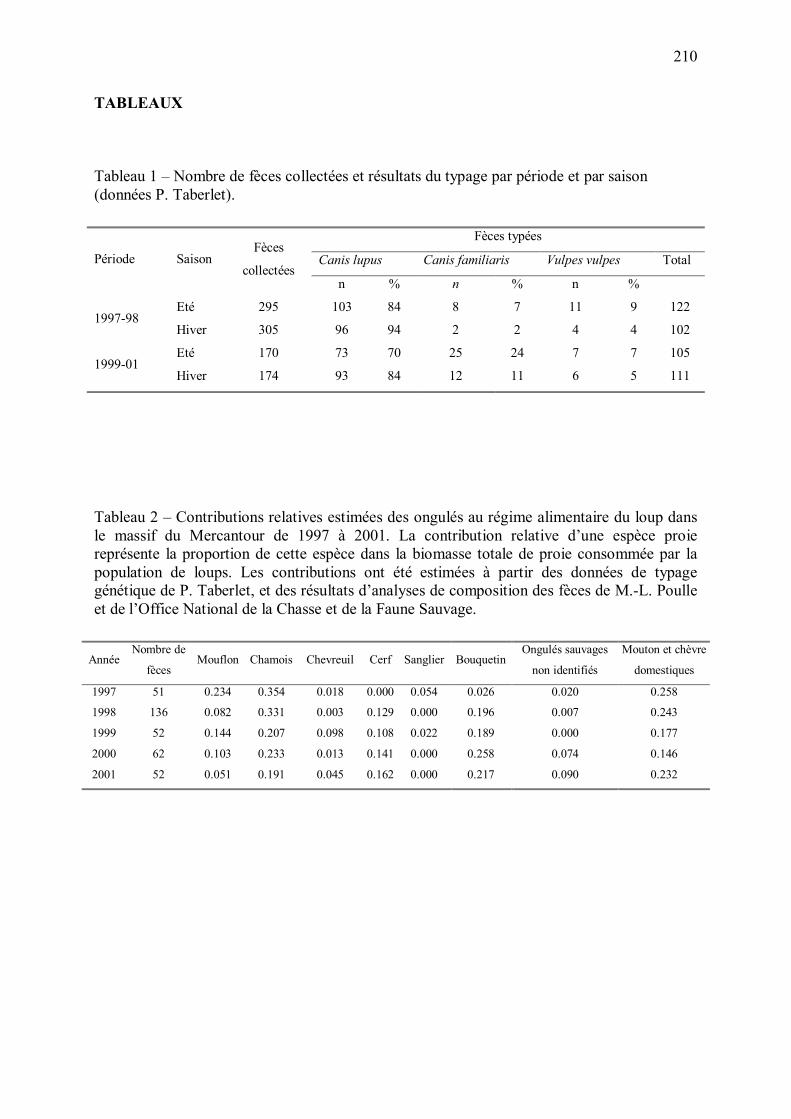
210
TABLEAUX
Tableau 1 � Nombre de fèces collectées et résultats du typage par période et par saison (données P. Taberlet).
Fèces typées
Canis lupus Canis familiaris Vulpes vulpes Total Période Saison Fèces
collectées n % n % n %
Eté 295 103 84 8 7 11 9 122 1997-98
Hiver 305 96 94 2 2 4 4 102
Eté 170 73 70 25 24 7 7 105 1999-01
Hiver 174 93 84 12 11 6 5 111
Tableau 2 � Contributions relatives estimées des ongulés au régime alimentaire du loup dans le massif du Mercantour de 1997 à 2001. La contribution relative d�une espèce proie représente la proportion de cette espèce dans la biomasse totale de proie consommée par la population de loups. Les contributions ont été estimées à partir des données de typage génétique de P. Taberlet, et des résultats d�analyses de composition des fèces de M.-L. Poulle et de l�Office National de la Chasse et de la Faune Sauvage.
Année Nombre de
fèces Mouflon Chamois Chevreuil Cerf Sanglier Bouquetin
Ongulés sauvages
non identifiés
Mouton et chèvre
domestiques
1997 51 0.234 0.354 0.018 0.000 0.054 0.026 0.020 0.258
1998 136 0.082 0.331 0.003 0.129 0.000 0.196 0.007 0.243
1999 52 0.144 0.207 0.098 0.108 0.022 0.189 0.000 0.177
2000 62 0.103 0.233 0.013 0.141 0.000 0.258 0.074 0.146
2001 52 0.051 0.191 0.045 0.162 0.000 0.217 0.090 0.232
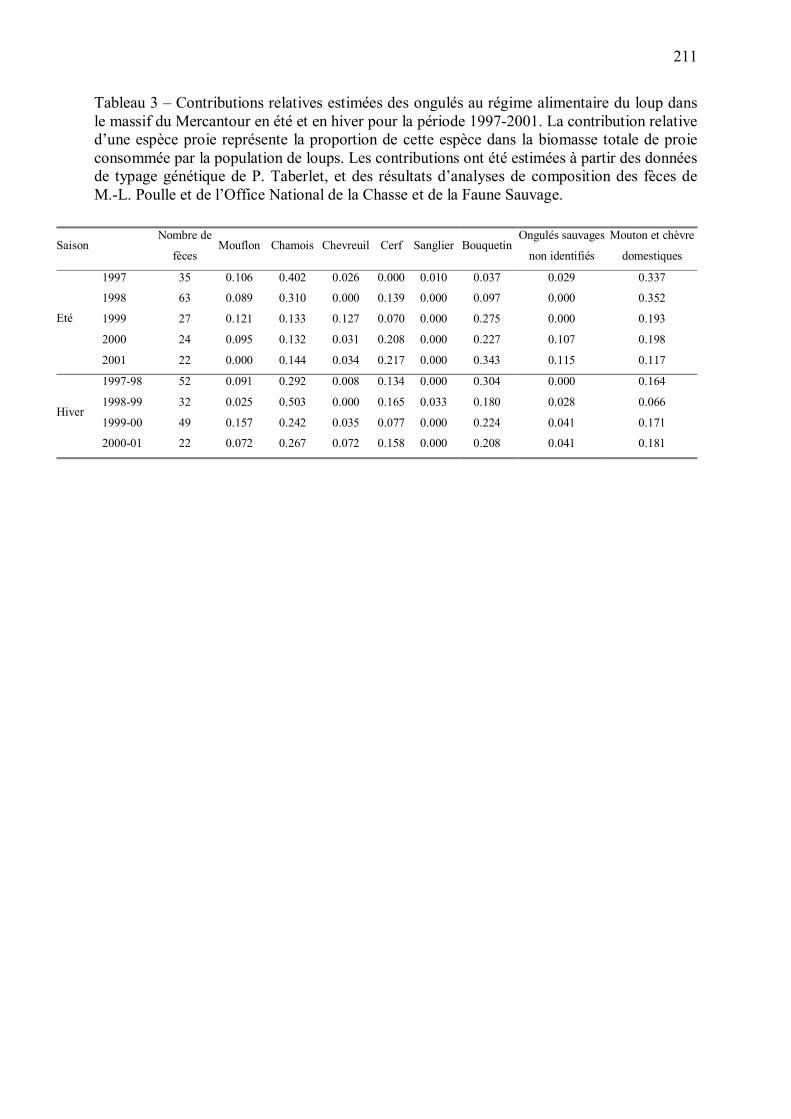
211
Tableau 3 � Contributions relatives estimées des ongulés au régime alimentaire du loup dans le massif du Mercantour en été et en hiver pour la période 1997-2001. La contribution relative d�une espèce proie représente la proportion de cette espèce dans la biomasse totale de proie consommée par la population de loups. Les contributions ont été estimées à partir des données de typage génétique de P. Taberlet, et des résultats d�analyses de composition des fèces de M.-L. Poulle et de l�Office National de la Chasse et de la Faune Sauvage.
Saison Nombre de
fèces Mouflon Chamois Chevreuil Cerf Sanglier Bouquetin
Ongulés sauvages
non identifiés
Mouton et chèvre
domestiques
1997 35 0.106 0.402 0.026 0.000 0.010 0.037 0.029 0.337
1998 63 0.089 0.310 0.000 0.139 0.000 0.097 0.000 0.352
1999 27 0.121 0.133 0.127 0.070 0.000 0.275 0.000 0.193
2000 24 0.095 0.132 0.031 0.208 0.000 0.227 0.107 0.198
Eté
2001 22 0.000 0.144 0.034 0.217 0.000 0.343 0.115 0.117
1997-98 52 0.091 0.292 0.008 0.134 0.000 0.304 0.000 0.164
1998-99 32 0.025 0.503 0.000 0.165 0.033 0.180 0.028 0.066
1999-00 49 0.157 0.242 0.035 0.077 0.000 0.224 0.041 0.171 Hiver
2000-01 22 0.072 0.267 0.072 0.158 0.000 0.208 0.041 0.181
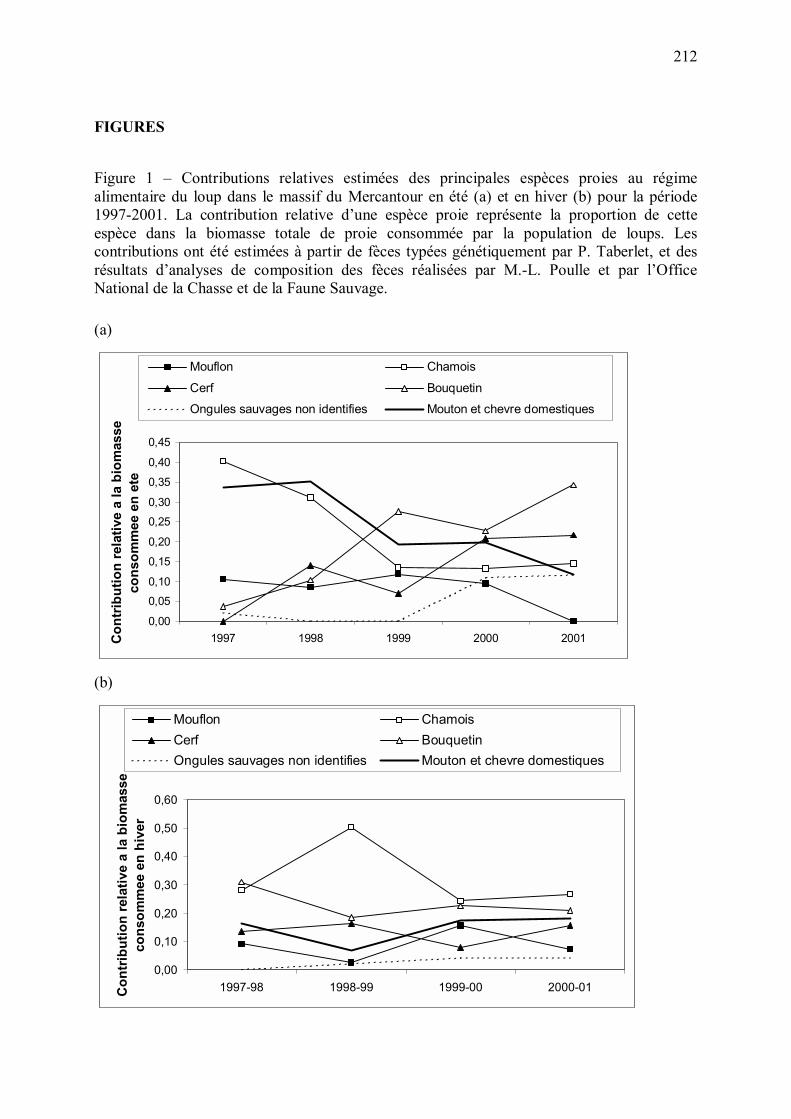
212
FIGURES
Figure 1 � Contributions relatives estimées des principales espèces proies au régime alimentaire du loup dans le massif du Mercantour en été (a) et en hiver (b) pour la période 1997-2001. La contribution relative d�une espèce proie représente la proportion de cette espèce dans la biomasse totale de proie consommée par la population de loups. Les contributions ont été estimées à partir de fèces typées génétiquement par P. Taberlet, et des résultats d�analyses de composition des fèces réalisées par M.-L. Poulle et par l�Office National de la Chasse et de la Faune Sauvage.
(a)
0,00
0,05
0,10
0,15
0,20
0,25
0,30
0,35
0,40
0,45
1997 1998 1999 2000 2001Con
trib
utio
n re
lativ
e a
la b
iom
asse
co
nsom
mee
en
ete
Mouflon Chamois
Cerf Bouquetin
Ongules sauvages non identifies Mouton et chevre domestiques
(b)
0,00
0,10
0,20
0,30
0,40
0,50
0,60
1997-98 1998-99 1999-00 2000-01Con
trib
utio
n re
lativ
e a
la b
iom
asse
co
nsom
mee
en
hive
r
Mouflon ChamoisCerf BouquetinOngules sauvages non identifies Mouton et chevre domestiques

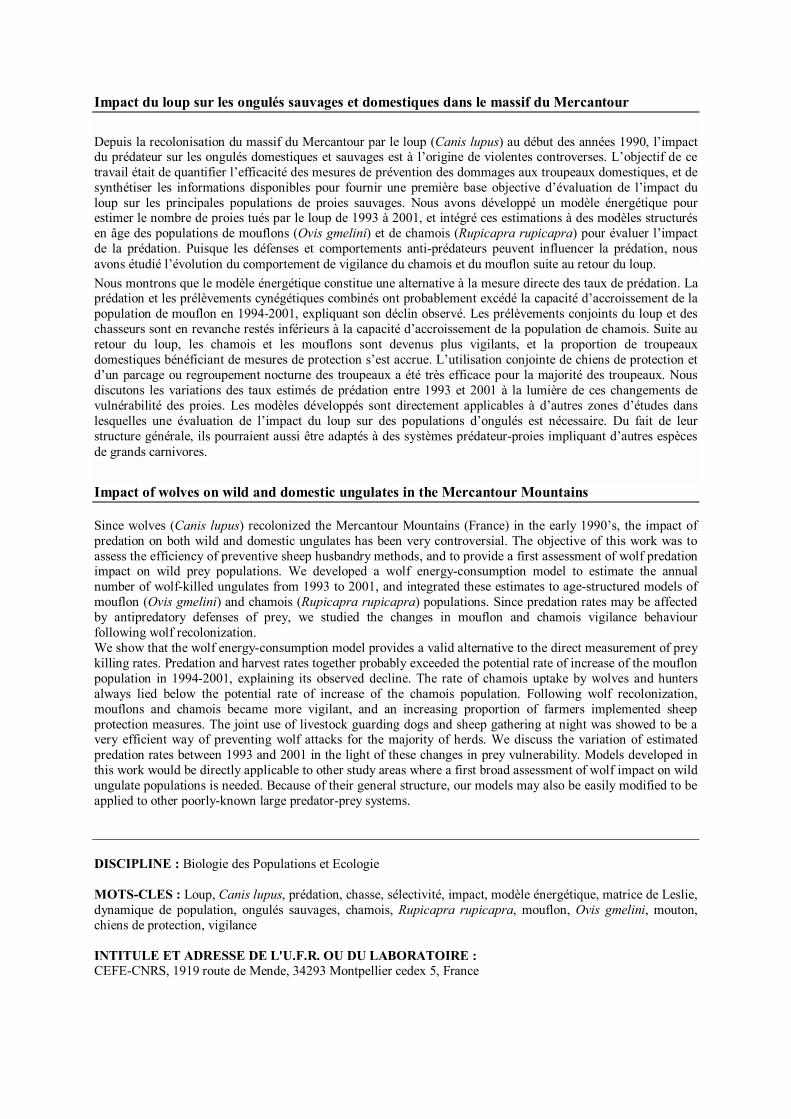
Impact du loup sur les ongulés sauvages et domestiques dans le massif du Mercantour Depuis la recolonisation du massif du Mercantour par le loup (Canis lupus) au début des années 1990, l�impact du prédateur sur les ongulés domestiques et sauvages est à l�origine de violentes controverses. L�objectif de ce travail était de quantifier l�efficacité des mesures de prévention des dommages aux troupeaux domestiques, et de synthétiser les informations disponibles pour fournir une première base objective d�évaluation de l�impact du loup sur les principales populations de proies sauvages. Nous avons développé un modèle énergétique pour estimer le nombre de proies tués par le loup de 1993 à 2001, et intégré ces estimations à des modèles structurés en âge des populations de mouflons (Ovis gmelini) et de chamois (Rupicapra rupicapra) pour évaluer l�impact de la prédation. Puisque les défenses et comportements anti-prédateurs peuvent influencer la prédation, nous avons étudié l�évolution du comportement de vigilance du chamois et du mouflon suite au retour du loup. Nous montrons que le modèle énergétique constitue une alternative à la mesure directe des taux de prédation. La prédation et les prélèvements cynégétiques combinés ont probablement excédé la capacité d�accroissement de la population de mouflon en 1994-2001, expliquant son déclin observé. Les prélèvements conjoints du loup et des chasseurs sont en revanche restés inférieurs à la capacité d�accroissement de la population de chamois. Suite au retour du loup, les chamois et les mouflons sont devenus plus vigilants, et la proportion de troupeaux domestiques bénéficiant de mesures de protection s�est accrue. L�utilisation conjointe de chiens de protection et d�un parcage ou regroupement nocturne des troupeaux a été très efficace pour la majorité des troupeaux. Nous discutons les variations des taux estimés de prédation entre 1993 et 2001 à la lumière de ces changements de vulnérabilité des proies. Les modèles développés sont directement applicables à d�autres zones d�études dans lesquelles une évaluation de l�impact du loup sur des populations d�ongulés est nécessaire. Du fait de leur structure générale, ils pourraient aussi être adaptés à des systèmes prédateur-proies impliquant d�autres espèces de grands carnivores. Impact of wolves on wild and domestic ungulates in the Mercantour Mountains Since wolves (Canis lupus) recolonized the Mercantour Mountains (France) in the early 1990�s, the impact of predation on both wild and domestic ungulates has been very controversial. The objective of this work was to assess the efficiency of preventive sheep husbandry methods, and to provide a first assessment of wolf predation impact on wild prey populations. We developed a wolf energy-consumption model to estimate the annual number of wolf-killed ungulates from 1993 to 2001, and integrated these estimates to age-structured models of mouflon (Ovis gmelini) and chamois (Rupicapra rupicapra) populations. Since predation rates may be affected by antipredatory defenses of prey, we studied the changes in mouflon and chamois vigilance behaviour following wolf recolonization. We show that the wolf energy-consumption model provides a valid alternative to the direct measurement of prey killing rates. Predation and harvest rates together probably exceeded the potential rate of increase of the mouflon population in 1994-2001, explaining its observed decline. The rate of chamois uptake by wolves and hunters always lied below the potential rate of increase of the chamois population. Following wolf recolonization, mouflons and chamois became more vigilant, and an increasing proportion of farmers implemented sheep protection measures. The joint use of livestock guarding dogs and sheep gathering at night was showed to be a very efficient way of preventing wolf attacks for the majority of herds. We discuss the variation of estimated predation rates between 1993 and 2001 in the light of these changes in prey vulnerability. Models developed in this work would be directly applicable to other study areas where a first broad assessment of wolf impact on wild ungulate populations is needed. Because of their general structure, our models may also be easily modified to be applied to other poorly-known large predator-prey systems. DISCIPLINE : Biologie des Populations et Ecologie MOTS-CLES : Loup, Canis lupus, prédation, chasse, sélectivité, impact, modèle énergétique, matrice de Leslie, dynamique de population, ongulés sauvages, chamois, Rupicapra rupicapra, mouflon, Ovis gmelini, mouton, chiens de protection, vigilance INTITULE ET ADRESSE DE L'U.F.R. OU DU LABORATOIRE : CEFE-CNRS, 1919 route de Mende, 34293 Montpellier cedex 5, France