Embed Size (px)
Citation preview

ESS Extension of Social Security
The Welfare Fund for Construction Workers in Tamil Nadu
V. Krishnamurthy
R. P. Nair
ESS Paper no. 18
Social Security Policy and Development Branch International Labour Office

Copyright © International Labour Organization 2003 First published 2003
Publications of the International Labour Office enjoy copyright under Protocol 2 of the Universal Copyright
Convention. Nevertheless, short excerpts from them may be reproduced without authorization, on condition that the source is indicated. For rights of reproduction or translation, application should be made to the Publications Bureau (Rights and Permissions), International Labour Office, CH-1211 Geneva 22, Switzerland. The International Labour Office welcomes such applications.
Libraries, institutions and other users registered in the United Kingdom with the Copyright Licensing Agency, 90
Tottenham Court Road, London W1T 4LP [Fax: (+44) (0)20 7631 5500; email: [email protected]], in the United States with the Copyright Clearance Center, 222 Rosewood Drive, Danvers, MA 01923 [Fax: (+1) (978) 750 4470; email: [email protected]] or in other countries with associated Reproduction Rights Organizations, may make photocopies in accordance with the licences issued to them for this purpose.
The designations employed in ILO publications, which are in conformity with United Nations practice, and the
presentation of material therein do not imply the expression of any opinion whatsoever on the part of the International Labour Office concerning the legal status of any country, area or territory or of its authorities, or concerning the delimitation of its frontiers.
The responsibility for opinions expressed in signed articles, studies and other contributions rests solely with their
authors, and publication does not constitute an endorsement by the International Labour Office of the opinions expressed in them.
Reference to names of firms and commercial products and processes does not imply their endorsement by the
International Labour Office, and any failure to mention a particular firm, commercial product or process is not a sign of disapproval.
ILO publications can be obtained through major booksellers or ILO local offices in many countries, or direct from
ILO Publications, International Labour Office, CH-1211 Geneva 22, Switzerland. Catalogues or lists of new publications are available free of charge from the above address, by email: [email protected] or website http://www.ilo.org/publns
Visit also the Extension of Social Security website: http://www.ilo.org/public/english/socsec/pol
Printed in Geneva
ILO / V. Krishnamurthy and R.P. Nair The Welfare Fund for Construction Workers in Tamil Nadu. ESS Paper no. 18 Geneva, International Labour Office, 2003 Social security, construction worker, construction industry, regional level, India 02.03.1 ISBN 92-2-113745-7 (print version) ISSN 1020-9581 – Extension of Social Security (ESS) Paper Series Also available in PDF format, ISBN 92-2-114138-1; ISSN 1020-959X.
ILO Cataloguing in Publication Data

iii
Contents Acknowledgements...................................................................................................................................................... iv Summary ....................................................................................................................................................................... v 1. Introduction............................................................................................................................................................... 1
1.1. Social security in India.................................................................................................................................. 1 1.2. Welfare funds.............................................................................................................................................. 1 1.3. Objectives and scope of the study................................................................................................................ 3 1.4. Structure of the report .................................................................................................................................. 4
2. Organization, structure and functions .................................................................................................................. 4 2.1 Organization................................................................................................................................................ 4 2.2 Structure ...................................................................................................................................................... 5
2.2.1 Constitution of the Board.............................................................................................................. 5 2.2.2 Staff pattern of the Board ................................................................................................................ 5
2.3 Functions..................................................................................................................................................... 6 2.3.1 Registration of manual workers .................................................................................................... 6 2.3.2 Benefits ......................................................................................................................................... 6
3. Performance of the scheme: A micro-level analysis .............................................................................................. 8 3.1 Preparation and background........................................................................................................................ 8 3.2 Scope........................................................................................................................................................... 8 3.3 Results of the survey.................................................................................................................................... 8 3.4 Social and demographic characteristics ...................................................................................................... 8 3.5 Housing standards ..................................................................................................................................... 12 3.6 Health care ................................................................................................................................................ 12 3.7 Economic status of the construction labour households ............................................................................ 13 3.8 The functioning of the Welfare Board ...................................................................................................... 16 3.9 Welfare benefits approved by the Board................................................................................................... 19 3.10 Unregistered workers ................................................................................................................................. 20
4. The main challenges faced by the Welfare Fund ................................................................................................ 21 4.1 Registration............................................................................................................................................... 22 4.2 Financial management .............................................................................................................................. 23 4.3 Effective mobilization of employer contributions..................................................................................... 24 4.4 Future policy options ................................................................................................................................. 26
5. Conclusions and recommendations...................................................................................................................... 27 Annex I ....................................................................................................................................................................... 30 Annex II ...................................................................................................................................................................... 31 Annex III..................................................................................................................................................................... 32 Annex IV..................................................................................................................................................................... 33 Annex V...................................................................................................................................................................... 34 ESS papers already published ..................................................................................................................................... 42

iv
Acknowledgements1
The study of the Welfare Fund for Construction Workers in Tamil Nadu (the Welfare
Fund) is based on both primary and secondary data. Primary data for studying the economic impact of the scheme was collected from construction workers using a structured questionnaire. Secondary data was collected from the The Tamil Nadu Construction Workers’ Welfare Board (the Board) and other related government agencies so as to evaluate the administration and operation of the Board. The authors are grateful for the support provided to the study by Mr. R. Ramesh, Secretary of the Board and his associates Mr. John and Mr. Kishore. Technical support was received from Shri. K.V. Palanidurai, Member, State Planning Commission and Mr. V. Krishnarajan, Joint Director of the Tamil Nadu Evaluation Department (Retired), who supervised the field survey of construction labour households. Help and support are acknowledged from Mr. P.A. Ramiah, Commissioner for Labour and Chairman of the Board, from Mr. R. Ratisaswamy and Mr. P. Shankar, Labour Secretary and Chief Secretary respectively of the Government of Tamil Nadu, and from those persons who completed the word processing of the report. 1 The authors (V. Krishnamurthy, Retired Chief Secretary, Government of Kerala and R.P. Nair, Research Fellow, Kerala Statistical Institute, Trivandrum) may be contacted directly at [email protected].

v
Summary
Although there are some social security schemes of national application in India – such as the Employees Provident Fund Scheme – they focus on the organized sector, whereas there is a need for a national social security policy. Some states, however, have given greater priority to social security through the establishment of non-contributory social assistance schemes, and the national government has in recent years tried to reinforce these efforts through the National Social Assistance programme.
Some states such as Tamil Nadu and Kerala have also given priority to providing social security to unorganized workers through the development of welfare funds based on occupational groups. This study examines the Tamil Nadu experience in this respect with some comparative reference to Kerala. State legislation enacted in 1982 provided the basis for welfare schemes to be set up in Tamil Nadu for specified categories of workers and eight welfare boards have been established with worker, employer and government representatives.
The study focuses on the Welfare Fund for Construction Workers (the Welfare Fund), which commenced in November 1994 and provides a range of welfare measures such as benefits for fatal and non-fatal accidents as well as grants for education, marriage and funerals.
Manual workers over the age of 15 can register with the Board and pay Rs.25/- as an insurance premium to cover accidental death or disability. In practice, however, workers are registered through their trade unions but the level of registration is low – 18 per cent of two million workers in the sector. Of the 90,000 members identified in a survey conducted under the study, only 200 had received any monetary benefit from their membership. Employers pay 0.3 per cent of each construction contract to the Welfare Fund but compliance is a problem and the benefits are too small to make a difference to living conditions.
The study recommends that the contribution rate can be increased to 1 per cent if the following two conditions are met: (i) there is in-depth study done on the reasons for the large current surplus of the fund, and (ii) there is a clear plan about how the current surplus and the increased future resources will be used for greater coverage and improved benefits. Moreover the Welfare Board should take direct responsibility for providing compensation for accidents, such as is done in Kerala. It concludes that there is a need for the various welfare funds to operate on a more uniform basis and that consideration should be given to achieving a greater degree of integration under one single board.


1
1. Introduction
1.1. Social security in India
India is yet to formulate a social security policy. There is a variety of schemes providing social security but they were created at various times and they do not conform to any overall design or represent a national strategy. There is therefore an obvious need for a social security policy for India.1
Social security can be broadly divided into social insurance provisions and social assistance. Social assistance is intended to ensure a minimum level of economic support to those who have no other income. Social insurance schemes on the other hand seek to replace income lost by employees in the organized sector as a consequence of inability to work due to the risk of unemployment, invalidity or old age.
In India, the first social security provision was an employer liability scheme – the Workmen's Compensation Act of 1923. This was followed by the introduction of a social insurance scheme with provisions for sickness, maternity, medical and employment injury benefits under the Employees State Insurance Scheme of 1948. The Employees Provident Fund Scheme was established in 1952 as a compulsory savings scheme.
Some state governments then launched social assistance schemes to provide support for the old and the destitute in the late 1960s and early 1970s. These schemes were reinforced more recently by the National Social Assistance Programme (NSAP), which was introduced by the central government to provide an old-age pension, a family benefit on the death of a primary breadwinner and a maternity benefit. This is a major attempt to provide a minimum of social security coverage to the poor.
1.2. Welfare funds
The Welfare Fund plays an important role in providing protection for workers in the unorganized sector. These funds are primarily contributory and cover a wide range of benefits. The welfare funds set up by the Government of India for mine and beedi workers do not include a provision for meeting the expenditure on any of the well recognized items of social security (sickness benefit, occupational injury, maternity, and old-age benefit). The welfare funds functioning in Tamil Nadu and Kerala are worth mentioning in this context.
Tamil Nadu is one of the pioneers in the implementation of social security programmes, especially for workers in the unorganized sector. The first major step was the enactment of the Tamil Nadu Manual Workers’ (Regulation and Employment and Conditions of Work) Act of 1982. This Act empowers the Government to frame schemes for regulating the employment of workers listed in the schedule to the Act, and also for their welfare. It also empowers the Government to constitute welfare boards to administer these schemes. All these boards are tripartite in character consisting of representatives of employees, employers and government. So far 67 employment categories have been added to the schedule to the Act, all of which are in the 1 R.K.A.Subramanya: Social Security in India – organized sector – a survey: Research project on strategies and financing of Human Development.

2
unorganized sector. Following this Act the Government of Tamil Nadu constituted welfare boards and formulated welfare schemes for the workers in the following employments:
♦ construction or maintenance of dams, bridges, roads or any building operations, ♦ driving auto rickshaws and taxis, ♦ work in laundries and washing clothes, ♦ hair dressing and beauty parlour salons, ♦ tree-climbing, ♦ tailoring, and ♦ making of handicrafts.
Apart from the above welfare boards, a separate welfare board for the remaining employments listed in the schedule was constituted and has been functioning since 1998. Thus in Tamil Nadu eight welfare boards have been constituted to cater to the welfare benefits of workers in the unorganized sector. All the welfare boards so far are in their initial stages of operation and their success in providing social security benefits to the various target groups needs to be objectively evaluated.
In August 1997, the Government of Tamil Nadu constituted two tripartite committees to study the problems and issues of unorganized workers engaged in employments that are covered by the provisions of labour enactments as well as those not covered by them, and to make suitable recommendations. The important recommendations of these committees are summarized below:
i. Priority should be given to enforcing the labour laws rather than adding further employments to the scheme and fixing of minimum wages.
ii. The enforcement of the Minimum Wages and other allied Acts should be the responsibility of the Labour Department.
iii. The formulation of a strategy for the integration of existing housing schemes which are administered by the Tamil Nadu Housing Board, the Tamil Nadu Slum Clearance Board, the Tamil Nadu Adi Dravidar Housing and Development Corporation and the Rural Development Department. Unorganized workers should be allocated 10 to 20 per cent of the houses in the above schemes. The Committees also recommended that to speed the implementation of this scheme for convergence of services, a separate monitoring unit should be constituted in the office of the Labour Commissioner.
iv. The Committees recommended an integrated social security scheme for unorganized labour and suggested the development of a comprehensive scheme aiming at a unified approach covering all sectors on a contributory basis. The Committee expressed the view that in the initial stages it is important to concentrate in certain areas where the need is greatest and the scope for success the highest. The objective is to ensure, in the initial stages at least, standard benefits for all categories of workers such as pension, temporary disability and sickness insurance, maternity benefits and survivors insurance. For effective implementation of these recommendations and for the administration of these schemes, the committee suggested the establishment of regional Boards with supporting staff at Chennai, Chingelpet, Thiruchirappalli, Salem, Coimbatore, Madurai

3
and Tirunelveli. A principal Board with supporting staff would be set up at Chennai to administer and co-ordinate the functions of the various regional Boards.
The Government is considering these recommendations of the Tripartite Committees.
In Kerala, there are 18 welfare funds that cover the majority of workers in the unorganized sector. Three of these are Labour Department funds (lottery agents, document writers, stamp vendors and advocate’s clerk welfare Funds). The remaining 15 funds have independent entities and are governed by tripartite bodies. Most of these funds are responsible for specific sections of the unorganized sector like toddy workers, head-load workers and motor transport workers. The funds are based on social insurance principles and the contribution rate varies but workers, on average, have to contribute 10 per cent of their wages. The employer contribution is between 10 to 25 per cent of the workers’ wage or 1 per cent of the turn over. There is a wide variety of schemes in Kerala – old-age pensions, provident fund and gratuity, ex-gratia, disability allowance, funeral allowance, education and medical assistance, marriage and maternity benefit, unemployment insurance and housing loan facility among others.
1.3. Objectives and scope of the study
The study had the following objectives:
i. An independent analysis of the Welfare Fund to determine the extent to which unprotected casual workers in this sector have benefited.
ii. An evaluation of the performance of the welfare schemes through a micro-level survey. Here the main objective was to assess the direction and magnitude of the actual assistance extended to the workers.
iii. An assessment of the economic impact of the welfare schemes implemented by the Board.
iv. An identification of the main challenges faced by the Welfare Fund and the development of alternative policy options.
The study evaluated the working of the Welfare Fund based on a micro-level survey conducted in Chennai City. The approximate number of construction workers in Tamil Nadu is 2,075,000 of which Chennai City accounts for slightly less than 10 per cent. It is interesting to note that only 19 per cent of construction workers in Tamil Nadu are registered, but in Chennai City 74 per cent of workers have registered with the welfare fund. This is the main justification for the selection of Chennai City for the micro-level study. Every effort has been made to cover all the registered workers in the city through a representative sample of beneficiaries and non-beneficiaries and almost 90 per cent of them have been covered in the sample. The pilot study covered 355 construction labour households of the following different categories of construction workers as indicated below:

4
♦ registered beneficiaries,
♦ registered non-beneficiaries, classified into two groups,
(a) registered but not applied for any benefits, and
(b) registered and applied for benefits but rejected, and
♦ unregistered workers.
1.4. Structure of the report
Following this introduction, Chapter 2 will examine the organization, structure and functions of the Welfare Board. Chapter 3 concentrates on the methodology of the study, sample design and the analysis of data of the micro-level study conducted in Chennai City. The results of this micro-level study are also presented in this chapter. The main challenges faced by the Welfare Fund – its sustainability and alternative policy options – are presented in Chapter 4. Chapter 5 summarizes the findings and sets out the conclusions of the study.
2. Organization, structure and functions
2.1 Organization
According to the 1991 census, the State of Tamil Nadu has nearly 2.1 million workers engaged in various types of construction activities. The welfare of these construction workers did not engage serious attention till 1982 when the Government enacted legislation called the Tamil Nadu Manual Workers’ (Regulation of Employment and Conditions of Work) Act, with a view to regulating the employment of manual workers as well as their conditions of work and security of employment. The schedule to this Act covers 67 employments. The powers conferred by Section 3 of the Act enabled the Government to start a scheme called the Tamil Nadu Manual Workers’ (Construction Workers’) Welfare Scheme in 1994 for the benefit of 36 categories of construction workers including the following (for a complete list, see Annex I): ♦ stone cutter, stone breaker or stone crusher, ♦ mason or brick layer, ♦ carpenter, ♦ painter or varnisher, ♦ plumber for road pipe work, ♦ electrician, ♦ mechanic, ♦ maistry, ♦ blacksmith, ♦ mosaic polisher.
The scheme started on 1 November 1994 in Chennai, Madurai and Coimbatore. With effect from 15 June 1997 the scheme was extended to the entire State. It provides the following welfare measures for manual workers engaged in the construction industry:

5
♦ crèches,* ♦ Group Personal Accident Insurance Scheme, ♦ Provident Fund and Employees State Insurance Scheme,* ♦ pension scheme,*2 ♦ assistance for funeral expenses in the death of a registered manual worker, ♦ assistance for the education of the son or daughter of a registered manual worker, ♦ assistance for the marriage of the son or daughter of a registered manual worker, ♦ assistance for the delivery of a child by a registered woman manual worker, ♦ assistance for the natural death of a registered manual worker.
2.2 Structure
2.2.1 Constitution of the Board
The Board consists of members representing employers and manual workers in equal numbers - nine each. The Government is represented by six members and it is stipulated in the Act that they should not exceed one-third of the total number. The Commissioner for Labour who is one of the members representing the Government is the Chairman of the Board.
2.2.2 Staff pattern of the Board
Under the Chairman of the Board all the executive functions are performed by the Secretary of the Board, who holds the rank of a Joint Labour Commissioner. He is assisted by five superintendents and 12 support staff. The main functions performed by the central office are: ♦ registration of construction workers belonging to four districts, ♦ issuance of identity cards, ♦ renewal of registration, and ♦ issuance of duplicate cards.
Processing of all claims under the various schemes and payments of assistance to beneficiaries is looked after by the central office only, and no financial responsibility is vested with the district level officers. The district level offices now function in 15 centres.
Each district level office is administered by one Superintendent with the rank of Assistant Inspector of Labour, assisted by a Junior Assistant cum typist. At present the district offices look after the work of the registration of construction workers, issuing identity cards to registered workers and dealing with the renewal of registration and issuance of duplicate identity cards. The staff of the Board is financed from its own revenues and not from state funds. The administrative costs incurred by the Board for the latest year 2000-2001 amount to approximately Rs.12,939,000.3 This constitutes nearly 12 per cent of the total revenue received by the Board as employer contributions, which at present is the only source of income for the Board. Out of total administrative costs, Rs.8.2 million is used as expenditure on the headquarters of the Welfare Board and Rs.4,739,000 is spent on administration of the regional offices.
2 The benefits marked* have not yet been approved by the Welfare Board. 3 1US$ = Rs.49.10
6
2.3 Functions
2.3.1 Registration of manual workers
A manual worker who is over 15 but under the age of 60 years is eligible to register his/her name with the Welfare Board. The worker is not required to come in to the Board office at the time of registration – usually representatives of the registered trade unions bring in the application. (Unlike in Kerala, the construction workers in Tamil Nadu are mostly illiterate and unorganized and cannot undertake the formalities involved in obtaining registration). The field survey conducted as part of this study revealed that the workers generally preferred to rely on trade unions for obtaining various benefits accorded by the Welfare Board. At the time of registration Rs.25/- is collected from each worker. After two years a renewal fee of Rs.10/- is also collected from the registered worker. The registration fee collected by the Board is remitted to the United India Insurance Company Ltd. (a Government of India undertaking) as part of the premium under the group insurance scheme. In addition a renewal premium of Rs.25/- per registered construction worker is paid to the company annually by the Board to finance a lump-sum payment in the case of accidental death or disability. Other benefits approved for registered workers (educational, marriage, and maternity assistance, etc.) are met from the levy collected from every local authority, and government departments, undertakings and institutions. Prior to July 1997, the levy collected was of 0.1 per cent of the total estimated cost of the building/construction work. With effect from July 1997 the rate was increased to 0.3 per cent. This amount is collected from the relevant agencies by the Board and invested with M/s. Power Finance and M/s Transport Finance, which are State Government undertakings. As of 30 April 2001, nearly Rs.315.5 million had been invested with the above companies. A proposal to increase the rate of levy collected from employers to 0.5 per cent is under consideration. Details of construction workers registered up to 30 November 2001, as well as insurance premiums paid, benefit payments and fund balance registration fee revenues are given in Annex II. Annex III provides the details regarding compensation/assistance approved.
Any manual worker engaged in any of the 36 categories of trade may register his/her name with the Board in order to obtain future entitlement to benefit. An application for registration must be made on Form ‘A’ together with a certificate of employment issued by any of the persons or authorities specified below:
(a) Employers engaged in the construction industry for purpose of trade or business, (b) Registered contractors, (c) Government organizations or agencies engaged in the building industry, and (d) Registered trade unions.
2.3.2 Benefits
Details of the six categories of benefits in operation are set out below.
(i) Group personal accident insurance scheme
All registered construction workers have been insured with the United India Insurance Company under a group personal accident insurance scheme and the Welfare Board pays the premium and renews the policy every year. In the event of the death of a registered construction worker in an accident arising out of and in the course of employment a sum of Rs.100,000 is paid to the nominee of the deceased. For the loss of limbs, eyes, etc. compensation is paid up to Rs.100,000. Up to 30 November 2001, Rs.14,4 million had been paid to the nominees of 153

7
construction workers who died in accidents and Rs.1,4 million to 76 workers who sustained injuries.
(ii) Education assistance
Assistance for the education of the son/daughter of a registered construction worker is payable as (i) 10th Standard – Rs.750/-; and ii) 12th Standard – Rs.1,000/-.
This facility is extended to only two children of a registered construction worker. This assistance may be increased from Rs.750/- to Rs.1,000/- and from Rs.1,000/- to Rs.1,500/- shortly. Up to 30 November 2001, Rs.1.34 million had been approved to 1,662 persons for the tenth standard and Rs.1.46 million to 993 persons for 12th standard and higher as education assistance.
(iii) Marriage assistance
To meet the marriage expenses of a son or daughter of a registered construction worker Rs.1,000/- is approved by the Board. This assistance is given only twice and the amount is likely to be increased to Rs.2,000/-. This assistance is also paid to registered construction workers for their marriage. Up to 30 November 2001 Rs.1.82 million had been disbursed to 1,610 registered workers as marriage assistance.
(iv) Maternity assistance
Rs.2,000/- is paid on not more than two occasions to a female construction worker registered under this scheme. Up to 30 November 2001 Rs.77,000/- had been paid as maternity benefit to 40 registered female workers.
(v) Assistance for funeral expenses
In the event of death (either natural or accidental) of a registered construction worker, the nominees are paid Rs.2,000/- to meet the funeral expenses. Rs.2.26 million had been approved to 1,239 beneficiaries up to 30 November 2001.
(vi) Natural death assistance
Rs.5,000/-is paid to the nominee of a registered construction worker who dies from natural causes. The Board approved Rs.5.78 million up to 30 November 2001 for providing these benefits to 993 persons.
In addition to the above-mentioned welfare schemes, the Welfare Board intends to offer scholarships once a year to the children of registered construction workers, the details of which are as follows (in Rs.):
Day scholar Hostel residence
(i) Diploma course 1,000/- 2,000/- (ii) Bachelor’s Degree 1,500/- 1,750/- (iii) BE, MBBS, BVSc 2,000/- 4,000/- (iv) Master’s Degree 4,000/- 6,000/-
Details of income received and welfare benefits approved under various categories as approved by the Board to registered workers from its inception up to 30 November 2001 is given in Annex IV.

8
3. Performance of the scheme: A micro-level analysis
3.1 Preparation and background
The welfare schemes for construction workers implemented by the Board have been evaluated in this study with the help of a sample survey conducted in Chennai City. In the State of Tamil Nadu, there are more than two million construction workers, but of this number only 380,000 (18 per cent) were registered with the Welfare Board as of November 2001. The registered workers in Chennai City came to 91,924 in the same period. Though the Welfare Board began functioning in November 1994, only 6,766 workers (1.8 per cent) have claimed assistance under the scheme since. The total amount of benefits approved up to November 2001 by the Board amounted to only Rs.28.53 million. In order to understand clearly the direction and magnitude of actual assistance extended to registered workers and also to assess the economic impact of the welfare schemes implemented by the Board a micro-level sample survey was conducted in Chennai City. Before beginning the main survey, the draft questionnaire was field tested in a few sample households in Chennai City during November/December 2000, and subsequently modified. The main survey was conducted during the period January – March 2001.
3.2 Scope
This chapter focuses on the main findings of the survey of construction labour households in Chennai City. Though nearly 83,578 workers have been registered with the Board in Chennai City (up to February 2001) benefits have been approved to only 210 workers (at the time of the survey). A vigorous effort was made to cover all the registered workers in the survey, but only 189 could be contacted, mainly due to the migratory nature of this particular labour force. The survey in Chennai City covered 355 labour households (for the questionnaire, see Annex V).
3.3 Results of the survey
The major findings of the survey are grouped according to the social and demographic characteristics of the construction workers, their economic status, employment and income characteristics, the expenditure patterns of labour households and the benefits extended by the Welfare Board. All these characteristics have been studied separately for the five main groups of workers: registered beneficiaries, registered non beneficiaries (who have not applied for any benefits), registered workers who applied for benefits but were rejected, unregistered workers in large constructions, and unregistered workers in small constructions.
3.4 Social and demographic characteristics
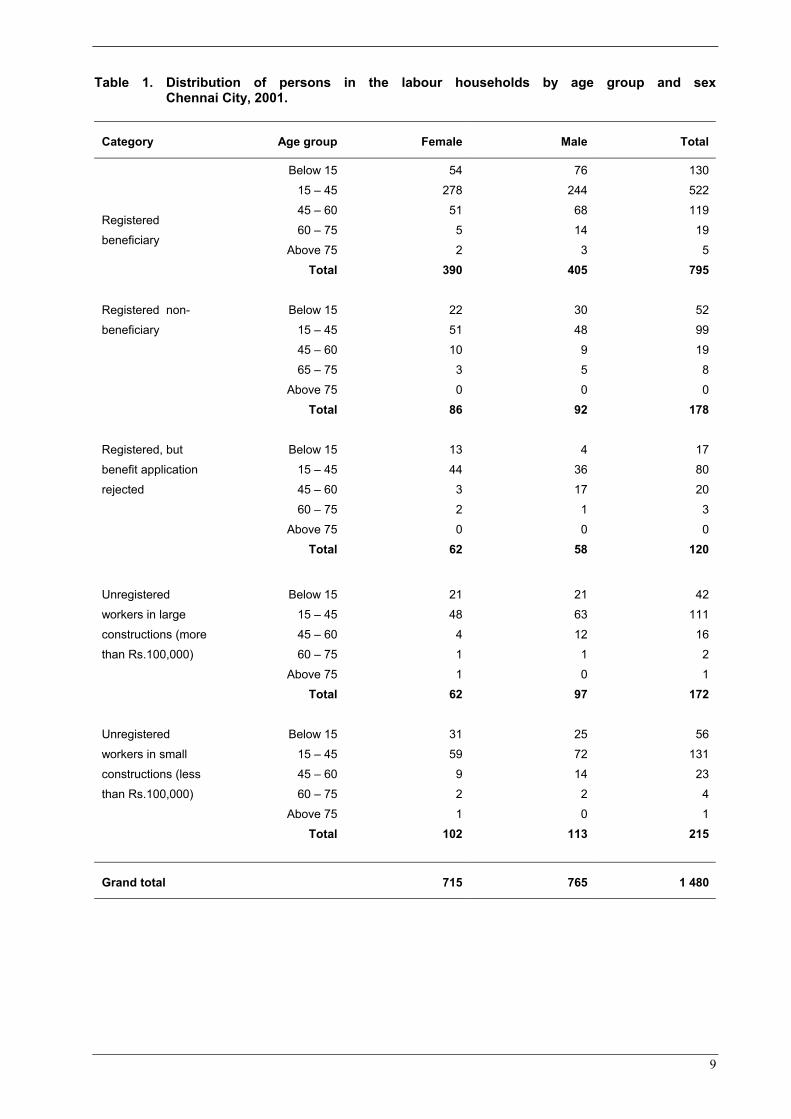
The important demographic information collected through the survey related to the distribution of persons in the construction labour households (category wise) by age group and sex. The combined sex ratio for all categories of households from the survey data was 935. The published official figure of sex ratio for Tamil Nadu is 986, according to 2001 Census. The details are presented below.
9
Table 1. Distribution of persons in the labour households by age group and sex Chennai City, 2001.
Category Age group Female Male Total
Registered beneficiary
Below 15 15 – 45 45 – 60 60 – 75
Above 75 Total
54 278 51 5 2 390
76 244 68 14 3 405
130 522 119 19 5 795
Registered non-beneficiary
Below 15 15 – 45 45 – 60 65 – 75
Above 75 Total
22 51 10 3 0 86
30 48 9 5 0 92
52 99 19 8 0 178
Registered, but benefit application rejected
Below 15 15 – 45 45 – 60 60 – 75
Above 75 Total
13 44 3 2 0 62
4 36 17 1 0 58
17 80 20 3 0 120
Unregistered workers in large constructions (more than Rs.100,000)
Below 15 15 – 45 45 – 60 60 – 75
Above 75 Total
21 48 4 1 1 62
21 63 12 1 0 97
42 111 16 2 1 172
Unregistered workers in small constructions (less than Rs.100,000)
Below 15 15 – 45 45 – 60 60 – 75
Above 75 Total
31 59 9 2 1 102
25 72 14 2 0 113
56 131 23 4 1 215
Grand total 715 765 1 480

10
Other demographic information collected through the survey related to the distribution of persons in the labour households by age group and marital status. Out of 1,480 persons in the 355 households surveyed, 48 per cent are in the never-married category (most of them are below the 15 to 45 age group) and 46 per cent are currently married. The remaining 6 per cent come under the group widowed, divorced or separated. The details are presented in the following table.
Table 2. Distribution of persons in the labour households by age group and marital status (Chennai City, 2001)
Marital status/age group
Registered beneficiary
Registered non-
beneficiary
Registered but benefit application
rejected
Unregistered workers (large constructions)
Unregistered workers (small constructions)
Total
Never married below 15 15 – 45 >45 Total
129 250 1 380
52 38 -- 90
17 37 --
54
39 39 --
78
56 51 1 108
293 415 2 710
Married below 15 15 – 45 >45 Total
1 233 114 348
-- 59 20 79
-- 40 19 59
3 71 15 89
-- 80 19 99
4 483 187 674
Widowed/ divorced/ separated below 15
15 – 45 >45 Total
-- 39 28 67
-- 2 7 9
-- 3 4 7
-- 1 4 5
-- --
8 8
-- 45 51 96
Total 795 178 120 172 215 1 480
Notes: -- = nil.
There is a widely held belief that workers in the unorganized sector are educationally backward, and this actually prevents them from acquiring better skills to improve their income levels. The primary data collected through the survey of construction labour households does not confirm this view since the literacy rate worked out from the survey results was 76 per cent (both males and females combined), whereas the 2001 census data showed the literacy rate for Tamil Nadu as 73 per cent. Therefore, the literacy rate for the construction worker households is slightly better than the State average. The details of educational status obtained from the survey are presented below.

11
Table 3. Distribution of persons in the labour households by sex and educational status (Chennai City, 2001)
Educational status
Registered beneficiaries
Registered non-
beneficiaries
Registered but benefit application
rejected
Unregistered workers (large constructions)
Unregistered workers (small constructions)
Total
Illiterate* Female Male
156 116 40
43 28 15
20 15 5
64 38 26
51 33 18
334 230 104
Up to SSLC Female Male
500 186 284
107 48 59
73 36 37
81 27 54
139 57 82
900 354 516
Graduate and below SSLC Female Male
106 46 60
6 1 5
19 6 13
2 -- 2
5 3 2
138 56 82
Post graduate/ professional degrees and others Female Male
12 2 10
-- -- --
2 -- 2
2 1 1
-- -- --
16 3 13
Total 1 388
Literacy rate 76%
Note: -- = nil; SSLC = Senior school leaving certificate. *Illiterate includes children over the age of six who do not go to school.
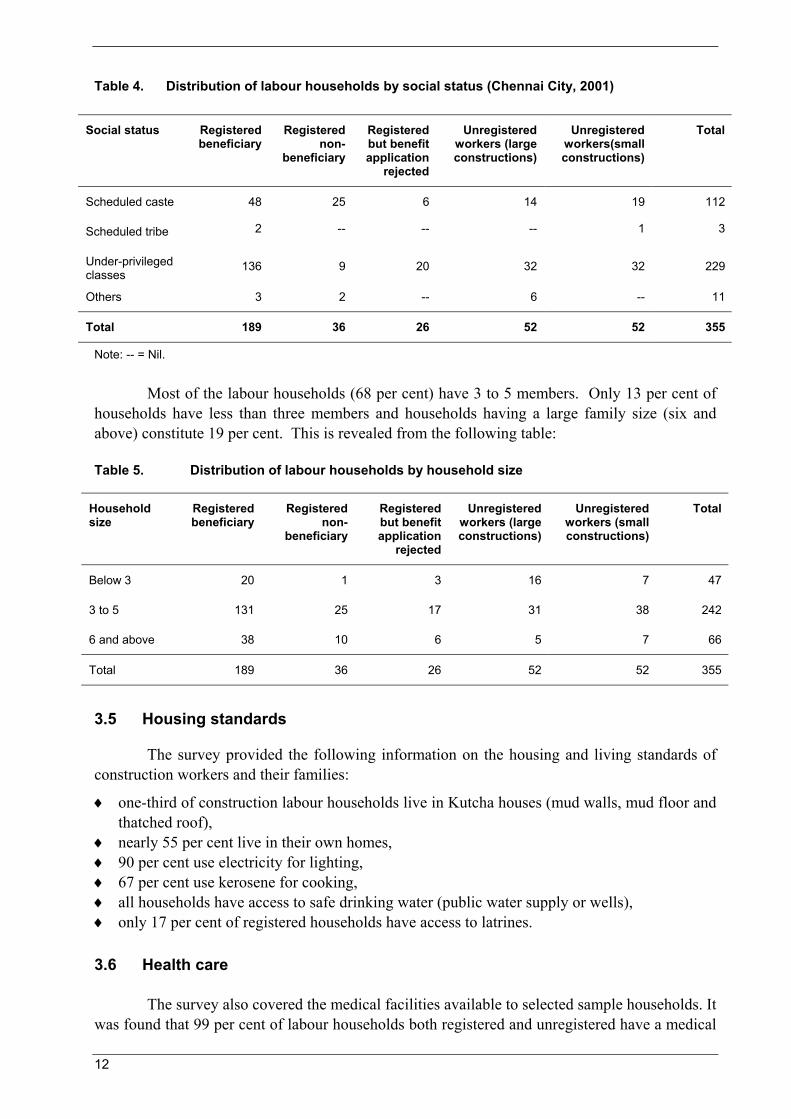
Construction workers come from the socially under-privileged and economically poor strata of society. Out of 355 labour households selected at random for the survey, 32 per cent belonged to Scheduled Caste and Scheduled Tribe families, 65 per cent to other under-privileged classes and 3 per cent to other communities including Christians and Muslims, as shown in the table below.
12
Table 4. Distribution of labour households by social status (Chennai City, 2001)
Social status Registered beneficiary
Registered non-
beneficiary
Registered but benefit application
rejected
Unregistered workers (large constructions)
Unregistered workers(small constructions)
Total
Scheduled caste 48 25 6 14 19 112
Scheduled tribe 2 -- -- -- 1 3
Under-privileged classes
136 9 20 32 32 229
Others 3 2 -- 6 -- 11
Total 189 36 26 52 52 355
Note: -- = Nil.
Most of the labour households (68 per cent) have 3 to 5 members. Only 13 per cent of households have less than three members and households having a large family size (six and above) constitute 19 per cent. This is revealed from the following table:
Table 5. Distribution of labour households by household size
Household size
Registered beneficiary
Registered non-
beneficiary
Registered but benefit application
rejected
Unregistered workers (large constructions)
Unregistered workers (small constructions)
Total
Below 3 20 1 3 16 7 47
3 to 5 131 25 17 31 38 242
6 and above 38 10 6 5 7 66
Total 189 36 26 52 52 355
3.5 Housing standards
The survey provided the following information on the housing and living standards of construction workers and their families:
♦ one-third of construction labour households live in Kutcha houses (mud walls, mud floor and thatched roof),
♦ nearly 55 per cent live in their own homes, ♦ 90 per cent use electricity for lighting, ♦ 67 per cent use kerosene for cooking, ♦ all households have access to safe drinking water (public water supply or wells), ♦ only 17 per cent of registered households have access to latrines.
3.6 Health care
The survey also covered the medical facilities available to selected sample households. It was found that 99 per cent of labour households both registered and unregistered have a medical

13
facility at an accessible distance (less than 2 km.). A large majority of construction workers preferred the allopathy system to other branches of treatment.
3.7 Economic status of the construction labour households
The economic status of construction labour households is analysed basically by three main factors, for which data was collected through the survey, namely:
(i) activity status, (ii) source of income, and (iii) consumption expenditure by broad groups. First, the distribution of persons in the selected labour households by activity status is presented in the Table 6.
The information presented in the above table shows that out of 1,480 persons covered by the survey in 355 households, 632 (43 per cent) are gainfully occupied. Of these, 90 per cent are engaged in non-agricultural pursuits (self-employed, helpers or casual labourers). The remaining 10 per cent are in regular (salary/wage) employment. Of the total work force in the surveyed-labour households, 11 per cent are unemployed. Of the total female population in the selected households, students make up nearly 22 per cent and 45 per cent are engaged in household work.
The source of income and the amount received as wages are important factors that determine the economic status of the construction-labour households. The main source of income of labour households is non-agriculture either as self-employed or as casual-wage labourers and slightly more than 80 per cent of their total income is from this source. Other sources are mainly rental, remittances and interest earned. The distribution of persons in labour households by source of income is presented below.
The conclusion that can be drawn from the data in Table 7 is that the monthly per capita income level (for the reference period) is the lowest in the case of registered beneficiaries (Rs.1,406/-), while it is the highest in the case of unregistered workers in small constructions (Rs.1,770/-). The average monthly income of all the earning members in the 355 labour households surveyed amounts to Rs.1,525/-. This income level is relatively high when compared to other employments in the unorganized sector of Tamil Nadu because they tend to find regular daily work and their rate of earning is generally higher than in other occupations.
The third and the most important indicator of economic welfare is the monthly per capita consumption expenditure. In the survey of 355 labour households of various categories conducted in Chennai City, monthly consumption expenditure for food and non-food items was analysed. The details are presented in the table below.

14
*Includes the old, the disabled, those too young to work or attend school, and pensioners.
**RB: Registered beneficiary; RN: Registered non-beneficiary; RR: Registered but benefit application rejected; UL: Unregistered workers in large constructions (over Rs.100,000); US: Unregistered workers in small constructions (under Rs.100,000).
Table 6:
Category Activity status Female Male Total
Regular-salary and wage-employed 10 23 33Unemployed 10 32 42Students 90 117 207Household work 178 0 178Others 19 21 40Total 390 405 795
Regular-salary and wage-employed 2 7 9Unemployed 5 8 13Students 15 21 36Household work 36 0 36Others 11 18 29Total 86 92 178
Regular-salary and wage-employed 3 6 9Unemployed 0 5 5Students 8 10 18Household work 34 0 34Others 8 2 10Total 62 58 120
Casual-wage labourers in non-agriculture 28 66 94Regular-salary and wage-employed 2 4 6Unemployed 5 5 10Students 9 6 15Household work 19 0 19Others 12 16 28Total 75 97 172
Casual-wage labourers in non-agriculture 13 67 80Regular-salary and wageemployed 2 5 7Unemployed 0 7 7Students 27 23 50Household work 52 0 52Others* 8 11 19Total 102 113 215
295
55
44
Distribution of persons in the labour households by sex and activity status (Chennai City, 2001)
9 35
Self-employed in non-agriculture, including helpers and casual-wage labourers
Self-employed in non-agriculture, including helpers and casual-wage labourers
Self-employed in non-agriculture, including helpers and casual wage labourers
83 212
17 38
US
RB**
RN
RR
UL

15
Table 7. Distribution of persons in labour households and monthly per capita income (Chennai City, 2001) (in Rs. million)
Category of labour households
Registered beneficiaries
Registered non-
beneficiaries
Registered but benefit
application rejected
Unregistered workers (large constructions)
Unregistered workers (small constructions)
Source of income
No.
Per capita
income
No.
Per capita
income
No.
Per capita
income
No.
Per capita
income
No.
Per capita
income
Self-employment in non-agriculture
282
1 510
54
1 611
42
1 690
93
1 624
80
1 800
Regular salaries and wages
49
1 184
11
1 636
13
1 615
7
1 428
7
1 428
Rentals, remittances, interest, etc.
43
977
--
--
--
--
--
--
--
--
Total 374 1 406 65 1 615 55 -- 100 1 610 87 1 770
Note: -- = Nil.
The data in Table 8 reveals that expenditure on food items varied from 62 to 70 per cent in respect of various categories of labour households. Expenditure on non-food items in all categories of labour households is below 30 per cent of the total consumption expenditure. Under non-food items, expenditure on education and health constitute only 9 to 13 per cent of the total. It is interesting to note that among all the categories, registered-beneficiary households incur the maximum amount for medical and education expenses (13 per cent). Monthly per capita consumer expenditure worked out for various categories of labour households revealed that unregistered workers in large constructions have the highest (Rs.752/). Per capita expenditure is the lowest in registered non-beneficiary households (Rs.507/-). The per capita monthly expenditure is often used to decide whether a particular household comes under the poverty line. The group appointed by the Government recommended that for 1993-94 the rural poverty line in Tamil Nadu should be Rs.196.33 per capita expenditure per month and Rs.296.63 per month for urban areas. If this estimate is adjusted for price changes, its equivalent for 2001 will come to Rs.550/- and thus it can be concluded that the five categories of labour households are close to the official poverty line.

16
Table 8. Structure of consumer expenditure (Chennai City, 2001) (in percentages)
Category of labour households
Items/consumption expenditure
Registered beneficiary
Registered non-beneficiary
Registered but benefit
application rejected
Registered worker (large
constructions)
Registered worker (small
constructions)
No. of persons 795 178 120 172 215
Cereals, pulses, vegetables, etc.
38.8 37.2 43.4 37.5 39.8
Pan, tobacco, beedi, etc.
1.4 1.8 1.7 2.7 2.6
Intoxicants and liquor
2.0 4.1 3.4 1.8 3.7
Other food items 19.7 24.9 21.4 25.5 21.2
Total food items 61.9 68.0 69.0 67.5 67.3
Medical expenses 1.7 2 1.7 2.4 1.7
Education 3.7 1.2 2 1.1 1.5
Non-food items 32.8 28.8 26.9 31 29.5
Total non-food items
38.1 32 31 34.5 32.7
Total consumer expenditure (Rs.) 455 785 90 290 75 998 129 368 135 273
Per capita consumer expenditure (Rs.)
573 507 633 752 629
3.8 The functioning of the Welfare Board
The primary function envisaged by the Board is to encourage construction workers to register. In practice however, the majority of registrations are sponsored by trade unions who send to the Board the completed applications for registration, in which manner 168 out of 189 workers were registered. It is not compulsory for a worker to be present in the Board office at the time of registration but this non-presence may lead to malpractices, which could affect workers adversely.
Nevertheless the survey revealed that most households contacted (213 out of 251) realized that registration was voluntary and there was a high degree of awareness among construction workers regarding the benefits to be provided after registration.

17
Table 9. Distribution of registered beneficiaries according to source of information for registration (Chennai City, 2001)
Category Source of information No. of families reporting
Registered beneficiary Contractor 13
Trade unions 168
Others 1
Source not reported 7
Total 189
Registered non-beneficiary Trade unions 36
Contractor 2
Trade unions 24
Registered but welfare benefits rejected
Total 26
The survey also revealed the excess cost incurred by the construction workers in registration fees, as well as renewal fees collected by trade unions. The fee charged by the Welfare Board for registration of their workers is Rs.25/-. A fee of Rs.10/- has also to be paid at the time of renewal of registration after the expiry of two years. In practice, it is found from the survey data that only 9 per cent of the beneficiaries contacted paid the correct fee of Rs.25/- as is revealed from the Table 11.
Table 10. Distribution of registered beneficiaries according to reason for registration (Chennai
City, 2001)
Household reporting reasons
Category Compulsion Voluntary Reason not reported
Total
Registered beneficiary 27 155 7 189
Registered
non-beneficiary 0 36 0 36
Registered but application for welfare benefits rejected
4 22 0 26
Total 31 213 7 251
18
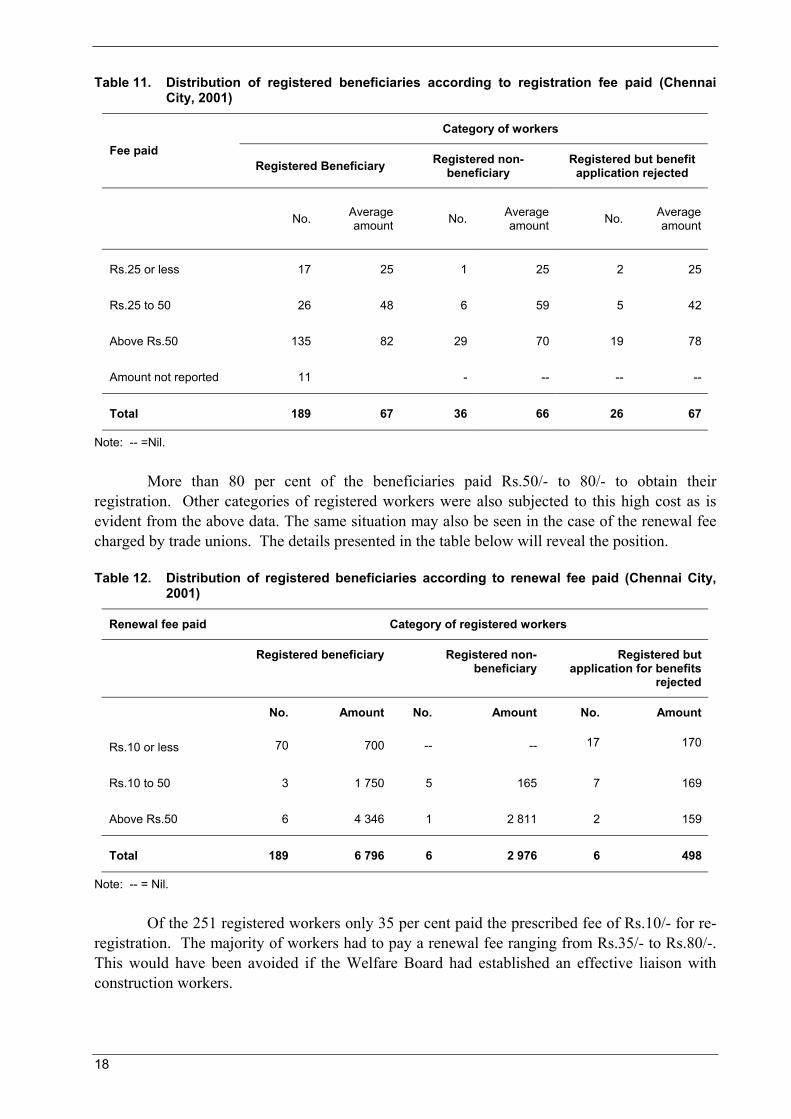
Table 11. Distribution of registered beneficiaries according to registration fee paid (Chennai City, 2001)
Category of workers
Fee paid Registered Beneficiary Registered non-
beneficiary Registered but benefit
application rejected
No. Average
amount No. Average amount No. Average
amount
Rs.25 or less 17 25 1 25 2 25
Rs.25 to 50 26 48 6 59 5 42
Above Rs.50 135 82 29 70 19 78
Amount not reported 11 - -- -- --
Total 189 67 36 66 26 67
Note: -- =Nil.
More than 80 per cent of the beneficiaries paid Rs.50/- to 80/- to obtain their registration. Other categories of registered workers were also subjected to this high cost as is evident from the above data. The same situation may also be seen in the case of the renewal fee charged by trade unions. The details presented in the table below will reveal the position.
Table 12. Distribution of registered beneficiaries according to renewal fee paid (Chennai City, 2001)
Renewal fee paid Category of registered workers
Registered beneficiary Registered non-beneficiary
Registered but application for benefits
rejected
No. Amount No. Amount No. Amount
Rs.10 or less 70 700 -- -- 17 170
Rs.10 to 50 3 1 750 5 165 7 169
Above Rs.50 6 4 346 1 2 811 2 159
Total 189 6 796 6 2 976 6 498
Note: -- = Nil.
Of the 251 registered workers only 35 per cent paid the prescribed fee of Rs.10/- for re-registration. The majority of workers had to pay a renewal fee ranging from Rs.35/- to Rs.80/-. This would have been avoided if the Welfare Board had established an effective liaison with construction workers.

19
3.9 Welfare benefits approved by the Board
Though the total number of registrations in Chennai City was 91,924 as of November 2001, the total number of beneficiaries (those who have obtained any kind of monetary benefit) was only 210 at the time of the survey, which is less than 0.3 per cent. The survey covered 186 beneficiaries and the type and amount of welfare benefits obtained by them are presented in the following table.
The amount of benefits approved to registered workers in Chennai City up to February 2001 as revealed from the survey is meagre when compared to the registration fee and renewal fee collected by the Welfare Board. Furthermore, over 90 per cent of the welfare benefits approved are in three categories: educational assistance, marriage assistance and natural death assistance. Though women workers constitute a large number only one claim for maternity benefit was approved, and other programmes such as providing crèches, a provident fund and a pension scheme have not been implemented.
Table 13. Distribution of beneficiaries according to nature of benefits received and the amount obtained (Chennai City, 2001)
Nature of benefit
Number of persons
Amount obtained (Rs)
Average amount per beneficiary (Rs)
1. Fatal accident 2 202 000 101 000
2. Non-fatal accident 6 395 000 65 833
3. Educational assistance 56 53 750 960
4. Marriage assistance 78 88 000 1 128
5. Maternity benefit 1 2 000 2 000
6. Funeral assistance 5 12 000 2 400
7. Natural death assistance 38 292 500 7 697
8. Other benefits -- -- --
Total 186 1 045 250 --
Note: -- = Nil.
Nevertheless, nearly 80 per cent of the registered workers interviewed in the course of the survey expressed their satisfaction with the welfare benefits provided. This is revealed as per the data furnished below.

20
Table 14. Distribution of registered beneficiaries according to the satisfaction of welfare benefits (Chennai City, 2001)
Category Not satisfied Satisfied Not reported Total
Registered beneficiary 33 151 5 189
Registered non-beneficiary 7 29 0 36
Registered but application for welfare benefits declined
13 13 0 26
Total 53 193 5 251
The registered beneficiaries did point out, however, that there was a delay in receiving the welfare benefits after approval. In the course of the survey, 34 cases were detected and the details are provided in the following table. Table 15. Registered workers for whom benefits have been approved but not received for the
last year (up to February 2001) (Chennai City, 2001)
Name of benefit approved No. of Beneficiaries Amount approved but not received (Rs)
i. Educational assistance 10 11 000
ii. Marriage assistance 14 14 000
iii. Maternity benefit 1 2 000
iv. Funeral assistance 1 500
v. Natural death assistance 8 44 500
Total 34 72 000
3.10 Unregistered workers
The survey covered a small sample of unregistered workers working in both large and small constructions. The details presented in the previous sections show that unregistered workers are in no way less privileged in the matter of housing conditions, education, wages and per capita consumption than their registered counterparts. In other words the registered beneficiaries are so insignificant in number and the amount of benefit obtained so small that it does not produce any visible impact on their standard of living.

21
4. The main challenges faced by the Welfare Fund
The need for social security for the workers in the unorganized sector and its justification from the point of view of equity and social justice are well recognized in the current literature on labour welfare. Jobs in this sector are basically unprotected and outside the scope of labour legislation on minimum wages, safety and health and other benefits. Many of these jobs are casual and insecure and the conditions of the workers, in most cases, are quite deplorable. The supplementary income available through social security alleviates bare-minimum living standards during their participation in the labour force, while retirement benefits provide some income support after retirement. This situation necessitated government intervention, and welfare fund schemes for workers in the unorganized sector emerged against this background. The introduction of these schemes necessitated a contribution from employers, workers and government.
After the Welfare Fund for Constructions Workers in Tamil Nadu was established in 1994, a series of welfare funds were started in the late 1990s exclusively for workers in the unorganized sector and nine such funds are now in operation for various categories of workers. The extent to which the welfare fund system provides an effective form of social security for construction workers in Tamil Nadu has been discussed in chapter 3 with the help of primary data generated through a micro-level survey in Chennai City. Chapter 4 is mainly focused on the source of funds available to the Welfare Board for financing various welfare programmes and the problems relating to fund management.
The main sources of funds available to the Welfare Board are the registration fee collected from every worker at the rate of Rs.25/- and the renewal fee of Rs.10/- collected every two years. The registration fee is deposited with the United India Insurance Company as a premium for life insurance of the workers registered. Apart from this, the Welfare Board pays Rs.25/- annually to the insurance company as a renewal premium for the life insurance of the registered workers, even though only Rs.10/- is collected from every registered worker after the expiry of two years from the date of registration. Hence this amount is a recurring additional financial burden for the Welfare Board. Only compensation for fatal and non-fatal accidents is paid by the insurance company. All other benefits such as those for education, marriage, maternity, etc., are paid from a levy collected employer contributions. With effect from 1 July 1997, this levy was increased from 0.1 to 0.3 per cent of the total estimated cost of the building or construction work. Though private constructions and autonomous bodies remit this levy without much difficulty, there are considerable problems in obtaining it from government organizations. The Secretary to the government Labour Department conducts review meetings periodically with heads of departments and other officials involved to expedite the remittance of this statutory contribution to the Welfare Fund. In spite of all these efforts, the Welfare Board could only collect a portion of the employer contribution due to them. Up to 30 November 2001, the amount collected from the employers came to Rs.383.54 million. There is considerable potential to enhance this source of revenue provided the Government takes effective action against defaulters in both the Government and public sector.
The revenue and expenditure figures relating to Kerala and Tamil Nadu are not comparable since the volume of construction activity differs considerably. The employer contributions also differ and the collection efficiency in Kerala is much higher since this state started its welfare fund programme as early as the 1970s.
22
The limitations in the effective implementation of welfare schemes can be broadly summarized as:
♦ A very low level of registration among construction workers, ♦ Weaknesses in financial management, and ♦ Failure to collect employers’ contribution fully and on time.
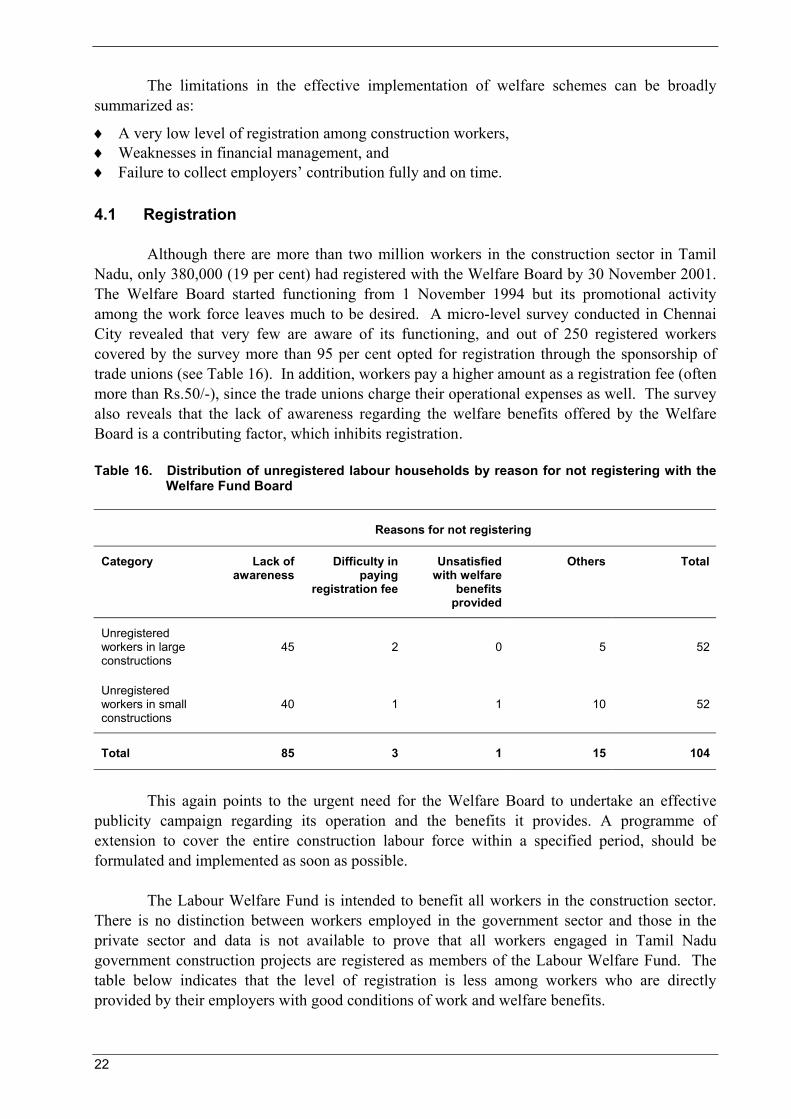
4.1 Registration
Although there are more than two million workers in the construction sector in Tamil Nadu, only 380,000 (19 per cent) had registered with the Welfare Board by 30 November 2001. The Welfare Board started functioning from 1 November 1994 but its promotional activity among the work force leaves much to be desired. A micro-level survey conducted in Chennai City revealed that very few are aware of its functioning, and out of 250 registered workers covered by the survey more than 95 per cent opted for registration through the sponsorship of trade unions (see Table 16). In addition, workers pay a higher amount as a registration fee (often more than Rs.50/-), since the trade unions charge their operational expenses as well. The survey also reveals that the lack of awareness regarding the welfare benefits offered by the Welfare Board is a contributing factor, which inhibits registration.
Table 16. Distribution of unregistered labour households by reason for not registering with the Welfare Fund Board
Reasons for not registering
Category Lack of awareness
Difficulty in paying
registration fee
Unsatisfied with welfare
benefits provided
Others Total
Unregistered workers in large constructions
45 2 0 5 52
Unregistered workers in small constructions
40 1 1 10 52
Total 85 3 1 15 104
This again points to the urgent need for the Welfare Board to undertake an effective publicity campaign regarding its operation and the benefits it provides. A programme of extension to cover the entire construction labour force within a specified period, should be formulated and implemented as soon as possible.
The Labour Welfare Fund is intended to benefit all workers in the construction sector. There is no distinction between workers employed in the government sector and those in the private sector and data is not available to prove that all workers engaged in Tamil Nadu government construction projects are registered as members of the Labour Welfare Fund. The table below indicates that the level of registration is less among workers who are directly provided by their employers with good conditions of work and welfare benefits.

23
4.2 Financial management
The present practice followed by the Welfare Board is to remit the entire registration fee collected as a life insurance premium to the United India Insurance Company. In addition, Rs.25/- is paid annually as a renewal premium to the insurance company for each construction worker. In this context, it should be noted that the Board collects only Rs.10/- per worker as a renewal fee every two years. This is an additional financial burden for the Welfare Board. If an analysis is made of the insurance premium and renewal premium paid by the Welfare Board every year compared with the compensation paid by the insurance company as indicated in the table below, it can be seen that the latter accounted for less than 30 per cent of the amount paid as premium for the period 1995-96 to 1998-99.
Table 17. Unregistered workers: Conditions of work and welfare benefits obtained from the contractor/employer (Chennai City, 2001)
Category Conditions of work Welfare benefits obtained
Satisfactory Not satisfactory Yes No
Unregistered workers in large constructions
48 4 21 31
Unregistered workers in small constructions
38 14 0 52
Total 86 18 21 83
Table 18. Details of insurance premium and renewal premium paid and compensation received for fatal and non-fatal accidents (in Rs.)
Year Insurance premium and renewal premium paid by the Welfare Board
Compensation for fatal and non-fatal accidents received
1995-96 548 650 77 500
1996-97 656 450 207 000
1997-98 1 801 552 403 750
1998-99 3 520 650 937 500
1999 5 297 550 2 600 000
2001 7 431 400 7 260 000
Total 19 256 252 10 945 000
24
In this context, the method adopted by the Kerala Construction Workers’ Welfare Fund Board is more sensible and beneficial. In Kerala the entire registration fee is kept with the Board and there is no renewal fee charged. Instead every registered worker has to pay a monthly subscription of Rs.20/-. The payment can be made through a commercial bank or cooperative bank offices in each district where an account is opened in the name of a registered worker. Payments made by the worker each month are recorded in a passbook issued by the Board. The registered worker can obtain benefits approved by the Welfare Board only if the monthly contribution is paid promptly. Defaulters may not receive benefits from the Board. Thus, all the remittance made by the registered worker, either as registration fee or as monthly subscription (no renewal fee is charged in Kerala) are deposited in the accounts of the Welfare Fund, and all the benefits paid to the registered workers are from these deposits. There is no life insurance for the workers in Kerala but compensation for fatal and non-fatal accidents is paid directly by the Welfare Board. This arrangement is more beneficial. The Kerala Board collects nearly Rs.130 million annually from members as subscriptions and registration fees. At present, the Board has a deposit of approximately Rs.1,000 million. The Tamil Nadu Welfare Board could similarly charge a monthly subscription of Rs.20/- from every registered worker and keep the entire proceeds of this account instead of remitting the same to the insurance company. The practice of insuring the life of every registered worker followed by Tamil Nadu Welfare Board may be discontinued and the arrangement with the insurance company terminated. Urgent action in this matter is essential for improved financial management of the existing scarce resources.
4.3 Effective mobilization of employer contributions
Up to November 2001, Rs.383.54 million has been received as employer contributions and most (70 per cent) comes from corporations, municipalities and panchayats.
The remittances made under section 8A of the Tamil Nadu Manual Workers Act of 1982 revealed that the amount remitted by government departments and public undertakings for construction work are too meagre when compared with similar remittances made by local authorities and private bodies. The Government of Tamil Nadu convened frequent meetings with concerned officials to explore the possibility of improving collection due from government departments. The objectives of these meetings were:
(i) To identify the operational difficulties involved in the collection of the amount due to the Tamil Nadu Welfare Board.
(ii) To discuss and finalize the modalities for ensuring that all the money due to the fund is remitted fully and in time by government departments and government undertakings.
In Tamil Nadu, the levy collected as employer contributions is at present only 0.3 per cent of the total estimated cost of construction, while in Kerala it is 1 per cent. Here too considerable difficulty is experienced in collecting dues from employers and only a portion of the actual potential of this source is being realized. A comparative statement of employer contributions obtained by the Kerala and Tamil Nadu Welfare Boards is presented below.

25
Table 19. Contributions collected from employers (Rs. million)
Year Tamil Nadu Board Kerala Welfare Board
1997-1998 28.30 87.90
1998-1999 62.18 87.17
1999-2000 89.10 120.73
2000-2001 108.02 119.89
It can be gathered from the above data that considering the magnitude of construction activities undertaken in Tamil Nadu only a very small portion of the actual potential from this source is now being realized by the Welfare Board. The possibility of increasing the employer contributions to 1 per cent of the cost of construction (as in Kerala) may also be explored. The Central Act, which came into effect from March 1996 permits collection of 1 per cent as employer contributions and there is no valid reason to forego the additional revenue. The present surplus is inadequate. When the membership of the Welfare Fund increases, unless the rate of contribution is increased as well, it will not be possible to provide adequate welfare benefits to the members. Moreover, the impact of raising the rate of contribution is borne by the contractors/construction agencies that can afford this increase. The Board should also identify the operational difficulties involved in the collection and remittance of the amount due to them. Only a few government agencies and related institutions in Tamil Nadu remit their share partially, which amounted to Rs.383.5 million as of 30 November 2001. Against this collection the benefits offered by the Welfare Board to registered workers amounted to Rs.28.53 million (7 per cent). Annual employer contributions and welfare benefits (other than those paid by the United India Insurance Company for fatal and non-fatal accidents) offered by the Board are presented in the table below.
Table 20. Employer contributions and welfare benefits (in Rs. million)
Year Employer contributions
received
Welfare benefits approved
1.11.1994 to 31.3.1997 9.02 --
1997-98 28.30 0.01
1998-99 62.18 0.06
1999-2000 89.10 0.49
2000-2001 108.01 6.78
2001-2002 (up to November)
86.92 5.39
Total 383.53 12.727

26
The above data shows that the Welfare Board is unnecessarily keeping a huge amount of employer contributions, which represent their statutory obligations for labour welfare. The benefits approved were only Rs.12.73 million, approximately 2.5 per cent of the total amount of employer contributions. The Board can consider extending the range and level of welfare benefits (pensions, crèche, etc.).
The surplus revenue in the fund is invested in fixed deposits in banks yielding a reasonable return, which is added to the accumulated revenues of the fund. In the Indian situation there are very few investment options. Mutual funds and stocks, which are the usual investment avenues in developed countries, are generally not considered safe or dependable in India, especially when the welfare funds include contributions from poor workers. The surplus revenue available with the fund is invested in bank deposits and the returns obtained are added to the revenues of the fund. Interest accrued on investments made by the Board up to 30 November 2001 is indicated below.
♦ Interest earned up to 31 March 2001 - Rs. 23.43 million ♦ From 1.4.2001 to 30 November 2001 - Rs. 19.52 million
Total - Rs. 42.95 million
4.4 Future policy options
Welfare funds in future will have to operate on a more uniform basis. The funds should offer benefits in return for specific contributions from workers. In restructuring the benefits, it will be important to find out the priority social security needs of workers. It is also necessary to rationalize the administration of the funds. It may also be considered whether the creation of new welfare funds is the most effective way of providing social security to the unorganized sector in future. Contributions from workers reflect their participation and attract a higher degree of accountability on the part of managers of the fund since members would have a right to demand benefits and services. When the objective is to make coverage universal and target an organized labour force with shifting jobs, it may be better to try out schemes on an area- based approach rather than on a model based on occupation or employment.
The idea of an area-based social insurance scheme stems from the same concern as was experienced in the setting up of labour welfare schemes. The majority of workers in the unorganized sector is not covered by statutory social security programmes because the workers do not have a clear employer–employee relationship. In addition, many workers in this sector have seasonal and temporary jobs. These two problems cannot be fully addressed through the setting up of welfare funds or through social assistance programmes. Welfare funds cater to workers in certain occupations and sectors, while the social assistance programme is appropriate for those below the poverty line. Hence the need for initiating an area- based approach to begin with, on a pilot or experimental basis. The area-based approach is thus suggested as a future policy option. Successful area-based schemes are yet to be established in India.

27
5. Conclusions and recommendations
(1) The main limitation of The Welfare Fund is its very low coverage of members. Though the Board started functioning from 1994, its total registered membership as of April 2001 was only 380,000 (18 per cent) out of a total of two million construction workers in the State. It may be noted in this context that the Kerala Welfare Board, which began in 1991, had covered 65 per cent of its total work force by early 2001.
(2) Less than 2 per cent of the registered workers received a benefit (6,761 out of 380,000) up to November 2001. In comparison, out of 980,000 workers registered with the Kerala Board, nearly 80 per cent have received some benefit during its ten years of operation.
(3) The administrative expenses of the Tamil Nadu Board in implementing its various schemes have been moderate (less than 12 per cent of income) while the administrative expenditure incurred by the fund in Kerala is even lower, at only 8 per cent.
(4) Applications for registration are presented by trade unions on behalf of workers and it is possible that this might result in the registration of ineligible workers. This might be against the interests of eligible members. In this context, it is recommended that proper care should be taken to screen members for registration, as in Kerala, to avoid possible malpractices. In Kerala, the worker has to appear in person to obtain registration. If the authority concerned is satisfied that the applicant has complied with the provisions of the scheme, the worker is registered and at which time has to make a monthly contribution of Rs.20/- to the Welfare Board.
(5) Athough women constitute 35 per cent of the construction labour force claims for maternity benefits are negligible.
(6) Since most members are registered through their trade unions, construction workers have to incur the extra expenditure charged by the unions.
(7) It is recommended that the present practice of remitting the entire registration fee collected as well as the renewal fee to the United India Insurance Company be discontinued and this amount retained by the Board. As of 30 November 2001, the Board has paid a total amount of Rs.21.37 million as insurance and renewal premiums to the New India Insurance Company, but the compensation paid to registered workers for fatal and non-fatal accidents during the same period was only Rs.15.79 million. The Kerala Welfare Board however, has no arrangement with any insurance company for insuring the life of registered workers. Instead the amount received as registration fees is kept by the Welfare Board, which provides compensation of nearly Rs.10 million annually for fatal and non-fatal accidents. It is suggested that the same practice be followed in Tamil Nadu. The Group Personal Accident Scheme as adopted by the Board at present is not cost-effective since the premium paid is more than the compensation given. If, however, the Welfare Board keeps the entire premium, compensation for death/work injury could be paid from the funds collected.
(8) The statutory contribution made by employers under Section 8A of the Tamil Nadu Construction Workers Act of 1982, is the main source of income for the Tamil Nadu Welfare Board to provide benefits to its registered members. By this Act, the Government and private organizations or individuals undertaking construction work must pay 0.3 per cent of the cost of construction to the Board. However, government institutions (both central and the state) only partially pay their share and thus only Rs.383 million has been
28
collected between 1994 and 2001. (This compares unfavourably with Kerala where, in spite of a lower level of construction activity, the Welfare Board has been able to collect between Rs.110 and 120 million each year annually as employer’s contribution). It is therefore suggested that the employer contribution rate could be increased to 1 per cent if the following two conditions are met: (i) there is in-depth study done on the reasons for the large current surplus of the fund, and (ii) there is a clear plan about how the current surplus and the increased future resources will be used for greater coverage and improved benefits. With increased resources, new benefits, such as pensions and house-building advances, may be provided. The impact of raising the rate of contribution will be borne by the contractors/construction agencies that can afford this increase.
(9) A micro-level survey of construction-labour households in Chennai City revealed that:
♦ among registered beneficiaries, 80 per cent had good housing conditions compared with only 65 per cent of the unregistered.
♦ nearly all households use electricity for lighting and most use kerosene for cooking.
♦ all households have access to sate water and 75 per cent of registered households have latrine facilities.
♦ the literacy rate among registered households is 79 per cent compared with 67 per cent for unregistered households.
♦ of the households surveyed, 45 per cent of the members were gainfully occupied, less than 10 per cent were unemployed, 22 per cent of the occupants were students, 45 per cent of the females were engaged in household work and 8 – 9 per cent were old or disabled.
(10) As regards the per capita consumption expenditure of labour households, 62 to 68 per cent is spent on food items (a typical feature noticed in lower-income categories or families below the poverty line). There is not much difference between the registered and the unregistered as regards expenditure on food items (between Rs.600/- – 700/-). The poverty line estimate for Tamil Nadu for urban areas is a per capita expenditure of Rs.296.63 per month (93-94 price level). If this estimate is adjusted for price changes, its equivalent for 2001 will come to slightly more than Rs.550/-. Thus all labour households are close to the official poverty line estimate.
(11) The survey revealed that the motivation for a construction worker to register came from trade unions. More than 90 per cent of the registrations are voluntary and the workers are aware of the benefits offered by the Welfare Board. But this awareness is mostly due to the briefing given by the trade unions rather than through publicity by the Welfare Board. Trade unions levy charges from workers for registration and more than 80 per cent of the workers registered had to pay an amount ranging from Rs.50/- to Rs.90/-(against the official rate of Rs.25/-). The same situation exists in the case of payment of renewal fees.
(12) Regarding welfare benefits approved by the Board, it is revealed from the survey that out of 91,924 registered members (up to November 2001) in Chennai City, less than 200 obtained any kind of monetary benefit (February, 2001). The survey also shows the level of benefits provided is very low compared with the registration and renewal fee collected by the Welfare Board. It is also evident from the survey results that the benefits approved are only of three types: educational assistance, marriage assistance and natural death assistance. In the course of discussion with the survey team, the registered beneficiaries

29
pointed out the undue delay in getting the welfare benefits approved from the Board. It was found that 34 such cases have been reported in the survey and the benefits approved amounted to Rs.72,000/-. It is concluded that the registered beneficiaries are so insignificant in number and the quantum of benefits obtained too small as to produce any significant impact on their standard of living. In comparison, the Kerala Welfare Board provides benefits to members in respect of pensions, scholarships to children, home building advance, medical assistance, tool purchase and loans etc.
(13) There is a need to integrate the numerous welfare funds in the interests of increased efficiency and cost effectiveness. A single compact Board with representation to major sectors of employees and a unified administration at district level would be able to ensure quicker delivery of benefits and services. The rates of contribution and the levels of benefits would differ from scheme to scheme. In view of this special care would be needed to establish a uniform base of benefits in the integrated scheme. Any proposal for a new welfare fund would have to be preceded by an actuarial study for ensuring its financial viability.

30
Annex I Categories of construction workers included in the Tamil Nadu Manual Workers’ Welfare Scheme, 1994 (Chennai City, 2001)
1. Stone cutter or stone breaker or stone crusher 2. Mason or brick layer 3. Carpenter 4. Painter or varnisher 5. Fitter including bar bender 6. Plumber for road pipe work 7. Electrician 8. Mechanic 9. Well sinker 10. Welder 11. Head mazdoor 12. Mazdoor 13. Sprayman or mixerman (road surfacing) 14. Wooden or stone packer 15. Well driver for removing silt 16. Hammerman 17. Thatcher 18. Maistry 19. Blacksmith 20. Sawer 21. Caulker 22. Mixer (including concrete mixer operator) 23. Pump operator 24. Mixer driver 25. Roller driver 26. Kalasis or sarang engaged in heavy engineering construction 27. Watchman 28. Mosaic polisher 29. Tunnel worker 30. Rock breaker and quarry worker 31. Marble/kadappa stone worker 32. Road worker 33. Earth worker connected with construction work 34. Worker engaged in processing lime. 35. Worker engaged in anti-sea erosion work. 36. Any other category of worker who is engaged in construction or maintenance

31
Annex II Tamil Nadu Construction Workers’ Welfare Board (Chennai): Details of insurance premium paid up to 30 November 2001 (revenue from registration and renewal fees in Rs.)
Year No. of workers
Initial premium paid
Renewal premium
Benefit payments
Fund balance*
1995 – 1996 21 946 548 650 -- --
1996 – 1997 4 312** 107 800 548 650 82 859
1997 – 1998 45 594 1 139 850 661 702 32 453
1998 – 1999 68 974 1 724 350 1 796 300 288 191
1999 – 2000 71 163 1 779 075 3 518 475 479 448
2000 – Feb.01 83 267 2 081 675 5 439 725 --
Feb.01– Nov.01
84 578 2 114 450 -- --
Total 379 834 9 495 850 11 874 852 882 951 20 487 751
*The Fund balance represents the sum total of the initial premium plus the renewal premium, minus benefit payments.
**The number of workers though abnormally low was found to be correct with the records of the Board.
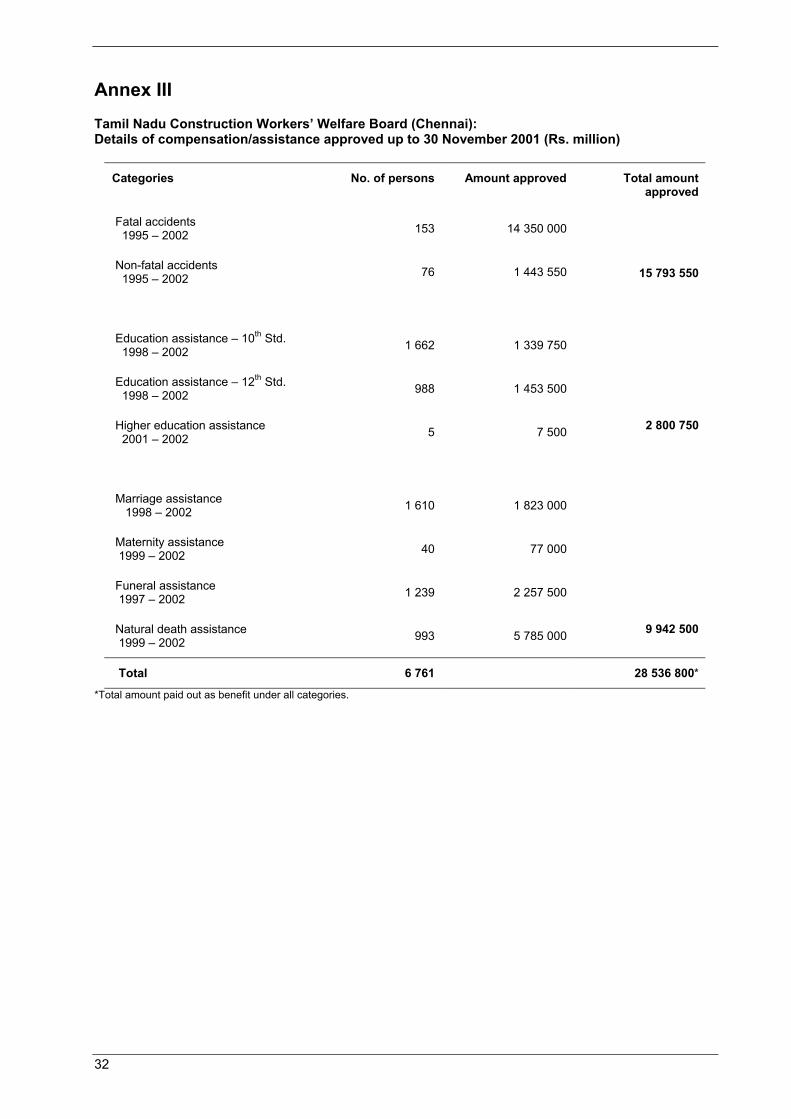
32
Annex III Tamil Nadu Construction Workers’ Welfare Board (Chennai): Details of compensation/assistance approved up to 30 November 2001 (Rs. million)
Categories No. of persons Amount approved Total amount approved
Fatal accidents 1995 – 2002 153 14 350 000
Non-fatal accidents 1995 – 2002 76 1 443 550 15 793 550
Education assistance – 10th Std. 1998 – 2002 1 662 1 339 750
Education assistance – 12th Std. 1998 – 2002 988 1 453 500
Higher education assistance 2001 – 2002 5 7 500 2 800 750
Marriage assistance 1998 – 2002 1 610 1 823 000
Maternity assistance 1999 – 2002 40 77 000
Funeral assistance 1997 – 2002 1 239 2 257 500
Natural death assistance 1999 – 2002 993 5 785 000 9 942 500
Total 6 761 28 536 800* *Total amount paid out as benefit under all categories.

33
Annex IV
Tamil Nadu Construction Workers’ Welfare Board (Chennai): Details of income received and welfare benefits approved, 2001 (in Rs. million)
Source of Income Welfare benefits approved
i) Registration fee and renewal fee Compensation for fatal and non-fatal accidents
Year Amount 1995-1990 0.55 1996-1997 0.66 1997-1998 1.80 1998-1999 3.52 1999-2000 5.29 2000-2001 7.43 Total 19.25 ii) Employer contributions 11/94 to 3/97 9.02 1997-1998 28.30 1998-1999 62.18 1999-2000 89.10 2000-2001 108.01
2001-2002 86.92 (up to November) --------- Total 383.53 iii) Administrative expenditure (average for one year) 2000-2001 a) Head office b) Regional offices Total
Amount 0.08 0.21 0.40 0.94 2.06 7.26 10.95
Other welfare benefits nil 0.007 0.06 0.49 6.78 5.39 ------- 12.727 8.20 4.74 12.94
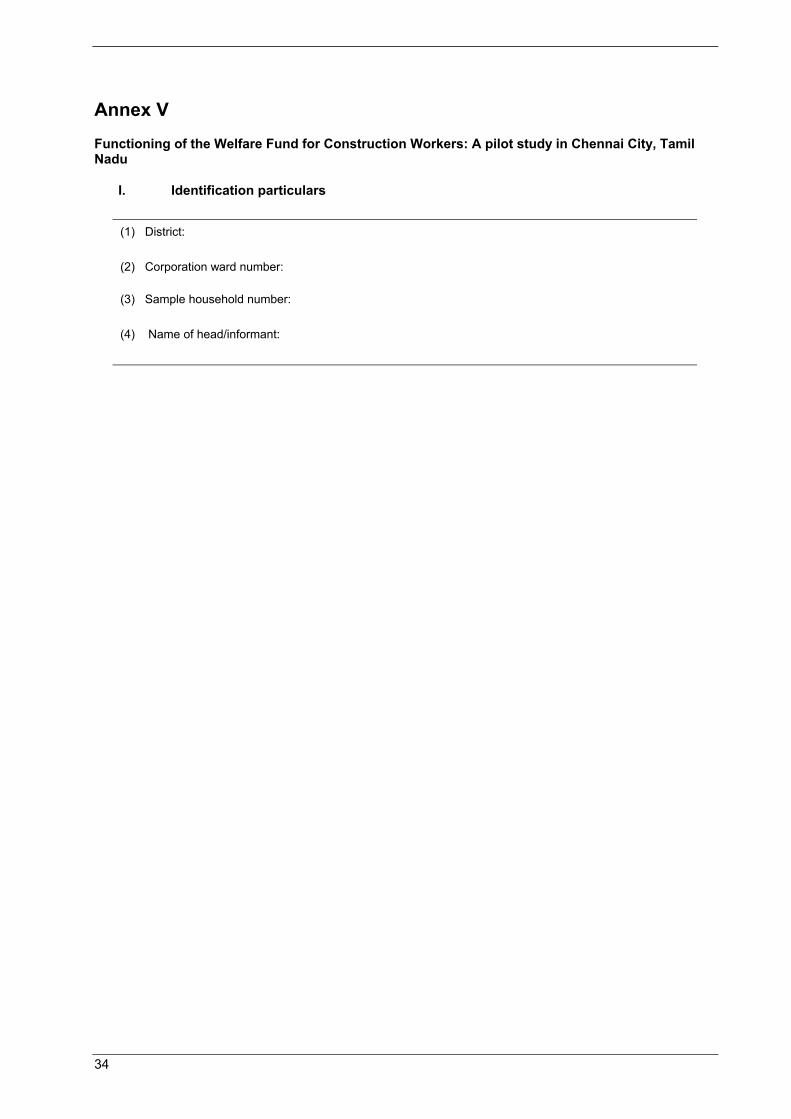
34
Annex V Functioning of the Welfare Fund for Construction Workers: A pilot study in Chennai City, Tamil Nadu
I. Identification particulars (1) District:
(2) Corporation ward number:
(3) Sample household number:
(4) Name of head/informant:

35
II. Household characteristics and other particulars
(1) Household size:
(2) Social group (code):
Scheduled caste – 1; scheduled tribe – 2; other backward classes – 3 ;
others – 4.
(3) Type of House (code):
Kutcha – 1; semi pucca – 2; pucca – 3.
(4) Ownership of House:
Owned – 1; rented – 2; others – 3 (specify)
(5) Primary source of energy for lighting (code):
Electricity – 1; kerosene – 2; gobar gas – 3; others – 4.
(6) Primary source of energy for cooking (code) :
Electricity – 1; kerosene – 2; gobar gas – 3; LPG – 4; firewood – 5 ; others – 6.
(7) Primary source of Drinking Water (code):
Public water supply – ; pucca well – 2; tube well – 3; ponds/tanks – 4;
canal, river, spring – 5; others - 6.
(8) Type of Latrine (code):
No latrine – 0; borehole/septic tank – 1; drainage – 2; other types – 3.
(9) Major source of household income (code)
Self employment in agriculture – 0; Self employment in non agriculture – 1;
Salaries & wages – 2; rentals – 3; remittances – 4; pension – 5; interest – 6;
other sources – 7 (specify).
(10) Medical facility available in the locality Yes /No
(11) If yes, the distance of the hospital / dispensary from your home (in km.):
(12) Source of treatment (government /private):
(13) System of medicine (code):
Allopathy – 1; ayurveda – 2; homeopathy – 3; others - 4.
(14) Amount spent for treatment during the month:
(15) Are you getting any free/concessional medical treatment? Yes / No
(16) If Yes, give details

36
III. Demographic particulars of household members
Sl.
No
Name Relation to head
Sex Age Marital status
Educational status
Activity status
If working:
Industry Occupation
1
2
3
4
5
6
7
Marital Status: Never married -1; currently married - 2; widowed - 3; divorced - 4; separated - 5; others - 6. Education: Illiterate - 00; Class 1 to 12 - 01; 02 -12; TTC -13; BA/BSc./B.Com - 14; Bed - 15; MA/MSc./M Com - 16; Med - 17; BE/B.Tech - 18; MBBS -19; other professional degrees - 20; others - 21. Activity Status: Self-employment in agriculture - 11; self-employment in non-agriculture - 12; helper in household agricultural enterprise - 21; helper in non-agricultural
enterprise - 22; regular wage/salary paid employment - 31; casual-wage labourer in agriculture - 41; casual-wage labourer in non-agriculture - 51; seeking work - 81; available for work - 82; students - 91; household work - 92; old and disabled - 93; too young to work or attend school - 94; pensioners, renters and remittance receivers - 95; others - 96.
Industry: Agriculture, forestry allied - 0; mining and quarrying - 1; manufacturing -2; construction - 3; trade - 4; transport - 5; hotel and restaurants - 6; real estate,
financial, insurance and business services - 7; community, social and personal services - 8; others - 9.

37
IV. Household Income
Source
No. of persons No. of days worked
during the month Monthly income
Self-employment/ own-account worker
Casual-wage labourer in agriculture/non-agriculture
Salaries and wages
Rentals
Remittances
Pension
Interest
Other sources (specify)
Total

38
V. Household monthly consumer expenditure
Number of participating members Items /group of items
1
Monthly consumption expenditure (Rs)
2 Adults
3 Children
4
A. Food items
Cereals and cereal substitutes
Pulses and grams
Milk and milk products
Edible oils and Coconut
Vegetable/tapioca
Fish and eggs
Meat
Fruits
Sugar, jaggery, etc.
Salt, condiments and spices
Tea, coffee, other beverages
Snacks/refreshments, prepared meals
Pan/tobacco/beedi, cigarette
Intoxicants and liquor
Other food items (specify)
Total food items
B. Non-food items
Fuel
Electricity
Water
Clothing
Foot wear
Entertainment
Medical expenses
Toilet articles/personal care
Transport cost
Education
House rent/imputed rent
Otther expenses
Total non-food items
Total consumption expenditure

39
VI.a Benefits/financial assistance received from Welfare Fund (registered workers)
Source of information about Welfare Fund (Trade union/contractor/extension-campaign/news- papers/others)
Whether membership was taken voluntarily or out of compulsion?
Amount paid as registration fee
Renewal fee paid, if any, and duration of renewal
Are you satisfied with the type of welfare benefits offered by the Fund?
(If No, what other benefits to be added)?
Yes/No
In your opinion, should any training programme for skilled work be organized by the Welfare Fund?
(If so, the type of training to be organized? Specify the details.)

40
VI.b Details of welfare benefits received and amount
Name Amount Year of receipt
Compensation for:
Fatal accidents
Non-fatal accidents
Educational assistance
Marriage assistance
Maternity assistance
Funeral assistance
Natural death assistance
Other benefits (specify)
Have you applied for welfare assistance that is not yet approved?
(If Yes, give details of benefits applied for and year)
Yes/No
Why was the application rejected?
(Give reasons.)
Have you at anytime applied for any assistance from the Welfare Fund so far?
(If No, specify reasons)
Yes/No
Are you in receipt of any financial/other assistance from various welfare programmes implemented by State government or the Federal government?
(If Yes, give details of the programme and also the nature of assistance)
Yes/No
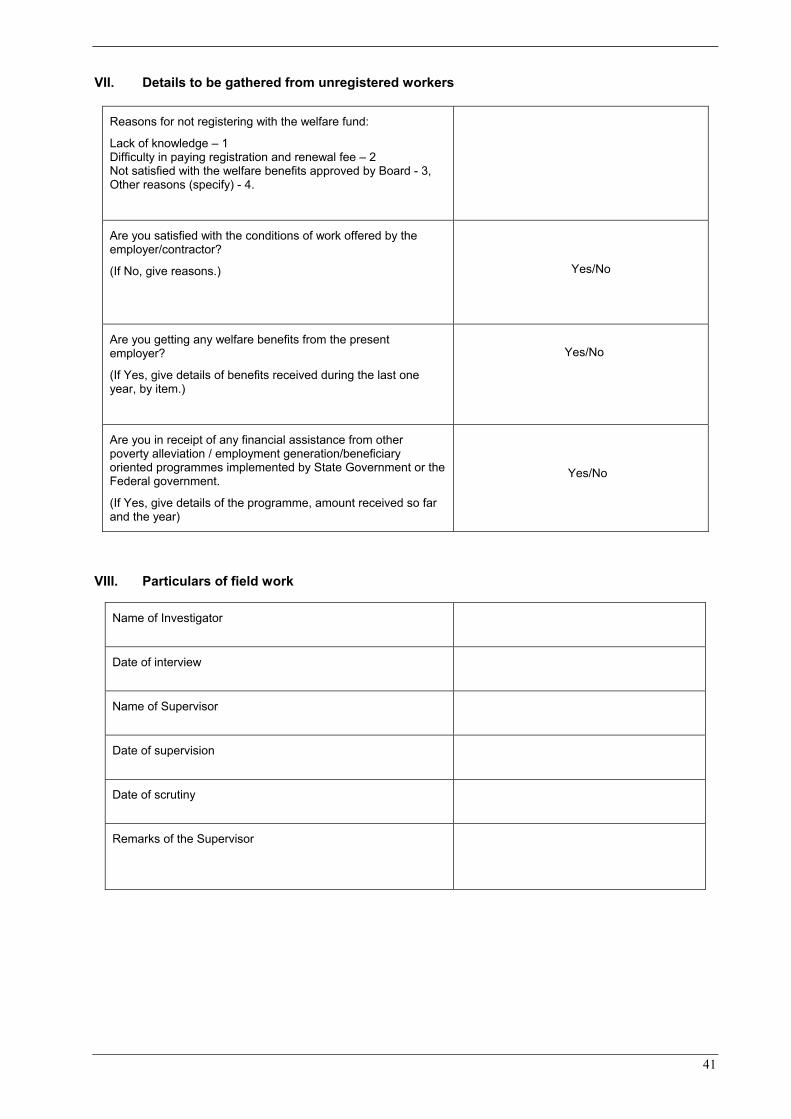
41
VII. Details to be gathered from unregistered workers
Reasons for not registering with the welfare fund:
Lack of knowledge – 1 Difficulty in paying registration and renewal fee – 2 Not satisfied with the welfare benefits approved by Board - 3, Other reasons (specify) - 4.
Are you satisfied with the conditions of work offered by the employer/contractor?
(If No, give reasons.)
Yes/No
Are you getting any welfare benefits from the present employer?
(If Yes, give details of benefits received during the last one year, by item.)
Yes/No
Are you in receipt of any financial assistance from other poverty alleviation / employment generation/beneficiary oriented programmes implemented by State Government or the Federal government.
(If Yes, give details of the programme, amount received so far and the year)
Yes/No
VIII. Particulars of field work
Name of Investigator
Date of interview
Name of Supervisor
Date of supervision
Date of scrutiny
Remarks of the Supervisor

42
ESS papers already published 17. Velásquez Pinto, M.D. The Bono Solidario in Ecuador: An exercise in targeting1.
16. Sabates-Wheeler, R.; Kabeer, N. Gender equality and the extension of social protection1.
15. Ferreira, O. Extending social security: Challenges for Cape Verde1. (2003). Version Portuguesa: A extensão da protecção social: o caso de Cabo Verde1.
14. Falconi Palomino, J. Social programmes, food security and poverty in Peru1 (2003). Versión español: La seguridad alimentaria en el Perú como forma de seguridad de los ingresos1.
13. van Ginneken, W. Extending social security: Policies for developing countries1 (2003).
12. Gbossa, F.L.; Gauthé, B. Social protection and crises in the Congo: From humanitarian aid to sustainable development1 (2002). Version française: La protection sociale et les crises aux Congo : de l’aide humanitaire vers une protection sociale durable1.
11. Schwarzer, H.; Querino, A.C. Non-contributory pensions in Brazil: The impact on poverty reduction1 (2002). Versión español: Beneficios sociales y los pobres en Brasil : Programas de pensiones no convencionales2. Version Portuguesa: Benefícios Sociais e Pobreza: programas não contributivos da seguridade social brasileira3.
10. Jütting, J. Public-private partnerships in the health sector: Experiences from developing countries1 (2002).
9. Fall, C. Extending health insurance in Senegal: Options for statutory schemes and mutual organisations1 (2002). Version française: Etendre l’assurance santé au Sénégal : possibilities à travers les regimes statutaires et les organisations mutualistes1.
8. Durán-Valverde, F. Anti-poverty programmes in Costa Rica: The Non-Contributory Pension Scheme1 (2002). Versión español: Los programas de asistencia social en Costa Rica : El régimen no contributivo de pensiones2.
7. Steinwachs, L. Extending health protection in Tanzania: Networking between health financing mechanisms1 (2002).
6. Schleberger, E. Namibia’s Universal Pension Scheme: Trends and challenges1 (2002).
5. Bertranou, F.; Grushka, C.O. The non-contributory pension programme in Argentina: Assessing the impact on poverty reduction1 (2002). Versión español: Beneficios sociales y pobreza en Argentina: Estudio del programa de pensiones no contributivas2.
4. Chaabane, M. Towards the universalization of social security: The experience of Tunisia1 (2002). Version française: Vers l’universalisation de la sécurité sociale : l’expérience de la Tunisie1.
3. Reynaud, E. The extension of social security coverage: The approach of the International Labour Office1 (2002). Version française: Extension de la sécurité sociale: la démarche du Bureau international du Travail1. Versión español: Extensión de la cobertura de la seguridad social: La actuación de la Oficina Internacional del Trabajo1.
2. Cruz-Saco, M-A. Labour markets and social security coverage: The Latin American experience1
(2002).
1. Kwon, S. Achieving health insurance for all: Lessons from the Republic of Korea1
(2002).
1 http://www.ilo.org/public/french/protection/socsec/pol/publ/index.htm
http://www.ilo.org/public/english/protection/socsec/pol/publ/index.htm 2 Pensiones no contributivas y asistenciales : Argentina, Brasil, Chile, Costa Rica y Uruguay. F.M. Bertranou, C. Solorio, W. van Ginneken
(eds.). Santiago, Oficina Internacional del Trabajo, 2002. 3 Discussion Text 929 de Instituto de Pesquisa Economica Aplicada); December 2002, sur: http//:www.ipea.gov.br.