Embed Size (px)
Citation preview

Page | 1
Essar Oil Limited
RG (East)-CBM-2001/1 (Phase-II) Half Yearly Environment Clearance Compliance Report
(October’16- March’17)
Ref: Environment Clearance no. F. No. J-11011/351/2009- IA II (I) dated 23.09.2011
Sr.No.
EC Conditions Compliance Status
A. Specific Conditions
I. As proposed, Only 58 pilot-cum-productionwells shall be drilled upto a depth of 1000 m.No additional wells shall be drilled withoutprior permission from this Ministry.
Number of pilot-cum-production wells has beendrilled as per the permission. Amendment inEnvironmental Clearance has been granted by MoEFfor drilling 4 additional supporting wells at each pilotcum production site to augment the production.
Ii As proposed, no drilling of well and anyconstruction work shall be carried out inforest land. No forest land shall be used forinstallation of Group Gathering Stations(GGSs) and pipeline laying in the proposedlocation
All the facilities including well sites & Gas GatheringStations are located outside the forest area.
Iii Recommendations of the State ForestDepartment shall be obtained regarding likelyimpact of the proposed plant on thesurrounding protected forests viz. DurgapurPF & Ukhra PF and implemented.
The Conservator of Forests (South East Circle), ForestDepartment, West Bengal made site inspection on19th Dec’12 to assess the probable impacts & suggestsuitable recommendations. The Addl. PCCF, WestBengal with his recommendations forwarded to theAddl. PCCF, MoEF (Eastern Regional Office). (A copyof the letter is attached with previous compliancereport).
iv Compensation for the land acquisition to theland oustees, if any, and also for standingcrop shall be paid as per the NationalResettlement and Rehabilitation Policy(NRRP) 2007 or State Government norms. Itmay be ensured that compensation providedshall not be less than the norms of the NRRP,
Land acquisition is in progress. The acquisition isdirectly being done with the concerned land ownersand compensation is paid above the prevailingmarket rates. There is no involvement ofRehabilitation and Resettlement.

Page | 2
Sr.No.
EC Conditions Compliance Status
A. Specific Conditions
2007.
V Prior permission from the Ministry of Defenceshall be obtained regarding impact ofproposed plant on Panagarh air base, if any.
NOC obtained from MoD for the proposed projectThe compliance of the conditions prescribed by MoDare being satisfactorily complied. (A copy of theletter is attached with previous compliance report)
Vi The surface facilities shall be installed as perthe applicable codes and standards,international practices and applicable localregulations.
Surface facilities have been designed as per OISD,DGMS and international standards viz. API.
Vii Ambient air quality shall be monitored nearthe closest human settlements as per theNational Ambient Air Quality EmissionStandards (NAAQES) issued by the Ministryvide G.S.R. No. 826(E) dated 16th November,2009 for PM1O, PM2.5, S02, NOx, CO, CH4,VOCs, HC, Non-methane HC etc. Efforts shallbe made to improve the ambient air qualityof the area.
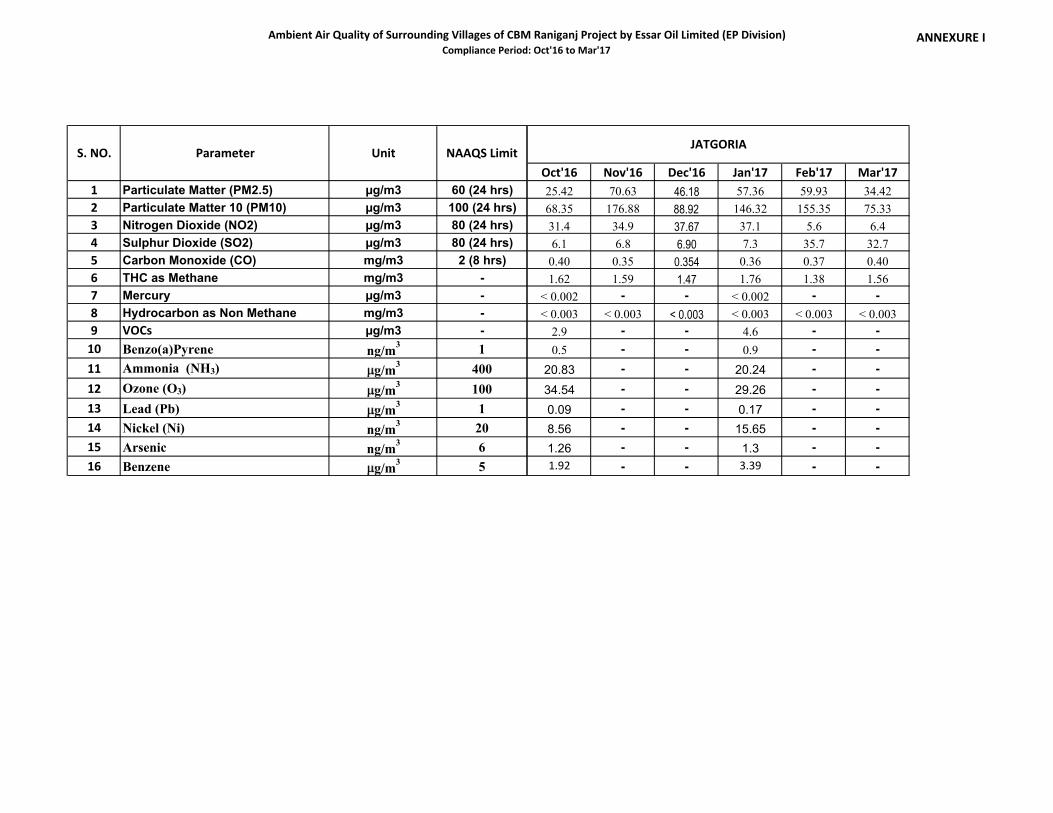
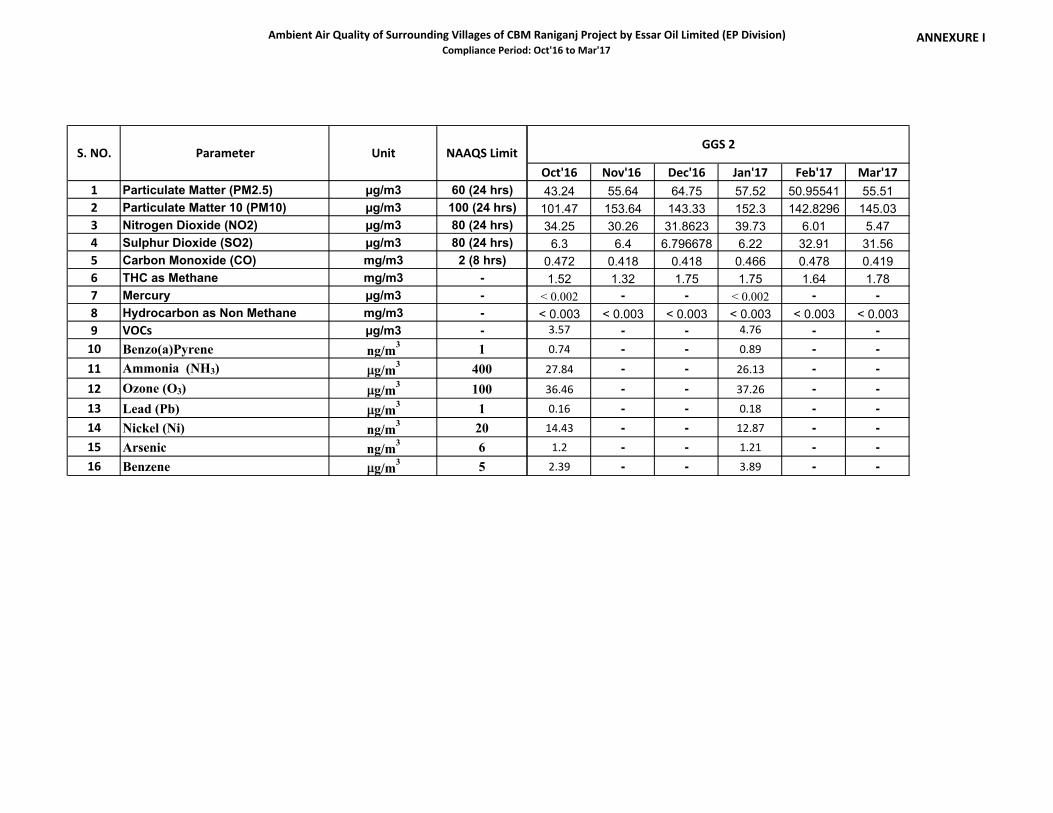
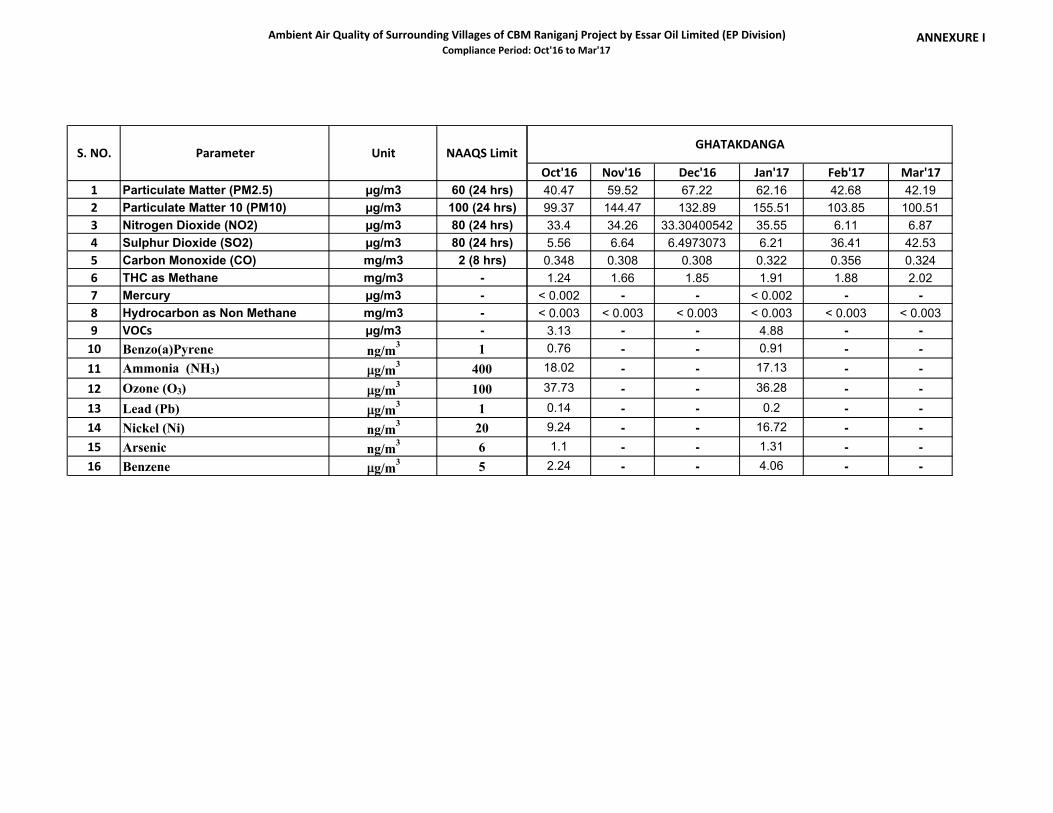
Ambient Air Quality Monitoring has been carried outnear to the closest human settlements as per theAmbient Air Quality Emission Standards (NAAQES)issued by the Ministry vide G.S.R No. 826(E) dated16th November, 2009 for PM10, PM2.5, SO2, NOX,CO, CH4, VOCs, HC, Non-methane HC. The monitoringresults have been attached in Annexure I.
Viii The company shall monitor data on methaneand non-methane hydrocarbon at the drillingsite, GGS, CGS and at the SV station fromwhere the gas is supplied to the customers.
Methane hydrocarbons are monitored as part ofAmbient Air Quality Monitoring Plan at Majorfacilities (GGS) and villages. The monitoring resultsare provided in Annexure I.
Ix Mercury shall also be analyzed in air, waterand drill cuttings twice during drilling period.
Mercury has been analyzed in produced water andambient air. Mercury levels in ambient air quality arewithin the Below Detection Limits (<1ng/m3). Theanalysis reports for Air & Water are attached inAnnexure I & II.
X The flare system shall be designed as pergood oil field practices and Oil Industry SafetyDirectorate (OISD) guidelines. The company
Elevated flare system has been designed as per OISDguidelines. Measures delineated in the EIA/EMP havebeen taken to prevent fire hazards. The overhead

Page | 3
Sr.No.
EC Conditions Compliance Status
A. Specific Conditions
shall take necessary measures to prevent firehazards and soil remediation as needed. Atthe place of ground flaring, the flare pit shallbe lined with refractory bricks and efficientburning system. In case of overhead flarestacks, the stack height shall be provided asper the regulatory requirements andemissions from stacks shall meet theMOEF/CPCB guidelines.
flaring has been installed with height of 30 m. Thefollowing measures have been implemented toprevent fire hazard.
Installation of electrical equipment as perapproved hazardous zone classification ascommunicated to DGMS
Provided dry chemical fire extinguishers
Online methane gas analyzers (CH4)
Use of flame proof type lighting fixtures, pushbuttons and switches in the drill site facilities
Xi The company shall make the arrangement forcontrol of noise from the drilling activity andDG sets by providing necessary mitigationmeasures such as proper acoustic enclosuresto DG sets and meet the norms notified bythe MoEF. Height of all the stacks/vents shallbe as per the CPCB guidelines.
CPCB approved models of Silent DG sets have beeninstalled with acoustic enclosures. Noise monitoringhas been carried out in the activity area. The resultsare attached in Annexure III.
Xii The company shall comply with the guidelinesfor disposal of solid waste, drill cutting anddrilling fluids for onshore drilling operationnotified vide GSR. 546(E) dated 30'August,2005.
Drill cuttings are stored in HDPE lined pits. Wecomply with the guidelines for disposal of solidwaste, drill cuttings and drilling fluids for onshoredrilling operation notified vide GSR.546 (E) dated30th August, 2005.
Xiii Total fresh water requirement from localapproved water suppliers shall not exceed 75m3/day/well and prior permission shall beobtained from the concerned Authority and acopy submitted to the Ministry's RegionalOffice at Bhubaneswar. No ground watershall be used without permission of CGWA.
Maximum water requirement for drilling operationshas been restricted to 75m3/well and for GGS is1m3/day. However, The RO treat water is supply thewater demand to new drilling operation and otherutilities. No ground water is withdrawal for waterconsumption.
Page | 4
Sr.No.
EC Conditions Compliance Status
A. Specific Conditions
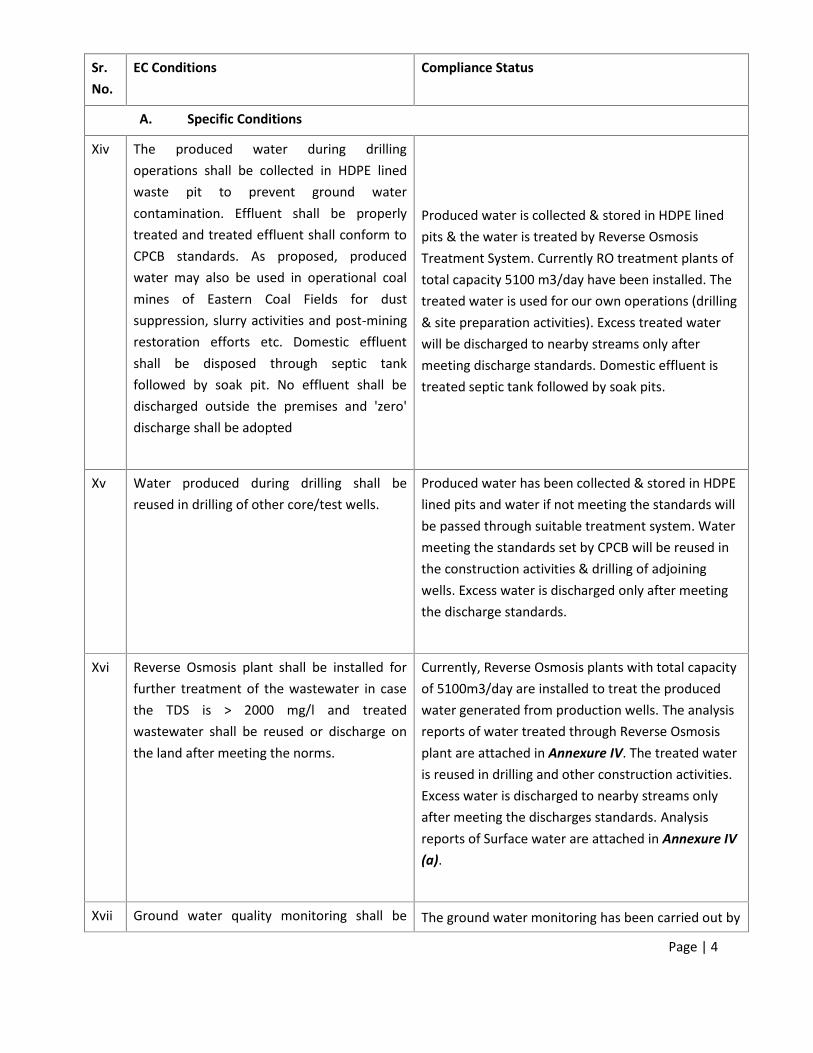
Xiv The produced water during drillingoperations shall be collected in HDPE linedwaste pit to prevent ground watercontamination. Effluent shall be properlytreated and treated effluent shall conform toCPCB standards. As proposed, producedwater may also be used in operational coalmines of Eastern Coal Fields for dustsuppression, slurry activities and post-miningrestoration efforts etc. Domestic effluentshall be disposed through septic tankfollowed by soak pit. No effluent shall bedischarged outside the premises and 'zero'discharge shall be adopted
Produced water is collected & stored in HDPE linedpits & the water is treated by Reverse OsmosisTreatment System. Currently RO treatment plants oftotal capacity 5100 m3/day have been installed. Thetreated water is used for our own operations (drilling& site preparation activities). Excess treated waterwill be discharged to nearby streams only aftermeeting discharge standards. Domestic effluent istreated septic tank followed by soak pits.
Xv Water produced during drilling shall bereused in drilling of other core/test wells.
Produced water has been collected & stored in HDPElined pits and water if not meeting the standards willbe passed through suitable treatment system. Watermeeting the standards set by CPCB will be reused inthe construction activities & drilling of adjoiningwells. Excess water is discharged only after meetingthe discharge standards.
Xvi Reverse Osmosis plant shall be installed forfurther treatment of the wastewater in casethe TDS is > 2000 mg/l and treatedwastewater shall be reused or discharge onthe land after meeting the norms.
Currently, Reverse Osmosis plants with total capacityof 5100m3/day are installed to treat the producedwater generated from production wells. The analysisreports of water treated through Reverse Osmosisplant are attached in Annexure IV. The treated wateris reused in drilling and other construction activities.Excess water is discharged to nearby streams onlyafter meeting the discharges standards. Analysisreports of Surface water are attached in Annexure IV(a).
Xvii Ground water quality monitoring shall be The ground water monitoring has been carried out by
Page | 5
Sr.No.
EC Conditions Compliance Status
A. Specific Conditions
done to assess if produced water storage ordisposal has any effect.
collecting samples from nearby bore holes & waterbodies in the project area and the analysis results areattached in Annexure V.
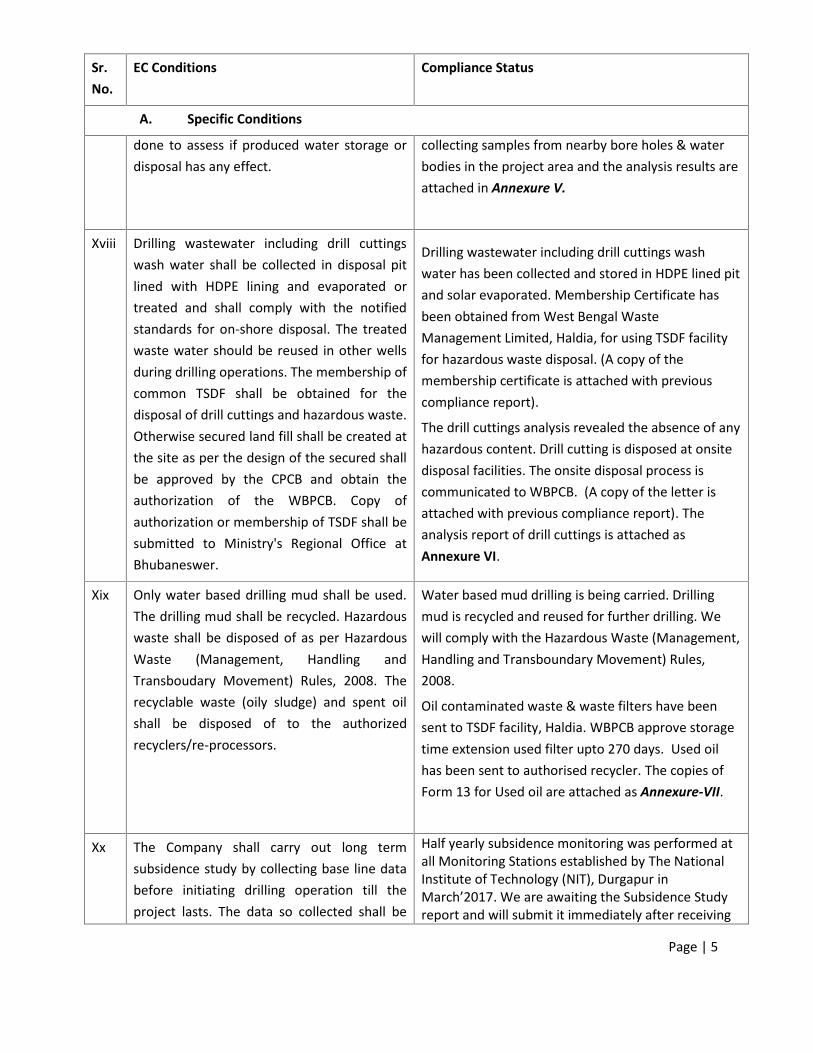
Xviii Drilling wastewater including drill cuttingswash water shall be collected in disposal pitlined with HDPE lining and evaporated ortreated and shall comply with the notifiedstandards for on-shore disposal. The treatedwaste water should be reused in other wellsduring drilling operations. The membership ofcommon TSDF shall be obtained for thedisposal of drill cuttings and hazardous waste.Otherwise secured land fill shall be created atthe site as per the design of the secured shallbe approved by the CPCB and obtain theauthorization of the WBPCB. Copy ofauthorization or membership of TSDF shall besubmitted to Ministry's Regional Office atBhubaneswer.
Drilling wastewater including drill cuttings washwater has been collected and stored in HDPE lined pitand solar evaporated. Membership Certificate hasbeen obtained from West Bengal WasteManagement Limited, Haldia, for using TSDF facilityfor hazardous waste disposal. (A copy of themembership certificate is attached with previouscompliance report).
The drill cuttings analysis revealed the absence of anyhazardous content. Drill cutting is disposed at onsitedisposal facilities. The onsite disposal process iscommunicated to WBPCB. (A copy of the letter isattached with previous compliance report). Theanalysis report of drill cuttings is attached asAnnexure VI.
Xix Only water based drilling mud shall be used.The drilling mud shall be recycled. Hazardouswaste shall be disposed of as per HazardousWaste (Management, Handling andTransboudary Movement) Rules, 2008. Therecyclable waste (oily sludge) and spent oilshall be disposed of to the authorizedrecyclers/re-processors.
Water based mud drilling is being carried. Drillingmud is recycled and reused for further drilling. Wewill comply with the Hazardous Waste (Management,Handling and Transboundary Movement) Rules,2008.
Oil contaminated waste & waste filters have beensent to TSDF facility, Haldia. WBPCB approve storagetime extension used filter upto 270 days. Used oilhas been sent to authorised recycler. The copies ofForm 13 for Used oil are attached as Annexure-VII.
Xx The Company shall carry out long termsubsidence study by collecting base line databefore initiating drilling operation till theproject lasts. The data so collected shall be
Half yearly subsidence monitoring was performed atall Monitoring Stations established by The NationalInstitute of Technology (NIT), Durgapur inMarch’2017. We are awaiting the Subsidence Studyreport and will submit it immediately after receiving
Page | 6
Sr.No.
EC Conditions Compliance Status
A. Specific Conditions
submitted six monthly to the Ministry and itsRegional Office at Bhubaneswar.
it.
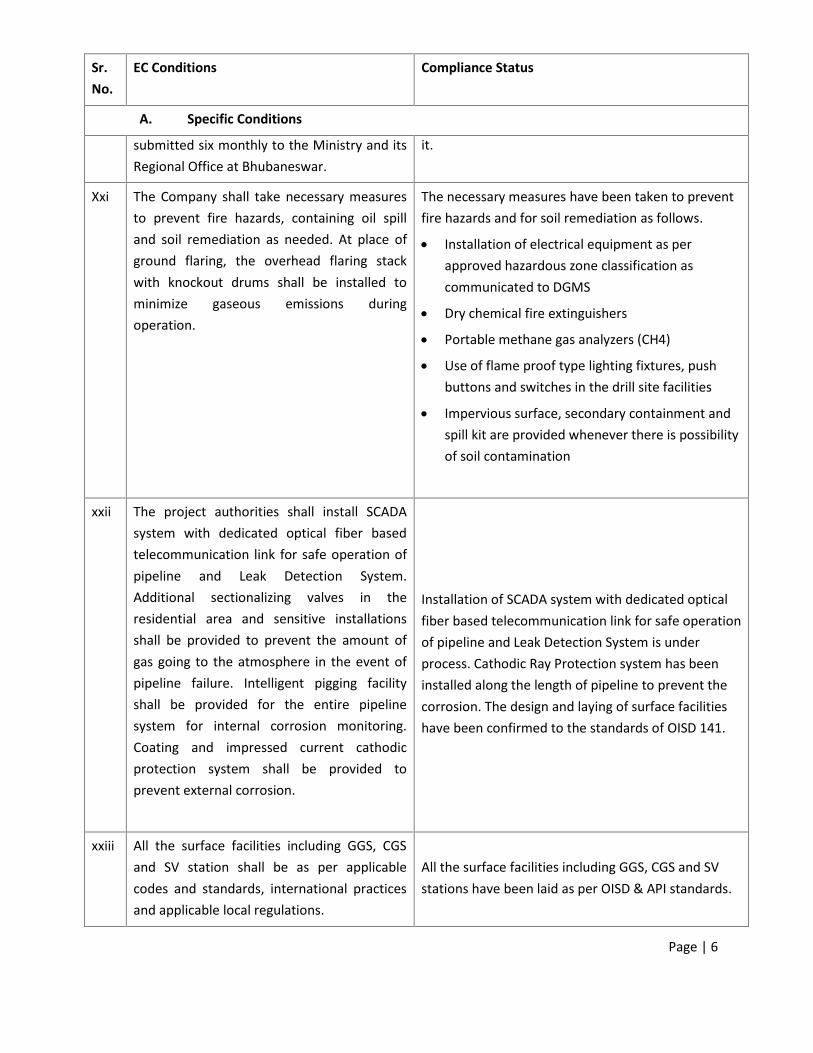
Xxi The Company shall take necessary measuresto prevent fire hazards, containing oil spilland soil remediation as needed. At place ofground flaring, the overhead flaring stackwith knockout drums shall be installed tominimize gaseous emissions duringoperation.
The necessary measures have been taken to preventfire hazards and for soil remediation as follows.
Installation of electrical equipment as perapproved hazardous zone classification ascommunicated to DGMS
Dry chemical fire extinguishers
Portable methane gas analyzers (CH4)
Use of flame proof type lighting fixtures, pushbuttons and switches in the drill site facilities
Impervious surface, secondary containment andspill kit are provided whenever there is possibilityof soil contamination
xxii The project authorities shall install SCADAsystem with dedicated optical fiber basedtelecommunication link for safe operation ofpipeline and Leak Detection System.Additional sectionalizing valves in theresidential area and sensitive installationsshall be provided to prevent the amount ofgas going to the atmosphere in the event ofpipeline failure. Intelligent pigging facilityshall be provided for the entire pipelinesystem for internal corrosion monitoring.Coating and impressed current cathodicprotection system shall be provided toprevent external corrosion.
Installation of SCADA system with dedicated opticalfiber based telecommunication link for safe operationof pipeline and Leak Detection System is underprocess. Cathodic Ray Protection system has beeninstalled along the length of pipeline to prevent thecorrosion. The design and laying of surface facilitieshave been confirmed to the standards of OISD 141.
xxiii All the surface facilities including GGS, CGSand SV station shall be as per applicablecodes and standards, international practicesand applicable local regulations.
All the surface facilities including GGS, CGS and SVstations have been laid as per OISD & API standards.
Page | 7
Sr.No.
EC Conditions Compliance Status
A. Specific Conditions
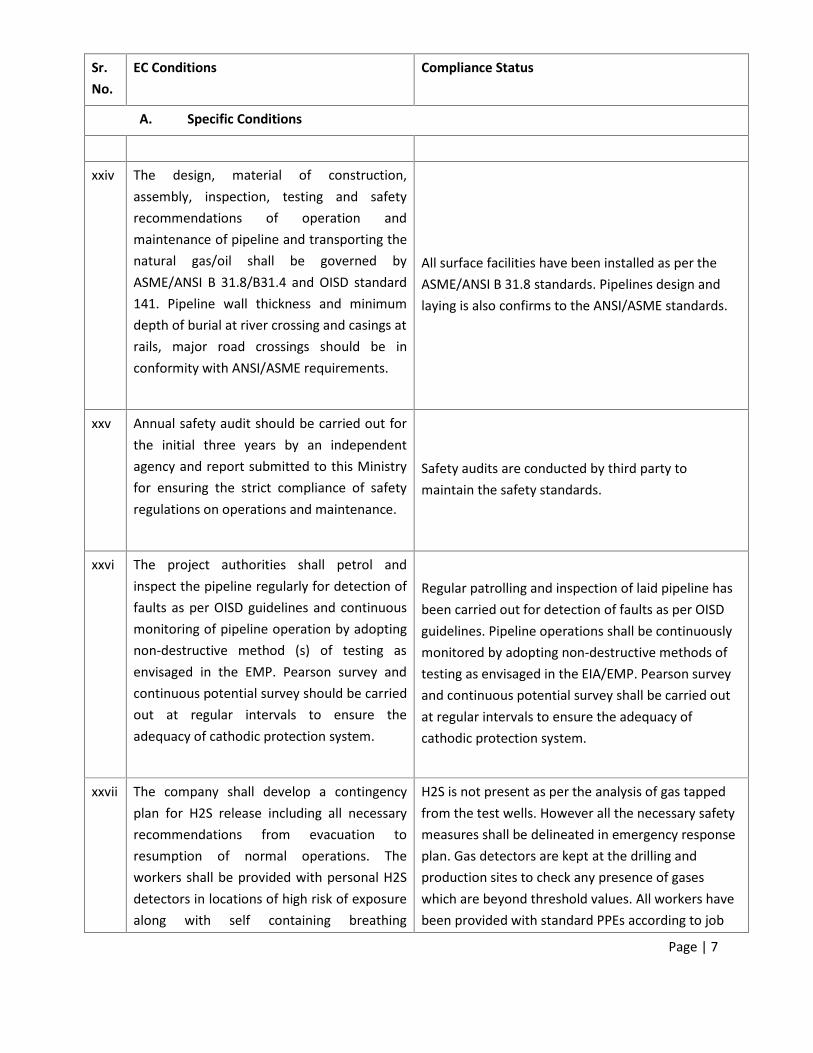
xxiv The design, material of construction,assembly, inspection, testing and safetyrecommendations of operation andmaintenance of pipeline and transporting thenatural gas/oil shall be governed byASME/ANSI B 31.8/B31.4 and OISD standard141. Pipeline wall thickness and minimumdepth of burial at river crossing and casings atrails, major road crossings should be inconformity with ANSI/ASME requirements.
All surface facilities have been installed as per theASME/ANSI B 31.8 standards. Pipelines design andlaying is also confirms to the ANSI/ASME standards.
xxv Annual safety audit should be carried out forthe initial three years by an independentagency and report submitted to this Ministryfor ensuring the strict compliance of safetyregulations on operations and maintenance.
Safety audits are conducted by third party tomaintain the safety standards.
xxvi The project authorities shall petrol andinspect the pipeline regularly for detection offaults as per OISD guidelines and continuousmonitoring of pipeline operation by adoptingnon-destructive method (s) of testing asenvisaged in the EMP. Pearson survey andcontinuous potential survey should be carriedout at regular intervals to ensure theadequacy of cathodic protection system.
Regular patrolling and inspection of laid pipeline hasbeen carried out for detection of faults as per OISDguidelines. Pipeline operations shall be continuouslymonitored by adopting non-destructive methods oftesting as envisaged in the EIA/EMP. Pearson surveyand continuous potential survey shall be carried outat regular intervals to ensure the adequacy ofcathodic protection system.
xxvii The company shall develop a contingencyplan for H2S release including all necessaryrecommendations from evacuation toresumption of normal operations. Theworkers shall be provided with personal H2Sdetectors in locations of high risk of exposurealong with self containing breathing
H2S is not present as per the analysis of gas tappedfrom the test wells. However all the necessary safetymeasures shall be delineated in emergency responseplan. Gas detectors are kept at the drilling andproduction sites to check any presence of gaseswhich are beyond threshold values. All workers havebeen provided with standard PPEs according to job
Page | 8
Sr.No.
EC Conditions Compliance Status
A. Specific Conditions
apparatus. requirement.
xxviii
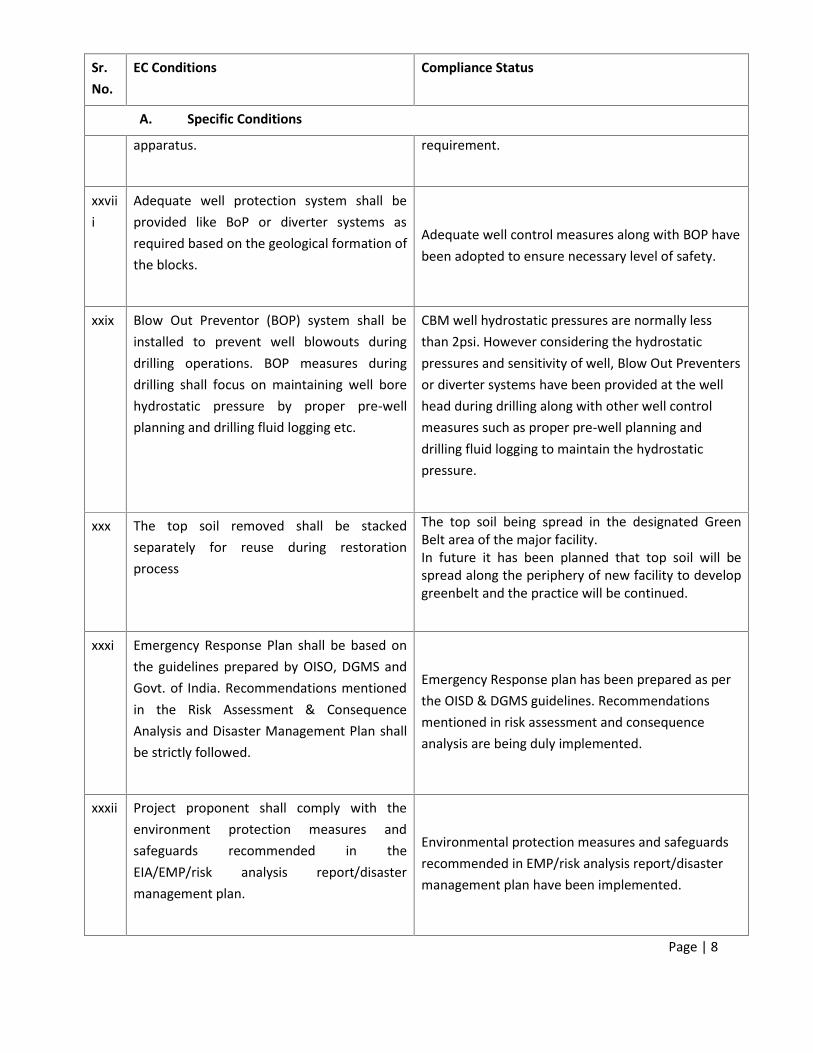
Adequate well protection system shall beprovided like BoP or diverter systems asrequired based on the geological formation ofthe blocks.
Adequate well control measures along with BOP havebeen adopted to ensure necessary level of safety.
xxix Blow Out Preventor (BOP) system shall beinstalled to prevent well blowouts duringdrilling operations. BOP measures duringdrilling shall focus on maintaining well borehydrostatic pressure by proper pre-wellplanning and drilling fluid logging etc.
CBM well hydrostatic pressures are normally lessthan 2psi. However considering the hydrostaticpressures and sensitivity of well, Blow Out Preventersor diverter systems have been provided at the wellhead during drilling along with other well controlmeasures such as proper pre-well planning anddrilling fluid logging to maintain the hydrostaticpressure.
xxx The top soil removed shall be stackedseparately for reuse during restorationprocess
The top soil being spread in the designated GreenBelt area of the major facility.In future it has been planned that top soil will bespread along the periphery of new facility to developgreenbelt and the practice will be continued.
xxxi Emergency Response Plan shall be based onthe guidelines prepared by OISO, DGMS andGovt. of India. Recommendations mentionedin the Risk Assessment & ConsequenceAnalysis and Disaster Management Plan shallbe strictly followed.
Emergency Response plan has been prepared as perthe OISD & DGMS guidelines. Recommendationsmentioned in risk assessment and consequenceanalysis are being duly implemented.
xxxii Project proponent shall comply with theenvironment protection measures andsafeguards recommended in theEIA/EMP/risk analysis report/disastermanagement plan.
Environmental protection measures and safeguardsrecommended in EMP/risk analysis report/disastermanagement plan have been implemented.
Page | 9
Sr.No.
EC Conditions Compliance Status
A. Specific Conditions
xxxiii
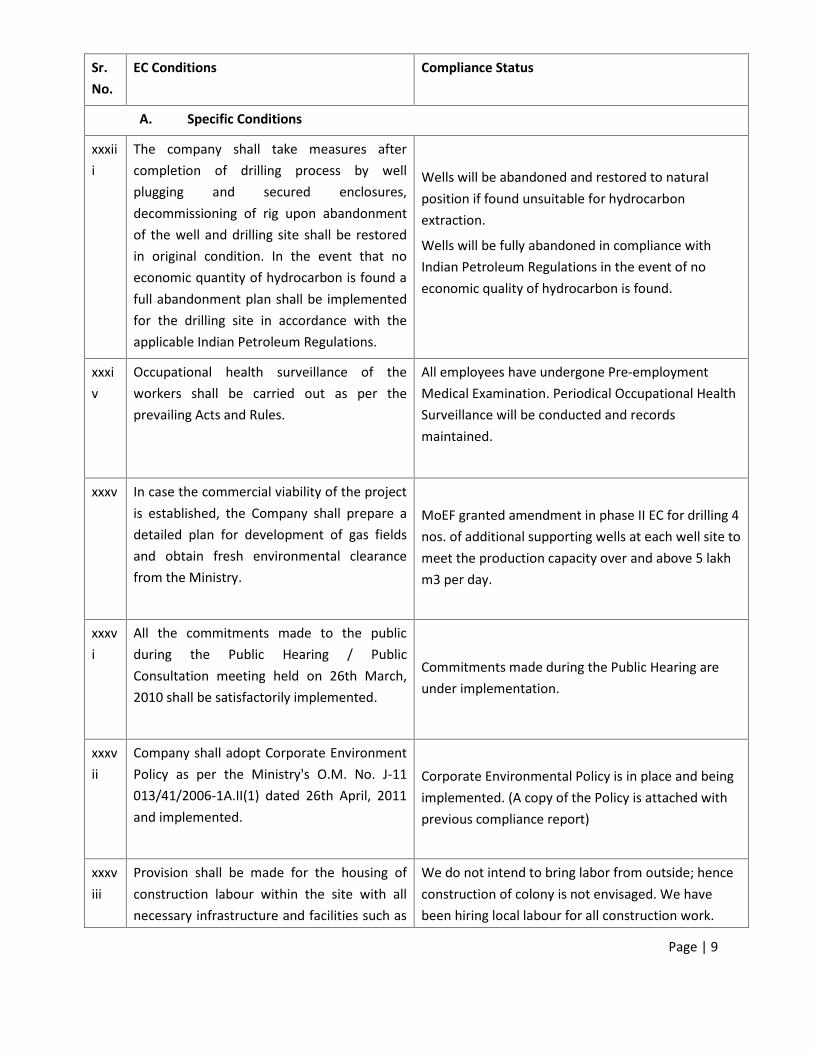
The company shall take measures aftercompletion of drilling process by wellplugging and secured enclosures,decommissioning of rig upon abandonmentof the well and drilling site shall be restoredin original condition. In the event that noeconomic quantity of hydrocarbon is found afull abandonment plan shall be implementedfor the drilling site in accordance with theapplicable Indian Petroleum Regulations.
Wells will be abandoned and restored to naturalposition if found unsuitable for hydrocarbonextraction.
Wells will be fully abandoned in compliance withIndian Petroleum Regulations in the event of noeconomic quality of hydrocarbon is found.
xxxiv
Occupational health surveillance of theworkers shall be carried out as per theprevailing Acts and Rules.
All employees have undergone Pre-employmentMedical Examination. Periodical Occupational HealthSurveillance will be conducted and recordsmaintained.
xxxv In case the commercial viability of the projectis established, the Company shall prepare adetailed plan for development of gas fieldsand obtain fresh environmental clearancefrom the Ministry.
MoEF granted amendment in phase II EC for drilling 4nos. of additional supporting wells at each well site tomeet the production capacity over and above 5 lakhm3 per day.
xxxvi
All the commitments made to the publicduring the Public Hearing / PublicConsultation meeting held on 26th March,2010 shall be satisfactorily implemented.
Commitments made during the Public Hearing areunder implementation.
xxxvii
Company shall adopt Corporate EnvironmentPolicy as per the Ministry's O.M. No. J-11013/41/2006-1A.II(1) dated 26th April, 2011and implemented.
Corporate Environmental Policy is in place and beingimplemented. (A copy of the Policy is attached withprevious compliance report)
xxxviii
Provision shall be made for the housing ofconstruction labour within the site with allnecessary infrastructure and facilities such as
We do not intend to bring labor from outside; henceconstruction of colony is not envisaged. We havebeen hiring local labour for all construction work.

Page | 10
Sr.No.
EC Conditions Compliance Status
A. Specific Conditions
fuel for cooking, mobile toilets, mobile STP,Safe drinking water, medical health care,creche etc. The housing may be in the form oftemporary structures to be removed after thecompletion of the project
Nonetheless, we are providing all the necessaryinfrastructure and facilities like porta cabins, mobiletoilets, soak pit & septic tank, safe drinking water,medical health care, creche, etc.

Page | 11
Sr.No.
EC Conditions Compliance Status
General Condition
I
The project authorities must strictly adhereto the stipulations made by the StatePollution Control Board (SPCB), StateGovernment and any other statutoryauthority.
We comply with the stipulations made by the StatePollution Control Board (SPCB), State Governmentand statutory bodies.
Ii
No further expansion or modification in theproject shall be carried out without priorapproval of the Ministry of Environment &Forests. In case of deviations or alterations inthe project proposal from those submitted tothis Ministry for clearance, a fresh referenceshall be made to the Ministry to assess theadequacy of conditions imposed and to addadditional environmental protectionmeasures required, if any
For any further expansion and modification in projectconfiguration, we would approach MoEF for the priorEnvironmental Clearance.
Iii
The project authorities must strictly complywith the rules and regulations underManufacture, Storage and Import ofHazardous Chemicals Rules, 2000 asamended subsequently. Prior approvals fromChief Inspectorate of Factories, ChiefController of Explosives, Fire SafetyInspectorate etc. must be obtained, whereverapplicable.
We comply with the rules and regulations underManufacture, Storage and Import of HazardousChemicals Rules, 2000 as amended subsequently.Prior approvals will be obtained from appropriateauthority.
iv
The project authorities must strictly complywith the rules and regulation with regardingto handling and disposal of Hazardous Wastes(Management, Handling and TransboundaryMovement) Rules, 2008 wherever applicable.Authorization from the State PollutionControl Board must be obtained for
We comply with the rules and regulations with regardto handling and disposal of Hazardous Wastes(Management, Handling and TransboundaryMovement) Rules, 2008.
Authorization from the West Bengal Pollution ControlBoard has been obtained with regard to storage,
Page | 12
Sr.No.
EC Conditions Compliance Status
General Condition
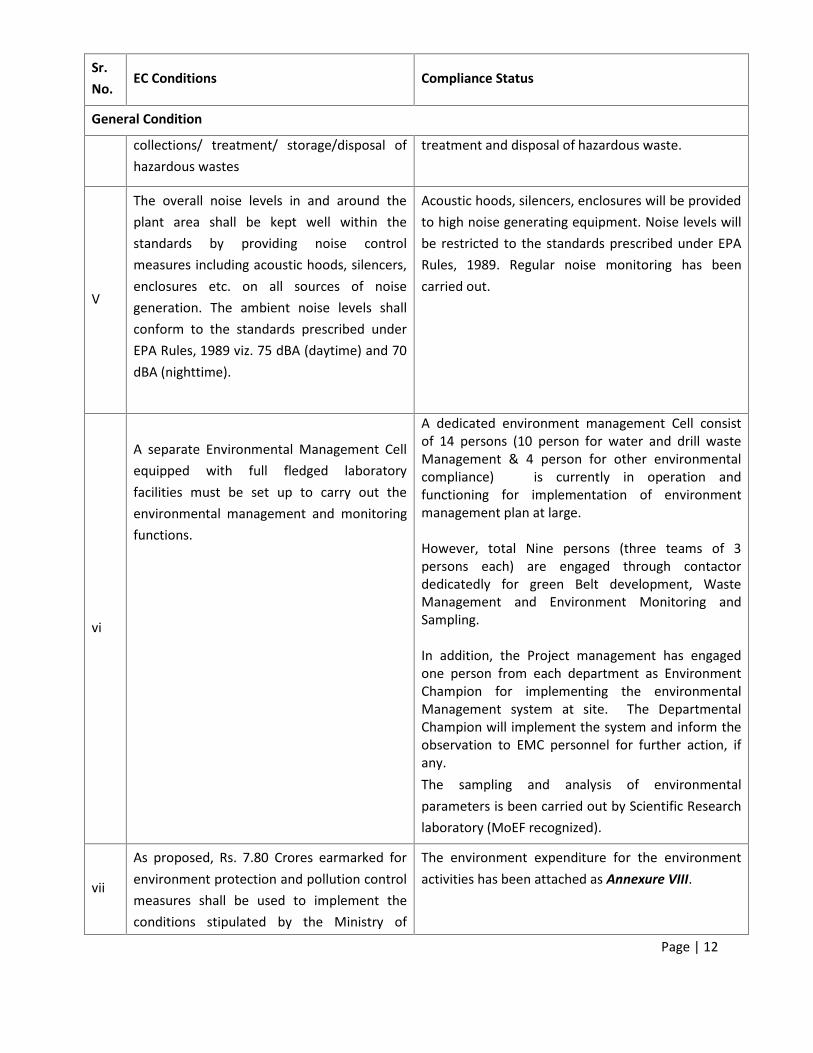
collections/ treatment/ storage/disposal ofhazardous wastes
treatment and disposal of hazardous waste.
V
The overall noise levels in and around theplant area shall be kept well within thestandards by providing noise controlmeasures including acoustic hoods, silencers,enclosures etc. on all sources of noisegeneration. The ambient noise levels shallconform to the standards prescribed underEPA Rules, 1989 viz. 75 dBA (daytime) and 70dBA (nighttime).
Acoustic hoods, silencers, enclosures will be providedto high noise generating equipment. Noise levels willbe restricted to the standards prescribed under EPARules, 1989. Regular noise monitoring has beencarried out.
vi
A separate Environmental Management Cellequipped with full fledged laboratoryfacilities must be set up to carry out theenvironmental management and monitoringfunctions.
A dedicated environment management Cell consistof 14 persons (10 person for water and drill wasteManagement & 4 person for other environmentalcompliance) is currently in operation andfunctioning for implementation of environmentmanagement plan at large.
However, total Nine persons (three teams of 3persons each) are engaged through contactordedicatedly for green Belt development, WasteManagement and Environment Monitoring andSampling.
In addition, the Project management has engagedone person from each department as EnvironmentChampion for implementing the environmentalManagement system at site. The DepartmentalChampion will implement the system and inform theobservation to EMC personnel for further action, ifany.The sampling and analysis of environmentalparameters is been carried out by Scientific Researchlaboratory (MoEF recognized).
vii
As proposed, Rs. 7.80 Crores earmarked forenvironment protection and pollution controlmeasures shall be used to implement theconditions stipulated by the Ministry of
The environment expenditure for the environmentactivities has been attached as Annexure VIII.
Page | 13
Sr.No.
EC Conditions Compliance Status
General Condition
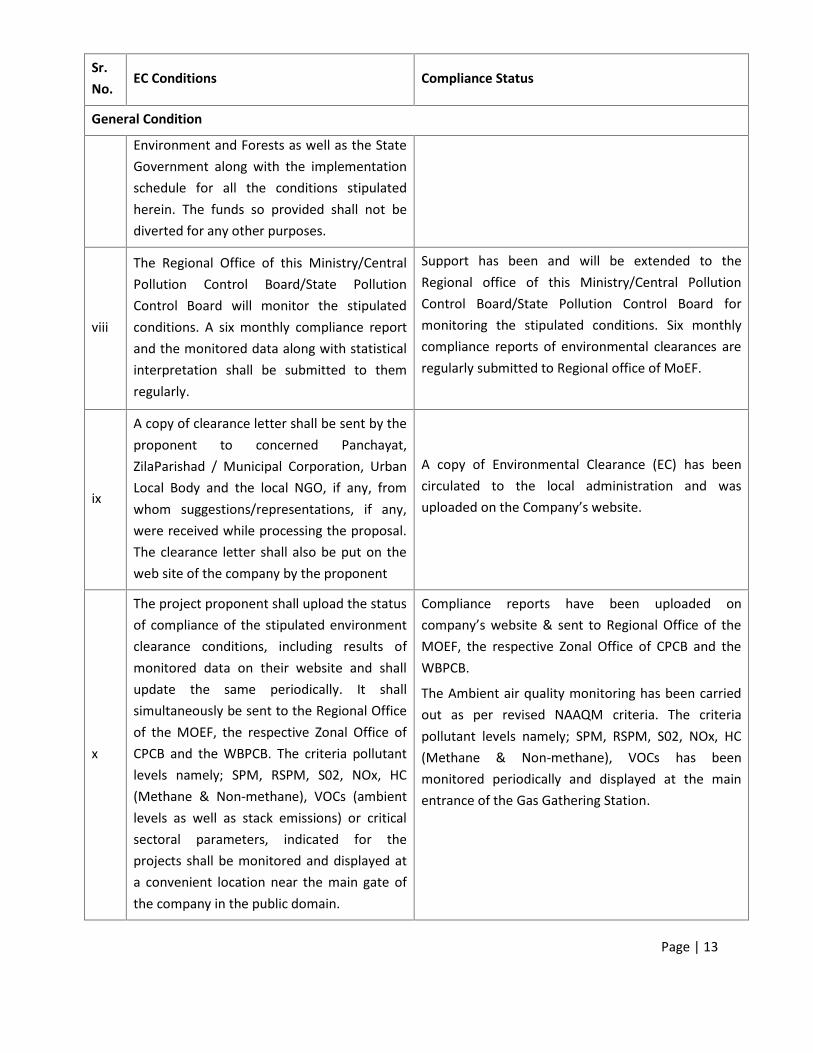
Environment and Forests as well as the StateGovernment along with the implementationschedule for all the conditions stipulatedherein. The funds so provided shall not bediverted for any other purposes.
viii
The Regional Office of this Ministry/CentralPollution Control Board/State PollutionControl Board will monitor the stipulatedconditions. A six monthly compliance reportand the monitored data along with statisticalinterpretation shall be submitted to themregularly.
Support has been and will be extended to theRegional office of this Ministry/Central PollutionControl Board/State Pollution Control Board formonitoring the stipulated conditions. Six monthlycompliance reports of environmental clearances areregularly submitted to Regional office of MoEF.
ix
A copy of clearance letter shall be sent by theproponent to concerned Panchayat,ZilaParishad / Municipal Corporation, UrbanLocal Body and the local NGO, if any, fromwhom suggestions/representations, if any,were received while processing the proposal.The clearance letter shall also be put on theweb site of the company by the proponent
A copy of Environmental Clearance (EC) has beencirculated to the local administration and wasuploaded on the Company’s website.
x
The project proponent shall upload the statusof compliance of the stipulated environmentclearance conditions, including results ofmonitored data on their website and shallupdate the same periodically. It shallsimultaneously be sent to the Regional Officeof the MOEF, the respective Zonal Office ofCPCB and the WBPCB. The criteria pollutantlevels namely; SPM, RSPM, S02, NOx, HC(Methane & Non-methane), VOCs (ambientlevels as well as stack emissions) or criticalsectoral parameters, indicated for theprojects shall be monitored and displayed ata convenient location near the main gate ofthe company in the public domain.
Compliance reports have been uploaded oncompany’s website & sent to Regional Office of theMOEF, the respective Zonal Office of CPCB and theWBPCB.
The Ambient air quality monitoring has been carriedout as per revised NAAQM criteria. The criteriapollutant levels namely; SPM, RSPM, S02, NOx, HC(Methane & Non-methane), VOCs has beenmonitored periodically and displayed at the mainentrance of the Gas Gathering Station.

Page | 14
Sr.No.
EC Conditions Compliance Status
General Condition
xi
The project proponent shall also submit sixmonthly reports on the status of thecompliance of the stipulated environmentalconditions including results of monitoreddata (both in hard copies as well as by e-mail)to the Regional Office of MOEF, therespective Zonal Office of CPCB and theWBPCB. The Regional Office of this Ministry/CPCB / WBPCB shall monitor the stipulatedconditions
We are submitting the six monthly compliancereports on the status of the compliance of thestipulated environmental conditions including resultsof monitored data (both in hard copies as well as bye-mail) to the Regional Office of MOEF, therespective Zonal Office of CPCB and the WBPCB.
xii
The environmental statement for eachfinancial year ending 31st March in Form-V asis mandated to be submitted by the projectproponent to the concerned State PollutionControl Board as prescribed under theEnvironment (Protection) Rules, 1986, asamended subsequently, shall also be put onthe website of the company along with thestatus of compliance of environmentalconditions and shall also be sent to therespective Regional Offices of the MOEF by e-mail.
The environmental statement for each financial yearending 31st March in Form-V as is being regularlysubmitted to West Bengal Pollution Control Boardand the same will be uploaded on the company’swebsite along with the status of compliance report.
Xiii
The Project Proponent shall inform the publicthat. The project has been accordedenvironmental clearance by the Ministry andcopies of the clearance letter are availablewith the WBPCB and may also be seen atWebsite of the Ministry of Environment andForests at http:/envfor.nic.in. This shall beadvertised within seven days from the date ofissue of the clearance letter, at least in twolocal newspapers that are widely circulated in
The advertisement was published in The TelegraphCalcutta and Anand Bazaar Pathrika on 30thSeptember, 2011. A copy of the same has beensubmitted in the compliance report during the periodApr’11-Sep’11.

Page | 15
Sr.No.
EC Conditions Compliance Status
General Condition
the region of which one shall be in thevernacular language of the locality concernedand a copy of the same shall be forwarded tothe Regional office
Xiv
Project authorities shall inform the RegionalOffice as well as the Ministry, the date offinancial closure and final approval of theproject by the concerned authorities and thedate of commencing the land developmentwork
Financial closure has been prepared in the year of2010. The development work was commenced on 7thDec, 2011 after obtaining consent to establish fromWBPCB.
Page | 1
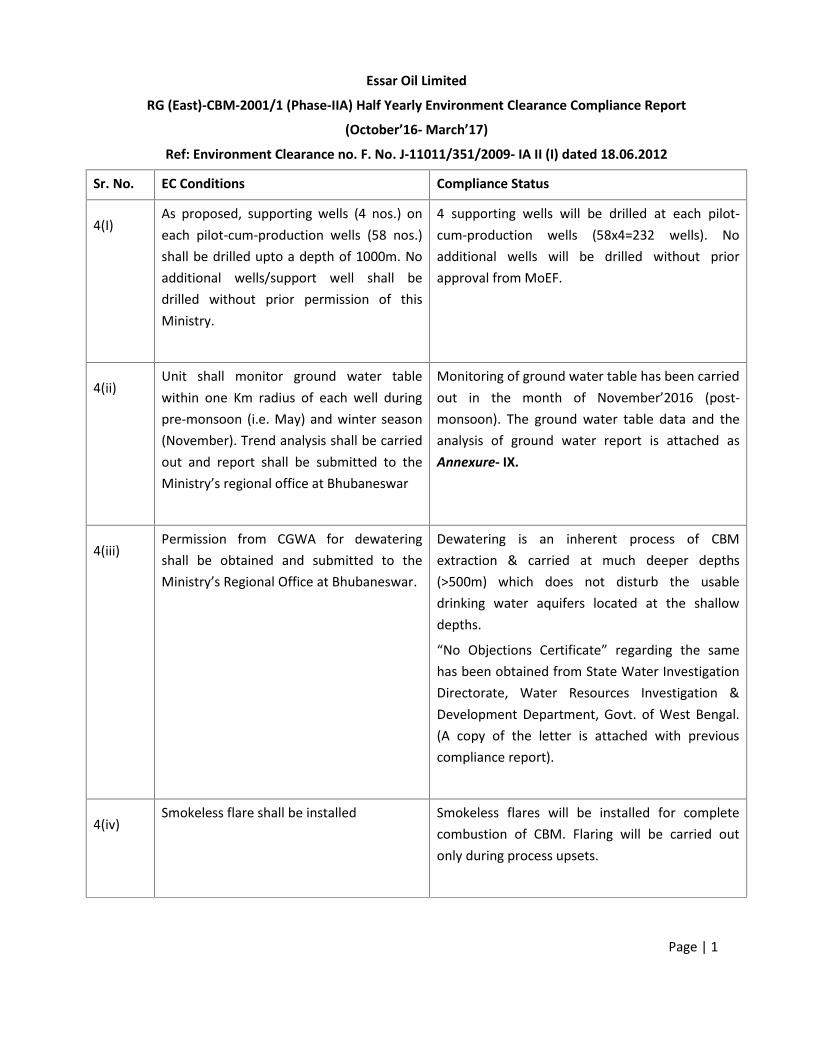
Essar Oil Limited
RG (East)-CBM-2001/1 (Phase-IIA) Half Yearly Environment Clearance Compliance Report
(October’16- March’17)
Ref: Environment Clearance no. F. No. J-11011/351/2009- IA II (I) dated 18.06.2012
Sr. No. EC Conditions Compliance Status
4(I)As proposed, supporting wells (4 nos.) oneach pilot-cum-production wells (58 nos.)shall be drilled upto a depth of 1000m. Noadditional wells/support well shall bedrilled without prior permission of thisMinistry.
4 supporting wells will be drilled at each pilot-cum-production wells (58x4=232 wells). Noadditional wells will be drilled without priorapproval from MoEF.
4(ii)Unit shall monitor ground water tablewithin one Km radius of each well duringpre-monsoon (i.e. May) and winter season(November). Trend analysis shall be carriedout and report shall be submitted to theMinistry’s regional office at Bhubaneswar
Monitoring of ground water table has been carriedout in the month of November’2016 (post-monsoon). The ground water table data and theanalysis of ground water report is attached asAnnexure- IX.
4(iii)Permission from CGWA for dewateringshall be obtained and submitted to theMinistry’s Regional Office at Bhubaneswar.
Dewatering is an inherent process of CBMextraction & carried at much deeper depths(>500m) which does not disturb the usabledrinking water aquifers located at the shallowdepths.
“No Objections Certificate” regarding the samehas been obtained from State Water InvestigationDirectorate, Water Resources Investigation &Development Department, Govt. of West Bengal.(A copy of the letter is attached with previouscompliance report).
4(iv)Smokeless flare shall be installed Smokeless flares will be installed for complete
combustion of CBM. Flaring will be carried outonly during process upsets.

Page | 2
Sr. No. EC Conditions Compliance Status
4(v)All measures shall be taken to control noisepollution during drilling process. Acousticenclosure/barrier shall be installed
Only silent DG sets meeting the specifications ofCPCB are used. Acoustic enclosures have beenprovided to major noise generating equipment(Diesel Generators Sets). Earplugs have beenprovided to the working personnel at the site.
4(vi)Any produced water shall be treated andrecycled/reused within the project area.Any excess water shall be discharged aftertreatment and meeting the standardsprescribed by the CPCB/SPCB. Regularwater quality monitoring shall be carriedout and monitoring report shall besubmitted to the respective Regional Officeof the MoEF.
Produced water is treated by Reverse OsmosisSystem. Treated water is being used for drilling &construction activities of other wells. Excess waterwill be discharged to the streams only aftermeeting the discharge standards. Treated Waterquality monitoring reports are attached asAnnexure-IV and discharged water qualitymonitoring reports are attached as Annexure IV(a).
4(vii)Approach road shall be constructed prior tothe drilling
Approach roads are being constructed whereverthe access is not available.
4(viii)Land subsidence shall be monitoredregularly and monitoring report shall besubmitted to CPCB, SPCB and respectiveMinistry’s regional office
Half yearly subsidence monitoring was performedat all Monitoring Stations established by NationalInstitute of Technology (NIT), Durgapur inMarch’2017.The Subsidence study report is awaited from NIT,Durgapur.
5All the specific conditions and generalconditions specified in the environmentalclearance accorded vide Ministry’s letterno.J-11011/351/2009-IA II (I) dated 23rdSeptember, 2011 shall be implemented
All the specific and general conditions of thePhase-II Environmental Clearance are beingimplemented.
6Consent to Establish & Operate for therevised proposal shall be obtained from theW.B. Pollution Control Board
Regular CTE & CTO will be obtained from PollutionControl Board and will be submitted to MoEF.
7No further expansion or modifications inthe plant shall be carried out without priorapproval of the Ministry of Environmentand Forests. In case of deviations oralterations in the project proposal from
No further expansion or modification will be donein the project configuration without prior approvalfrom the MoEF.
Page | 3
Sr. No. EC Conditions Compliance Status
those submitted to this Ministry forclearance, a fresh reference shall be madeto the Ministry to assess the adequacy ofconditions imposed and to add additionalenvironmental protection measures ifrequired, if any.

Ambient Air Quality of Surrounding Villages of CBM Raniganj Project by Essar Oil Limited (EP Division)Compliance Period: Oct'16 to Mar'17
ANNEXURE I
Oct'16 Nov'16 Dec'16 Jan'17 Feb'17 Mar'171 Particulate Matter (PM2.5) µg/m3 60 (24 hrs) 29.1 54.5 58.9 58.3 62.7 35.82 Particulate Matter 10 (PM10) µg/m3 100 (24 hrs) 77.19 156.84 145.98 108.60 173.26 64.733 Nitrogen Dioxide (NO2) µg/m3 80 (24 hrs) 32.19 32.78 37.32 31.80 5.72 6.064 Sulphur Dioxide (SO2) µg/m3 80 (24 hrs) 6.21 6.14 6.8261007 5.84 36.47 33.185 Carbon Monoxide (CO) mg/m3 2 (8 hrs) 0.4 0.4 0.4 0.4 0.3 0.46 THC as Methane mg/m3 - 1.96 1.17 1.88 1.33 1.52 1.837 Mercury µg/m3 - < 0.002 - - < 0.002 - -8 Hydrocarbon as Non Methane mg/m3 - < 0.003 < 0.003 < 0.003 < 0.003 < 0.003 < 0.0039 VOCs µg/m3 - 3.1 - - 3.9 - -
10 Benzo(a)Pyrene ng/m3 1 0.61 - - 0.56 - -11 Ammonia (NH3) g/m3 400 26.46 - - 21.6 - -12 Ozone (O3) g/m3 100 36 - - 35.02 - -13 Lead (Pb) g/m3 1 0.11 - - 0.18 - -14 Nickel (Ni) ng/m3 20 8.52 - - 14.96 - -15 Arsenic ng/m3 6 1.12 - - 1.32 - -16 Benzene g/m3 5 2.03 - - 2.76 - -
NAAQS LimitUnitParameterS. NO.GGS 1
Ambient Air Quality of Surrounding Villages of CBM Raniganj Project by Essar Oil Limited (EP Division)Compliance Period: Oct'16 to Mar'17
ANNEXURE I
1 Particulate Matter (PM2.5) µg/m3 60 (24 hrs)2 Particulate Matter 10 (PM10) µg/m3 100 (24 hrs)3 Nitrogen Dioxide (NO2) µg/m3 80 (24 hrs)4 Sulphur Dioxide (SO2) µg/m3 80 (24 hrs)5 Carbon Monoxide (CO) mg/m3 2 (8 hrs)6 THC as Methane mg/m3 -7 Mercury µg/m3 -8 Hydrocarbon as Non Methane mg/m3 -9 VOCs µg/m3 -
10 Benzo(a)Pyrene ng/m3 111 Ammonia (NH3) g/m3 40012 Ozone (O3) g/m3 10013 Lead (Pb) g/m3 114 Nickel (Ni) ng/m3 2015 Arsenic ng/m3 616 Benzene g/m3 5
NAAQS LimitUnitParameterS. NO.Oct'16 Nov'16 Dec'16 Jan'17 Feb'17 Mar'1725.42 70.63 46.18 57.36 59.93 34.4268.35 176.88 88.92 146.32 155.35 75.3331.4 34.9 37.67 37.1 5.6 6.46.1 6.8 6.90 7.3 35.7 32.7
0.40 0.35 0.354 0.36 0.37 0.401.62 1.59 1.47 1.76 1.38 1.56
< 0.002 - - < 0.002 - -< 0.003 < 0.003 < 0.003 < 0.003 < 0.003 < 0.003
2.9 - - 4.6 - -0.5 - - 0.9 - -
20.83 - - 20.24 - -34.54 - - 29.26 - -0.09 - - 0.17 - -8.56 - - 15.65 - -1.26 - - 1.3 - -1.92 - - 3.39 - -
JATGORIA

Ambient Air Quality of Surrounding Villages of CBM Raniganj Project by Essar Oil Limited (EP Division)Compliance Period: Oct'16 to Mar'17
ANNEXURE I
1 Particulate Matter (PM2.5) µg/m3 60 (24 hrs)2 Particulate Matter 10 (PM10) µg/m3 100 (24 hrs)3 Nitrogen Dioxide (NO2) µg/m3 80 (24 hrs)4 Sulphur Dioxide (SO2) µg/m3 80 (24 hrs)5 Carbon Monoxide (CO) mg/m3 2 (8 hrs)6 THC as Methane mg/m3 -7 Mercury µg/m3 -8 Hydrocarbon as Non Methane mg/m3 -9 VOCs µg/m3 -
10 Benzo(a)Pyrene ng/m3 111 Ammonia (NH3) g/m3 40012 Ozone (O3) g/m3 10013 Lead (Pb) g/m3 114 Nickel (Ni) ng/m3 2015 Arsenic ng/m3 616 Benzene g/m3 5
NAAQS LimitUnitParameterS. NO.Oct'16 Nov'16 Dec'16 Jan'17 Feb'17 Mar'1742.21 51.7 51.33 50.3 28.28 48.8599.24 122.56 90.21 135.22 67.29 129.3634.94 28.95 30.80829 32.62 6.44 6.26.22 6.18 6.212357 5.9 34.84 34.50.434 0.462 0.462 0.398 0.422 0.341.48 1.48 1.31 1.45 1.56 1.32
< 0.002 - - < 0.002 - -< 0.003 < 0.003 < 0.003 < 0.003 < 0.003 < 0.003
3.04 - - 4.22 - -0.69 - - 0.82 - -22.52 - - 21.37 - -44.68 - - 40.37 - -0.15 - - 0.14 - -12.36 - - 10.42 - -1.32 - - 1.28 - -2.12 - - 3.04 - -
MCS

Ambient Air Quality of Surrounding Villages of CBM Raniganj Project by Essar Oil Limited (EP Division)Compliance Period: Oct'16 to Mar'17
ANNEXURE I
1 Particulate Matter (PM2.5) µg/m3 60 (24 hrs)2 Particulate Matter 10 (PM10) µg/m3 100 (24 hrs)3 Nitrogen Dioxide (NO2) µg/m3 80 (24 hrs)4 Sulphur Dioxide (SO2) µg/m3 80 (24 hrs)5 Carbon Monoxide (CO) mg/m3 2 (8 hrs)6 THC as Methane mg/m3 -7 Mercury µg/m3 -8 Hydrocarbon as Non Methane mg/m3 -9 VOCs µg/m3 -
10 Benzo(a)Pyrene ng/m3 111 Ammonia (NH3) g/m3 40012 Ozone (O3) g/m3 10013 Lead (Pb) g/m3 114 Nickel (Ni) ng/m3 2015 Arsenic ng/m3 616 Benzene g/m3 5
NAAQS LimitUnitParameterS. NO.Oct'16 Nov'16 Dec'16 Jan'17 Feb'17 Mar'1751.79 57.6 47.38 55.07 68.74 48.5
122.53 134.16 82.27 135.89 168.76 104.6136.5 32.1 33.05 35.58 6.38 6.197.52 6.6 6.71 6.29 35.36 34.280.356 0.284 0.284 0.368 0.402 0.38
1.3 1.39 1.24 1.58 1.54 1.66< 0.002 - - < 0.002 - -< 0.003 < 0.003 < 0.003 < 0.003 < 0.003 < 0.003
4.02 - - 4.13 - -0.95 - - 0.68 - -26.49 - - 20.97 - -47.16 - - 34.26 - -0.17 - - 0.22 - -11.51 - - 15.6 - -1.39 - - 1.2 - -3.17 - - 3.25 - -
KULDIHA

Ambient Air Quality of Surrounding Villages of CBM Raniganj Project by Essar Oil Limited (EP Division)Compliance Period: Oct'16 to Mar'17
ANNEXURE I
1 Particulate Matter (PM2.5) µg/m3 60 (24 hrs)2 Particulate Matter 10 (PM10) µg/m3 100 (24 hrs)3 Nitrogen Dioxide (NO2) µg/m3 80 (24 hrs)4 Sulphur Dioxide (SO2) µg/m3 80 (24 hrs)5 Carbon Monoxide (CO) mg/m3 2 (8 hrs)6 THC as Methane mg/m3 -7 Mercury µg/m3 -8 Hydrocarbon as Non Methane mg/m3 -9 VOCs µg/m3 -
10 Benzo(a)Pyrene ng/m3 111 Ammonia (NH3) g/m3 40012 Ozone (O3) g/m3 10013 Lead (Pb) g/m3 114 Nickel (Ni) ng/m3 2015 Arsenic ng/m3 616 Benzene g/m3 5
NAAQS LimitUnitParameterS. NO.Oct'16 Nov'16 Dec'16 Jan'17 Feb'17 Mar'1732.13 68.2 68.29 42.66 41.70 45.4383.38 187.91 173.52 93.25 116.78 113.9432.12 34.89 32.26562 31.8 5.6 5.8
5.5 6.17 6.188845 5.1 36.6 38.10.426 0.398 0.398 0.40 0.41 0.341.64 1.88 1.96 1.24 1.56 1.49
< 0.002 - - < 0.002 - -< 0.003 < 0.003 < 0.003 < 0.003 < 0.003 < 0.003
2.39 - - 2.73 - -0.82 - - 0.37 - -24.27 - - 17.64 - -42.63 - - 36.26 - -0.15 - - 0.15 - -11.29 - - 9.78 - -
1.1 - - 1.2 - -1.75 - - 1.89 - -
GOPALPUR
Ambient Air Quality of Surrounding Villages of CBM Raniganj Project by Essar Oil Limited (EP Division)Compliance Period: Oct'16 to Mar'17
ANNEXURE I
1 Particulate Matter (PM2.5) µg/m3 60 (24 hrs)2 Particulate Matter 10 (PM10) µg/m3 100 (24 hrs)3 Nitrogen Dioxide (NO2) µg/m3 80 (24 hrs)4 Sulphur Dioxide (SO2) µg/m3 80 (24 hrs)5 Carbon Monoxide (CO) mg/m3 2 (8 hrs)6 THC as Methane mg/m3 -7 Mercury µg/m3 -8 Hydrocarbon as Non Methane mg/m3 -9 VOCs µg/m3 -
10 Benzo(a)Pyrene ng/m3 111 Ammonia (NH3) g/m3 40012 Ozone (O3) g/m3 10013 Lead (Pb) g/m3 114 Nickel (Ni) ng/m3 2015 Arsenic ng/m3 616 Benzene g/m3 5
NAAQS LimitUnitParameterS. NO.Oct'16 Nov'16 Dec'16 Jan'17 Feb'17 Mar'1743.24 55.64 64.75 57.52 50.95541 55.51
101.47 153.64 143.33 152.3 142.8296 145.0334.25 30.26 31.8623 39.73 6.01 5.47
6.3 6.4 6.796678 6.22 32.91 31.560.472 0.418 0.418 0.466 0.478 0.4191.52 1.32 1.75 1.75 1.64 1.78
< 0.002 - - < 0.002 - -< 0.003 < 0.003 < 0.003 < 0.003 < 0.003 < 0.003
3.57 - - 4.76 - -0.74 - - 0.89 - -
27.84 - - 26.13 - -36.46 - - 37.26 - -0.16 - - 0.18 - -
14.43 - - 12.87 - -1.2 - - 1.21 - -
2.39 - - 3.89 - -
GGS 2

Ambient Air Quality of Surrounding Villages of CBM Raniganj Project by Essar Oil Limited (EP Division)Compliance Period: Oct'16 to Mar'17
ANNEXURE I
1 Particulate Matter (PM2.5) µg/m3 60 (24 hrs)2 Particulate Matter 10 (PM10) µg/m3 100 (24 hrs)3 Nitrogen Dioxide (NO2) µg/m3 80 (24 hrs)4 Sulphur Dioxide (SO2) µg/m3 80 (24 hrs)5 Carbon Monoxide (CO) mg/m3 2 (8 hrs)6 THC as Methane mg/m3 -7 Mercury µg/m3 -8 Hydrocarbon as Non Methane mg/m3 -9 VOCs µg/m3 -
10 Benzo(a)Pyrene ng/m3 111 Ammonia (NH3) g/m3 40012 Ozone (O3) g/m3 10013 Lead (Pb) g/m3 114 Nickel (Ni) ng/m3 2015 Arsenic ng/m3 616 Benzene g/m3 5
NAAQS LimitUnitParameterS. NO.Oct'16 Nov'16 Dec'16 Jan'17 Feb'17 Mar'1730.4 69.46 77.60 41.12 45.75 51.9975.29 169.58 169.50 99.58 84.55 143.7835.32 30.02 37.66 39.68 6.07 5.735.94 5.55 6.58 6.52 34.15 32.240.416 0.392 0.392 0.384 0.398 0.4081.44 1.36 1.71 1.39 1.62 1.74
< 0.002 - - < 0.002 - -< 0.003 < 0.003 < 0.003 < 0.003 < 0.003 < 0.003
2.57 - - 3.68 - -0.71 - - 0.45 - -24.21 - - 18.43 - -42.1 - - 40.36 - -0.14 - - 0.16 - -10.48 - - 13.17 - -1.11 - - 1.3 - -1.64 - - 2.37 - -
SARENGA

Ambient Air Quality of Surrounding Villages of CBM Raniganj Project by Essar Oil Limited (EP Division)Compliance Period: Oct'16 to Mar'17
ANNEXURE I
1 Particulate Matter (PM2.5) µg/m3 60 (24 hrs)2 Particulate Matter 10 (PM10) µg/m3 100 (24 hrs)3 Nitrogen Dioxide (NO2) µg/m3 80 (24 hrs)4 Sulphur Dioxide (SO2) µg/m3 80 (24 hrs)5 Carbon Monoxide (CO) mg/m3 2 (8 hrs)6 THC as Methane mg/m3 -7 Mercury µg/m3 -8 Hydrocarbon as Non Methane mg/m3 -9 VOCs µg/m3 -
10 Benzo(a)Pyrene ng/m3 111 Ammonia (NH3) g/m3 40012 Ozone (O3) g/m3 10013 Lead (Pb) g/m3 114 Nickel (Ni) ng/m3 2015 Arsenic ng/m3 616 Benzene g/m3 5
NAAQS LimitUnitParameterS. NO.Oct'16 Nov'16 Dec'16 Jan'17 Feb'17 Mar'1755.39 69.68 67.68 57.05 56.20 81.13
122.13 167.51 169.04 148.89 161.51 177.1540.11 36.63 33.53133998 41.42 6.18 5.84
6.9 6.63 6.018432322 5.14 34.24 34.410.464 0.388 0.388 0.432 0.455 0.2841.53 1.55 1.89 1.98 1.62 1.43
< 0.002 - - < 0.002 - -< 0.003 < 0.003 < 0.003 < 0.003 < 0.003 < 0.003
4.05 - - 4.74 - -0.94 - - 0.93 - -23.65 - - 18.26 - -33.76 - - 39.82 - -0.16 - - 0.19 - -12.37 - - 11.72 - -1.41 - - 1.42 - -3.14 - - 3.77 - -
DHABANI

Ambient Air Quality of Surrounding Villages of CBM Raniganj Project by Essar Oil Limited (EP Division)Compliance Period: Oct'16 to Mar'17
ANNEXURE I
1 Particulate Matter (PM2.5) µg/m3 60 (24 hrs)2 Particulate Matter 10 (PM10) µg/m3 100 (24 hrs)3 Nitrogen Dioxide (NO2) µg/m3 80 (24 hrs)4 Sulphur Dioxide (SO2) µg/m3 80 (24 hrs)5 Carbon Monoxide (CO) mg/m3 2 (8 hrs)6 THC as Methane mg/m3 -7 Mercury µg/m3 -8 Hydrocarbon as Non Methane mg/m3 -9 VOCs µg/m3 -
10 Benzo(a)Pyrene ng/m3 111 Ammonia (NH3) g/m3 40012 Ozone (O3) g/m3 10013 Lead (Pb) g/m3 114 Nickel (Ni) ng/m3 2015 Arsenic ng/m3 616 Benzene g/m3 5
NAAQS LimitUnitParameterS. NO.Oct'16 Nov'16 Dec'16 Jan'17 Feb'17 Mar'1743.55 44.71 53.28 68.54 46.72 37.61
119.13 96.25 116.25 148.57 129.94 80.2938.58 31.8 41.25519593 36.62 6.43 6.596.62 6.98 7.642543358 6.87 35.24 36.550.506 0.464 0.464 0.484 0.432 0.3981.42 1.69 1.63 1.64 1.78 1.53
< 0.002 - - < 0.002 - -< 0.003 < 0.003 < 0.003 < 0.003 < 0.003 < 0.003
4.04 - - 4.91 - -0.87 - - 0.79 - -16.89 - - 15.73 - -36.14 - - 38.26 - -0.15 - - 0.24 - -12.47 - - 14.15 - -1.16 - - 1.13 - -3.05 - - 4.02 - -
NACHAN
Ambient Air Quality of Surrounding Villages of CBM Raniganj Project by Essar Oil Limited (EP Division)Compliance Period: Oct'16 to Mar'17
ANNEXURE I
1 Particulate Matter (PM2.5) µg/m3 60 (24 hrs)2 Particulate Matter 10 (PM10) µg/m3 100 (24 hrs)3 Nitrogen Dioxide (NO2) µg/m3 80 (24 hrs)4 Sulphur Dioxide (SO2) µg/m3 80 (24 hrs)5 Carbon Monoxide (CO) mg/m3 2 (8 hrs)6 THC as Methane mg/m3 -7 Mercury µg/m3 -8 Hydrocarbon as Non Methane mg/m3 -9 VOCs µg/m3 -
10 Benzo(a)Pyrene ng/m3 111 Ammonia (NH3) g/m3 40012 Ozone (O3) g/m3 10013 Lead (Pb) g/m3 114 Nickel (Ni) ng/m3 2015 Arsenic ng/m3 616 Benzene g/m3 5
NAAQS LimitUnitParameterS. NO.Oct'16 Nov'16 Dec'16 Jan'17 Feb'17 Mar'1740.47 59.52 67.22 62.16 42.68 42.1999.37 144.47 132.89 155.51 103.85 100.5133.4 34.26 33.30400542 35.55 6.11 6.875.56 6.64 6.4973073 6.21 36.41 42.530.348 0.308 0.308 0.322 0.356 0.3241.24 1.66 1.85 1.91 1.88 2.02
< 0.002 - - < 0.002 - -< 0.003 < 0.003 < 0.003 < 0.003 < 0.003 < 0.003
3.13 - - 4.88 - -0.76 - - 0.91 - -18.02 - - 17.13 - -37.73 - - 36.28 - -0.14 - - 0.2 - -9.24 - - 16.72 - -1.1 - - 1.31 - -
2.24 - - 4.06 - -
GHATAKDANGA

Ambient Air Quality of Surrounding Villages of CBM Raniganj Project by Essar Oil Limited (EP Division)Compliance Period: Oct'16 to Mar'17
ANNEXURE I
1 Particulate Matter (PM2.5) µg/m3 60 (24 hrs)2 Particulate Matter 10 (PM10) µg/m3 100 (24 hrs)3 Nitrogen Dioxide (NO2) µg/m3 80 (24 hrs)4 Sulphur Dioxide (SO2) µg/m3 80 (24 hrs)5 Carbon Monoxide (CO) mg/m3 2 (8 hrs)6 THC as Methane mg/m3 -7 Mercury µg/m3 -8 Hydrocarbon as Non Methane mg/m3 -9 VOCs µg/m3 -
10 Benzo(a)Pyrene ng/m3 111 Ammonia (NH3) g/m3 40012 Ozone (O3) g/m3 10013 Lead (Pb) g/m3 114 Nickel (Ni) ng/m3 2015 Arsenic ng/m3 616 Benzene g/m3 5
NAAQS LimitUnitParameterS. NO.Oct'16 Nov'16 Dec'16 Jan'17 Feb'17 Mar'1753.57 67.07 51.06 50.12 61.67 30.49
113.93 195.14 107.85 136.55 152.44 66.6438.76 36.54 39.826258 32.76 5.76 6.297.11 6.92 6.9760563 6.85 37.73 42.91
0.584 0.476 0.476 0.488 0.426 0.3921.38 1.84 1.57 1.51 1.84 1.97
< 0.002 - - < 0.002 - -< 0.003 < 0.003 < 0.003 < 0.003 < 0.003 < 0.003
3.97 - - 4.48 - -0.82 - - 0.71 - -
21.96 - - 27.42 - -33.53 - - 37.36 - -
0.15 - - 0.2 - -12.5 - - 16.1 - -1.21 - - 1.11 - -2.84 - - 3.64 - -
KANTABERIA

Ambient Air Quality of Surrounding Villages of CBM Raniganj Project by Essar Oil Limited (EP Division)Compliance Period: Oct'16 to Mar'17
ANNEXURE I
1 Particulate Matter (PM2.5) µg/m3 60 (24 hrs)2 Particulate Matter 10 (PM10) µg/m3 100 (24 hrs)3 Nitrogen Dioxide (NO2) µg/m3 80 (24 hrs)4 Sulphur Dioxide (SO2) µg/m3 80 (24 hrs)5 Carbon Monoxide (CO) mg/m3 2 (8 hrs)6 THC as Methane mg/m3 -7 Mercury µg/m3 -8 Hydrocarbon as Non Methane mg/m3 -9 VOCs µg/m3 -
10 Benzo(a)Pyrene ng/m3 111 Ammonia (NH3) g/m3 40012 Ozone (O3) g/m3 10013 Lead (Pb) g/m3 114 Nickel (Ni) ng/m3 2015 Arsenic ng/m3 616 Benzene g/m3 5
NAAQS LimitUnitParameterS. NO.Oct'16 Nov'16 Dec'16 Jan'17 Feb'17 Mar'1732.26 47.57 57.05 67.82 36.53 49.3482.92 119.39 120.45 161.74 60.09 87.6234.69 28.6 35.537967 36.39 6.06 6.826.18 5.35 6.8004601 6.78 34.98 41.47
0.418 0.386 0.386 0.386 0.386 0.3581.3 1.24 1.66 1.67 1.74 1.67
< 0.002 - - < 0.002 - -< 0.003 < 0.003 < 0.003 < 0.003 < 0.003 < 0.003
2.82 - - 4.58 - -0.64 - - 0.98 - -
20.83 - - 23.36 - -36.14 - - 40.37 - -0.16 - - 0.19 - -
10.37 - - 14.54 - -1.22 - - 1.27 - -1.97 - - 3.52 - -
PRATAPPUR

Produced Water Analysis Report of CBM Raniganj Project E1 Division(Compliance Period: Oct'16 - Mar'17)
ANNEXURE II
S. No. Parameter Unit
CPCB Limit forDischarge of
EnvironmentalPollutants (Inland
surface water)
EDN-172 V1 EDN-169 V1 EDN-103 D1 EDIE-115 V1 EDI-042 V1
03.10.2016 03.10.2016 03.10.2016 03.10.2016 03.10.20161 pH 5.5 to 9.0 6.72 6.81 7.13 7.98 7.532 Total Suspended Solids mg/l 100 70 88 21 8 43 Total Dissolved Solids mg/l --- 11120 10722 10242 2648 94224 Turbidity NTU --- 621 922 130.6 32.9 12.55 Acidity as CaCO3 mg/l --- 33.3 29.4 25.5 27.4 24
6 Total Alkalinity as Calcium Carbonate mg/l --- 1634.9 1406.1 1227.2 432.6 1069.2
7 Chloride mg/l --- 7561.5 6939.3 4163.6 1005 3110.78 Total Hardness mg/l --- 1497.7 1148.5 356.9 54.3 3229 Sulphate mg/l --- 14.8 12.7 10.8 <2.5 11.810 Calcium mg/l 432.3 381 105.7 15.6 99.511 Magnesium mg/l --- 101.8 48.1 22.6 3.8 17.912 Dissolved Oxygen mg/l --- 5.9 6.2 6 5.7 5.6
13 Biological Oxygen Demand, 3 Days at27ºC mg/l 30 5 4 3 2 <2
14 Chemical Oxygen Demand mg/l 250 25 22.6 18 10 <815 Oil & Grease(Hexane Extract) mg/l 10 <5.0 <5.0 <5.0 <5.0 <5.0
16 Phenolic Compounds (as C6H5OH) mg/l 1 <0.001 <0.001 <0.001 <0.001 <0.001
17 Sulphide mg/l 2 <0.5 <0.5 <0.5 <0.5 <0.518 Fluoride mg/l 2 9.5 8.6 7.3 2.4 3.819 Ammoniacal Nitrogen mg/l --- 6.07 4.93 4.3 1.48 4.4820 Iron mg/l --- 63.2 71.7 42.2 3.1 0.9321 Total Chromium mg/l 2 <0.05 <0.05 <0.05 <0.05 <0.0522 Zinc mg/l --- 0.017 0.018 0.025 0.019 0.02723 Copper mg/l --- <0.05 <0.05 <0.05 <0.05 <0.0524 Nickel mg/l <0.05 <0.05 <0.05 <0.05 <0.0525 Total Arsenic mg/l <0.01 <0.01 <0.01 <0.01 <0.0126 Lead mg/l <0.1 <0.1 <0.1 <0.1 <0.1
Date

Produced Water Analysis Report of CBM Raniganj Project E2 Division(Compliance Period: Oct'16 - Mar'17)
ANNEXURE II
S. No. Parameter Unit
CPCB Limit forDischarge of
EnvironmentalPollutants (Inland
surface water)
EDN-172 V1 EDN-169 V1 EDN-103 D1 EDIE-115 V1 EDI-042 V1
27 Mercury mg/l 0.01 <0.001 <0.001 <0.001 <0.001 <0.00128 Boron mg/l <1.0 <1.0 <1.0 <1.0 <1.029 SAR --- 68.7 69.6 112.4 102.6 91.430 Phosphorus mg/l --- 0.29 0.23 0.22 0.17 0.1531 Aluminium mg/l --- <0.01 <0.01 <0.01 <0.01 <0.0132 Lithium mg/l <0.5 <0.5 <0.5 <0.5 <0.533 Manganese mg/l 0.247 0.311 0.215 0.063 <0.0534 Molybdenum mg/l --- <0.5 <0.5 <0.5 <0.5 <0.535 Palladium mg/l --- <0.5 <0.5 <0.5 <0.5 <0.536 Selenium mg/l <0.01 <0.01 <0.01 <0.01 <0.0137 Vanadium mg/l --- <0.2 <0.2 <0.2 <0.2 <0.238 Cadmium mg/l <0.01 <0.01 <0.01 <0.01 <0.0139 Cobalt mg/l <0.1 <0.1 <0.1 <0.1 <0.140 Bicarbonate mg/l --- 1944 1715.4 1497.2 527.8 13061.441 Electrical Conductivity µmhos/cm --- 17920 15950 13110 4285 126042 Sodium mg/l --- 6120 5430 4870 1750 3760
Potassium mg/l --- 11.7 10.6 10.2 6.7 8.8

Produced Water Analysis Report of CBM Raniganj Project E3 Division(Compliance Period: Oct'16 - Mar'17)
ANNEXURE II
S. No. Parameter Unit
CPCB Limit forDischarge of
EnvironmentalPollutants (Inland
surface water)
1 pH 5.5 to 9.02 Total Suspended Solids mg/l 1003 Total Dissolved Solids mg/l ---4 Turbidity NTU ---5 Acidity as CaCO3 mg/l ---
6 Total Alkalinity as Calcium Carbonate mg/l ---
7 Chloride mg/l ---8 Total Hardness mg/l ---9 Sulphate mg/l ---10 Calcium mg/l11 Magnesium mg/l ---12 Dissolved Oxygen mg/l ---
13 Biological Oxygen Demand, 3 Days at27ºC mg/l 30
14 Chemical Oxygen Demand mg/l 25015 Oil & Grease(Hexane Extract) mg/l 10
16 Phenolic Compounds (as C6H5OH) mg/l 1
17 Sulphide mg/l 218 Fluoride mg/l 219 Ammoniacal Nitrogen mg/l ---20 Iron mg/l ---21 Total Chromium mg/l 222 Zinc mg/l ---23 Copper mg/l ---24 Nickel mg/l25 Total Arsenic mg/l26 Lead mg/l
Date
EDH-035 D1 EDH-033 D5 EDH-031 V1 EDH-56 D1 EDH-11 V1
03.10.2016 03.10.2016 03.10.2016 03.10.2016 03.10.20168.07 7.95 7.32 7.54 8.759 7 8 6 <24954 3948 12028 3852 147637.8 28.4 173.4 118.4 6.811.8 19.6 23.5 25.5 Nil
740.5 278.7 1185.6 241.3 128.9
622.1 526.4 7752.9 765.7 382.850.4 38.8 985.5 58.2 316.9 6 16.7 6.4 <2.515.6 12.4 321.9 17.1 7.82.8 1.9 44.3 3.8 2.86.3 6 6.5 5.8 6
6 2 <2 3 <2
37 14 <8 22.6 <8<5.0 <5.0 <5.0 <5.0 <5.0
<0.001 <0.001 <0.001 <0.001 <0.001
<0.5 <0.5 <0.5 <0.5 <0.52.9 2.6 10.1 1.05 0.913.29 2.89 5.88 2.5 2.215.3 2.6 48 31 0.81<0.05 <0.05 <0.05 <0.05 <0.050.015 0.016 0.036 0.038 0.044<0.05 <0.05 <0.05 <0.05 <0.05<0.05 <0.05 <0.05 <0.05 <0.05<0.01 <0.01 <0.01 <0.01 <0.01<0.1 <0.1 <0.1 <0.1 <0.1

Produced Water Analysis Report of CBM Raniganj Project E4 Division(Compliance Period: Oct'16 - Mar'17)
ANNEXURE II
S. No. Parameter Unit
CPCB Limit forDischarge of
EnvironmentalPollutants (Inland
surface water)27 Mercury mg/l 0.0128 Boron mg/l29 SAR ---30 Phosphorus mg/l ---31 Aluminium mg/l ---32 Lithium mg/l33 Manganese mg/l34 Molybdenum mg/l ---35 Palladium mg/l ---36 Selenium mg/l37 Vanadium mg/l ---38 Cadmium mg/l39 Cobalt mg/l40 Bicarbonate mg/l ---41 Electrical Conductivity µmhos/cm ---42 Sodium mg/l ---
Potassium mg/l ---
EDH-035 D1 EDH-033 D5 EDH-031 V1 EDH-56 D1 EDH-11 V1
<0.001 <0.001 <0.001 <0.001 <0.001<1.0 <1.0 <1.0 <1.0 <1.0165.8 137.9 86.9 60.9 28.20.2 0.29 0.28 0.12 0.24<0.01 <0.01 <0.01 <0.01 <0.01<0.5 <0.5 <0.5 <0.5 <0.50.076 <0.05 0.143 0.108 <0.05<0.5 <0.5 <0.5 <0.5 <0.5<0.5 <0.5 <0.5 <0.5 <0.5<0.01 <0.01 <0.01 <0.01 <0.01<0.2 <0.2 <0.2 <0.2 <0.2<0.01 <0.01 <0.01 <0.01 <0.01<0.1 <0.1 <0.1 <0.1 <0.1903.4 340 1446.4 294.4 157.27983 6252 17980 5889 23562710 1980 6270 1068 3627.5 6.9 12.5 5.3 3.6
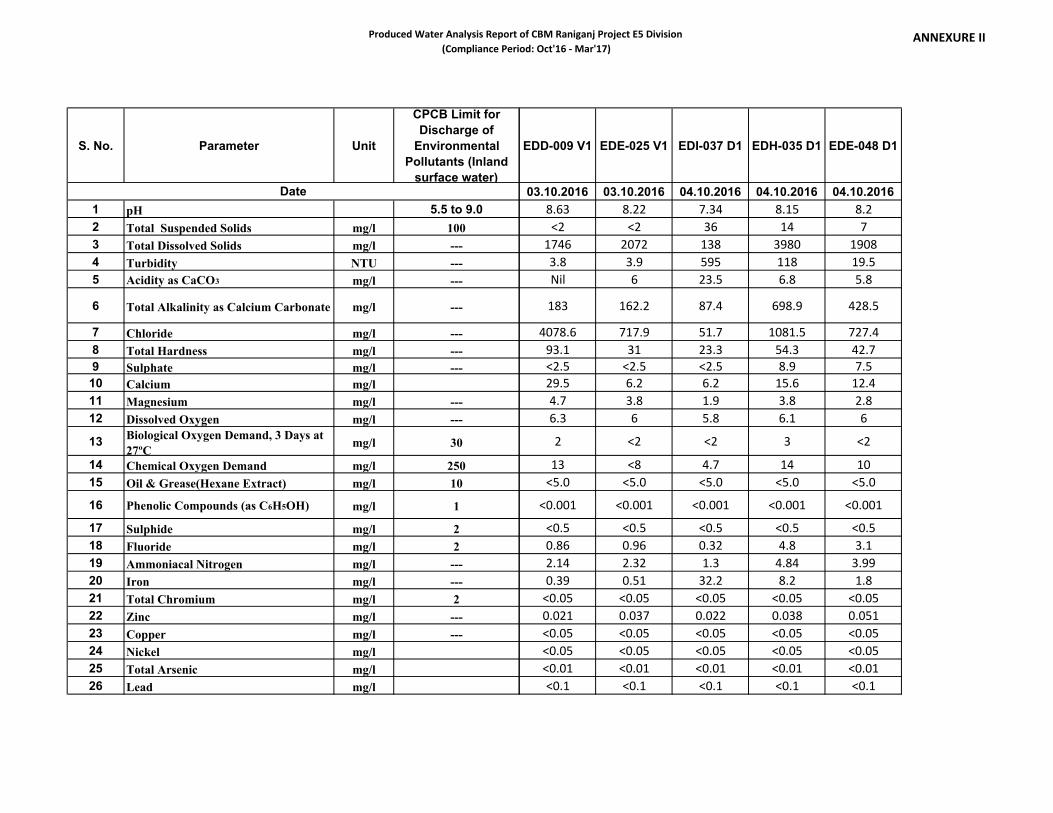
Produced Water Analysis Report of CBM Raniganj Project E5 Division(Compliance Period: Oct'16 - Mar'17)
ANNEXURE II
S. No. Parameter Unit
CPCB Limit forDischarge of
EnvironmentalPollutants (Inland
surface water)
1 pH 5.5 to 9.02 Total Suspended Solids mg/l 1003 Total Dissolved Solids mg/l ---4 Turbidity NTU ---5 Acidity as CaCO3 mg/l ---
6 Total Alkalinity as Calcium Carbonate mg/l ---
7 Chloride mg/l ---8 Total Hardness mg/l ---9 Sulphate mg/l ---10 Calcium mg/l11 Magnesium mg/l ---12 Dissolved Oxygen mg/l ---
13 Biological Oxygen Demand, 3 Days at27ºC mg/l 30
14 Chemical Oxygen Demand mg/l 25015 Oil & Grease(Hexane Extract) mg/l 10
16 Phenolic Compounds (as C6H5OH) mg/l 1
17 Sulphide mg/l 218 Fluoride mg/l 219 Ammoniacal Nitrogen mg/l ---20 Iron mg/l ---21 Total Chromium mg/l 222 Zinc mg/l ---23 Copper mg/l ---24 Nickel mg/l25 Total Arsenic mg/l26 Lead mg/l
Date
EDD-009 V1 EDE-025 V1 EDI-037 D1 EDH-035 D1 EDE-048 D1
03.10.2016 03.10.2016 04.10.2016 04.10.2016 04.10.20168.63 8.22 7.34 8.15 8.2<2 <2 36 14 71746 2072 138 3980 19083.8 3.9 595 118 19.5Nil 6 23.5 6.8 5.8
183 162.2 87.4 698.9 428.5
4078.6 717.9 51.7 1081.5 727.493.1 31 23.3 54.3 42.7<2.5 <2.5 <2.5 8.9 7.529.5 6.2 6.2 15.6 12.44.7 3.8 1.9 3.8 2.86.3 6 5.8 6.1 6
2 <2 <2 3 <2
13 <8 4.7 14 10<5.0 <5.0 <5.0 <5.0 <5.0
<0.001 <0.001 <0.001 <0.001 <0.001
<0.5 <0.5 <0.5 <0.5 <0.50.86 0.96 0.32 4.8 3.12.14 2.32 1.3 4.84 3.990.39 0.51 32.2 8.2 1.8<0.05 <0.05 <0.05 <0.05 <0.050.021 0.037 0.022 0.038 0.051<0.05 <0.05 <0.05 <0.05 <0.05<0.05 <0.05 <0.05 <0.05 <0.05<0.01 <0.01 <0.01 <0.01 <0.01<0.1 <0.1 <0.1 <0.1 <0.1
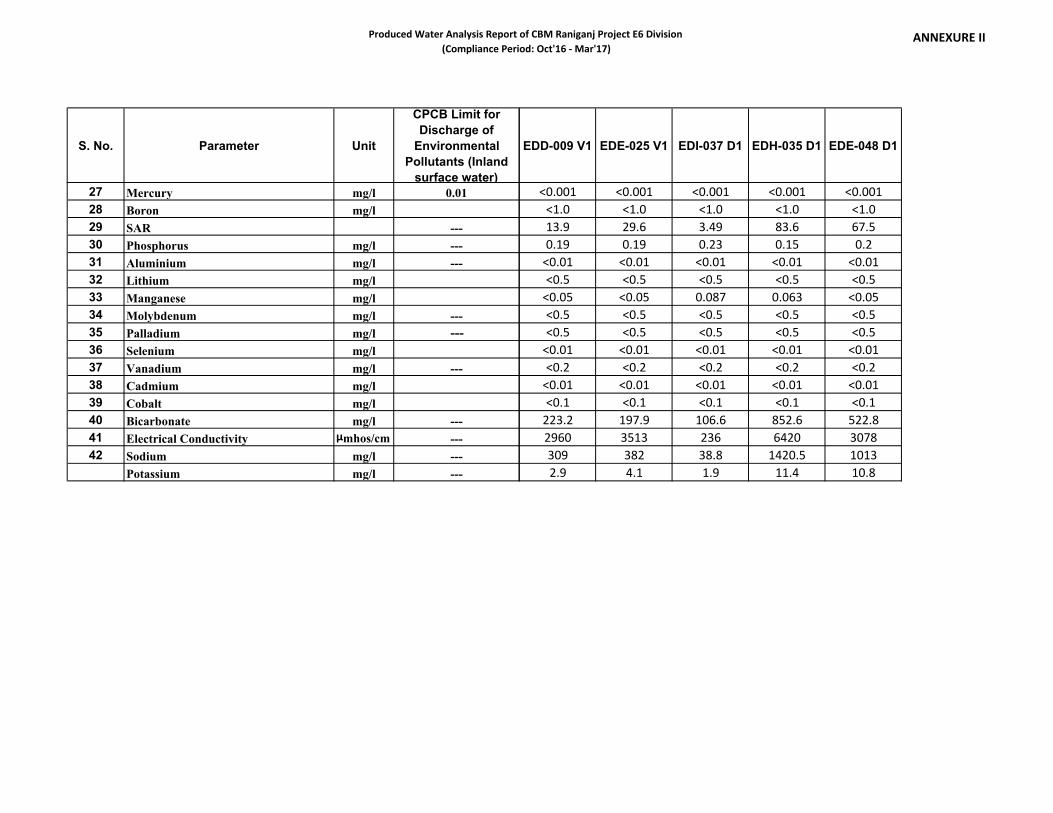
Produced Water Analysis Report of CBM Raniganj Project E6 Division(Compliance Period: Oct'16 - Mar'17)
ANNEXURE II
S. No. Parameter Unit
CPCB Limit forDischarge of
EnvironmentalPollutants (Inland
surface water)27 Mercury mg/l 0.0128 Boron mg/l29 SAR ---30 Phosphorus mg/l ---31 Aluminium mg/l ---32 Lithium mg/l33 Manganese mg/l34 Molybdenum mg/l ---35 Palladium mg/l ---36 Selenium mg/l37 Vanadium mg/l ---38 Cadmium mg/l39 Cobalt mg/l40 Bicarbonate mg/l ---41 Electrical Conductivity µmhos/cm ---42 Sodium mg/l ---
Potassium mg/l ---
EDD-009 V1 EDE-025 V1 EDI-037 D1 EDH-035 D1 EDE-048 D1
<0.001 <0.001 <0.001 <0.001 <0.001<1.0 <1.0 <1.0 <1.0 <1.013.9 29.6 3.49 83.6 67.50.19 0.19 0.23 0.15 0.2<0.01 <0.01 <0.01 <0.01 <0.01<0.5 <0.5 <0.5 <0.5 <0.5<0.05 <0.05 0.087 0.063 <0.05<0.5 <0.5 <0.5 <0.5 <0.5<0.5 <0.5 <0.5 <0.5 <0.5<0.01 <0.01 <0.01 <0.01 <0.01<0.2 <0.2 <0.2 <0.2 <0.2<0.01 <0.01 <0.01 <0.01 <0.01<0.1 <0.1 <0.1 <0.1 <0.1223.2 197.9 106.6 852.6 522.82960 3513 236 6420 3078309 382 38.8 1420.5 10132.9 4.1 1.9 11.4 10.8

Produced Water Analysis Report of CBM Raniganj Project E7 Division(Compliance Period: Oct'16 - Mar'17)
ANNEXURE II
S. No. Parameter Unit
CPCB Limit forDischarge of
EnvironmentalPollutants (Inland
surface water)
1 pH 5.5 to 9.02 Total Suspended Solids mg/l 1003 Total Dissolved Solids mg/l ---4 Turbidity NTU ---5 Acidity as CaCO3 mg/l ---
6 Total Alkalinity as Calcium Carbonate mg/l ---
7 Chloride mg/l ---8 Total Hardness mg/l ---9 Sulphate mg/l ---10 Calcium mg/l11 Magnesium mg/l ---12 Dissolved Oxygen mg/l ---
13 Biological Oxygen Demand, 3 Days at27ºC mg/l 30
14 Chemical Oxygen Demand mg/l 25015 Oil & Grease(Hexane Extract) mg/l 10
16 Phenolic Compounds (as C6H5OH) mg/l 1
17 Sulphide mg/l 218 Fluoride mg/l 219 Ammoniacal Nitrogen mg/l ---20 Iron mg/l ---21 Total Chromium mg/l 222 Zinc mg/l ---23 Copper mg/l ---24 Nickel mg/l25 Total Arsenic mg/l26 Lead mg/l
Date
EDN-174 V1 EDN-170 V1 EDD-53 V-1 EDID-50 D-2 EDD-52 D-1
03.11.2016 03.11.2016 03.11.2016 03.11.2016 03.11.20167.68 7.79 8.11 7.92 8.46<2 83 11 4 <22852 7982 2964 2662 9786.5 865 35.9 12.4 5.38.82 7.84 6.86 9.8 Nil
457.6 249.6 2475.2 931.2 999.1
972.8 2963.6 882.7 110.7 432.5257.4 1643.4 178 237.6 3967.2 21.7 6.8 10.3 12.963.5 555.5 39.6 71.4 87.224 62.5 19.2 14.4 43.35.1 4.7 4.6 5.5 4.8
2.8 8 7 2.3 2.1
14 40 38 12 10<5.0 <5.0 6.5 <5.0 <5.0
<0.001 <0.001 <0.001 <0.001 <0.001
<0.5 <0.5 <0.5 <0.5 <0.50.84 2.25 0.92 0.76 0.82.48 5.51 4.39 3.17 1.360.96 25.27 3.68 1.11 6.57<0.05 <0.05 <0.05 <0.05 <0.050.048 0.083 0.104 0.048 0.033<0.05 <0.05 <0.05 <0.05 <0.05<0.05 <0.05 <0.05 <0.05 <0.05<0.01 <0.01 <0.01 <0.01 <0.01<0.1 <0.1 <0.1 <0.1 <0.1

Produced Water Analysis Report of CBM Raniganj Project E8 Division(Compliance Period: Oct'16 - Mar'17)
ANNEXURE II
S. No. Parameter Unit
CPCB Limit forDischarge of
EnvironmentalPollutants (Inland
surface water)27 Mercury mg/l 0.0128 Boron mg/l29 SAR ---30 Phosphorus mg/l ---31 Aluminium mg/l ---32 Lithium mg/l33 Manganese mg/l34 Molybdenum mg/l ---35 Palladium mg/l ---36 Selenium mg/l37 Vanadium mg/l ---38 Cadmium mg/l39 Cobalt mg/l40 Bicarbonate mg/l ---41 Electrical Conductivity µmhos/cm ---42 Sodium mg/l ---
Potassium mg/l ---
EDN-174 V1 EDN-170 V1 EDD-53 V-1 EDID-50 D-2 EDD-52 D-1
<0.001 <0.001 <0.001 <0.001 <0.001<1.0 <1.0 <1.0 <1.0 <1.029.5 48.7 31.5 29.7 36.80.28 0.31 0.23 0.25 0.29<0.01 <0.01 <0.01 <0.01 <0.01<0.5 <0.5 <0.5 <0.5 <0.5<0.05 0.163 0.082 <0.05 <0.05<0.5 <0.5 <0.5 <0.5 <0.5<0.5 <0.5 <0.5 <0.5 <0.5<0.01 <0.01 <0.01 <0.01 <0.01<0.2 <0.2 <0.2 <0.2 <0.2<0.01 <0.01 <0.01 <0.01 <0.01<0.1 <0.1 <0.1 <0.1 <0.1558.3 304.5 3019.7 1136.1 1218.94192 11383 4532 4369 61171083 4548 968 1053 168610.8 16.6 9.6 10.1 11.2

Produced Water Analysis Report of CBM Raniganj Project E9 Division(Compliance Period: Oct'16 - Mar'17)
ANNEXURE II
S. No. Parameter Unit
CPCB Limit forDischarge of
EnvironmentalPollutants (Inland
surface water)
1 pH 5.5 to 9.02 Total Suspended Solids mg/l 1003 Total Dissolved Solids mg/l ---4 Turbidity NTU ---5 Acidity as CaCO3 mg/l ---
6 Total Alkalinity as Calcium Carbonate mg/l ---
7 Chloride mg/l ---8 Total Hardness mg/l ---9 Sulphate mg/l ---10 Calcium mg/l11 Magnesium mg/l ---12 Dissolved Oxygen mg/l ---
13 Biological Oxygen Demand, 3 Days at27ºC mg/l 30
14 Chemical Oxygen Demand mg/l 25015 Oil & Grease(Hexane Extract) mg/l 10
16 Phenolic Compounds (as C6H5OH) mg/l 1
17 Sulphide mg/l 218 Fluoride mg/l 219 Ammoniacal Nitrogen mg/l ---20 Iron mg/l ---21 Total Chromium mg/l 222 Zinc mg/l ---23 Copper mg/l ---24 Nickel mg/l25 Total Arsenic mg/l26 Lead mg/l
Date
EDD-28 D-5 EDD-29 V-1 EDH-35 D-4 EDD-24 V-1 EDE-043 V1
03.11.2016 03.11.2016 03.11.2016 03.11.2016 03.11.20167.62 8.21 8.56 7.96 8.0721 3 16 12 81536 4782 1582 998 139291.4 12.1 83.2 47.2 26.97.84 3.92 Nil 7.84 6.86
853.6 1086.4 1996.8 717.8 488.8
638.5 1528.2 622.7 387.6 352.5455.4 495 316.8 297 59.414.2 11.5 15.3 9.6 5.9103.1 158.7 87.2 79.3 15.848.1 24 24 24 4.84.4 4.8 4.7 4.5 4.2
4 3.5 19 3.5 3.3
21 18 65 17 17<5.0 <5.0 <5.0 <5.0 <5.0
<0.001 <0.001 <0.001 <0.001 <0.001
<0.5 <0.5 <0.5 <0.5 <0.51.04 0.94 0.91 0.72 0.584.62 2.79 5.88 3.62 3.329.57 1.44 8.41 4.97 4.13<0.05 <0.05 <0.05 <0.05 <0.050.138 0.045 0.246 0.121 0.098<0.05 <0.05 <0.05 <0.05 <0.05<0.05 <0.05 <0.05 <0.05 <0.05<0.01 <0.01 <0.01 <0.01 <0.01<0.1 <0.1 <0.1 <0.1 <0.1

Produced Water Analysis Report of CBM Raniganj Project E10 Division(Compliance Period: Oct'16 - Mar'17)
ANNEXURE II
S. No. Parameter Unit
CPCB Limit forDischarge of
EnvironmentalPollutants (Inland
surface water)27 Mercury mg/l 0.0128 Boron mg/l29 SAR ---30 Phosphorus mg/l ---31 Aluminium mg/l ---32 Lithium mg/l33 Manganese mg/l34 Molybdenum mg/l ---35 Palladium mg/l ---36 Selenium mg/l37 Vanadium mg/l ---38 Cadmium mg/l39 Cobalt mg/l40 Bicarbonate mg/l ---41 Electrical Conductivity µmhos/cm ---42 Sodium mg/l ---
Potassium mg/l ---
EDD-28 D-5 EDD-29 V-1 EDH-35 D-4 EDD-24 V-1 EDE-043 V1
<0.001 <0.001 <0.001 <0.001 <0.001<1.0 <1.0 <1.0 <1.0 <1.052.5 35.9 65.7 43.6 22.90.33 0.35 0.28 0.26 0.23<0.01 <0.01 <0.01 <0.01 <0.01<0.5 <0.5 <0.5 <0.5 <0.50.092 <0.05 0.144 0.105 0.088<0.5 <0.5 <0.5 <0.5 <0.5<0.5 <0.5 <0.5 <0.5 <0.5<0.01 <0.01 <0.01 <0.01 <0.01<0.2 <0.2 <0.2 <0.2 <0.2<0.01 <0.01 <0.01 <0.01 <0.01<0.1 <0.1 <0.1 <0.1 <0.11041.4 1325.4 2436.1 875.7 596.37362 8104 7139 5174 22442577 1836 2681 1721 512.414.3 12.1 13 11.7 5

Produced Water Analysis Report of CBM Raniganj Project E11 Division(Compliance Period: Oct'16 - Mar'17)
ANNEXURE II
S. No. Parameter Unit
CPCB Limit forDischarge of
EnvironmentalPollutants (Inland
surface water)
1 pH 5.5 to 9.02 Total Suspended Solids mg/l 1003 Total Dissolved Solids mg/l ---4 Turbidity NTU ---5 Acidity as CaCO3 mg/l ---
6 Total Alkalinity as Calcium Carbonate mg/l ---
7 Chloride mg/l ---8 Total Hardness mg/l ---9 Sulphate mg/l ---10 Calcium mg/l11 Magnesium mg/l ---12 Dissolved Oxygen mg/l ---
13 Biological Oxygen Demand, 3 Days at27ºC mg/l 30
14 Chemical Oxygen Demand mg/l 25015 Oil & Grease(Hexane Extract) mg/l 10
16 Phenolic Compounds (as C6H5OH) mg/l 1
17 Sulphide mg/l 218 Fluoride mg/l 219 Ammoniacal Nitrogen mg/l ---20 Iron mg/l ---21 Total Chromium mg/l 222 Zinc mg/l ---23 Copper mg/l ---24 Nickel mg/l25 Total Arsenic mg/l26 Lead mg/l
Date
EDP-98 D-2 EDH-29 D-2 EDD-52 D-2 EDD-50 D-2 EDE-048 D-1
03.11.2016 03.12.2016 03.12.2016 03.12.2016 03.12.20167.52 7.46 7.81 8.09 8.4237 9 6 4 <211012 5242 2784 2318 2012184 33.6 21.7 11.9 6.89.8 17.6 12.7 8.8 Nil
821.6 327.40 126.3 99.7 186.2
3875.4 1026 437 397 511.4772.2 237.60 201.9 198 19027.6 5.3 <2.5 <2.5 6.8198.3 76.1 66.6 61.8 47.667.3 11.5 8.6 10.5 17.35.1 5.8 6.1 6.3 5.4
5.7 3 <2 <2 3
28 10.0 <8 <8 8<5.0 <5.0 <5.0 <5 <5.0
<0.001 <0.001 <0.001 <0.001 <0.001
<0.5 <0.5 <0.5 <0.5 <0.52.6 1.45 1.5 2.1 0.84.23 3.26 2.11 2.48 1.910.98 4.33 3.91 1.46 0.66<0.05 <0.05 <0.05 <0.05 <0.050.156 0.044 0.021 0.032 0.024<0.05 <0.05 <0.05 <0.05 <0.05<0.05 <0.05 <0.05 <0.05 <0.05<0.01 <0.01 <0.01 <0.01 <0.01<0.1 <0.1 <0.1 <0.1 <0.1

Produced Water Analysis Report of CBM Raniganj Project E12 Division(Compliance Period: Oct'16 - Mar'17)
ANNEXURE II
S. No. Parameter Unit
CPCB Limit forDischarge of
EnvironmentalPollutants (Inland
surface water)27 Mercury mg/l 0.0128 Boron mg/l29 SAR ---30 Phosphorus mg/l ---31 Aluminium mg/l ---32 Lithium mg/l33 Manganese mg/l34 Molybdenum mg/l ---35 Palladium mg/l ---36 Selenium mg/l37 Vanadium mg/l ---38 Cadmium mg/l39 Cobalt mg/l40 Bicarbonate mg/l ---41 Electrical Conductivity µmhos/cm ---42 Sodium mg/l ---
Potassium mg/l ---
EDP-98 D-2 EDH-29 D-2 EDD-52 D-2 EDD-50 D-2 EDE-048 D-1
<0.001 <0.001 <0.001 <0.001 <0.001<1.0 <1.0 <1.0 <1.0 <1.0100.3 18.8 9.6 8.6 8.50.26 0.29 0.16 0.17 0.19<0.01 <0.01 <0.01 <0.01 <0.01<0.5 <0.5 <0.5 <0.5 <0.50.216 0.107 0.082 <0.05 <0.05<0.5 <0.5 <0.5 <0.5 <0.5<0.5 <0.5 <0.5 <0.5 <0.5<0.01 <0.01 <0.01 <0.01 <0.01<0.2 <0.2 <0.2 <0.2 <0.2<0.01 <0.01 <0.01 <0.01 <0.01<0.1 <0.1 <0.1 <0.1 <0.11002.4 399.4 154.1 121.6 227.214846 7943 4278 3622 30486398 670.0 312 280 26818.2 18.7 11.3 10.2 8.7

Produced Water Analysis Report of CBM Raniganj Project E13 Division(Compliance Period: Oct'16 - Mar'17)
ANNEXURE II
S. No. Parameter Unit
CPCB Limit forDischarge of
EnvironmentalPollutants (Inland
surface water)
1 pH 5.5 to 9.02 Total Suspended Solids mg/l 1003 Total Dissolved Solids mg/l ---4 Turbidity NTU ---5 Acidity as CaCO3 mg/l ---
6 Total Alkalinity as Calcium Carbonate mg/l ---
7 Chloride mg/l ---8 Total Hardness mg/l ---9 Sulphate mg/l ---10 Calcium mg/l11 Magnesium mg/l ---12 Dissolved Oxygen mg/l ---
13 Biological Oxygen Demand, 3 Days at27ºC mg/l 30
14 Chemical Oxygen Demand mg/l 25015 Oil & Grease(Hexane Extract) mg/l 10
16 Phenolic Compounds (as C6H5OH) mg/l 1
17 Sulphide mg/l 218 Fluoride mg/l 219 Ammoniacal Nitrogen mg/l ---20 Iron mg/l ---21 Total Chromium mg/l 222 Zinc mg/l ---23 Copper mg/l ---24 Nickel mg/l25 Total Arsenic mg/l26 Lead mg/l
Date
EDI-70 D-1 EDI-120 V-1 EDI-36 V-1 EDH-64 D-1 EDN-171 V1
03.12.2016 03.12.2016 03.12.2016 03.12.2016 03.12.20167.74 7.39 7.95 8.31 8.0417 14 3 <2 <210918 11840 4382 3114 169292.6 80.4 10.2 7.6 5.811.7 16.6 9.8 Nil 7.8
1143 1215.2340.2 276 112.5
4271.5 4819.2 1262 732 317.91346.4 1326.6 225.7 194 150.418.3 21 9.2 5.1 <2.5341.2 380.9 66.6 55.5 34.9120.2 91.4 14.4 13.4 15.35.1 4.9 6.4 6.2 6.1
5 7 <2 <2 <2
16 22 <8 <8 <8<5.0 <5.0 <5.0 <5.0 <5.0
<0.001 <0.001 <0.001 <0.001 <0.001
<0.5 <0.5 <0.5 <0.5 <0.58.9 5.3 2.4 1.1 0.755.1 4.9 3.47 2.73 2.0712.4 9.65 1.15 0.91 0.62<0.05 <0.05 <0.05 <0.05 <0.050.087 0.096 0.044 0.026 0.017<0.05 <0.05 <0.05 <0.05 <0.05<0.05 <0.05 <0.05 <0.05 <0.05<0.01 <0.01 <0.01 <0.01 <0.01<0.1 <0.1 <0.1 <0.1 <0.1

Produced Water Analysis Report of CBM Raniganj Project E14 Division(Compliance Period: Oct'16 - Mar'17)
ANNEXURE II
S. No. Parameter Unit
CPCB Limit forDischarge of
EnvironmentalPollutants (Inland
surface water)27 Mercury mg/l 0.0128 Boron mg/l29 SAR ---30 Phosphorus mg/l ---31 Aluminium mg/l ---32 Lithium mg/l33 Manganese mg/l34 Molybdenum mg/l ---35 Palladium mg/l ---36 Selenium mg/l37 Vanadium mg/l ---38 Cadmium mg/l39 Cobalt mg/l40 Bicarbonate mg/l ---41 Electrical Conductivity µmhos/cm ---42 Sodium mg/l ---
Potassium mg/l ---
EDI-70 D-1 EDI-120 V-1 EDI-36 V-1 EDH-64 D-1 EDN-171 V1
<0.001 <0.001 <0.001 <0.001 <0.001<1.0 <1.0 <1.0 <1.0 <1.037.7 48 29.3 22.8 7.30.46 0.58 0.37 0.32 0.23<0.01 <0.01 <0.01 <0.01 <0.01<0.5 <0.5 <0.5 <0.5 <0.50.211 0.146 0.075 <0.05 <0.05<0.5 <0.5 <0.5 <0.5 <0.5<0.5 <0.5 <0.5 <0.5 <0.5<0.01 <0.01 <0.01 <0.01 <0.01<0.2 <0.2 <0.2 <0.2 <0.2<0.01 <0.01 <0.01 <0.01 <0.01<0.1 <0.1 <0.1 <0.1 <0.11394.5 1482.5 415 336.7 136.916530 17940 674 4791 26443180 4022 1011 732 20822.4 20.4 12.2 11.3 7.6

Produced Water Analysis Report of CBM Raniganj Project E15 Division(Compliance Period: Oct'16 - Mar'17)
ANNEXURE II
S. No. Parameter Unit
CPCB Limit forDischarge of
EnvironmentalPollutants (Inland
surface water)
1 pH 5.5 to 9.02 Total Suspended Solids mg/l 1003 Total Dissolved Solids mg/l ---4 Turbidity NTU ---5 Acidity as CaCO3 mg/l ---
6 Total Alkalinity as Calcium Carbonate mg/l ---
7 Chloride mg/l ---8 Total Hardness mg/l ---9 Sulphate mg/l ---10 Calcium mg/l11 Magnesium mg/l ---12 Dissolved Oxygen mg/l ---
13 Biological Oxygen Demand, 3 Days at27ºC mg/l 30
14 Chemical Oxygen Demand mg/l 25015 Oil & Grease(Hexane Extract) mg/l 10
16 Phenolic Compounds (as C6H5OH) mg/l 1
17 Sulphide mg/l 218 Fluoride mg/l 219 Ammoniacal Nitrogen mg/l ---20 Iron mg/l ---21 Total Chromium mg/l 222 Zinc mg/l ---23 Copper mg/l ---24 Nickel mg/l25 Total Arsenic mg/l26 Lead mg/l
Date
EDD-26 D-1 EDD-72 V-1 EDI-041 V-1 EDH-68 D-1 EDH-68 D-3
08.12.2016 08.12.2016 08.12.2016 08.12.2016 08.12.20167.64 8.11 7.81 8.06 8.16<2 2 3 11 72392 2314 5294 5704 51685.1 7.5 11.4 21.7 15.612.7 4.9 9.8 10.7 12.7
209.3 191.5 298.6 412 327518 485.3 2012.4 1143.5 1248178.2 166.3 198 205.9 209.86.3 4.8 11.7 10.2 9.644.4 49.2 60.3 76.1 6516.3 10.5 11.5 3.8 11.56.5 6.2 5.9 4.9 5.2
<2 <2 <2 4 3<8 <8 <8 14 11<5.0 <5.0 <5.0 <5.0 <5.0
<0.001 <0.001 <0.001 <0.001 <0.001
<0.5 <0.5 <0.5 <0.5 <0.51.2 0.8 2.4 3.2 2.83.32 2.87 4.55 4.06 3.521.8 2.46 3.11 5.62 4.3<0.05 <0.05 <0.05 <0.05 <0.050.037 0.029 0.052 0.048 0.033<0.05 <0.05 <0.05 <0.05 <0.05<0.05 <0.05 <0.05 <0.05 <0.05<0.01 <0.01 <0.01 <0.01 <0.01<0.1 <0.1 <0.1 <0.1 <0.1

Produced Water Analysis Report of CBM Raniganj Project E16 Division(Compliance Period: Oct'16 - Mar'17)
ANNEXURE II
S. No. Parameter Unit
CPCB Limit forDischarge of
EnvironmentalPollutants (Inland
surface water)27 Mercury mg/l 0.0128 Boron mg/l29 SAR ---30 Phosphorus mg/l ---31 Aluminium mg/l ---32 Lithium mg/l33 Manganese mg/l34 Molybdenum mg/l ---35 Palladium mg/l ---36 Selenium mg/l37 Vanadium mg/l ---38 Cadmium mg/l39 Cobalt mg/l40 Bicarbonate mg/l ---41 Electrical Conductivity µmhos/cm ---42 Sodium mg/l ---
Potassium mg/l ---
EDD-26 D-1 EDD-72 V-1 EDI-041 V-1 EDH-68 D-1 EDH-68 D-3
<0.001 <0.001 <0.001 <0.001 <0.001<1.0 <1.0 <1.0 <1.0 <1.013.9 13.9 18.8 21.4 21.70.28 0.24 0.39 0.41 0.35<0.01 <0.01 <0.01 <0.01 <0.01<0.5 <0.5 <0.5 <0.5 <0.5<0.05 0.086 0.092 0.127 0.105<0.5 <0.5 <0.5 <0.5 <0.5<0.5 <0.5 <0.5 <0.5 <0.5<0.01 <0.01 <0.01 <0.01 <0.01<0.2 <0.2 <0.2 <0.2 <0.2<0.01 <0.01 <0.01 <0.01 <0.01<0.1 <0.1 <0.1 <0.1 <0.1255.3 233.6 364.3 502.6 398.94511 3539 8146 8775 7952431 412 612 704 7229.5 8.8 11.9 15.4 13.1

Produced Water Analysis Report of CBM Raniganj Project E17 Division(Compliance Period: Oct'16 - Mar'17)
ANNEXURE II
S. No. Parameter Unit
CPCB Limit forDischarge of
EnvironmentalPollutants (Inland
surface water)
1 pH 5.5 to 9.02 Total Suspended Solids mg/l 1003 Total Dissolved Solids mg/l ---4 Turbidity NTU ---5 Acidity as CaCO3 mg/l ---
6 Total Alkalinity as Calcium Carbonate mg/l ---
7 Chloride mg/l ---8 Total Hardness mg/l ---9 Sulphate mg/l ---10 Calcium mg/l11 Magnesium mg/l ---12 Dissolved Oxygen mg/l ---
13 Biological Oxygen Demand, 3 Days at27ºC mg/l 30
14 Chemical Oxygen Demand mg/l 25015 Oil & Grease(Hexane Extract) mg/l 10
16 Phenolic Compounds (as C6H5OH) mg/l 1
17 Sulphide mg/l 218 Fluoride mg/l 219 Ammoniacal Nitrogen mg/l ---20 Iron mg/l ---21 Total Chromium mg/l 222 Zinc mg/l ---23 Copper mg/l ---24 Nickel mg/l25 Total Arsenic mg/l26 Lead mg/l
Date
EDN-184 D3 EDN-184 D-4
EDD-405 D-1 EDD-54 D-4 EDD-54 D-3
10.01.2017 10.01.2017 10.01.2017 10.01.2017 10.01.20178.22 7.73 8.47 7.24 7.864 <2 <2 9 162148 1094 2092 4122 348811.2 1.8 1.5 36.7 81.94.9 11.8 Nil 17.6 10.8
121.70 83.1 97.6 209.5 192.4
927.5 460.6 912.1 1435.7 1276.3150.40 90.2 156.8 164.6 176.49.5 7.3 12.7 12.6 10.547.1 28.3 34.6 34.6 36.17.6 4.8 17.1 19.1 215.9 6.3 6.2 5.8 5.6
<2 <2 <2 2 3
<8 <8 <8 10 11<5.0 <5.0 <5 <5.0 <5.0
<0.001 <0.001 <0.001 <0.001 <0.001
<0.5 <0.5 <0.5 <0.5 <0.50.88 0.71 1.1 2.1 1.980.26 0.14 0.33 0.42 0.352.65 0.59 0.48 3.6 8.9<0.05 <0.05 <0.05 <0.05 <0.050.084 0.121 0.147 0.091 0.133<0.05 <0.05 <0.05 <0.05 <0.05<0.05 <0.05 <0.05 <0.05 <0.05<0.01 <0.01 <0.01 <0.01 <0.01<0.1 <0.1 <0.1 <0.1 <0.1

Produced Water Analysis Report of CBM Raniganj Project E18 Division(Compliance Period: Oct'16 - Mar'17)
ANNEXURE II
S. No. Parameter Unit
CPCB Limit forDischarge of
EnvironmentalPollutants (Inland
surface water)27 Mercury mg/l 0.0128 Boron mg/l29 SAR ---30 Phosphorus mg/l ---31 Aluminium mg/l ---32 Lithium mg/l33 Manganese mg/l34 Molybdenum mg/l ---35 Palladium mg/l ---36 Selenium mg/l37 Vanadium mg/l ---38 Cadmium mg/l39 Cobalt mg/l40 Bicarbonate mg/l ---41 Electrical Conductivity µmhos/cm ---42 Sodium mg/l ---
Potassium mg/l ---
EDN-184 D3 EDN-184 D-4
EDD-405 D-1 EDD-54 D-4 EDD-54 D-3
<0.001 <0.001 <0.001 <0.001 <0.001<1.0 <1.0 <1.0 <1.0 <1.030.2 4.6 32.4 39.1 34.20.19 0.14 0.34 0.39 0.28<0.01 <0.01 <0.01 <0.01 <0.01<0.5 <0.5 <0.5 <0.5 <0.50.112 0.082 <0.05 0.207 0.256<0.5 <0.5 <0.5 <0.5 <0.5<0.5 <0.5 <0.5 <0.5 <0.5<0.01 <0.01 <0.01 <0.01 <0.01<0.2 <0.2 <0.2 <0.2 <0.2<0.01 <0.01 <0.01 <0.01 <0.01<0.1 <0.1 <0.1 <0.1 <0.1148.5 101.4 119.1 255.6 234.72691 1442 3020 5782 4752852.0 230 834 1152 104510.3 8.8 14.5 16.5 15.2

Produced Water Analysis Report of CBM Raniganj Project E19 Division(Compliance Period: Oct'16 - Mar'17)
ANNEXURE II
S. No. Parameter Unit
CPCB Limit forDischarge of
EnvironmentalPollutants (Inland
surface water)
1 pH 5.5 to 9.02 Total Suspended Solids mg/l 1003 Total Dissolved Solids mg/l ---4 Turbidity NTU ---5 Acidity as CaCO3 mg/l ---
6 Total Alkalinity as Calcium Carbonate mg/l ---
7 Chloride mg/l ---8 Total Hardness mg/l ---9 Sulphate mg/l ---10 Calcium mg/l11 Magnesium mg/l ---12 Dissolved Oxygen mg/l ---
13 Biological Oxygen Demand, 3 Days at27ºC mg/l 30
14 Chemical Oxygen Demand mg/l 25015 Oil & Grease(Hexane Extract) mg/l 10
16 Phenolic Compounds (as C6H5OH) mg/l 1
17 Sulphide mg/l 218 Fluoride mg/l 219 Ammoniacal Nitrogen mg/l ---20 Iron mg/l ---21 Total Chromium mg/l 222 Zinc mg/l ---23 Copper mg/l ---24 Nickel mg/l25 Total Arsenic mg/l26 Lead mg/l
Date
EDD-26 D-3 EDE-048 D-2 EDD-21 D-3 EDD-21 D-1 EDD-21 D-2
10.01.2017 10.01.2017 10.01.2017 10.01.2017 10.01.20177.61 8.3 8.41 7.92 8.1712 2 <2 9 <22772 2534 2492 4286 385855.2 2.5 1.7 12.2 212.7 Nil Nil 9.8 9.8
100.376.2 65.3 119.7 211
1120.1 832.4 930.5 1920.1 1831.5150.4 164.6 168.6 109.8 150.49.9 9.3 8.2 10.1 7.547.1 34.6 44 28.2 447.6 19.1 14.3 9.5 9.55.3 6.1 6.8 6.2 6.2
4 <2 <2 <2 <2
21 <8 <8 <8 <8<5.0 <5.0 <5.0 <5.0 <5.0
<0.001 <0.001 <0.001 <0.001 <0.001
<0.5 <0.5 <0.5 <0.5 <0.53.2 3.2 1.8 2.9 1.20.29 2.27 3.19 4.3 2.114.1 0.63 0.57 1.86 1.07<0.05 <0.05 <0.05 <0.05 <0.050.078 0.139 0.127 0.211 0.092<0.05 <0.05 <0.05 <0.05 <0.05<0.05 <0.05 <0.05 <0.05 <0.05<0.01 <0.01 <0.01 <0.01 <0.01<0.1 <0.1 <0.1 <0.1 <0.1

Produced Water Analysis Report of CBM Raniganj Project E20 Division(Compliance Period: Oct'16 - Mar'17)
ANNEXURE II
S. No. Parameter Unit
CPCB Limit forDischarge of
EnvironmentalPollutants (Inland
surface water)27 Mercury mg/l 0.0128 Boron mg/l29 SAR ---30 Phosphorus mg/l ---31 Aluminium mg/l ---32 Lithium mg/l33 Manganese mg/l34 Molybdenum mg/l ---35 Palladium mg/l ---36 Selenium mg/l37 Vanadium mg/l ---38 Cadmium mg/l39 Cobalt mg/l40 Bicarbonate mg/l ---41 Electrical Conductivity µmhos/cm ---42 Sodium mg/l ---
Potassium mg/l ---
EDD-26 D-3 EDE-048 D-2 EDD-21 D-3 EDD-21 D-1 EDD-21 D-2
<0.001 <0.001 <0.001 <0.001 <0.001<1.0 <1.0 <1.0 <1.0 <1.036.6 36.6 39.8 39.7 72.50.41 0.27 0.19 0.3 0.15<0.01 <0.01 <0.01 <0.01 <0.01<0.5 <0.5 <0.5 <0.5 <0.50.219 <0.05 <0.05 <0.05 0.085<0.5 <0.5 <0.5 <0.5 <0.5<0.5 <0.5 <0.5 <0.5 <0.5<0.01 <0.01 <0.01 <0.01 <0.01<0.2 <0.2 <0.2 <0.2 <0.2<0.01 <0.01 <0.01 <0.01 <0.01<0.1 <0.1 <0.1 <0.1 <0.1122.4 93 79.7 146 257.43864 3591 3421 5826 53921032 1080 1190 2141 204614.2 9.5 8.8 10.9 11.7

Produced Water Analysis Report of CBM Raniganj Project E21 Division(Compliance Period: Oct'16 - Mar'17)
ANNEXURE II
S. No. Parameter Unit
CPCB Limit forDischarge of
EnvironmentalPollutants (Inland
surface water)
1 pH 5.5 to 9.02 Total Suspended Solids mg/l 1003 Total Dissolved Solids mg/l ---4 Turbidity NTU ---5 Acidity as CaCO3 mg/l ---
6 Total Alkalinity as Calcium Carbonate mg/l ---
7 Chloride mg/l ---8 Total Hardness mg/l ---9 Sulphate mg/l ---10 Calcium mg/l11 Magnesium mg/l ---12 Dissolved Oxygen mg/l ---
13 Biological Oxygen Demand, 3 Days at27ºC mg/l 30
14 Chemical Oxygen Demand mg/l 25015 Oil & Grease(Hexane Extract) mg/l 10
16 Phenolic Compounds (as C6H5OH) mg/l 1
17 Sulphide mg/l 218 Fluoride mg/l 219 Ammoniacal Nitrogen mg/l ---20 Iron mg/l ---21 Total Chromium mg/l 222 Zinc mg/l ---23 Copper mg/l ---24 Nickel mg/l25 Total Arsenic mg/l26 Lead mg/l
Date
EDH-44 D-2 EDH-44 D-3 EDH-64 D-2 EDI-38 D-1 EDI-39 V-1
10.01.2017 10.01.2017 10.01.2017 10.01.2017 10.01.20177.84 7.92 8.16 8.25 7.972 5 2 <2 <26446 5422 4724 5432 41263.6 14.7 6.6 2.8 3.111.8 10.8 9.8 4.9 10.8
120.5 250.4 311 280.5 214.91532 1920.3 1752.4 1832.9 1960.4407.7 356.7 356.7 164.6 150.410.9 13.5 11.5 9.9 16.1127.3 127.3 122.5 50.3 34.621.9 9.5 12.4 9.5 15.26.8 5.5 5.9 6.2 6.4
<2 <2 <2 <2 <2<8 11 <8 <8 <8<5.0 <5.0 <5.0 <5.0 <5.0
<0.001 <0.001 <0.001 <0.001 <0.001
<0.5 <0.5 <0.5 <0.5 <0.51.95 2.25 1.5 1.65 1.83.46 4.17 2.45 3.11 2.962.45 2.92 0.98 0.7 0.65<0.05 <0.05 <0.05 <0.05 <0.050.043 0.097 0.102 0.133 0.121<0.05 <0.05 <0.05 <0.05 <0.05<0.05 <0.05 <0.05 <0.05 <0.05<0.01 <0.01 <0.01 <0.01 <0.01<0.1 <0.1 <0.1 <0.1 <0.1

Produced Water Analysis Report of CBM Raniganj Project E22 Division(Compliance Period: Oct'16 - Mar'17)
ANNEXURE II
S. No. Parameter Unit
CPCB Limit forDischarge of
EnvironmentalPollutants (Inland
surface water)27 Mercury mg/l 0.0128 Boron mg/l29 SAR ---30 Phosphorus mg/l ---31 Aluminium mg/l ---32 Lithium mg/l33 Manganese mg/l34 Molybdenum mg/l ---35 Palladium mg/l ---36 Selenium mg/l37 Vanadium mg/l ---38 Cadmium mg/l39 Cobalt mg/l40 Bicarbonate mg/l ---41 Electrical Conductivity µmhos/cm ---42 Sodium mg/l ---
Potassium mg/l ---
EDH-44 D-2 EDH-44 D-3 EDH-64 D-2 EDI-38 D-1 EDI-39 V-1
<0.001 <0.001 <0.001 <0.001 <0.001<1.0 <1.0 <1.0 <1.0 <1.072.8 62.4 46.7 93 71.20.25 0.32 0.23 0.49 0.57<0.01 <0.01 <0.01 <0.01 <0.01<0.5 <0.5 <0.5 <0.5 <0.50.149 0.159 0.131 0.075 0.059<0.5 <0.5 <0.5 <0.5 <0.5<0.5 <0.5 <0.5 <0.5 <0.5<0.01 <0.01 <0.01 <0.01 <0.01<0.2 <0.2 <0.2 <0.2 <0.2<0.01 <0.01 <0.01 <0.01 <0.01<0.1 <0.1 <0.1 <0.1 <0.1147 305.5 379.4 342.2 262.29161 7643 5642 7511 61953382 2710 2027 2745 200818.3 12.5 17.2 12.1 10.5

Produced Water Analysis Report of CBM Raniganj Project E23 Division(Compliance Period: Oct'16 - Mar'17)
ANNEXURE II
S. No. Parameter Unit
CPCB Limit forDischarge of
EnvironmentalPollutants (Inland
surface water)
1 pH 5.5 to 9.02 Total Suspended Solids mg/l 1003 Total Dissolved Solids mg/l ---4 Turbidity NTU ---5 Acidity as CaCO3 mg/l ---
6 Total Alkalinity as Calcium Carbonate mg/l ---
7 Chloride mg/l ---8 Total Hardness mg/l ---9 Sulphate mg/l ---10 Calcium mg/l11 Magnesium mg/l ---12 Dissolved Oxygen mg/l ---
13 Biological Oxygen Demand, 3 Days at27ºC mg/l 30
14 Chemical Oxygen Demand mg/l 25015 Oil & Grease(Hexane Extract) mg/l 10
16 Phenolic Compounds (as C6H5OH) mg/l 1
17 Sulphide mg/l 218 Fluoride mg/l 219 Ammoniacal Nitrogen mg/l ---20 Iron mg/l ---21 Total Chromium mg/l 222 Zinc mg/l ---23 Copper mg/l ---24 Nickel mg/l25 Total Arsenic mg/l26 Lead mg/l
Date
EDN-162 D3 EDI-71 D-1 EDD-70 D-3 EDI-41 D-2 EDI-39 D-3
08.02.2017 08.02.2017 08.02.2017 08.02.2017 08.02.20177.62 7.33 7.52 7.49 8.05<2 <2 <2 8 54122 10296 8504 3388 38224.5 6.8 3.3 21.8 15.3Nil Nil Nil Nil Nil
1024.00 1670 1521 912 826.1
1450.3 1927.5 1803.2 1832.2 1905.2104.00 180 152 84 8810.3 16.7 15.2 8.4 9.232.1 56.1 8.1 28.9 25.75.8 9.7 7.8 2.9 5.86.1 6.5 6 4.1 5.2
<2 <2 <2 4 <2
<8 <8 <8 12 8<5.0 <5.0 <5 <5.0 <5.0
<0.001 <0.001 <0.001 <0.001 <0.001
<0.5 <0.5 <0.5 <0.5 <0.52.41 5.11 4.55 1.47 2.261.12 2.48 2.83 0.86 1.440.49 0.73 0.37 4.86 3.29<0.05 <0.05 <0.05 <0.05 <0.050.029 0.037 0.042 0.115 0.281<0.05 <0.05 <0.05 <0.05 <0.05<0.05 <0.05 <0.05 <0.05 <0.05<0.01 <0.01 <0.01 <0.01 <0.01<0.1 <0.1 <0.1 <0.1 <0.1

Produced Water Analysis Report of CBM Raniganj Project E24 Division(Compliance Period: Oct'16 - Mar'17)
ANNEXURE II
S. No. Parameter Unit
CPCB Limit forDischarge of
EnvironmentalPollutants (Inland
surface water)27 Mercury mg/l 0.0128 Boron mg/l29 SAR ---30 Phosphorus mg/l ---31 Aluminium mg/l ---32 Lithium mg/l33 Manganese mg/l34 Molybdenum mg/l ---35 Palladium mg/l ---36 Selenium mg/l37 Vanadium mg/l ---38 Cadmium mg/l39 Cobalt mg/l40 Bicarbonate mg/l ---41 Electrical Conductivity µmhos/cm ---42 Sodium mg/l ---
Potassium mg/l ---
EDN-162 D3 EDI-71 D-1 EDD-70 D-3 EDI-41 D-2 EDI-39 D-3
<0.001 <0.001 <0.001 <0.001 <0.001<1.0 <1.0 <1.0 <1.0 <1.054.6 112.1 75.5 76.27 77.070.27 0.57 0.62 0.31 0.37<0.01 <0.01 <0.01 <0.01 <0.01<0.5 <0.5 <0.5 <0.5 <0.5<0.05 <0.05 <0.05 0.182 0.119<0.5 <0.5 <0.5 <0.5 <0.5<0.5 <0.5 <0.5 <0.5 <0.5<0.01 <0.01 <0.01 <0.01 <0.01<0.2 <0.2 <0.2 <0.2 <0.2<0.01 <0.01 <0.01 <0.01 <0.01<0.1 <0.1 <0.1 <0.1 <0.11249.3 2037.4 1855.6 1112.6 1007.86244 14922 12324 5056 56221280.0 3460 2142 1608 166215.0 17.5 10.5 8.8 10.2

Produced Water Analysis Report of CBM Raniganj Project E25 Division(Compliance Period: Oct'16 - Mar'17)
ANNEXURE II
S. No. Parameter Unit
CPCB Limit forDischarge of
EnvironmentalPollutants (Inland
surface water)
1 pH 5.5 to 9.02 Total Suspended Solids mg/l 1003 Total Dissolved Solids mg/l ---4 Turbidity NTU ---5 Acidity as CaCO3 mg/l ---
6 Total Alkalinity as Calcium Carbonate mg/l ---
7 Chloride mg/l ---8 Total Hardness mg/l ---9 Sulphate mg/l ---10 Calcium mg/l11 Magnesium mg/l ---12 Dissolved Oxygen mg/l ---
13 Biological Oxygen Demand, 3 Days at27ºC mg/l 30
14 Chemical Oxygen Demand mg/l 25015 Oil & Grease(Hexane Extract) mg/l 10
16 Phenolic Compounds (as C6H5OH) mg/l 1
17 Sulphide mg/l 218 Fluoride mg/l 219 Ammoniacal Nitrogen mg/l ---20 Iron mg/l ---21 Total Chromium mg/l 222 Zinc mg/l ---23 Copper mg/l ---24 Nickel mg/l25 Total Arsenic mg/l26 Lead mg/l
Date
EDI-40 D-2 EDE-60 V-1 EDE-043 D-1 EDI-32 D-5 EDD-22 D-2
08.02.2017 08.02.2017 08.02.2017 08.02.2017 08.02.20178.22 8.36 8.15 7.82 7.913 6 3 4 95404 1856 1976 3462 178216.2 31.5 17.2 19.4 41.2Nil 4.9 Nil Nil Nil
730.7 520 439.5 928.3 437.2
2005.4 580.2 680.1 1420.2 489108 60 64 116 6810.2 6.8 7.3 10.9 11.230.5 14.7 14.7 25.7 167.8 5.8 6.8 12.6 6.84.5 3.8 4 4.2 3.5
3 5 3 2 4
10 18 12 10 16<5.0 <5.0 <5.0 <5.0 <5.0
<0.001 <0.001 <0.001 <0.001 <0.001
<0.5 <0.5 <0.5 <0.5 <0.52.82 2.36 2.14 3.41 0.631.02 1.18 1.49 2.32 1.254.63 6.28 3.24 4.11 8.41<0.05 <0.05 <0.05 <0.05 <0.050.362 0.049 0.086 0.153 0.119<0.05 <0.05 <0.05 <0.05 <0.05<0.05 <0.05 <0.05 <0.05 <0.05<0.01 <0.01 <0.01 <0.01 <0.01<0.1 <0.1 <0.1 <0.1 <0.1

Produced Water Analysis Report of CBM Raniganj Project E26 Division(Compliance Period: Oct'16 - Mar'17)
ANNEXURE II
S. No. Parameter Unit
CPCB Limit forDischarge of
EnvironmentalPollutants (Inland
surface water)27 Mercury mg/l 0.0128 Boron mg/l29 SAR ---30 Phosphorus mg/l ---31 Aluminium mg/l ---32 Lithium mg/l33 Manganese mg/l34 Molybdenum mg/l ---35 Palladium mg/l ---36 Selenium mg/l37 Vanadium mg/l ---38 Cadmium mg/l39 Cobalt mg/l40 Bicarbonate mg/l ---41 Electrical Conductivity µmhos/cm ---42 Sodium mg/l ---
Potassium mg/l ---
EDI-40 D-2 EDE-60 V-1 EDE-043 D-1 EDI-32 D-5 EDD-22 D-2
<0.001 <0.001 <0.001 <0.001 <0.001<1.0 <1.0 <1.0 <1.0 <1.071.3 24.5 27.75 42.06 20.980.48 0.19 0.26 0.36 0.22<0.01 <0.01 <0.01 <0.01 <0.01<0.5 <0.5 <0.5 <0.5 <0.50.197 0.242 0.097 0.101 0.105<0.5 <0.5 <0.5 <0.5 <0.5<0.5 <0.5 <0.5 <0.5 <0.5<0.01 <0.01 <0.01 <0.01 <0.01<0.2 <0.2 <0.2 <0.2 <0.2<0.01 <0.01 <0.01 <0.01 <0.01<0.1 <0.1 <0.1 <0.1 <0.1891.5 622.2 536.2 1132.5 533.47945 2811 2948 5243 27411704 437 510 1043 39712.5 5.9 2.8 8.6 1.9

Produced Water Analysis Report of CBM Raniganj Project E27 Division(Compliance Period: Oct'16 - Mar'17)
ANNEXURE II
S. No. Parameter Unit
CPCB Limit forDischarge of
EnvironmentalPollutants (Inland
surface water)
1 pH 5.5 to 9.02 Total Suspended Solids mg/l 1003 Total Dissolved Solids mg/l ---4 Turbidity NTU ---5 Acidity as CaCO3 mg/l ---
6 Total Alkalinity as Calcium Carbonate mg/l ---
7 Chloride mg/l ---8 Total Hardness mg/l ---9 Sulphate mg/l ---10 Calcium mg/l11 Magnesium mg/l ---12 Dissolved Oxygen mg/l ---
13 Biological Oxygen Demand, 3 Days at27ºC mg/l 30
14 Chemical Oxygen Demand mg/l 25015 Oil & Grease(Hexane Extract) mg/l 10
16 Phenolic Compounds (as C6H5OH) mg/l 1
17 Sulphide mg/l 218 Fluoride mg/l 219 Ammoniacal Nitrogen mg/l ---20 Iron mg/l ---21 Total Chromium mg/l 222 Zinc mg/l ---23 Copper mg/l ---24 Nickel mg/l25 Total Arsenic mg/l26 Lead mg/l
Date
EDD-23 D-1 EDD 407 D-1 EDG-74 D-3 EDC-413 D1 EDG-77 D-1
08.02.2017 08.02.2017 08.02.2017 08.02.2017 08.02.20178.25 8.17 7.81 7.36 8.6211 5 9 14 61598 1460 2114 3728 245850.1 30.2 48.2 62.5 27.3Nil Nil Nil Nil 7.8
387.5 352.4 622.5 701.2 590.3
470.5 392 747.5 920 71236 48 100 92 729.4 7.8 10.5 14.5 11.211.2 8 28.9 25.7 166.8 6.8 6.8 6.8 7.84 4.4 5.9 4.3 4.1
3 2 <2 2 211 9 <8 12 11<5.0 <5.0 <5.0 <5.0 <5.0
<0.001 <0.001 <0.001 <0.001 <0.001
<0.5 <0.5 <0.5 <0.5 <0.51.15 0.82 1.42 2.36 3.292.43 1.09 0.46 0.82 0.769.63 7.42 8.76 10.24 7.11<0.05 <0.05 <0.05 <0.05 <0.050.089 0.076 0.232 0.182 0.117<0.05 <0.05 <0.05 <0.05 <0.05<0.05 <0.05 <0.05 <0.05 <0.05<0.01 <0.01 <0.01 <0.01 <0.01<0.1 <0.1 <0.1 <0.1 <0.1

Produced Water Analysis Report of CBM Raniganj Project E28 Division(Compliance Period: Oct'16 - Mar'17)
ANNEXURE II
S. No. Parameter Unit
CPCB Limit forDischarge of
EnvironmentalPollutants (Inland
surface water)27 Mercury mg/l 0.0128 Boron mg/l29 SAR ---30 Phosphorus mg/l ---31 Aluminium mg/l ---32 Lithium mg/l33 Manganese mg/l34 Molybdenum mg/l ---35 Palladium mg/l ---36 Selenium mg/l37 Vanadium mg/l ---38 Cadmium mg/l39 Cobalt mg/l40 Bicarbonate mg/l ---41 Electrical Conductivity µmhos/cm ---42 Sodium mg/l ---
Potassium mg/l ---
EDD-23 D-1 EDD 407 D-1 EDG-74 D-3 EDC-413 D1 EDG-77 D-1
<0.001 <0.001 <0.001 <0.001 <0.001<1.0 <1.0 <1.0 <1.0 <1.018.17 18.76 27.7 34.2 27.110.31 0.17 0.35 0.45 0.32<0.01 <0.01 <0.01 <0.01 <0.01<0.5 <0.5 <0.5 <0.5 <0.50.201 0.224 0.117 0.095 0.142<0.5 <0.5 <0.5 <0.5 <0.5<0.5 <0.5 <0.5 <0.5 <0.5<0.01 <0.01 <0.01 <0.01 <0.01<0.2 <0.2 <0.2 <0.2 <0.2<0.01 <0.01 <0.01 <0.01 <0.01<0.1 <0.1 <0.1 <0.1 <0.1472.8 429.9 759.5 855.5 707.62496 2282 3247 5649 3782312 298 638 755 530<1 <1 4.5 6.9 5.2

Produced Water Analysis Report of CBM Raniganj Project E29 Division(Compliance Period: Oct'16 - Mar'17)
ANNEXURE II
S. No. Parameter Unit
CPCB Limit forDischarge of
EnvironmentalPollutants (Inland
surface water)
1 pH 5.5 to 9.02 Total Suspended Solids mg/l 1003 Total Dissolved Solids mg/l ---4 Turbidity NTU ---5 Acidity as CaCO3 mg/l ---
6 Total Alkalinity as Calcium Carbonate mg/l ---
7 Chloride mg/l ---8 Total Hardness mg/l ---9 Sulphate mg/l ---10 Calcium mg/l11 Magnesium mg/l ---12 Dissolved Oxygen mg/l ---
13 Biological Oxygen Demand, 3 Days at27ºC mg/l 30
14 Chemical Oxygen Demand mg/l 25015 Oil & Grease(Hexane Extract) mg/l 10
16 Phenolic Compounds (as C6H5OH) mg/l 1
17 Sulphide mg/l 218 Fluoride mg/l 219 Ammoniacal Nitrogen mg/l ---20 Iron mg/l ---21 Total Chromium mg/l 222 Zinc mg/l ---23 Copper mg/l ---24 Nickel mg/l25 Total Arsenic mg/l26 Lead mg/l
Date
EDN-162 D4 EDI-71 D-2 EDI-38 D-3 EDI-41 D-3 EDI-32 D-5
06.03.2017 06.03.2017 06.03.2017 06.03.2017 06.03.20177.71 7.32 8.09 7.98 8.3288 114 7 14 165152 9168 3988 4372 3628150 260 20.1 40.7 43.9Nil Nil Nil Nil Nil
1128.00 1402 914 1220 892
2047 4211 1136 1937 1732152.00 432 96 120 804.6 10.2 <2.5 7.5 6.227.3 101 17.6 22.4 14.420.4 43.7 12.6 15.6 10.44.7 4.1 6.1 5.1 4.8
3.6 6 <2 <2 2
18.0 24 <8 8 9<5.0 <5.0 <5 <5.0 <5.0
<0.001 <0.001 <0.001 <0.001 <0.001
<0.5 <0.5 <0.5 <0.5 <0.56 5.1 4.2 2.7 43.10 3.6 2.3 4.3 3.977.30 124.5 6.9 8.8 11.3<0.05 <0.05 <0.05 <0.05 <0.050.101 0.245 0.082 0.049 0.073<0.05 <0.05 <0.05 <0.05 <0.05<0.05 <0.05 <0.05 <0.05 <0.05<0.01 <0.01 <0.01 <0.01 <0.01<0.1 <0.1 <0.1 <0.1 <0.1

Produced Water Analysis Report of CBM Raniganj Project E30 Division(Compliance Period: Oct'16 - Mar'17)
ANNEXURE II
S. No. Parameter Unit
CPCB Limit forDischarge of
EnvironmentalPollutants (Inland
surface water)27 Mercury mg/l 0.0128 Boron mg/l29 SAR ---30 Phosphorus mg/l ---31 Aluminium mg/l ---32 Lithium mg/l33 Manganese mg/l34 Molybdenum mg/l ---35 Palladium mg/l ---36 Selenium mg/l37 Vanadium mg/l ---38 Cadmium mg/l39 Cobalt mg/l40 Bicarbonate mg/l ---41 Electrical Conductivity µmhos/cm ---42 Sodium mg/l ---
Potassium mg/l ---
EDN-162 D4 EDI-71 D-2 EDI-38 D-3 EDI-41 D-3 EDI-32 D-5
<0.001 <0.001 <0.001 <0.001 <0.001<1.0 <1.0 <1.0 <1.0 <1.040.5 61.6 45.8 43.2 54.70.11 0.16 0.31 0.41 0.33<0.01 <0.01 <0.01 <0.01 <0.01<0.5 <0.5 <0.5 <0.5 <0.50.363 0.228 0.141 0.086 0.049<0.5 <0.5 <0.5 <0.5 <0.5<0.5 <0.5 <0.5 <0.5 <0.5<0.01 <0.01 <0.01 <0.01 <0.01<0.2 <0.2 <0.2 <0.2 <0.2<0.01 <0.01 <0.01 <0.01 <0.01<0.1 <0.1 <0.1 <0.1 <0.11376.0 1710 1115 1488 10887924 12952 5763 6431 52441148.0 2943 1033 1089 112410.6 14.7 9.1 7.8 8.6

Produced Water Analysis Report of CBM Raniganj Project E31 Division(Compliance Period: Oct'16 - Mar'17)
ANNEXURE II
S. No. Parameter Unit
CPCB Limit forDischarge of
EnvironmentalPollutants (Inland
surface water)
1 pH 5.5 to 9.02 Total Suspended Solids mg/l 1003 Total Dissolved Solids mg/l ---4 Turbidity NTU ---5 Acidity as CaCO3 mg/l ---
6 Total Alkalinity as Calcium Carbonate mg/l ---
7 Chloride mg/l ---8 Total Hardness mg/l ---9 Sulphate mg/l ---10 Calcium mg/l11 Magnesium mg/l ---12 Dissolved Oxygen mg/l ---
13 Biological Oxygen Demand, 3 Days at27ºC mg/l 30
14 Chemical Oxygen Demand mg/l 25015 Oil & Grease(Hexane Extract) mg/l 10
16 Phenolic Compounds (as C6H5OH) mg/l 1
17 Sulphide mg/l 218 Fluoride mg/l 219 Ammoniacal Nitrogen mg/l ---20 Iron mg/l ---21 Total Chromium mg/l 222 Zinc mg/l ---23 Copper mg/l ---24 Nickel mg/l25 Total Arsenic mg/l26 Lead mg/l
Date
EDD-52 D-5 EDG-74 D-2 EDG-74 D-3 EDG-413 D2 EDG-77 D-5
06.03.2017 06.03.2017 06.03.2017 06.03.2017 06.03.20178.28 8.11 7.92 7.75 8.1715 3 6 22 73114 2544 2298 3818 267242.8 6.3 8.4 51.6 3.3Nil Nil Nil Nil Nil
817 724 712 941 698
1460 912 1026 1556 110760 52 32 48 685 <2.5 <2.5 6.5 4.811.2 12.8 8 11.2 19.27.8 4.9 2.9 4.9 4.94.3 5.2 5 2.4 5.9
<2 <2 <2 31 <2
8 <8 <8 112 <8<5.0 <5.0 <5.0 <5.0 <5.0
<0.001 <0.001 <0.001 <0.001 <0.001
<0.5 <0.5 <0.5 <0.5 <0.55.1 0.66 0.82 3.41 2.984.8 2.66 2.82 2.45 4.119.1 0.91 1.43 3.4 2.92<0.05 <0.05 <0.05 <0.05 <0.050.062 0.132 0.092 0.096 0.052<0.05 <0.05 <0.05 <0.05 <0.05<0.05 <0.05 <0.05 <0.05 <0.05<0.01 <0.01 <0.01 <0.01 <0.01<0.1 <0.1 <0.1 <0.1 <0.1

Produced Water Analysis Report of CBM Raniganj Project E32 Division(Compliance Period: Oct'16 - Mar'17)
ANNEXURE II
S. No. Parameter Unit
CPCB Limit forDischarge of
EnvironmentalPollutants (Inland
surface water)27 Mercury mg/l 0.0128 Boron mg/l29 SAR ---30 Phosphorus mg/l ---31 Aluminium mg/l ---32 Lithium mg/l33 Manganese mg/l34 Molybdenum mg/l ---35 Palladium mg/l ---36 Selenium mg/l37 Vanadium mg/l ---38 Cadmium mg/l39 Cobalt mg/l40 Bicarbonate mg/l ---41 Electrical Conductivity µmhos/cm ---42 Sodium mg/l ---
Potassium mg/l ---
EDD-52 D-5 EDG-74 D-2 EDG-74 D-3 EDG-413 D2 EDG-77 D-5
<0.001 <0.001 <0.001 <0.001 <0.001<1.0 <1.0 <1.0 <1.0 <1.053.2 38.4 44.2 54.1 37.60.46 0.19 0.25 0.33 0.36<0.01 <0.01 <0.01 <0.01 <0.01<0.5 <0.5 <0.5 <0.5 <0.50.062 <0.05 <0.05 0.112 0.071<0.5 <0.5 <0.5 <0.5 <0.5<0.5 <0.5 <0.5 <0.5 <0.5<0.01 <0.01 <0.01 <0.01 <0.01<0.2 <0.2 <0.2 <0.2 <0.2<0.01 <0.01 <0.01 <0.01 <0.01<0.1 <0.1 <0.1 <0.1 <0.1997 883 869 1148 8524298 3641 3288 5438 3718947 637 575 863 7125.9 4.6 5.1 8.8 2.2

Produced Water Analysis Report of CBM Raniganj Project E33 Division(Compliance Period: Oct'16 - Mar'17)
ANNEXURE II
S. No. Parameter Unit
CPCB Limit forDischarge of
EnvironmentalPollutants (Inland
surface water)
1 pH 5.5 to 9.02 Total Suspended Solids mg/l 1003 Total Dissolved Solids mg/l ---4 Turbidity NTU ---5 Acidity as CaCO3 mg/l ---
6 Total Alkalinity as Calcium Carbonate mg/l ---
7 Chloride mg/l ---8 Total Hardness mg/l ---9 Sulphate mg/l ---10 Calcium mg/l11 Magnesium mg/l ---12 Dissolved Oxygen mg/l ---
13 Biological Oxygen Demand, 3 Days at27ºC mg/l 30
14 Chemical Oxygen Demand mg/l 25015 Oil & Grease(Hexane Extract) mg/l 10
16 Phenolic Compounds (as C6H5OH) mg/l 1
17 Sulphide mg/l 218 Fluoride mg/l 219 Ammoniacal Nitrogen mg/l ---20 Iron mg/l ---21 Total Chromium mg/l 222 Zinc mg/l ---23 Copper mg/l ---24 Nickel mg/l25 Total Arsenic mg/l26 Lead mg/l
Date
EDD-22 D-2 EDD-23 D-2 EDD-007 D1 EDP-429 D1 EDP-406 D2
06.03.2017 06.03.2017 06.03.2017 06.03.2017 06.03.20178.22 8.27 8.44 7.62 7.783 <2 <2 74 272108 1984 1362 1744 12487.6 5.3 2.9 125 58.6Nil Nil 10.8 Nil Nil
547 512 430 498 357
857 792 412 852 30884 36 40 100 32<2.5 <2.5 <2.5 <2.5 <2.517.6 8 9.6 19.2 89.7 3.9 3.9 12.6 2.96 6.3 6.5 2.9 2.5
<2 <2 <2 26.7 12.3<8 <8 <8 89 39<5.0 <5.0 <5.0 <5.0 <5.0
<0.001 <0.001 <0.001 <0.001 <0.001
<0.5 <0.5 <0.5 <0.5 <0.53.45 1.96 6.7 4.3 2.23.96 2.4 1.19 2.4 3.11.76 0.72 0.43 1.49 0.88<0.05 <0.05 <0.05 <0.05 <0.050.035 0.041 0.028 0.035 0.021<0.05 <0.05 <0.05 <0.05 <0.05<0.05 <0.05 <0.05 <0.05 <0.05<0.01 <0.01 <0.01 <0.01 <0.01<0.1 <0.1 <0.1 <0.1 <0.1

Produced Water Analysis Report of CBM Raniganj Project E34 Division(Compliance Period: Oct'16 - Mar'17)
ANNEXURE II
S. No. Parameter Unit
CPCB Limit forDischarge of
EnvironmentalPollutants (Inland
surface water)27 Mercury mg/l 0.0128 Boron mg/l29 SAR ---30 Phosphorus mg/l ---31 Aluminium mg/l ---32 Lithium mg/l33 Manganese mg/l34 Molybdenum mg/l ---35 Palladium mg/l ---36 Selenium mg/l37 Vanadium mg/l ---38 Cadmium mg/l39 Cobalt mg/l40 Bicarbonate mg/l ---41 Electrical Conductivity µmhos/cm ---42 Sodium mg/l ---
Potassium mg/l ---
EDD-22 D-2 EDD-23 D-2 EDD-007 D1 EDP-429 D1 EDP-406 D2
<0.001 <0.001 <0.001 <0.001 <0.001<1.0 <1.0 <1.0 <1.0 <1.012.8 17.2 10.8 10.8 9.90.45 0.28 0.11 0.59 0.37<0.01 <0.01 <0.01 <0.01 <0.01<0.5 <0.5 <0.5 <0.5 <0.5<0.05 <0.05 <0.05 <0.05 <0.05<0.5 <0.5 <0.5 <0.5 <0.5<0.5 <0.5 <0.5 <0.5 <0.5<0.01 <0.01 <0.01 <0.01 <0.01<0.2 <0.2 <0.2 <0.2 <0.2<0.01 <0.01 <0.01 <0.01 <0.01<0.1 <0.1 <0.1 <0.1 <0.1667 625 525 608 4362896 2786 1822 2357 1731268 236 157 249 1284.3 4.7 2.6 3.4 1.9

Noise Analysis Report of CBM Raniganj Project (E P Division)Compliance Period Oct'16 -Mar'17
ANNEXURE III
Location Gopalpur GGS-2 GGS-1 EDH-31 ESSAR CAMP EDN-98SamplingDate
12.01.17 to13.01.17
09.01.17 to10.01.17
17.01.17 to18.01.17
07.02.17 to08.02.17
08.02.17 to09.02.17
09.02.17 to10.02.17
75 Day time 54.4 72.4 74.0 55.7 48.8 53.470 Night Time 48.2 72.3 73.7 59.2 55.7 51.8
Location EDN-169 EDD-19 EDP-49SamplingDate
11.02.17 to12.02.17
13.02.17 to14.02.17
17.02.17 to18.02.17
75 Day time 50.2 60.0 55.470 Night Time 49.6 60.3 54.8
PermissibleLimit as per
CPCB
Noise in Operational Areas
PermissibleLimit as per
CPCB
Noise in Operational Areas

Analysis of R.O. Water of CBM Raniganj Project by Essar Oil Limited (E P Division)Compliance Period: Oct'16 to Mar'17
ANNEXURE IV
04.10.2016 04.10.2016 04.10.2016
S. No. Parameter Unit
CPCB Limit forDischarge of
EnvironmentalPollutants (Inland
surface water)
OnshoreDischargeStandards
Inlet EDD-050 Outlet EDD-050 Reject EDD-050
1 pH 5.5 to 9.0 5.5-9.0 7.95 8.52 9.022 Total Suspended Solids mg/l 100 100 3 <2 183 Total Dissolved Solids mg/l --- 2100 2468 774 34484 Turbidity NTU --- --- 10.2 3.6 79.75 Acidity as CaCO3 mg/l 19.6 Nil 15.66 Alkalinity as CaCO3 mg/l --- --- 449.3 245.4 615.77 Chlorides mg/l --- 600 813.6 149.3 1024.18 Total Hardness as CaCO3 mg/l --- --- 31 54.3 46.59 Sulphates mg/l --- 1000 6.8 <2.5 13.810 Calcium mg/l --- --- 9.3 17.1 15.611 Magnesium mg/l --- --- 1.9 2.8 1.912 BOD mg/l 30 30 3.6 <2 413 COD mg/l 250 100 18 3.8 21.714 Oil & Grease mg/l 10 10 <5 <5 <515 Phenolic Compounds mg/l 1 1.2 <0.001 <0.001 <0.00116 Sulphides mg/l 2 2 <0.5 <0.5 <0.517 Fluorides mg/l 2 1.5 3.7 1.55 8.2
18 Ammonia Nitrogen mg/l 5.32 2.58 5.78
19 Iron mg/l --- --- 0.97 0.18 5.18
20 Total Chromium mg/l 2 1 <0.05 <0.05 <0.05
21 Zinc mg/l 0.017 0.024 0.02222 Copper mg/l <0.05 <0.05 <0.0523 Nickel mg/l <0.05 <0.05 <0.0524 Arsenic mg/l <0.01 <0.01 <0.0125 Lead mg/l <0.1 <0.1 <0.126 Mercury mg/l 0.01 0.01 <0.001 <0.001 <0.001
Date

Analysis of R.O. Water of CBM Raniganj Project by Essar Oil Limited (E P Division)Compliance Period: Oct'16 to Mar'17
ANNEXURE IV
04.10.2016 04.10.2016 04.10.2016
S. No. Parameter Unit
CPCB Limit forDischarge of
EnvironmentalPollutants (Inland
surface water)
OnshoreDischargeStandards
Inlet EDD-050 Outlet EDD-050 Reject EDD-050
Date
27 Boron mg/l --- --- <1 <1 <1
28 Sodium Absorption Ratio --- --- 89.6 27.2 88.9
29 Phosphorous mg/l 0.017 0.018 0.0230 Aluminum mg/l <0.01 <0.01 <0.0131 Lithium mg/l <0.5 <0.5 <0.532 Manganese mg/l <0.05 <0.05 0.07133 Molybednum mg/l <0.5 <0.5 <0.534 Palladium mg/l <0.5 <0.5 <0.535 Selenium mg/l <0.01 <0.01 <0.0136 Vanadium mg/l <0.2 <0.2 <0.237 Cadmium mg/l <0.01 <0.01 <0.0138 Cobalt mg/l <0.1 <0.1 <0.139 Bicarbonate mg/l --- --- 548.2 299.4 751.2
40 Electrical Conductivity at 25degree Celsius us/cm --- --- 4112 1260 5560

Analysis of R.O. Water of CBM Raniganj Project by Essar Oil Limited (E P Division)Compliance Period: Oct'16 to Mar'17
ANNEXURE IV
S. No. Parameter Unit
CPCB Limit forDischarge of
EnvironmentalPollutants (Inland
surface water)
OnshoreDischargeStandards
1 pH 5.5 to 9.0 5.5-9.02 Total Suspended Solids mg/l 100 1003 Total Dissolved Solids mg/l --- 21004 Turbidity NTU --- ---5 Acidity as CaCO3 mg/l6 Alkalinity as CaCO3 mg/l --- ---7 Chlorides mg/l --- 6008 Total Hardness as CaCO3 mg/l --- ---9 Sulphates mg/l --- 100010 Calcium mg/l --- ---11 Magnesium mg/l --- ---12 BOD mg/l 30 3013 COD mg/l 250 10014 Oil & Grease mg/l 10 1015 Phenolic Compounds mg/l 1 1.216 Sulphides mg/l 2 217 Fluorides mg/l 2 1.518 Ammonia Nitrogen mg/l19 Iron mg/l --- ---20 Total Chromium mg/l 2 121 Zinc mg/l22 Copper mg/l23 Nickel mg/l24 Arsenic mg/l25 Lead mg/l26 Mercury mg/l 0.01 0.01
Date 04.10.2016 04.10.2016 04.10.2016
Inlet GGS 1 Outlet GGS 1 Reject GGS 1
8.32 7.95 8.23<2 <2 121816 284 109925.8 2.4 24.7Nil 21.5 5.9407.7 149.8 1609.9603 130.2 7322.215.5 62.1 14247.1 <2.5 17.43.1 18.7 438.51.9 3.8 80.12.4 <2 511 5.6 27<5 <5 <5<0.001 <0.001 <0.001<0.5 <0.5 <0.55.2 0.68 9.1
2.46 1.23 6.6
0.38 0.11 2.1
<0.05 <0.05 <0.05
0.015 0.012 0.02<0.05 <0.05 <0.05<0.05 <0.05 <0.05<0.01 <0.01 <0.01<0.1 <0.1 <0.1<0.001 <0.001 <0.001

Analysis of R.O. Water of CBM Raniganj Project by Essar Oil Limited (E P Division)Compliance Period: Oct'16 to Mar'17
ANNEXURE IV
S. No. Parameter Unit
CPCB Limit forDischarge of
EnvironmentalPollutants (Inland
surface water)
OnshoreDischargeStandards
Date
27 Boron mg/l --- ---
28 Sodium Absorption Ratio --- ---
29 Phosphorous mg/l30 Aluminum mg/l31 Lithium mg/l32 Manganese mg/l33 Molybednum mg/l34 Palladium mg/l35 Selenium mg/l36 Vanadium mg/l37 Cadmium mg/l38 Cobalt mg/l39 Bicarbonate mg/l --- ---
40 Electrical Conductivity at 25degree Celsius us/cm --- ---
04.10.2016 04.10.2016 04.10.2016
Inlet GGS 1 Outlet GGS 1 Reject GGS 1
<1 <1 <1
100.3 4.31 81.9
0.24 0.14 0.19<0.01 <0.01 <0.01<0.5 <0.5 <0.5<0.05 <0.05 <0.05<0.5 <0.5 <0.5<0.5 <0.5 <0.5<0.01 <0.01 <0.01<0.2 <0.2 <0.2<0.01 <0.01 <0.01<0.1 <0.1 <0.1497.4 182.7 1964.1
2945 490 17460

Analysis of R.O. Water of CBM Raniganj Project by Essar Oil Limited (E P Division)Compliance Period: Oct'16 to Mar'17
ANNEXURE IV
S. No. Parameter Unit
CPCB Limit forDischarge of
EnvironmentalPollutants (Inland
surface water)
OnshoreDischargeStandards
1 pH 5.5 to 9.0 5.5-9.02 Total Suspended Solids mg/l 100 1003 Total Dissolved Solids mg/l --- 21004 Turbidity NTU --- ---5 Acidity as CaCO3 mg/l6 Alkalinity as CaCO3 mg/l --- ---7 Chlorides mg/l --- 6008 Total Hardness as CaCO3 mg/l --- ---9 Sulphates mg/l --- 100010 Calcium mg/l --- ---11 Magnesium mg/l --- ---12 BOD mg/l 30 3013 COD mg/l 250 10014 Oil & Grease mg/l 10 1015 Phenolic Compounds mg/l 1 1.216 Sulphides mg/l 2 217 Fluorides mg/l 2 1.518 Ammonia Nitrogen mg/l19 Iron mg/l --- ---20 Total Chromium mg/l 2 121 Zinc mg/l22 Copper mg/l23 Nickel mg/l24 Arsenic mg/l25 Lead mg/l26 Mercury mg/l 0.01 0.01
Date 05.10.2016 05.10.2016 05.10.2016
Inlet EDH-044 Outlet EDH-044 Reject EDH-044
8.69 8.03 8.353 <2 <23562 382 598610.6 2.3 2.7Nil 19.6 Nil407.7 99.8 532.5938 53.6 1091.250.4 27.1 65.911.8 <2.5 9.617.1 15.6 20.21.9 3.8 3.82.5 2 <210 8 <8<5 <5 <5<0.001 <0.001 <0.001<0.5 <0.5 <0.56.9 0.49 5.5
5.67 2.94 5.88
0.95 0.13 0.15
<0.05 <0.05 <0.05
0.051 0.047 0.022<0.05 <0.05 <0.05<0.05 <0.05 <0.05<0.01 <0.01 <0.01<0.1 <0.1 <0.1<0.001 <0.001 <0.001
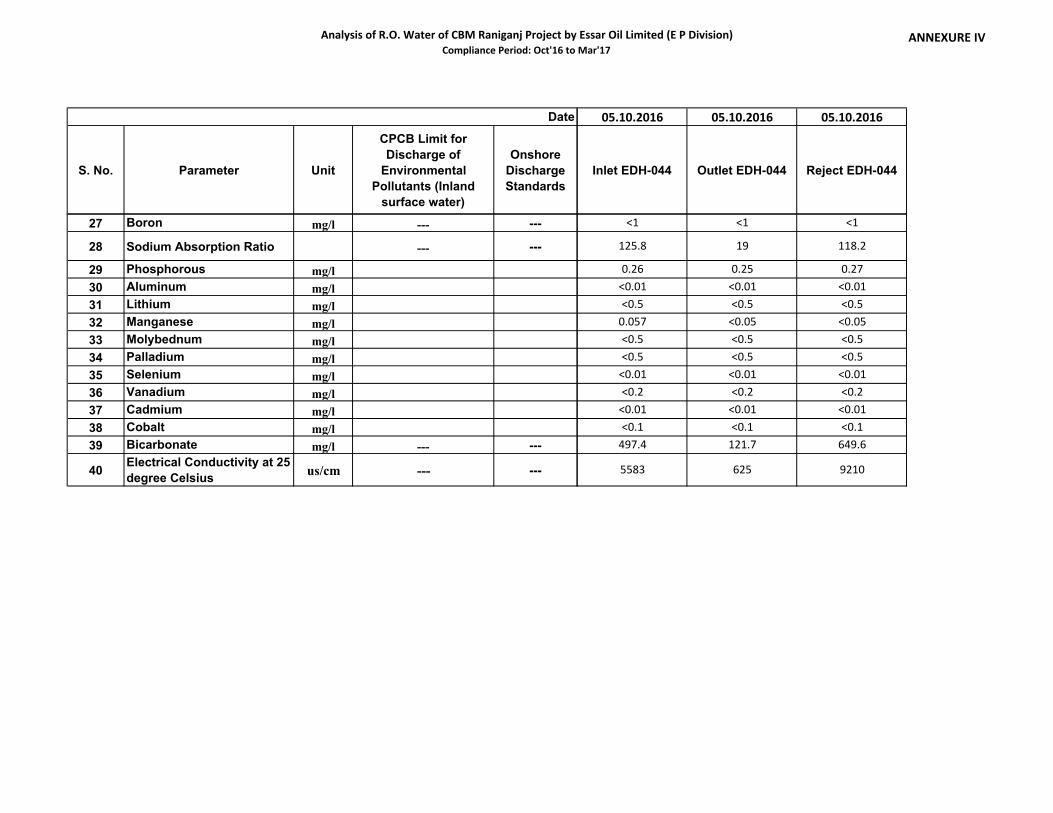
Analysis of R.O. Water of CBM Raniganj Project by Essar Oil Limited (E P Division)Compliance Period: Oct'16 to Mar'17
ANNEXURE IV
S. No. Parameter Unit
CPCB Limit forDischarge of
EnvironmentalPollutants (Inland
surface water)
OnshoreDischargeStandards
Date
27 Boron mg/l --- ---
28 Sodium Absorption Ratio --- ---
29 Phosphorous mg/l30 Aluminum mg/l31 Lithium mg/l32 Manganese mg/l33 Molybednum mg/l34 Palladium mg/l35 Selenium mg/l36 Vanadium mg/l37 Cadmium mg/l38 Cobalt mg/l39 Bicarbonate mg/l --- ---
40 Electrical Conductivity at 25degree Celsius us/cm --- ---
05.10.2016 05.10.2016 05.10.2016
Inlet EDH-044 Outlet EDH-044 Reject EDH-044
<1 <1 <1
125.8 19 118.2
0.26 0.25 0.27<0.01 <0.01 <0.01<0.5 <0.5 <0.50.057 <0.05 <0.05<0.5 <0.5 <0.5<0.5 <0.5 <0.5<0.01 <0.01 <0.01<0.2 <0.2 <0.2<0.01 <0.01 <0.01<0.1 <0.1 <0.1497.4 121.7 649.6
5583 625 9210

Analysis of R.O. Water of CBM Raniganj Project by Essar Oil Limited (E P Division)Compliance Period: Oct'16 to Mar'17
ANNEXURE IV
S. No. Parameter Unit
CPCB Limit forDischarge of
EnvironmentalPollutants (Inland
surface water)
OnshoreDischargeStandards
1 pH 5.5 to 9.0 5.5-9.02 Total Suspended Solids mg/l 100 1003 Total Dissolved Solids mg/l --- 21004 Turbidity NTU --- ---5 Acidity as CaCO3 mg/l6 Alkalinity as CaCO3 mg/l --- ---7 Chlorides mg/l --- 6008 Total Hardness as CaCO3 mg/l --- ---9 Sulphates mg/l --- 100010 Calcium mg/l --- ---11 Magnesium mg/l --- ---12 BOD mg/l 30 3013 COD mg/l 250 10014 Oil & Grease mg/l 10 1015 Phenolic Compounds mg/l 1 1.216 Sulphides mg/l 2 217 Fluorides mg/l 2 1.518 Ammonia Nitrogen mg/l19 Iron mg/l --- ---20 Total Chromium mg/l 2 121 Zinc mg/l22 Copper mg/l23 Nickel mg/l24 Arsenic mg/l25 Lead mg/l26 Mercury mg/l 0.01 0.01
Date 04.11.2016 04.11.2016 04.11.2016
Inlet GGS 1 Outlet GGS 1 Reject GGS 1
8.42 8.31 8.1212 <2 <21986 212 782441.7 <1 2.1Nil Nil 6.86189.2 36.5 2176.8648.5 54.7 2929.7158.4 71.2 1623.6<2.5 7.5 <2.547.6 20.6 555.59.6 4.8 57.72.8 <2 <214 <8 <8<5 <5 <5<0.001 <0.001 <0.001<0.5 <0.5 <0.53.19 0.57 6.243.38 1.27 5.461.87 <0.1 <0.1
<0.05 <0.05 <0.05
0.109 0.026 0.243<0.05 <0.05 <0.05<0.05 <0.05 <0.05<0.01 <0.01 <0.01<0.1 <0.1 <0.1<0.001 <0.001 <0.001
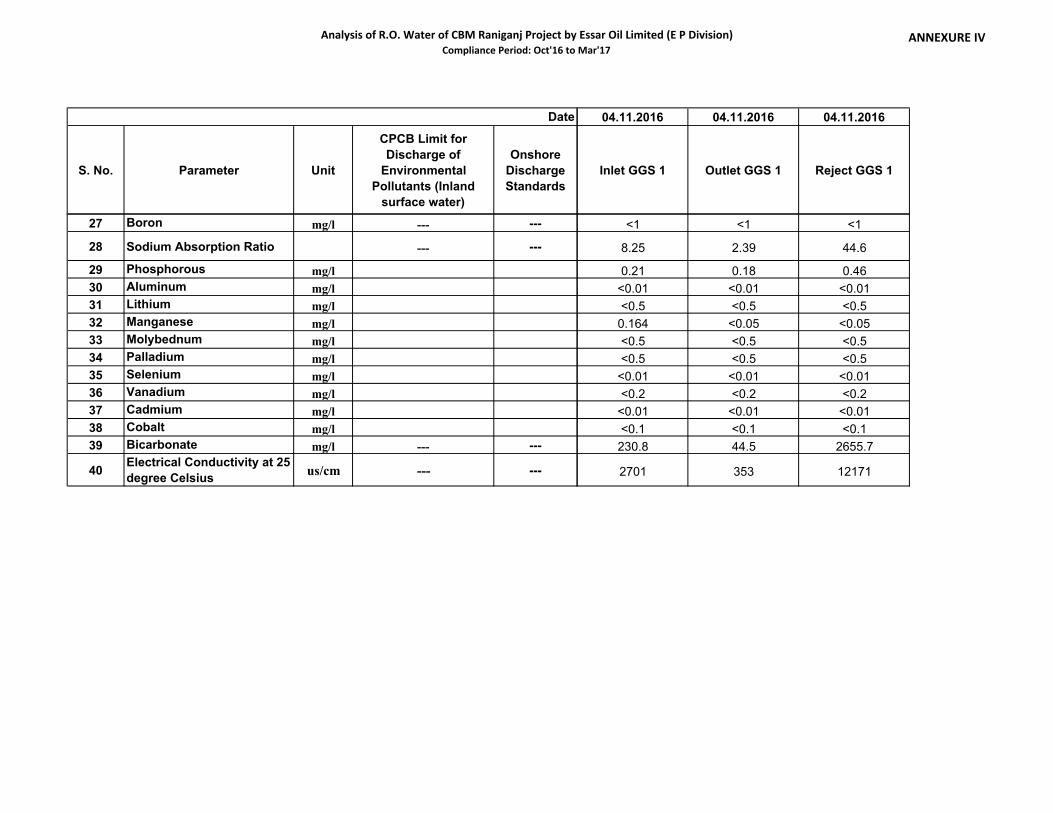
Analysis of R.O. Water of CBM Raniganj Project by Essar Oil Limited (E P Division)Compliance Period: Oct'16 to Mar'17
ANNEXURE IV
S. No. Parameter Unit
CPCB Limit forDischarge of
EnvironmentalPollutants (Inland
surface water)
OnshoreDischargeStandards
Date
27 Boron mg/l --- ---
28 Sodium Absorption Ratio --- ---
29 Phosphorous mg/l30 Aluminum mg/l31 Lithium mg/l32 Manganese mg/l33 Molybednum mg/l34 Palladium mg/l35 Selenium mg/l36 Vanadium mg/l37 Cadmium mg/l38 Cobalt mg/l39 Bicarbonate mg/l --- ---
40 Electrical Conductivity at 25degree Celsius us/cm --- ---
04.11.2016 04.11.2016 04.11.2016
Inlet GGS 1 Outlet GGS 1 Reject GGS 1
<1 <1 <1
8.25 2.39 44.6
0.21 0.18 0.46<0.01 <0.01 <0.01<0.5 <0.5 <0.50.164 <0.05 <0.05<0.5 <0.5 <0.5<0.5 <0.5 <0.5<0.01 <0.01 <0.01<0.2 <0.2 <0.2<0.01 <0.01 <0.01<0.1 <0.1 <0.1230.8 44.5 2655.7
2701 353 12171

Analysis of R.O. Water of CBM Raniganj Project by Essar Oil Limited (E P Division)Compliance Period: Oct'16 to Mar'17
ANNEXURE IV
S. No. Parameter Unit
CPCB Limit forDischarge of
EnvironmentalPollutants (Inland
surface water)
OnshoreDischargeStandards
1 pH 5.5 to 9.0 5.5-9.02 Total Suspended Solids mg/l 100 1003 Total Dissolved Solids mg/l --- 21004 Turbidity NTU --- ---5 Acidity as CaCO3 mg/l6 Alkalinity as CaCO3 mg/l --- ---7 Chlorides mg/l --- 6008 Total Hardness as CaCO3 mg/l --- ---9 Sulphates mg/l --- 100010 Calcium mg/l --- ---11 Magnesium mg/l --- ---12 BOD mg/l 30 3013 COD mg/l 250 10014 Oil & Grease mg/l 10 1015 Phenolic Compounds mg/l 1 1.216 Sulphides mg/l 2 217 Fluorides mg/l 2 1.518 Ammonia Nitrogen mg/l19 Iron mg/l --- ---20 Total Chromium mg/l 2 121 Zinc mg/l22 Copper mg/l23 Nickel mg/l24 Arsenic mg/l25 Lead mg/l26 Mercury mg/l 0.01 0.01
Date 04.11.2016 04.11.2016 04.11.2016
Inlet EDD-050 Outlet EDD-050 Reject EDD-050
8.12 8.38 8.738 <2 722836 864 373217 1.0 1404.9 Nil Nil267.7 147.9 298.5879.2 320.5 947.4237.6 178.2 29711.6 <2.5 12.663.4 39.6 79.319.2 19.2 244.5 2 1623 12 71<5 <5 <5<0.001 <0.001 <0.001<0.5 <0.5 <0.53.67 1.22 3.863.86 2.14 8.780.89 <0.1 3.87
<0.05 <0.05 <0.05
0.082 0.022 0.243<0.05 <0.05 <0.05<0.05 <0.05 <0.05<0.01 <0.01 <0.01<0.1 <0.1 <0.1<0.001 <0.001 <0.001

Analysis of R.O. Water of CBM Raniganj Project by Essar Oil Limited (E P Division)Compliance Period: Oct'16 to Mar'17
ANNEXURE IV
S. No. Parameter Unit
CPCB Limit forDischarge of
EnvironmentalPollutants (Inland
surface water)
OnshoreDischargeStandards
Date
27 Boron mg/l --- ---
28 Sodium Absorption Ratio --- ---
29 Phosphorous mg/l30 Aluminum mg/l31 Lithium mg/l32 Manganese mg/l33 Molybednum mg/l34 Palladium mg/l35 Selenium mg/l36 Vanadium mg/l37 Cadmium mg/l38 Cobalt mg/l39 Bicarbonate mg/l --- ---
40 Electrical Conductivity at 25degree Celsius us/cm --- ---
04.11.2016 04.11.2016 04.11.2016
Inlet EDD-050 Outlet EDD-050 Reject EDD-050
<1 <1 <1
18.85 6.78 20.55
0.21 0.11 0.46<0.01 <0.01 <0.01<0.5 <0.5 <0.5<0.05 <0.05 0.057<0.5 <0.5 <0.5<0.5 <0.5 <0.5<0.01 <0.01 <0.01<0.2 <0.2 <0.2<0.01 <0.01 <0.01<0.1 <0.1 <0.1326.6 180.4 364.2
4080 1320 5238

Analysis of R.O. Water of CBM Raniganj Project by Essar Oil Limited (E P Division)Compliance Period: Oct'16 to Mar'17
ANNEXURE IV
S. No. Parameter Unit
CPCB Limit forDischarge of
EnvironmentalPollutants (Inland
surface water)
OnshoreDischargeStandards
1 pH 5.5 to 9.0 5.5-9.02 Total Suspended Solids mg/l 100 1003 Total Dissolved Solids mg/l --- 21004 Turbidity NTU --- ---5 Acidity as CaCO3 mg/l6 Alkalinity as CaCO3 mg/l --- ---7 Chlorides mg/l --- 6008 Total Hardness as CaCO3 mg/l --- ---9 Sulphates mg/l --- 100010 Calcium mg/l --- ---11 Magnesium mg/l --- ---12 BOD mg/l 30 3013 COD mg/l 250 10014 Oil & Grease mg/l 10 1015 Phenolic Compounds mg/l 1 1.216 Sulphides mg/l 2 217 Fluorides mg/l 2 1.518 Ammonia Nitrogen mg/l19 Iron mg/l --- ---20 Total Chromium mg/l 2 121 Zinc mg/l22 Copper mg/l23 Nickel mg/l24 Arsenic mg/l25 Lead mg/l26 Mercury mg/l 0.01 0.01
Date 04.11.2016 04.11.2016 04.11.2016
Inlet EDH-044 Outlet EDH-044 Reject EDH-044
8.11 8.4 8.352 <2 23846 468 58922.5 1.3 2.34.9 Nil Nil356.6 43.8 581.9798.2 38.7 1720.8316.8 83.1 772.26.5 <2.5 8.871.4 23.8 23833.6 5.7 43.34.3 <2 3.118 <8 12<5 <5 <5<0.001 <0.001 <0.001<0.5 <0.5 <0.52.33 0.76 3.763.12 1.27 2.36<0.1 <0.1 0.11
<0.05 <0.05 <0.05
0.073 0.041 0.048<0.05 <0.05 <0.05<0.05 <0.05 <0.05<0.01 <0.01 <0.01<0.1 <0.1 <0.1<0.001 <0.001 <0.001

Analysis of R.O. Water of CBM Raniganj Project by Essar Oil Limited (E P Division)Compliance Period: Oct'16 to Mar'17
ANNEXURE IV
S. No. Parameter Unit
CPCB Limit forDischarge of
EnvironmentalPollutants (Inland
surface water)
OnshoreDischargeStandards
Date
27 Boron mg/l --- ---
28 Sodium Absorption Ratio --- ---
29 Phosphorous mg/l30 Aluminum mg/l31 Lithium mg/l32 Manganese mg/l33 Molybednum mg/l34 Palladium mg/l35 Selenium mg/l36 Vanadium mg/l37 Cadmium mg/l38 Cobalt mg/l39 Bicarbonate mg/l --- ---
40 Electrical Conductivity at 25degree Celsius us/cm --- ---
04.11.2016 04.11.2016 04.11.2016
Inlet EDH-044 Outlet EDH-044 Reject EDH-044
<1 <1 <1
13 2.17 19.53
0.42 0.16 0.25<0.01 <0.01 <0.01<0.5 <0.5 <0.5<0.05 <0.05 <0.05<0.5 <0.5 <0.5<0.5 <0.5 <0.5<0.01 <0.01 <0.01<0.2 <0.2 <0.2<0.01 <0.01 <0.01<0.1 <0.1 <0.1435 53.4 709.9
553.1 469 9200

Analysis of R.O. Water of CBM Raniganj Project by Essar Oil Limited (E P Division)Compliance Period: Oct'16 to Mar'17
ANNEXURE IV
S. No. Parameter Unit
CPCB Limit forDischarge of
EnvironmentalPollutants (Inland
surface water)
OnshoreDischargeStandards
1 pH 5.5 to 9.0 5.5-9.02 Total Suspended Solids mg/l 100 1003 Total Dissolved Solids mg/l --- 21004 Turbidity NTU --- ---5 Acidity as CaCO3 mg/l6 Alkalinity as CaCO3 mg/l --- ---7 Chlorides mg/l --- 6008 Total Hardness as CaCO3 mg/l --- ---9 Sulphates mg/l --- 100010 Calcium mg/l --- ---11 Magnesium mg/l --- ---12 BOD mg/l 30 3013 COD mg/l 250 10014 Oil & Grease mg/l 10 1015 Phenolic Compounds mg/l 1 1.216 Sulphides mg/l 2 217 Fluorides mg/l 2 1.518 Ammonia Nitrogen mg/l19 Iron mg/l --- ---20 Total Chromium mg/l 2 121 Zinc mg/l22 Copper mg/l23 Nickel mg/l24 Arsenic mg/l25 Lead mg/l26 Mercury mg/l 0.01 0.01
Date 02.12.2016 02.12.2016 02.12.2016
Inlet GGS 1 Outlet GGS 1 Reject GGS 1
8.31 7.58 7.622 <2 51426 184 113786 <1 12.5Nil 10.8 9.8345.4 85.2 1609.5430.2 22.5 7231.2150.4 19.8 1227.610.6 5.8 21.747.6 6.3 412.57.6 <1 48.1<2 <2 <2<8 <8 <8<5 <5 <5<0.001 <0.001 <0.001<0.5 <0.5 <0.50.87 0.48 2.442.11 3.46 5.40.86 0.18 3.11
<0.05 <0.05 <0.05
0.033 0.059 0.078<0.05 <0.05 <0.05<0.05 <0.05 <0.05<0.01 <0.01 <0.01<0.1 <0.1 <0.1<0.001 <0.001 <0.001

Analysis of R.O. Water of CBM Raniganj Project by Essar Oil Limited (E P Division)Compliance Period: Oct'16 to Mar'17
ANNEXURE IV
S. No. Parameter Unit
CPCB Limit forDischarge of
EnvironmentalPollutants (Inland
surface water)
OnshoreDischargeStandards
Date
27 Boron mg/l --- ---
28 Sodium Absorption Ratio --- ---
29 Phosphorous mg/l30 Aluminum mg/l31 Lithium mg/l32 Manganese mg/l33 Molybednum mg/l34 Palladium mg/l35 Selenium mg/l36 Vanadium mg/l37 Cadmium mg/l38 Cobalt mg/l39 Bicarbonate mg/l --- ---
40 Electrical Conductivity at 25degree Celsius us/cm --- ---
02.12.2016 02.12.2016 02.12.2016
Inlet GGS 1 Outlet GGS 1 Reject GGS 1
<1 <1 <1
27.8 4.9 92.9
0.39 0.42 0.31<0.01 <0.01 <0.01<0.5 <0.5 <0.5<0.05 <0.05 0.188<0.5 <0.5 <0.5<0.5 <0.5 <0.5<0.01 <0.01 <0.01<0.2 <0.2 <0.2<0.02 <0.02 <0.02<0.1 <0.1 <0.1421.4 103.9 1963.6
1978 292 16732

Analysis of R.O. Water of CBM Raniganj Project by Essar Oil Limited (E P Division)Compliance Period: Oct'16 to Mar'17
ANNEXURE IV
S. No. Parameter Unit
CPCB Limit forDischarge of
EnvironmentalPollutants (Inland
surface water)
OnshoreDischargeStandards
1 pH 5.5 to 9.0 5.5-9.02 Total Suspended Solids mg/l 100 1003 Total Dissolved Solids mg/l --- 21004 Turbidity NTU --- ---5 Acidity as CaCO3 mg/l6 Alkalinity as CaCO3 mg/l --- ---7 Chlorides mg/l --- 6008 Total Hardness as CaCO3 mg/l --- ---9 Sulphates mg/l --- 100010 Calcium mg/l --- ---11 Magnesium mg/l --- ---12 BOD mg/l 30 3013 COD mg/l 250 10014 Oil & Grease mg/l 10 1015 Phenolic Compounds mg/l 1 1.216 Sulphides mg/l 2 217 Fluorides mg/l 2 1.518 Ammonia Nitrogen mg/l19 Iron mg/l --- ---20 Total Chromium mg/l 2 121 Zinc mg/l22 Copper mg/l23 Nickel mg/l24 Arsenic mg/l25 Lead mg/l26 Mercury mg/l 0.01 0.01
Date 02.12.2016 02.12.2016 02.12.2016
Inlet EDD-050 Outlet EDD-050 Reject EDD-050
8.32 8.19 8.614 <2 <22228 788 346212.1 3.6 2.0Nil 5.8 Nil428.7 272.8 598.7552.3 385.6 812.5166.3 122.7 201.913.6 8.9 11.252.3 39.6 66.68.6 5.7 8.6<2 <2 <2<8 <8 <8<5 <5 <5<0.001 <0.001 <0.001<0.5 <0.5 <0.51.07 0.98 1.484.21 2.26 3.692.41 0.74 0.39
<0.05 <0.05 <0.05
0.114 0.087 0.062<0.05 <0.05 <0.05<0.05 <0.05 <0.05<0.01 <0.01 <0.01<0.1 <0.1 <0.1<0.001 <0.001 <0.001

Analysis of R.O. Water of CBM Raniganj Project by Essar Oil Limited (E P Division)Compliance Period: Oct'16 to Mar'17
ANNEXURE IV
S. No. Parameter Unit
CPCB Limit forDischarge of
EnvironmentalPollutants (Inland
surface water)
OnshoreDischargeStandards
Date
27 Boron mg/l --- ---
28 Sodium Absorption Ratio --- ---
29 Phosphorous mg/l30 Aluminum mg/l31 Lithium mg/l32 Manganese mg/l33 Molybednum mg/l34 Palladium mg/l35 Selenium mg/l36 Vanadium mg/l37 Cadmium mg/l38 Cobalt mg/l39 Bicarbonate mg/l --- ---
40 Electrical Conductivity at 25degree Celsius us/cm --- ---
02.12.2016 02.12.2016 02.12.2016
Inlet EDD-050 Outlet EDD-050 Reject EDD-050
<1 <1 <1
40.9 13.8 47
0.26 0.43 0.51<0.01 <0.01 <0.01<0.5 <0.5 <0.50.204 <0.05 <0.05<0.5 <0.5 <0.5<0.5 <0.5 <0.5<0.01 <0.01 <0.01<0.2 <0.2 <0.2<0.02 <0.02 <0.02<0.1 <0.1 <0.1523 332.8 730.4
3382 1049 4651

Analysis of R.O. Water of CBM Raniganj Project by Essar Oil Limited (E P Division)Compliance Period: Oct'16 to Mar'17
ANNEXURE IV
S. No. Parameter Unit
CPCB Limit forDischarge of
EnvironmentalPollutants (Inland
surface water)
OnshoreDischargeStandards
1 pH 5.5 to 9.0 5.5-9.02 Total Suspended Solids mg/l 100 1003 Total Dissolved Solids mg/l --- 21004 Turbidity NTU --- ---5 Acidity as CaCO3 mg/l6 Alkalinity as CaCO3 mg/l --- ---7 Chlorides mg/l --- 6008 Total Hardness as CaCO3 mg/l --- ---9 Sulphates mg/l --- 100010 Calcium mg/l --- ---11 Magnesium mg/l --- ---12 BOD mg/l 30 3013 COD mg/l 250 10014 Oil & Grease mg/l 10 1015 Phenolic Compounds mg/l 1 1.216 Sulphides mg/l 2 217 Fluorides mg/l 2 1.518 Ammonia Nitrogen mg/l19 Iron mg/l --- ---20 Total Chromium mg/l 2 121 Zinc mg/l22 Copper mg/l23 Nickel mg/l24 Arsenic mg/l25 Lead mg/l26 Mercury mg/l 0.01 0.01
Date 02.12.2016 02.12.2016 02.12.2016
Inlet EDH-044 Outlet EDH-044 Reject EDH-044
8.02 8.36 7.9818 <2 <23816 142 624889.2 3.1 <16.2 Nil 9.8632.8 87.4 532.8877.1 18.8 1078.3229.6 15.8 241.514.3 6.2 16.760.3 4.7 82.519.2 <1 8.6<2 <2 <2<8 <8 <8<5 <5 <5<0.001 <0.001 <0.001<0.5 <0.5 <0.50.68 0.59 1.194.07 3.12 4.8210.61 0.73 0.18
<0.05 <0.05 <0.05
0.093 0.022 0.019<0.05 <0.05 <0.05<0.05 <0.05 <0.05<0.01 <0.01 <0.01<0.1 <0.1 <0.1<0.001 <0.001 <0.001

Analysis of R.O. Water of CBM Raniganj Project by Essar Oil Limited (E P Division)Compliance Period: Oct'16 to Mar'17
ANNEXURE IV
S. No. Parameter Unit
CPCB Limit forDischarge of
EnvironmentalPollutants (Inland
surface water)
OnshoreDischargeStandards
Date
27 Boron mg/l --- ---
28 Sodium Absorption Ratio --- ---
29 Phosphorous mg/l30 Aluminum mg/l31 Lithium mg/l32 Manganese mg/l33 Molybednum mg/l34 Palladium mg/l35 Selenium mg/l36 Vanadium mg/l37 Cadmium mg/l38 Cobalt mg/l39 Bicarbonate mg/l --- ---
40 Electrical Conductivity at 25degree Celsius us/cm --- ---
02.12.2016 02.12.2016 02.12.2016
Inlet EDH-044 Outlet EDH-044 Reject EDH-044
<1 <1 <1
61.9 4.5 65.8
0.21 0.19 0.35<0.01 <0.01 <0.01<0.5 <0.5 <0.50.249 <0.05 <0.05<0.5 <0.5 <0.5<0.5 <0.5 <0.5<0.01 <0.01 <0.01<0.2 <0.2 <0.2<0.02 <0.02 <0.02<0.1 <0.1 <0.1772 106.6 650
5629 242 9844

Analysis of R.O. Water of CBM Raniganj Project by Essar Oil Limited (E P Division)Compliance Period: Oct'16 to Mar'17
ANNEXURE IV
S. No. Parameter Unit
CPCB Limit forDischarge of
EnvironmentalPollutants (Inland
surface water)
OnshoreDischargeStandards
1 pH 5.5 to 9.0 5.5-9.02 Total Suspended Solids mg/l 100 1003 Total Dissolved Solids mg/l --- 21004 Turbidity NTU --- ---5 Acidity as CaCO3 mg/l6 Alkalinity as CaCO3 mg/l --- ---7 Chlorides mg/l --- 6008 Total Hardness as CaCO3 mg/l --- ---9 Sulphates mg/l --- 100010 Calcium mg/l --- ---11 Magnesium mg/l --- ---12 BOD mg/l 30 3013 COD mg/l 250 10014 Oil & Grease mg/l 10 1015 Phenolic Compounds mg/l 1 1.216 Sulphides mg/l 2 217 Fluorides mg/l 2 1.518 Ammonia Nitrogen mg/l19 Iron mg/l --- ---20 Total Chromium mg/l 2 121 Zinc mg/l22 Copper mg/l23 Nickel mg/l24 Arsenic mg/l25 Lead mg/l26 Mercury mg/l 0.01 0.01
Date 09.01.2017 09.01.2017 09.01.2017
Inlet EDD-050 Outlet EDD-050 Reject EDD-050
8.34 8.42 8.568 <2 <22482 882 282418.6 <1 <1Nil Nil Nil124.6 28.7 135.91032.5 320.4 1220.3164.6 90.2 117.611.7 5.1 12.547.1 18.8 18.811.4 10.5 17.18.4 <2 <239.5 <8 <8<5 <5 <5<0.001 <0.001 <0.001<0.5 <0.5 <0.52.42 0.82 1.764.86 2.44 5.470.71 0.18 0.12
<0.05 <0.05 <0.05
0.143 0.101 0.172<0.05 <0.05 <0.05<0.05 <0.05 <0.05<0.01 <0.01 <0.01<0.1 <0.1 <0.1<0.001 <0.001 <0.001

Analysis of R.O. Water of CBM Raniganj Project by Essar Oil Limited (E P Division)Compliance Period: Oct'16 to Mar'17
ANNEXURE IV
S. No. Parameter Unit
CPCB Limit forDischarge of
EnvironmentalPollutants (Inland
surface water)
OnshoreDischargeStandards
Date
27 Boron mg/l --- ---
28 Sodium Absorption Ratio --- ---
29 Phosphorous mg/l30 Aluminum mg/l31 Lithium mg/l32 Manganese mg/l33 Molybednum mg/l34 Palladium mg/l35 Selenium mg/l36 Vanadium mg/l37 Cadmium mg/l38 Cobalt mg/l39 Bicarbonate mg/l --- ---
40 Electrical Conductivity at 25degree Celsius us/cm --- ---
09.01.2017 09.01.2017 09.01.2017
Inlet EDD-050 Outlet EDD-050 Reject EDD-050
<1 <1 <1
30.3 5.2 41.2
0.42 0.24 0.31<0.01 <0.01 <0.01<0.5 <0.5 <0.5<0.05 <0.05 0.188<0.5 <0.5 <0.5<0.5 <0.5 <0.5<0.01 <0.01 <0.01<0.2 <0.2 <0.2<0.02 <0.02 <0.02<0.1 <0.1 <0.1152 35 165.8
3456 1304 3946

Analysis of R.O. Water of CBM Raniganj Project by Essar Oil Limited (E P Division)Compliance Period: Oct'16 to Mar'17
ANNEXURE IV
S. No. Parameter Unit
CPCB Limit forDischarge of
EnvironmentalPollutants (Inland
surface water)
OnshoreDischargeStandards
1 pH 5.5 to 9.0 5.5-9.02 Total Suspended Solids mg/l 100 1003 Total Dissolved Solids mg/l --- 21004 Turbidity NTU --- ---5 Acidity as CaCO3 mg/l6 Alkalinity as CaCO3 mg/l --- ---7 Chlorides mg/l --- 6008 Total Hardness as CaCO3 mg/l --- ---9 Sulphates mg/l --- 100010 Calcium mg/l --- ---11 Magnesium mg/l --- ---12 BOD mg/l 30 3013 COD mg/l 250 10014 Oil & Grease mg/l 10 1015 Phenolic Compounds mg/l 1 1.216 Sulphides mg/l 2 217 Fluorides mg/l 2 1.518 Ammonia Nitrogen mg/l19 Iron mg/l --- ---20 Total Chromium mg/l 2 121 Zinc mg/l22 Copper mg/l23 Nickel mg/l24 Arsenic mg/l25 Lead mg/l26 Mercury mg/l 0.01 0.01
Date 09.01.2017 09.01.2017 09.01.2017
Inlet EDH-044 Outlet EDH-044 Reject EDH-044
8.47 7.92 7.64<2 2 <23688 182 54327.9 12.7 8.2Nil 9.8 12.7220.5 11.4 180.61228.6 65.3 2318266.6 23.5 309.714.3 <2.5 15.780.1 4.7 81.616.1 2.8 25.71.7 2.6 <28 9 <8<5 <5 <5<0.001 <0.001 <0.001<0.5 <0.5 <0.51.65 0.72 2.16.21 2.02 3.421.53 2.18 1.98
<0.05 <0.05 <0.05
0.089 0.021 0.171<0.05 <0.05 <0.05<0.05 <0.05 <0.05<0.01 <0.01 <0.01<0.1 <0.1 <0.1<0.001 <0.001 <0.001

Analysis of R.O. Water of CBM Raniganj Project by Essar Oil Limited (E P Division)Compliance Period: Oct'16 to Mar'17
ANNEXURE IV
S. No. Parameter Unit
CPCB Limit forDischarge of
EnvironmentalPollutants (Inland
surface water)
OnshoreDischargeStandards
Date
27 Boron mg/l --- ---
28 Sodium Absorption Ratio --- ---
29 Phosphorous mg/l30 Aluminum mg/l31 Lithium mg/l32 Manganese mg/l33 Molybednum mg/l34 Palladium mg/l35 Selenium mg/l36 Vanadium mg/l37 Cadmium mg/l38 Cobalt mg/l39 Bicarbonate mg/l --- ---
40 Electrical Conductivity at 25degree Celsius us/cm --- ---
09.01.2017 09.01.2017 09.01.2017
Inlet EDH-044 Outlet EDH-044 Reject EDH-044
<1 <1 <1
30.2 3.9 55.1
0.39 0.15 0.47<0.01 <0.01 <0.01<0.5 <0.5 <0.50.127 0.059 0.079<0.5 <0.5 <0.5<0.5 <0.5 <0.5<0.01 <0.01 <0.01<0.2 <0.2 <0.2<0.02 <0.02 <0.02<0.1 <0.1 <0.1269 13.9 220.3
5208 256 8108
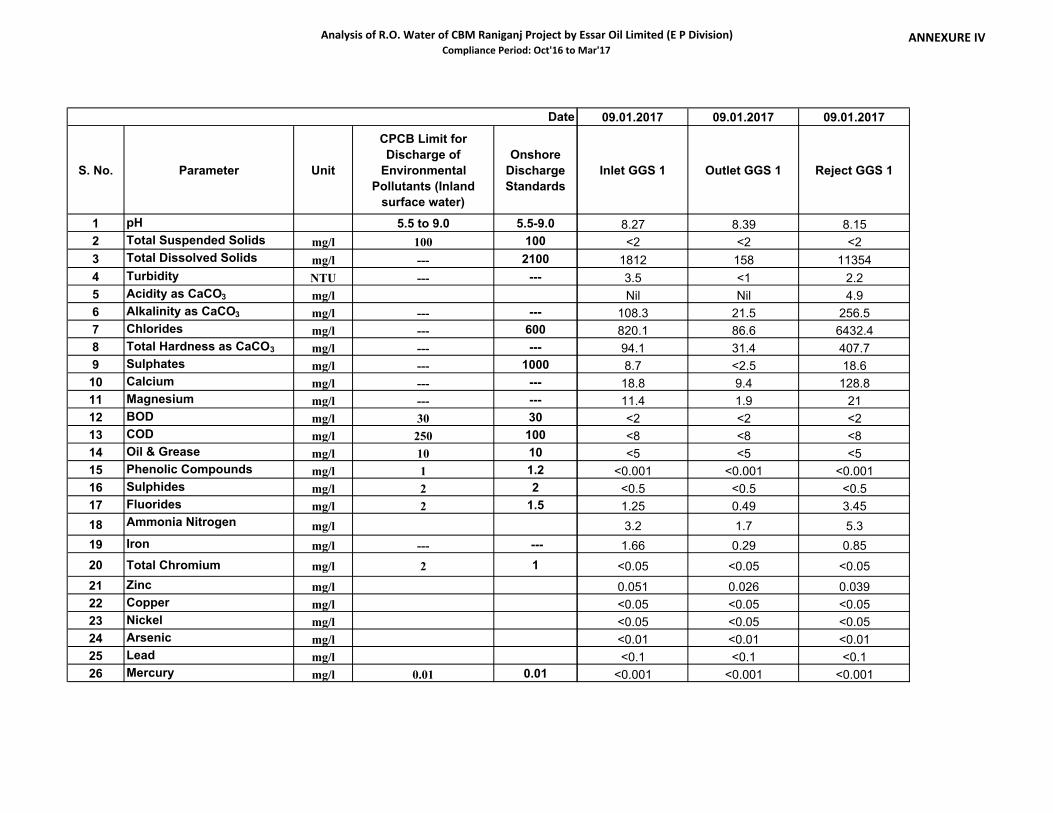
Analysis of R.O. Water of CBM Raniganj Project by Essar Oil Limited (E P Division)Compliance Period: Oct'16 to Mar'17
ANNEXURE IV
S. No. Parameter Unit
CPCB Limit forDischarge of
EnvironmentalPollutants (Inland
surface water)
OnshoreDischargeStandards
1 pH 5.5 to 9.0 5.5-9.02 Total Suspended Solids mg/l 100 1003 Total Dissolved Solids mg/l --- 21004 Turbidity NTU --- ---5 Acidity as CaCO3 mg/l6 Alkalinity as CaCO3 mg/l --- ---7 Chlorides mg/l --- 6008 Total Hardness as CaCO3 mg/l --- ---9 Sulphates mg/l --- 100010 Calcium mg/l --- ---11 Magnesium mg/l --- ---12 BOD mg/l 30 3013 COD mg/l 250 10014 Oil & Grease mg/l 10 1015 Phenolic Compounds mg/l 1 1.216 Sulphides mg/l 2 217 Fluorides mg/l 2 1.518 Ammonia Nitrogen mg/l19 Iron mg/l --- ---20 Total Chromium mg/l 2 121 Zinc mg/l22 Copper mg/l23 Nickel mg/l24 Arsenic mg/l25 Lead mg/l26 Mercury mg/l 0.01 0.01
Date 09.01.2017 09.01.2017 09.01.2017
Inlet GGS 1 Outlet GGS 1 Reject GGS 1
8.27 8.39 8.15<2 <2 <21812 158 113543.5 <1 2.2Nil Nil 4.9108.3 21.5 256.5820.1 86.6 6432.494.1 31.4 407.78.7 <2.5 18.618.8 9.4 128.811.4 1.9 21<2 <2 <2<8 <8 <8<5 <5 <5<0.001 <0.001 <0.001<0.5 <0.5 <0.51.25 0.49 3.453.2 1.7 5.31.66 0.29 0.85
<0.05 <0.05 <0.05
0.051 0.026 0.039<0.05 <0.05 <0.05<0.05 <0.05 <0.05<0.01 <0.01 <0.01<0.1 <0.1 <0.1<0.001 <0.001 <0.001

Analysis of R.O. Water of CBM Raniganj Project by Essar Oil Limited (E P Division)Compliance Period: Oct'16 to Mar'17
ANNEXURE IV
S. No. Parameter Unit
CPCB Limit forDischarge of
EnvironmentalPollutants (Inland
surface water)
OnshoreDischargeStandards
Date
27 Boron mg/l --- ---
28 Sodium Absorption Ratio --- ---
29 Phosphorous mg/l30 Aluminum mg/l31 Lithium mg/l32 Manganese mg/l33 Molybednum mg/l34 Palladium mg/l35 Selenium mg/l36 Vanadium mg/l37 Cadmium mg/l38 Cobalt mg/l39 Bicarbonate mg/l --- ---
40 Electrical Conductivity at 25degree Celsius us/cm --- ---
09.01.2017 09.01.2017 09.01.2017
Inlet GGS 1 Outlet GGS 1 Reject GGS 1
<1 <1 <1
27.8 3.9 110.7
0.24 0.11 0.61<0.01 <0.01 <0.01<0.5 <0.5 <0.50.075 <0.05 <0.05<0.5 <0.5 <0.5<0.5 <0.5 <0.5<0.01 <0.01 <0.01<0.2 <0.2 <0.2<0.02 <0.02 <0.02<0.1 <0.1 <0.1132.1 26.2 312.9
2442 208 16220

Analysis of R.O. Water of CBM Raniganj Project by Essar Oil Limited (E P Division)Compliance Period: Oct'16 to Mar'17
ANNEXURE IV
S. No. Parameter Unit
CPCB Limit forDischarge of
EnvironmentalPollutants (Inland
surface water)
OnshoreDischargeStandards
1 pH 5.5 to 9.0 5.5-9.02 Total Suspended Solids mg/l 100 1003 Total Dissolved Solids mg/l --- 21004 Turbidity NTU --- ---5 Acidity as CaCO3 mg/l6 Alkalinity as CaCO3 mg/l --- ---7 Chlorides mg/l --- 6008 Total Hardness as CaCO3 mg/l --- ---9 Sulphates mg/l --- 100010 Calcium mg/l --- ---11 Magnesium mg/l --- ---12 BOD mg/l 30 3013 COD mg/l 250 10014 Oil & Grease mg/l 10 1015 Phenolic Compounds mg/l 1 1.216 Sulphides mg/l 2 217 Fluorides mg/l 2 1.518 Ammonia Nitrogen mg/l19 Iron mg/l --- ---20 Total Chromium mg/l 2 121 Zinc mg/l22 Copper mg/l23 Nickel mg/l24 Arsenic mg/l25 Lead mg/l26 Mercury mg/l 0.01 0.01
Date 07.02.2017 07.02.2017 07.02.2017
Inlet GGS 1 Outlet GGS 1 Reject GGS 1
8.48 8.37 8.253 <2 <22506 122 805812.6 2.1 1.17.8 4.9 Nil930.2 76.2 12341126 45 261044 20 1567.5 <2.5 14.812.8 4.8 49.72.9 1.9 7.83 <2 <214 <8 <8<5 <5 <5<0.001 <0.001 <0.001<0.5 <0.5 <0.53.48 1.16 6.212.11 1.07 5.431.46 0.83 0.52
<0.05 <0.05 <0.05
0.108 0.068 0.283<0.05 <0.05 <0.05<0.05 <0.05 <0.05<0.01 <0.01 <0.01<0.1 <0.1 <0.1<0.001 <0.001 <0.001

Analysis of R.O. Water of CBM Raniganj Project by Essar Oil Limited (E P Division)Compliance Period: Oct'16 to Mar'17
ANNEXURE IV
S. No. Parameter Unit
CPCB Limit forDischarge of
EnvironmentalPollutants (Inland
surface water)
OnshoreDischargeStandards
Date
27 Boron mg/l --- ---
28 Sodium Absorption Ratio --- ---
29 Phosphorous mg/l30 Aluminum mg/l31 Lithium mg/l32 Manganese mg/l33 Molybednum mg/l34 Palladium mg/l35 Selenium mg/l36 Vanadium mg/l37 Cadmium mg/l38 Cobalt mg/l39 Bicarbonate mg/l --- ---
40 Electrical Conductivity at 25degree Celsius us/cm --- ---
07.02.2017 07.02.2017 07.02.2017
Inlet GGS 1 Outlet GGS 1 Reject GGS 1
<1 <1 <1
60.3 3.02 76.8
0.28 0.18 0.52<0.01 <0.01 <0.01<0.5 <0.5 <0.50.147 <0.05 0.188<0.5 <0.5 <0.5<0.5 <0.5 <0.5<0.01 <0.01 <0.01<0.2 <0.2 <0.2<0.02 <0.02 <0.02<0.1 <0.1 <0.11134.8 93 1505.5
3848 207 12027

Analysis of R.O. Water of CBM Raniganj Project by Essar Oil Limited (E P Division)Compliance Period: Oct'16 to Mar'17
ANNEXURE IV
S. No. Parameter Unit
CPCB Limit forDischarge of
EnvironmentalPollutants (Inland
surface water)
OnshoreDischargeStandards
1 pH 5.5 to 9.0 5.5-9.02 Total Suspended Solids mg/l 100 1003 Total Dissolved Solids mg/l --- 21004 Turbidity NTU --- ---5 Acidity as CaCO3 mg/l6 Alkalinity as CaCO3 mg/l --- ---7 Chlorides mg/l --- 6008 Total Hardness as CaCO3 mg/l --- ---9 Sulphates mg/l --- 100010 Calcium mg/l --- ---11 Magnesium mg/l --- ---12 BOD mg/l 30 3013 COD mg/l 250 10014 Oil & Grease mg/l 10 1015 Phenolic Compounds mg/l 1 1.216 Sulphides mg/l 2 217 Fluorides mg/l 2 1.518 Ammonia Nitrogen mg/l19 Iron mg/l --- ---20 Total Chromium mg/l 2 121 Zinc mg/l22 Copper mg/l23 Nickel mg/l24 Arsenic mg/l25 Lead mg/l26 Mercury mg/l 0.01 0.01
Date 07.02.2017 07.02.2017 07.02.2017
Inlet EDD-050 Outlet EDD-050 Reject EDD-050
8.41 8.52 8.715 2 <22186 792 278218 5 7.05.8 9.8 17.6616 220.3 6811426.3 382.5 1521.572 32 605.8 <2.5 6.619.2 8 17.65.8 2.9 3.93 <2 <216 <8 <8<5 <5 <5<0.001 <0.001 <0.001<0.5 <0.5 <0.52.11 1.87 2.951.96 3.92 2.452.15 1.09 1.18
<0.05 <0.05 <0.05
0.162 0.093 0.219<0.05 <0.05 <0.05<0.05 <0.05 <0.05<0.01 <0.01 <0.01<0.1 <0.1 <0.1<0.001 <0.001 <0.001

Analysis of R.O. Water of CBM Raniganj Project by Essar Oil Limited (E P Division)Compliance Period: Oct'16 to Mar'17
ANNEXURE IV
S. No. Parameter Unit
CPCB Limit forDischarge of
EnvironmentalPollutants (Inland
surface water)
OnshoreDischargeStandards
Date
27 Boron mg/l --- ---
28 Sodium Absorption Ratio --- ---
29 Phosphorous mg/l30 Aluminum mg/l31 Lithium mg/l32 Manganese mg/l33 Molybednum mg/l34 Palladium mg/l35 Selenium mg/l36 Vanadium mg/l37 Cadmium mg/l38 Cobalt mg/l39 Bicarbonate mg/l --- ---
40 Electrical Conductivity at 25degree Celsius us/cm --- ---
07.02.2017 07.02.2017 07.02.2017
Inlet EDD-050 Outlet EDD-050 Reject EDD-050
<1 <1 <1
56.7 21.7 68.8
0.24 0.15 0.31<0.01 <0.01 <0.01<0.5 <0.5 <0.50.242 <0.05 <0.05<0.5 <0.5 <0.5<0.5 <0.5 <0.5<0.01 <0.01 <0.01<0.2 <0.2 <0.2<0.02 <0.02 <0.02<0.1 <0.1 <0.1751.5 268.8 780.8
3148 1227 3942

Analysis of R.O. Water of CBM Raniganj Project by Essar Oil Limited (E P Division)Compliance Period: Oct'16 to Mar'17
ANNEXURE IV
S. No. Parameter Unit
CPCB Limit forDischarge of
EnvironmentalPollutants (Inland
surface water)
OnshoreDischargeStandards
1 pH 5.5 to 9.0 5.5-9.02 Total Suspended Solids mg/l 100 1003 Total Dissolved Solids mg/l --- 21004 Turbidity NTU --- ---5 Acidity as CaCO3 mg/l6 Alkalinity as CaCO3 mg/l --- ---7 Chlorides mg/l --- 6008 Total Hardness as CaCO3 mg/l --- ---9 Sulphates mg/l --- 100010 Calcium mg/l --- ---11 Magnesium mg/l --- ---12 BOD mg/l 30 3013 COD mg/l 250 10014 Oil & Grease mg/l 10 1015 Phenolic Compounds mg/l 1 1.216 Sulphides mg/l 2 217 Fluorides mg/l 2 1.518 Ammonia Nitrogen mg/l19 Iron mg/l --- ---20 Total Chromium mg/l 2 121 Zinc mg/l22 Copper mg/l23 Nickel mg/l24 Arsenic mg/l25 Lead mg/l26 Mercury mg/l 0.01 0.01
Date 07.02.2017 07.02.2017 07.02.2017
Inlet EDH-044 Outlet EDH-044 Reject EDH-044
8.43 8.33 8.19<2 3 <23648 148 53924 10.2 5.85.8 3.9 Nil1128.1 81.1 1640.21627 62 172684 20 1008.2 <2.5 12.525.7 4.8 32.19.9 1.9 4.93 <2 <210 <8 <8<5 <5 <5<0.001 <0.001 <0.001<0.5 <0.5 <0.52.88 2.05 4.162.49 1.21 3.760.71 0.89 0.62
<0.05 <0.05 <0.05
0.017 0.011 0.024<0.05 <0.05 <0.05<0.05 <0.05 <0.05<0.01 <0.01 <0.01<0.1 <0.1 <0.1<0.001 <0.001 <0.001

Analysis of R.O. Water of CBM Raniganj Project by Essar Oil Limited (E P Division)Compliance Period: Oct'16 to Mar'17
ANNEXURE IV
S. No. Parameter Unit
CPCB Limit forDischarge of
EnvironmentalPollutants (Inland
surface water)
OnshoreDischargeStandards
Date
27 Boron mg/l --- ---
28 Sodium Absorption Ratio --- ---
29 Phosphorous mg/l30 Aluminum mg/l31 Lithium mg/l32 Manganese mg/l33 Molybednum mg/l34 Palladium mg/l35 Selenium mg/l36 Vanadium mg/l37 Cadmium mg/l38 Cobalt mg/l39 Bicarbonate mg/l --- ---
40 Electrical Conductivity at 25degree Celsius us/cm --- ---
07.02.2017 07.02.2017 07.02.2017
Inlet EDH-044 Outlet EDH-044 Reject EDH-044
<1 <1 <1
66.56 3.98 65.5
0.25 0.11 0.39<0.01 <0.01 <0.01<0.5 <0.5 <0.5<0.05 <0.05 <0.05<0.5 <0.5 <0.5<0.5 <0.5 <0.5<0.01 <0.01 <0.01<0.2 <0.2 <0.2<0.02 <0.02 <0.02<0.1 <0.1 <0.11376.3 98.9 2001
5476 248 8106

Analysis of R.O. Water of CBM Raniganj Project by Essar Oil Limited (E P Division)Compliance Period: Oct'16 to Mar'17
ANNEXURE IV
S. No. Parameter Unit
CPCB Limit forDischarge of
EnvironmentalPollutants (Inland
surface water)
OnshoreDischargeStandards
1 pH 5.5 to 9.0 5.5-9.02 Total Suspended Solids mg/l 100 1003 Total Dissolved Solids mg/l --- 21004 Turbidity NTU --- ---5 Acidity as CaCO3 mg/l6 Alkalinity as CaCO3 mg/l --- ---7 Chlorides mg/l --- 6008 Total Hardness as CaCO3 mg/l --- ---9 Sulphates mg/l --- 100010 Calcium mg/l --- ---11 Magnesium mg/l --- ---12 BOD mg/l 30 3013 COD mg/l 250 10014 Oil & Grease mg/l 10 1015 Phenolic Compounds mg/l 1 1.216 Sulphides mg/l 2 217 Fluorides mg/l 2 1.518 Ammonia Nitrogen mg/l19 Iron mg/l --- ---20 Total Chromium mg/l 2 121 Zinc mg/l22 Copper mg/l23 Nickel mg/l24 Arsenic mg/l25 Lead mg/l26 Mercury mg/l 0.01 0.01
Date 07.03.2017 07.03.2017 07.03.2017
Inlet GGS 1 Outlet GGS 1 Reject GGS 1
8.53 8.39 8.28<2 <2 41782 228 71641.2 <1 9.410.9 6.8 Nil468 72 1470747 49 304264 28 352<2.5 <2.5 9.814.4 8 78.66.8 1.9 37.9<2 <2 8.9<8 <8 29<5 <5 <5<0.001 <0.001 <0.001<0.5 <0.5 <0.53.1 0.52 10.40.86 0.59 1.880.22 0.17 0.98
<0.05 <0.05 <0.05
0.062 <0.01 0.153<0.05 <0.05 <0.05<0.05 <0.05 <0.05<0.01 <0.01 <0.01<0.1 <0.1 <0.1<0.001 <0.001 <0.001
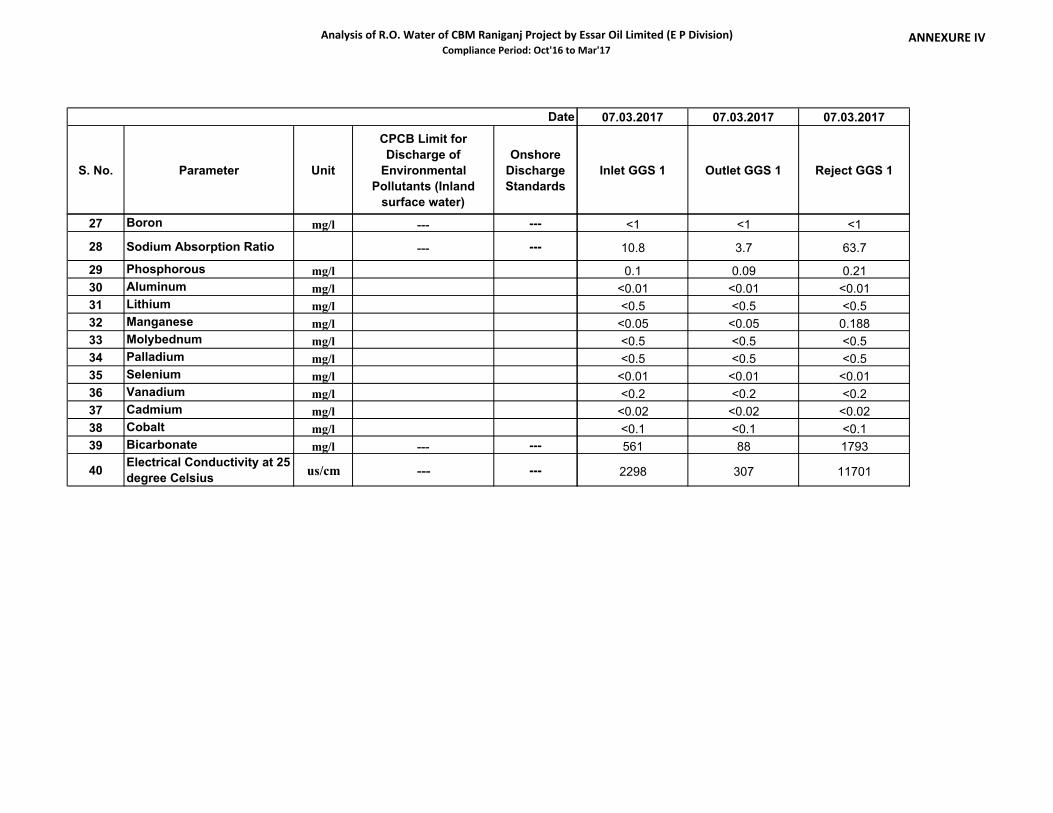
Analysis of R.O. Water of CBM Raniganj Project by Essar Oil Limited (E P Division)Compliance Period: Oct'16 to Mar'17
ANNEXURE IV
S. No. Parameter Unit
CPCB Limit forDischarge of
EnvironmentalPollutants (Inland
surface water)
OnshoreDischargeStandards
Date
27 Boron mg/l --- ---
28 Sodium Absorption Ratio --- ---
29 Phosphorous mg/l30 Aluminum mg/l31 Lithium mg/l32 Manganese mg/l33 Molybednum mg/l34 Palladium mg/l35 Selenium mg/l36 Vanadium mg/l37 Cadmium mg/l38 Cobalt mg/l39 Bicarbonate mg/l --- ---
40 Electrical Conductivity at 25degree Celsius us/cm --- ---
07.03.2017 07.03.2017 07.03.2017
Inlet GGS 1 Outlet GGS 1 Reject GGS 1
<1 <1 <1
10.8 3.7 63.7
0.1 0.09 0.21<0.01 <0.01 <0.01<0.5 <0.5 <0.5<0.05 <0.05 0.188<0.5 <0.5 <0.5<0.5 <0.5 <0.5<0.01 <0.01 <0.01<0.2 <0.2 <0.2<0.02 <0.02 <0.02<0.1 <0.1 <0.1561 88 1793
2298 307 11701

Analysis of R.O. Water of CBM Raniganj Project by Essar Oil Limited (E P Division)Compliance Period: Oct'16 to Mar'17
ANNEXURE IV
S. No. Parameter Unit
CPCB Limit forDischarge of
EnvironmentalPollutants (Inland
surface water)
OnshoreDischargeStandards
1 pH 5.5 to 9.0 5.5-9.02 Total Suspended Solids mg/l 100 1003 Total Dissolved Solids mg/l --- 21004 Turbidity NTU --- ---5 Acidity as CaCO3 mg/l6 Alkalinity as CaCO3 mg/l --- ---7 Chlorides mg/l --- 6008 Total Hardness as CaCO3 mg/l --- ---9 Sulphates mg/l --- 100010 Calcium mg/l --- ---11 Magnesium mg/l --- ---12 BOD mg/l 30 3013 COD mg/l 250 10014 Oil & Grease mg/l 10 1015 Phenolic Compounds mg/l 1 1.216 Sulphides mg/l 2 217 Fluorides mg/l 2 1.518 Ammonia Nitrogen mg/l19 Iron mg/l --- ---20 Total Chromium mg/l 2 121 Zinc mg/l22 Copper mg/l23 Nickel mg/l24 Arsenic mg/l25 Lead mg/l26 Mercury mg/l 0.01 0.01
Date 07.03.2017 07.03.2017 07.03.2017
Inlet EDD-050 Outlet EDD-050 Reject EDD-050
8.21 8.65 8.849 3 <22118 812 251620.9 7.2 <1Nil 16.7 17.6722 470 7841086 218 94964 44 686.5 <2.5 8.216 11.2 48.15.8 3.9 11.72 5.6 <211 19 <8<5 <5 <5<0.001 <0.001 <0.001<0.5 <0.5 <0.51.86 0.77 3.45.1 1.9 1.42.29 1.22 0.27
<0.05 <0.05 <0.05
0.044 0.051 0.065<0.05 <0.05 <0.05<0.05 <0.05 <0.05<0.01 <0.01 <0.01<0.1 <0.1 <0.1<0.001 <0.001 <0.001

Analysis of R.O. Water of CBM Raniganj Project by Essar Oil Limited (E P Division)Compliance Period: Oct'16 to Mar'17
ANNEXURE IV
S. No. Parameter Unit
CPCB Limit forDischarge of
EnvironmentalPollutants (Inland
surface water)
OnshoreDischargeStandards
Date
27 Boron mg/l --- ---
28 Sodium Absorption Ratio --- ---
29 Phosphorous mg/l30 Aluminum mg/l31 Lithium mg/l32 Manganese mg/l33 Molybednum mg/l34 Palladium mg/l35 Selenium mg/l36 Vanadium mg/l37 Cadmium mg/l38 Cobalt mg/l39 Bicarbonate mg/l --- ---
40 Electrical Conductivity at 25degree Celsius us/cm --- ---
07.03.2017 07.03.2017 07.03.2017
Inlet EDD-050 Outlet EDD-050 Reject EDD-050
<1 <1 <1
47.5 4.7 26.1
0.24 0.17 0.12<0.01 <0.01 <0.01<0.5 <0.5 <0.50.091 <0.05 <0.05<0.5 <0.5 <0.5<0.5 <0.5 <0.5<0.01 <0.01 <0.01<0.2 <0.2 <0.2<0.02 <0.02 <0.02<0.1 <0.1 <0.1881 478 801
3142 1176 3428

Analysis of R.O. Water of CBM Raniganj Project by Essar Oil Limited (E P Division)Compliance Period: Oct'16 to Mar'17
ANNEXURE IV
S. No. Parameter Unit
CPCB Limit forDischarge of
EnvironmentalPollutants (Inland
surface water)
OnshoreDischargeStandards
1 pH 5.5 to 9.0 5.5-9.02 Total Suspended Solids mg/l 100 1003 Total Dissolved Solids mg/l --- 21004 Turbidity NTU --- ---5 Acidity as CaCO3 mg/l6 Alkalinity as CaCO3 mg/l --- ---7 Chlorides mg/l --- 6008 Total Hardness as CaCO3 mg/l --- ---9 Sulphates mg/l --- 100010 Calcium mg/l --- ---11 Magnesium mg/l --- ---12 BOD mg/l 30 3013 COD mg/l 250 10014 Oil & Grease mg/l 10 1015 Phenolic Compounds mg/l 1 1.216 Sulphides mg/l 2 217 Fluorides mg/l 2 1.518 Ammonia Nitrogen mg/l19 Iron mg/l --- ---20 Total Chromium mg/l 2 121 Zinc mg/l22 Copper mg/l23 Nickel mg/l24 Arsenic mg/l25 Lead mg/l26 Mercury mg/l 0.01 0.01
Date 17.03.2017 17.03.2017 17.03.2017
Inlet EDH-044 Outlet EDH-044 Reject EDH-044
8.44 8.79 7.66<2 <2 43344 162 55166.8 2.1 1210.6 16.8 Nil126.8 42.1 282940 27 109260 32 765.4 <2.5 12.517.6 6.4 19.23.9 3.9 6.82.1 <2 38 <8 10<5 <5 <5<0.001 <0.001 <0.001<0.5 <0.5 <0.51.96 0.29 2.483.32 1.98 3.962.86 0.24 4.22
<0.05 <0.05 <0.05
0.082 0.041 0.117<0.05 <0.05 <0.05<0.05 <0.05 <0.05<0.01 <0.01 <0.01<0.1 <0.1 <0.1<0.001 <0.001 <0.001

Analysis of R.O. Water of CBM Raniganj Project by Essar Oil Limited (E P Division)Compliance Period: Oct'16 to Mar'17
ANNEXURE IV
S. No. Parameter Unit
CPCB Limit forDischarge of
EnvironmentalPollutants (Inland
surface water)
OnshoreDischargeStandards
Date
27 Boron mg/l --- ---
28 Sodium Absorption Ratio --- ---
29 Phosphorous mg/l30 Aluminum mg/l31 Lithium mg/l32 Manganese mg/l33 Molybednum mg/l34 Palladium mg/l35 Selenium mg/l36 Vanadium mg/l37 Cadmium mg/l38 Cobalt mg/l39 Bicarbonate mg/l --- ---
40 Electrical Conductivity at 25degree Celsius us/cm --- ---
17.03.2017 17.03.2017 17.03.2017
Inlet EDH-044 Outlet EDH-044 Reject EDH-044
<1 <1 <1
40 2.83 58.5
0.43 0.22 0.56<0.01 <0.01 <0.01<0.5 <0.5 <0.50.092 <0.05 0.128<0.5 <0.5 <0.5<0.5 <0.5 <0.5<0.01 <0.01 <0.01<0.2 <0.2 <0.2<0.02 <0.02 <0.02<0.1 <0.1 <0.1138.2 52.4 344
4626 247 7819
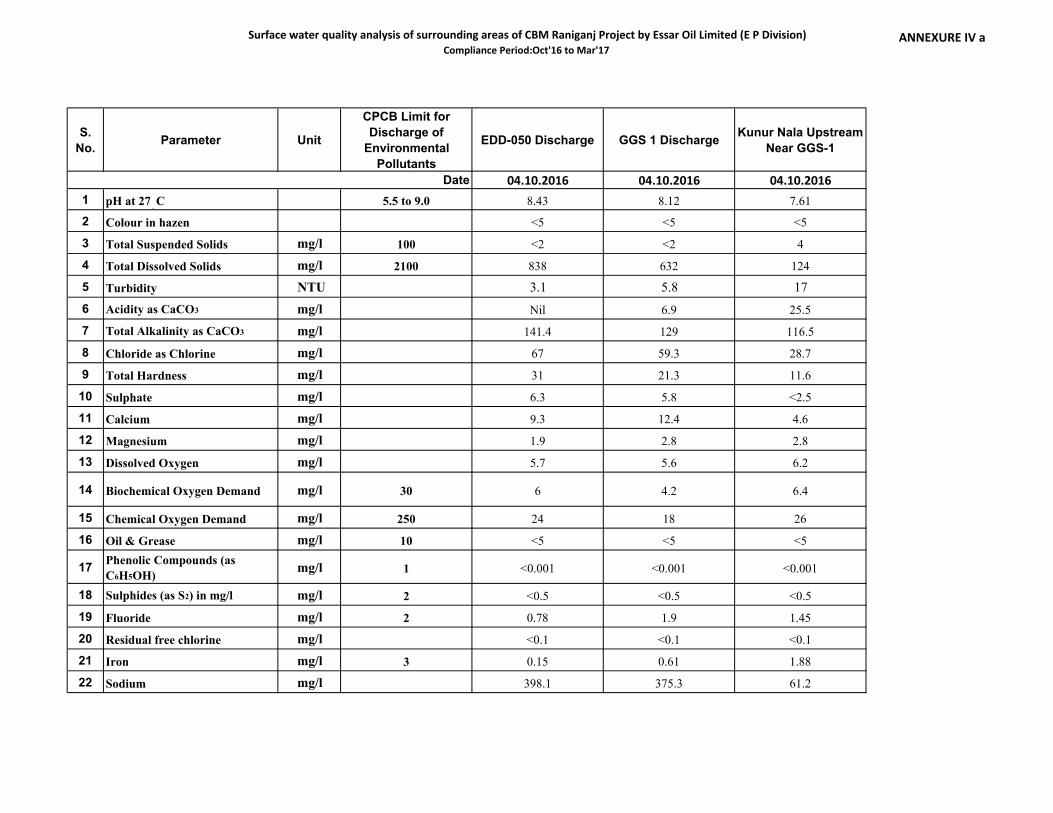
Surface water quality analysis of surrounding areas of CBM Raniganj Project by Essar Oil Limited (E P Division)Compliance Period:Oct'16 to Mar'17
ANNEXURE IV a
S.No. Parameter Unit
CPCB Limit forDischarge of
EnvironmentalPollutants
EDD-050 Discharge GGS 1 Discharge Kunur Nala UpstreamNear GGS-1
04.10.2016 04.10.2016 04.10.20161 pH at 27⁰C 5.5 to 9.0 8.43 8.12 7.61
2 Colour in hazen <5 <5 <5
3 Total Suspended Solids mg/l 100 <2 <2 4
4 Total Dissolved Solids mg/l 2100 838 632 124
5 Turbidity NTU 3.1 5.8 176 Acidity as CaCO3 mg/l Nil 6.9 25.5
7 Total Alkalinity as CaCO3 mg/l 141.4 129 116.5
8 Chloride as Chlorine mg/l 67 59.3 28.7
9 Total Hardness mg/l 31 21.3 11.6
10 Sulphate mg/l 6.3 5.8 <2.5
11 Calcium mg/l 9.3 12.4 4.6
12 Magnesium mg/l 1.9 2.8 2.8
13 Dissolved Oxygen mg/l 5.7 5.6 6.2
14 Biochemical Oxygen Demand mg/l 30 6 4.2 6.4
15 Chemical Oxygen Demand mg/l 250 24 18 26
16 Oil & Grease mg/l 10 <5 <5 <5
17 Phenolic Compounds (asC6H5OH) mg/l 1 <0.001 <0.001 <0.001
18 Sulphides (as S2) in mg/l mg/l 2 <0.5 <0.5 <0.5
19 Fluoride mg/l 2 0.78 1.9 1.45
20 Residual free chlorine mg/l <0.1 <0.1 <0.1
21 Iron mg/l 3 0.15 0.61 1.88
22 Sodium mg/l 398.1 375.3 61.2
Date

Surface water quality analysis of surrounding areas of CBM Raniganj Project by Essar Oil Limited (E P Division)Compliance Period:Oct'16 to Mar'17
ANNEXURE IV a
S.No. Parameter Unit
CPCB Limit forDischarge of
EnvironmentalPollutants
EDD-050 Discharge GGS 1 Discharge Kunur Nala UpstreamNear GGS-1
04.10.2016 04.10.2016 04.10.2016Date23 Total Chromium mg/l 2 <0.05 <0.05 <0.05
24 Zinc mg/l 5 0.024 0.039 0.031
25 Copper mg/l 3 <0.05 <0.05 <0.05
26 Nickel mg/l 3 <0.05 <0.05 <0.05
27 Arsenic mg/l 0.2 <0.01 <0.01 <0.01
28 Lead mg/l 0.1 <0.1 <0.1 <0.1
29 Mercury mg/l 0.01 <0.001 <0.001 <0.001
30 Boron mg/l <1 <1 <1
31 SAR 31.1 35.2 7.8
32 Phosphate mg/l 0.18 0.15 0.1733 Potassium mg/l 8.1 7.3 1.8
34 Aluminium mg/l <0.01 <0.01 <0.01
35 Electrical Conductivity at 25° C µmhos/cm 1259 9.98 225
36 Cadmium mg/l 2 <0.01 <0.01 <0.01
37 Cobalt mg/l <0.1 <0.1 <0.1
38 Vanadium mg/l 0.2 <0.2 <0.2 <0.2
39 Palladium mg/l <0.5 <0.5 <0.5
40 Selenium mg/l 0.05 <0.01 <0.01 <0.01
41 Manganese mg/l 2 <0.05 <0.05 0.069
42 Molybednum mg/l <0.5 <0.5 <0.543 Lithium mg/l <0.5 <0.5 <0.544 Berylium mg/l <0.5 <0.5 <0.5
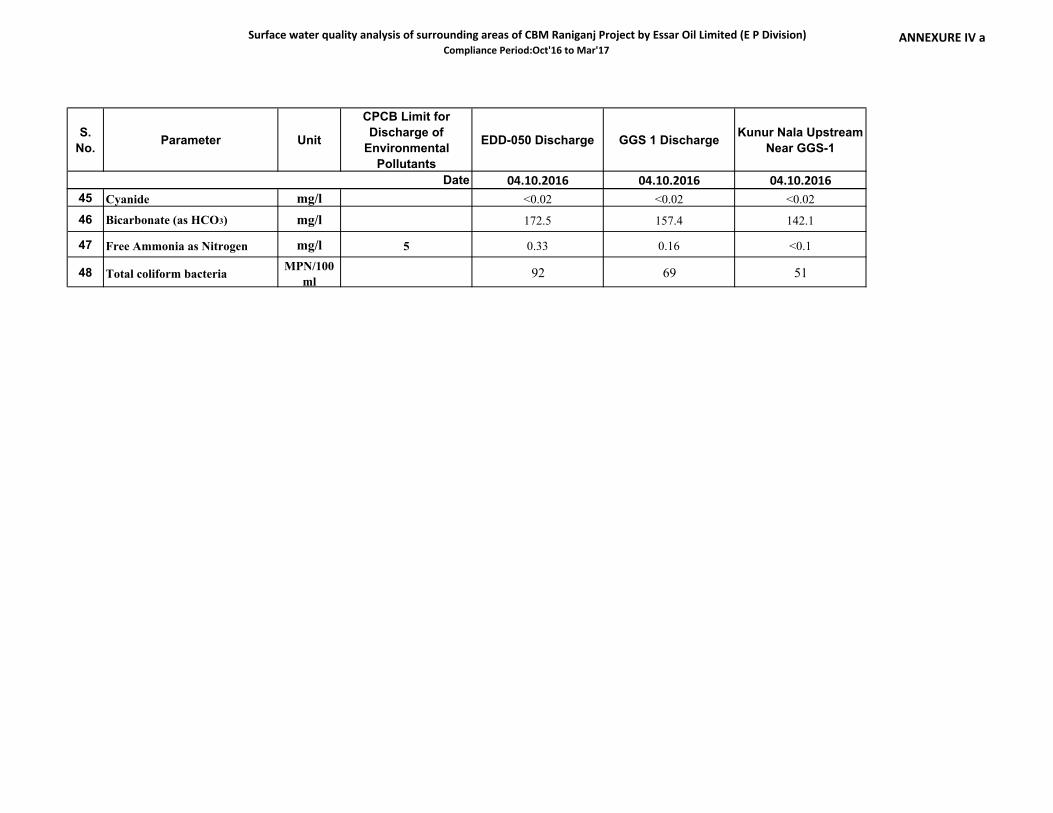
Surface water quality analysis of surrounding areas of CBM Raniganj Project by Essar Oil Limited (E P Division)Compliance Period:Oct'16 to Mar'17
ANNEXURE IV a
S.No. Parameter Unit
CPCB Limit forDischarge of
EnvironmentalPollutants
EDD-050 Discharge GGS 1 Discharge Kunur Nala UpstreamNear GGS-1
04.10.2016 04.10.2016 04.10.2016Date45 Cyanide mg/l <0.02 <0.02 <0.02
46 Bicarbonate (as HCO3) mg/l 172.5 157.4 142.1
47 Free Ammonia as Nitrogen mg/l 5 0.33 0.16 <0.1
48 Total coliform bacteria MPN/100ml
92 69 51

Surface water quality analysis of surrounding areas of CBM Raniganj Project by Essar Oil Limited (E P Division)Compliance Period:Oct'16 to Mar'17
ANNEXURE IV a
S.No. Parameter Unit
CPCB Limit forDischarge of
EnvironmentalPollutants
1 pH at 27⁰C 5.5 to 9.0
2 Colour in hazen
3 Total Suspended Solids mg/l 100
4 Total Dissolved Solids mg/l 2100
5 Turbidity NTU6 Acidity as CaCO3 mg/l7 Total Alkalinity as CaCO3 mg/l8 Chloride as Chlorine mg/l9 Total Hardness mg/l
10 Sulphate mg/l11 Calcium mg/l12 Magnesium mg/l13 Dissolved Oxygen mg/l
14 Biochemical Oxygen Demand mg/l 30
15 Chemical Oxygen Demand mg/l 250
16 Oil & Grease mg/l 10
17 Phenolic Compounds (asC6H5OH) mg/l 1
18 Sulphides (as S2) in mg/l mg/l 2
19 Fluoride mg/l 2
20 Residual free chlorine mg/l21 Iron mg/l 3
22 Sodium mg/l
Date
Kunur NalaDownstream
Between EDH-63 &58
Kunur NalaDownstream Near
Kuldiha BridgeGGS 1 Discharge
04.10.2016 05.10.2016 04.11.20167.89 8.15 8.19
<5 <5 <5
12 8 2
488 288 252
57.2 33.4 1.5
21.5 7.8 5.88
66.6 104 81.6
78.5 38.3 22.5
15.5 13.5 71.2
4.5 <2.5 <2.5
7.8 7.8 17.4
2.8 1.9 6.73
6.3 6 4.21
7.5 4 4.8
35 20 23
<5 <5 <5
<0.001 <0.001 <0.001
<0.5 <0.5 <0.5
0.53 0.75 0.37
<0.1 <0.1 <0.1
3.8 2.1 0.42
128.6 337.1 14.78

Surface water quality analysis of surrounding areas of CBM Raniganj Project by Essar Oil Limited (E P Division)Compliance Period:Oct'16 to Mar'17
ANNEXURE IV a
S.No. Parameter Unit
CPCB Limit forDischarge of
EnvironmentalPollutants
Date23 Total Chromium mg/l 2
24 Zinc mg/l 5
25 Copper mg/l 3
26 Nickel mg/l 3
27 Arsenic mg/l 0.2
28 Lead mg/l 0.1
29 Mercury mg/l 0.01
30 Boron mg/l31 SAR
32 Phosphate mg/l33 Potassium mg/l34 Aluminium mg/l
35 Electrical Conductivity at 25° C µmhos/cm
36 Cadmium mg/l 2
37 Cobalt mg/l38 Vanadium mg/l 0.2
39 Palladium mg/l40 Selenium mg/l 0.05
41 Manganese mg/l 2
42 Molybednum mg/l43 Lithium mg/l44 Berylium mg/l
Kunur NalaDownstream
Between EDH-63 &58
Kunur NalaDownstream Near
Kuldiha BridgeGGS 1 Discharge
04.10.2016 05.10.2016 04.11.2016<0.05 <0.05 <0.05
0.019 0.044 0.036
<0.05 <0.05 <0.05
<0.05 <0.05 <0.05
<0.01 <0.01 <0.01
<0.1 <0.1 <0.1
<0.001 <0.001 <0.001
<1 <1 <1
14.2 15.8 0.76
0.2 0.22 0.39
3.2 6.4 4.3
<0.01 <0.01 <0.01
734 485 431
<0.01 <0.01 <0.01
<0.1 <0.1 <0.1
<0.2 <0.2 <0.2
<0.5 <0.5 <0.5
<0.01 <0.01 <0.01
0.075 0.068 <0.05
<0.5 <0.5 <0.5
<0.5 <0.5 <0.5
<0.5 <0.5 <0.5

Surface water quality analysis of surrounding areas of CBM Raniganj Project by Essar Oil Limited (E P Division)Compliance Period:Oct'16 to Mar'17
ANNEXURE IV a
S.No. Parameter Unit
CPCB Limit forDischarge of
EnvironmentalPollutants
Date45 Cyanide mg/l46 Bicarbonate (as HCO3) mg/l
47 Free Ammonia as Nitrogen mg/l 5
48 Total coliform bacteria MPN/100ml
Kunur NalaDownstream
Between EDH-63 &58
Kunur NalaDownstream Near
Kuldiha BridgeGGS 1 Discharge
04.10.2016 05.10.2016 04.11.2016<0.02 <0.02 <0.02
81.2 126.9 99.5
<0.1 0.1 0.31
69 92 120

Surface water quality analysis of surrounding areas of CBM Raniganj Project by Essar Oil Limited (E P Division)Compliance Period:Oct'16 to Mar'17
ANNEXURE IV a
S.No. Parameter Unit
CPCB Limit forDischarge of
EnvironmentalPollutants
1 pH at 27⁰C 5.5 to 9.0
2 Colour in hazen
3 Total Suspended Solids mg/l 100
4 Total Dissolved Solids mg/l 2100
5 Turbidity NTU6 Acidity as CaCO3 mg/l7 Total Alkalinity as CaCO3 mg/l8 Chloride as Chlorine mg/l9 Total Hardness mg/l
10 Sulphate mg/l11 Calcium mg/l12 Magnesium mg/l13 Dissolved Oxygen mg/l
14 Biochemical Oxygen Demand mg/l 30
15 Chemical Oxygen Demand mg/l 250
16 Oil & Grease mg/l 10
17 Phenolic Compounds (asC6H5OH) mg/l 1
18 Sulphides (as S2) in mg/l mg/l 2
19 Fluoride mg/l 2
20 Residual free chlorine mg/l21 Iron mg/l 3
22 Sodium mg/l
Date
Kunur Nala UpstreamNear GGS-1
Kunur NalaDownstream
Between EDH-58 &63
Kunur Nala DownstreamNear Kuldiha Bridge
04.11.2016 04.11.2016 04.11.20187.85 8.49 8.37
<5 <5 10
4 8 7.5
142 854 384
6.9 32.4 20.2
10.78 Nil Nil
45.7 102.8 215.7
18.7 251.6 60.5
51.4 138.6 91.1
3.5 12.5 8.8
14.2 31.7 23.8
3.84 14.4 7.6
3.45 5.2 3.92
3.6 6.6 3.6
21 32 18
<5 <5 <5
<0.001 <0.001 <0.001
<0.5 <0.5 <0.5
0.21 0.82 0.86
<0.1 <0.1 <0.1
0.31 0.83 0.23
12.3 165.3 36.7
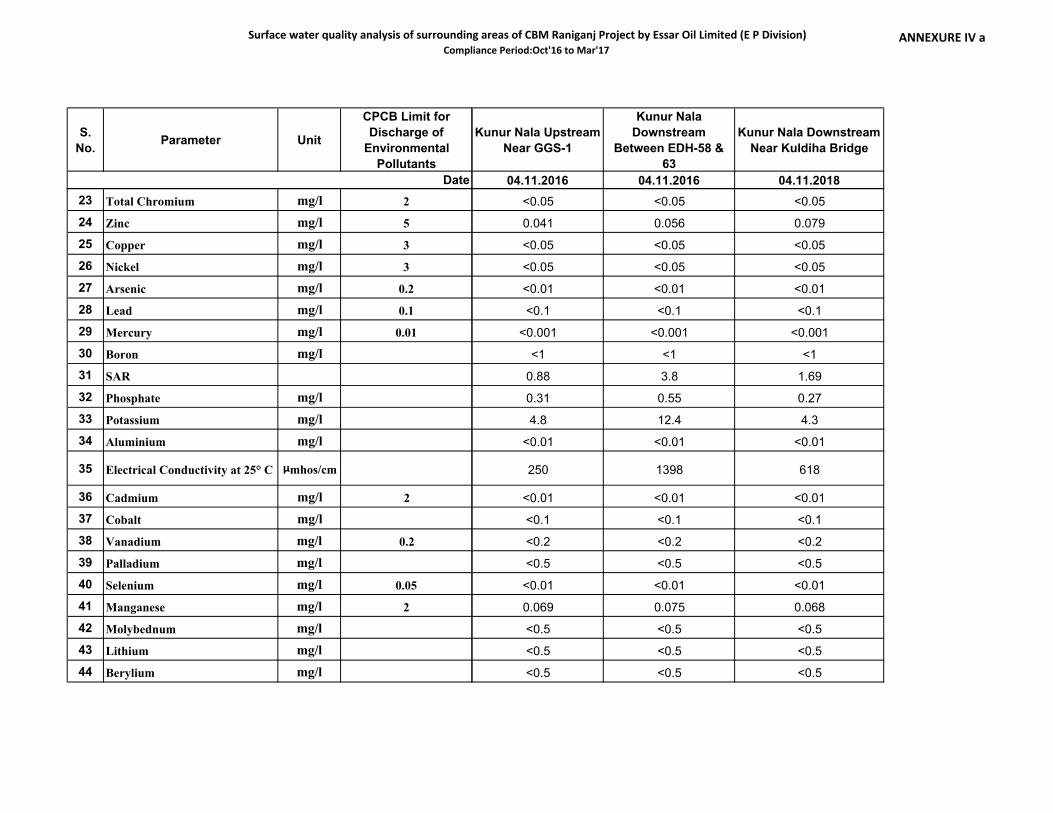
Surface water quality analysis of surrounding areas of CBM Raniganj Project by Essar Oil Limited (E P Division)Compliance Period:Oct'16 to Mar'17
ANNEXURE IV a
S.No. Parameter Unit
CPCB Limit forDischarge of
EnvironmentalPollutants
Date23 Total Chromium mg/l 2
24 Zinc mg/l 5
25 Copper mg/l 3
26 Nickel mg/l 3
27 Arsenic mg/l 0.2
28 Lead mg/l 0.1
29 Mercury mg/l 0.01
30 Boron mg/l31 SAR
32 Phosphate mg/l33 Potassium mg/l34 Aluminium mg/l
35 Electrical Conductivity at 25° C µmhos/cm
36 Cadmium mg/l 2
37 Cobalt mg/l38 Vanadium mg/l 0.2
39 Palladium mg/l40 Selenium mg/l 0.05
41 Manganese mg/l 2
42 Molybednum mg/l43 Lithium mg/l44 Berylium mg/l
Kunur Nala UpstreamNear GGS-1
Kunur NalaDownstream
Between EDH-58 &63
Kunur Nala DownstreamNear Kuldiha Bridge
04.11.2016 04.11.2016 04.11.2018<0.05 <0.05 <0.05
0.041 0.056 0.079
<0.05 <0.05 <0.05
<0.05 <0.05 <0.05
<0.01 <0.01 <0.01
<0.1 <0.1 <0.1
<0.001 <0.001 <0.001
<1 <1 <1
0.88 3.8 1.69
0.31 0.55 0.27
4.8 12.4 4.3
<0.01 <0.01 <0.01
250 1398 618
<0.01 <0.01 <0.01
<0.1 <0.1 <0.1
<0.2 <0.2 <0.2
<0.5 <0.5 <0.5
<0.01 <0.01 <0.01
0.069 0.075 0.068
<0.5 <0.5 <0.5
<0.5 <0.5 <0.5
<0.5 <0.5 <0.5

Surface water quality analysis of surrounding areas of CBM Raniganj Project by Essar Oil Limited (E P Division)Compliance Period:Oct'16 to Mar'17
ANNEXURE IV a
S.No. Parameter Unit
CPCB Limit forDischarge of
EnvironmentalPollutants
Date45 Cyanide mg/l46 Bicarbonate (as HCO3) mg/l
47 Free Ammonia as Nitrogen mg/l 5
48 Total coliform bacteria MPN/100ml
Kunur Nala UpstreamNear GGS-1
Kunur NalaDownstream
Between EDH-58 &63
Kunur Nala DownstreamNear Kuldiha Bridge
04.11.2016 04.11.2016 04.11.2018<0.02 <0.02 <0.02
55.7 125.4 263.1
0.11 0.58 0.46
110 170 120

Surface water quality analysis of surrounding areas of CBM Raniganj Project by Essar Oil Limited (E P Division)Compliance Period:Oct'16 to Mar'17
ANNEXURE IV a
S.No. Parameter Unit
CPCB Limit forDischarge of
EnvironmentalPollutants
1 pH at 27⁰C 5.5 to 9.0
2 Colour in hazen
3 Total Suspended Solids mg/l 100
4 Total Dissolved Solids mg/l 2100
5 Turbidity NTU6 Acidity as CaCO3 mg/l7 Total Alkalinity as CaCO3 mg/l8 Chloride as Chlorine mg/l9 Total Hardness mg/l
10 Sulphate mg/l11 Calcium mg/l12 Magnesium mg/l13 Dissolved Oxygen mg/l
14 Biochemical Oxygen Demand mg/l 30
15 Chemical Oxygen Demand mg/l 250
16 Oil & Grease mg/l 10
17 Phenolic Compounds (asC6H5OH) mg/l 1
18 Sulphides (as S2) in mg/l mg/l 2
19 Fluoride mg/l 2
20 Residual free chlorine mg/l21 Iron mg/l 3
22 Sodium mg/l
Date
GGS-1Discharge
Kunur NalaUpstream Near
GGS-1
EDD-050Dischrage
Kunur NalaDownstream
Between EDH-58 & 63
Kunur NalaDownstreamNear Kuldiha
Bridge02.12.2016 02.12.2016 02.12.2016 02.12.2016 02.12.20167.11 8.06 8.52 8.37 8.26
<5 <5 <5 <5 <5
<2 2 <2 <2 3
498 116 878 1108 368
1.4 6.2 3.3 2.3 6.3
17.6 7.8 Nil Nil 3.9
108.7 77.9 298.5 357 96.3
98 20.8 409.5 468.1 35.6
39.6 43.5 150.4 166.3 31.6
3.8 <2.5 6.6 12.5 8.9
11.1 11.1 42.8 49.2 7.9
2.8 3.8 10.5 10.5 2.8
6.8 6.2 5.9 6.2 6.5
3 <2 2 <2 <2
10 9 11 8 <8
<5 <5 <5 <5 <5
<0.001 <0.001 <0.001 <0.001 <0.001
<0.5 <0.5 <0.5 <0.5 <0.5
0.72 0.32 0.82 1.02 0.73
<0.1 <0.1 <0.1 <0.1 <0.1
0.33 1.06 0.92 0.28 1.14
140 32.6 418.6 538 86

Surface water quality analysis of surrounding areas of CBM Raniganj Project by Essar Oil Limited (E P Division)Compliance Period:Oct'16 to Mar'17
ANNEXURE IV a
S.No. Parameter Unit
CPCB Limit forDischarge of
EnvironmentalPollutants
Date23 Total Chromium mg/l 2
24 Zinc mg/l 5
25 Copper mg/l 3
26 Nickel mg/l 3
27 Arsenic mg/l 0.2
28 Lead mg/l 0.1
29 Mercury mg/l 0.01
30 Boron mg/l31 SAR
32 Phosphate mg/l33 Potassium mg/l34 Aluminium mg/l
35 Electrical Conductivity at 25° C µmhos/cm
36 Cadmium mg/l 2
37 Cobalt mg/l38 Vanadium mg/l 0.2
39 Palladium mg/l40 Selenium mg/l 0.05
41 Manganese mg/l 2
42 Molybednum mg/l43 Lithium mg/l44 Berylium mg/l
GGS-1Discharge
Kunur NalaUpstream Near
GGS-1
EDD-050Dischrage
Kunur NalaDownstream
Between EDH-58 & 63
Kunur NalaDownstreamNear Kuldiha
Bridge02.12.2016 02.12.2016 02.12.2016 02.12.2016 02.12.2016<0.05 <0.05 <0.05 <0.05 <0.05
0.036 0.071 0.048 0.044 0.059
<0.05 <0.05 <0.05 <0.05 <0.05
<0.05 <0.05 <0.05 <0.05 <0.05
<0.01 <0.01 <0.01 <0.01 <0.01
<0.1 <0.1 <0.1 <0.1 <0.1
<0.001 <0.001 <0.001 <0.001 <0.001
<1 <1 <1 <1 <1
9.7 2.1 14.9 18.2 6.6
0.54 0.47 0.38 0.44 0.37
5.1 2.4 6.2 7.3 4.8
<0.01 <0.01 <0.01 <0.01 <0.01
775 208 1462 1972 592
<0.02 <0.02 <0.02 <0.02 <0.02
<0.1 <0.1 <0.1 <0.1 <0.1
<0.2 <0.2 <0.2 <0.2 <0.2
<0.5 <0.5 <0.5 <0.5 <0.5
<0.01 <0.01 <0.01 <0.01 <0.01
<0.05 0.086 <0.05 0.068 0.063
<0.5 <0.5 <0.5 <0.5 <0.5
<0.5 <0.5 <0.5 <0.5 <0.5
<0.5 <0.5 <0.5 <0.5 <0.5

Surface water quality analysis of surrounding areas of CBM Raniganj Project by Essar Oil Limited (E P Division)Compliance Period:Oct'16 to Mar'17
ANNEXURE IV a
S.No. Parameter Unit
CPCB Limit forDischarge of
EnvironmentalPollutants
Date45 Cyanide mg/l46 Bicarbonate (as HCO3) mg/l
47 Free Ammonia as Nitrogen mg/l 5
48 Total coliform bacteria MPN/100ml
GGS-1Discharge
Kunur NalaUpstream Near
GGS-1
EDD-050Dischrage
Kunur NalaDownstream
Between EDH-58 & 63
Kunur NalaDownstreamNear Kuldiha
Bridge02.12.2016 02.12.2016 02.12.2016 02.12.2016 02.12.2016<0.02 <0.02 <0.02 <0.02 <0.02
132.6 95 364.2 435.5 117.5
0.31 0.52 0.61 0.48 0.81
120 220 430 170 110

Surface water quality analysis of surrounding areas of CBM Raniganj Project by Essar Oil Limited (E P Division)Compliance Period:Oct'16 to Mar'17
ANNEXURE IV a
S.No. Parameter Unit
CPCB Limit forDischarge of
EnvironmentalPollutants
1 pH at 27⁰C 5.5 to 9.0
2 Colour in hazen
3 Total Suspended Solids mg/l 100
4 Total Dissolved Solids mg/l 2100
5 Turbidity NTU6 Acidity as CaCO3 mg/l7 Total Alkalinity as CaCO3 mg/l8 Chloride as Chlorine mg/l9 Total Hardness mg/l
10 Sulphate mg/l11 Calcium mg/l12 Magnesium mg/l13 Dissolved Oxygen mg/l
14 Biochemical Oxygen Demand mg/l 30
15 Chemical Oxygen Demand mg/l 250
16 Oil & Grease mg/l 10
17 Phenolic Compounds (asC6H5OH) mg/l 1
18 Sulphides (as S2) in mg/l mg/l 2
19 Fluoride mg/l 2
20 Residual free chlorine mg/l21 Iron mg/l 3
22 Sodium mg/l
Date
Kunur NalaUpstream Near
GGS-1
EDD-050Discharge
Kunur NalaDownstream
Between EDH-58 & 63
GGS 1Discharge
Kunur NalaDownstreamNear Kuldiha
Bridge09.01.2017 09.01.2017 09.01.2017 09.01.2017 09.01.20178.11 8.5 7.72 8.24 7.41
<5 <5 <5 <5 <5
<2 <2 <2 4 2
72 952 1948 734 468
4 2.8 1.1 10.6 5.1
9.8 Nil 10.8 4.9 16.7
8.3 32.1 108.7 52.2 23.4
14.5 540 980.5 310.8 240.5
31.4 121.5 149 121.5 70.6
<2.5 5.9 7.9 6.1 <2.5
9.4 42.4 42.4 31.4 14.1
1.9 3.8 10.5 10.5 8.6
6.9 6.5 6.1 4.9 6.5
<2 <2 <2 3.8 <2
<8 <8 <8 19.3 <8
<5 <5 <5 <5 <5
<0.001 <0.001 <0.001 <0.001 <0.001
<0.5 <0.5 <0.5 <0.5 <0.5
0.82 0.97 1.08 0.56 0.72
<0.1 <0.1 <0.1 <0.1 <0.1
0.56 0.41 0.27 1.88 0.65
18.1 327 724 140 112
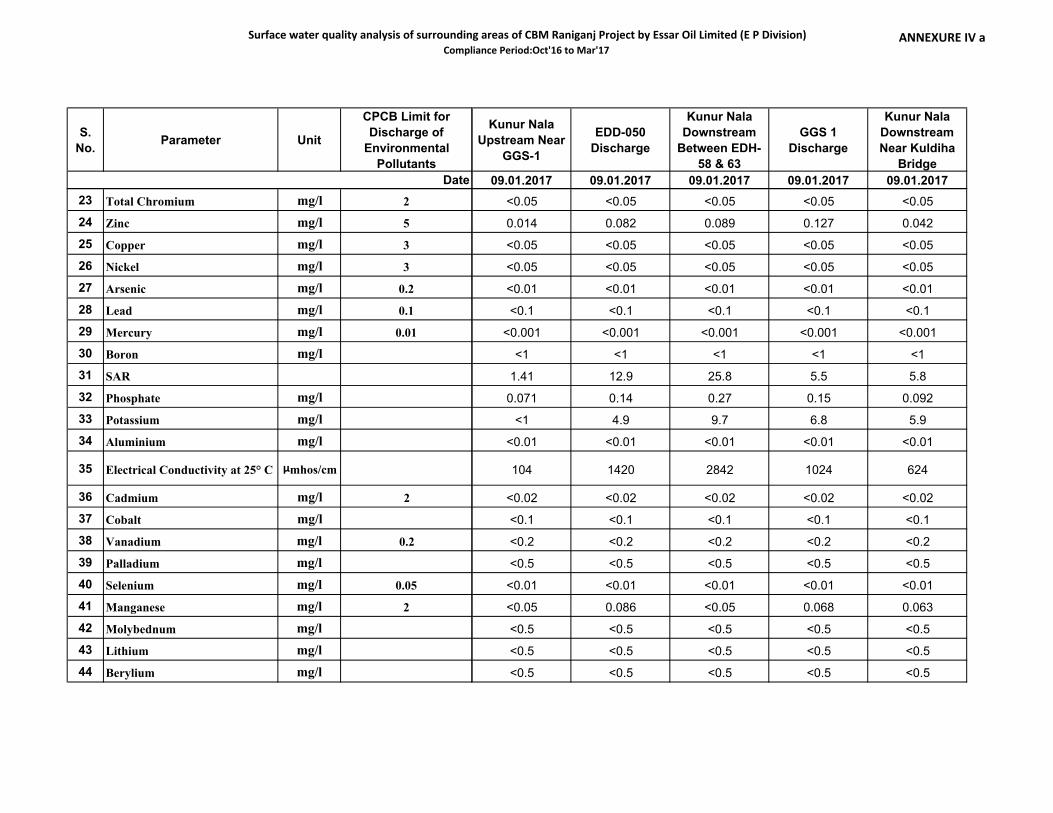
Surface water quality analysis of surrounding areas of CBM Raniganj Project by Essar Oil Limited (E P Division)Compliance Period:Oct'16 to Mar'17
ANNEXURE IV a
S.No. Parameter Unit
CPCB Limit forDischarge of
EnvironmentalPollutants
Date23 Total Chromium mg/l 2
24 Zinc mg/l 5
25 Copper mg/l 3
26 Nickel mg/l 3
27 Arsenic mg/l 0.2
28 Lead mg/l 0.1
29 Mercury mg/l 0.01
30 Boron mg/l31 SAR
32 Phosphate mg/l33 Potassium mg/l34 Aluminium mg/l
35 Electrical Conductivity at 25° C µmhos/cm
36 Cadmium mg/l 2
37 Cobalt mg/l38 Vanadium mg/l 0.2
39 Palladium mg/l40 Selenium mg/l 0.05
41 Manganese mg/l 2
42 Molybednum mg/l43 Lithium mg/l44 Berylium mg/l
Kunur NalaUpstream Near
GGS-1
EDD-050Discharge
Kunur NalaDownstream
Between EDH-58 & 63
GGS 1Discharge
Kunur NalaDownstreamNear Kuldiha
Bridge09.01.2017 09.01.2017 09.01.2017 09.01.2017 09.01.2017<0.05 <0.05 <0.05 <0.05 <0.05
0.014 0.082 0.089 0.127 0.042
<0.05 <0.05 <0.05 <0.05 <0.05
<0.05 <0.05 <0.05 <0.05 <0.05
<0.01 <0.01 <0.01 <0.01 <0.01
<0.1 <0.1 <0.1 <0.1 <0.1
<0.001 <0.001 <0.001 <0.001 <0.001
<1 <1 <1 <1 <1
1.41 12.9 25.8 5.5 5.8
0.071 0.14 0.27 0.15 0.092
<1 4.9 9.7 6.8 5.9
<0.01 <0.01 <0.01 <0.01 <0.01
104 1420 2842 1024 624
<0.02 <0.02 <0.02 <0.02 <0.02
<0.1 <0.1 <0.1 <0.1 <0.1
<0.2 <0.2 <0.2 <0.2 <0.2
<0.5 <0.5 <0.5 <0.5 <0.5
<0.01 <0.01 <0.01 <0.01 <0.01
<0.05 0.086 <0.05 0.068 0.063
<0.5 <0.5 <0.5 <0.5 <0.5
<0.5 <0.5 <0.5 <0.5 <0.5
<0.5 <0.5 <0.5 <0.5 <0.5

Surface water quality analysis of surrounding areas of CBM Raniganj Project by Essar Oil Limited (E P Division)Compliance Period:Oct'16 to Mar'17
ANNEXURE IV a
S.No. Parameter Unit
CPCB Limit forDischarge of
EnvironmentalPollutants
Date45 Cyanide mg/l46 Bicarbonate (as HCO3) mg/l
47 Free Ammonia as Nitrogen mg/l 5
48 Total coliform bacteria MPN/100ml
Kunur NalaUpstream Near
GGS-1
EDD-050Discharge
Kunur NalaDownstream
Between EDH-58 & 63
GGS 1Discharge
Kunur NalaDownstreamNear Kuldiha
Bridge09.01.2017 09.01.2017 09.01.2017 09.01.2017 09.01.2017<0.02 <0.02 <0.02 <0.02 <0.02
10.1 39.2 132.6 63.7 28.5
<0.1 <0.1 0.15 0.11 <0.1
430 220 240 350 430
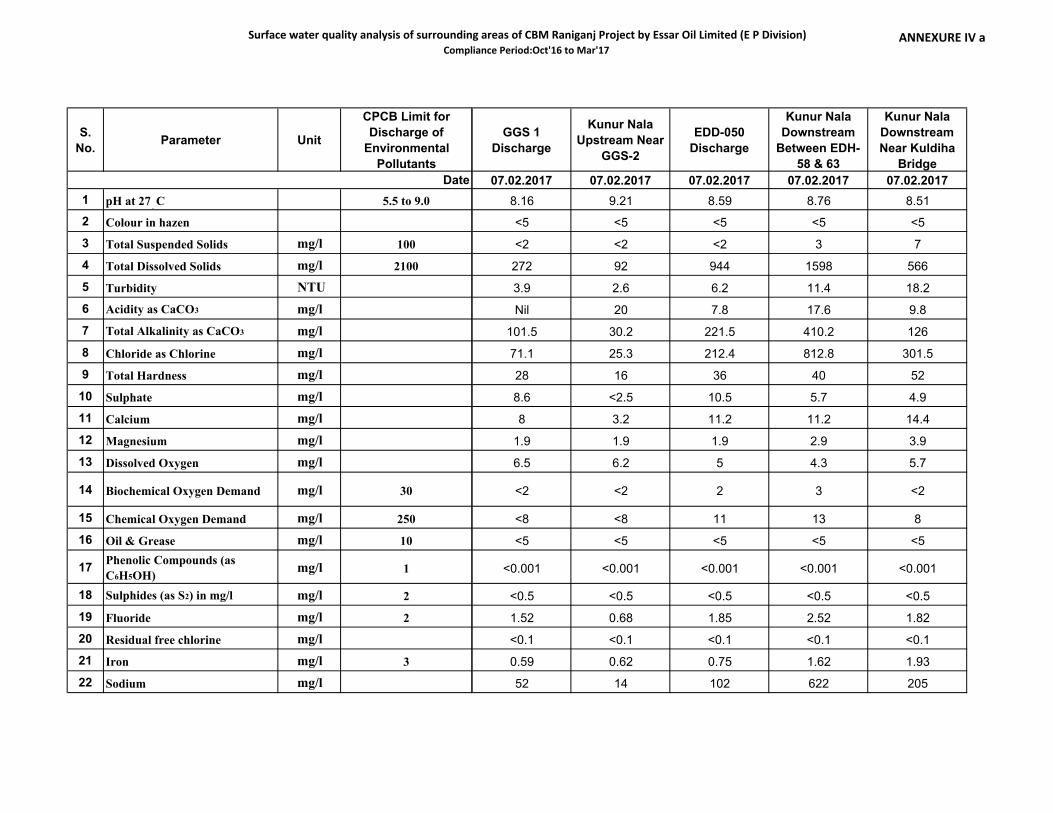
Surface water quality analysis of surrounding areas of CBM Raniganj Project by Essar Oil Limited (E P Division)Compliance Period:Oct'16 to Mar'17
ANNEXURE IV a
S.No. Parameter Unit
CPCB Limit forDischarge of
EnvironmentalPollutants
1 pH at 27⁰C 5.5 to 9.0
2 Colour in hazen
3 Total Suspended Solids mg/l 100
4 Total Dissolved Solids mg/l 2100
5 Turbidity NTU6 Acidity as CaCO3 mg/l7 Total Alkalinity as CaCO3 mg/l8 Chloride as Chlorine mg/l9 Total Hardness mg/l
10 Sulphate mg/l11 Calcium mg/l12 Magnesium mg/l13 Dissolved Oxygen mg/l
14 Biochemical Oxygen Demand mg/l 30
15 Chemical Oxygen Demand mg/l 250
16 Oil & Grease mg/l 10
17 Phenolic Compounds (asC6H5OH) mg/l 1
18 Sulphides (as S2) in mg/l mg/l 2
19 Fluoride mg/l 2
20 Residual free chlorine mg/l21 Iron mg/l 3
22 Sodium mg/l
Date
GGS 1Discharge
Kunur NalaUpstream Near
GGS-2
EDD-050Discharge
Kunur NalaDownstream
Between EDH-58 & 63
Kunur NalaDownstreamNear Kuldiha
Bridge07.02.2017 07.02.2017 07.02.2017 07.02.2017 07.02.20178.16 9.21 8.59 8.76 8.51
<5 <5 <5 <5 <5
<2 <2 <2 3 7
272 92 944 1598 566
3.9 2.6 6.2 11.4 18.2
Nil 20 7.8 17.6 9.8
101.5 30.2 221.5 410.2 126
71.1 25.3 212.4 812.8 301.5
28 16 36 40 52
8.6 <2.5 10.5 5.7 4.9
8 3.2 11.2 11.2 14.4
1.9 1.9 1.9 2.9 3.9
6.5 6.2 5 4.3 5.7
<2 <2 2 3 <2
<8 <8 11 13 8
<5 <5 <5 <5 <5
<0.001 <0.001 <0.001 <0.001 <0.001
<0.5 <0.5 <0.5 <0.5 <0.5
1.52 0.68 1.85 2.52 1.82
<0.1 <0.1 <0.1 <0.1 <0.1
0.59 0.62 0.75 1.62 1.93
52 14 102 622 205

Surface water quality analysis of surrounding areas of CBM Raniganj Project by Essar Oil Limited (E P Division)Compliance Period:Oct'16 to Mar'17
ANNEXURE IV a
S.No. Parameter Unit
CPCB Limit forDischarge of
EnvironmentalPollutants
Date23 Total Chromium mg/l 2
24 Zinc mg/l 5
25 Copper mg/l 3
26 Nickel mg/l 3
27 Arsenic mg/l 0.2
28 Lead mg/l 0.1
29 Mercury mg/l 0.01
30 Boron mg/l31 SAR
32 Phosphate mg/l33 Potassium mg/l34 Aluminium mg/l
35 Electrical Conductivity at 25° C µmhos/cm
36 Cadmium mg/l 2
37 Cobalt mg/l38 Vanadium mg/l 0.2
39 Palladium mg/l40 Selenium mg/l 0.05
41 Manganese mg/l 2
42 Molybednum mg/l43 Lithium mg/l44 Berylium mg/l
GGS 1Discharge
Kunur NalaUpstream Near
GGS-2
EDD-050Discharge
Kunur NalaDownstream
Between EDH-58 & 63
Kunur NalaDownstreamNear Kuldiha
Bridge07.02.2017 07.02.2017 07.02.2017 07.02.2017 07.02.2017<0.05 <0.05 <0.05 <0.05 <0.05
0.059 0.063 0.072 0.047 0.103
<0.05 <0.05 <0.05 <0.05 <0.05
<0.05 <0.05 <0.05 <0.05 <0.05
<0.01 <0.01 <0.01 <0.01 <0.01
<0.1 <0.1 <0.1 <0.1 <0.1
<0.001 <0.001 <0.001 <0.001 <0.001
<1 <1 <1 <1 <1
4.27 1.53 7.38 42.7 12.34
0.52 0.26 0.38 0.28 0.24
3 <1 11.2 14 5.2
<0.01 <0.01 <0.01 <0.01 <0.01
450 142 1427 2397 912
<0.02 <0.02 <0.02 <0.02 <0.02
<0.1 <0.1 <0.1 <0.1 <0.1
<0.2 <0.2 <0.2 <0.2 <0.2
<0.5 <0.5 <0.5 <0.5 <0.5
<0.01 <0.01 <0.01 <0.01 <0.01
<0.05 <0.05 <0.05 0.082 0.042
<0.5 <0.5 <0.5 <0.5 <0.5
<0.5 <0.5 <0.5 <0.5 <0.5
<0.5 <0.5 <0.5 <0.5 <0.5
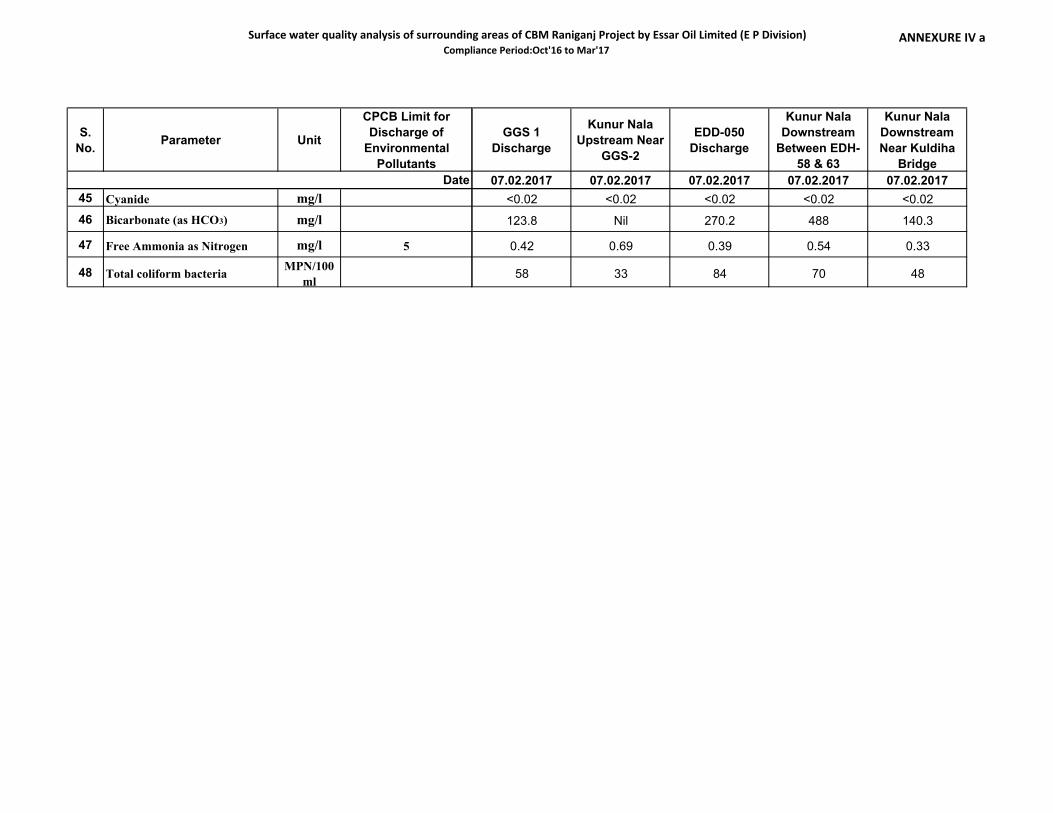
Surface water quality analysis of surrounding areas of CBM Raniganj Project by Essar Oil Limited (E P Division)Compliance Period:Oct'16 to Mar'17
ANNEXURE IV a
S.No. Parameter Unit
CPCB Limit forDischarge of
EnvironmentalPollutants
Date45 Cyanide mg/l46 Bicarbonate (as HCO3) mg/l
47 Free Ammonia as Nitrogen mg/l 5
48 Total coliform bacteria MPN/100ml
GGS 1Discharge
Kunur NalaUpstream Near
GGS-2
EDD-050Discharge
Kunur NalaDownstream
Between EDH-58 & 63
Kunur NalaDownstreamNear Kuldiha
Bridge07.02.2017 07.02.2017 07.02.2017 07.02.2017 07.02.2017<0.02 <0.02 <0.02 <0.02 <0.02
123.8 Nil 270.2 488 140.3
0.42 0.69 0.39 0.54 0.33
58 33 84 70 48

Surface water quality analysis of surrounding areas of CBM Raniganj Project by Essar Oil Limited (E P Division)Compliance Period:Oct'16 to Mar'17
ANNEXURE IV a
S.No. Parameter Unit
CPCB Limit forDischarge of
EnvironmentalPollutants
1 pH at 27⁰C 5.5 to 9.0
2 Colour in hazen
3 Total Suspended Solids mg/l 100
4 Total Dissolved Solids mg/l 2100
5 Turbidity NTU6 Acidity as CaCO3 mg/l7 Total Alkalinity as CaCO3 mg/l8 Chloride as Chlorine mg/l9 Total Hardness mg/l
10 Sulphate mg/l11 Calcium mg/l12 Magnesium mg/l13 Dissolved Oxygen mg/l
14 Biochemical Oxygen Demand mg/l 30
15 Chemical Oxygen Demand mg/l 250
16 Oil & Grease mg/l 10
17 Phenolic Compounds (asC6H5OH) mg/l 1
18 Sulphides (as S2) in mg/l mg/l 2
19 Fluoride mg/l 2
20 Residual free chlorine mg/l21 Iron mg/l 3
22 Sodium mg/l
Date
GGS 1Discharge
EDD-050Discharge
Kunur NalaUpstream Near
GGS-1
Kunur NalaDownstream
Between EDH-58 & 63
Kunur NalaDownstreamNear Kuldiha
Bridge07.03.2017 07.03.2017 07.03.2017 07.03.2017 07.03.20178.88 8.81 9.12 8.65 8.17
5 15 <5 <5 <5
8 11 <2 3 <2
402 1142 92 1984 778
18.8 20.3 2.8 8 4.4
19.6 17.6 21.6 16.8 Nil
320 512 27 826 448
88 276 22 864 226
52 72 20 36 32
<2.5 <2.5 <2.5 4.9 <2.5
14.4 17.6 4.9 8 8
3.9 6.8 1.9 3.9 2.9
4.5 4 6 6.7 6.2
3 4.8 <2 <2 <2
10 16 <8 <8 <8
<5 <5 <5 <5 <5
<0.001 <0.001 <0.001 <0.001 <0.001
<0.5 <0.5 <0.5 <0.5 <0.5
0.54 1.35 1.45 0.62 0.84
<0.1 <0.1 <0.1 <0.1 <0.1
2.52 4.61 1.6 1.11 0.82
57 69 21 912 103
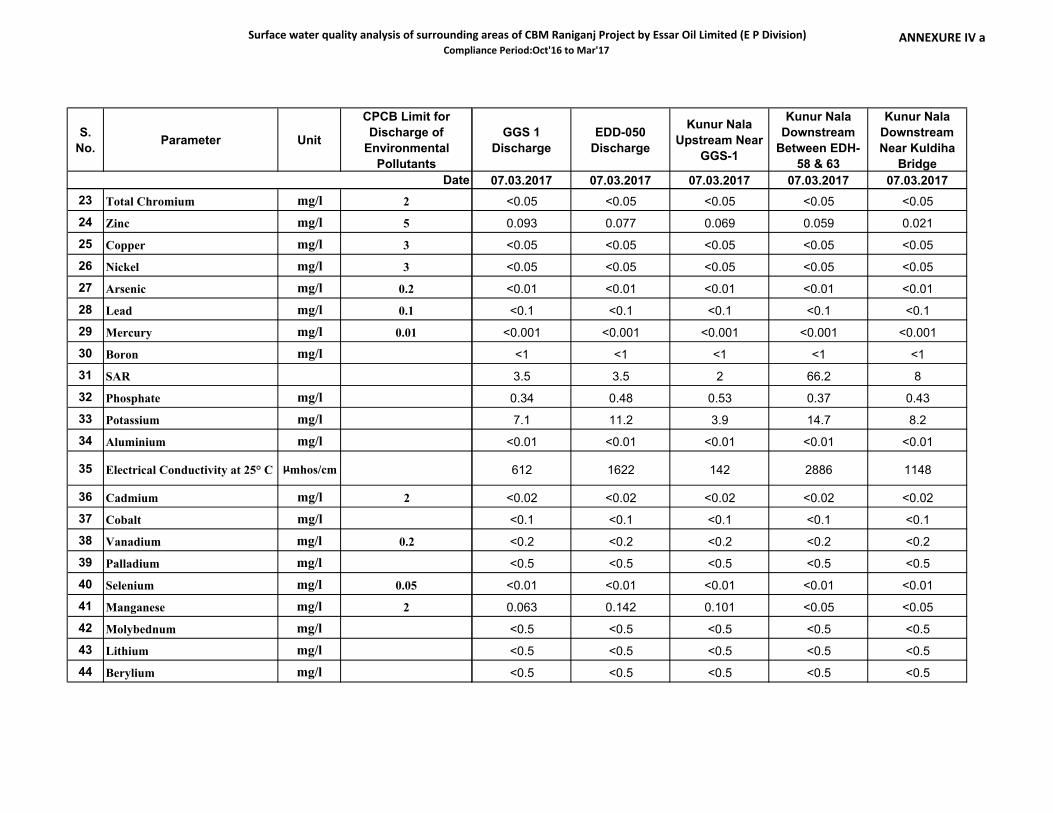
Surface water quality analysis of surrounding areas of CBM Raniganj Project by Essar Oil Limited (E P Division)Compliance Period:Oct'16 to Mar'17
ANNEXURE IV a
S.No. Parameter Unit
CPCB Limit forDischarge of
EnvironmentalPollutants
Date23 Total Chromium mg/l 2
24 Zinc mg/l 5
25 Copper mg/l 3
26 Nickel mg/l 3
27 Arsenic mg/l 0.2
28 Lead mg/l 0.1
29 Mercury mg/l 0.01
30 Boron mg/l31 SAR
32 Phosphate mg/l33 Potassium mg/l34 Aluminium mg/l
35 Electrical Conductivity at 25° C µmhos/cm
36 Cadmium mg/l 2
37 Cobalt mg/l38 Vanadium mg/l 0.2
39 Palladium mg/l40 Selenium mg/l 0.05
41 Manganese mg/l 2
42 Molybednum mg/l43 Lithium mg/l44 Berylium mg/l
GGS 1Discharge
EDD-050Discharge
Kunur NalaUpstream Near
GGS-1
Kunur NalaDownstream
Between EDH-58 & 63
Kunur NalaDownstreamNear Kuldiha
Bridge07.03.2017 07.03.2017 07.03.2017 07.03.2017 07.03.2017<0.05 <0.05 <0.05 <0.05 <0.05
0.093 0.077 0.069 0.059 0.021
<0.05 <0.05 <0.05 <0.05 <0.05
<0.05 <0.05 <0.05 <0.05 <0.05
<0.01 <0.01 <0.01 <0.01 <0.01
<0.1 <0.1 <0.1 <0.1 <0.1
<0.001 <0.001 <0.001 <0.001 <0.001
<1 <1 <1 <1 <1
3.5 3.5 2 66.2 8
0.34 0.48 0.53 0.37 0.43
7.1 11.2 3.9 14.7 8.2
<0.01 <0.01 <0.01 <0.01 <0.01
612 1622 142 2886 1148
<0.02 <0.02 <0.02 <0.02 <0.02
<0.1 <0.1 <0.1 <0.1 <0.1
<0.2 <0.2 <0.2 <0.2 <0.2
<0.5 <0.5 <0.5 <0.5 <0.5
<0.01 <0.01 <0.01 <0.01 <0.01
0.063 0.142 0.101 <0.05 <0.05
<0.5 <0.5 <0.5 <0.5 <0.5
<0.5 <0.5 <0.5 <0.5 <0.5
<0.5 <0.5 <0.5 <0.5 <0.5

Surface water quality analysis of surrounding areas of CBM Raniganj Project by Essar Oil Limited (E P Division)Compliance Period:Oct'16 to Mar'17
ANNEXURE IV a
S.No. Parameter Unit
CPCB Limit forDischarge of
EnvironmentalPollutants
Date45 Cyanide mg/l46 Bicarbonate (as HCO3) mg/l
47 Free Ammonia as Nitrogen mg/l 5
48 Total coliform bacteria MPN/100ml
GGS 1Discharge
EDD-050Discharge
Kunur NalaUpstream Near
GGS-1
Kunur NalaDownstream
Between EDH-58 & 63
Kunur NalaDownstreamNear Kuldiha
Bridge07.03.2017 07.03.2017 07.03.2017 07.03.2017 07.03.2017<0.02 <0.02 <0.02 <0.02 <0.02
345 536 48 838 547
0.061 0.043 0.088 0.044 0.036
58 33 84 70 94
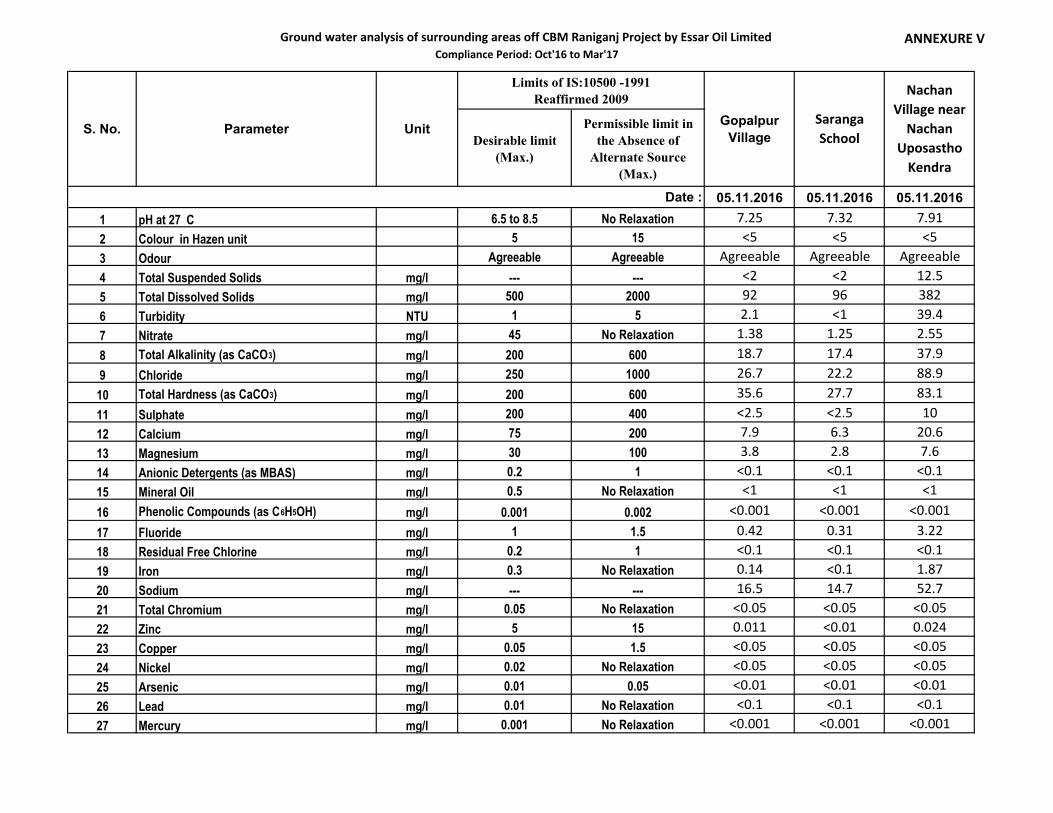
Ground water analysis of surrounding areas off CBM Raniganj Project by Essar Oil LimitedCompliance Period: Oct'16 to Mar'17
ANNEXURE V
Desirable limit(Max.)
Permissible limit inthe Absence of
Alternate Source(Max.)
05.11.2016 05.11.2016 05.11.20161 pH at 27⁰C 6.5 to 8.5 No Relaxation 7.25 7.32 7.912 Colour in Hazen unit 5 15 <5 <5 <53 Odour Agreeable Agreeable Agreeable Agreeable Agreeable4 Total Suspended Solids mg/l --- --- <2 <2 12.55 Total Dissolved Solids mg/l 500 2000 92 96 3826 Turbidity NTU 1 5 2.1 <1 39.47 Nitrate mg/l 45 No Relaxation 1.38 1.25 2.558 Total Alkalinity (as CaCO3) mg/l 200 600 18.7 17.4 37.99 Chloride mg/l 250 1000 26.7 22.2 88.9
10 Total Hardness (as CaCO3) mg/l 200 600 35.6 27.7 83.111 Sulphate mg/l 200 400 <2.5 <2.5 1012 Calcium mg/l 75 200 7.9 6.3 20.613 Magnesium mg/l 30 100 3.8 2.8 7.614 Anionic Detergents (as MBAS) mg/l 0.2 1 <0.1 <0.1 <0.115 Mineral Oil mg/l 0.5 No Relaxation <1 <1 <116 Phenolic Compounds (as C6H5OH) mg/l 0.001 0.002 <0.001 <0.001 <0.00117 Fluoride mg/l 1 1.5 0.42 0.31 3.2218 Residual Free Chlorine mg/l 0.2 1 <0.1 <0.1 <0.119 Iron mg/l 0.3 No Relaxation 0.14 <0.1 1.8720 Sodium mg/l --- --- 16.5 14.7 52.721 Total Chromium mg/l 0.05 No Relaxation <0.05 <0.05 <0.0522 Zinc mg/l 5 15 0.011 <0.01 0.02423 Copper mg/l 0.05 1.5 <0.05 <0.05 <0.0524 Nickel mg/l 0.02 No Relaxation <0.05 <0.05 <0.0525 Arsenic mg/l 0.01 0.05 <0.01 <0.01 <0.0126 Lead mg/l 0.01 No Relaxation <0.1 <0.1 <0.127 Mercury mg/l 0.001 No Relaxation <0.001 <0.001 <0.001
Date :
GopalpurVillage
SarangaSchool
NachanVillage near
NachanUposastho
Kendra
S. No. Parameter Unit
Limits of IS:10500 -1991Reaffirmed 2009

Ground water analysis of surrounding areas off CBM Raniganj Project by Essar Oil LimitedCompliance Period: Oct'16 to Mar'17
ANNEXURE V
Desirable limit(Max.)
Permissible limit inthe Absence of
Alternate Source(Max.)
05.11.2016 05.11.2016 05.11.2016Date :
GopalpurVillage
SarangaSchool
NachanVillage near
NachanUposastho
Kendra
S. No. Parameter Unit
Limits of IS:10500 -1991Reaffirmed 2009
28 Boron mg/l 0.5 1 <1 <1 <129 Phosphorus mg/l --- --- 0.18 0.23 0.4630 Potassium mg/l --- --- 2.2 1.8 3.531 Aluminium mg/l 0.03 0.2 <0.01 <0.01 <0.0132 Manganese mg/l 0.1 0.3 <0.05 <0.05 0.14233 Selenium mg/l 0.01 No Relaxation <0.01 <0.01 <0.0134 Cadmium mg/l 0.003 No Relaxation <0.01 <0.01 <0.0135 Cyanide mg/l 0.05 No Relaxation <0.02 <0.02 <0.0236 Electrical Conductivity at 25° C us/cm --- --- 163 152 60237 Hexavalent Chromium mg/l --- --- <0.01 <0.01 <0.0138 Total Coliform MPN/100ml --- --- 22 36 23

Ground water analysis of surrounding areas off CBM Raniganj Project by Essar Oil LimitedCompliance Period: Oct'16 to Mar'17
ANNEXURE V
Desirable limit(Max.)
Permissible limit inthe Absence of
Alternate Source(Max.)
1 pH at 27⁰C 6.5 to 8.5 No Relaxation2 Colour in Hazen unit 5 153 Odour Agreeable Agreeable4 Total Suspended Solids mg/l --- ---5 Total Dissolved Solids mg/l 500 20006 Turbidity NTU 1 57 Nitrate mg/l 45 No Relaxation8 Total Alkalinity (as CaCO3) mg/l 200 6009 Chloride mg/l 250 1000
10 Total Hardness (as CaCO3) mg/l 200 60011 Sulphate mg/l 200 40012 Calcium mg/l 75 20013 Magnesium mg/l 30 10014 Anionic Detergents (as MBAS) mg/l 0.2 115 Mineral Oil mg/l 0.5 No Relaxation16 Phenolic Compounds (as C6H5OH) mg/l 0.001 0.00217 Fluoride mg/l 1 1.518 Residual Free Chlorine mg/l 0.2 119 Iron mg/l 0.3 No Relaxation20 Sodium mg/l --- ---21 Total Chromium mg/l 0.05 No Relaxation22 Zinc mg/l 5 1523 Copper mg/l 0.05 1.524 Nickel mg/l 0.02 No Relaxation25 Arsenic mg/l 0.01 0.0526 Lead mg/l 0.01 No Relaxation27 Mercury mg/l 0.001 No Relaxation
Date :
S. No. Parameter Unit
Limits of IS:10500 -1991Reaffirmed 2009
05.11.2016 05.11.2016 05.11.20167.87 7.45 7.57<5 <5 <5
Agreeable Agreeable Agreeable2.7 <2 <2382 176 682.6 <1 <10.62 <0.5 <0.562.8 28.5 18.773.6 48.7 19.739.6 27.7 11.912.5 9.8 <2.59.5 4.7 1.53.8 3.8 1.9<0.1 <0.1 <0.1<1 <1 <1<0.001 <0.001 <0.0010.73 0.82 0.33<0.1 <0.1 <0.10.14 <0.1 <0.148.6 31.2 12.9<0.05 <0.05 <0.050.044 <0.01 <0.01<0.05 <0.05 <0.05<0.05 <0.05 <0.05<0.01 <0.01 <0.01<0.1 <0.1 <0.1<0.001 <0.001 <0.001
KalikapurVillage
KhatgoriaVillage (GGS-
1)
KantaberiaVillage

Ground water analysis of surrounding areas off CBM Raniganj Project by Essar Oil LimitedCompliance Period: Oct'16 to Mar'17
ANNEXURE V
Desirable limit(Max.)
Permissible limit inthe Absence of
Alternate Source(Max.)
Date :
S. No. Parameter Unit
Limits of IS:10500 -1991Reaffirmed 2009
28 Boron mg/l 0.5 129 Phosphorus mg/l --- ---30 Potassium mg/l --- ---31 Aluminium mg/l 0.03 0.232 Manganese mg/l 0.1 0.333 Selenium mg/l 0.01 No Relaxation34 Cadmium mg/l 0.003 No Relaxation35 Cyanide mg/l 0.05 No Relaxation36 Electrical Conductivity at 25° C us/cm --- ---37 Hexavalent Chromium mg/l --- ---38 Total Coliform MPN/100ml --- ---
05.11.2016 05.11.2016 05.11.2016
KalikapurVillage
KhatgoriaVillage (GGS-
1)
KantaberiaVillage
<1 <1 <10.23 0.41 0.124.23 1.24 1.12<0.01 <0.01 <0.010.059 <0.05 <0.05<0.01 <0.01 <0.01<0.01 <0.01 <0.01<0.02 <0.02 <0.02658 305 124<0.01 <0.01 <0.0136 51 12

Ground water analysis of surrounding areas off CBM Raniganj Project by Essar Oil LimitedCompliance Period: Oct'16 to Mar'17
ANNEXURE V
Desirable limit(Max.)
Permissible limit inthe Absence of
Alternate Source(Max.)
1 pH at 27⁰C 6.5 to 8.5 No Relaxation2 Colour in Hazen unit 5 153 Odour Agreeable Agreeable4 Total Suspended Solids mg/l --- ---5 Total Dissolved Solids mg/l 500 20006 Turbidity NTU 1 57 Nitrate mg/l 45 No Relaxation8 Total Alkalinity (as CaCO3) mg/l 200 6009 Chloride mg/l 250 1000
10 Total Hardness (as CaCO3) mg/l 200 60011 Sulphate mg/l 200 40012 Calcium mg/l 75 20013 Magnesium mg/l 30 10014 Anionic Detergents (as MBAS) mg/l 0.2 115 Mineral Oil mg/l 0.5 No Relaxation16 Phenolic Compounds (as C6H5OH) mg/l 0.001 0.00217 Fluoride mg/l 1 1.518 Residual Free Chlorine mg/l 0.2 119 Iron mg/l 0.3 No Relaxation20 Sodium mg/l --- ---21 Total Chromium mg/l 0.05 No Relaxation22 Zinc mg/l 5 1523 Copper mg/l 0.05 1.524 Nickel mg/l 0.02 No Relaxation25 Arsenic mg/l 0.01 0.0526 Lead mg/l 0.01 No Relaxation27 Mercury mg/l 0.001 No Relaxation
Date :
S. No. Parameter Unit
Limits of IS:10500 -1991Reaffirmed 2009
05.11.2016 05.11.2016 05.11.20167.26 7.39 6.55<5 <5 <5
Agreeable Agreeable Agreeable9.8 2.5 3.278 66 4240.6 1.8 9.8<0.5 <0.5 <0.518.7 12.6 9.722.5 18.3 9.215.8 7.9 7.94.2 3.5 <2.53.1 1.5 1.51.9 1 1<0.1 <0.1 <0.1<1 <1 <1<0.001 <0.001 <0.0010.39 0.21 0.18<0.1 <0.1 <0.11.78 0.42 0.69.8 7.9 3.2<0.05 <0.05 <0.05<0.01 0.021 0.034<0.05 <0.05 <0.05<0.05 <0.05 <0.05<0.01 <0.01 <0.01<0.1 <0.1 <0.1<0.001 <0.001 <0.001
JatgoriaVillage
DhabaniVillage
LabnaparaVillage

Ground water analysis of surrounding areas off CBM Raniganj Project by Essar Oil LimitedCompliance Period: Oct'16 to Mar'17
ANNEXURE V
Desirable limit(Max.)
Permissible limit inthe Absence of
Alternate Source(Max.)
Date :
S. No. Parameter Unit
Limits of IS:10500 -1991Reaffirmed 2009
28 Boron mg/l 0.5 129 Phosphorus mg/l --- ---30 Potassium mg/l --- ---31 Aluminium mg/l 0.03 0.232 Manganese mg/l 0.1 0.333 Selenium mg/l 0.01 No Relaxation34 Cadmium mg/l 0.003 No Relaxation35 Cyanide mg/l 0.05 No Relaxation36 Electrical Conductivity at 25° C us/cm --- ---37 Hexavalent Chromium mg/l --- ---38 Total Coliform MPN/100ml --- ---
05.11.2016 05.11.2016 05.11.2016
JatgoriaVillage
DhabaniVillage
LabnaparaVillage
<1 <1 <10.18 0.16 0.12.2 1.9 1.2<0.01 <0.01 <0.010.14 <0.05 <0.05<0.01 <0.01 <0.01<0.01 <0.01 <0.01<0.02 <0.02 <0.02136 118 70<0.01 <0.01 <0.0116 12 11

Ground water analysis of surrounding areas off CBM Raniganj Project by Essar Oil LimitedCompliance Period: Oct'16 to Mar'17
ANNEXURE V
Desirable limit(Max.)
Permissible limit inthe Absence of
Alternate Source(Max.)
1 pH at 27⁰C 6.5 to 8.5 No Relaxation2 Colour in Hazen unit 5 153 Odour Agreeable Agreeable4 Total Suspended Solids mg/l --- ---5 Total Dissolved Solids mg/l 500 20006 Turbidity NTU 1 57 Nitrate mg/l 45 No Relaxation8 Total Alkalinity (as CaCO3) mg/l 200 6009 Chloride mg/l 250 1000
10 Total Hardness (as CaCO3) mg/l 200 60011 Sulphate mg/l 200 40012 Calcium mg/l 75 20013 Magnesium mg/l 30 10014 Anionic Detergents (as MBAS) mg/l 0.2 115 Mineral Oil mg/l 0.5 No Relaxation16 Phenolic Compounds (as C6H5OH) mg/l 0.001 0.00217 Fluoride mg/l 1 1.518 Residual Free Chlorine mg/l 0.2 119 Iron mg/l 0.3 No Relaxation20 Sodium mg/l --- ---21 Total Chromium mg/l 0.05 No Relaxation22 Zinc mg/l 5 1523 Copper mg/l 0.05 1.524 Nickel mg/l 0.02 No Relaxation25 Arsenic mg/l 0.01 0.0526 Lead mg/l 0.01 No Relaxation27 Mercury mg/l 0.001 No Relaxation
Date :
S. No. Parameter Unit
Limits of IS:10500 -1991Reaffirmed 2009
05.11.2016 05.11.2016 05.11.20166.87 6.89 6.25<5 <5 <5
Agreeable Agreeable Agreeable2.4 <2 3.588 124 383.7 <1 191.87 1.24 <0.522.7 28.3 9.431.8 37.5 14.211.9 19.8 7.95.8 7.3 <2.53.1 4.7 1.51 1.9 1<0.1 <0.1 <0.1<1 <1 <1<0.001 <0.001 <0.0010.43 0.67 0.31<0.1 <0.1 <0.10.12 <0.1 0.6218.8 20.7 2.4<0.05 <0.05 <0.050.018 0.014 <0.01<0.05 <0.05 <0.05<0.05 <0.05 <0.05<0.01 <0.01 <0.01<0.1 <0.1 <0.1<0.001 <0.001 <0.001
AkandaraVillage
SaraswatiganjVillage
GhatakdangaVillage

Ground water analysis of surrounding areas off CBM Raniganj Project by Essar Oil LimitedCompliance Period: Oct'16 to Mar'17
ANNEXURE V
Desirable limit(Max.)
Permissible limit inthe Absence of
Alternate Source(Max.)
Date :
S. No. Parameter Unit
Limits of IS:10500 -1991Reaffirmed 2009
28 Boron mg/l 0.5 129 Phosphorus mg/l --- ---30 Potassium mg/l --- ---31 Aluminium mg/l 0.03 0.232 Manganese mg/l 0.1 0.333 Selenium mg/l 0.01 No Relaxation34 Cadmium mg/l 0.003 No Relaxation35 Cyanide mg/l 0.05 No Relaxation36 Electrical Conductivity at 25° C us/cm --- ---37 Hexavalent Chromium mg/l --- ---38 Total Coliform MPN/100ml --- ---
05.11.2016 05.11.2016 05.11.2016
AkandaraVillage
SaraswatiganjVillage
GhatakdangaVillage
<1 <1 <10.13 0.19 0.162.4 1.8 <1<0.01 <0.01 <0.01<0.05 <0.05 <0.05<0.01 <0.01 <0.01<0.01 <0.01 <0.01<0.02 <0.02 <0.02151 219 67<0.01 <0.01 <0.0112 23 16
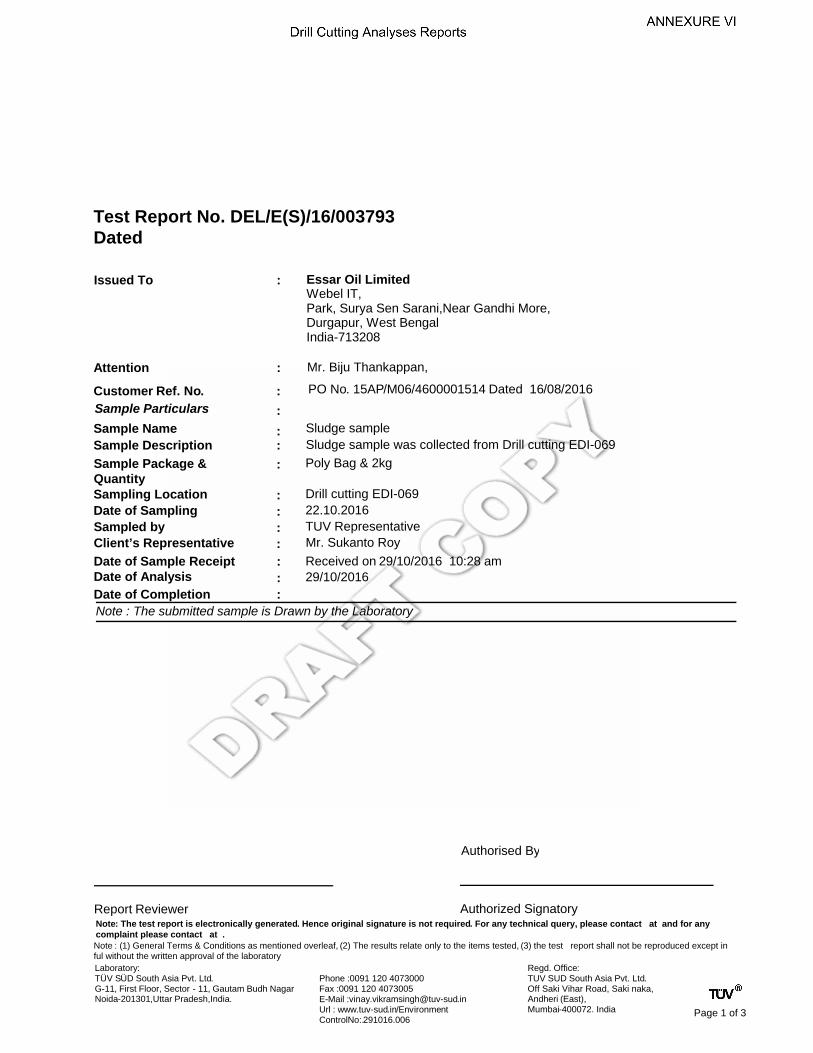
Test Report No. DEL/E(S)/16/003793Dated
Issued To Essar Oil LimitedWebel IT,Park, Surya Sen Sarani,Near Gandhi More,Durgapur, West BengalIndia-713208
:
Attention : Mr. Biju Thankappan,
Customer Ref. No. : PO No. 15AP/M06/4600001514 Dated 16/08/2016
Sample Particulars :
Sample Name : Sludge sample
Sample Description : Sludge sample was collected from Drill cutting EDI-069
Sample Package & Quantity
Poly Bag & 2kg:
Sampling Location Drill cutting EDI-069:Date of Sampling 22.10.2016:Sampled by TUV Representative:Client’s Representative Mr. Sukanto Roy:
Date of Completion :
: 29/10/2016Date of AnalysisReceived on 29/10/2016 10:28 amDate of Sample Receipt :
Note : The submitted sample is Drawn by the Laboratory
Authorized SignatoryReport Reviewer
Authorised By
Note: The test report is electronically generated. Hence original signature is not required. For any technical query, please contact at and for any complaint please contact at .
Note : (1) General Terms & Conditions as mentioned overleaf, (2) The results relate only to the items tested, (3) the test report shall not be reproduced except in ful without the written approval of the laboratory
Regd. Office:TUV SUD South Asia Pvt. Ltd. Off Saki Vihar Road, Saki naka, Andheri (East), Mumbai-400072. India
Phone :0091 120 4073000Fax :0091 120 4073005E-Mail :[email protected] : www.tuv-sud.in/EnvironmentControlNo:.291016.006
Laboratory:TÜV SÜD South Asia Pvt. Ltd.G-11, First Floor, Sector - 11, Gautam Budh NagarNoida-201301,Uttar Pradesh,India.
Page 1 of 3

Test Report No. DEL/E(S)/16/003793Dated
S. NO. TEST METHODTEST RESULTUNITPARAMETERS
USEPA 1664<50.01 Oil & Graese , mg/kg
USEPA–3050B/3051/30522.02 Arsenic [as As], mg/kg
USEPA –3051/3052<2.03 Cadmium [as Cd], mg/kg
USEPA- 7471 A<1.04 Mercury [as Hg], mg/kg
USEPA – 3051/30528.05 Lead [as Pb], mg/kg
USEPA –3050B/3051/3052<1.06 Selenium [as Se], mg/kg
USEPA 3050/3051/3052<2.07 Silver [as Ag], mg/kg
USEPA - 3050B191.08 Barium (as Ba), mg/kg
USEPA – 3051/305245.09 Chromium [as Cr], mg/kg
As per CPCB ManualAbsent10 Reactivity, mg/kg
As per CPCB Manual>65.011 Ignitibility, °C
USEPA 8260<1.012 Benzene, mg/kg
By Langelier Saturation Index Calculator
11.513 Corrosivity , -
USEPA 8260<1.014 Vinyl Chloride, mg/kg
USEPA 8260<1.015 1,1-Dichloroethane, mg/kg
APHA 6232<1.016 Chloroform, mg/kg
USEPA 8260<1.017 1,2-Dichloroethane, mg/kg
USEPA 8260<1.018 Carbon tetrachloride mg/kg
USEPA 8260<1.019 Chlorobenzene, mg/kg
USEPA 8260<1.020 1,4-Dichlorobenzene, mg/kg
USEPA 8260<1.021 Hexachlorobutadiene, mg/kg
USEPA 8260-22 Methanesulfonate methyl, -
USEPA 8270D<1.023 Hexachloroethane, mg/kg
USEPA 8270 D-24 Nitrobenzene, -
USEPA 8270D-25 2,4,6-Trichlorophenol, -
USEPA 8270D-26 2,4,5-Trichlorophenol, -
USEPA 8270D-27 2,4-Dinitrotoluene, -
USEPA 8270D-28 Hexachlorobenzene, -
USEPA 8270D<1.029 Heptachlor, mg/kg
Page 2 of 3

Test Report No. DEL/E(S)/16/003793Dated
S. NO. TEST METHODTEST RESULTUNITPARAMETERS
USEPA 8270D<1.030 Pyrene, mg/kg
USEPA 8270D-31 Endrin, -
USEPA 8270D<1.032 Tetrachloroethene, mg/kg
USEPA 515.1-33 2,4-D, -
USEPA 8270D<1.034 Lindane, mg/kg
8270C-35 o-Cresol -
8270C-36 m-Cresol -
8270C-37 p-Cresol -
8270C-38 Cresol -
USEPA 8270-39 Pentachlorophenol -
8081A-40 Chlordane -
8081A-41 Methoxychlor -
8081A-42 Toxaphene -
8150-43 2,4,5-TP(Silvex) -
USEPA-8270D-44 Methyl ethyl ketone -
USEPA-8270D-45 Pyridine -
USEPA-8270D-46 Phenol Mix(27 compounds) -
()
Authorised By
- END OF TEST REPORT-
Page 3 of 3
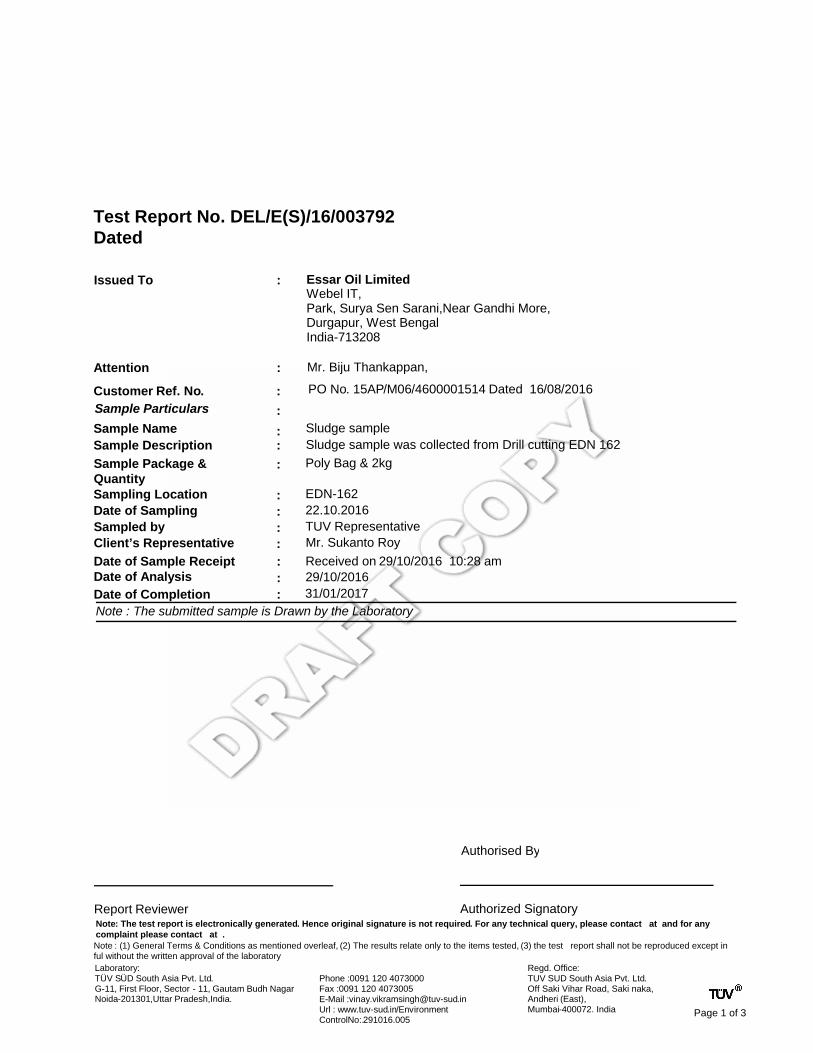
Test Report No. DEL/E(S)/16/003792Dated
Issued To Essar Oil LimitedWebel IT,Park, Surya Sen Sarani,Near Gandhi More,Durgapur, West BengalIndia-713208
:
Attention : Mr. Biju Thankappan,
Customer Ref. No. : PO No. 15AP/M06/4600001514 Dated 16/08/2016
Sample Particulars :
Sample Name : Sludge sample
Sample Description : Sludge sample was collected from Drill cutting EDN 162
Sample Package & Quantity
Poly Bag & 2kg:
Sampling Location EDN-162:Date of Sampling 22.10.2016:Sampled by TUV Representative:Client’s Representative Mr. Sukanto Roy:
Date of Completion : 31/01/2017: 29/10/2016Date of Analysis
Received on 29/10/2016 10:28 amDate of Sample Receipt :
Note : The submitted sample is Drawn by the Laboratory
Authorized SignatoryReport Reviewer
Authorised By
Note: The test report is electronically generated. Hence original signature is not required. For any technical query, please contact at and for any complaint please contact at .
Note : (1) General Terms & Conditions as mentioned overleaf, (2) The results relate only to the items tested, (3) the test report shall not be reproduced except in ful without the written approval of the laboratory
Regd. Office:TUV SUD South Asia Pvt. Ltd. Off Saki Vihar Road, Saki naka, Andheri (East), Mumbai-400072. India
Phone :0091 120 4073000Fax :0091 120 4073005E-Mail :[email protected] : www.tuv-sud.in/EnvironmentControlNo:.291016.005
Laboratory:TÜV SÜD South Asia Pvt. Ltd.G-11, First Floor, Sector - 11, Gautam Budh NagarNoida-201301,Uttar Pradesh,India.
Page 1 of 3

Test Report No. DEL/E(S)/16/003792Dated
S. NO. TEST METHODTEST RESULTUNITPARAMETERS
USEPA 1664<50.01 Oil & Graese , mg/kg
USEPA–3050B/3051/3052<1.02 Arsenic [as As], mg/kg
USEPA –3051/3052<2.03 Cadmium [as Cd], mg/kg
USEPA- 7471 A<1.04 Mercury [as Hg], mg/kg
USEPA – 3051/305211.45 Lead [as Pb], mg/kg
USEPA –3050B/3051/3052<1.06 Selenium [as Se], mg/kg
USEPA 3050/3051/3052<2.07 Silver [as Ag], mg/kg
USEPA - 3050B153.88 Barium (as Ba), mg/kg
USEPA – 3051/305273.39 Chromium [as Cr], mg/kg
As per CPCB ManualAbsent10 Reactivity, mg/kg
As per CPCB Manual>65.011 Ignitibility, °C
USEPA 8260<1.012 Benzene, mg/kg
By Langelier Saturation Index Calculator
9.613 Corrosivity , -
USEPA 8260<1.014 Vinyl Chloride, mg/kg
USEPA 8260<1.015 1,1-Dichloroethane, mg/kg
APHA 6232<1.016 Chloroform, mg/kg
USEPA 8260<1.017 1,2-Dichloroethane, mg/kg
USEPA 8260<1.018 Carbon tetrachloride mg/kg
USEPA 8260<1.019 Chlorobenzene, mg/kg
USEPA 8260<1.020 1,4-Dichlorobenzene, mg/kg
USEPA 8260<1.021 Hexachlorobutadiene, mg/kg
USEPA 8260-22 Methanesulfonate methyl, -
USEPA 8270D<1.023 Hexachloroethane, mg/kg
USEPA 8270 D-24 Nitrobenzene, -
USEPA 8270D-25 2,4,6-Trichlorophenol, -
USEPA 8270D-26 2,4,5-Trichlorophenol, -
USEPA 8270D-27 2,4-Dinitrotoluene, -
USEPA 8270D-28 Hexachlorobenzene, -
USEPA 8270D<1.029 Heptachlor, mg/kg
Page 2 of 3
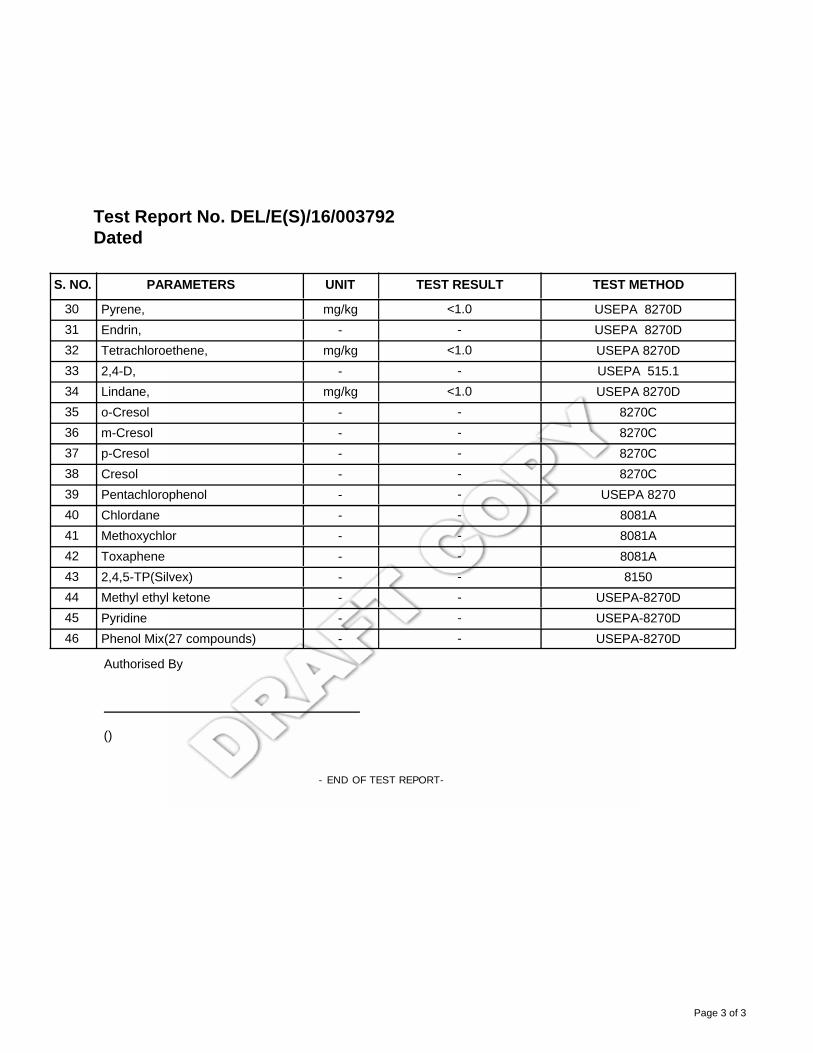
Test Report No. DEL/E(S)/16/003792Dated
S. NO. TEST METHODTEST RESULTUNITPARAMETERS
USEPA 8270D<1.030 Pyrene, mg/kg
USEPA 8270D-31 Endrin, -
USEPA 8270D<1.032 Tetrachloroethene, mg/kg
USEPA 515.1-33 2,4-D, -
USEPA 8270D<1.034 Lindane, mg/kg
8270C-35 o-Cresol -
8270C-36 m-Cresol -
8270C-37 p-Cresol -
8270C-38 Cresol -
USEPA 8270-39 Pentachlorophenol -
8081A-40 Chlordane -
8081A-41 Methoxychlor -
8081A-42 Toxaphene -
8150-43 2,4,5-TP(Silvex) -
USEPA-8270D-44 Methyl ethyl ketone -
USEPA-8270D-45 Pyridine -
USEPA-8270D-46 Phenol Mix(27 compounds) -
()
Authorised By
- END OF TEST REPORT-
Page 3 of 3
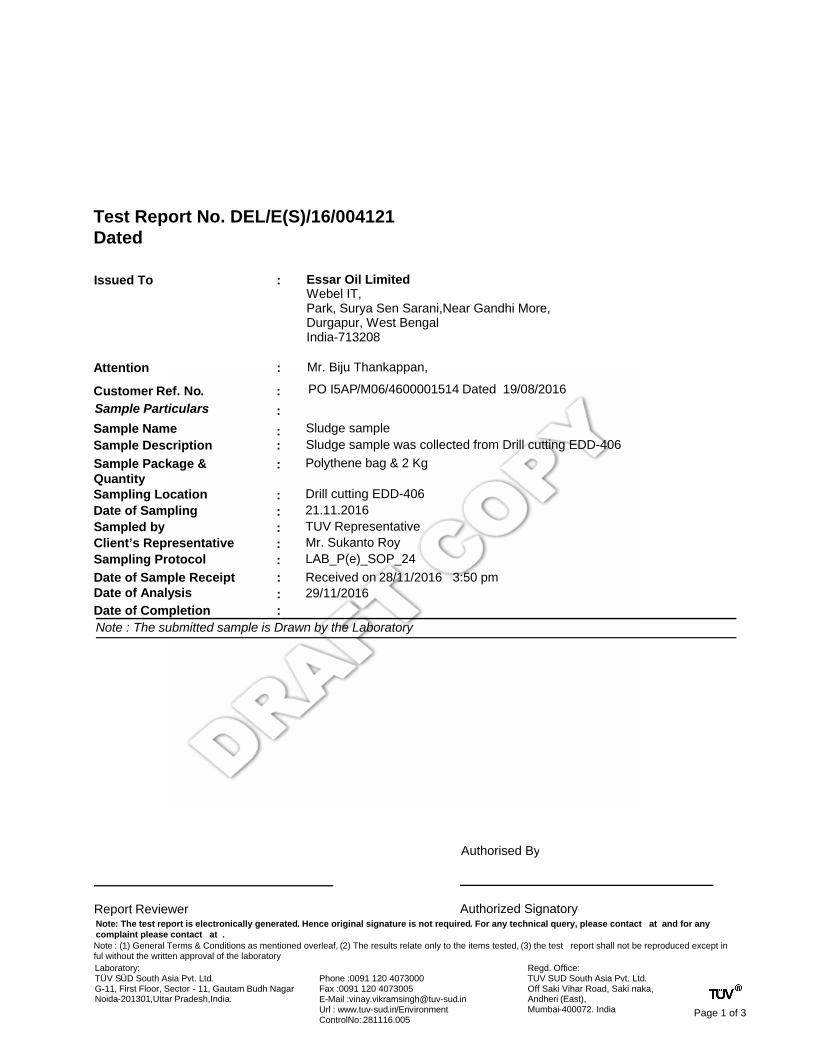
Test Report No. DEL/E(S)/16/004121Dated
Issued To Essar Oil LimitedWebel IT,Park, Surya Sen Sarani,Near Gandhi More,Durgapur, West BengalIndia-713208
:
Attention : Mr. Biju Thankappan,
Customer Ref. No. : PO I5AP/M06/4600001514 Dated 19/08/2016
Sample Particulars :
Sample Name : Sludge sample
Sample Description : Sludge sample was collected from Drill cutting EDD-406
Sample Package & Quantity
Polythene bag & 2 Kg:
Sampling Location Drill cutting EDD-406:Date of Sampling 21.11.2016:Sampled by TUV Representative:Client’s Representative Mr. Sukanto Roy:Sampling Protocol LAB_P(e)_SOP_24:
Date of Completion :
: 29/11/2016Date of AnalysisReceived on 28/11/2016 3:50 pmDate of Sample Receipt :
Note : The submitted sample is Drawn by the Laboratory
Authorized SignatoryReport Reviewer
Authorised By
Note: The test report is electronically generated. Hence original signature is not required. For any technical query, please contact at and for any complaint please contact at .
Note : (1) General Terms & Conditions as mentioned overleaf, (2) The results relate only to the items tested, (3) the test report shall not be reproduced except in ful without the written approval of the laboratory
Regd. Office:TUV SUD South Asia Pvt. Ltd. Off Saki Vihar Road, Saki naka, Andheri (East), Mumbai-400072. India
Phone :0091 120 4073000Fax :0091 120 4073005E-Mail :[email protected] : www.tuv-sud.in/EnvironmentControlNo:.281116.005
Laboratory:TÜV SÜD South Asia Pvt. Ltd.G-11, First Floor, Sector - 11, Gautam Budh NagarNoida-201301,Uttar Pradesh,India.
Page 1 of 3
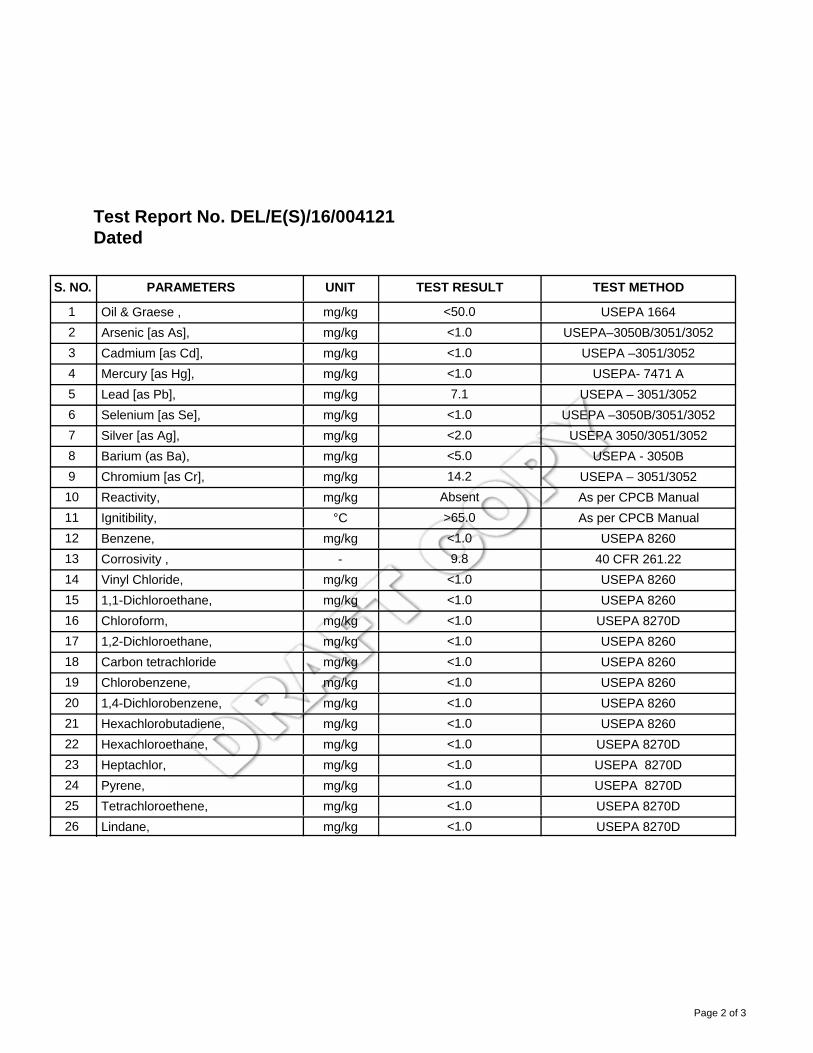
Test Report No. DEL/E(S)/16/004121Dated
S. NO. TEST METHODTEST RESULTUNITPARAMETERS
USEPA 1664<50.01 Oil & Graese , mg/kg
USEPA–3050B/3051/3052<1.02 Arsenic [as As], mg/kg
USEPA –3051/3052<1.03 Cadmium [as Cd], mg/kg
USEPA- 7471 A<1.04 Mercury [as Hg], mg/kg
USEPA – 3051/30527.15 Lead [as Pb], mg/kg
USEPA –3050B/3051/3052<1.06 Selenium [as Se], mg/kg
USEPA 3050/3051/3052<2.07 Silver [as Ag], mg/kg
USEPA - 3050B<5.08 Barium (as Ba), mg/kg
USEPA – 3051/305214.29 Chromium [as Cr], mg/kg
As per CPCB ManualAbsent10 Reactivity, mg/kg
As per CPCB Manual>65.011 Ignitibility, °C
USEPA 8260<1.012 Benzene, mg/kg
40 CFR 261.229.813 Corrosivity , -
USEPA 8260<1.014 Vinyl Chloride, mg/kg
USEPA 8260<1.015 1,1-Dichloroethane, mg/kg
USEPA 8270D<1.016 Chloroform, mg/kg
USEPA 8260<1.017 1,2-Dichloroethane, mg/kg
USEPA 8260<1.018 Carbon tetrachloride mg/kg
USEPA 8260<1.019 Chlorobenzene, mg/kg
USEPA 8260<1.020 1,4-Dichlorobenzene, mg/kg
USEPA 8260<1.021 Hexachlorobutadiene, mg/kg
USEPA 8270D<1.022 Hexachloroethane, mg/kg
USEPA 8270D<1.023 Heptachlor, mg/kg
USEPA 8270D<1.024 Pyrene, mg/kg
USEPA 8270D<1.025 Tetrachloroethene, mg/kg
USEPA 8270D<1.026 Lindane, mg/kg
Page 2 of 3

Test Report No. DEL/E(S)/16/004121Dated
()
Authorised By
- END OF TEST REPORT-
Page 3 of 3

Test Report No. DEL/E(S)/16/004120Dated
Issued To Essar Oil LimitedWebel IT,Park, Surya Sen Sarani,Near Gandhi More,Durgapur, West BengalIndia-713208
:
Attention : Mr. Biju Thankappan,
Customer Ref. No. : PO I5AP/M06/4600001514 Dated 19/08/2016
Sample Particulars :
Sample Name : Sludge sample
Sample Description : Sludge sample was collected from Drill cutting EDD-407
Sample Package & Quantity
Polythene bag & 2 Kg:
Sampling Location Drill cutting EDD-407:Date of Sampling 21.11.2016:Sampled by TUV Representative:Client’s Representative Mr. Sukanto Roy:Sampling Protocol LAB_P(e)_SOP_24:
Date of Completion :
: 29/11/2016Date of AnalysisReceived on 28/11/2016 3:50 pmDate of Sample Receipt :
Note : The submitted sample is Drawn by the Laboratory
Authorized SignatoryReport Reviewer
Authorised By
Note: The test report is electronically generated. Hence original signature is not required. For any technical query, please contact at and for any complaint please contact at .
Note : (1) General Terms & Conditions as mentioned overleaf, (2) The results relate only to the items tested, (3) the test report shall not be reproduced except in ful without the written approval of the laboratory
Regd. Office:TUV SUD South Asia Pvt. Ltd. Off Saki Vihar Road, Saki naka, Andheri (East), Mumbai-400072. India
Phone :0091 120 4073000Fax :0091 120 4073005E-Mail :[email protected] : www.tuv-sud.in/EnvironmentControlNo:.281116.004
Laboratory:TÜV SÜD South Asia Pvt. Ltd.G-11, First Floor, Sector - 11, Gautam Budh NagarNoida-201301,Uttar Pradesh,India.
Page 1 of 3

Test Report No. DEL/E(S)/16/004120Dated
S. NO. TEST METHODTEST RESULTUNITPARAMETERS
USEPA 1664<50.01 Oil & Graese , mg/kg
USEPA–3050B/3051/30526.12 Arsenic [as As], mg/kg
USEPA –3051/3052<1.03 Cadmium [as Cd], mg/kg
USEPA- 7471 A<1.04 Mercury [as Hg], mg/kg
USEPA – 3051/3052135 Lead [as Pb], mg/kg
USEPA –3050B/3051/3052<1.06 Selenium [as Se], mg/kg
USEPA 3050/3051/3052<2.07 Silver [as Ag], mg/kg
USEPA - 3050B115.38 Barium (as Ba), mg/kg
USEPA – 3051/305250.39 Chromium [as Cr], mg/kg
As per CPCB ManualAbsent10 Reactivity, mg/kg
As per CPCB Manual>65.011 Ignitibility, °C
USEPA 8260<1.012 Benzene, mg/kg
40 CFR 261.2211.313 Corrosivity , -
USEPA 8260<1.014 Vinyl Chloride, mg/kg
USEPA 8260<1.015 1,1-Dichloroethane, mg/kg
USEPA 8270D<1.016 Chloroform, mg/kg
USEPA 8260<1.017 1,2-Dichloroethane, mg/kg
USEPA 8260<1.018 Carbon tetrachloride mg/kg
USEPA 8260<1.019 Chlorobenzene, mg/kg
USEPA 8260<1.020 1,4-Dichlorobenzene, mg/kg
USEPA 8260<1.021 Hexachlorobutadiene, mg/kg
USEPA 8270D<1.022 Hexachloroethane, mg/kg
USEPA 8270D<1.023 Heptachlor, mg/kg
USEPA 8270D<1.024 Pyrene, mg/kg
USEPA 8270D<1.025 Tetrachloroethene, mg/kg
USEPA 8270D<1.026 Lindane, mg/kg
Page 2 of 3

Test Report No. DEL/E(S)/16/004120Dated
()
Authorised By
- END OF TEST REPORT-
Page 3 of 3

Test Report No. DEL/E(S)/16/004416Dated
Issued To Essar Oil LimitedWebel IT,Park, Surya Sen Sarani,Near Gandhi More,Durgapur, West BengalIndia-713208
:
Attention : Mr. Biju Thankappan,
Customer Ref. No. : PO No. 15AP/M06/4600001514 Dated 16/08/2016
Sample Particulars :
Sample Name : Sludge sample
Sample Description : Sludge sample was collected from Drill cutting EDD 052
Sample Package & Quantity
Poly bag & 1kg:
Sampling Location EDD 052:Date of Sampling 19.12.2016:Sampled by TUV Representative:
Date of Completion :
: 27/12/2016Date of AnalysisReceived on 27/12/2016 11:37 amDate of Sample Receipt :
Note : The submitted sample is Drawn by the Laboratory
Authorized SignatoryReport Reviewer
Authorised By
Note: The test report is electronically generated. Hence original signature is not required. For any technical query, please contact at and for any complaint please contact at .
Note : (1) General Terms & Conditions as mentioned overleaf, (2) The results relate only to the items tested, (3) the test report shall not be reproduced except in ful without the written approval of the laboratory
Regd. Office:TUV SUD South Asia Pvt. Ltd. Off Saki Vihar Road, Saki naka, Andheri (East), Mumbai-400072. India
Phone :0091 120 4073000Fax :0091 120 4073005E-Mail :[email protected] : www.tuv-sud.in/EnvironmentControlNo:.271216.016
Laboratory:TÜV SÜD South Asia Pvt. Ltd.G-11, First Floor, Sector - 11, Gautam Budh NagarNoida-201301,Uttar Pradesh,India.
Page 1 of 3

Test Report No. DEL/E(S)/16/004416Dated
S. NO. TEST METHODTEST RESULTUNITPARAMETERS
USEPA 1664<50.01 Oil & Graese , mg/kg
USEPA–3050B/3051/30522.72 Arsenic [as As], mg/kg
USEPA –3051/3052<2.03 Cadmium [as Cd], mg/kg
USEPA- 7471 A<1.04 Mercury [as Hg], mg/kg
USEPA – 3051/30525.35 Lead [as Pb], mg/kg
USEPA –3050B/3051/3052<1.06 Selenium [as Se], mg/kg
USEPA 3050/3051/305266.27 Silver [as Ag], mg/kg
USEPA - 3050B48.88 Barium (as Ba), mg/kg
USEPA – 3051/305266.29 Chromium [as Cr], mg/kg
As per CPCB ManualAbsent10 Reactivity, mg/kg
As per CPCB Manual>6511 Ignitibility, °C
USEPA 8260<1.012 Benzene, mg/kg
40 CFR 261.229.813 Corrosivity , -
USEPA 8260<1.014 Vinyl Chloride, mg/kg
USEPA 8260<1.015 1,1-Dichloroethane, mg/kg
APHA 6232<1.016 Chloroform, mg/kg
USEPA 8260<1.017 1,2-Dichloroethane, mg/kg
USEPA 8260<1.018 Carbon tetrachloride mg/kg
USEPA 8260<1.019 Chlorobenzene, mg/kg
USEPA 8260<1.020 1,4-Dichlorobenzene, mg/kg
USEPA 8260<1.021 Hexachlorobutadiene, mg/kg
USEPA 8270D<1.022 Hexachloroethane, mg/kg
USEPA 8270D<1.023 Heptachlor, mg/kg
USEPA 8270D<1.024 Pyrene, mg/kg
USEPA 8270D<1.025 Tetrachloroethene, mg/kg
USEPA 8270D<1.026 Lindane, mg/kg
Page 2 of 3

Test Report No. DEL/E(S)/16/004416Dated
()
Authorised By
- END OF TEST REPORT-
Page 3 of 3
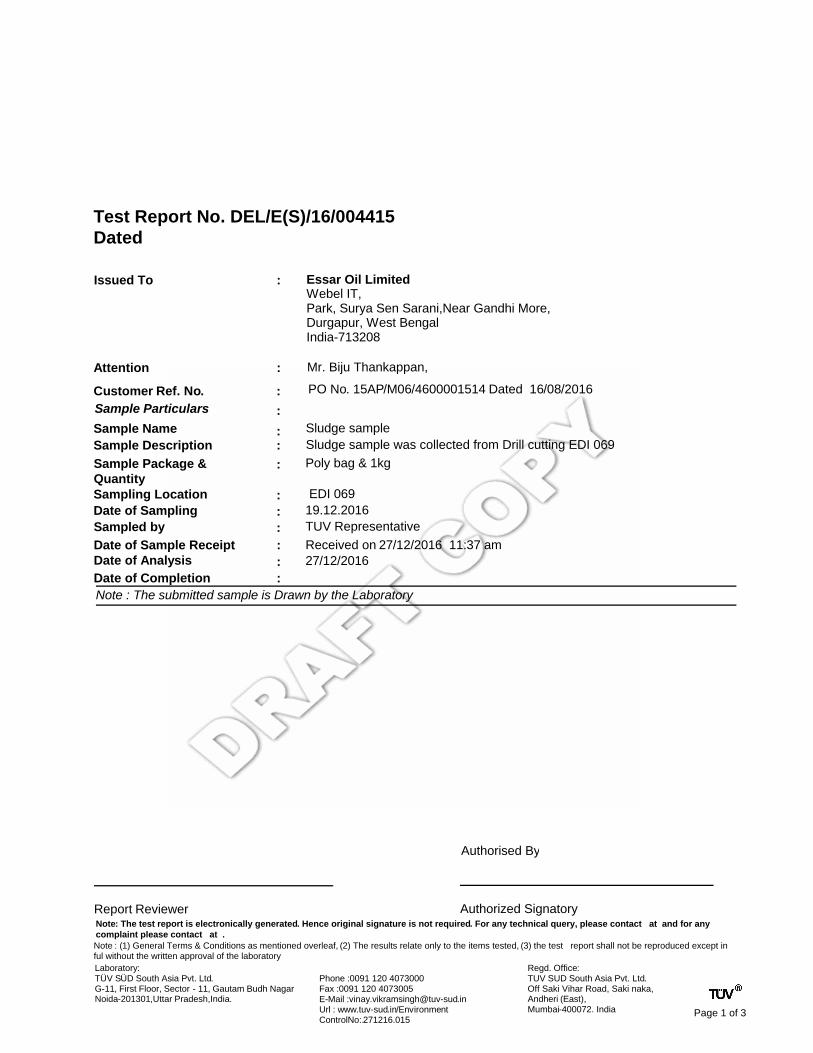
Test Report No. DEL/E(S)/16/004415Dated
Issued To Essar Oil LimitedWebel IT,Park, Surya Sen Sarani,Near Gandhi More,Durgapur, West BengalIndia-713208
:
Attention : Mr. Biju Thankappan,
Customer Ref. No. : PO No. 15AP/M06/4600001514 Dated 16/08/2016
Sample Particulars :
Sample Name : Sludge sample
Sample Description : Sludge sample was collected from Drill cutting EDI 069
Sample Package & Quantity
Poly bag & 1kg:
Sampling Location EDI 069:Date of Sampling 19.12.2016:Sampled by TUV Representative:
Date of Completion :
: 27/12/2016Date of AnalysisReceived on 27/12/2016 11:37 amDate of Sample Receipt :
Note : The submitted sample is Drawn by the Laboratory
Authorized SignatoryReport Reviewer
Authorised By
Note: The test report is electronically generated. Hence original signature is not required. For any technical query, please contact at and for any complaint please contact at .
Note : (1) General Terms & Conditions as mentioned overleaf, (2) The results relate only to the items tested, (3) the test report shall not be reproduced except in ful without the written approval of the laboratory
Regd. Office:TUV SUD South Asia Pvt. Ltd. Off Saki Vihar Road, Saki naka, Andheri (East), Mumbai-400072. India
Phone :0091 120 4073000Fax :0091 120 4073005E-Mail :[email protected] : www.tuv-sud.in/EnvironmentControlNo:.271216.015
Laboratory:TÜV SÜD South Asia Pvt. Ltd.G-11, First Floor, Sector - 11, Gautam Budh NagarNoida-201301,Uttar Pradesh,India.
Page 1 of 3

Test Report No. DEL/E(S)/16/004415Dated
S. NO. TEST METHODTEST RESULTUNITPARAMETERS
USEPA 1664<50.01 Oil & Graese , mg/kg
USEPA–3050B/3051/30521.62 Arsenic [as As], mg/kg
USEPA –3051/3052<2.03 Cadmium [as Cd], mg/kg
USEPA- 7471 A<1.04 Mercury [as Hg], mg/kg
USEPA – 3051/305210.75 Lead [as Pb], mg/kg
USEPA –3050B/3051/3052<1.06 Selenium [as Se], mg/kg
USEPA 3050/3051/30527.17 Silver [as Ag], mg/kg
USEPA - 3050B17.98 Barium (as Ba), mg/kg
USEPA – 3051/305229.69 Chromium [as Cr], mg/kg
As per CPCB ManualAbsent10 Reactivity, mg/kg
As per CPCB Manual>6511 Ignitibility, °C
USEPA 8260<1.012 Benzene, mg/kg
40 CFR 261.229.713 Corrosivity , -
USEPA 8260<1.014 Vinyl Chloride, mg/kg
USEPA 8260<1.015 1,1-Dichloroethane, mg/kg
APHA 6232<1.016 Chloroform, mg/kg
USEPA 8260<1.017 1,2-Dichloroethane, mg/kg
USEPA 8260<1.018 Carbon tetrachloride mg/kg
USEPA 8260<1.019 Chlorobenzene, mg/kg
USEPA 8260<1.020 1,4-Dichlorobenzene, mg/kg
USEPA 8260<1.021 Hexachlorobutadiene, mg/kg
USEPA 8270D<1.022 Hexachloroethane, mg/kg
USEPA 8270D<1.023 Heptachlor, mg/kg
USEPA 8270D<1.024 Pyrene, mg/kg
USEPA 8270D<1.025 Tetrachloroethene, mg/kg
USEPA 8270D<1.026 Lindane, mg/kg
Page 2 of 3
Test Report No. DEL/E(S)/16/004415Dated
()
Authorised By
- END OF TEST REPORT-
Page 3 of 3

Test Report No. DEL/E(S)/17/000532Dated
Issued To Essar Oil LimitedWebel IT,Park, Surya Sen Sarani,Near Gandhi More,Durgapur, West BengalIndia-713208
:
Attention : Mr. Biju Thankappan,
Customer Ref. No. : PO No. 15AP/M06/4600001514 Dated 16/08/2016
Sample Particulars :
Sample Name : Sludge sample
Sample Description : Sludge sample was collected from Drill cutting EDI 429
Sample Package & Quantity
Polythene bag & 2 Kg.:
Sampling Location Drill cutting EDI 429:Date of Sampling 30.01.2017:Sampled by TUV Representative:Client’s Representative Mr. Sukanto Roy:Sampling Protocol LAB_P(e)_SOP_24:
Date of Completion :
: 11/02/2017Date of AnalysisReceived on 10/02/2017 2:58 pmDate of Sample Receipt :
Note : The submitted sample is Drawn by the Laboratory
Authorized SignatoryReport Reviewer
Authorised By
Note: The test report is electronically generated. Hence original signature is not required. For any technical query, please contact at and for any complaint please contact at .
Note : (1) General Terms & Conditions as mentioned overleaf, (2) The results relate only to the items tested, (3) the test report shall not be reproduced except in ful without the written approval of the laboratory
Regd. Office:TUV SUD South Asia Pvt. Ltd. Off Saki Vihar Road, Saki naka, Andheri (East), Mumbai-400072. India
Phone :0091 120 4073000Fax :0091 120 4073005E-Mail :[email protected] : www.tuv-sud.in/EnvironmentControlNo:.100217.003
Laboratory:TÜV SÜD South Asia Pvt. Ltd.G-11, First Floor, Sector - 11, Gautam Budh NagarNoida-201301,Uttar Pradesh,India.
Page 1 of 3

Test Report No. DEL/E(S)/17/000532Dated
S. NO. TEST METHODTEST RESULTUNITPARAMETERS
USEPA 1664<50.01 Oil & Graese , mg/kg
USEPA–3050B/3051/3052<1.02 Arsenic [as As], mg/kg
USEPA –3051/30526.253 Cadmium [as Cd], mg/kg
USEPA- 7471 A7.44 Mercury [as Hg], mg/kg
USEPA – 3051/305213.95 Lead [as Pb], mg/kg
USEPA –3050B/3051/3052<1.06 Selenium [as Se], mg/kg
USEPA 3050/3051/3052<2.07 Silver [as Ag], mg/kg
USEPA - 3050B138.38 Barium (as Ba), mg/kg
USEPA – 3051/3052101.59 Chromium [as Cr], mg/kg
As per CPCB ManualAbsent10 Reactivity, mg/kg
As per CPCB Manual>65.011 Ignitibility, °C
USEPA 8260<1.012 Benzene, mg/kg
40 CFR 261.229.513 Corrosivity , -
USEPA 8260<1.014 Vinyl Chloride, mg/kg
USEPA 8260<1.015 1,1-Dichloroethane, mg/kg
USEPA 8270D<1.016 Chloroform, mg/kg
USEPA 8260<1.017 1,2-Dichloroethane, mg/kg
USEPA 8260<1.018 Carbon tetrachloride mg/kg
USEPA 8260<1.019 1,4-Dichlorobenzene, mg/kg
USEPA 8260<1.020 Hexachlorobutadiene, mg/kg
USEPA 8270D<1.021 Hexachloroethane, mg/kg
USEPA 8270D<1.022 Heptachlor, mg/kg
USEPA 8270D<1.023 Pyrene, mg/kg
USEPA 8270D<1.024 Chlorobenzilate, mg/kg
USEPA 8270D<1.025 Tetrachloroethene, mg/kg
USEPA 8270D<1.026 Lindane, mg/kg
Page 2 of 3

Test Report No. DEL/E(S)/17/000532Dated
()
Authorised By
- END OF TEST REPORT-
Page 3 of 3


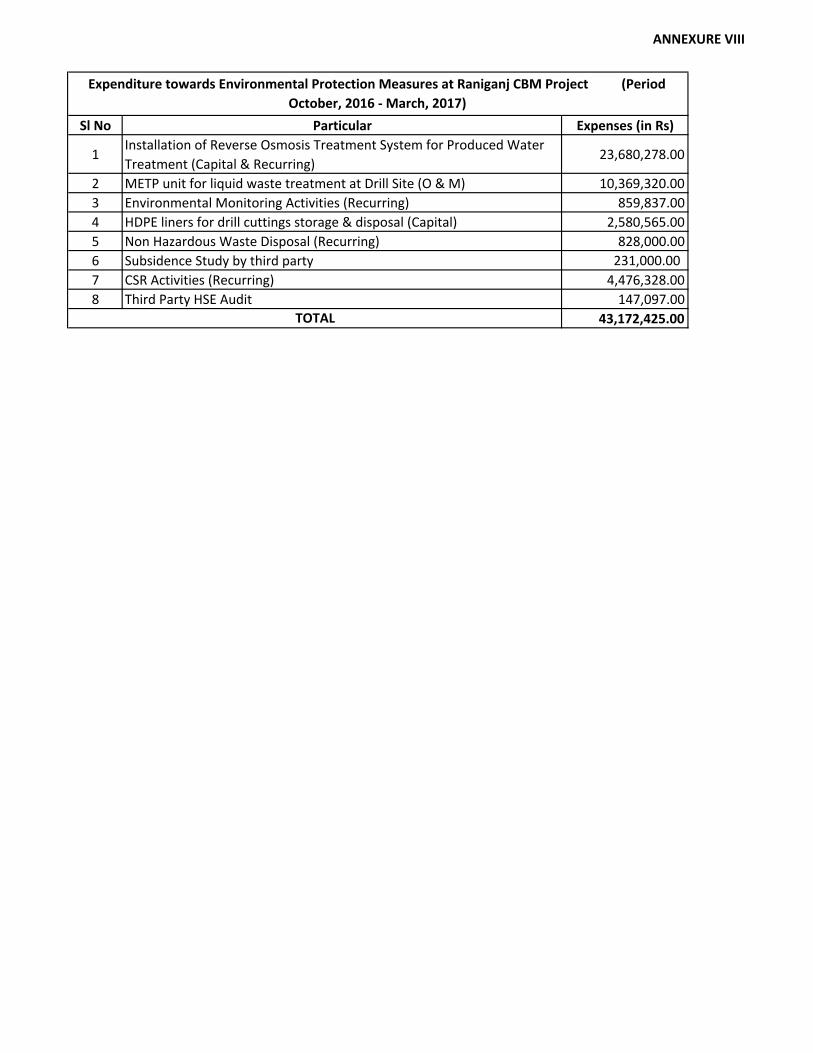
ANNEXURE VIII
Sl No Particular Expenses (in Rs)
1Installation of Reverse Osmosis Treatment System for Produced WaterTreatment (Capital & Recurring)
23,680,278.00
2 METP unit for liquid waste treatment at Drill Site (O & M) 10,369,320.003 Environmental Monitoring Activities (Recurring) 859,837.004 HDPE liners for drill cuttings storage & disposal (Capital) 2,580,565.005 Non Hazardous Waste Disposal (Recurring) 828,000.006 Subsidence Study by third party 231,000.007 CSR Activities (Recurring) 4,476,328.008 Third Party HSE Audit 147,097.00
43,172,425.00
Expenditure towards Environmental Protection Measures at Raniganj CBM Project (PeriodOctober, 2016 - March, 2017)
TOTAL

SCI ENTI FIC RESEARCH LABORATORY(Analytical & Environmental Engineering Laboratory)
Loborotory Recognised By West Bengol Pollution Control BoordAn l5O 14001 :2O04,!SO 900] : 2008 & OHSAS 18001 :2007 Certified
90, Lake East (4th Road) Santoshpur, Jadavpur, Kolkata -7OOO75
DETAILS OF GROUND WATER LEVEL MEASUREMENT
[Format No. SRL/FM/481
Name & Address of the Customer
Sample ldentification No.
lnskument Used
Environmental Condition
Sampling Date
M/s. Essar Oil LtdWebel lT Park, Surya Sen Sarani,Near Gandhi More, Durgapur-713208GWLM-01-2016 to GWLM-07-201 6
PIEZOMETER
Dry
05.1 1 .201 6
REPORT OF GROUND WATER LEVEL MEASUREMENl[Report No. SRL / EOL / GWLM-O1-2016 to GWLM-07-2016 Dated: 10.1 1 .201 6]
Tele Fax : (033) 2416 2267, Tel. : (033) 2416 1311, E-mail : [email protected] : www.scientificlab.org
SLNo.
Location Details Land Mark Latitude Longitude Measurement Result (ln Meters)
ParapetHeight
Diameterof Well
DTW fromParapet
tooDTW bgl
1
GWLM-01-2016 :
Nachon VillageHouse of Arup
Ghatak23"36',42.4',N 87"19',58 g',E 0.68 1 1.77 109
2.GWLM-02-2016:Kalikapur Village
Behind Durga
Mandir23'37.464',N 87'20.1 51',E 08 185 1.47 067
I GW1M.03.2016 :
Dhabani (Bauripara)Bauripara 23'35',51 9',N 87'22.08s',8 0.95 1.8 t.6t 1.87
4GWLM-04-2016 :
Dhabani (Rana)Rana Bari 23'35 31.2',N 87'22'00.q',E 0.7 0.68 1.22 0.52
5.GWLM-05-2016 :
Labnapara
Near High
School23"35',05.36N 87'22',15.g',E 1.2 1.5 313 '{ 01
6.GWLM-06-2016 :
Akandara
Adhibasi
Para(Choto)23'34',461',N 87"23',01 3',E 065 1.85 2,65 2,4
7GW1M.07.2016 :
Saraswatiganj
House of
Sibhu Saha23'35 226',N 87'24'784',E 0.6 1.75 2,33 1.73
-.. -JIt lh:...
For Scientific Research Laboratory' " , I '.
!,' I
SL,."^J* DS-l;,,(Senior Chemist)
1of 1
a
a
a
The test reporl sholl not be reproduced, except in full, without written opprovol of the compony.Results relote only to the poromelers lested.No Repboi Anolysis will be entertoined ofter l5 doys from the dote of sompling.

SCI ENTI FIC RESEARCH LABORATORY(Analytical & Environmental Engineering Laboratory)
Loborotory Recognised By West Bengol Pollution Control BoordAn lSO 1400'l :2O04,|SO 900] : 2008 & OHSAS 18001 :2007 Cerrified
90, Lake East (4th Road) Santoshpur, Jadavpur, Kolkata - 700 075rere Fax: (033) 24162267, rel. : (033) 24161311,
iil.tl,g:[ffi]='J,,"qfli;ffi1::[
DETAILS OF GROUND WATER LEVEL MEASUREMENT
[Format No. SRL/FM/48]
Name & Address of the Customer
Sample ldentification No.
Instrument Used
Environmental Condition
Sampling Date
M/s. Essar Oil LtdWebel lT Park, Surya Sen Sarani,Near Gandhi More, Durgapur-713208GWLM-08-201 6 to GWLM-'14-2016
PIEZOMETER
Dry
05.1 1 .201 6
REPORT OF GROUND WATER LEVEL MEASUREMENT[Repoft No. SRL / EOL / GW1M.08.2016 to GW1M.14.201 6 Dated: 10.1 1.2016]
For Scientific Research Laboratory
9L-n-J* DE,=+ ii..,r,,,",,.'.(Senior Chemist)
1of1
SLNo
Location Details Land Mark Latitude Longitude Measurement Result (ln Meters)
Parapet
HeightDiameterof Well
DTWfromParapet
trtnDTW bgl
1GW1M.08.2016 :
Ghatak DangaNew Atchala 23'34',147',N 87"24 308',E 1 2.4 2.4 1.4
2.GW1M.09.2016 :
Saranga (Kesabpur)House of
Damal Lohar23"31',665',N 87"24'400',E 0 0.6 0.91 0.91
3
GWLM-I0-2016 :
Gopalpur (Chatal
Danoa)Near EDN 178 23"30',639',N 87'23',408',E 05 1E)
I .JJ 1.77 1.27
4.GWLM-I1-2016 :
JatgoriaNear Mosjid 23'36',973',N oaonat nlnilc
OI 'J1JZ
L 0.6 t.o 1.56 0.96
5GWLM-I2-2016 :
KantaberiaNear Mandir 23'36 829',N 87"22',242',E u.t) LJ 1.48 OBB
6.GWLM-13-2016 :
BargoriaNear EDT-O06 23'37',580',N 87"21',397',E 0.7 2.5 2.16 1.46
7.GWLM-142016:Khatgoria
Near Rabindra
Sanga23'37 52.5',N 87'21',08.3',E 0.8 08 t.1 1.3
a
a
a
The tesl report sholl not be reproduced, otcept in full, without written opprovol of the compony.Results relole only to the porometers tesled.No Repbot Anolysis will be entertoined ofrer l5 doys from the dote of sompting.