Embed Size (px)
Citation preview
Essays on information asymmetry,
disclosures and the financing of R&D
– The case of the biotechnology industry –
Hans Jeppsson

Doctoral dissertation in Business Administration, Department of Business Administration,
School of Business, Economics and Law at University of Gothenburg December, 13, 2013.
© Hans Jeppsson, 2013
All rights reserved. No part of this book may be reproduced without the written permission of
the author.
Cover Picture: Don Bishop
ISBN: 978-91-7246-322-6
BAS Publishing
School of Business, Economics and Law
University of Gothenburg
Box 610
405 30 Gothenburg
Sweden
E-mail: [email protected]
Printed by: Ineko AB, Kållered, 2013
i
Abstract
Ph.D. dissertation at University of Gothenburg, Sweden, 2013
Title: Information asymmetry, disclosures and the financing of R&D
Author: Hans Jeppsson
Language: English, with a Swedish summary
Department: Department of Business Administration, The School of Business,
Economics and Law at University of Gothenburg, PO Box 610, S E-405 30 Göteborg
ISBN 978-91-7246-322-6
Investments in research and development (R&D) are an important driver of innovation,
productivity and economic growth. Despite the importance of R&D investments to society, it
is commonly known that R&D activities are difficult to finance in a competitive marketplace.
Corporate investments in intangible assets, such as R&D, create information asymmetry
problems between corporate insiders and outsiders. Several additional factors contribute to
information asymmetry: the relative uniqueness of R&D to the developing firm, the lack of
organized markets for trading R&D assets and the scarcity of R&D information in corporate
reports. As a result, Hall and Lerner (2009) suggest that the marketplace for financing R&D
looks like the “lemons” market (Akerlof, 1970).
This thesis studies asymmetric information in the context of two major corporate events in the
biotechnology industry: corporate financing of R&D and corporate takeovers. The two essays
on corporate financing of R&D examine how biotech firm managers access capital markets to
raise external financing to finance capital-intensive R&D investments and how they choose
between alternative equity flotation methods. The essay on corporate takeovers investigates
the role of asymmetric information in corporate takeovers between acquiring and target firms
and the subsequent performance of R&D.
The results of this thesis indicate that corporate managers issue equity to a larger extent
following the disclosure of R&D information, i.e. when the degree of asymmetric information
is low, and when the stock is temporarily mispriced. Biotech stocks generate positive
abnormal returns in the period prior to the equity issue announcement and negative abnormal
returns in the period thereafter. The results also indicate that the degree of asymmetric
information plays a role in the choice of equity-selling mechanisms. Biotechnology firms

ii
issue equity publicly rather than privately following disclosures of R&D information. Finally,
the empirical results show that R&D projects that are co-developed prior to the acquisition are
no more likely to advance to subsequent stages of development than are R&D projects that are
not preceded by alliances, which raises questions regarding the ability of R&D alliances to
serve as a mechanism to mitigate information asymmetry problems.
Keywords: biotechnology, R&D, information asymmetry, disclosures, value-relevance,
equity market timing, mispricing, adverse selection, monitoring, seasoned equity offerings,
rights offerings, private placements, M&A, alliance

iii
Sammanfattning
Investeringar i forskning och utveckling (FoU) är en viktig drivkraft för innovation,
produktivitet och ekonomisk tillväxt. Trots betydelsen av FoU för samhället är det allmänt
känt att FoU är svårt att finansiera i en konkurrensutsatt marknad. Företagens investeringar i
immateriella tillgångar, såsom FoU, skapar informationsasymmetriproblem mellan
företagsledningen och externa investerare. Flera andra faktorer bidrar också till
informationsasymmetrin: FoU är relativt unikt för det utvecklande företaget, avsaknaden av
en organiserad marknad för handel med FoU-tillgångar och den begränsade information kring
FoU i företagens kvartalsrapporter och årsredovisningar. Som ett resultat av detta menar Hall
och Lerner (2009) att marknaden för finansiering av FoU kan jämföras med Akerlof’s
(1970) ”lemons market”.
Denna avhandling studerar asymmetrisk information i samband med två stora och viktiga
händelser för företag i bioteknikindustrin: finansiering av FoU och företagsförvärv. I
företagens finansiering av FoU studeras hur bioteknikföretag söker extern finansiering via
kapitalmarknaden för att finansiera kapitalintensiva FoU-investeringar och hur de väljer
mellan olika finansieringsmetoder. Studien som berör företagsförvärv undersöker
asymmetrisk information i företagsförvärv mellan köpande företag och målbolag och vilken
effekt det har på FoU i perioden efter förvärvet.
Resultaten från denna avhandling visar att företag tenderar att söka extern finansiering i större
utsträckning efter det att man släppt företagsspecifik FoU information, som i sin tur har
betydande informationsinnehåll och ger investerarna värderelevant information. De söker
även externt kapital vid tillfälliga felprissättningar i företagets aktie: Bioteknikaktier tenderar
att ge en positiv överavkastning i perioden före tillkännagivandet av nyemissionen och
negativ överavkastning under perioden därefter. Resultaten visar också att asymmetrisk
information spelar en viktig roll i valet av emissionsmetod. Bioteknikföretag använder sig av
företrädesemissioner i större utsträckning jämfört med riktade emissioner efter det att man
släppt företagsspecifik information om FoU. Slutligen visar de empiriska resultaten att FoU-
projekt som är utvecklade i en allians före förvärvet inte har större sannolikhet att lyckas
jämfört med FoU-projekt som inte föregås av en allians, vilket väcker frågan om i vilken
utsträckning allianser som mekanism kan överbrygga informationsasymmetrier mellan
köpande företag och målbolag.

iv
Acknowledgments
I am indebted to several people who have contributed with helpful comments and feedback
during the completion of this thesis project. First and foremost, I would like to thank my
supervisor, Professor Ted Lindblom, for invaluable support during the entire research process.
My deepest gratitude goes also to my two co-supervisors, Associate Professor Stefan Sjögren
and Assistant Professor Taylan Mavruk, for constructive comments and highly appreciated
discussions.
Additional acknowledgements go to colleagues at the Industrial and Financial Management &
Logistics group, the Centre for Finance, and the Institute for Innovation and Entrepreneurship
at the University of Gothenburg. I specially thank Professor Martin Holmén for his valuable
comments in my final seminar. I also owe special thanks to Ph.D. Evert Carlsson, Professor
Tamir Agmon and Elias Johannesson for fruitful discussions.
Furthermore, I would like to thank the Department of Economics at UC Berkeley for giving
me the opportunity to visit during the spring of 2011 as a research scholar, and I am thankful
for the financial support from Handelsbanken. Thanks also go to the Foundation Centre for
Finance and the Barbro Osher pro Swecia Foundation for financial support.
I would also like to thank Mattias Häggblom at Danske Markets for his great practical insights
and for sharing his extensive industry experience. Thanks also go to Thomas Bowers for the
many interesting discussions and Christer Beckard for giving me the opportunity to work as a
healthcare equity analyst.
On the personal side, I wish to thank my parents, sisters and my friends for their kindness and
encouragement. My thoughts go also to my grandparents, May-Lis and Erland. Although
many of you are far away, you are always close to my heart.
Last but not least, I would like to thank my love, Sofia, for her patience and support during
this journey, although this is just the beginning of a much longer journey.
Hans Jeppsson
Gothenburg, Sweden, November 2013

Contents
Abstract .................................................................................................................................................... i
Sammanfattning...................................................................................................................................... iii
Acknowledgments .................................................................................................................................. iv
1. Introduction ................................................................................................................................. - 1 -
2. Theoretical framework ................................................................................................................ - 4 -
2.1 Corporate financing of R&D ........................................................................................... - 4 -
2.1.1 R&D investment .......................................................................................................... - 4 -
2.1.2 Information asymmetry and R&D ............................................................................... - 5 -
2.1.2.1 Adverse selection......................................................................................................... - 7 -
2.1.2.2 Moral hazard ................................................................................................................ - 8 -
2.1.3 Corporate disclosures .................................................................................................. - 8 -
2.1.4 Capital structure and R&D .......................................................................................... - 9 -
2.1.5 Seasoned equity offerings and market timing ........................................................... - 13 -
2.1.5.1 The mispricing theory................................................................................................ - 13 -
2.1.5.2 The adverse-selection cost theory ............................................................................. - 14 -
2.2 Corporate takeovers ....................................................................................................... - 14 -
2.2.1 Corporate takeovers and information asymmetry ..................................................... - 15 -
2.2.2 Information intermediaries ........................................................................................ - 15 -
3. The biotechnology industry as a research focus ........................................................................ - 17 -
3.1 Mandatory R&D disclosures ......................................................................................... - 17 -
3.2 Information asymmetry and R&D disclosures .............................................................. - 18 -
3.3 Equity financing ............................................................................................................ - 19 -
3.4 Takeovers and post-acquisition performance ................................................................ - 20 -
4. Research questions .................................................................................................................... - 20 -
5. Data ........................................................................................................................................... - 24 -
6. Conclusions and further research .............................................................................................. - 28 -
6.1 Conclusions of the essays .............................................................................................. - 28 -
6.2 Future research .............................................................................................................. - 30 -
7. The biotechnology industry ....................................................................................................... - 31 -
7.1 Definition of biotechnology .......................................................................................... - 31 -
7.2 Drug development process ............................................................................................ - 32 -
7.3 Evolution of the biotechnology industry ....................................................................... - 36 -
7.4 R&D spending ............................................................................................................... - 40 -
7.5 Sources of R&D funding ............................................................................................... - 41 -

7.6 IPO windows ................................................................................................................. - 44 -
7.7 R&D alliances ............................................................................................................... - 46 -
7.8 Mergers and acquisitions (M&A) .................................................................................. - 48 -
7.9 The biotechnology industry from an industry perspective ............................................ - 49 -
7.10 The biotechnology industry from an investor perspective ............................................ - 51 -
7.11 Industry summary .......................................................................................................... - 56 -
References ......................................................................................................................................... - 57 -
Essay 1 ............................................................................................................................................... - 69 -
Essay 2 ............................................................................................................................................... - 99 -
Essay 3 ............................................................................................................................................. - 143 -
Essay 4 ............................................................................................................................................. - 187 -
- 1 -
1. Introduction
It is commonly known that corporate investments in intangible assets, such as R&D, are
difficult to finance in the marketplace. Schumpeter (1942) argues that R&D investments are
preferably financed with internal cash flows due to agency problems and the costs associated
with the disclosure of strategic information to product market rivals. R&D investments create
an intangible asset, e.g., knowledge of how to cure cancer, but this knowledge is non-rivalrous
in the absence of intellectual property protection, and its use by a competing firm is not
prevented if the scientist leaves the firm or is fired (Hall, 2002). In such cases, firms will be
reluctant to invest in R&D if the returns cannot be extracted by the firm that undertakes the
investment, leading to an underinvestment in R&D in the economy.
Modigliani and Miller (1958) argue that a firm making an investment should be indifferent to
its capital structure, i.e., internal and external financing sources are perfect substitutes, and the
firm managers should invest if the net present value is positive. The seminal work by
Modigliani and Miller (1958) has received much attention over the years and provides a
useful starting point. With respect to R&D investment, several reasons have been proposed
for why there may be a difference between internal and external costs of capital. Hall (2002)
proposes two alternative explanations1: 1) asymmetric information between the inventor and
the investors, and 2) moral hazard due to the separation between ownership and control.
Corporate investments in intangible assets, such as R&D, create information asymmetry
problems, which refers to the fact that inventors (or corporate managers) can continually
observe changes on an individual asset basis, whereas outsiders obtain only highly aggregated
information at discrete points of time when R&D information is disclosed to the public.
Information asymmetry is particularly evident in R&D-intensive industries, such as the high-
technology sector (Himmelberg and Petersen, 1994) and especially the biotechnology industry
(Lerner et al., 2003; Hall, 2002). Information asymmetry can lead to problems associated with
adverse selection and moral hazard, which can have severe effects for financing R&D.
According to the principal-agent theory (Jensen and Meckling, 1976), moral hazard may
occur when corporate managers (agent) invest funds that may benefit them but not the
existing shareholders (principal). Adverse selection can occur in markets with “hidden
information”, where one party is better informed than other parties. A well-known example is
1 Hall (2002) and Auerbach (1984) also argue that tax considerations may play a role in the difference between
internal and external costs of capital, although this is outside the scope of this study.
- 2 -
the market for used cars. According to Akerlof’s (1970) lemon principle, the asymmetrically
distributed information about the quality of the car between buyer and seller can result in a
dramatic situation in which sellers of high-quality cars withdraw from the market and only
low-quality cars become available in the market. The lemon problem is not only apparent in
the market for used cars but exists in several other markets, such as the market for deals
(Nanda and Williamson, 1995), the market for corporate financing (Myers and Majluf) and
financing R&D (Hall and Lerner, 2009), and the market for corporate acquisitions (Hansen,
1987).
In the market for corporate financing, Myers and Majluf (1984) argue that managers of
issuing firms generally have better information than the outside investors buying their
securities. First, they know more about what the raised capital will be used for (e.g., financing
new investments and allocation between different projects). Second, they may also be in a
position to have better access to information about the true value of the company’s assets in
place and its future investment opportunities. Temporary mispricing of the firm’s stock can
impact the security issuance decisions in the following way: if the firm managers (acting in
the interest of existing shareholders) believe the firm is undervalued, and if the total cost of
issuing exceeds the value of the project, they will forego the investment opportunity and not
issue stock, a scenario Myers and Majluf (1984) call the “underinvestment problem”.
Consequently, those seasoned equity offerings that are offered to the market tend to be
overpriced, hence the term “adverse selection”.
In the market for corporate acquisitions (Hansen, 1987), it has been argued that information
asymmetry problems can be mitigated by the role of information-producing intermediaries
that may help evaluate and signal to markets the quality of firms (e.g., Leland and Pyle, 1977).
Nanda and Williamson (1995) argue that an alliance provides an opportunity for the acquiring
firm to learn more about the quality of the asset and improve their informational disadvantage.
This suggests that pre-acquisition information-gathering activities, such as alliances, may lead
to more successful post-acquisition integration.
This thesis studies asymmetric information in the context of corporate financing of R&D and
corporate takeovers, two major corporate events in the biotechnology industry. The
biotechnology industry has made significant contributions to medicine and society. In 1982,
the first biotechnology derived drug, recombinant insulin, was approved (Berg et al., 2002).
Since then, more than 100 drugs have been launched that have improved the quality of life of
- 3 -
millions of people (Walsh, 2006). These approved drugs provide treatment for indications
ranging from common diseases such as cancer and arthritis to rare genetic disorders. The
biotechnology industry is one of the most innovative and important economic drivers in the
United States. In 2012, biotechnology companies collectively reported more than $103 billion
in revenues, spent more than $25 billion on R&D and brought in profits of more than $7.7
billion (Huggett, 2013). Between 2001 and 2006, the annual growth rate averaged 20 percent
in the biotechnology industry, significantly exceeding the annual growth rate of only 6-8
percent for US pharmaceutical firms (Aggarwal, 2007).
The core business of most biotechnology firms is to engage in the research and development
of therapeutic drugs. The drug development process consists of different stages that are linked
to each other. These different stages are broadly classified as discovery, pre-clinical, clinical
phase I, clinical phase II, clinical phase III, and regulatory review. In pre-clinical trials, the
discovered drug is tested in animals before moving into clinical stages with an increasing
number of human patients at each stage. The movement from one stage to the next must be
built on the success of the previous stage. A key feature of the drug development process is
that it is closely monitored by regulatory authorities, such as the US Food and Drug
Administration (FDA), that assess and approve the transition from one stage to the next
(McConomy and Xu, 2004). In addition, drug development is a very long, risky and
expensive process. It is estimated to take 10 to 15 years from initial concept to product launch
(Miller, 2002). Only approximately ten percent of compounds that enter clinical testing reach
the market (e.g., Robbins-Roth (2001). The average cost per launched product has been
estimated to be $1,318 million (DiMasi and Grabowski, 2007).
The purpose of this thesis is to address two issues. From the viewpoint of corporate managers,
it examines when and how these managers seek external financing to finance investments in
R&D. From the viewpoint of acquiring firm managers, it investigates whether an a prior R&D
alliance with the target firm alleviates information asymmetry problems and leads to a more
successful post-acquisition performance.
- 4 -
2. Theoretical framework
This chapter describes the theoretical framework of the essays. Section 2.1 presents the
corporate financing of R&D, and Section 2.2 introduces corporate takeovers.
2.1 Corporate financing of R&D
The corporate financing of R&D is divided into the following sections. Section 2.1.1 provides
an example of the challenges and underlying assumptions for an entrepreneurial firm that
considers investing in a R&D project that cannot be financed with internal funds. Section
2.1.2 introduces problems that can arise in the presence of information asymmetry. Sections
2.1.2.1 and 2.1.2.2 detail two types of market imperfections due to information asymmetries:
adverse selection and moral hazard. Section 2.1.3 describes R&D disclosures as a mechanism
to mitigate information asymmetry problems. Section 2.1.4 presents a brief overview of
capital structure and R&D, and Section 2.1.5 describes two equity-market timing theories.
2.1.1 R&D investment
Consider an entrepreneurial firm without financial slack and no assets in place that has an
opportunity to invest in a risky R&D project. Let us assume that the firm’s scientists have
identified a key mechanism responsible for the growth of cancer tumors and have been able to
develop inhibitors blocking this mechanism. Although the drug has only been tested in animal
models, the results are intriguing: blocking the energy supply to the tumor not only resulted in
shrinkage of the tumor but also eliminated the tumor. Finding a cure to cancer would offer a
significant market opportunity. The cancer market is expected to grow to more than $40
billion. Currently approved drugs only marginally extend the life of cancer patients but offer
no cure. Although the R&D project is risky, as the molecular target is non-validated, the
calculated net present value of the project is positive. The only problem is that carrying out
the project requires a significant amount of funding, which is estimated to be $500 million.
Due to the lack of internal funds and no collateral, the firm has to raise external financing in
the capital market, i.e., issue shares, to finance the investment. Due to the competitiveness in
the cancer market, the investment opportunity is short-lived, i.e., it evaporates if it is not
undertaken.
Managers are assumed to act in the interest of existing shareholders and will only raise equity
financing if the net issue benefit is non-negative, i.e., when the net present value of the R&D
project exceeds or is equal to the sum of the direct flotation costs of the issue and the expected
- 5 -
wealth transfer from existing to new investors. That is, when b – [d + w(k)] ≥ 0, where b is the
value of the project, d is the direct flotation cost, and w(k) is the expected wealth transfer from
old to new investors. The entrepreneurial firm has been listed on the stock exchange for a year,
but the stock has declined significantly following the failure of a prior project based on a
completely different mechanism. Investors have started to question the technology of the firm
and its ability to generate promising drugs. In addition, due to the financial crisis, the
investment sentiment and appetite for high risk stocks is generally low, which has driven the
share price even farther down. Some of the existing large investors, unaware of the current
R&D project, have indicated that they do not intend to participate in the equity issue. The
managers of the firm believe the firm is substantially undervalued, especially given the
current potential of the cancer R&D project. In this case, the total cost of issuing exceeds the
value of the project, i.e., the dilution costs of issuing undervalued equity for existing
stockholders are too high relative to the profitability of the R&D project. Therefore, the
managers of the firm will forego the investment opportunity, which Myers and Majluf (1984)
refer to as the underinvestment problem.2 Although the risky R&D project was at an early
stage and many years away from reaching the market by foregoing the investment opportunity
would simply mean abandon a potentially life-saving discovery for millions of cancer patients.
2.1.2 Information asymmetry and R&D
Corporate investments generally create information asymmetry problems3, which refers to the
fact that corporate managers can continually observe changes in investment productivity for
individual assets, whereas outsiders only have access to highly aggregated information at
certain points of time when information is made public. Corporate R&D investments have
several characteristics that make them different from ordinary investments. First, fifty percent
or more of the amount of the R&D investment is human capital, i.e., the salaries of highly
educated research scientists (Hall, 2002). In turn, they create an intangible asset, the firm’s
knowledge base, from which future profits will be derived. Therefore, the human capital (the
2 In the single flotation method, as suggested by Myers and Majluf (1984), existing investors are passive and the
issuing method is a direct equity sale to the public, i.e., existing shareholders do not participate in the equity
issue. 3 In well-functioning markets with perfect information, the information between sellers and prospective buyers is
unbiased and symmetrical. Under such circumstances, rational buyers will choose the best products, and the
market will reward sellers of the best products with higher sales. By relaxing the assumption of perfect
information and well-functioning markets, the information between the two parties becomes asymmetrically
distributed, i.e., one party now has more (or superior) information than another, which gives rise to information
asymmetry problems.
- 6 -
resource base) of the firm will be equal to zero if the scientists leave the firm or are fired.
Second, an important feature of R&D is the uncertainty associated with its output. In the drug
development setting, for example, only approximately 10 percent of clinical candidates reach
the market. Third, R&D investments are associated with long development times: it takes an
average of 10-15 years to develop a new drug.
Asymmetric information problems vary across industry sectors. Himmelberg and Petersen
(1994) argue that problems associated with information asymmetry are particularly evident in
R&D-intensive industries, such as the high-technology sector and especially the
biotechnology industry (Lerner et al., 2003; Hall, 2002). Several factors contribute to the
information asymmetry in the biotechnology industry. First, managers in R&D-intensive
industries generally know considerably more than outsiders do about the specification of
products under development, the likelihood of success, the results of product feasibility tests,
and marketing prospects (Aboody and Lev, 2000). Second, the extent of information
asymmetry associated with R&D investments is larger than that associated with tangible and
financial investments due to the relative uniqueness of R&D (Aboody and Lev, 2000; Titman
and Wessels, 1988). R&D projects, such as the development of a new drug, are often unique
to the developing firm. For example, a failure of a drug with a new mechanism of action to
exhibit efficacy in humans is a unique event not shared by other biotechnology or
pharmaceutical companies. Hence, investors generally derive little or no information about
the firm’s R&D projects by observing the R&D performance of other drugs. Third, while
financial assets are traded in organized markets, where prices are observable and convey
direct information about values, there are no organized markets for R&D where prices are
available. Fourth, while financial assets are generally marked-to-market and reported on a
quarterly basis, current accounting practice requires firms to immediately expense their
significant value-enhancing investments in R&D, and therefore, it is generally not required
that information be provided about the value of R&D.4 Fifth, firms are reluctant to disclose
firm-specific proprietary information about the firms’ R&D activities for competitive reasons.
4 In an international setting, the IASC implemented a standard for Intangible Assets (IAS 38) in 2001. According
to IAS 38 (IFRS), research costs should be expensed when they incur, while development costs can be
capitalized if certain criteria are met. One such criterion is that future economic benefits are highly probable.
Even in the later stages of the clinical development process, the likelihood of success is relatively small. For
example, in clinical phase III, the probability of reaching the market averages 67 percent. Consequently, most
development stage biotechnology companies immediately expense the R&D investments when they occur.
- 7 -
In the corporate financing of R&D, several challenges arise for the asymmetrically informed
agents, e.g., the corporate managers. The agents are motivated to communicate the privately
owned information about the R&D project to a subset of uninformed agents (investors) but
can only do so through channels or signals that benefit competing agents (Bhattacharya and
Ritter, 1983). An alternative would be to communicate privately to existing investors only,
who would subsequently buy and hold the entire issue. This alternative would be equivalent to
having access to internal corporate funds, but this would be both difficult and illegal.
Consequently, the disclosure of R&D information is of direct usefulness to competitors and,
therefore, associated with a substantial cost because it serves to reduce the quality of the
signal they can make about a potential project (Anton and Yao, 1998). The asymmetrically
informed agent, therefore, faces a trade-off between reducing the value of its informational
advantage and raising financing at better terms that reflect its innovation prospects, thus
lowering the dilution suffered by its existing shareholders owning the R&D project
(Bhattacharya and Ritter, 1983).5 Spence (1974) proposes a signaling equilibrium model
arising from the trade-off between increased valuation in the capital market and the lower
probability of being the first to innovate. In the corporate financing of R&D, the
asymmetrically distributed information between corporate insiders and outsiders can lead to
problems associated with adverse selection and moral hazard.
2.1.2.1 Adverse selection
In his seminal paper, Akerlof (1970) used the market for used cars as an example of the
problem when asymmetric information about quality can lead to a situation where only poor
quality products (“lemons”) become available in the market. Assuming that there are good
cars and bad cars (lemons) in the market, prospective buyers have difficulty distinguishing
between the good cars and the bad cars. Sellers know the quality of their cars but cannot
convey this information credibly to buyers. To hedge for risks of buying a defective car,
buyers discount the price they are willing to pay based on the expected probability that they
will get a bad car. Sellers of good cars are unwilling to sell at a discounted price and withdraw
from the market. As a result, only “lemons” will be for sale in the used car market. Hall and
Lerner (2009) argue that a similar lemon problem exists in the market for financing R&D.
Prospective buyers (e.g., outside investors) have difficulty distinguishing high-quality projects
(or firms) from low-quality projects (“lemons”). High-quality firms have difficulty signaling
their quality by disclosing more R&D-specific information due to the costs associated with
5 This basically assumes that existing investors do not participate in the offering.
- 8 -
benefiting competitors. The lemon premium will be higher in R&D-intensive industries,
especially when projects are long-term R&D investments, than when they are more short-term
or low-risk projects (Leland and Pyle, 1977). In the most extreme case, the market for
financing R&D projects may completely disappear if the level of information asymmetry is
too high.
2.1.2.2 Moral hazard
Moral hazard problems provide another market friction in the financing of R&D. Moral
hazard problems arise when there is a separation between ownership and control. The
principal-agent theory (Jensen and Meckling, 1976) concerns difficulties in motivating
corporate management (the agent) to act in the best interests of existing shareholders (the
principal) rather than in his or her own interests. The agency theory describes the relationship
as a contract under which principals engage agents to make decisions and manage the firm on
their behalf. In the R&D setting, two agency cost scenarios may co-exist. First, managers may
spend on activities that simply benefit them (although not the existing shareholders), such as
investing in negative NPV projects. Second, risk-averse managers may be reluctant, or even
avoid, investing in uncertain and high-risk R&D projects. To reduce agency costs, the amount
of free cash flow available to the managers can be limited by leveraging the firm. However,
the lack of collateral makes leveraging an unviable alternative. In addition, leveraging forces
the firm to use the higher-cost external funds to finance R&D (Jensen and Meckling, 1976).
Grossman and Hart (1980) and Shleifer and Vishny (1986) suggest that institutional
ownership can lower agency costs. The higher the level of ownership concentration, the easier
it is for a small group of shareholders to influence management behavior through their voting
power as well as ensuring that the resources of the firm are efficiently used. In contrast, the
more diverse the shareholding, the easier it is for management to expropriate their own
interests or to use cash inefficiently as the level of influence by non-management shareholders
decreases (Mitchell, 1983). Pension funds and venture capital funds are generally considered
effective in monitoring agents (e.g., Admati and Pfleiderer, 1994; Sahlman, 1990). However,
monitoring may not be effective if ownership is concentrated in the hands of passive investors.
2.1.3 Corporate disclosures
Corporate disclosures generally aim at reducing the information asymmetry between
managers and investors. Firms may have incentives to make additional voluntary disclosures
if these will benefit the firm (Cerbioni and Parbonetti, 2007). However, reducing information
- 9 -
asymmetry via voluntary disclosures represents a trade-off between the benefits and costs of
disclosing information. Spence (1974) proposes a signaling equilibrium model arising from
the trade-off between increased valuation in the capital market and the lower probability of
being the first to innovate. Prior empirical research has shown that voluntary disclosures are
associated with a lower cost of equity capital (Botosan, 1997), higher stock liquidity
(Diamond and Verrecchia, 1991) and an increase in information intermediation (Lang and
Lundholm, 1996). In contrast, the costs of disclosures are related in terms of benefiting
competitors (Guo et al., 2004) and increasing litigation exposure (e.g., Darrough and
Stoughton, 1990). However, Guo et al. (2004) argue that although news about a drug’s
success in clinical trials might encourage competitors to develop substitute drugs, it might
alternatively deter them from entering the field.
2.1.4 Capital structure and R&D
Myers and Majluf (1984) provide an early analytical framework in the context of raising
external equity financing. In their model, corporate managers maximize the full-information
value of existing shareholders’ claims on the firm and issue equity directly to the market in a
public offering with no mechanism (such as an underwriter) for communication between the
issuer and outside investors and without participation in the issue of existing investors. In this
setting, Myers (1984) proposed a pecking-order theory, where the cost of financing increases
with the degree of asymmetric information. Corporate managers have more information about
the firms’ prospects than corporate outsiders, and the theory suggests a financing hierarchy,
where they first prefer internal financing, then debt, and then raise external equity as a last
resort. For early-stage and cash-flow negative R&D firms that invest heavily in intangible
assets such as R&D, the investments generally exceed their capability of generating funds
internally. Debt finance is generally not an option due to the absence of collateral (i.e., assets-
in-place). Hence, equity provides the primary alternative. Blass and Yosha (2001) find that
R&D-intensive US firms tend to use highly equity-based sources of financing.
The Myers and Majluf (1984) model only considers the single case, in which corporate
managers issue equity directly to the market in a public offering and do not provide a rational
explanation for the firm’s choices of equity flotation methods, ranging from uninsured rights
offerings to current shareholders to underwritten rights offerings (such as standby and firm-
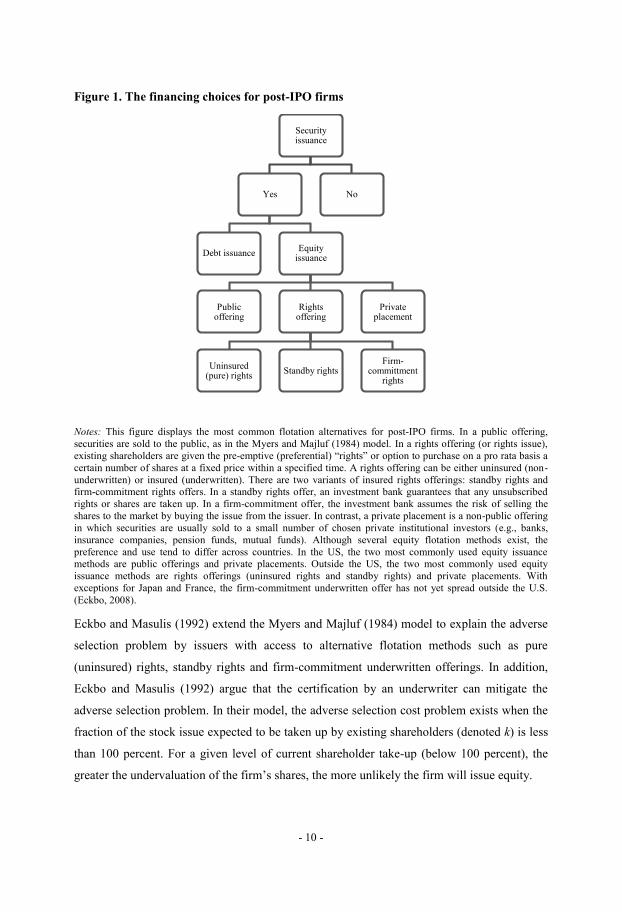
commitment rights) and private placements (see Figure 1).
- 10 -
Figure 1. The financing choices for post-IPO firms
Notes: This figure displays the most common flotation alternatives for post-IPO firms. In a public offering,
securities are sold to the public, as in the Myers and Majluf (1984) model. In a rights offering (or rights issue),
existing shareholders are given the pre-emptive (preferential) “rights” or option to purchase on a pro rata basis a
certain number of shares at a fixed price within a specified time. A rights offering can be either uninsured (non-
underwritten) or insured (underwritten). There are two variants of insured rights offerings: standby rights and
firm-commitment rights offers. In a standby rights offer, an investment bank guarantees that any unsubscribed
rights or shares are taken up. In a firm-commitment offer, the investment bank assumes the risk of selling the
shares to the market by buying the issue from the issuer. In contrast, a private placement is a non-public offering
in which securities are usually sold to a small number of chosen private institutional investors (e.g., banks,
insurance companies, pension funds, mutual funds). Although several equity flotation methods exist, the
preference and use tend to differ across countries. In the US, the two most commonly used equity issuance
methods are public offerings and private placements. Outside the US, the two most commonly used equity
issuance methods are rights offerings (uninsured rights and standby rights) and private placements. With
exceptions for Japan and France, the firm-commitment underwritten offer has not yet spread outside the U.S.
(Eckbo, 2008).
Eckbo and Masulis (1992) extend the Myers and Majluf (1984) model to explain the adverse
selection problem by issuers with access to alternative flotation methods such as pure
(uninsured) rights, standby rights and firm-commitment underwritten offerings. In addition,
Eckbo and Masulis (1992) argue that the certification by an underwriter can mitigate the
adverse selection problem. In their model, the adverse selection cost problem exists when the
fraction of the stock issue expected to be taken up by existing shareholders (denoted k) is less
than 100 percent. For a given level of current shareholder take-up (below 100 percent), the
greater the undervaluation of the firm’s shares, the more unlikely the firm will issue equity.
Security issuance
Yes
Debt issuance Equity
issuance
Public offering
Rights offering
Uninsured (pure) rights
Standby rights Firm-
committment rights
Private placement
No

- 11 -
The value of k is assumed to be an exogenous factor determined by shareholder characteristics,
such as wealth constraints, diversification benefits, and benefits from maintaining a
shareholder’s proportional ownership of the issuer’s equity (Bøhren et al, 1997; Eckbo and
Masulis, 1992). Although k is largely beyond managerial control, managers are assumed to
have better information than the market about k, as subscription pre-commitments indicated
by existing shareholders give them a good approximation of the expected take-up in the issue.
If the management believes k to be high, i.e., existing shareholders are expected to buy and
hold the new shares, a pure (uninsured) rights offer is the lowest-cost flotation method. In the
extreme case of k = 1, where current shareholders purchase and hold the entire issue, there is
no wealth transfer to outside investors. This is basically equivalent to having access to an
internal source of funds that is not disadvantaged by asymmetric information costs. In this
case, both the subscription price and the degree of undervaluation (or mispricing) are
irrelevant to shareholders, as there is no wealth transfer from existing investors (no adverse
selection). In theory, a deeply discounted rights offering to existing investors may help ensure
the success of the offering and minimize the wealth transfer from existing to outside investors.
However, the subscription price is a signal of firm quality, and a deep discount may convey
negative information to outside investors about the true value of the issue (Heinkel and
Schwartz, 1986; Loderer and Zimmermann, 1988). Managers may therefore be reluctant to
issue rights with a deep subscription-price discount (Smith, 1977). Furthermore, it is
reasonable to assume that firm managers in general are unable to commit personal wealth to
the R&D project due to the significant amount of funds required to finance the R&D project,
such that outside investors are incapable of deriving any signal from the corporate managers’
commitment to the project.6 Empirical studies (e.g., Eckbo and Masulis, 1992; Cronqvist and
Nilsson, 2004) report an average shareholder take-up of 86-90 percent in pure (uninsured)
rights offerings compared with approximately 65-81 percent for standby rights. In the current
study for a sample of European biotechnology firms, the corresponding figures are 69.5 and
74.9 percent for standby rights and uninsured rights, respectively. Consequently, it is
reasonable to assume that k < 1 in the pool of rights offerings.
When k is expected to be less than one, some undervalued firms may find it too costly to issue
new equity due to the costs to existing shareholders of selling shares to outsiders at a price
6 Leland and Pyle (1977) consider an entrepreneur seeking external equity financing to finance a project. In
contrast to outside investors, the entrepreneur knows the value of the project. However, the outside investors
observe the fraction of the entrepreneur’s personal wealth committed to the project and set their valuation
accordingly.

- 12 -
below the intrinsic value. Adverse selection effects, and thus w(k), increase as k decreases.
Hence, low-k issuers are likely to employ a more expensive flotation alternative (standby or
firm-commitment) involving underwriter certification to narrow, although not fully remove,
the information asymmetry between the firm and the market, as long as the sum of the
expected certification benefit and the net project value exceeds the underwriter fee. Under
Myers and Majluf’s information asymmetry model for public offerings, the “underinvestment
problem” can be avoided if managers are able to convey their private information to the
market at no cost. Hertzel and Smith (1993) extend the Myers and Majluf (1984) model to
allow the possibility that private placement investors can assess firm value through their
negotiations with management and that private placements provide benefits similar to those
suggested for mergers by Myers and Majluf (1984). Similarly, but for rights offerings, Eckbo
and Norli (2005) expand the Eckbo and Masulis (1992) model by proposing an equity
flotation pecking order (See Figure 2), in which issuing firms have access to a menu of
flotation methods, including uninsured rights, standby rights and private placements, and
select the cost-minimizing flotation method conditional on shareholder take-up. When k is
expected to be low, in addition to hiring an underwriter (or, in the case the underwriter,
declines to underwrite the offering) issuers can attempt to minimize a costly7 market reaction
to the announcement of the rights offering by choosing a private placement, in which
sophisticated investors are given access to proprietary firm information. Therefore,
undervalued firms can choose a private placement over a public issue (instead of not issuing
and thereby potentially foregoing an investment opportunity) if it enables existing
shareholders to retain a larger fraction of the firm, i.e., if the net present value of the
investment opportunity exceeds the total cost of informing private investors about firm value,
that is, b ≥ w(k), as private placements are assumed to have very low direct flotation costs.
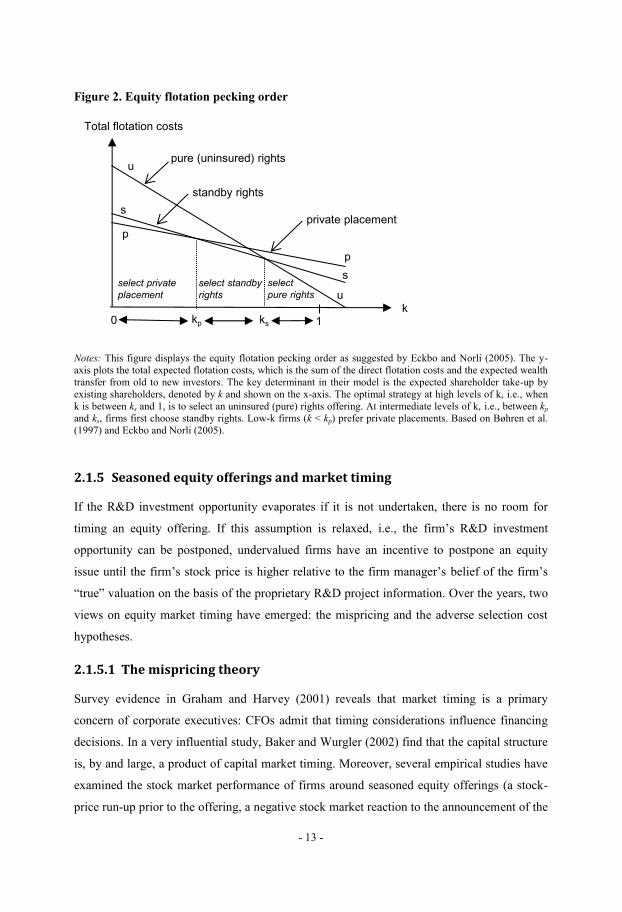
Eckbo and Norli (2005) describe the choice of the flotation method as an issuing game. High-
k firms select uninsured rights, as this minimizes the potential wealth transfer to outside
investors. Intermediate-k firms prefer standby rights but move to private placements if the
underwriter rejects the issue. Low-k firms first select private placements but move to standby
rights if they are unable to find a private placement investor. If both second choices are
rejected, intermediate-k and low-k firms either select uninsured rights or abandon the issue.
7 Eckbo (2008) documents that a stock market reaction of negative 2 percent to SEOs translates to an amount
equal to 15 percent of the proceeds of the average issue, which is equivalent to more than three times the direct
costs of an issue.
- 13 -
Figure 2. Equity flotation pecking order
Notes: This figure displays the equity flotation pecking order as suggested by Eckbo and Norli (2005). The y-
axis plots the total expected flotation costs, which is the sum of the direct flotation costs and the expected wealth
transfer from old to new investors. The key determinant in their model is the expected shareholder take-up by
existing shareholders, denoted by k and shown on the x-axis. The optimal strategy at high levels of k, i.e., when
k is between ks and 1, is to select an uninsured (pure) rights offering. At intermediate levels of k, i.e., between kp
and ks, firms first choose standby rights. Low-k firms (k < kp) prefer private placements. Based on Bøhren et al.
(1997) and Eckbo and Norli (2005).
2.1.5 Seasoned equity offerings and market timing
If the R&D investment opportunity evaporates if it is not undertaken, there is no room for
timing an equity offering. If this assumption is relaxed, i.e., the firm’s R&D investment
opportunity can be postponed, undervalued firms have an incentive to postpone an equity
issue until the firm’s stock price is higher relative to the firm manager’s belief of the firm’s
“true” valuation on the basis of the proprietary R&D project information. Over the years, two
views on equity market timing have emerged: the mispricing and the adverse selection cost
hypotheses.
2.1.5.1 The mispricing theory
Survey evidence in Graham and Harvey (2001) reveals that market timing is a primary
concern of corporate executives: CFOs admit that timing considerations influence financing
decisions. In a very influential study, Baker and Wurgler (2002) find that the capital structure
is, by and large, a product of capital market timing. Moreover, several empirical studies have
examined the stock market performance of firms around seasoned equity offerings (a stock-
price run-up prior to the offering, a negative stock market reaction to the announcement of the
pure (uninsured) rights
standby rights
k1ks0
u
u
s
s
Total flotation costs
kp
p
p
private placement
select private
placement
select standby
rights
select
pure rights
- 14 -
equity offering, and negative long-run returns). The results seem to indicate that managers
time equity offerings when there is temporary mispricing (overvaluation) in the market. This
is known as the mispricing (“windows-of-opportunity”) hypothesis and is based on non-
rational market pricing, in which investors have overly optimistic expectations about the
issuing firm’s future prospects. In the extreme case, where existing investors buy and hold the
entire equity issue, which is similar to having access to internal corporate funds, temporary
over- and undervaluation of the firm’s stock is captured by existing shareholders. However, if
existing investors sell some of their subscription rights in a rights issue (i.e., k < 1), when the
firm is temporarily overvalued, outside investors will buy overpriced shares and are likely to
experience a subsequent long-run underperformance when investors correct the mispricing
over time.
2.1.5.2 The adverse-selection cost theory
The other equity market timing theory that has emerged is the adverse selection costs
hypothesis. This hypothesis is built on the notion that the degree of asymmetric information
between corporate insiders and outsiders is not fixed over time. The time-varying asymmetric
information model by Korajczyk et al. (1991, 1992) suggests that immediately following an
information release, few managers will have received a private signal, and the level of
information asymmetry is small. As time passes, however, the information asymmetry
problem becomes more severe. The model by Korajczyk et al. (1991, 1992) is based on
rational market pricing and implies an association between equity issue activity and releases
of firm specific information, such as the disclosure of quarterly and annual financial reports or
the disclosure of R&D information. It is important to note that corporate disclosures will only
reduce the information asymmetry if they contain value-relevant information. Hence, rational
firm managers have incentives to raise external financing to finance R&D investments when
information asymmetry between managers and investors is low, i.e., when investors are likely
to understand the firm’s future prospects, which typically is the case when value-relevant
R&D information has been disclosed.
2.2 Corporate takeovers
Corporate takeovers are among the largest investments a firm ever will undertake. Hence, it is
of great interest to examine the effect of takeovers on the wealth of bidder and target
shareholders. The wealth effect of bidder and target shareholders can be investigated over a
short-term event window around the acquisition announcement as well as the long-term
- 15 -
performance to the acquiring firm’s shareholders. Most empirical research suggests that the
shareholders of target firms realize significant positive abnormal returns around the
acquisition announcement, while returns to acquiring firms’ shareholders are close to zero
(e.g., Eckbo, 2009; Huang and Walkling, 1987; Jensen and Ruback, 1983; Martynova and
Renneboog, 2008). The wealth effect of merged firms in the post-merger period is
inconclusive. If returns of merging firms are benchmarked to non-merging firms matched on
size and the book-to-market ratio, the post-merger performance is, on average, negative (e.g.,
Rau and Vermaelen, 1998). However, when using asset pricing benchmarks, the abnormal
performance is insignificantly different from zero.
2.2.1 Corporate takeovers and information asymmetry
Myers and Majluf (1984) argue that corporate acquisitions gives rise to adverse selection
problems due to asymmetrically distributed information between parties involved in the
transaction. Although corporate bidders have access to publicly available information and
diligence information about the target company, they only have imperfect information about
the target company’s future cash flow contribution and about the prospects of a competing bid.
Several studies have suggested that information asymmetry problems may have a significant
impact on the likelihood and performance implications of acquisitions (e.g., Eckbo et al,
1990; Balakrishnan and Koza, 1993; Coff, 1999). Information asymmetry further complicates
the post-acquisition management of target firms with intangible assets, such as research and
development (R&D), because acquirers are typically unable to verify the targets’ quality prior
to the acquisition. Rodriguez and Higgins (2003) find that little or no value is created for the
acquiring firm’s shareholders when a significant portion of the target firm’s value consists of
intangible assets.
2.2.2 Information intermediaries
In the market for deals, the lemon problem (Akerlof, 1970) is described such that sellers of
high-quality assets withdraw from the market because they are unable to convey their
information to buyers, leaving only low-quality assets left in the marketplace. In the R&D
setting, Pisano (1997) finds that biotechnology firms exploit their information advantage
regarding the quality of their drug candidates by out-licensing to pharmaceutical firms those
- 16 -
that have relatively poor prospects8: the real performance of out-licensed drugs have a higher
likelihood of failure than projects that are developed in-house. Biotechnology firms may have
access to superior information (asymmetrically distributed information) regarding adverse
effects or limitations of the R&D project but have few reasons to disclose them.
Several studies discuss the role of information-producing intermediaries in various situations
that may help evaluate and signal to markets the quality of firms (Leland and Pyle, 1977;
Campbell and Kracaw, 1980; Chan, 1983; Chemmanur, 1993; Chemmanur and Fulghieri,
1994; Eckbo and Masulis, 19929). In alliances, Leland and Pyle (1977) argue that “moral
hazard problems can be alleviated if the firm gathering the information becomes an
intermediary, buying and holding assets on the basis of its specialized information”. Nanda
and Williamson (1995) argue that an alliance provides an opportunity for the acquiring firm to
learn more about the quality of the asset and improve their informational disadvantage. In the
R&D setting, an alliance between a pharmaceutical firm (licensee) and a biotech firm
(licensor) may mitigate information asymmetry problems if scientists of both companies work
in close collaboration and exchange project-specific information.
The principal-agent relationship in an R&D alliance between the pharmaceutical and
biotechnology firm is subject to moral hazard problems in several aspects. The incentives of
biotechnology firm managers (agents) and alliance partners (principals) may diverge such that
managers of biotechnology firms shift or extract resources from the partner project to other
projects within the firm for two reasons. First, the contractual cash flow rights that are granted
to the alliance partner often place a cap on the upside of the equity value of the small
company (Ozmel et al, 2012). Second, risk-averse managers may extract resources to pursue
similar projects (e.g., “follow-up” projects) or other projects to diversify the firms’ project
portfolio. Furthermore, reputational concerns, such as the ability to attract future partners,
may prevent scientists at the biotechnology firm from confessing that the R&D project is
unlikely to succeed and, therefore, from proposing termination.
In corporate acquisitions, several empirical studies document a positive association between
having a prior alliance with the target firm and bidder returns (e.g., Chan et al., 1997; Porrini,
2004; Higgins and Rodriguez, 2006; Mantecon, 2009). For example, Higgins and Rodriguez
8 In contrast, Nicholson et al. (2005) do not find support for a “lemons” problem in the market for know-how
between biotechnology and pharmaceutical firms. 9 In security issues, it has been argued that the role of financial intermediaries is to help mitigate, although not
fully eliminate, the adverse selection problem. Eckbo and Masulis (1992) argue that certification by an
underwriter can mitigate the adverse selection problem.
- 17 -
(2006) find, using a sample of 160 biopharmaceutical acquisitions between 1994-2011, that
the overall abnormal return for acquiring firms is 3.9 percent and is positively associated with
having a preceding alliance with the target firm. Thus, they conclude that “this prior contact
should provide learning opportunities for the acquiring firm resulting in a more appropriate
valuation being placed on the target firm”. However, these studies are short-term in nature
and provide no direct evidence of whether an alliance is associated with post-acquisition real
performance.
3. The biotechnology industry as a research focus
The biotechnology industry has certain key features that make it an interesting study object
from an academic point of view. This section describes why the disclosures of R&D
information provide investors with value-relevant information, proxies for measuring
information asymmetry, and what sources of R&D financing exist.
3.1 Mandatory R&D disclosures
Biotechnology firms differ from other R&D-intensive firms in the sense that the development
process is closely monitored by external regulatory authorities, such as the FDA, with
considerable experience of how to evaluate drugs in light of issues such as efficacy and safety.
Biotechnology projects have to undergo a thorough and well-documented regulatory review
process, and therefore, there are mandatory non-discretionary evaluations of the value-
creation process. Publicly listed firms are subject to stock exchange regulations, which
stipulate that they have an obligation to disclose “price sensitive” information as soon as
possible to the public. These security laws limit the ability of firms to manage and time
corporate disclosures. In addition, managers’ incentives to disclose value-relevant product
development information are also derived from investor demand (Guo et al, 2004; Cerbioni
and Parbonetti, 2007). Consequently, disclosures of R&D information, such as clinical trial
results, are generally mandatory (rather than voluntary) for small biotechnology firms. A
problem with voluntary disclosures is that they are subject to a self-selection bias and, hence,
the association between market reactions and disclosure might be driven by firm performance
rather than disclosure per se (Healy and Palepu, 2001). Consequently, the non-discretionary
nature of R&D disclosures in this industry overcomes the common criticism of endogenous
events in the event study literature (Schultz, 2003; Viswanathan and Wei, 2008).
- 18 -
3.2 Information asymmetry and R&D disclosures
Several proxies for measuring the degree of asymmetric information are frequently employed
in the academic literature, such as the number of analysts following the firm, institutional and
insider ownership (e.g., Stoll, 1978; Brennan and Subrahmanyam, 1995), firm size (e.g.,
Vermaelen, 1981), firm age (e.g., James and Wier, 1990), trading volume (e.g., Chari et al.,
1988), bid-ask spread (e.g., Glosten and Milgrom, 1985), and stock return volatility (e.g.,
French and Roll, 1986; Krishnaswami and Subramaniam, 1999). Aboody and Lev (2000)
argue that these proxies are noisy because they reflect not only information asymmetry but
also several firm and market characteristics. They suggest that the identification of firm-
specific drivers of information asymmetry will provide more precise and less noisy measures
of the level of information asymmetry.
Information asymmetries decrease when new value-relevant information is made public.
Given that the disclosure of value-relevant information varies between firms and over time,
the level of asymmetrically distributed information also varies (Dierkens, 1991; Lucas and
McDonald, 1990; Choe et al., 1993). Asymmetries are low immediately following relevant
news announcements because few firm managers have received a private signal, but the
information advantage for managers increases with time. The adverse selection costs
hypothesis tends to be tested in association with the release of earnings announcements (e.g.,
Korajczyk et al., 1991; 1992), dividend announcements (Loderer and Mauer, 1992) or
financial forecast revisions (Lin et al., 2008). While disclosures of accounting information can
be biased given the discretionary nature of accounting information, value-relevant and
mandatory R&D disclosures are more likely to be a clean test of the information asymmetry
hypothesis. In addition, it has been argued that accounting information for firms in R&D
intensive industries such as biotechnology that invest heavily in intangibles convey less value-
relevant information (e.g., Amir and Lev, 1996). Investors, therefore, are dependent on other
types of information. In the biotechnology industry, a candidate drug’s progress in clinical
trials is a strong signal to investors that the firm creates value (e.g., Amir and Lev, 1996;
McConomy and Xu, 2004). Furthermore, using an industry-specific sample provides an
opportunity to use more direct and less noisy proxies of information asymmetry, which
increases the power of tests for the presence of information asymmetry.
- 19 -
3.3 Equity financing
The biotechnology industry is different from other industries in that firms usually operate with
large negative free cash flows and have significant costs associated with R&D. Most
biotechnology firms are in an early life-cycle stage with no commercial product, and they
invest heavily on a continuous basis in intangible assets such as R&D, but they can rarely
fund these investments internally. Consequently, they are dependent on external financing.
Because few biotechnology firms are profitable and investments are mainly in intangible
assets, these firms cannot use debt financing and instead regularly turn to the equity market.
Consequently, equity capital is a primary source of funding for publicly listed early-stage and
not-yet-profitable growth firms (Bolton and Freixas, 2000; Rajan and Zingales, 1998; Ravid
and Spiegel, 1997). Therefore, a sample of biotechnology firms enables a study of examining
market timing theories and external financing decisions without having to think about
alternative sources of external capital, such as debt financing (Guo and Mech, 2000). While
debt financing is more common in the US because several larger biotechnology firms are
cash-flow positive, it remains relatively uncommon in the European biotechnology industry
(see Figure 3). A major advantage when examining the market timing aspects of equity issues
is that one does not need to control for other sources of external capital (Guo and Mech, 2000).
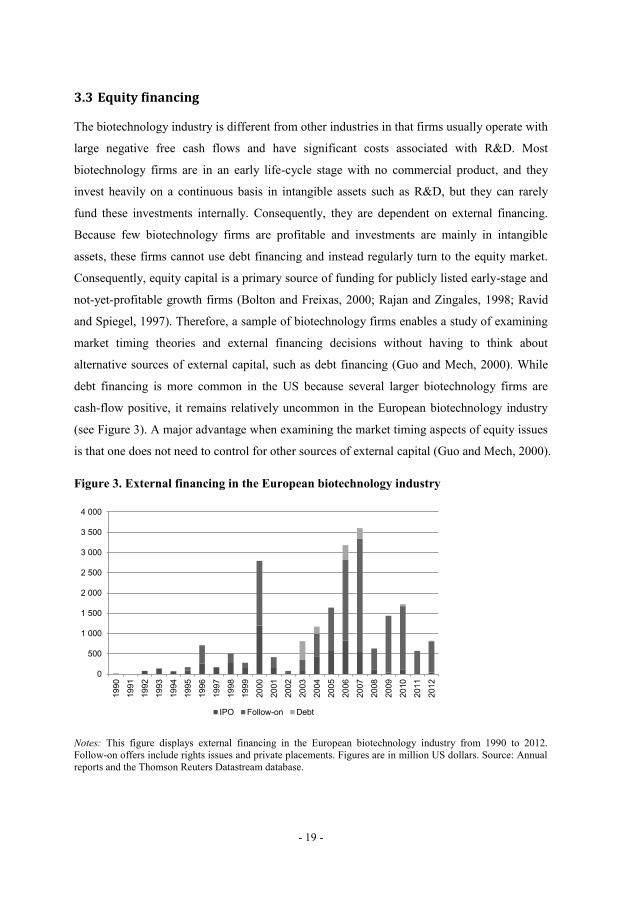
Figure 3. External financing in the European biotechnology industry
Notes: This figure displays external financing in the European biotechnology industry from 1990 to 2012.
Follow-on offers include rights issues and private placements. Figures are in million US dollars. Source: Annual
reports and the Thomson Reuters Datastream database.
0
500
1 000
1 500
2 000
2 500
3 000
3 500
4 000
1990
1991
1992
1993
1994
1995
1996
1997
1998
1999
2000
2001
2002
2003
2004
2005
2006
2007
2008
2009
2010
2011
2012
IPO Follow-on Debt
- 20 -
3.4 Takeovers and post-acquisition performance
A key challenge in analyzing the performance of corporate takeovers is to find appropriate
measures of transaction success. Most prior studies measure the cumulative abnormal returns
in the post-acquisition period. Although a positive abnormal stock market performance
provides a real measure of success, a potential drawback with this measure is that it is noisy in
the sense that it may reflect not only the performance of takeovers but also other firm and
market characteristics that have an impact on the firm’s stock. In this setting, the
biopharmaceutical industry provides a unique opportunity to study the association between
information asymmetry, takeovers, alliances and the post-acquisition performance of R&D
projects for several reasons. First, pharmaceutical firms engage intensively in alliances as well
as mergers and acquisitions of biotechnology firms to supplement their internal R&D
portfolios. Second, extensive publicly data are available for both the acquiring and target firm
research portfolios that are associated with information asymmetries, which provides an
opportunity to directly examine the real performance of individual R&D projects regarding
the project-level rather than firm-level performance in the post-acquisition period.
4. Research questions
Having the characteristics of the biotechnology industry in mind, this thesis is centered
around two key events that play an important role in the biotechnology industry: 1) Corporate
financing of R&D and 2) Corporate takeovers (see Figure 4). In the corporate financing of
R&D, the biotechnology firm raises external financing from investors (new or existing
shareholders) to finance investments in R&D. In corporate takeovers, the acquiring firm
targets the biotechnology firm. In both cases, the biotechnology firm is assumed to have
access to more information than investors and the acquiring firm, respectively. Table 1
provides an overview of the four essays and the research hypotheses.
- 21 -
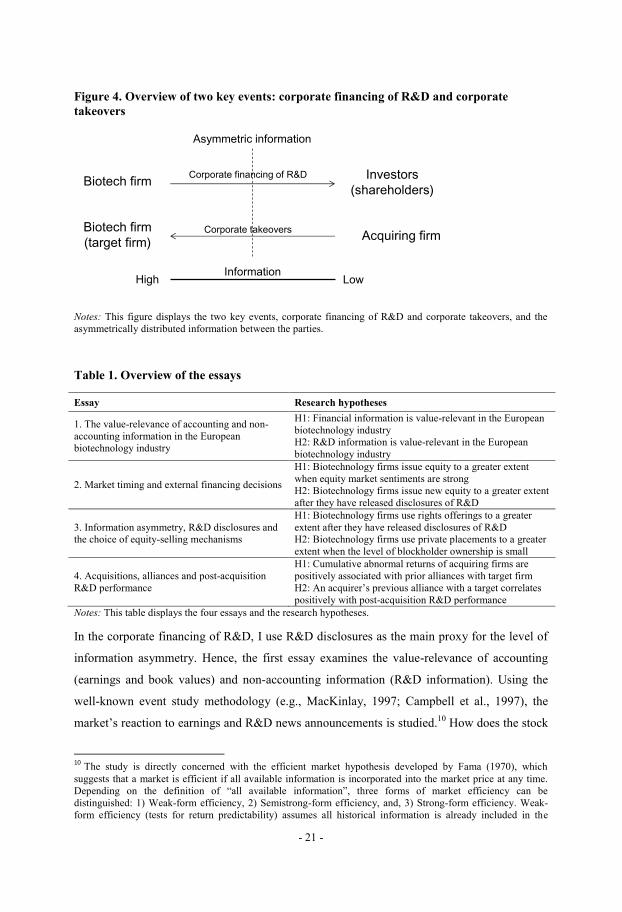
Figure 4. Overview of two key events: corporate financing of R&D and corporate
takeovers
Notes: This figure displays the two key events, corporate financing of R&D and corporate takeovers, and the
asymmetrically distributed information between the parties.
Table 1. Overview of the essays
Essay Research hypotheses
1. The value-relevance of accounting and non-
accounting information in the European
biotechnology industry
H1: Financial information is value-relevant in the European
biotechnology industry
H2: R&D information is value-relevant in the European
biotechnology industry
2. Market timing and external financing decisions
H1: Biotechnology firms issue equity to a greater extent
when equity market sentiments are strong
H2: Biotechnology firms issue new equity to a greater extent
after they have released disclosures of R&D
3. Information asymmetry, R&D disclosures and
the choice of equity-selling mechanisms
H1: Biotechnology firms use rights offerings to a greater
extent after they have released disclosures of R&D
H2: Biotechnology firms use private placements to a greater
extent when the level of blockholder ownership is small
4. Acquisitions, alliances and post-acquisition
R&D performance
H1: Cumulative abnormal returns of acquiring firms are
positively associated with prior alliances with target firm
H2: An acquirer’s previous alliance with a target correlates
positively with post-acquisition R&D performance
Notes: This table displays the four essays and the research hypotheses.
In the corporate financing of R&D, I use R&D disclosures as the main proxy for the level of
information asymmetry. Hence, the first essay examines the value-relevance of accounting
(earnings and book values) and non-accounting information (R&D information). Using the
well-known event study methodology (e.g., MacKinlay, 1997; Campbell et al., 1997), the
market’s reaction to earnings and R&D news announcements is studied.10
How does the stock
10
The study is directly concerned with the efficient market hypothesis developed by Fama (1970), which
suggests that a market is efficient if all available information is incorporated into the market price at any time.
Depending on the definition of “all available information”, three forms of market efficiency can be
distinguished: 1) Weak-form efficiency, 2) Semistrong-form efficiency, and, 3) Strong-form efficiency. Weak-
form efficiency (tests for return predictability) assumes all historical information is already included in the
Biotech firmInvestors
(shareholders)
Biotech firm
(target firm)Acquiring firm
Asymmetric information
HighInformation
Low
Corporate financing of R&D
Corporate takeovers
- 22 -
market react when quarterly earnings information or the results of clinical trials are disclosed?
Is there a difference in the market’s reaction between different types of R&D news
announcements (e.g., pre-clinical, phase 1, phase 2, etc.), between announcements of positive
and negative results, between different types of companies, and between different market
sentiments? This study forms the basis for the measure of information asymmetry (R&D
disclosures) used in essays two and essay three.
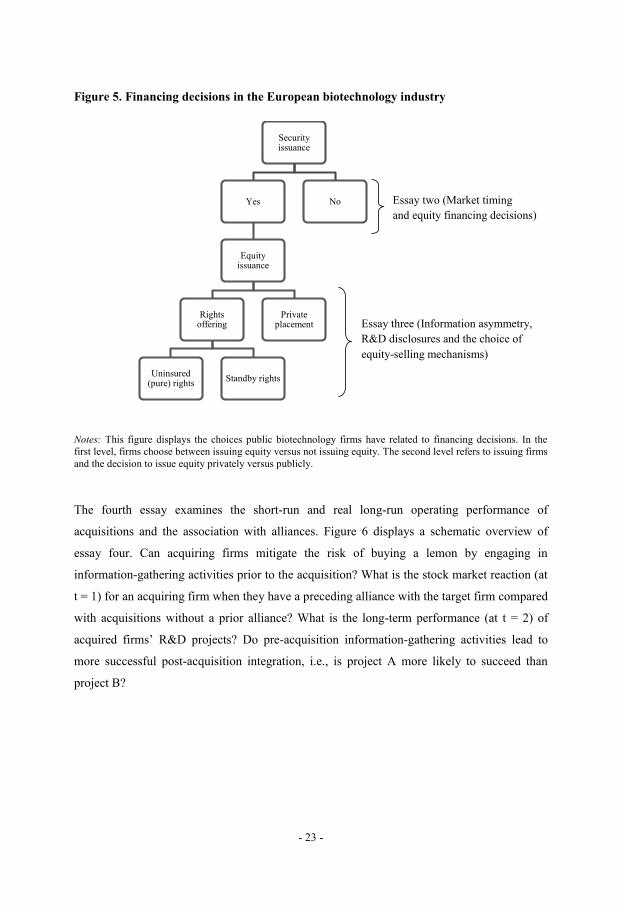
The second and the third essays address equity financing decisions. A schematic overview of
the two essays is detailed in Figure 5. I assume that the choice to issue equity occurs at two
levels. In the first level, the firm decides whether to issue equity. In the second level, firms
that have decided to raise equity capital choose between raising capital via a rights offering or
a private placement.
Essay two examines timing aspects of raising external financing. Are biotechnology firms
able to access equity markets following a period of abnormal stock return performance? How
do biotechnology stocks perform in the period after the equity issue announcement? To what
degree are biotechnology firm managers able to access equity markets when there is a higher
likelihood that investors understand the firm’s prospects? How does the stock market respond
to equity issue announcements? Is there an association between pre-issue disclosures of R&D
information and the stock market reaction at the equity issue announcement?
The third essay investigates how biotechnology firm managers choose between two equity-
selling mechanisms: rights offerings vs. private placements. What impact does the level of
information asymmetry about firm value have on the choice between private and public equity
capital? Does the risk of moral hazard play a role in the choice of equity-selling mechanisms?
market price. According to semistrong-form efficiency, at the time public information is issued, it is immediately
incorporated in the market price. In Fama (1991), this section was renamed “Event Studies”. Strong-form
efficiency (tests for private information) assumes that all possible information, including insider information, is
included in the market price. Essay one makes the explicit assumption that the stock markets are semistrong-
form efficient.
- 23 -
Figure 5. Financing decisions in the European biotechnology industry
Notes: This figure displays the choices public biotechnology firms have related to financing decisions. In the
first level, firms choose between issuing equity versus not issuing equity. The second level refers to issuing firms
and the decision to issue equity privately versus publicly.
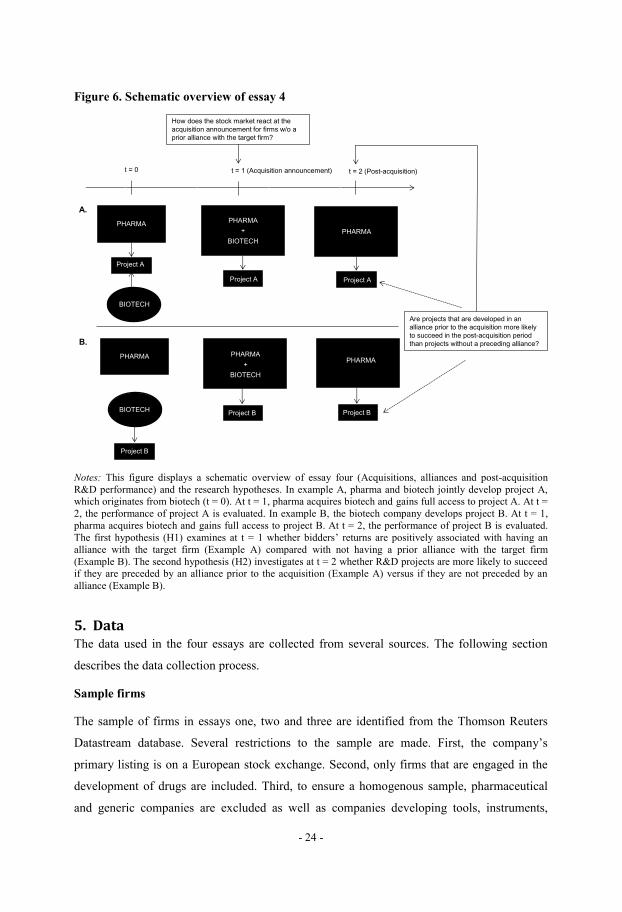
The fourth essay examines the short-run and real long-run operating performance of
acquisitions and the association with alliances. Figure 6 displays a schematic overview of
essay four. Can acquiring firms mitigate the risk of buying a lemon by engaging in
information-gathering activities prior to the acquisition? What is the stock market reaction (at
t = 1) for an acquiring firm when they have a preceding alliance with the target firm compared
with acquisitions without a prior alliance? What is the long-term performance (at t = 2) of
acquired firms’ R&D projects? Do pre-acquisition information-gathering activities lead to
more successful post-acquisition integration, i.e., is project A more likely to succeed than
project B?
Security issuance
Yes
Equity issuance
Rights offering
Uninsured (pure) rights
Standby rights
Private placement
No Essay two (Market timing
and equity financing decisions)
Essay three (Information asymmetry,
R&D disclosures and the choice of
equity-selling mechanisms)
- 24 -
Figure 6. Schematic overview of essay 4
Notes: This figure displays a schematic overview of essay four (Acquisitions, alliances and post-acquisition
R&D performance) and the research hypotheses. In example A, pharma and biotech jointly develop project A,
which originates from biotech (t = 0). At t = 1, pharma acquires biotech and gains full access to project A. At t =
2, the performance of project A is evaluated. In example B, the biotech company develops project B. At t = 1,
pharma acquires biotech and gains full access to project B. At t = 2, the performance of project B is evaluated.
The first hypothesis (H1) examines at t = 1 whether bidders’ returns are positively associated with having an
alliance with the target firm (Example A) compared with not having a prior alliance with the target firm
(Example B). The second hypothesis (H2) investigates at t = 2 whether R&D projects are more likely to succeed
if they are preceded by an alliance prior to the acquisition (Example A) versus if they are not preceded by an
alliance (Example B).
5. Data The data used in the four essays are collected from several sources. The following section
describes the data collection process.
Sample firms
The sample of firms in essays one, two and three are identified from the Thomson Reuters
Datastream database. Several restrictions to the sample are made. First, the company’s
primary listing is on a European stock exchange. Second, only firms that are engaged in the
development of drugs are included. Third, to ensure a homogenous sample, pharmaceutical
and generic companies are excluded as well as companies developing tools, instruments,
PHARMA
BIOTECH
Project A
t = 0
PHARMA
BIOTECH
Project B
t = 1 (Acquisition announcement) t = 2 (Post-acquisition)
A.
B.
PHARMA
+
BIOTECH
Project A
BIOTECH
PHARMA
+
BIOTECH
Project B
Project A
PHARMA
Project A
PHARMA
Project B
How does the stock market react at the
acquisition announcement for firms w/o a
prior alliance with the target firm?
Are projects that are developed in an
alliance prior to the acquisition more likely
to succeed in the post-acquisition period
than projects without a preceding alliance?
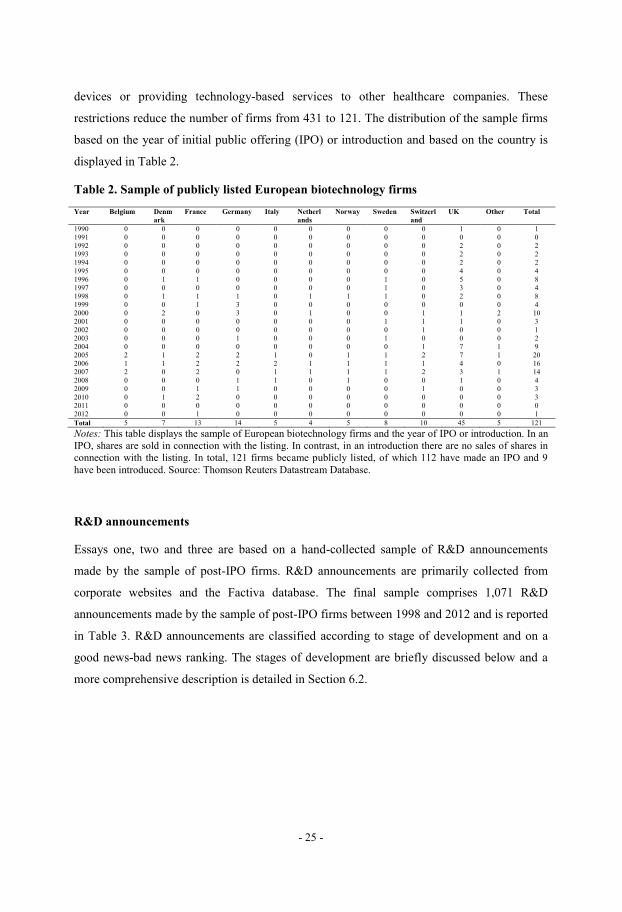
- 25 -
devices or providing technology-based services to other healthcare companies. These
restrictions reduce the number of firms from 431 to 121. The distribution of the sample firms
based on the year of initial public offering (IPO) or introduction and based on the country is
displayed in Table 2.
Table 2. Sample of publicly listed European biotechnology firms
Year Belgium Denm
ark
France Germany Italy Netherl
ands
Norway Sweden Switzerl
and
UK Other Total
1990 0 0 0 0 0 0 0 0 0 1 0 1
1991 0 0 0 0 0 0 0 0 0 0 0 0
1992 0 0 0 0 0 0 0 0 0 2 0 2
1993 0 0 0 0 0 0 0 0 0 2 0 2
1994 0 0 0 0 0 0 0 0 0 2 0 2
1995 0 0 0 0 0 0 0 0 0 4 0 4
1996 0 1 1 0 0 0 0 1 0 5 0 8
1997 0 0 0 0 0 0 0 1 0 3 0 4
1998 0 1 1 1 0 1 1 1 0 2 0 8
1999 0 0 1 3 0 0 0 0 0 0 0 4
2000 0 2 0 3 0 1 0 0 1 1 2 10
2001 0 0 0 0 0 0 0 1 1 1 0 3
2002 0 0 0 0 0 0 0 0 1 0 0 1
2003 0 0 0 1 0 0 0 1 0 0 0 2
2004 0 0 0 0 0 0 0 0 1 7 1 9
2005 2 1 2 2 1 0 1 1 2 7 1 20
2006 1 1 2 2 2 1 1 1 1 4 0 16
2007 2 0 2 0 1 1 1 1 2 3 1 14
2008 0 0 0 1 1 0 1 0 0 1 0 4
2009 0 0 1 1 0 0 0 0 1 0 0 3
2010 0 1 2 0 0 0 0 0 0 0 0 3
2011 0 0 0 0 0 0 0 0 0 0 0 0
2012 0 0 1 0 0 0 0 0 0 0 0 1
Total 5 7 13 14 5 4 5 8 10 45 5 121
Notes: This table displays the sample of European biotechnology firms and the year of IPO or introduction. In an
IPO, shares are sold in connection with the listing. In contrast, in an introduction there are no sales of shares in
connection with the listing. In total, 121 firms became publicly listed, of which 112 have made an IPO and 9
have been introduced. Source: Thomson Reuters Datastream Database.
R&D announcements
Essays one, two and three are based on a hand-collected sample of R&D announcements
made by the sample of post-IPO firms. R&D announcements are primarily collected from
corporate websites and the Factiva database. The final sample comprises 1,071 R&D
announcements made by the sample of post-IPO firms between 1998 and 2012 and is reported
in Table 3. R&D announcements are classified according to stage of development and on a
good news-bad news ranking. The stages of development are briefly discussed below and a
more comprehensive description is detailed in Section 6.2.
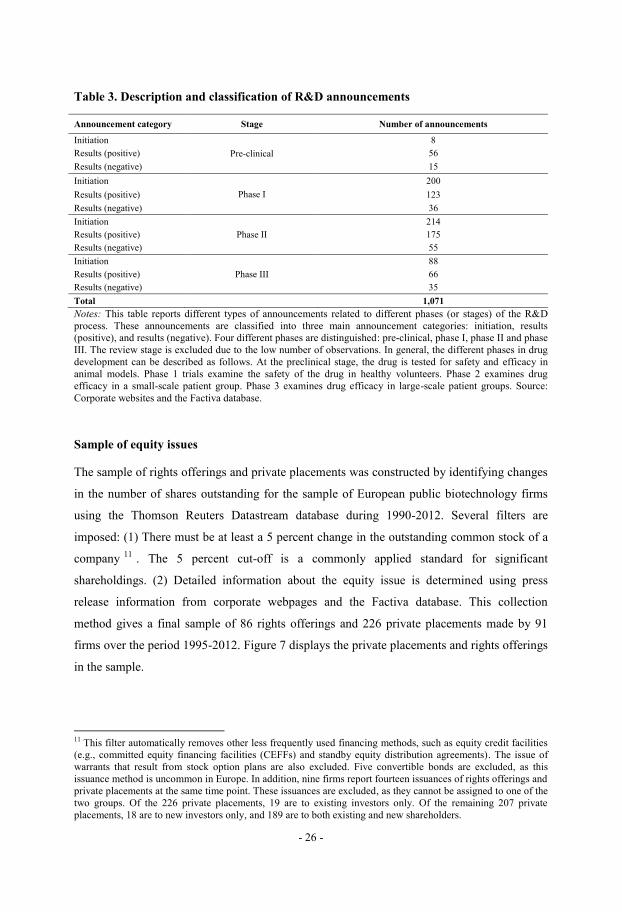
- 26 -
Table 3. Description and classification of R&D announcements
Announcement category Stage Number of announcements
Initiation
Pre-clinical
8
Results (positive) 56
Results (negative) 15
Initiation
Phase I
200
Results (positive) 123
Results (negative) 36
Initiation
Phase II
214
Results (positive) 175
Results (negative) 55
Initiation
Phase III
88
Results (positive) 66
Results (negative) 35
Total 1,071
Notes: This table reports different types of announcements related to different phases (or stages) of the R&D
process. These announcements are classified into three main announcement categories: initiation, results
(positive), and results (negative). Four different phases are distinguished: pre-clinical, phase I, phase II and phase
III. The review stage is excluded due to the low number of observations. In general, the different phases in drug
development can be described as follows. At the preclinical stage, the drug is tested for safety and efficacy in
animal models. Phase 1 trials examine the safety of the drug in healthy volunteers. Phase 2 examines drug
efficacy in a small-scale patient group. Phase 3 examines drug efficacy in large-scale patient groups. Source:
Corporate websites and the Factiva database.
Sample of equity issues
The sample of rights offerings and private placements was constructed by identifying changes
in the number of shares outstanding for the sample of European public biotechnology firms
using the Thomson Reuters Datastream database during 1990-2012. Several filters are
imposed: (1) There must be at least a 5 percent change in the outstanding common stock of a
company11
. The 5 percent cut-off is a commonly applied standard for significant
shareholdings. (2) Detailed information about the equity issue is determined using press
release information from corporate webpages and the Factiva database. This collection
method gives a final sample of 86 rights offerings and 226 private placements made by 91
firms over the period 1995-2012. Figure 7 displays the private placements and rights offerings
in the sample.
11
This filter automatically removes other less frequently used financing methods, such as equity credit facilities
(e.g., committed equity financing facilities (CEFFs) and standby equity distribution agreements). The issue of
warrants that result from stock option plans are also excluded. Five convertible bonds are excluded, as this
issuance method is uncommon in Europe. In addition, nine firms report fourteen issuances of rights offerings and
private placements at the same time point. These issuances are excluded, as they cannot be assigned to one of the
two groups. Of the 226 private placements, 19 are to existing investors only. Of the remaining 207 private
placements, 18 are to new investors only, and 189 are to both existing and new shareholders.
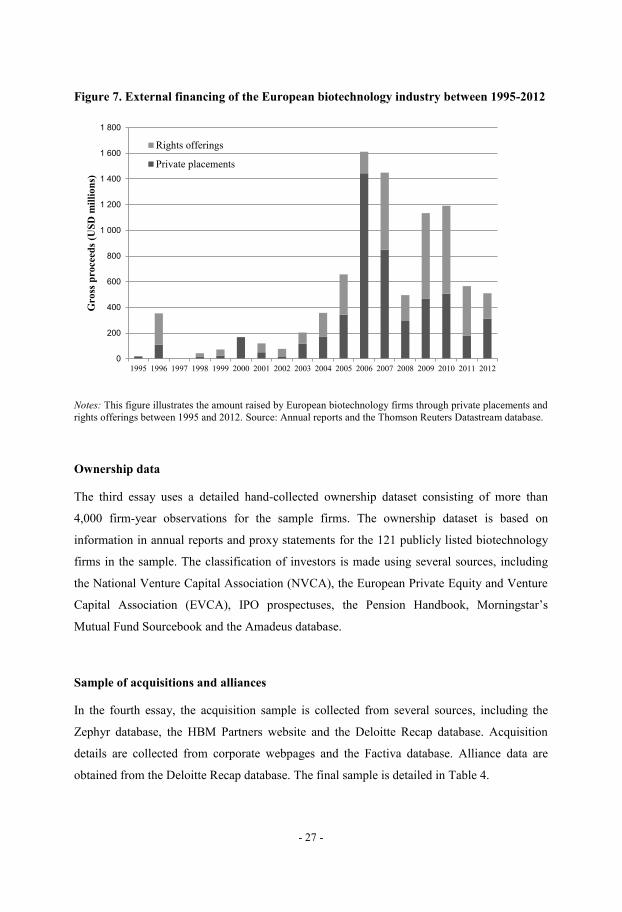
- 27 -
Figure 7. External financing of the European biotechnology industry between 1995-2012
Notes: This figure illustrates the amount raised by European biotechnology firms through private placements and
rights offerings between 1995 and 2012. Source: Annual reports and the Thomson Reuters Datastream database.
Ownership data
The third essay uses a detailed hand-collected ownership dataset consisting of more than
4,000 firm-year observations for the sample firms. The ownership dataset is based on
information in annual reports and proxy statements for the 121 publicly listed biotechnology
firms in the sample. The classification of investors is made using several sources, including
the National Venture Capital Association (NVCA), the European Private Equity and Venture
Capital Association (EVCA), IPO prospectuses, the Pension Handbook, Morningstar’s
Mutual Fund Sourcebook and the Amadeus database.
Sample of acquisitions and alliances
In the fourth essay, the acquisition sample is collected from several sources, including the
Zephyr database, the HBM Partners website and the Deloitte Recap database. Acquisition
details are collected from corporate webpages and the Factiva database. Alliance data are
obtained from the Deloitte Recap database. The final sample is detailed in Table 4.
0
200
400
600
800
1 000
1 200
1 400
1 600
1 800
1995 1996 1997 1998 1999 2000 2001 2002 2003 2004 2005 2006 2007 2008 2009 2010 2011 2012
Gro
ss p
roce
eds
(US
D m
illi
on
s)
Rights offerings
Private placements
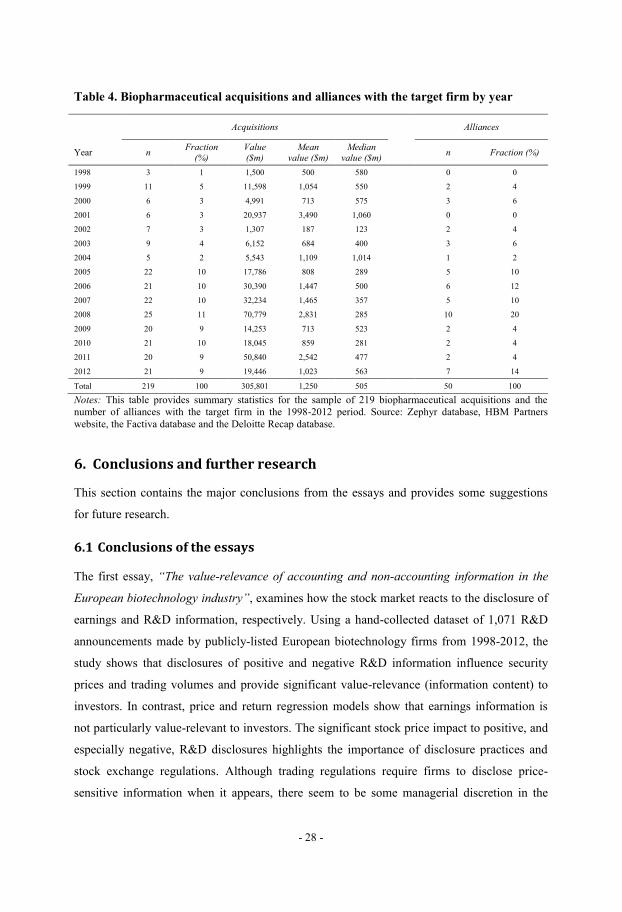
- 28 -
Table 4. Biopharmaceutical acquisitions and alliances with the target firm by year
Acquisitions Alliances
Year n Fraction
(%)
Value
($m)
Mean
value ($m)
Median
value ($m) n Fraction (%)
1998 3 1 1,500 500 580 0 0
1999 11 5 11,598 1,054 550 2 4
2000 6 3 4,991 713 575 3 6
2001 6 3 20,937 3,490 1,060 0 0
2002 7 3 1,307 187 123 2 4
2003 9 4 6,152 684 400 3 6
2004 5 2 5,543 1,109 1,014 1 2
2005 22 10 17,786 808 289 5 10
2006 21 10 30,390 1,447 500 6 12
2007 22 10 32,234 1,465 357 5 10
2008 25 11 70,779 2,831 285 10 20
2009 20 9 14,253 713 523 2 4
2010 21 10 18,045 859 281 2 4
2011 20 9 50,840 2,542 477 2 4
2012 21 9 19,446 1,023 563 7 14
Total 219 100 305,801 1,250 505 50 100
Notes: This table provides summary statistics for the sample of 219 biopharmaceutical acquisitions and the
number of alliances with the target firm in the 1998-2012 period. Source: Zephyr database, HBM Partners
website, the Factiva database and the Deloitte Recap database.
6. Conclusions and further research
This section contains the major conclusions from the essays and provides some suggestions
for future research.
6.1 Conclusions of the essays
The first essay, “The value-relevance of accounting and non-accounting information in the
European biotechnology industry”, examines how the stock market reacts to the disclosure of
earnings and R&D information, respectively. Using a hand-collected dataset of 1,071 R&D
announcements made by publicly-listed European biotechnology firms from 1998-2012, the
study shows that disclosures of positive and negative R&D information influence security
prices and trading volumes and provide significant value-relevance (information content) to
investors. In contrast, price and return regression models show that earnings information is
not particularly value-relevant to investors. The significant stock price impact to positive, and
especially negative, R&D disclosures highlights the importance of disclosure practices and
stock exchange regulations. Although trading regulations require firms to disclose price-
sensitive information when it appears, there seem to be some managerial discretion in the
- 29 -
wording of clinical trial announcements, which shed lights of the importance of a robust
framework regarding the information content in press releases.
The second essay, “Market timing and equity financing decisions”, investigates the two views
of equity market timing, mispricing and adverse selection costs, in the context of whether to
issue equity. The study is based on a sample of 250 seasoned equity offerings made by
publicly listed European biotechnology firms from 1998-2012. The primary motive to issue
equity is due to a short-term need for cash as the average survival time at the announcement
date is less than 7 months. The results of the study find support for both the adverse selection
cost hypothesis and the mispricing hypothesis. They are significant explanatory factors on a
stand-alone basis, and they provide incremental explanatory power beyond that of survival
time. The empirical analysis shows that R&D news announcements are positively associated
with issue of new equity, which lends support for the view that corporate managers access
capital markets when there is relatively little asymmetric information between shareholders
and management. In addition, biotechnology stocks generate positive abnormal returns in the
period preceding the equity issue announcement and negative abnormal returns thereafter,
which indicates that corporate managers can predict future stock returns better than investors
can. During the last decade, a large body of research has focused on the idea that market
timing is about opportunistic managers trying to capitalize on temporary mispricing. This
study shows that the adverse selection cost theory seems to be, at least, an equally important
factor in the equity issuance decision.
The third essay, “Information asymmetry, R&D disclosures and the choice of equity-selling
mechanisms”, analyzes the impact of information asymmetry and corporate management
monitoring on the choice between the two most common equity-selling mechanisms outside
the US: rights offerings and private placements. The empirical study is based on 86 rights
offerings and 226 private placements made by publicly listed European biotechnology firms
during the 1995-2012 period. The results show that biotechnology firms tend to issue equity
publicly rather than privately following the disclosures of R&D news announcements, i.e.,
when information asymmetry is low. However, there is no support for the monitoring
hypothesis. A detailed analysis of investor identities show that confirms that monitoring does
not seem to be an important determinant in the choice of equity-selling mechanisms. Several
proxies, such as firm size and firm age, for measuring the degree of asymmetric information
are frequently used in the literature. These proxies reflect not only information asymmetry but
also several firm and market characteristics (Aboody and Lev, 2000) and do not fit well with
- 30 -
the time-varying asymmetric information model developed by Korajczyk et al. (1991, 1992).
This paper verifies the importance of information asymmetry, using R&D disclosures as a
proxy for information asymmetry, and adds to the growing literature addressing the choice
between private and public financing.
The fourth essay, “Acquisitions, alliances and post-acquisition R&D performance”, examines
the short-term and real long-term performance of acquisitions and their association with
alliances. The study is based on a sample of 219 biopharmaceutical acquisitions from 1998-
2012. Contrary to past research, this study finds no association between having a prior
alliance with target firms and bidder returns at the acquisition announcement. Using a hand-
collected dataset of 383 R&D projects, the study finds that R&D projects that are co-
developed prior to the acquisition are no more likely to advance to subsequent stages of
development than are R&D projects that are not preceded by alliances. Even though an
alliance provides an opportunity for an acquiring firm to learn more about the quality of the
target firm’s asset, it may not eliminate problems associated with information asymmetry. A
key advantage of examining the post-acquisition R&D performance in this setting is the
isolation of imperfect information, whereas the performance of out-licensed R&D projects
can be either driven by imperfect information (lower-quality R&D projects that are licensed
out) or perfect information (R&D projects are licensed out due to gains-from-trade). This
study contributes to the acquisition literature by providing an alternative measure of analyzing
transaction success in the post-acquisition period.
6.2 Future research
The empirical results from the essays have led to several interesting research questions for
future research. In the corporate financing of R&D, future research can investigate questions
such as: How does the private/public equity choice interact with alliance funding? What is the
relation between capital requirement and the choice of equity-selling mechanism? To what
extent are firms able to use both private placements and rights offerings (i.e. use a private
placement to reduce information asymmetry and at the same time issue equity via a rights
offering)? What is the association between the disclosure of accounting information and the
choice of equity-selling mechanism in industries where accounting information provide
investors with value relevant information? How are private placement investors chosen and
what types of investors are likely to participate in private placements? What is the relationship
between future performance of an R&D project and the choice of equity-selling mechanisms?
- 31 -
What is the association between future performance of an R&D project and managerial
participation in the equity issue? How are firm managers working to attract long-term public
investors that are willing to commit funding in the post-IPO period after venture investors
liquidate their investments? Is there a potential monitoring gap problem following the
departure of venture capital investors from the board before they are replaced with new
blockholders?
In corporate takeovers, future research can examine when alliances are an alternative to
acquisitions and when they are complementary. Additional research topics could include the
determinants of significant bid premiums and whether there is a winner’s curse in the
biopharmaceutical industry. Further research on corporate financing of R&D and corporate
takeovers seems promising.
7. The biotechnology industry
This section provides an introduction and overview of the biotechnology industry, which is
the industry that the four essays address. Although reading this section is not a prerequisite
before moving to the four essays, it details some of the characteristics and key features that
may guide and help the reader in understanding the essays.
7.1 Definition of biotechnology
The word “biotechnology” is generally defined as the use of living systems and organisms to
develop products for specific use. The term is most frequently associated with the healthcare
industry/business and the use of various technologies to discover and develop new drugs for
human diseases.
In this dissertation, when a “biotechnology” company is referred to, the definition common
among industry practitioners is employed: “a firm that engages in the research and
development of drugs and was founded after Genentech (1976)” (Nicholson et al., 2005).
Therefore, companies developing tools, instruments, devices or providing technology-based
services to other healthcare companies are excluded. Genentech is generally thought of as the
first12
biotechnology company that sought to produce biologics (i.e., therapeutics derived
from molecules present in the human body) rather than the chemical compounds (i.e., small
molecules) being developed by established pharmaceutical firms. Early definitions of
12
In fact, Cetus Corporation was the first biotechnology company and was established in California in 1971,
while Genentech was the first biotechnology company to become publicly listed (1980).
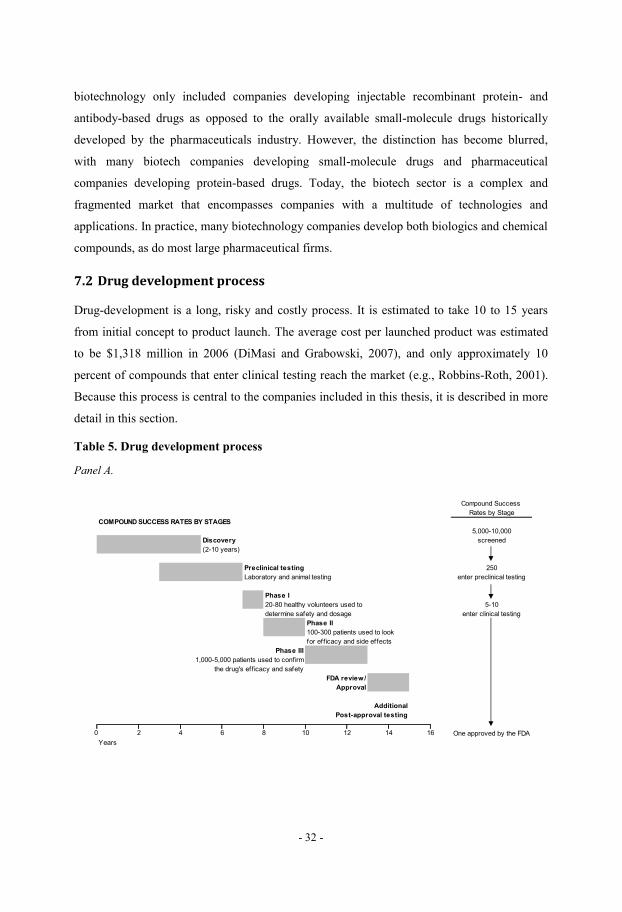
- 32 -
biotechnology only included companies developing injectable recombinant protein- and
antibody-based drugs as opposed to the orally available small-molecule drugs historically
developed by the pharmaceuticals industry. However, the distinction has become blurred,
with many biotech companies developing small-molecule drugs and pharmaceutical
companies developing protein-based drugs. Today, the biotech sector is a complex and
fragmented market that encompasses companies with a multitude of technologies and
applications. In practice, many biotechnology companies develop both biologics and chemical
compounds, as do most large pharmaceutical firms.
7.2 Drug development process
Drug-development is a long, risky and costly process. It is estimated to take 10 to 15 years
from initial concept to product launch. The average cost per launched product was estimated
to be $1,318 million in 2006 (DiMasi and Grabowski, 2007), and only approximately 10
percent of compounds that enter clinical testing reach the market (e.g., Robbins-Roth, 2001).
Because this process is central to the companies included in this thesis, it is described in more
detail in this section.
Table 5. Drug development process
Panel A.
Compound Success
Rates by Stage
COMPOUND SUCCESS RATES BY STAGES
5,000-10,000
Discovery screened
(2-10 years)
Preclinical testing 250
Laboratory and animal testing enter preclinical testing
Phase I
20-80 healthy volunteers used to 5-10
determine safety and dosage enter clinical testing
Phase II
100-300 patients used to look
for eff icacy and side effects
Phase III
1,000-5,000 patients used to confirm
the drug's eff icacy and safety
FDA review/
Approval
Additional
Post-approval testing
One approved by the FDA
Years
10 12 14 160 2 4 6 8
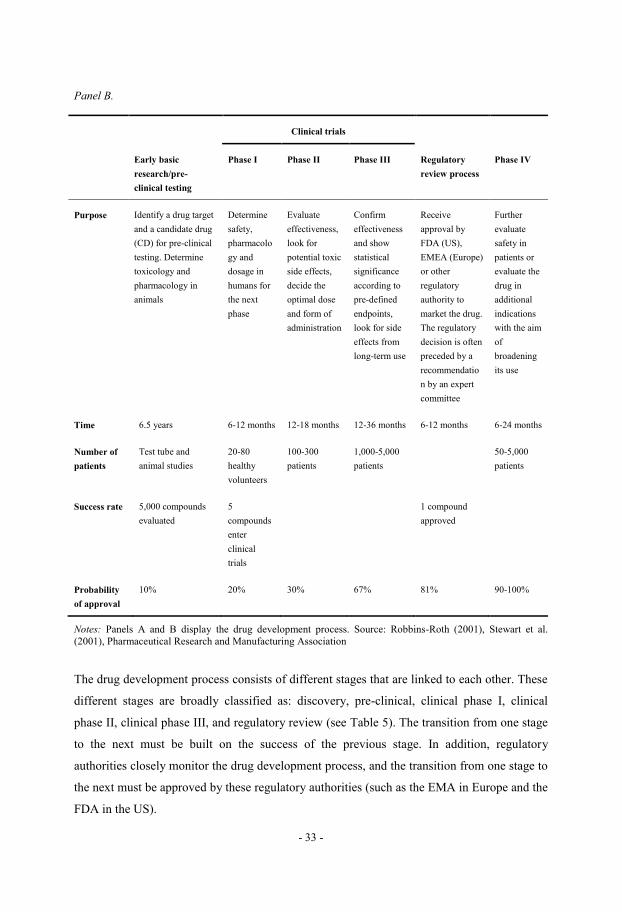
- 33 -
Panel B.
Clinical trials
Early basic
research/pre-
clinical testing
Phase I Phase II Phase III Regulatory
review process
Phase IV
Purpose Identify a drug target
and a candidate drug
(CD) for pre-clinical
testing. Determine
toxicology and
pharmacology in
animals
Determine
safety,
pharmacolo
gy and
dosage in
humans for
the next
phase
Evaluate
effectiveness,
look for
potential toxic
side effects,
decide the
optimal dose
and form of
administration
Confirm
effectiveness
and show
statistical
significance
according to
pre-defined
endpoints,
look for side
effects from
long-term use
Receive
approval by
FDA (US),
EMEA (Europe)
or other
regulatory
authority to
market the drug.
The regulatory
decision is often
preceded by a
recommendatio
n by an expert
committee
Further
evaluate
safety in
patients or
evaluate the
drug in
additional
indications
with the aim
of
broadening
its use
Time 6.5 years 6-12 months 12-18 months 12-36 months 6-12 months 6-24 months
Number of
patients
Test tube and
animal studies
20-80
healthy
volunteers
100-300
patients
1,000-5,000
patients
50-5,000
patients
Success rate 5,000 compounds
evaluated
5
compounds
enter
clinical
trials
1 compound
approved
Probability
of approval
10% 20% 30% 67% 81% 90-100%
Notes: Panels A and B display the drug development process. Source: Robbins-Roth (2001), Stewart et al.
(2001), Pharmaceutical Research and Manufacturing Association
The drug development process consists of different stages that are linked to each other. These
different stages are broadly classified as: discovery, pre-clinical, clinical phase I, clinical
phase II, clinical phase III, and regulatory review (see Table 5). The transition from one stage
to the next must be built on the success of the previous stage. In addition, regulatory
authorities closely monitor the drug development process, and the transition from one stage to
the next must be approved by these regulatory authorities (such as the EMA in Europe and the
FDA in the US).
- 34 -
Drug discovery and pre-clinical development
The drug discovery process differs for small molecules and for protein therapeutic agents. In
traditional drug discovery of small molecules, which historically has been employed by
pharmaceutical companies, the process begins with a multitude of chemical compounds that
are screened against different types of disease models. As soon as an in vitro (in the test tube)
assay has been established for a selected target, researchers can begin to screen for potential
hits. These screening processes are carried out in automated processes, a process referred to as
high-throughput screening (HTS), in which several hundred thousand compounds can be
screened during a single day. One or several compounds with the most appropriate properties
are then selected and are called the lead compounds. A process called lead optimization
follows, when the lead compounds are chemically modified to further improve their
characteristics suited for the specific target.
The discovery process for protein therapeutics agents such as monoclonal antibodies can
generally be divided into five stages: target validation, screening preparation, hit generation
and lead selection, lead optimization and characterization, and candidate selection. In the first
stage, evidence is collected to support the target rationale and experimentally validate the
target in, e.g., an animal model. In the screening preparation stage, an assay is developed. The
next stage involves generating antibody hits using a technology (such as hybridoma
technology) and selecting lead compounds. In the lead optimization and characterization
stage, several techniques can be employed, such as humanization and Fc engineering, along
an exploratory safety study leading to the selection of a clinical candidate monoclonal
antibody.
The main objectives of pre-clinical studies are to determine a candidate drug’s (CD) safety
profile in animals by evaluating the toxicology profile. Studies of a drug’s toxicity generally
include the organs targeted by the drug and whether there are any potential long-term cancer
effects or toxic effects on mammalian reproduction. Typically, both in vitro and in vivo tests
are performed. After the testing has been successfully completed, to legally test the drug in
humans the company must first obtain an investigational new drug (IND) designation from
the regulatory authorities. The regulatory authorities, such as the FDA and EMA, use a default
procedure in which the sponsor can start clinical trials if the sponsor is not contacted within
30 days.
- 35 -
Phase I
In clinical phase I, the candidate drug is tested on a small group of healthy volunteers. The
aim of this phase is to evaluate the drug’s safety and side-effect profile in humans. This is
performed by administering the drug in a series of escalating doses and examine how the drug
is absorbed, distributed, metabolized and excreted (ADME) in the human body, and then to
establish the appropriate dose and dosage interval that will have a positive effect on the
disease without causing undesirable side-effects. Phase I trials generally include a small
number of healthy volunteers (usually 20-80). However, in certain indications, such as HIV
and cancer, the regulatory authorities allow patients with the disease to participate (in which
case it is called a phase I/II). Several side effects occur at a very low frequency and,
consequently, do not appear in earlier clinical trials.
Phase II
In clinical phase II, the drug is tested in a larger group of patients (usually 100-300). The
purpose is to demonstrate the drug’s efficacy and to confirm its safety. Phase II trials may also
include comparisons with a group receiving an inactive placebo treatment or sometimes with
an active comparator (i.e., an already approved drug on the market) as a control. In addition,
phase II trials are sometimes studied in subgroups of patients, e.g., in patients with different
solid tumors, to see if the drug is broadly efficient or only works in certain cancers. Phase II
trials generally take 12-18 months to complete.
Phase III
In clinical phase III, which is sometimes referred to as confirmatory studies or pivotal trials,
the drug’s efficacy and safety is studied in larger patient groups (usually 1,000-5,000). The
main objective is to show a statistically significant difference between patients on drugs and
those on placebo (or standard treatment). The data from the clinical trial sites are collected,
and the database is locked and evaluated. If the results are positive, the data is put into a file
and sent to regulatory authorities requesting marketing approval.
Regulatory review
When all pre-clinical and clinical data have been collected and sent to the FDA and the
EMEA, the application is called a New Drug Application (NDA) in the US if it is a small
molecule/organic chemical entity and a Biological License Application (BLA) if the potential
drug is a protein-based product or vaccine.
- 36 -
Once the NDA/BLA is submitted, the FDA has 30 days to inform the company of whether it
will accept the filing. If the NDA/BLA is found insufficiently complete, which is relatively
uncommon, the FDA rejects the application with the issue of a so called ‘Refuse to File
letter’. The review of the NDA/BLA is performed by either the Center for Drug Evaluation
and Research (CDER) or the Center for Biologics Evaluation and Research (CBER). The
FDA will also decide whether the NDA/BLA will receive a standard or accelerated review. A
standard review implies that the FDA will complete its review within approximately 10
months, while a priority review (as a result of the FDA Modernization Act of 1997) should be
completed within six months. Once the FDA has approved the NDA/BLA, the new drug can
be legally marketed.
7.3 Evolution of the biotechnology industry
The biotechnology industry emerged in the US in the late 1970s and early 1980s. The basic
idea was that through improved technology and a better understanding of biological processes,
the R&D process would become more efficient, faster, less risky and cheaper (Pisano, 2006).
The research was based on a new technology called recombinant DNA technology, which
made use of genetic engineering to synthesize proteins by inserting a certain gene (which
codes for a protein) into bacteria or other cell cultures to produce protein for human use. The
technology used to produce certain key proteins in large quantities offered a significant
market opportunity because it could displace the costly extraction from animal sources (e.g.,
pigs, cattle and human cadavers). In October 1982, Humulin, developed by researchers at
Amgen for the treatment of insulin-dependent diabetes, became the first-ever approved
genetically engineered human therapeutic. Humulin (recombinant human insulin) was
synthesized by inserting the human insulin gene into bacteria (E. coli), which started to
produce human insulin. Humulin was licensed to and developed in partnership with the
insulin manufacturer Eli Lilly.
The second approved drug in the biotechnology history was Protropin (developed by
Genentech), a supplementary growth hormone for children with growth hormone deficiency
(so-called pituitary dwarfism). Protropin was approved by the US FDA in 1985. Before
growth hormone could be produced in large quantities using recombinant DNA technology,
the hormone was extracted from the pituitary glands of human cadavers, which was very
costly. A standard two-year treatment with natural growth hormones required extraction from
as many as fifty to a hundred human pituitaries (Elkington, 1985). Within a year after
- 37 -
Protropin was approved, patients were paying as much as $10,000-15,000 a year for a drug
that the US government had earlier distributed for free (Hall, 2006).
While the identification and isolation of a certain gene coding for a protein could be a very
time-consuming and challenging task in itself, genetic engineering presented political, social,
ethical, regulatory and legal challenges (Binder, 2008; Smith Hughes, 2011). For example,
questions were raised regarding the patentability of life and living organisms. Others
questioned what potential harm this new technology could do to humans, and few people
understood the unproven technology, which made it difficult to attract investors.
A key milestone in the biotechnology industry was the successful initial public offering (IPO)
of Genentech (Genetic Engineering Technology), the first biotechnology company to become
publicly listed, on October 14, 198013
. At the time Genentech went public, it had either sales
revenues or a product on (or even near) the market. Companies at the time usually waited
until they had one or more products on or very near the market and at least some sales
revenues before going public. Two reforms played a key role in enhancing investment in the
biotechnology industry: 1) In 1978, the US congress reduced the capital gains tax rate from 48
to 28 percent to induce investment. 2) The US Department of Labor removed the Employee
Retirement Income Security Act as a barrier to venture investing, i.e., restrictions were
removed on pension funds from investing in venture capital. Consequently, venture capital
financing increased from less than $600 million in 1980 to $4.6 billion in 1986 (Binder, 2008).
The Genentech IPO generated $38.5 million and tripled its stock price on the first day of
trading14
. The four-year-old firm’s successful IPO demonstrated to venture capitalists that an
investment in biotechnology could achieve liquidity within a timetable of four to six years
even if the company had no product or sales revenues. According to the prospectus, one of the
VC investors, Kleiner & Perkins, owned 938,000 shares with an average price of $1.85 per
share prior to the IPO. However, the early investors in many biotechnology start-ups were
also corporations. For example, two of the largest investors in Amgen’s first round of
financing were Abbott Laboratories and Tosco Corporation of Concord. Abbott Laboratories
was concerned that Amgen might intrude on its diagnostic division and therefore became a
13
According to the prospectus of Genentech, a price range of $25-30 per share and sales of 1 million shares was
expected. However, the IPO priced above the expected price range ($35), and the number of shares was
increased due to strong demand (1.1 million). 14
In the first few minutes of trading, the (GENE) shares increased from $35 to $85, which, at the time, was the
largest gain in stock market history (for a newly listed company), and closed at $71 at the end of the day, valuing
the company at $532 million.
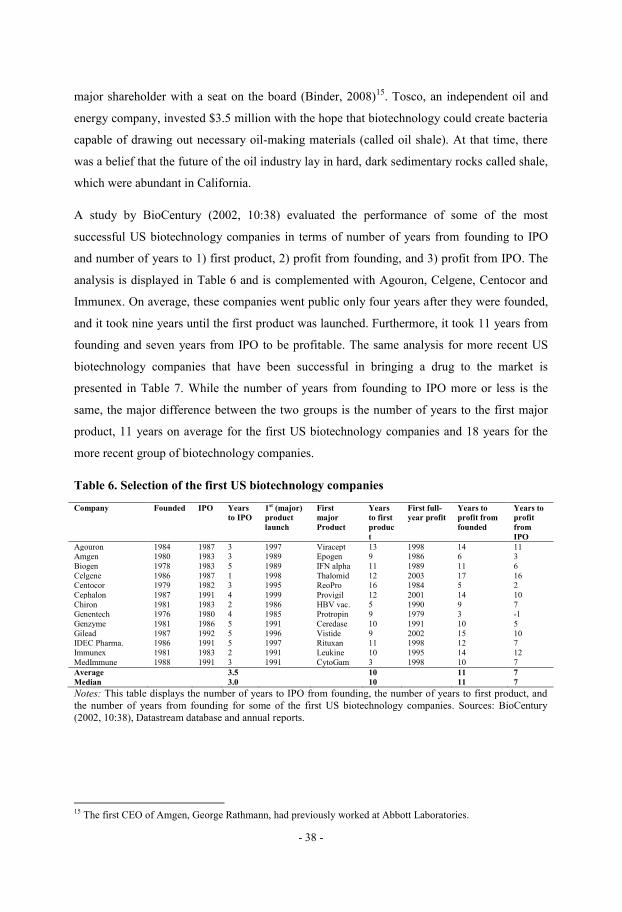
- 38 -
major shareholder with a seat on the board (Binder, 2008)15
. Tosco, an independent oil and
energy company, invested $3.5 million with the hope that biotechnology could create bacteria
capable of drawing out necessary oil-making materials (called oil shale). At that time, there
was a belief that the future of the oil industry lay in hard, dark sedimentary rocks called shale,
which were abundant in California.
A study by BioCentury (2002, 10:38) evaluated the performance of some of the most
successful US biotechnology companies in terms of number of years from founding to IPO
and number of years to 1) first product, 2) profit from founding, and 3) profit from IPO. The
analysis is displayed in Table 6 and is complemented with Agouron, Celgene, Centocor and
Immunex. On average, these companies went public only four years after they were founded,
and it took nine years until the first product was launched. Furthermore, it took 11 years from
founding and seven years from IPO to be profitable. The same analysis for more recent US
biotechnology companies that have been successful in bringing a drug to the market is
presented in Table 7. While the number of years from founding to IPO more or less is the
same, the major difference between the two groups is the number of years to the first major
product, 11 years on average for the first US biotechnology companies and 18 years for the
more recent group of biotechnology companies.
Table 6. Selection of the first US biotechnology companies
Company Founded IPO Years
to IPO
1st (major)
product
launch
First
major
Product
Years
to first
produc
t
First full-
year profit
Years to
profit from
founded
Years to
profit
from
IPO
Agouron 1984 1987 3 1997 Viracept 13 1998 14 11 Amgen 1980 1983 3 1989 Epogen 9 1986 6 3
Biogen 1978 1983 5 1989 IFN alpha 11 1989 11 6
Celgene 1986 1987 1 1998 Thalomid 12 2003 17 16 Centocor 1979 1982 3 1995 ReoPro 16 1984 5 2
Cephalon 1987 1991 4 1999 Provigil 12 2001 14 10
Chiron 1981 1983 2 1986 HBV vac. 5 1990 9 7 Genentech 1976 1980 4 1985 Protropin 9 1979 3 -1
Genzyme 1981 1986 5 1991 Ceredase 10 1991 10 5
Gilead 1987 1992 5 1996 Vistide 9 2002 15 10 IDEC Pharma. 1986 1991 5 1997 Rituxan 11 1998 12 7
Immunex 1981 1983 2 1991 Leukine 10 1995 14 12
MedImmune 1988 1991 3 1991 CytoGam 3 1998 10 7
Average 3.5 10 11 7
Median 3.0 10 11 7
Notes: This table displays the number of years to IPO from founding, the number of years to first product, and
the number of years from founding for some of the first US biotechnology companies. Sources: BioCentury
(2002, 10:38), Datastream database and annual reports.
15
The first CEO of Amgen, George Rathmann, had previously worked at Abbott Laboratories.
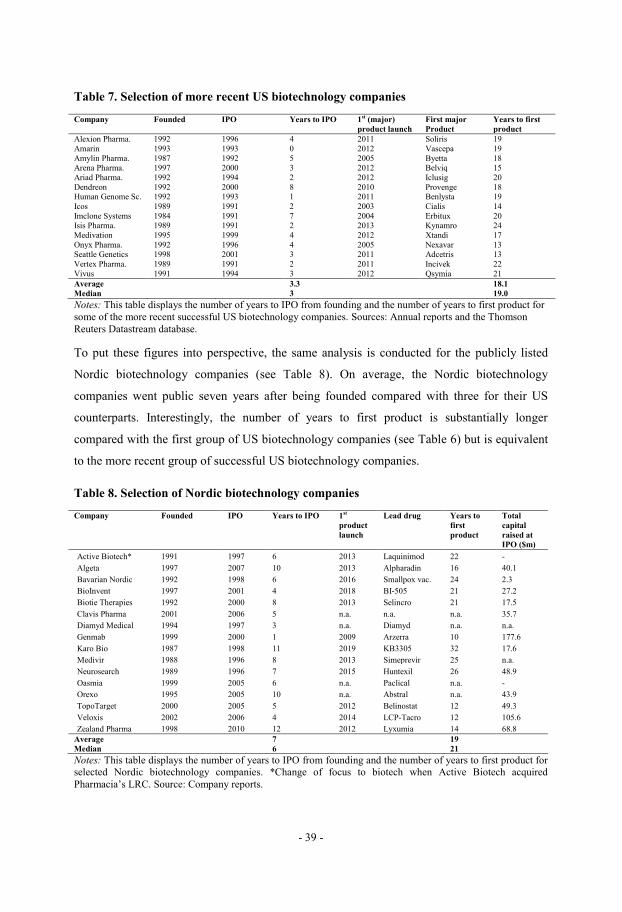
- 39 -
Table 7. Selection of more recent US biotechnology companies
Company Founded IPO Years to IPO 1st (major)
product launch
First major
Product
Years to first
product
Alexion Pharma. 1992 1996 4 2011 Soliris 19
Amarin 1993 1993 0 2012 Vascepa 19
Amylin Pharma. 1987 1992 5 2005 Byetta 18 Arena Pharma. 1997 2000 3 2012 Belviq 15
Ariad Pharma. 1992 1994 2 2012 Iclusig 20
Dendreon 1992 2000 8 2010 Provenge 18 Human Genome Sc. 1992 1993 1 2011 Benlysta 19
Icos 1989 1991 2 2003 Cialis 14
Imclone Systems 1984 1991 7 2004 Erbitux 20 Isis Pharma. 1989 1991 2 2013 Kynamro 24
Medivation 1995 1999 4 2012 Xtandi 17
Onyx Pharma. 1992 1996 4 2005 Nexavar 13 Seattle Genetics 1998 2001 3 2011 Adcetris 13
Vertex Pharma. 1989 1991 2 2011 Incivek 22
Vivus 1991 1994 3 2012 Qsymia 21
Average 3.3 18.1
Median 3 19.0
Notes: This table displays the number of years to IPO from founding and the number of years to first product for
some of the more recent successful US biotechnology companies. Sources: Annual reports and the Thomson
Reuters Datastream database.
To put these figures into perspective, the same analysis is conducted for the publicly listed
Nordic biotechnology companies (see Table 8). On average, the Nordic biotechnology
companies went public seven years after being founded compared with three for their US
counterparts. Interestingly, the number of years to first product is substantially longer
compared with the first group of US biotechnology companies (see Table 6) but is equivalent
to the more recent group of successful US biotechnology companies.
Table 8. Selection of Nordic biotechnology companies
Company Founded IPO Years to IPO 1st
product
launch
Lead drug Years to
first
product
Total
capital
raised at
IPO ($m)
Active Biotech* 1991 1997 6 2013 Laquinimod 22 -
Algeta 1997 2007 10 2013 Alpharadin 16 40.1
Bavarian Nordic 1992 1998 6 2016 Smallpox vac. 24 2.3
BioInvent 1997 2001 4 2018 BI-505 21 27.2
Biotie Therapies 1992 2000 8 2013 Selincro 21 17.5
Clavis Pharma 2001 2006 5 n.a. n.a. n.a. 35.7
Diamyd Medical 1994 1997 3 n.a. Diamyd n.a. n.a.
Genmab 1999 2000 1 2009 Arzerra 10 177.6
Karo Bio 1987 1998 11 2019 KB3305 32 17.6
Medivir 1988 1996 8 2013 Simeprevir 25 n.a.
Neurosearch 1989 1996 7 2015 Huntexil 26 48.9
Oasmia 1999 2005 6 n.a. Paclical n.a. -
Orexo 1995 2005 10 n.a. Abstral n.a. 43.9
TopoTarget 2000 2005 5 2012 Belinostat 12 49.3
Veloxis 2002 2006 4 2014 LCP-Tacro 12 105.6
Zealand Pharma 1998 2010 12 2012 Lyxumia 14 68.8
Average 7 19
Median 6 21
Notes: This table displays the number of years to IPO from founding and the number of years to first product for
selected Nordic biotechnology companies. *Change of focus to biotech when Active Biotech acquired
Pharmacia’s LRC. Source: Company reports.
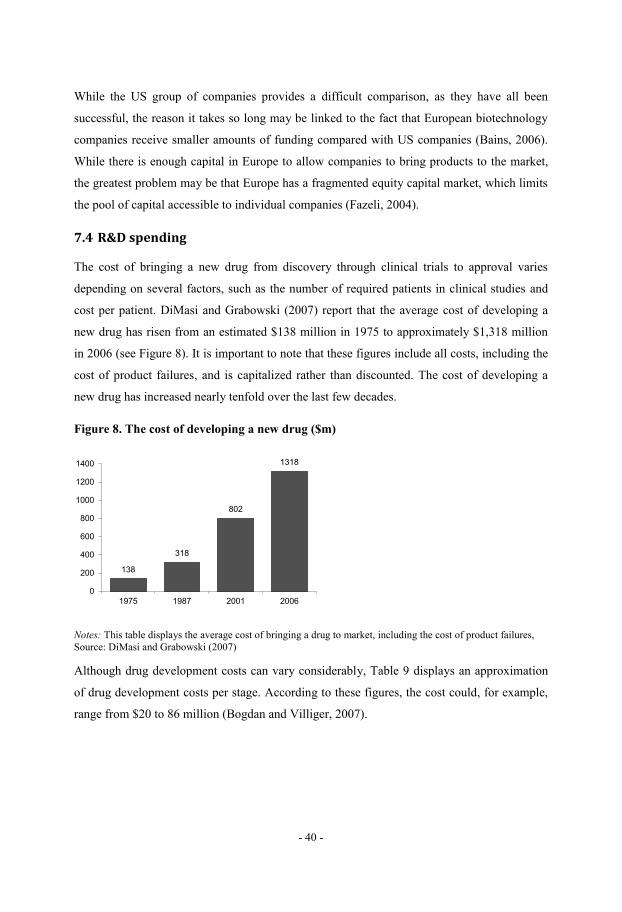
- 40 -
While the US group of companies provides a difficult comparison, as they have all been
successful, the reason it takes so long may be linked to the fact that European biotechnology
companies receive smaller amounts of funding compared with US companies (Bains, 2006).
While there is enough capital in Europe to allow companies to bring products to the market,
the greatest problem may be that Europe has a fragmented equity capital market, which limits
the pool of capital accessible to individual companies (Fazeli, 2004).
7.4 R&D spending
The cost of bringing a new drug from discovery through clinical trials to approval varies
depending on several factors, such as the number of required patients in clinical studies and
cost per patient. DiMasi and Grabowski (2007) report that the average cost of developing a
new drug has risen from an estimated $138 million in 1975 to approximately $1,318 million
in 2006 (see Figure 8). It is important to note that these figures include all costs, including the
cost of product failures, and is capitalized rather than discounted. The cost of developing a
new drug has increased nearly tenfold over the last few decades.
Figure 8. The cost of developing a new drug ($m)
Notes: This table displays the average cost of bringing a drug to market, including the cost of product failures,
Source: DiMasi and Grabowski (2007)
Although drug development costs can vary considerably, Table 9 displays an approximation
of drug development costs per stage. According to these figures, the cost could, for example,
range from $20 to 86 million (Bogdan and Villiger, 2007).
138
318
802
1318
0
200
400
600
800
1000
1200
1400
1975 1987 2001 2006
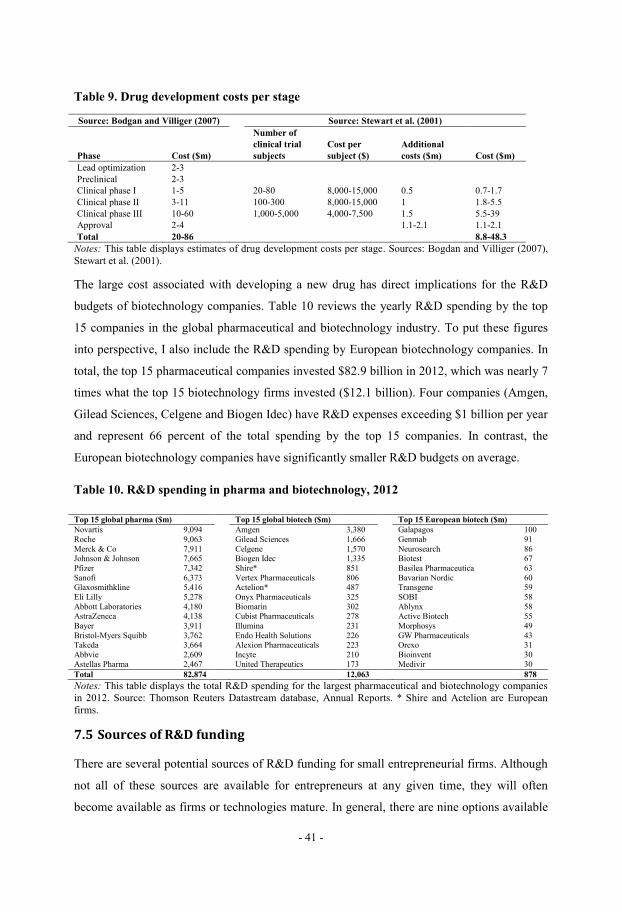
- 41 -
Table 9. Drug development costs per stage
Source: Bodgan and Villiger (2007) Source: Stewart et al. (2001)
Phase Cost ($m)
Number of
clinical trial
subjects
Cost per
subject ($)
Additional
costs ($m) Cost ($m)
Lead optimization 2-3
Preclinical 2-3
Clinical phase I 1-5 20-80 8,000-15,000 0.5 0.7-1.7
Clinical phase II 3-11 100-300 8,000-15,000 1 1.8-5.5
Clinical phase III 10-60 1,000-5,000 4,000-7,500 1.5 5.5-39
Approval 2-4 1.1-2.1 1.1-2.1
Total 20-86 8.8-48.3
Notes: This table displays estimates of drug development costs per stage. Sources: Bogdan and Villiger (2007),
Stewart et al. (2001).
The large cost associated with developing a new drug has direct implications for the R&D
budgets of biotechnology companies. Table 10 reviews the yearly R&D spending by the top
15 companies in the global pharmaceutical and biotechnology industry. To put these figures
into perspective, I also include the R&D spending by European biotechnology companies. In
total, the top 15 pharmaceutical companies invested $82.9 billion in 2012, which was nearly 7
times what the top 15 biotechnology firms invested ($12.1 billion). Four companies (Amgen,
Gilead Sciences, Celgene and Biogen Idec) have R&D expenses exceeding $1 billion per year
and represent 66 percent of the total spending by the top 15 companies. In contrast, the
European biotechnology companies have significantly smaller R&D budgets on average.
Table 10. R&D spending in pharma and biotechnology, 2012
Top 15 global pharma ($m) Top 15 global biotech ($m) Top 15 European biotech ($m)
Novartis 9,094 Amgen 3,380 Galapagos 100
Roche 9,063 Gilead Sciences 1,666 Genmab 91
Merck & Co 7,911 Celgene 1,570 Neurosearch 86 Johnson & Johnson 7,665 Biogen Idec 1,335 Biotest 67
Pfizer 7,342 Shire* 851 Basilea Pharmaceutica 63
Sanofi 6,373 Vertex Pharmaceuticals 806 Bavarian Nordic 60 Glaxosmithkline 5,416 Actelion* 487 Transgene 59
Eli Lilly 5,278 Onyx Pharmaceuticals 325 SOBI 58
Abbott Laboratories 4,180 Biomarin 302 Ablynx 58 AstraZeneca 4,138 Cubist Pharmaceuticals 278 Active Biotech 55
Bayer 3,911 Illumina 231 Morphosys 49
Bristol-Myers Squibb 3,762 Endo Health Solutions 226 GW Pharmaceuticals 43 Takeda 3,664 Alexion Pharmaceuticals 223 Orexo 31
Abbvie 2,609 Incyte 210 Bioinvent 30 Astellas Pharma 2,467 United Therapeutics 173 Medivir 30
Total 82,874 12,063 878
Notes: This table displays the total R&D spending for the largest pharmaceutical and biotechnology companies
in 2012. Source: Thomson Reuters Datastream database, Annual Reports. * Shire and Actelion are European
firms.
7.5 Sources of R&D funding
There are several potential sources of R&D funding for small entrepreneurial firms. Although
not all of these sources are available for entrepreneurs at any given time, they will often
become available as firms or technologies mature. In general, there are nine options available

- 42 -
for financing: 1) friends/family, 2) “angel” investors, 3) government, 4) internal corporate
funds, 5) banks, 6) venture capitalists, 7) public debt markets, 8) public equity markets, and 9)
strategic alliance partners (Higgins, 2008; Metrick and Yasuda, 2010).
In the biotechnology industry, many of these options are unavailable primarily due to the
characteristics of drug development. The length of the development life cycle for a successful
product is usually between 10 and 15 years, the costs of developing a drug average $1,318
million (DiMasi and Grabowski, 2007) and less than 10 percent of all drugs entering clinical
trials reach the market (e.g., Robbins-Roth, 2001).
Most biotechnology firms are in an early life-cycle stage and invest heavily on a continuous
basis in intangible assets such as research and development (R&D), but they can rarely fund
these investments internally. In other words, the financing needs of biotechnology firms
typically exceed their capability of generating funds internally. In contrast, pharmaceutical
firms have access to internal corporate funds that can be plowed back into R&D. The
government is unlikely to provide much help in the direct financing of R&D projects,
although there are other benefits associated with R&D tax credits. Although biotechnology
firms hold substantial growth opportunities, banks generally do not provide bank loans (debt
finance) due to the absence of collateral (i.e., assets-in-place). Another source of debt finance,
namely, public debt markets, have increased as a source of financing as the industry has
grown but are primarily only an option for the cash flow positive companies in the sector.
Private biotechnology companies mainly raise funding via private capital (venture capital),
public equity markets (via an initial public offering) and strategic alliance partners. For public
biotechnology companies, the two sources of funding are public equity markets and strategic
alliance partners. Consequently, public biotechnology companies have no other choice but to
regularly ask investors for (equity) finance for their research projects, and a majority of the
biotechnology companies are 100 percent equity-financed. An alternative for both private and
public biotechnology companies is strategic alliance partners. Small biotechnology firms
without significant internal funds or that lack sufficient knowhow related to clinical
development, manufacturing, regulatory expertise, marketing or sales can form a strategic
alliance with a large pharmaceutical company.
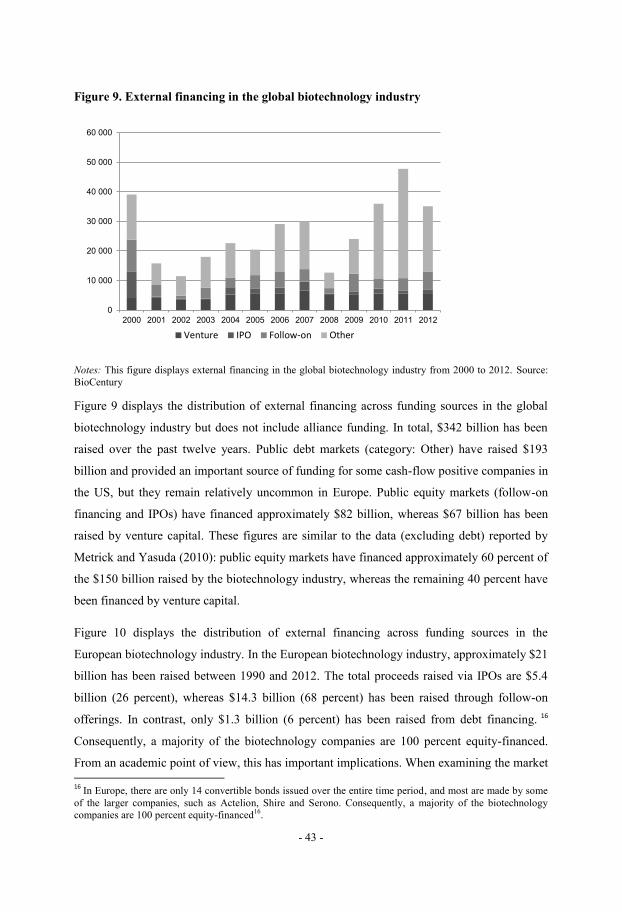
- 43 -
Figure 9. External financing in the global biotechnology industry
Notes: This figure displays external financing in the global biotechnology industry from 2000 to 2012. Source:
BioCentury
Figure 9 displays the distribution of external financing across funding sources in the global
biotechnology industry but does not include alliance funding. In total, $342 billion has been
raised over the past twelve years. Public debt markets (category: Other) have raised $193
billion and provided an important source of funding for some cash-flow positive companies in
the US, but they remain relatively uncommon in Europe. Public equity markets (follow-on
financing and IPOs) have financed approximately $82 billion, whereas $67 billion has been
raised by venture capital. These figures are similar to the data (excluding debt) reported by
Metrick and Yasuda (2010): public equity markets have financed approximately 60 percent of
the $150 billion raised by the biotechnology industry, whereas the remaining 40 percent have
been financed by venture capital.
Figure 10 displays the distribution of external financing across funding sources in the
European biotechnology industry. In the European biotechnology industry, approximately $21
billion has been raised between 1990 and 2012. The total proceeds raised via IPOs are $5.4
billion (26 percent), whereas $14.3 billion (68 percent) has been raised through follow-on
offerings. In contrast, only $1.3 billion (6 percent) has been raised from debt financing. 16
Consequently, a majority of the biotechnology companies are 100 percent equity-financed.
From an academic point of view, this has important implications. When examining the market 16
In Europe, there are only 14 convertible bonds issued over the entire time period, and most are made by some
of the larger companies, such as Actelion, Shire and Serono. Consequently, a majority of the biotechnology
companies are 100 percent equity-financed16
.
0
10 000
20 000
30 000
40 000
50 000
60 000
2000 2001 2002 2003 2004 2005 2006 2007 2008 2009 2010 2011 2012
Venture IPO Follow-on Other
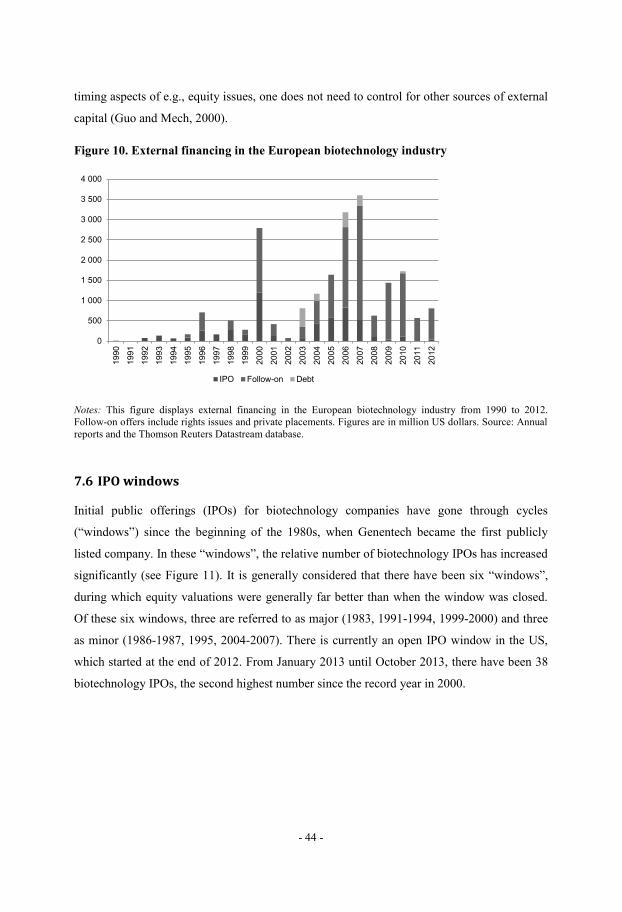
- 44 -
timing aspects of e.g., equity issues, one does not need to control for other sources of external
capital (Guo and Mech, 2000).
Figure 10. External financing in the European biotechnology industry
Notes: This figure displays external financing in the European biotechnology industry from 1990 to 2012.
Follow-on offers include rights issues and private placements. Figures are in million US dollars. Source: Annual
reports and the Thomson Reuters Datastream database.
7.6 IPO windows
Initial public offerings (IPOs) for biotechnology companies have gone through cycles
(“windows”) since the beginning of the 1980s, when Genentech became the first publicly
listed company. In these “windows”, the relative number of biotechnology IPOs has increased
significantly (see Figure 11). It is generally considered that there have been six “windows”,
during which equity valuations were generally far better than when the window was closed.
Of these six windows, three are referred to as major (1983, 1991-1994, 1999-2000) and three
as minor (1986-1987, 1995, 2004-2007). There is currently an open IPO window in the US,
which started at the end of 2012. From January 2013 until October 2013, there have been 38
biotechnology IPOs, the second highest number since the record year in 2000.
0
500
1 000
1 500
2 000
2 500
3 000
3 500
4 000
1990
1991
1992
1993
1994
1995
1996
1997
1998
1999
2000
2001
2002
2003
2004
2005
2006
2007
2008
2009
2010
2011
2012
IPO Follow-on Debt
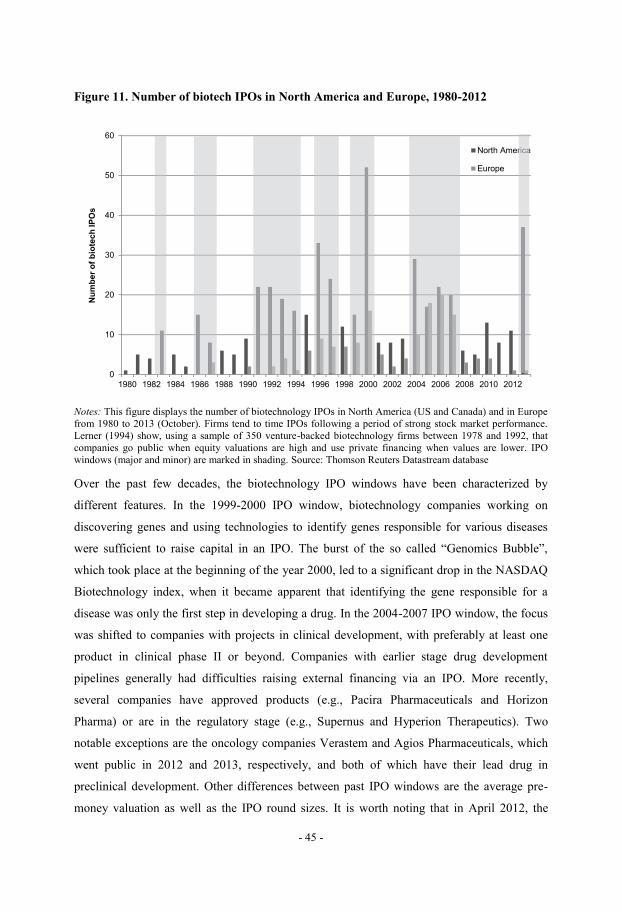
- 45 -
Figure 11. Number of biotech IPOs in North America and Europe, 1980-2012
Notes: This figure displays the number of biotechnology IPOs in North America (US and Canada) and in Europe from 1980 to 2013 (October). Firms tend to time IPOs following a period of strong stock market performance. Lerner (1994) show, using a sample of 350 venture-backed biotechnology firms between 1978 and 1992, that companies go public when equity valuations are high and use private financing when values are lower. IPO windows (major and minor) are marked in shading. Source: Thomson Reuters Datastream database
Over the past few decades, the biotechnology IPO windows have been characterized by
different features. In the 1999-2000 IPO window, biotechnology companies working on
discovering genes and using technologies to identify genes responsible for various diseases
were sufficient to raise capital in an IPO. The burst of the so called “Genomics Bubble”,
which took place at the beginning of the year 2000, led to a significant drop in the NASDAQ
Biotechnology index, when it became apparent that identifying the gene responsible for a
disease was only the first step in developing a drug. In the 2004-2007 IPO window, the focus
was shifted to companies with projects in clinical development, with preferably at least one
product in clinical phase II or beyond. Companies with earlier stage drug development
pipelines generally had difficulties raising external financing via an IPO. More recently,
several companies have approved products (e.g., Pacira Pharmaceuticals and Horizon
Pharma) or are in the regulatory stage (e.g., Supernus and Hyperion Therapeutics). Two
notable exceptions are the oncology companies Verastem and Agios Pharmaceuticals, which
went public in 2012 and 2013, respectively, and both of which have their lead drug in
preclinical development. Other differences between past IPO windows are the average pre-
money valuation as well as the IPO round sizes. It is worth noting that in April 2012, the
0
10
20
30
40
50
60
1980 1982 1984 1986 1988 1990 1992 1994 1996 1998 2000 2002 2004 2006 2008 2010 2012
Num
ber o
f bio
tech
IPO
s
North America
Europe
North America
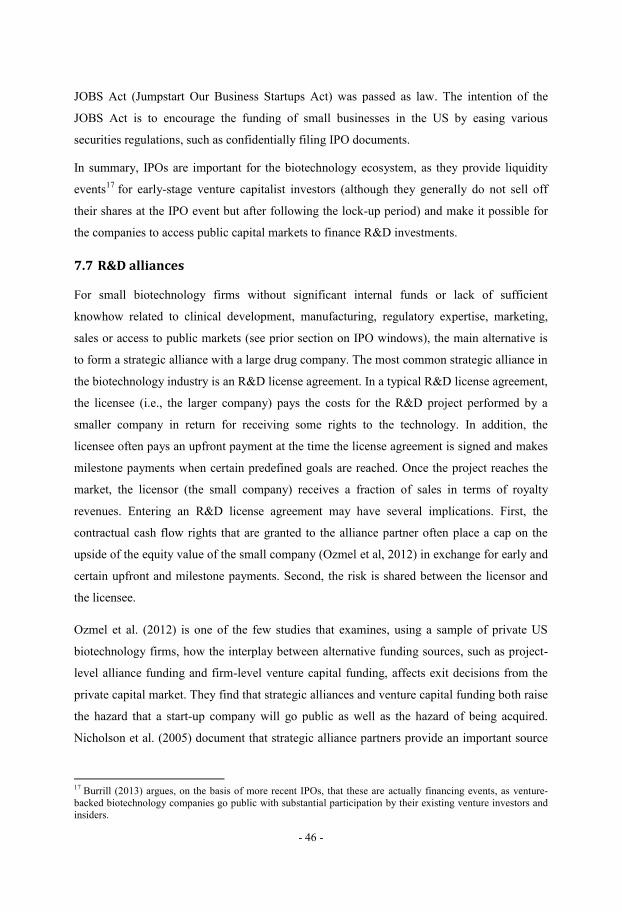
- 46 -
JOBS Act (Jumpstart Our Business Startups Act) was passed as law. The intention of the
JOBS Act is to encourage the funding of small businesses in the US by easing various
securities regulations, such as confidentially filing IPO documents.
In summary, IPOs are important for the biotechnology ecosystem, as they provide liquidity
events17
for early-stage venture capitalist investors (although they generally do not sell off
their shares at the IPO event but after following the lock-up period) and make it possible for
the companies to access public capital markets to finance R&D investments.
7.7 R&D alliances
For small biotechnology firms without significant internal funds or lack of sufficient
knowhow related to clinical development, manufacturing, regulatory expertise, marketing,
sales or access to public markets (see prior section on IPO windows), the main alternative is
to form a strategic alliance with a large drug company. The most common strategic alliance in
the biotechnology industry is an R&D license agreement. In a typical R&D license agreement,
the licensee (i.e., the larger company) pays the costs for the R&D project performed by a
smaller company in return for receiving some rights to the technology. In addition, the
licensee often pays an upfront payment at the time the license agreement is signed and makes
milestone payments when certain predefined goals are reached. Once the project reaches the
market, the licensor (the small company) receives a fraction of sales in terms of royalty
revenues. Entering an R&D license agreement may have several implications. First, the
contractual cash flow rights that are granted to the alliance partner often place a cap on the
upside of the equity value of the small company (Ozmel et al, 2012) in exchange for early and
certain upfront and milestone payments. Second, the risk is shared between the licensor and
the licensee.
Ozmel et al. (2012) is one of the few studies that examines, using a sample of private US
biotechnology firms, how the interplay between alternative funding sources, such as project-
level alliance funding and firm-level venture capital funding, affects exit decisions from the
private capital market. They find that strategic alliances and venture capital funding both raise
the hazard that a start-up company will go public as well as the hazard of being acquired.
Nicholson et al. (2005) document that strategic alliance partners provide an important source
17
Burrill (2013) argues, on the basis of more recent IPOs, that these are actually financing events, as venture-
backed biotechnology companies go public with substantial participation by their existing venture investors and
insiders.
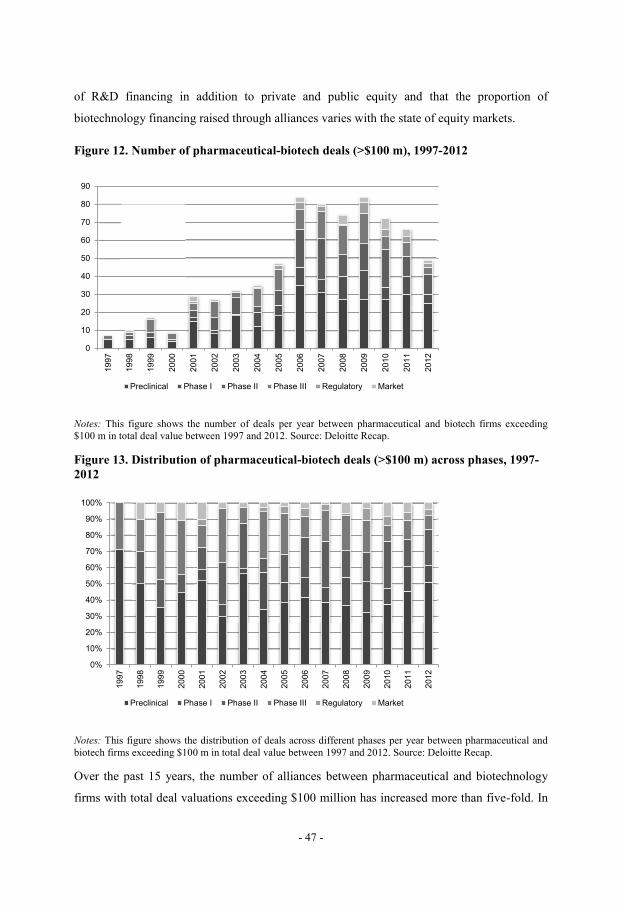
- 47 -
of R&D financing in addition to private and public equity and that the proportion of
biotechnology financing raised through alliances varies with the state of equity markets.
Figure 12. Number of pharmaceutical-biotech deals (>$100 m), 1997-2012
Notes: This figure shows the number of deals per year between pharmaceutical and biotech firms exceeding $100 m in total deal value between 1997 and 2012. Source: Deloitte Recap.
Figure 13. Distribution of pharmaceutical-biotech deals (>$100 m) across phases, 1997-2012
Notes: This figure shows the distribution of deals across different phases per year between pharmaceutical and biotech firms exceeding $100 m in total deal value between 1997 and 2012. Source: Deloitte Recap.
Over the past 15 years, the number of alliances between pharmaceutical and biotechnology
firms with total deal valuations exceeding $100 million has increased more than five-fold. In
0
10
20
30
40
50
60
70
80
90
1997
1998
1999
2000
2001
2002
2003
2004
2005
2006
2007
2008
2009
2010
2011
2012
Preclinical Phase I Phase II Phase III Regulatory Market
0%
10%
20%
30%
40%
50%
60%
70%
80%
90%
100%
1997
1998
1999
2000
2001
2002
2003
2004
2005
2006
2007
2008
2009
2010
2011
2012
Preclinical Phase I Phase II Phase III Regulatory Market
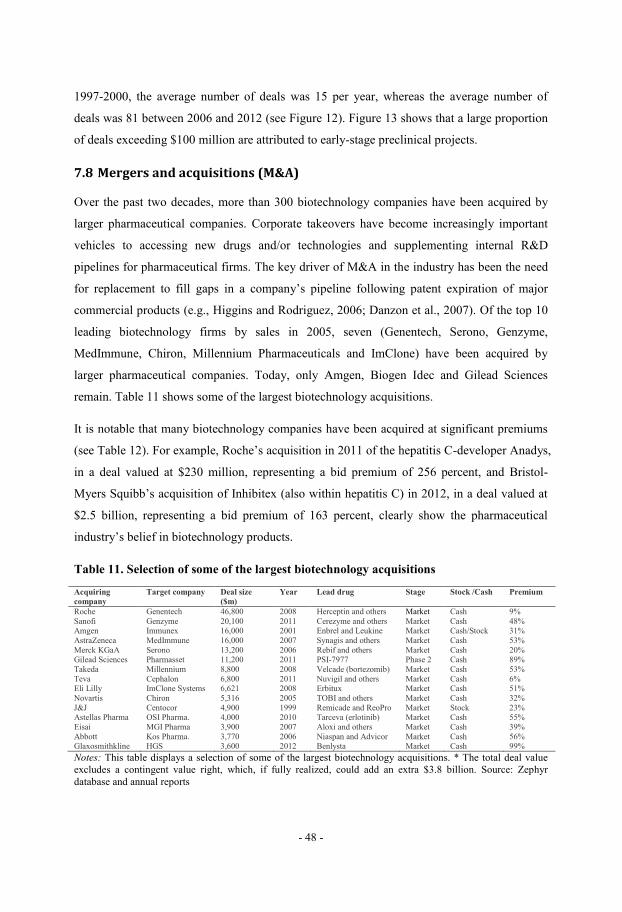
- 48 -
1997-2000, the average number of deals was 15 per year, whereas the average number of
deals was 81 between 2006 and 2012 (see Figure 12). Figure 13 shows that a large proportion
of deals exceeding $100 million are attributed to early-stage preclinical projects.
7.8 Mergers and acquisitions (M&A)
Over the past two decades, more than 300 biotechnology companies have been acquired by
larger pharmaceutical companies. Corporate takeovers have become increasingly important
vehicles to accessing new drugs and/or technologies and supplementing internal R&D
pipelines for pharmaceutical firms. The key driver of M&A in the industry has been the need
for replacement to fill gaps in a company’s pipeline following patent expiration of major
commercial products (e.g., Higgins and Rodriguez, 2006; Danzon et al., 2007). Of the top 10
leading biotechnology firms by sales in 2005, seven (Genentech, Serono, Genzyme,
MedImmune, Chiron, Millennium Pharmaceuticals and ImClone) have been acquired by
larger pharmaceutical companies. Today, only Amgen, Biogen Idec and Gilead Sciences
remain. Table 11 shows some of the largest biotechnology acquisitions.
It is notable that many biotechnology companies have been acquired at significant premiums
(see Table 12). For example, Roche’s acquisition in 2011 of the hepatitis C-developer Anadys,
in a deal valued at $230 million, representing a bid premium of 256 percent, and Bristol-
Myers Squibb’s acquisition of Inhibitex (also within hepatitis C) in 2012, in a deal valued at
$2.5 billion, representing a bid premium of 163 percent, clearly show the pharmaceutical
industry’s belief in biotechnology products.
Table 11. Selection of some of the largest biotechnology acquisitions
Acquiring
company
Target company Deal size
($m)
Year Lead drug Stage Stock /Cash Premium
Roche Genentech 46,800 2008 Herceptin and others Market Cash 9%
Sanofi Genzyme 20,100 2011 Cerezyme and others Market Cash 48% Amgen Immunex 16,000 2001 Enbrel and Leukine Market Cash/Stock 31%
AstraZeneca MedImmune 16,000 2007 Synagis and others Market Cash 53%
Merck KGaA Serono 13,200 2006 Rebif and others Market Cash 20% Gilead Sciences Pharmasset 11,200 2011 PSI-7977 Phase 2 Cash 89%
Takeda Millennium 8,800 2008 Velcade (bortezomib) Market Cash 53%
Teva Cephalon 6,800 2011 Nuvigil and others Market Cash 6% Eli Lilly ImClone Systems 6,621 2008 Erbitux Market Cash 51%
Novartis Chiron 5,316 2005 TOBI and others Market Cash 32%
J&J Centocor 4,900 1999 Remicade and ReoPro Market Stock 23% Astellas Pharma OSI Pharma. 4,000 2010 Tarceva (erlotinib) Market Cash 55%
Eisai MGI Pharma 3,900 2007 Aloxi and others Market Cash 39%
Abbott Kos Pharma. 3,770 2006 Niaspan and Advicor Market Cash 56% Glaxosmithkline HGS 3,600 2012 Benlysta Market Cash 99%
Notes: This table displays a selection of some of the largest biotechnology acquisitions. * The total deal value
excludes a contingent value right, which, if fully realized, could add an extra $3.8 billion. Source: Zephyr
database and annual reports
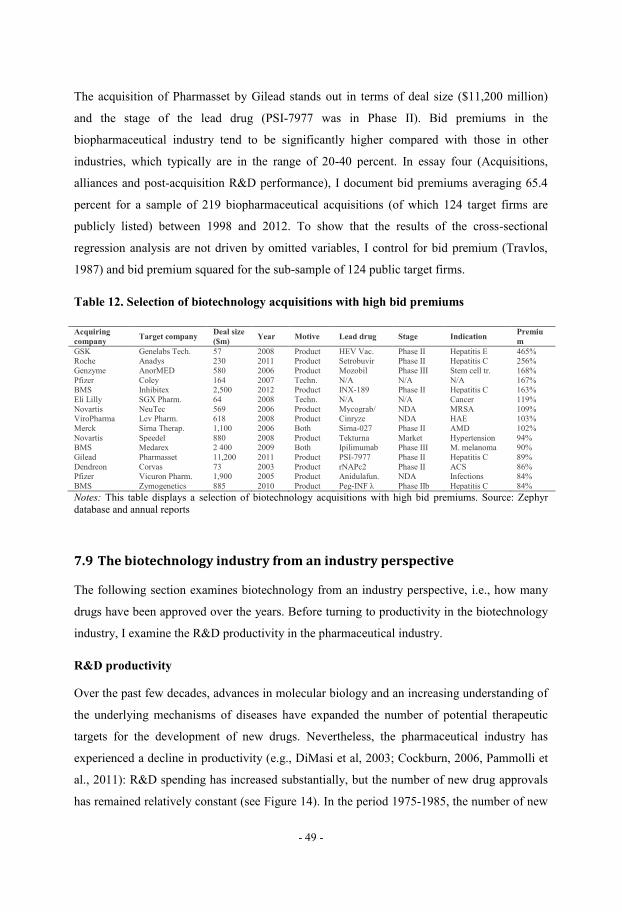
- 49 -
The acquisition of Pharmasset by Gilead stands out in terms of deal size ($11,200 million)
and the stage of the lead drug (PSI-7977 was in Phase II). Bid premiums in the
biopharmaceutical industry tend to be significantly higher compared with those in other
industries, which typically are in the range of 20-40 percent. In essay four (Acquisitions,
alliances and post-acquisition R&D performance), I document bid premiums averaging 65.4
percent for a sample of 219 biopharmaceutical acquisitions (of which 124 target firms are
publicly listed) between 1998 and 2012. To show that the results of the cross-sectional
regression analysis are not driven by omitted variables, I control for bid premium (Travlos,
1987) and bid premium squared for the sub-sample of 124 public target firms.
Table 12. Selection of biotechnology acquisitions with high bid premiums
Acquiring
company Target company
Deal size
($m) Year Motive Lead drug Stage Indication
Premiu
m
GSK Genelabs Tech. 57 2008 Product HEV Vac. Phase II Hepatitis E 465% Roche Anadys 230 2011 Product Setrobuvir Phase II Hepatitis C 256%
Genzyme AnorMED 580 2006 Product Mozobil Phase III Stem cell tr. 168%
Pfizer Coley 164 2007 Techn. N/A N/A N/A 167% BMS Inhibitex 2,500 2012 Product INX-189 Phase II Hepatitis C 163%
Eli Lilly SGX Pharm. 64 2008 Techn. N/A N/A Cancer 119%
Novartis NeuTec 569 2006 Product Mycograb/ NDA MRSA 109% ViroPharma Lev Pharm. 618 2008 Product Cinryze NDA HAE 103%
Merck Sirna Therap. 1,100 2006 Both Sirna-027 Phase II AMD 102%
Novartis Speedel 880 2008 Product Tekturna Market Hypertension 94%
BMS Medarex 2 400 2009 Both Ipilimumab Phase III M. melanoma 90%
Gilead Pharmasset 11,200 2011 Product PSI-7977 Phase II Hepatitis C 89%
Dendreon Corvas 73 2003 Product rNAPc2 Phase II ACS 86% Pfizer Vicuron Pharm. 1,900 2005 Product Anidulafun. NDA Infections 84%
BMS Zymogenetics 885 2010 Product Peg-INF λ Phase IIb Hepatitis C 84%
Notes: This table displays a selection of biotechnology acquisitions with high bid premiums. Source: Zephyr
database and annual reports
7.9 The biotechnology industry from an industry perspective
The following section examines biotechnology from an industry perspective, i.e., how many
drugs have been approved over the years. Before turning to productivity in the biotechnology
industry, I examine the R&D productivity in the pharmaceutical industry.
R&D productivity
Over the past few decades, advances in molecular biology and an increasing understanding of
the underlying mechanisms of diseases have expanded the number of potential therapeutic
targets for the development of new drugs. Nevertheless, the pharmaceutical industry has
experienced a decline in productivity (e.g., DiMasi et al, 2003; Cockburn, 2006, Pammolli et
al., 2011): R&D spending has increased substantially, but the number of new drug approvals
has remained relatively constant (see Figure 14). In the period 1975-1985, the number of new
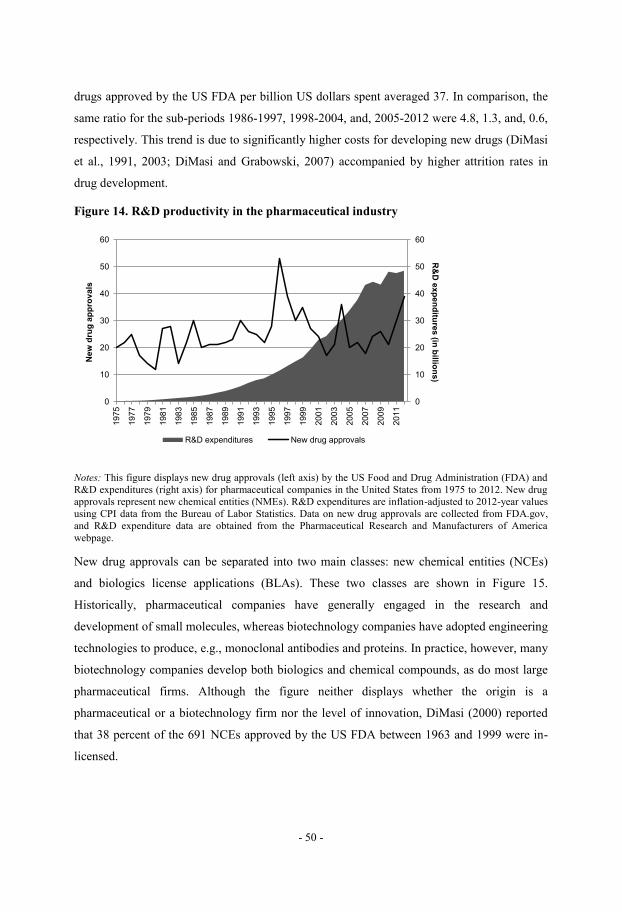
- 50 -
drugs approved by the US FDA per billion US dollars spent averaged 37. In comparison, the
same ratio for the sub-periods 1986-1997, 1998-2004, and, 2005-2012 were 4.8, 1.3, and, 0.6,
respectively. This trend is due to significantly higher costs for developing new drugs (DiMasi
et al., 1991, 2003; DiMasi and Grabowski, 2007) accompanied by higher attrition rates in
drug development.
Figure 14. R&D productivity in the pharmaceutical industry
Notes: This figure displays new drug approvals (left axis) by the US Food and Drug Administration (FDA) and
R&D expenditures (right axis) for pharmaceutical companies in the United States from 1975 to 2012. New drug
approvals represent new chemical entities (NMEs). R&D expenditures are inflation-adjusted to 2012-year values
using CPI data from the Bureau of Labor Statistics. Data on new drug approvals are collected from FDA.gov,
and R&D expenditure data are obtained from the Pharmaceutical Research and Manufacturers of America
webpage.
New drug approvals can be separated into two main classes: new chemical entities (NCEs)
and biologics license applications (BLAs). These two classes are shown in Figure 15.
Historically, pharmaceutical companies have generally engaged in the research and
development of small molecules, whereas biotechnology companies have adopted engineering
technologies to produce, e.g., monoclonal antibodies and proteins. In practice, however, many
biotechnology companies develop both biologics and chemical compounds, as do most large
pharmaceutical firms. Although the figure neither displays whether the origin is a
pharmaceutical or a biotechnology firm nor the level of innovation, DiMasi (2000) reported
that 38 percent of the 691 NCEs approved by the US FDA between 1963 and 1999 were in-
licensed.
0
10
20
30
40
50
60
0
10
20
30
40
50
60
1975
1977
1979
1981
1983
1985
1987
1989
1991
1993
1995
1997
1999
2001
2003
2005
2007
2009
2011
R&
D e
xp
en
ditu
res (in
billio
ns
)
New
dru
g a
pp
rov
als
R&D expenditures New drug approvals
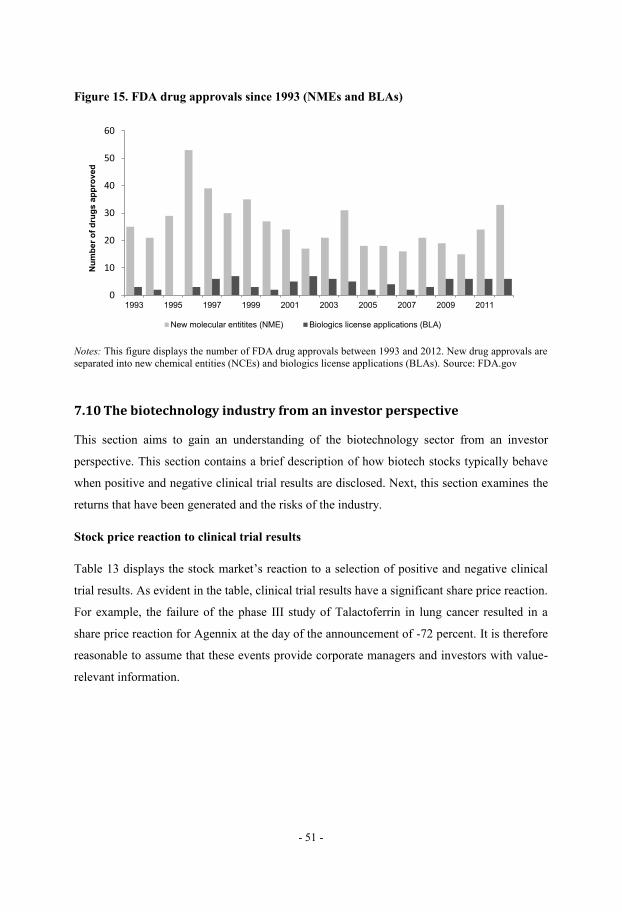
- 51 -
Figure 15. FDA drug approvals since 1993 (NMEs and BLAs)
Notes: This figure displays the number of FDA drug approvals between 1993 and 2012. New drug approvals are
separated into new chemical entities (NCEs) and biologics license applications (BLAs). Source: FDA.gov
7.10 The biotechnology industry from an investor perspective
This section aims to gain an understanding of the biotechnology sector from an investor
perspective. This section contains a brief description of how biotech stocks typically behave
when positive and negative clinical trial results are disclosed. Next, this section examines the
returns that have been generated and the risks of the industry.
Stock price reaction to clinical trial results
Table 13 displays the stock market’s reaction to a selection of positive and negative clinical
trial results. As evident in the table, clinical trial results have a significant share price reaction.
For example, the failure of the phase III study of Talactoferrin in lung cancer resulted in a
share price reaction for Agennix at the day of the announcement of -72 percent. It is therefore
reasonable to assume that these events provide corporate managers and investors with value-
relevant information.
0
10
20
30
40
50
60
1993 1995 1997 1999 2001 2003 2005 2007 2009 2011
Nu
mb
er
of
dru
gs
ap
pro
ved
New molecular entitites (NME) Biologics license applications (BLA)
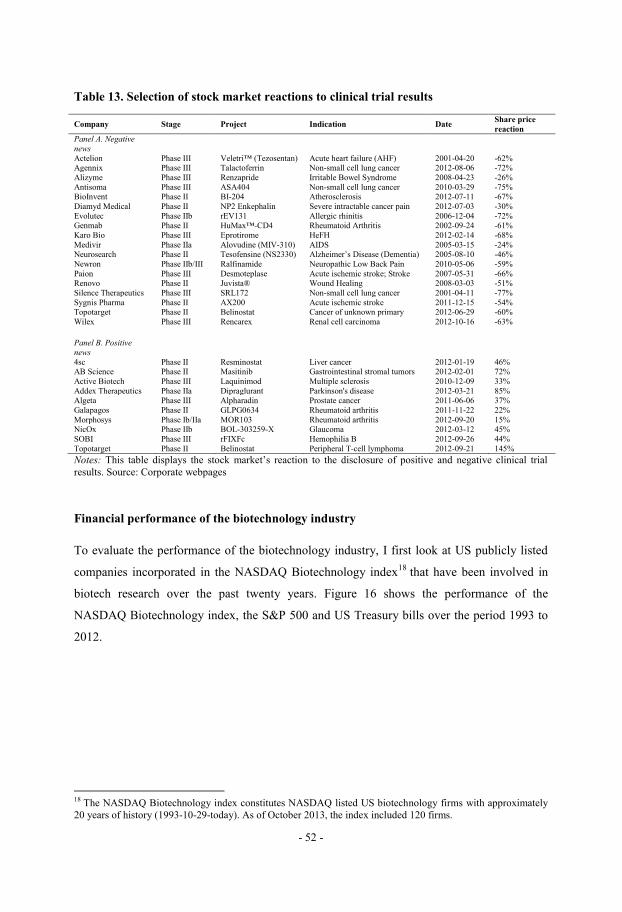
- 52 -
Table 13. Selection of stock market reactions to clinical trial results
Company Stage Project Indication Date Share price
reaction
Panel A. Negative
news
Actelion Phase III Veletri™ (Tezosentan) Acute heart failure (AHF) 2001-04-20 -62% Agennix Phase III Talactoferrin Non-small cell lung cancer 2012-08-06 -72%
Alizyme Phase III Renzapride Irritable Bowel Syndrome 2008-04-23 -26%
Antisoma Phase III ASA404 Non-small cell lung cancer 2010-03-29 -75% BioInvent Phase II BI-204 Atherosclerosis 2012-07-11 -67%
Diamyd Medical Phase II NP2 Enkephalin Severe intractable cancer pain 2012-07-03 -30%
Evolutec Phase IIb rEV131 Allergic rhinitis 2006-12-04 -72% Genmab Phase II HuMax™-CD4 Rheumatoid Arthritis 2002-09-24 -61%
Karo Bio Phase III Eprotirome HeFH 2012-02-14 -68%
Medivir Phase IIa Alovudine (MIV-310) AIDS 2005-03-15 -24% Neurosearch Phase II Tesofensine (NS2330) Alzheimer’s Disease (Dementia) 2005-08-10 -46%
Newron Phase IIb/III Ralfinamide Neuropathic Low Back Pain 2010-05-06 -59%
Paion Phase III Desmoteplase Acute ischemic stroke; Stroke 2007-05-31 -66% Renovo Phase II Juvista® Wound Healing 2008-03-03 -51%
Silence Therapeutics Phase III SRL172 Non-small cell lung cancer 2001-04-11 -77%
Sygnis Pharma Phase II AX200 Acute ischemic stroke 2011-12-15 -54% Topotarget Phase II Belinostat Cancer of unknown primary 2012-06-29 -60%
Wilex Phase III Rencarex Renal cell carcinoma 2012-10-16 -63%
Panel B. Positive
news
4sc Phase II Resminostat Liver cancer 2012-01-19 46% AB Science Phase II Masitinib Gastrointestinal stromal tumors 2012-02-01 72%
Active Biotech Phase III Laquinimod Multiple sclerosis 2010-12-09 33%
Addex Therapeutics Phase IIa Dipraglurant Parkinson's disease 2012-03-21 85% Algeta Phase III Alpharadin Prostate cancer 2011-06-06 37%
Galapagos Phase II GLPG0634 Rheumatoid arthritis 2011-11-22 22%
Morphosys Phase Ib/IIa MOR103 Rheumatoid arthritis 2012-09-20 15% NicOx Phase IIb BOL-303259-X Glaucoma 2012-03-12 45%
SOBI Phase III rFIXFc Hemophilia B 2012-09-26 44%
Topotarget Phase II Belinostat Peripheral T-cell lymphoma 2012-09-21 145%
Notes: This table displays the stock market’s reaction to the disclosure of positive and negative clinical trial
results. Source: Corporate webpages
Financial performance of the biotechnology industry
To evaluate the performance of the biotechnology industry, I first look at US publicly listed
companies incorporated in the NASDAQ Biotechnology index18
that have been involved in
biotech research over the past twenty years. Figure 16 shows the performance of the
NASDAQ Biotechnology index, the S&P 500 and US Treasury bills over the period 1993 to
2012.
18
The NASDAQ Biotechnology index constitutes NASDAQ listed US biotechnology firms with approximately
20 years of history (1993-10-29-today). As of October 2013, the index included 120 firms.
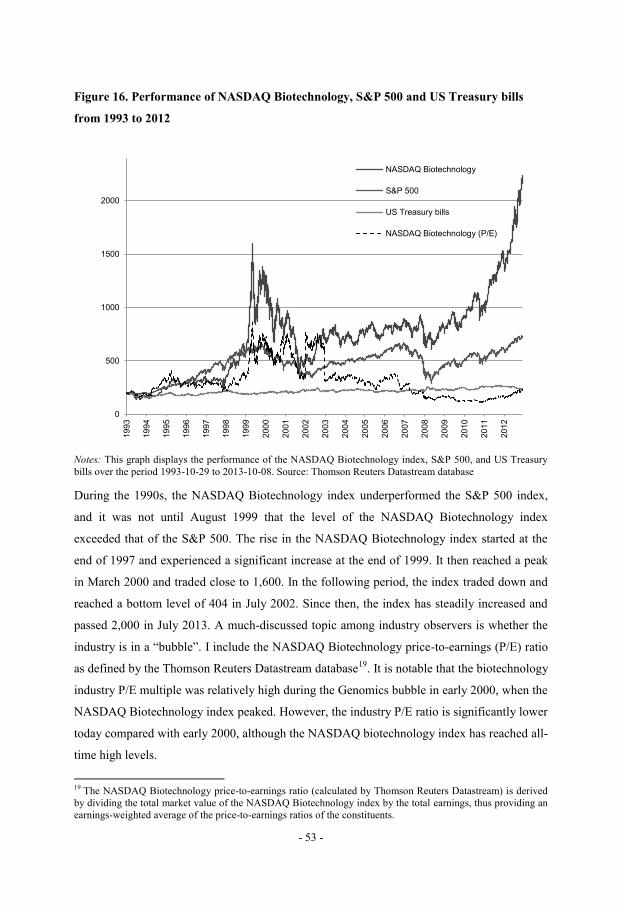
- 53 -
Figure 16. Performance of NASDAQ Biotechnology, S&P 500 and US Treasury bills
from 1993 to 2012
Notes: This graph displays the performance of the NASDAQ Biotechnology index, S&P 500, and US Treasury
bills over the period 1993-10-29 to 2013-10-08. Source: Thomson Reuters Datastream database
During the 1990s, the NASDAQ Biotechnology index underperformed the S&P 500 index,
and it was not until August 1999 that the level of the NASDAQ Biotechnology index
exceeded that of the S&P 500. The rise in the NASDAQ Biotechnology index started at the
end of 1997 and experienced a significant increase at the end of 1999. It then reached a peak
in March 2000 and traded close to 1,600. In the following period, the index traded down and
reached a bottom level of 404 in July 2002. Since then, the index has steadily increased and
passed 2,000 in July 2013. A much-discussed topic among industry observers is whether the
industry is in a “bubble”. I include the NASDAQ Biotechnology price-to-earnings (P/E) ratio
as defined by the Thomson Reuters Datastream database19
. It is notable that the biotechnology
industry P/E multiple was relatively high during the Genomics bubble in early 2000, when the
NASDAQ Biotechnology index peaked. However, the industry P/E ratio is significantly lower
today compared with early 2000, although the NASDAQ biotechnology index has reached all-
time high levels.
19
The NASDAQ Biotechnology price-to-earnings ratio (calculated by Thomson Reuters Datastream) is derived
by dividing the total market value of the NASDAQ Biotechnology index by the total earnings, thus providing an
earnings-weighted average of the price-to-earnings ratios of the constituents.
0
500
1000
1500
2000
1993
1994
1995
1996
1997
1998
1999
2000
2001
2002
2003
2004
2005
2006
2007
2008
2009
2010
2011
2012
NASDAQ Biotechnology
S&P 500
US Treasury bills
NASDAQ Biotechnology (P/E)
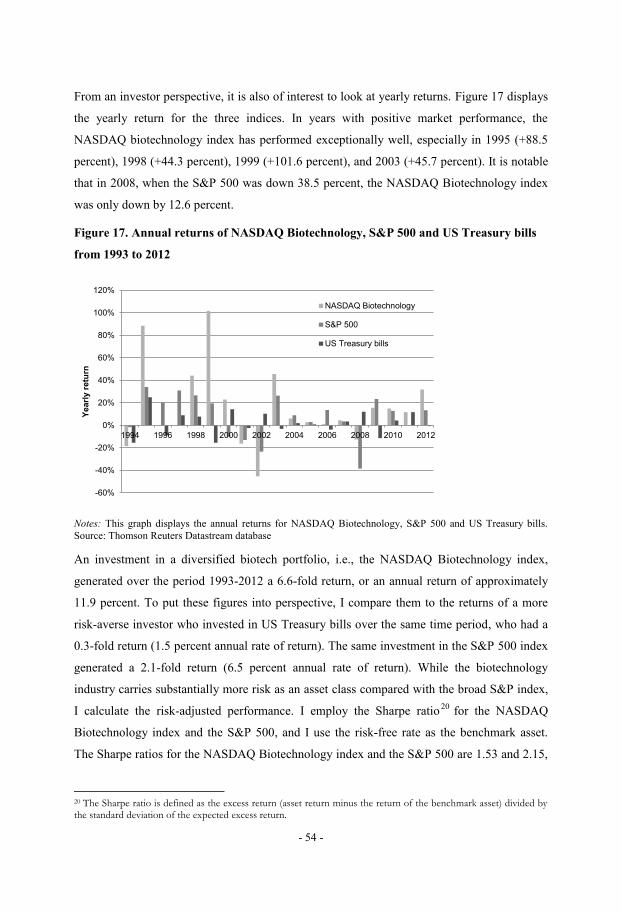
- 54 -
From an investor perspective, it is also of interest to look at yearly returns. Figure 17 displays
the yearly return for the three indices. In years with positive market performance, the
NASDAQ biotechnology index has performed exceptionally well, especially in 1995 (+88.5
percent), 1998 (+44.3 percent), 1999 (+101.6 percent), and 2003 (+45.7 percent). It is notable
that in 2008, when the S&P 500 was down 38.5 percent, the NASDAQ Biotechnology index
was only down by 12.6 percent.
Figure 17. Annual returns of NASDAQ Biotechnology, S&P 500 and US Treasury bills
from 1993 to 2012
Notes: This graph displays the annual returns for NASDAQ Biotechnology, S&P 500 and US Treasury bills.
Source: Thomson Reuters Datastream database
An investment in a diversified biotech portfolio, i.e., the NASDAQ Biotechnology index,
generated over the period 1993-2012 a 6.6-fold return, or an annual return of approximately
11.9 percent. To put these figures into perspective, I compare them to the returns of a more
risk-averse investor who invested in US Treasury bills over the same time period, who had a
0.3-fold return (1.5 percent annual rate of return). The same investment in the S&P 500 index
generated a 2.1-fold return (6.5 percent annual rate of return). While the biotechnology
industry carries substantially more risk as an asset class compared with the broad S&P index,
I calculate the risk-adjusted performance. I employ the Sharpe ratio20
for the NASDAQ
Biotechnology index and the S&P 500, and I use the risk-free rate as the benchmark asset.
The Sharpe ratios for the NASDAQ Biotechnology index and the S&P 500 are 1.53 and 2.15,
20 The Sharpe ratio is defined as the excess return (asset return minus the return of the benchmark asset) divided by the standard deviation of the expected excess return.
-60%
-40%
-20%
0%
20%
40%
60%
80%
100%
120%
1994 1996 1998 2000 2002 2004 2006 2008 2010 2012
Yearl
y r
etu
rn
NASDAQ Biotechnology
S&P 500
US Treasury bills
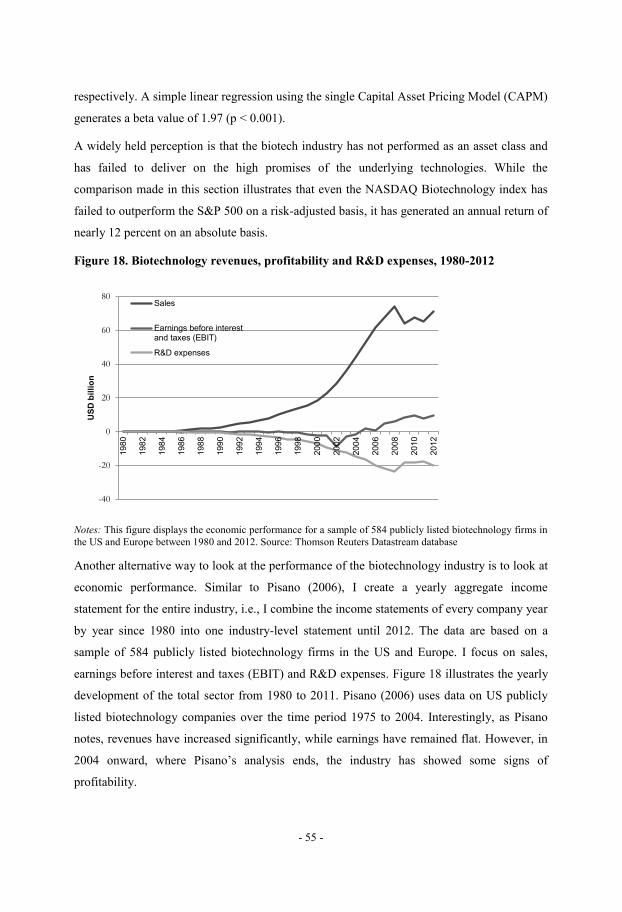
- 55 -
respectively. A simple linear regression using the single Capital Asset Pricing Model (CAPM)
generates a beta value of 1.97 (p < 0.001).
A widely held perception is that the biotech industry has not performed as an asset class and
has failed to deliver on the high promises of the underlying technologies. While the
comparison made in this section illustrates that even the NASDAQ Biotechnology index has
failed to outperform the S&P 500 on a risk-adjusted basis, it has generated an annual return of
nearly 12 percent on an absolute basis.
Figure 18. Biotechnology revenues, profitability and R&D expenses, 1980-2012
Notes: This figure displays the economic performance for a sample of 584 publicly listed biotechnology firms in
the US and Europe between 1980 and 2012. Source: Thomson Reuters Datastream database
Another alternative way to look at the performance of the biotechnology industry is to look at
economic performance. Similar to Pisano (2006), I create a yearly aggregate income
statement for the entire industry, i.e., I combine the income statements of every company year
by year since 1980 into one industry-level statement until 2012. The data are based on a
sample of 584 publicly listed biotechnology firms in the US and Europe. I focus on sales,
earnings before interest and taxes (EBIT) and R&D expenses. Figure 18 illustrates the yearly
development of the total sector from 1980 to 2011. Pisano (2006) uses data on US publicly
listed biotechnology companies over the time period 1975 to 2004. Interestingly, as Pisano
notes, revenues have increased significantly, while earnings have remained flat. However, in
2004 onward, where Pisano’s analysis ends, the industry has showed some signs of
profitability.
-40
-20
0
20
40
60
80
1980
1982
1984
1986
1988
1990
1992
1994
1996
1998
2000
2002
2004
2006
2008
2010
2012
US
D b
illi
on
Sales
Earnings before interestand taxes (EBIT)
R&D expenses
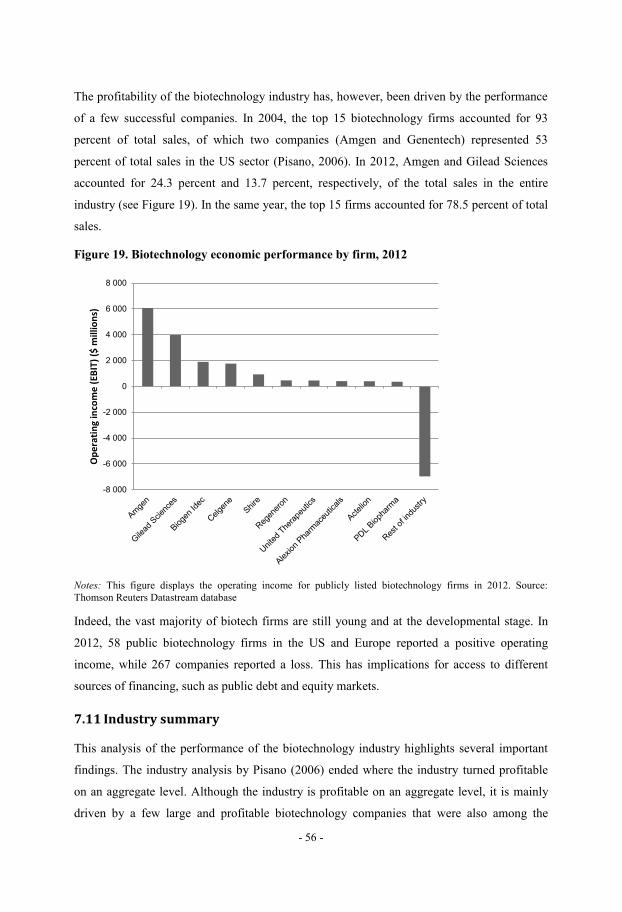
- 56 -
The profitability of the biotechnology industry has, however, been driven by the performance
of a few successful companies. In 2004, the top 15 biotechnology firms accounted for 93
percent of total sales, of which two companies (Amgen and Genentech) represented 53
percent of total sales in the US sector (Pisano, 2006). In 2012, Amgen and Gilead Sciences
accounted for 24.3 percent and 13.7 percent, respectively, of the total sales in the entire
industry (see Figure 19). In the same year, the top 15 firms accounted for 78.5 percent of total
sales.
Figure 19. Biotechnology economic performance by firm, 2012
Notes: This figure displays the operating income for publicly listed biotechnology firms in 2012. Source:
Thomson Reuters Datastream database
Indeed, the vast majority of biotech firms are still young and at the developmental stage. In
2012, 58 public biotechnology firms in the US and Europe reported a positive operating
income, while 267 companies reported a loss. This has implications for access to different
sources of financing, such as public debt and equity markets.
7.11 Industry summary
This analysis of the performance of the biotechnology industry highlights several important
findings. The industry analysis by Pisano (2006) ended where the industry turned profitable
on an aggregate level. Although the industry is profitable on an aggregate level, it is mainly
driven by a few large and profitable biotechnology companies that were also among the
-8 000
-6 000
-4 000
-2 000
0
2 000
4 000
6 000
8 000
Op
era
tin
g in
com
e (
EBIT
) ($
mill
ion
s)
- 57 -
earliest entrants in the industry. More than 33 years since the IPO of Genentech, the first
biotechnology company to go public, or approximately two product life cycles, a majority of
the public (and private) biotech universe is loss-making R&D firms with no products on the
market. The current industry analysis also sheds light on the long time it takes to bring a new
drug to the market: the average number of years from company founding to the launch of the
first major product for a sample of more recent successful US biotechnology companies is 18
years. While this group of companies on average went public only three years after founding,
this means that public capital markets have provided the R&D capital needed for a majority of
the period.
Although the NASDAQ biotechnology industry index has underperformed the S&P 500 index
on a risk-adjusted basis over the period 1993-2013, there have been periods when returns have
been excessively high and have generated significant profits for public investors. The
underlying driving factors of the industry, such as big pharma’s need to replace the major
blockbusters due to patent expiration, and the significant bid premiums in M&As and the
returns generated over certain periods in the sector will certainly play an important role in the
industry’s ability to attract R&D funding in the future.
References Aboody, D., Lev, B. 2000. Information Asymmetry, R&D and Insider Gains. Journal of
Finance 55, 2747-2766.
Admati, A.R., Pleiderar, P., 1994. Robust financial contracting and the role of venture
capitalists. Journal of Finance 49, 371-402.
Aggarwal, S., 2007. What’s fueling the biotech engine? Nature Biotechnology 25, 1097-1104.
Akerlof, G.A., 1970. The market for “lemons”: quality uncertainty and the market and
mechanism. The Quarterly Journal of Economics 84, 488-500.
Amir, E., Lev, B., 1996. Value-relevance of nonfinancial information: The wireless
communications industry. Journal of Accounting and Economics 22, 3-30.
Anton, J. J., Yao, D. A., 1998. The sale of intellectual property: Strategic disclosure, property
rights, and incomplete contracts. The Wharton School, University of Pennsylvania: working
paper.

- 58 -
Auerbach, A. J., 1984. Taxes, firm financial policy, and the cost of capital: an empirical
analysis. Journal of Public Economics 23, 27-57.
Bains, W., What you give is what you get: Investment in European biotechnology. Journal of
Commercial Biotechnology 12, 274-283.
Baker, M., Wurgler, J., 2002. Market timing and capital structure. Journal of Finance 57, 1-32.
Balakrishnan, S., Koza, M. P., 1993. Information asymmetry, adverse selection, and joint
ventures. Journal of Economic Behavior and Organization 20, 99-117.
Berg, C., Nassr, R., Pang, K., 2002. The evolution of biotech. Nature Reviews of Drug
Discovery 1, 845-846.
Bhattacharya, S., Ritter, J. R., 1983. Innovation and communication: Signaling with partial
disclosure. Review of Economic Studies 50, 331-346.
Binder, G., Bashe, P., 2008. Science lessons: What the business of biotech taught me about
management. Harvard Business Press.
Blass, A, Yosha, O., 2003. Financing R&D in mature companies: An empirical analysis. In:
Economics of innovation and new technology. Abingdon: Routledge.
Bodgan, B, Villiger, R., 2007. Valuation in Life Sciences. Springer-Verlag Berlin Heidelberg.
Bolton, P., Freixas, X., 2000. Equity, bonds, and bank debt: capital structure and financial
market equilibrium under asymmetric information. Journal of Political Economy 108, 324–
351.
Botosan, C. A., 1997. Disclosure level and the cost of capital. The Accounting Review 72,
323-349.
Brennan, M., Subrahmanyam, A., 1995. Investment analysis and price information in
securities markets. Journal of Financial Economics 38, 361-381.
Burrill, S. G., Improving IPO market still not an exit path. Journal of Commercial
Biotechnology 19, 53-54.
Campbell, J. Y., Lo, A. W., MacKinlay, C. A., 1997. The econometrics of financial markets.
Princeton: Princeton University Press.

- 59 -
Campbell, T. S., Kracaw, W. A., 1980. Information production, market signaling, and the
theory of financial intermediation. Journal of Finance 35, 863-882.
Cerbioni, F., Parbonetti, A., 2007. Exploring the effects of corporate governance on
intellectual capital disclosure: An analysis of European biotechnology companies. European
Accounting Review 16, 791-826.
Chan, Y., 1983. On the positive role of financial intermediation in allocation of venture
capital in a market with imperfect information. Journal of Finance 38, 1543-1568.
Chari, V. V., Jagannathan, R., Ofer, A., 1988. Seasonalities in securities returns: the case of
earnings announcements. Journal of Financial Economics 21, 101-121.
Chemmanur, T. J., 1993. The pricing of initial public offerings: a dynamic model with
information production. Journal of Finance 48, 285-304.
Chemmanur, T. J., Fulghieri, P., 1994. Investment bank reputation, information production,
and financial intermediation. Journal of Finance 49, 57-79.
Choe, H., Masulis, R., Nanda, V., 1993. Common stock offerings across the business cycle:
Theory and evidence. Journal of Empirical Finance 1, 3-31.
Cockburn, I., 2006. Is the pharmaceutical industry in a productivity crisis? In: Innovation
Policy and the Economy, eds. A. Jaffe, J. Lerner, and S. Stern, 1-32. Cambridge, MA: MIT
Press.
Coff, R. W., 1999. How buyers cope with uncertainty when acquiring firms in knowledge-
intensive industries: caveat emptor. Organization Science 10, 144-161.
Collins, D. W., Maydew, E. L., Weiss, I. S., 1997. Changes in the value-relevance of earnings
and book values over the past forty years. Journal of Accounting and Economics 24, 39-67.
Darrough, M., Stoughton, N., 1990. Financial disclosure policy in an entry game. Journal of
Accounting and Economics 12, 219-244.
DeAngelo, H., DeAngelo, L., Stulz, R. M., 2010. Seasoned equity offerings, market timing,
and the corporate lifecycle. Journal of Financial Economics 95, 275-295.
Diamond, D., Verrecchia, R., 1991. Disclosure, liquidity, and the cost of capital. Journal of
Finance 46, 1325-1359.
- 60 -
Dierkens, N., 1991. Information asymmetry and equity issues. Journal of Financial and
Quantitative Analysis 26, 181-199.
DiMasi, J. A., 2000. New drug innovation and pharmaceutical industry structure: Trends in
the output of pharmaceutical firms. Drug Information Journal 34, 1169-1194.
DiMasi, J. A., 2001. Risks in new drug development: Approval success rates for
investigational drugs. Clinical Pharmacology & Therapeutics 69, 297-307.
DiMasi, J.A., Hansen, R.W., Grabowski, H.G., Lasagna, L., 1991. Cost of innovation in the
pharmaceutical industry. Journal of Health Economics 10, 107–142.
DiMasi, J. A., Hansen, R. W., Grabowski, H. G., 2003. The price of innovation: new
estimates of drug development costs. Journal of Health Economics 22, 151-185.
DiMasi, J. A., Grabowski, H. G., 2007. The cost of biopharmaceutical R&D: is biotech
different? Managerial and Decision Economics 28, 469-479.
Easton, P., Harris, T., 1991. Earnings as an explanatory variable for returns. Journal of
Accounting Research 29, 19-36.
Eckbo, B. E, 2008. Equity issues and the disappearing rights offer phenomenon. Journal of
Applied Corporate Finance 20, 72-85.
Eckbo, B. E., 2009. Bidding strategies and takeover premiums: A review. Journal of
Corporate Finance 15, 149-178.
Eckbo, B. E., Giammarino, R. M., Heinkel, R. L., 1990. Asymmetric information and the
medium of exhange in takeovers: Theory and tests. Review of Financial Studies 3, 651-675.
Eckbo, B. E., Masulis, R. W., 1992. Adverse selection and the rights offer paradox. Journal of
Financial Economics 32, 293-332.
Elkington, J, 1985. The gene factory. New York: Carroll & Graf.
Ely, K., Simko, P. J., Thomas, L. G., 2003. The usefulness of biotechnology firms: Drug
development status in the evaluation of research and development costs. Journal of
Accounting, Auditing and Finance 18, 163-196.
- 61 -
Fama, E. F., 1970. Efficient capital markets: a review of theory and empirical work. Journal
of Finance 25, 383-417.
Fama, E. F., 1991. Efficient capital markets: II. Journal of Finance 46, 1575-1617.
Fazeli, M. S., 2004. 2003: What lessons for European biotechnology? Journal of Commercial
Biotechnology 10, 304-311.
Francis, J., Schipper, K., 1999. Have financial statements lost their relevance? Journal of
Accounting Research 37, 319-352.
French, K., Roll, R., 1986. Stock return variances: the arrival of information and the reaction of
traders. Journal of Financial Economics 17, 5-26.
Glosten, L. R., Milgrom, P. R., 1985. Bid, ask and transaction prices in a specialist market with
heterogeneously informed traders. Journal of Financial Economics 14, 71-100.
Graham, J. R., Harvey, C. R., 2001. Theory and practice of corporate finance: Evidence from
the field. Journal of Financial Economics 60, 187-243.
Grossman, S. J., Hart, O.D., 1980. Takeover bids, the free-rider problem, and the theory of the
corporation. Bell Journal of Economics 11, 42-64.
Guo, R-J., Lev, B., Zhou, N., 2004. Competitive costs of disclosure by biotech IPOs. Journal
of Accounting Research 42, 319-355.
Guo, L., Mech, T. S., 2000. Conditional event studies, anticipation, and asymmetric
information: The case of seasoned equity issues and pre-issue information releases. Journal of
Empirical Finance 7, 113-141.
Hall, B. H., 2002. The financing of research and development. Oxford Review of Economic
Policy 18, 35-51.
Hall, B. H., Lerner, J., 2009. The financing of R&D and innovation. NBER Working paper no.
w15325, 1-55.
Hall, S. S., 2006. Size matters: How height affects the health, happiness, and success of boys
– and the men they become. Boston: Houghton Mifflin.

- 62 -
Hansen, R. G., 1987. A theory for the choice of exchange medium in mergers and acquisitions.
Journal of Business 60, 75-95.
Healy, P. M., Palepu, K. J., 2001. Information asymmetry, corporate disclosure and the capital
markets: A review of the empirical disclosure literature. Journal of Accounting and
Economics 31, 405-440.
Hertzel, M.G., Smith, R.L., 1993. Market discounts and shareholder gains for placing equity
privately. Journal of Finance 48, 459-485.
Higgins, M. J., 2008. Introduction to finance and valuing early stage technology. In:
Advances in the Study of Entrepreneurship, Innovation and Economic Growth 18, 253-285.
Higgins, M. J., Rodriguez, D., 2006. The outsourcing of R&D through acquisitions in the
pharmaceutical industry. Journal of Financial Economics 80, 351-383.
Himmelberg, C.P., Petersen, B.C., 1994. R&D and internal finance: a panel study of small
firms in high-tech industries. Review of Economics and Statistics 76, 38-51.
Huang, Y-S., Walkling, R. A., 1987. Target abnormal returns associated with acquisition
announcements: Payment, acquisition form, and managerial resistance. Journal of Financial
Economics 19, 329-349.
Huggett, B, 2013. Public biotech 2012 – the numbers. Nature Biotechnology 31, 697-703.
Ikenberry, D., Lakonishok, J., Vermaelen, T., 1995. Market underreaction to open market share
repurchases. Journal of Financial Economics 39, 181-208.
James, C., Wier, P., 1990. Borrowing relationships, intermediation, and the cost of issuing
public securities. Journal of Financial Economics 28, 149-171.
Jensen, M. C., Meckling, W., 1976. Theory of the firm: Managerial behavior, agency costs
and capital structure. Journal of Financial Economics 3, 305-360.
Jensen, M. C., Ruback, R. S., 1983. The market for corporate control: The scientific evidence.
Journal of Financial Economics 11, 5-50.
Kahn, C., Winton, A., 1998. Ownership structure, speculation, and shareholder intervention.
Journal of Finance 53, 99-129.

- 63 -
Korajczyk, R. A., Lucas, D. J., McDonald, R. L., 1991. The effect of information releases on
the pricing and timing of equity issues. The Review of Financial Studies 4, 685-708.
Korajczyk, R. A., Lucas, D. J., McDonald, R. L., 1992. Equity issues with time-varying
asymmetric information. Journal of Financial and Quantitative Analysis 27, 397-417.
Krishnaswami, S., Subramaniam, V., 1999. Information asymmetry, valuation, and the
corporate spin-off decision. Journal of Financial Economics 53, 73-112.
Lang, M., Lundholm, R., 1996. Corporate disclosure policy and analyst behavior. The
Accounting Review 71, 467–493.
Leland, H. E., Pyle, D. H., 1977. Informational asymmetries, financial structure, and financial
intermediation. Journal of Finance 32, 371-387.
Lerner, J., 1994. Venture capitalists and the decision to go public. Journal of Financial
Economics 35, 293-316.
Lerner, J., Shane, H., Tsai, A., 2003. Do equity financing cycles matter? Evidence from
biotechnology alliances. Journal of Financial Economics 67, 411-446.
Lin, Y-M., You, S-J., Lin, F-J., 2008. The effects of pre-issue information releases on
seasoned equity offerings. Journal of Business Finance & Accounting 35, 1138-1163.
Loderer, C. F., Mauer, D. C., 1992. Corporate dividends and seasoned equity issues: An
empirical investigation. Journal of Finance 47, 201-225.
Lucas, D., McDonald, R., 1990. Equity issues and stock price dynamics. Journal of Finance 45,
1019-1043.
MacKinlay, C. A., 1997. Event studies in economics and finance. Journal of Economic
Literature 35, 13-39.
Martynova, M., Renneboog, L., 2008. A century of corporate takeovers: What have we
learned and where do we stand? Journal of Banking and Finance 32, 2148-2177.
Metrick, A., Yasuda, A., 2010. Venture capital and the finance of innovation. The M.C.
Escher Company-Holland.
Miller, H. I., 2002. As biotech turns 20…. Nature Reviews of Drug Discovery 1, 1007-1008.

- 64 -
McConomy, B., Xu, B., 2004. Value creation in the biotechnology industry. CMA
Management, 29-31.
Modigliani, F., Miller, M. H., 1958. The cost of capital, corporation finance and the theory of
investment. American Economic Review 48, 261-297.
Myers, S. C., 1984. The capital structure puzzle. Journal of Finance 39, 575-592.
Myers, S. C., Majluf, N. S., 1984. Corporate financing and investment decisions when firms
have information that investors do not have. Journal of Financial Economics 13, 187-221.
Nanda, A., Williamson, J., 1995. Use of joint ventures to ease the pain of structuring. Harvard
Business Review Nov-Dec, 119-128.
Nicholson, S., Danzon, P. M., McCullough, J., 2005. Biotech-pharmaceutical alliances as a
signal of asset and firm quality. Journal of Business 78, 1433-1464.
Ozmel, U., Robinson, D. T., Stuart, T. E., 2013. Strategic alliances, venture capital, and exit
decisions in early stage high-tech firms. Journal of Financial Economics 41, 655-670.
Pammolli, F., Magazzini, L., Riccaboni, M., 2011. The productivity crisis in pharmaceutical
R&D. Nature Reviews of Drug Discovery 10, 428-438.
Pisano, G. P., 1997. R&D performance, collaborative arrangements, and the market-for know-
how: A test of the “lemons” hypothesis in biotechnology. Harvard Business School,
Cambridge, MA, mimeo.
Pisano, G. P. 2006. Science business: The promise, the reality, and the future of biotech.
Harvard Business School Press.
Rajan, R. G., Zingales, L., 1998. Financial dependence and growth. American Economic
Review 88, 559–586.
Rau , P. R., Vermaelen, T., 1998. Glamour, value and the post-acquisition performance of
acquiring firms. Journal of Financial Economics 49, 223-253.
Ravid, S. A., Spiegel, M., 1997. Optimal financial contracts for a start-up with unlimited
operating discretion. Journal of Financial and Quantitative Analysis 32, 269–287.
- 65 -
Reichert, J., Pavlou, A., 2004. Monoclonal antibodies market. Nature Reviews of Drug
Discovery 3, 383-384.
Ritter, J., 1991. The long-run performance of initial purchase offerings. Journal of Finance 46,
3-27.
Robbins-Roth, C., 2001. From alchemy to IPO: The business of biotechnology. Basic Books.
Sahlman, W.A., 1990. The structure and governance of venture-capital organizations. Journal
of Financial Economics 27, 473-521.
Schumpeter, J. A., 1942. Capitalism, socialism and democracy. New York: Harper and Brother
(Harper Colophon Edition, reprinted 1976).
Shleifer, A., Vishny, R.W., 1986. Large shareholders and corporate control. Journal of
Political Economy 94, 461-488.
Schultz, P., 2003. Pseudo market timing and the long-run underperformance of IPOs. Journal
of Finance 58, 483-517.
Smith Hughes, S., 2011. Genentech: The beginnings of biotech. University of Chicago Press.
Spence, M, 1974. Competitive and optimal responses to signals: an analysis of efficiency and
distribution. Journal of Economic Theory 7, 296-332.
Stewart, J. J., Allison, P. N., Johnson, R. S., 2001. Putting a price on biotechnology. Nature
Biotechnology 19, 813-817.
Stoll, H., 1978. The pricing of security dealer services: an empirical study of NASDAQ
stocks. Journal of Finance 33, 1153-1172.
Titman, S, Wessels, R., 1988. The determinants of capital structure choice. Journal of Finance
43, 1-19.
Travlos, N. G., 1987. Corporate takeover bids, methods of payment, and bidding firms’ stock
returns. Journal of Finance 42, 943-963.
Vermaelen, T, 1981. Common stock repurchases and market signaling: An empirical study.
Journal of Financial Economics 9, 139-183.

- 66 -
Viswanathan, S., Wei, B., 2008. Endogenous events and long-run returns. Review of Financial
Studies 21, 855-888.
Walsh, G., 2006. Biopharmaceutical benchmarks 2006. Nature Biotechnology 24, 769-776.
Wruck, H.K., 1989. Equity ownership concentration and firm value: evidence from private
equity financings. Journal of Financial Economics 23, 3-28.

I

- 69 -
The value-relevance of accounting and non-accounting information in
the European biotechnology industry
Hans Jeppsson*
University of Gothenburg, School of Business, Economics and Law
Abstract
This paper examines the value-relevance of accounting and non-accounting information in the
biotechnology industry. The study is based on hand-collected R&D data of publicly listed
companies in the European biotechnology industry from 1998 to 2012. Consistent with
expectations, information regarding the progress of individual research projects is value-
relevant, whereas earnings information is not particularly value-relevant. The study shows
that a stock market reacts more strongly to late-stage announcements than to early-stage
announcements. These findings are consistent for both positive and negative R&D
announcements. In addition, market reactions are explained using project- and firm-specific
variables. Furthermore, the study documents a large asymmetry in the stock market’s reaction
to positive and negative R&D announcements. Importantly, there are significantly more
positive than negative R&D news announcements. The findings of this study raise two
important issues. First, firms may be reluctant to disclose negative information given the huge
stock price impact of adverse news announcements. Second, given the large information
asymmetries in the biotechnology industry and the large capital requirements, managers may
use the value-relevant, mandatory and non-discretionary R&D news announcements as an
instrument in the decision to raise external financing when there is a chance that investors will
understand the firm’s prospects better.
JEL-classification: G14
Keywords: Value-relevance; Accounting information; Non-accounting information;
Disclosures; R&D; Biotechnology
* Contact address: Department of Business Administration, School of Business, Economics and Law at the
University of Gothenburg. P.O. Box 610, SE-40530 Göteborg. Telephone: +46 31 786 1463.
- 70 -
1. Introduction
Traditionally, accounting information, such as earnings and book value of equity, has been
considered value-relevant to investors (e.g. Easton and Harris, 1991; Collins et al., 1997;
Francis and Schipper, 1999). However, it has been argued that accounting information for
firms in R&D intensive industries, such as the biotechnology industry, that invest heavily in
intangibles convey less value-relevant information (e.g. Amir and Lev, 1996). Large
investments in intangibles, such as research and development (R&D), that are immediately
expensed and less frequently capitalized, has two main consequences. First, current
performance measures are excessively low (often negative), even though one can expect that
the more negative the current performance, the more positive future performance will be.
Second, the measure of the current resources, equity, becomes excessively low because few
investments are booked as assets.
Instead of relying on accounting information investors have to rely on voluntary and
mandatory disclosures of information about the status of the firm’s investment projects.
Empirical accounting research verifies that voluntary disclosures improve stock liquidity
(Diamond and Verrecchia, 1991), reduce the cost of equity capital (Botosan, 1997) and
increase information intermediation (Lang and Lundholm, 1996). A problem is that voluntary
disclosures are subject to a self-selection bias and, hence, the association between market
reactions and disclosure might be driven by firm performance rather than disclosure per se
(Healy and Palepu, 2001: 431). In this setting the biotechnology industry is studied in which
investors make little use of accounting information and disclosures of R&D information is
generally unbiased and mandatory1 (rather than voluntary), and hence, problems associated
with self-selection bias are less prominent. In addition, the drug development process is
heavily regulated and monitored by regulatory authorities. As a result, the non-discretionary
nature of disclosures in this industry overcomes the common criticism of endogenous event in
the event study literature (Schultz, 2003; Viswanathan and Wei, 2008).
This study provides three contributions to the accounting and finance literature. First, it
documents how the market reacts in aggregate to the disclosure of non-discretionary
information. It shows the extent to which different accounting and non-accounting
information is relevant to investors (in the sense that it influences security prices). This
knowledge is important to investors who are evaluating firms within a given industry.
1 For a review of disclosure issues for biotechnology and pharmaceutical firms, see Fisher (2002).
- 71 -
Second, while numerous studies have used information from the US stock exchanges (Ely et
al., 2003; McConomy and Xu, 2004), this study uses a unique hand-collected dataset of
publicly listed firms in the European biotechnology industry from 1998–2012. It has been
argued that the US biotechnology sector differs from the European biotechnology sector in
terms of maturity, size and the availability of funding (Dedman et al., 2008). Hence, this study
provides the largest analysis by far of the European biotechnology industry, covering 87 firms
from eleven countries over thirteen years.
Third, the study provides evidence of the differences in market reactions according to
predictions. In particular, there are differences in stock price and in trading volume between
projects in different phases, as well as between positive and negative outcomes. The study
also documented how market reactions are explained, using project- and firm-specific
variables.
The remainder of the paper is organized as follows. Section 2 contains a literature review and
describes the hypotheses. Section 3 introduces the methodology, and section 4 explains the
data sample. Section 5 presents the empirical results, and Section 6 concludes.
2. Theory and research hypotheses
2.1 Value-relevance of accounting information
It is known that value-relevant information changes stock prices because it causes investors to
revise their expectations of the firms’ future cash flows (Francis and Schipper, 1999). To
determine expected future cash flows investors use the information they find value-relevant
(Holthausen and Watts, 2001; Barth et al, 2001). Accounting information, such as earnings and
book value of equity, has generally been considered to provide investors with value-relevant
information (Easton and Harris, 1991; Francis and Schipper, 1999). However, it has been
questioned to what extent accounting information plays a role for firms in high-tech industries
that invest heavily in intangible assets, such as R&D, that are less frequently capitalized. Most
research suggests that accounting information plays a less prominent role for these firms (e.g.
Amir and Lev, 1996).
Amir and Lev (1996) examined the value-relevance of financial and non-financial information
for a sample of US cellular firms. They find that accounting information (such as earnings,
changes in earnings, book values and cash flows) on a stand-alone basis is not particularly
- 72 -
value-relevant. Amir and Lev (1996) argue that biotechnology firms suffer from the same
inadequacies as do cellular firms. Using a sample of 44 US biotechnology firms, where
earnings are predominantly negative, they find that book values and changes in earnings are
positively related to market values, while earnings are negatively related to market values.
Similarly, Ely et al. (2003) provide evidence, using a sample of 83 US biotechnology firms
with no marketable products, that the market value of equity is associated to book value, but
not significantly related to earnings (before R&D). Furthermore, Dedman et al. (2008) find,
for a sample of UK biotechnology and pharmaceutical firms between 1990 and 1998 that
book value of equity is positively associated with market value of equity, while earnings
showed no significant association with market value of equity. Overall, past empirical
research find mixed evidence that accounting information is value-relevant. Prior studies have
primarily used information from the US stock exchanges.2 US biotechnology sector differs
from the European biotechnology sector in terms of maturity, size and the availability of
funding (Dedman et al., 2008). Hence, whether accounting information for European
biotechnology firms is value-relevant to investors is an open empirical question. This leads to
the first hypothesis:
H1: Financial information is value-relevant in the European biotechnology industry.
2.2 Value-relevance of non-accounting information
In industries where accounting information convey less value-relevant information it is
essential to identify important non-accounting performance indicators. In the cellular industry,
Amir and Lev (1996) show that non-accounting information, such as the population size of
areas in which service licenses are held, potential growth in customers and market
penetration, are highly value-relevant. Behn and Riley (1999) provide evidence that non-
2 Generally accepted accounting principles (GAAP) in the US requires firms to immediately expense their
significant value enhancing investments in internally developed intangible assets, and therefore, large
investments in intangibles have two main consequences. First, current performance measures, such as earnings,
are excessively low (often negative), even though one can expect that the more negative the current performance,
the more positive future performance will be. Second, the measure of the current resources, equity, becomes
excessively low because few investments are booked as assets. In an international setting the IASC implemented
a standard on Intangible Assets (IAS 38) in 2001 which declares that development expenditures, fulfilling certain
critera, shall be capitalized and amortized over its useful life (maximum five years). Lev and Sougiannis (1996)
- 73 -
accounting disclosures, such as several proxies for customer satisfaction, enhance traditional
accounting information in the US airline industry. McConomy and Xu (2004) suggest
industry-specific non-accounting disclosures of information, such as load factors in airlines,
web traffic and customer experience in internet-based firms that may be value-relevant
factors.
Several studies have examined the value-relevance of non-accounting information in the
biotechnology industry that are engaged in the research and development of drugs.3 For
example, Yang (2008) finds that non-financial patent information is associated with
biotechnology firms’ financial performance as well as provides incremental value-relevance
over traditional accounting information to the market value of equity. Ely et al. (2003)
examine the value-relevance of product development information in the US biotechnology
sector. They find that the significant positive association of market value with R&D costs is a
function of portfolio potential as measured by the number of a firm’s in-process drugs
weighted by their development status. Measuring the stock market’s reaction to phase
initiations and status updates of R&D projects, they find the most significant reaction to phase
II initiations and phase II status update announcements. However, they find no significant
stock market reaction to news concerning later stages of development, such as phase III and
FDA submissions, which interpret their findings as evidence that phase II is the stage at which
investors begin to consider R&D projects as value-relevant4. Dedman et al. (2008) investigate
the stock market reaction to research progress information. They find that the stock market
reacts positive to phase III results (2.35 percent) and final success (1.87 percent), but not
significantly positive to phase I and Phase II results5.
Overall, it appears that there is a lack of general consensus on the value-relevance of non-
accounting R&D information in the biotechnology industry. In addition, prior studies on
and Oswald and Zarowin (2007) find that capitalization of R&D expenditures is associated with more
informative stock prices, relative to expensing R&D. 3 The drug development process consists of different stages that are linked to each other. These different stages
are broadly classified as: discovery, pre-clinical, clinical phase I, clinical phase II, clinical phase III, and
regulatory. The transition from one stage to the next must be built on the success of the previous stage. In
addition, regulatory authorities closely monitor the drug development process, and the transition from one stage
to the next must be approved by these regulatory authorities (such as the EMA in Europe and the FDA in the
US). 4 Joos (2003) provide several explanations to the event study findings by Ely et al. (2003) that Phase III and FDA
submissions are not considered value-relevant. First, there may be wrong event dates. Second, phase initiations
are not always good news as firm may initate the next clinical trial for a more limited set of indications than the
market initially expected. Similarly, although the FDA may approve a drug, it may not always be good news as
the drug may be approved in a sub-population or include unfavorable black-box labels.
- 74 -
biotechnology firms have only studied the stock market reaction to positive news, due to
small sample sizes (Ely et al., 2003; Dedman et al., 2008)6. Hence, the second hypothesis is:
H2: R&D information is value-relevant in the European biotechnology industry.
3. Methodology
This section describes the research methodologies used in the paper. First, the price regression
model to explain the value-relevance of accounting variables is described. Second, the event
study methodology is described that is used to assess the stock market’s price and trading
volume reaction to announcements of earnings- and R&D information. Third, the cross-
sectional regression model that is employed to investigate the link between project- and firm-
specific variables, as well as accounting variables, on stock market returns, is presented.
3.1 Price regression model
To examine if accounting information provides investors with value-relevant information, I
follow Amir and Lev (1996) and estimate the following price regression model from panel
data of quarterly financial information for a sample of European biotechnology firms:
(1)
is the stock price of firm i at the end of the second month following quarter t. The
independent variables, and , are quarterly earnings per share and book value per
share, respectively, of firm i at the end of quarter t. is measured as the change in
earnings per share from the same quarter in the year before. Since the panel data set includes
the same companies in successive quarters, I include a dummy variable for each firm to
control for firm-fixed effects.
5 A potential explanation to the findings by Dedman et al. (2008) is that 54 percent of the positive R&D
announcements were released by three pharmaceutical firms during the test period. 6 McConomy and Xu (2004) find that phase III results (positive/negative) exhibits the strongest market reaction
of the different stages, but do not comment on differences between market reactions between positive and
negative news across phases.

- 75 -
3.2 Event study methodology
To investigate the stock market’s price reaction to earnings- and R&D announcements, the
standard methodology for a short run event study, as suggested by MacKinlay (1997) and
Campbell et al. (1997), is followed. For robustness reasons, I also examine trading volumes
surrounding R&D announcements.
3.2.1 Price reaction
To estimate abnormal returns, I first employ OLS regression methods to estimate predicted
returns in the following market model7:
(2)
where is the daily market return on the acquiring firm i over day t, is the return on
the value-weighted market portfolio over day t, αi and βi are the parameters of the market
model, and εi,t is the zero mean disturbance term. As a proxy for the market portfolio, the
equal-weighted dividend- and split-adjusted stock return for all other firms that were included
in the sample is used.8 Predicted returns are estimated using ordinary least squares (OLS)
regression over an estimation period of 221 days (the time period starting 250 days prior to
the announcement and ending 30 days prior to the event). The abnormal return is the
difference between a firm’s predicted and actual stock price for any given day, derived from
the market model:
( ) (3)
where and are estimates of the regression parameters. The cumulative abnormal return
(CAR) is calculated by aggregating the abnormal returns across two dimensions; firms and
time. First, the cumulative abnormal return is calculated over the event window for each event
in the sample. I use an event window of three days, which includes the day of the
announcement as well as the day before and after.
7 For robustness reasons, I also estimate predicted returns using the Fama-French three factor model. The three
factor model yield similar results. 8 Biotech- (and pharmaceutical) stocks are non-cyclical. Hence, this study uses an industry index rather than a
market index.

- 76 -
∑
(4)
Second, the cumulative average abnormal return across all the events, N, in the sample is
calculated.
∑
(5)
To eliminate the effect of confounding events and a possible dependence between abnormal
returns, overlapping events were excluded (using a three-day period centered on the
announcement date). Day 0 is designated as the day when the firm makes the earnings or
R&D announcement.9 If the information is disclosed during a weekend or any other time
when the markets are closed, the next trading day becomes the event day. As a check of
robustness, the cumulative abnormal returns (CAR) for a three-day event window (from day
−1 to day +1), a five-day event window (from day −2 to day +2), and a twelve-day event
window (from day −2 to day +10) are calculated. In addition to Student’s t test, the non-
parametric Wilcoxon signed ranks test is used, which does not require that the population be
normally distributed.
3.2.2 Trading volume
Trading volumes may provide a better measure of information content than do price reactions
(Beaver, 1968; Bamber, 1986). While price reactions reflect an average revision in investor
beliefs, trading volume reactions reflect idiosyncratic belief revisions (Karpoff, 1986; Kim
and Verrecchia, 1991a and 1991b). To calculate abnormal trading volume, I follow the
procedure adopted by Roni and Jean-Luc (1996) and Lin et al. (2008). 10
9 Most US studies use the announcement dates in the Wall Street Journal as the event dates. Newspapers
normally have one or two days of delay in their announcements. Business intelligence databases use newspapers
as sources of information. Hence, relying on the dates from newspapers or databases might bias the event date.
Therefore, as a check of robustness, different event windows are used, although the longer event windows tend
to be noisier. 10
As a robustness check, I also calculate abnormal trading volume following Ajinkya and Jain (1989). Abnormal
trading volume is the difference between the actual and predicted trading volume. Equivalent to the estimation of
predicted returns, the single-index market model with an estimation window of 180 days (day −200 to day −21)
is used. A firm’s actual trading volume is the number of shares traded on day t scaled to the total number of
shares outstanding. The market proxy is the number of shares traded for all other firms (that were included in the
sample), scaled by these firms’ total number of shares outstanding. The model yield similar results.

- 77 -
I first calculate the average trading volume (ATV) during the observation period, which is
defined as the average daily turnover rate during the period of days -45 to -4 and +4 to +45
relative to the issue announcement. That is:
∑ [ ] [ ]
(6)
where denotes the trading volume of stock i on date t and T represents the trading days
during the observation period. Daily abnormal trading volume (ATV) during the event period
is defined as:
(7)
Summing up daily abnormal trading volume during the event period yields cumulative
abnormal trading volume (CATV):
∑
(8)
3.3 Cross-sectional regression
Kothari and Zimmerman (1995) argue that the use of both return and price models has the
potential to yield more convincing evidence. Following Kothari and Zimmerman (1995) and
Amir and Lev (1996), I estimate the following return model:
(9)
is the cumulative abnormal return of firm i over a three day event window around
quarter t earnings announcement (centered on the quarterly earnings announcement day). The
estimation of is detailed in the previous section. The independent variable, , is
defined as quarterly earnings per share of firm i at the end of quarter t. is measured as
the change in earnings per share from the same quarter in the year before.
I also employ a regression model to explain the cross-sectional variations in cumulative
abnormal return (Kale et al., 2002) of R&D announcements, using firm- and project-specific
information:
- 78 -
∑
(10)
is the cumulative abnormal return of firm i over a three day event window around
quarter t earnings announcement (centered on the R&D announcement day). The regression is
run for three models with the following dependent variables: (1) all positive R&D
announcements, (2) positive phase I announcements, and (3) positive phase II
announcements.11
The independent variables are described below.
Complexity
The therapy area of a project is a proxy for the complexity of the research project
(COMPLEXITY). Projects within therapy areas that tend to have low success rates, such as the
central nervous system, are expected to have a larger stock market reaction following positive
news on clinical trials. Historical success rates per therapy area are based on DiMasi (2001).12
Risk-sharing
Biotech firms generally seek to collaborate with experienced partners in the costly late-stage
clinical trials to share the risk.13
A dummy variable (RISK_SHARING) is given a value of one
when a project is developed with a partner; otherwise, it is zero.
Investment
The number of patients varies; not only between the different stages of drug development, but
also between firms. The size of clinical trials (i.e., the number of patients included in the
study) is a function of the size of the investment made by the firm and may provide investors
with a more credible signal of the firms’ belief in the project. The variable (INVESTMENT) is
the logarithmic value of the number of patients.
11
The few number of R&D announcements in other categories restricted the cross-sectional analysis to these
categories. 12
The success rates by DiMasi (2001) are based on pharmaceutical firms and may not directly apply to
biotechnology firms. However, the success rates are not inflated by the R&D announcements in this sample.
Hence, they are considered to be independent. 13
For example, Paion’s business strategy is to partner clinical products after the first major value driving
milestone (after phase II), in order to share the risk of later clinical development (Paion, Annual Report, 2008).
- 79 -
Project diversification
A firm with many projects is less dependent on the success of each single project, compared
to a firm with only one project. Project diversification (DIVERSIFICATION) is measured as
the logarithmic market value of equity (measured as the average market value from day −21
to day −2, relative to the R&D announcement).
Other independent variables
Other control variables are market-to-book (MTB) and region dummies. Following La Porta et
al. (1998), region dummies are included to control for the institutional characteristics between
countries. The Anglo-Saxon region is used as a benchmark relative to the other three regions
(Germanic, French, and Scandinavian).
3.4 Hypothesis testing
Two tests are performed. First, the value-relevance of accounting information is examined
(H1). To examine if accounting information (earnings and book value of equity) provides
investors with value-relevant information I perform a price regression on accounting variables
(equation 1). To test for hypothesis 1, I ascribe the results from the price regression model.
Following Kothari and Zimmerman (1995) and Amir and Lev (1996), I also estimate a cross-
sectional return model (equation 9). To shed additional light, I examine the price and trading
volume reaction around earnings announcements following the event-study methodology.
Second, the value-relevance of non-accounting information is investigated (H2). To examine
if non-accounting information (R&D announcements) provides investors with value-relevant
information I examine the stock market’s reaction (with respect to price and volume) to R&D
announcements. To test for hypothesis 2, price and trading volume reactions for R&D
announcements are assumed to be significantly different from zero, i.e. no price and trading
volume reaction.
- 80 -
4. Data and sample selection
4.1 Sample selection
This study examines R&D announcements of 87 publicly listed European biotechnology
firms between 1998 and 201214
. The sample of firms is primarily identified from the
Thomson Datastream database. Three restrictions to the sample are made. First, the
company’s primary quotation is on a European stock exchange. Second, only firms that are
engaged in the development of drugs are included.15
Third, to ensure a homogenous sample,
pharmaceutical and generic companies are excluded. Prior research has used US data (Amir
and Lev, 1996; Ely et al., 2003), whereas Dedman et al. (2008) use a mix of UK
biotechnology and pharmaceutical firms. Even though the drug development process is
essentially identical for biotechnology and pharmaceutical companies, the key difference is
that pharmaceutical companies are generally much larger and hold a much more diversified
project pipeline than biotech companies. Furthermore, pharmaceutical companies have
revenue-generating products, and therefore, failures (and successes) of early-stage projects
might be considered to be, relatively speaking, less value-relevant information. In addition,
disclosure of early-stage R&D information may not be subject to mandatory disclosures, but
rather voluntary disclosures. Consequently, voluntary disclosures of the clinical trial results of
pharmaceutical firms may suffer from potential self-selection bias, meaning that the results
cannot be generalized to biotechnology firms. These restrictions reduce the number of firms
from 431 to 87. These firms are listed on 11 stock exchanges across Europe. 16
Financial and accounting information, such as the dividend- and split-adjusted stock prices
and trading volumes, as well as quarterly earnings, the number of shares outstanding and the
book value of equity, are gathered from the Thomson Datastream.
14
Ely et al. (2003) use a sample of 83 US biotech firms with no marketable products between 1988 and 1998.
Dedman et al. (2008) use a sample of 22 UK firms, comprising a mixture of both biotechnology and
pharmaceutical companies. The final sample consists of 151 positive announcements made between 1990 and
1998, of which 81 are made by three pharmaceutical firms. 15
The biotechnology companies can be broadly classified to the fields of medical devices, diagnostics,
information technology, tools and equipment, and drug development. 16
The stock exchanges are the following: Vienna Stock Exchange (Austria), Copenhagen Stock Exchange
(Denmark), Helsinki Stock Exchange (Finland), Euronext Paris (France), Frankfurt Stock Exchange (Germany),
Milano Stock Exchange (Italy), Euronext Amsterdam (the Netherlands), Oslo Stock Exchange (Norway), OMX
Stockholm (Sweden), Swiss Stock Exchange (Switzerland), and London Stock Exchange/Alternative Investment
Market (United Kingdom).
- 81 -
4.2 R&D announcements
This study uses a complete sample of 1,071 R&D announcements made by all public
biotechnology firms between 1998 and 2012. For active firms, the information related to
R&D announcements is collected from corporate websites and is cross-checked (with a focus
on event dates) with the Factiva database. For inactive firms, I primarily use the Factiva
database and in some cases annual reports.17
In general, the different phases in drug
development can be described as follows. At the preclinical stage, the drugs is tested for
safety and efficacy in animal models. Phase 1 trials examine safety of the drug in healthy
volunteers. Phase 2 examines drug efficacy in a small-scale patient group. Phase 3 examines
drug efficacy in large-scale patient groups. Clinical trial results are subject to a good news-
bad news ranking (Guo et al., 2004).
The biotechnology industry has two key features that make studies of market reactions to the
disclosure of R&D information of special interest. First, disclosures of R&D information is
generally mandatory (rather than voluntary), and hence, problems associated with self-
selection bias are less prominent. Second, the drug development process is heavily regulated
and monitored by regulatory authorities, and consequently, the non-discretionary nature of
disclosures in this industry overcomes the common criticism of endogenous event in the event
study literature (Schultz, 2003; Viswanathan and Wei, 2008). In addition, managers’
incentives to disclose value-relevant product development information are also derived from
investor demand (Guo et al, 2004; Cerbioni and Parbonetti, 2007). Public firms are subject to
stock exchange regulations18
, which not only require the information disclosed by a company
to be correct, relevant, clear, and not misleading, but also require the information to be
comprehensive enough to provide adequate guidance to assess the effect on the price of its
securities. Firms must have a headline indicating the substance of the announcement and they
must also clearly present the most important information at the beginning of the
announcement. Hence, wording in the heading such as “positive results,” “successful
completion” or “primary endpoint was met” are classified as positive news. Similarly, press
17
Joos (2003) argue that clinical trial results may also become available through alternative information sources,
such as medical journals, conference abstracts and analyst meetings, and consequently, some news may suffer
from potential biases. However, stock exchange regulations require public firms to have their own website on
which ”price-sensitive” information shall be made available as soon as possible after the information has been
disclosed. According to these rules, firms are not allowed to provide price sensitive information at general
meetings or analyst presentations without also disclosing the information elsewhere. 18
Publicly-listed firms are subject to certain requirements about trading rules and regulations. Following general
disclosure rules, firms have an obligation to disclose “price sensitive” information as soon as possible to the
public.
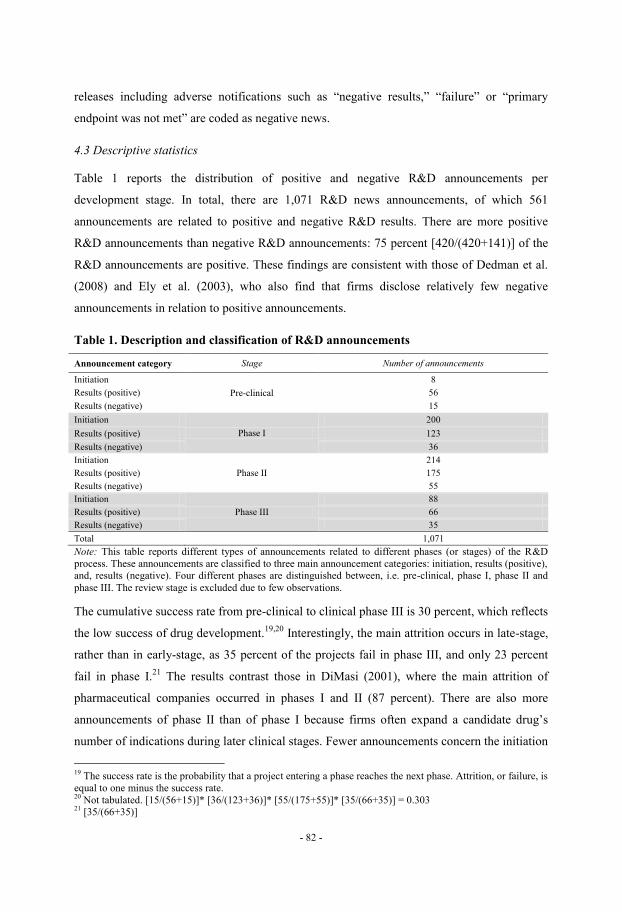
- 82 -
releases including adverse notifications such as “negative results,” “failure” or “primary
endpoint was not met” are coded as negative news.
4.3 Descriptive statistics
Table 1 reports the distribution of positive and negative R&D announcements per
development stage. In total, there are 1,071 R&D news announcements, of which 561
announcements are related to positive and negative R&D results. There are more positive
R&D announcements than negative R&D announcements: 75 percent [420/(420+141)] of the
R&D announcements are positive. These findings are consistent with those of Dedman et al.
(2008) and Ely et al. (2003), who also find that firms disclose relatively few negative
announcements in relation to positive announcements.
Table 1. Description and classification of R&D announcements
Announcement category Stage Number of announcements
Initiation
Pre-clinical
8
Results (positive) 56
Results (negative) 15
Initiation
Phase I
200
Results (positive) 123
Results (negative) 36
Initiation
Phase II
214
Results (positive) 175
Results (negative) 55
Initiation
Phase III
88
Results (positive) 66
Results (negative) 35
Total 1,071
Note: This table reports different types of announcements related to different phases (or stages) of the R&D
process. These announcements are classified to three main announcement categories: initiation, results (positive),
and, results (negative). Four different phases are distinguished between, i.e. pre-clinical, phase I, phase II and
phase III. The review stage is excluded due to few observations.
The cumulative success rate from pre-clinical to clinical phase III is 30 percent, which reflects
the low success of drug development.19,20
Interestingly, the main attrition occurs in late-stage,
rather than in early-stage, as 35 percent of the projects fail in phase III, and only 23 percent
fail in phase I.21
The results contrast those in DiMasi (2001), where the main attrition of
pharmaceutical companies occurred in phases I and II (87 percent). There are also more
announcements of phase II than of phase I because firms often expand a candidate drug’s
number of indications during later clinical stages. Fewer announcements concern the initiation
19
The success rate is the probability that a project entering a phase reaches the next phase. Attrition, or failure, is
equal to one minus the success rate. 20
Not tabulated. [15/(56+15)]* [36/(123+36)]* [55/(175+55)]* [35/(66+35)] = 0.303 21
[35/(66+35)]
- 83 -
of projects at the pre-clinical stage, compared with the initiation of projects in the clinical
stages. Preclinical results are often published in scientific journals and companies only
sporadically disclose this information in annual reports and company announcements (Joos,
2003). 22
In summary, this study primarily focuses on the three stages of drug development:
clinical phase I, phase II and phase III, and there is good reason to believe that disclosures
during these stages constitute the most value-relevant disclosures about the firms’ projects.
5. Empirical results
5.1 Value-relevance of accounting information
In this section, I examine if accounting information (earnings and book value of equity)
provide investors with value-relevant information. I follow Amir and Lev (1996) and regress
stock prices on reported financial accounting variables. Table 2 presents coefficient estimates
from the price regressions.
In Table 2, the coefficient on earnings (EPS) is statistically insignificant across models 1-4. In
addition, the results of models 2-4 indicate that changes in the level of earnings (ΔEPS) are
not value-relevant. In contrast, the coefficient on book value of equity (BV) is positive and
statistically significant (1 percent level). Similar to the findings in this study, Ely et al. (2003)
and Dedman et al. (2008) find that book value is significantly positively related to firm value,
while earnings have no significant association with the market value of equity. The results
contrasts the findings in Amir and Lev (1996), who finds that neither earnings nor book value
are relevant in explaining the market value of cellular companies. Ohlson (1995) argues that
book value is expected to be the dominant valuation variable when earnings are not
informative. To control for impact of regulatory changes, following the adoption of IFRS in
the European Union in 200523
, I include a dummy variable (Time) taking the value of one for
years in the period 2005-2012, and zero for periods prior to 2005. In model 4, the interaction
variable between EPS and Time is statistically insignificant, which indicates that there is no
22
A firm has no reason to file an Investigational New Drug (IND) with regulatory authorities if they find that the
drug has adverse effects in animal studies. As a result, an announcement related to this stage may suffer from a
self-reporting bias problem. 23
In March 2002, the European Parliament passed a resolution requiring all firms listed on stock exchanges of
European member states to apply International Financial Reporting Standards (IFRS) when preparing their
financial statements for fiscal years beginning on or after January 1, 2005. According to IAS 38 (IFRS), research
costs should be expensed when they incur, while development costs can be capitalized if certain criteria are met.
One such criterion is that future economic benefits are highly probable.
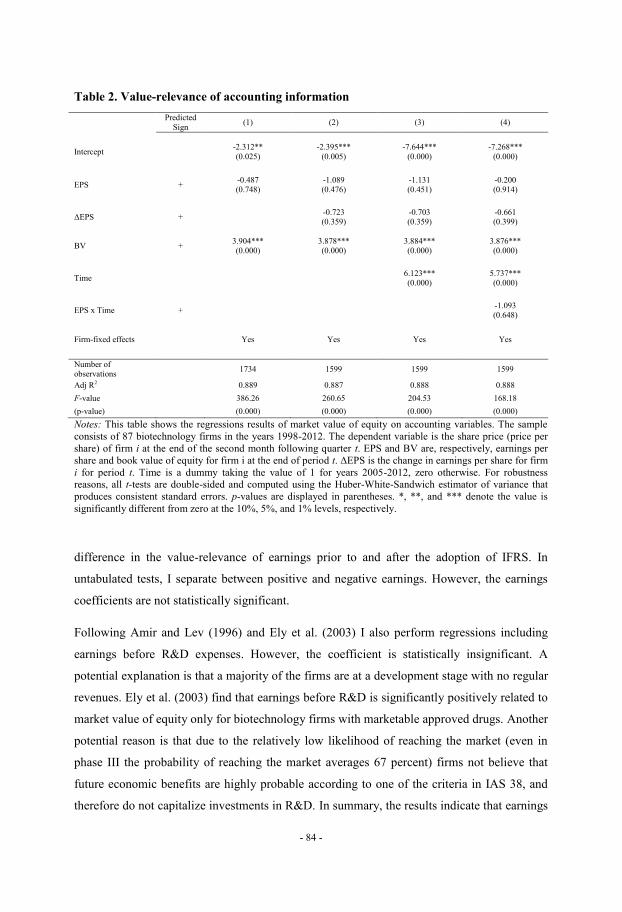
- 84 -
Table 2. Value-relevance of accounting information
Predicted
Sign (1) (2) (3) (4)
Intercept -2.312**
(0.025)
-2.395***
(0.005)
-7.644***
(0.000)
-7.268***
(0.000)
EPS + -0.487 (0.748)
-1.089 (0.476)
-1.131 (0.451)
-0.200 (0.914)
ΔEPS + -0.723 (0.359)
-0.703 (0.359)
-0.661 (0.399)
BV + 3.904*** (0.000)
3.878*** (0.000)
3.884*** (0.000)
3.876*** (0.000)
Time 6.123*** (0.000)
5.737*** (0.000)
EPS x Time + -1.093 (0.648)
Firm-fixed effects Yes Yes Yes Yes
Number of observations
1734 1599 1599 1599
Adj R2 0.889 0.887 0.888 0.888
F-value 386.26 260.65 204.53 168.18
(p-value) (0.000) (0.000) (0.000) (0.000)
Notes: This table shows the regressions results of market value of equity on accounting variables. The sample
consists of 87 biotechnology firms in the years 1998-2012. The dependent variable is the share price (price per
share) of firm i at the end of the second month following quarter t. EPS and BV are, respectively, earnings per
share and book value of equity for firm i at the end of period t. ΔEPS is the change in earnings per share for firm
i for period t. Time is a dummy taking the value of 1 for years 2005-2012, zero otherwise. For robustness
reasons, all t-tests are double-sided and computed using the Huber-White-Sandwich estimator of variance that
produces consistent standard errors. p-values are displayed in parentheses. *, **, and *** denote the value is
significantly different from zero at the 10%, 5%, and 1% levels, respectively.
difference in the value-relevance of earnings prior to and after the adoption of IFRS. In
untabulated tests, I separate between positive and negative earnings. However, the earnings
coefficients are not statistically significant.
Following Amir and Lev (1996) and Ely et al. (2003) I also perform regressions including
earnings before R&D expenses. However, the coefficient is statistically insignificant. A
potential explanation is that a majority of the firms are at a development stage with no regular
revenues. Ely et al. (2003) find that earnings before R&D is significantly positively related to
market value of equity only for biotechnology firms with marketable approved drugs. Another
potential reason is that due to the relatively low likelihood of reaching the market (even in
phase III the probability of reaching the market averages 67 percent) firms not believe that
future economic benefits are highly probable according to one of the criteria in IAS 38, and
therefore do not capitalize investments in R&D. In summary, the results indicate that earnings
- 85 -
are not value-relevant, whereas book value of equity is value-relevant. This indicates that the
null hypothesis cannot be rejected.
5.2 Value-relevance of non-accounting information
In this section, I examine the value-relevance of accounting and non-accounting information
by examining the stock market’s reaction to earnings- and R&D announcements. Table 3
presents the short-run stock price and volume reaction to earnings- and R&D announcements
(related to the stages of drug development).
The stock market reaction at day zero to earnings announcements is -0.79 percent and
statistically significant (1 percent level). However, the magnitude of the coefficient is small.
The abnormal volume at day zero and around earnings announcements (days −1 to +1 relative
to the announcement day) is statistically insignificant, which indicates that earnings
announcements provide limited information content.
Next, the stock market’s reactions to R&D announcements are examined. The stock market
reacts positively (negatively) to all positive (negative) R&D announcements on day zero.24,25
The day zero mean abnormal return is 1.99 percent (−12.25 percent) for clinical phase I
results, 6.37 percent (−15.78 percent) for clinical phase II results and 7.53 percent (−31.77
percent) for clinical phase III results. The strong stock market reaction to negative news
announcements, especially to clinical phase III, suggests that they were largely unanticipated
by investors. In the most extreme case, the market value decreased by 75 percent during one
day on a single negative phase III news announcement (not tabulated).
Column two of Table 3 documents the stock market’s reaction over a three-day event window
(days −1 to +1 relative to the announcement day). Positive R&D announcements are not
different when using a one- or three-day event window. In contrast, negative R&D
announcements exhibit a larger negative reaction when using the three-day event window. For
example, the three-day cumulative abnormal return to negative phase II results is −24.18
24
All of the reactions are statistically significant at the 1% level, but reactions to positive phase I announcements
were significant at the 5% level. 25
Non-parametric tests confirm the results.
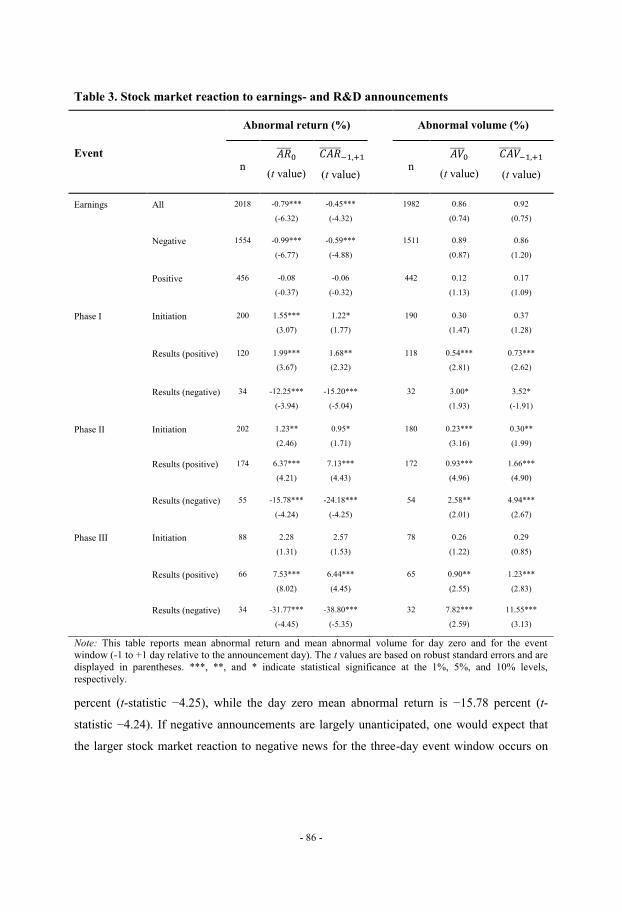
- 86 -
Table 3. Stock market reaction to earnings- and R&D announcements
Abnormal return (%) Abnormal volume (%)
Event
n
(t value)
(t value)
n
(t value)
(t value)
Earnings All 2018 -0.79***
(-6.32)
-0.45***
(-4.32)
1982 0.86
(0.74)
0.92
(0.75)
Negative 1554 -0.99***
(-6.77)
-0.59***
(-4.88)
1511 0.89
(0.87)
0.86
(1.20)
Positive 456 -0.08
(-0.37)
-0.06
(-0.32)
442 0.12
(1.13)
0.17
(1.09)
Phase I Initiation 200 1.55***
(3.07)
1.22*
(1.77)
190 0.30
(1.47)
0.37
(1.28)
Results (positive) 120 1.99***
(3.67)
1.68**
(2.32)
118 0.54***
(2.81)
0.73***
(2.62)
Results (negative) 34 -12.25***
(-3.94)
-15.20***
(-5.04)
32 3.00*
(1.93)
3.52*
(-1.91)
Phase II Initiation 202 1.23**
(2.46)
0.95*
(1.71)
180 0.23***
(3.16)
0.30**
(1.99)
Results (positive) 174 6.37***
(4.21)
7.13***
(4.43)
172 0.93***
(4.96)
1.66***
(4.90)
Results (negative) 55 -15.78***
(-4.24)
-24.18***
(-4.25)
54 2.58**
(2.01)
4.94***
(2.67)
Phase III Initiation 88 2.28
(1.31)
2.57
(1.53)
78 0.26
(1.22)
0.29
(0.85)
Results (positive) 66 7.53***
(8.02)
6.44***
(4.45)
65 0.90**
(2.55)
1.23***
(2.83)
Results (negative) 34 -31.77***
(-4.45)
-38.80***
(-5.35)
32 7.82***
(2.59)
11.55***
(3.13)
Note: This table reports mean abnormal return and mean abnormal volume for day zero and for the event
window (-1 to +1 day relative to the announcement day). The t values are based on robust standard errors and are
displayed in parentheses. ***, **, and * indicate statistical significance at the 1%, 5%, and 10% levels,
respectively.
percent (t-statistic −4.25), while the day zero mean abnormal return is −15.78 percent (t-
statistic −4.24). If negative announcements are largely unanticipated, one would expect that
the larger stock market reaction to negative news for the three-day event window occurs on
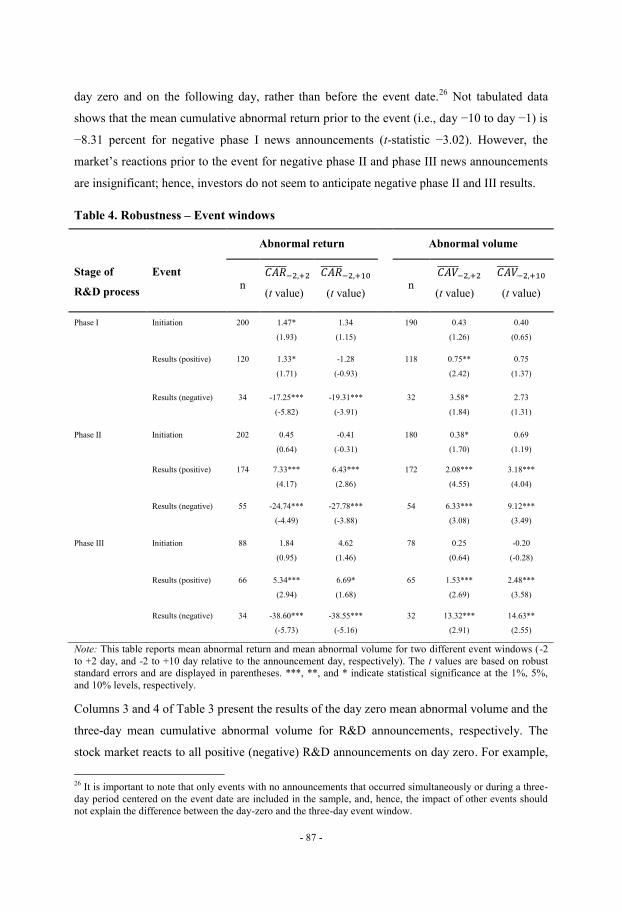
- 87 -
day zero and on the following day, rather than before the event date.26
Not tabulated data
shows that the mean cumulative abnormal return prior to the event (i.e., day −10 to day −1) is
−8.31 percent for negative phase I news announcements (t-statistic −3.02). However, the
market’s reactions prior to the event for negative phase II and phase III news announcements
are insignificant; hence, investors do not seem to anticipate negative phase II and III results.
Table 4. Robustness – Event windows
Abnormal return Abnormal volume
Stage of
R&D process
Event
n
(t value)
(t value)
n
(t value)
(t value)
Phase I Initiation 200 1.47*
(1.93)
1.34
(1.15)
190 0.43
(1.26)
0.40
(0.65)
Results (positive) 120 1.33*
(1.71)
-1.28
(-0.93)
118 0.75**
(2.42)
0.75
(1.37)
Results (negative) 34 -17.25***
(-5.82)
-19.31***
(-3.91)
32 3.58*
(1.84)
2.73
(1.31)
Phase II Initiation 202 0.45
(0.64)
-0.41
(-0.31)
180 0.38*
(1.70)
0.69
(1.19)
Results (positive) 174 7.33***
(4.17)
6.43***
(2.86)
172 2.08***
(4.55)
3.18***
(4.04)
Results (negative) 55 -24.74***
(-4.49)
-27.78***
(-3.88)
54 6.33***
(3.08)
9.12***
(3.49)
Phase III Initiation 88 1.84
(0.95)
4.62
(1.46)
78 0.25
(0.64)
-0.20
(-0.28)
Results (positive) 66 5.34***
(2.94)
6.69*
(1.68)
65 1.53***
(2.69)
2.48***
(3.58)
Results (negative) 34 -38.60***
(-5.73)
-38.55***
(-5.16)
32 13.32***
(2.91)
14.63**
(2.55)
Note: This table reports mean abnormal return and mean abnormal volume for two different event windows (-2
to +2 day, and -2 to +10 day relative to the announcement day, respectively). The t values are based on robust
standard errors and are displayed in parentheses. ***, **, and * indicate statistical significance at the 1%, 5%,
and 10% levels, respectively.
Columns 3 and 4 of Table 3 present the results of the day zero mean abnormal volume and the
three-day mean cumulative abnormal volume for R&D announcements, respectively. The
stock market reacts to all positive (negative) R&D announcements on day zero. For example,
26
It is important to note that only events with no announcements that occurred simultaneously or during a three-
day period centered on the event date are included in the sample, and, hence, the impact of other events should
not explain the difference between the day-zero and the three-day event window.
- 88 -
the mean abnormal volume on day zero for negative phase III results is 7.82 percent (t-
statistic 2.59) compared to 3.00 percent (t-statistic 1.93) for negative phase I results. The
mean cumulative abnormal volume over the three-day window documents that the trading
volume increases significantly for negative phase II and III results, compared to day zero
(11.55 percent > 7.82 percent, and 4.94 percent > 2.58 percent, respectively). In contrast, the
trading volumes (in regards to the positive and negative phase I results) only exhibit small
differences between the one- and three-day event windows. In summary, the results of Table 3
indicate that H2 cannot be rejected.
Table 3 also reports that the stock market reacts positively to news about the initiations of
clinical phase I (1.55 percent, t-statistic 3.07) and clinical phase II (1.23 percent, t-statistic
2.46), but that there is no significant reaction to initiations of clinical phase III. There are two
explanations for this result for clinical phase III. First, phase initiations are not always good
news because firms may start a clinical trial for fewer indications than were being
investigated in the prior stage (Joos, 2003). Second, following positive clinical phase II
results, the initiation of clinical phase III trials may already be anticipated by investors.
For robustness reasons, I examine if the findings are consistent using different alternative
event windows. Table 4 presents the mean cumulative abnormal return (volume) for R&D
announcements for two different event windows: days −2 to +2, and days −2 to +10,
respectively. Overall, the results reveal that the price and volume-reactions to phase II and
phase III results are persistent over longer event windows, while only price-reactions to
negative phase I results are persistent.
5.3 Cross-sectional regression results
One key feature in the biotechnology industry is that firms disclose quite detailed information
and, quite possibly, there is no other industry in which such detailed information about
ongoing projects is disposed. Corporate disclosures concerning clinical trial results in general
contain information, such as type of compound, indication and therapy area, stage of
development, number of patients, comments made by CEO and/or medical director et cetera.
In addition, disclosures contain information about if the primary and/or secondary endpoint/s
of the study was met (such as safety, efficacy, or tolerability of the drug), which is based upon
- 89 -
pre-defined measures.27
Hence, clinical trial results are subject to a good news-bad news
ranking (Guo et al, 2004).
If the stock market responds differently to similar type of information, the results may be
driven by key features of the sample. For example, a firm with a single project in phase II has
a considerably different risk profile than a firm with five projects in clinical trials of which
one is phase II. Joos (2003) proposes that collecting a richer set of data on micro level might
provide additional insight into the value creation process and how R&D contributes to the
value of a biotech firm. While important to investors, reliable measures of these differences
are scarce in the literature.
To examine the association between the magnitude of the three-day cumulative abnormal
return and the project- and firm-specific variables, a cross-sectional regression model is used.
Table 5, panel A, presents summary statistics of the independent variables. The mean success
rate (COMPLEXITY) per therapy area is 0.56. The average clinical trial (INVESTMENT)
enrolls 176 patients (or health volunteers). 24.5 percent of the projects are developed in
collaboration with a partner (RISK_SHARING). However, there is a large variation in the size.
The largest clinical trial involves 3,000 patients and the smallest has only 10 patients enrolled
(not tabulated). The average market capitalization (DIVERSIFICATION) is €369 million.
Most of the firms are quite small, though a few firms are substantially larger than the average
(not tabulated). Panel B of Table 5 contains a pair-wide correlation matrix and documents a
low correlation overall between the independent variables.
Table 6 presents the results of the cross-sectional regression model. The dependent variables
are the day zero abnormal returns for (i) all positive R&D announcements, (ii) positive phase
I announcements, and (iii) positive phase II announcements. In general, these tests confirm
our expectations. Model (i) documents negative and significant effects of COMPLEXITY (t-
statistic −2.00) and DIVERSIFICATION (t-statistic −2.21), as well as a positive and
significant effect of INVESTMENT (t-statistic 1.99). In model (ii) and model (iii), positive
R&D announcements of phase I and II are tested separately. Both models suggest that
COMPLEXITY, INVESTMENT and DIVERSIFICATION are statistically significant.
27
Stock exchange regulations not only require information disclosed by the company to be correct, relevant,
clear, and not misleading. It also requires information to be comprehensive enough to provide adequate guidance
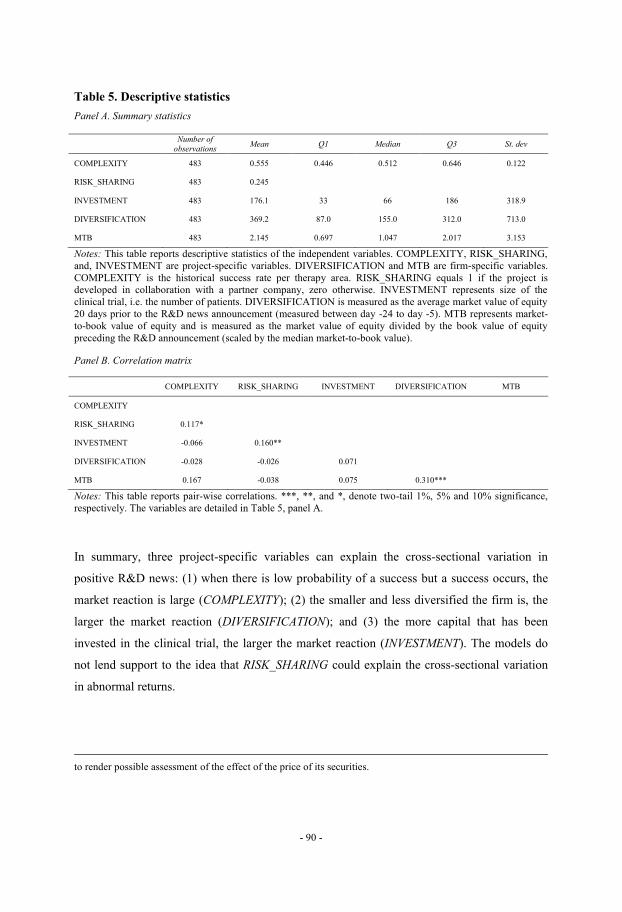
- 90 -
Table 5. Descriptive statistics
Panel A. Summary statistics
Number of
observations Mean Q1 Median Q3 St. dev
COMPLEXITY 483 0.555 0.446 0.512 0.646 0.122
RISK_SHARING 483 0.245
INVESTMENT 483 176.1 33 66 186 318.9
DIVERSIFICATION 483 369.2 87.0 155.0 312.0 713.0
MTB 483 2.145 0.697 1.047 2.017 3.153
Notes: This table reports descriptive statistics of the independent variables. COMPLEXITY, RISK_SHARING,
and, INVESTMENT are project-specific variables. DIVERSIFICATION and MTB are firm-specific variables.
COMPLEXITY is the historical success rate per therapy area. RISK_SHARING equals 1 if the project is
developed in collaboration with a partner company, zero otherwise. INVESTMENT represents size of the
clinical trial, i.e. the number of patients. DIVERSIFICATION is measured as the average market value of equity
20 days prior to the R&D news announcement (measured between day -24 to day -5). MTB represents market-
to-book value of equity and is measured as the market value of equity divided by the book value of equity
preceding the R&D announcement (scaled by the median market-to-book value).
Panel B. Correlation matrix
COMPLEXITY RISK_SHARING INVESTMENT DIVERSIFICATION MTB
COMPLEXITY
RISK_SHARING 0.117*
INVESTMENT -0.066 0.160**
DIVERSIFICATION -0.028 -0.026 0.071
MTB 0.167 -0.038 0.075 0.310***
Notes: This table reports pair-wise correlations. ***, **, and *, denote two-tail 1%, 5% and 10% significance,
respectively. The variables are detailed in Table 5, panel A.
In summary, three project-specific variables can explain the cross-sectional variation in
positive R&D news: (1) when there is low probability of a success but a success occurs, the
market reaction is large (COMPLEXITY); (2) the smaller and less diversified the firm is, the
larger the market reaction (DIVERSIFICATION); and (3) the more capital that has been
invested in the clinical trial, the larger the market reaction (INVESTMENT). The models do
not lend support to the idea that RISK_SHARING could explain the cross-sectional variation
in abnormal returns.
to render possible assessment of the effect of the price of its securities.
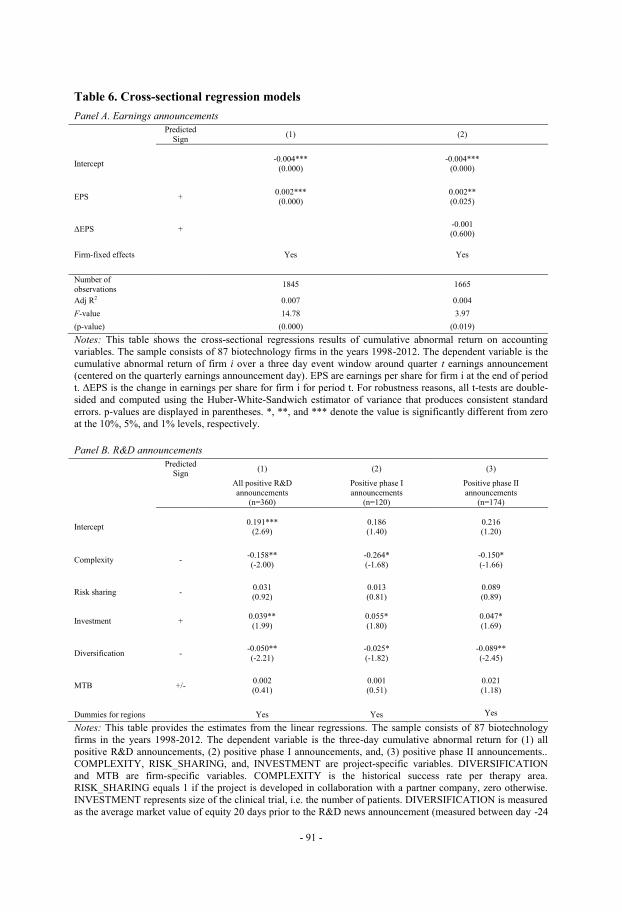
- 91 -
Table 6. Cross-sectional regression models
Panel A. Earnings announcements
Predicted
Sign (1) (2)
Intercept -0.004***
(0.000)
-0.004***
(0.000)
EPS + 0.002***
(0.000)
0.002**
(0.025)
ΔEPS + -0.001 (0.600)
Firm-fixed effects Yes Yes
Number of
observations 1845 1665
Adj R2 0.007 0.004
F-value 14.78 3.97
(p-value) (0.000) (0.019)
Notes: This table shows the cross-sectional regressions results of cumulative abnormal return on accounting
variables. The sample consists of 87 biotechnology firms in the years 1998-2012. The dependent variable is the
cumulative abnormal return of firm i over a three day event window around quarter t earnings announcement
(centered on the quarterly earnings announcement day). EPS are earnings per share for firm i at the end of period
t. ΔEPS is the change in earnings per share for firm i for period t. For robustness reasons, all t-tests are double-
sided and computed using the Huber-White-Sandwich estimator of variance that produces consistent standard
errors. p-values are displayed in parentheses. *, **, and *** denote the value is significantly different from zero
at the 10%, 5%, and 1% levels, respectively.
Panel B. R&D announcements
Predicted
Sign (1) (2) (3)
All positive R&D
announcements (n=360)
Positive phase I
announcements (n=120)
Positive phase II
announcements (n=174)
Intercept 0.191***
(2.69) 0.186 (1.40)
0.216 (1.20)
Complexity - -0.158**
(-2.00)
-0.264*
(-1.68)
-0.150*
(-1.66)
Risk sharing - 0.031
(0.92)
0.013
(0.81)
0.089
(0.89)
Investment + 0.039**
(1.99)
0.055*
(1.80)
0.047*
(1.69)
Diversification - -0.050**
(-2.21)
-0.025*
(-1.82)
-0.089**
(-2.45)
MTB +/- 0.002
(0.41)
0.001
(0.51)
0.021
(1.18)
Dummies for regions Yes Yes Yes
Notes: This table provides the estimates from the linear regressions. The sample consists of 87 biotechnology
firms in the years 1998-2012. The dependent variable is the three-day cumulative abnormal return for (1) all
positive R&D announcements, (2) positive phase I announcements, and, (3) positive phase II announcements..
COMPLEXITY, RISK_SHARING, and, INVESTMENT are project-specific variables. DIVERSIFICATION
and MTB are firm-specific variables. COMPLEXITY is the historical success rate per therapy area.
RISK_SHARING equals 1 if the project is developed in collaboration with a partner company, zero otherwise.
INVESTMENT represents size of the clinical trial, i.e. the number of patients. DIVERSIFICATION is measured
as the average market value of equity 20 days prior to the R&D news announcement (measured between day -24
- 92 -
to day -5). MTB represents market-to-book value of equity and is measured as the market value of equity divided
by the book value of equity preceding the R&D announcement (scaled by the median market-to-book value). For
robustness reasons, all t-tests are double-sided and computed using the Huber-White-Sandwich estimator of
variance that produces consistent standard errors. p-values are displayed in parentheses. *, **, and *** denote
the value is significantly different from zero at the 10%, 5%, and 1% levels, respectively.
6. Conclusion
This paper investigates the stock market’s reaction to disclosures of accounting and non-
accounting information in the biotechnology industry. The interest in the value-relevance of
non-accounting information stems from the concern that accounting information is not
particularly relevant for firms in R&D intensive industries which invest heavily in intangibles
that are immediately expensed and less frequently capitalized. The biotechnology industry has
two features that make studies of market reactions to the disclosure of non-accounting
information of special interest. First, disclosures are generally mandatory (rather than
voluntary), and hence, self-selection biases are less prominent. Second, the drug development
process is heavily regulated and monitored by regulatory authorities. As a result, the non-
discretionary nature of disclosures in this industry overcomes the common criticism of
endogenous event in the event study literature.
The empirical study is based on a unique hand-collected dataset of all publicly-listed firms in
the European biotech industry from 1998–2012. While prior studies have used data from the
US stock exchanges, this study provides the largest analysis by far of the European biotech
industry, covering 87 firms from 11 countries over 15 years. Using price and return regression
models, as well as examining the price and trading volume reactions, earnings are not
considered value-relevant to investors. In contrast, the study shows the extent to which
different non-accounting information, such as positive and negative news announcements
concerning R&D projects, are value-relevant to investors and can influence security prices
and trading volumes. The study provides evidence of differences in market reactions
according to predictions. In particular, there are differences in stock price and trading volume
differences between projects in different phases, as well as between positive and negative
outcomes. The study also documents how market reactions are explained using project- and
firm-specific variables.
The findings highlight two important issues. First, the large stock market reaction to clinical
trial events is of great concern to both investors and management of biotechnology
companies. Firm managers may be reluctant to disclose negative R&D news; this reluctance
- 93 -
highlights the importance of stock exchange regulations and the disclosure of price-sensitive
information. At the same time, the disclosure of information has to be credible and reliable to
investors and other market participants. This is of crucial importance in an industry where
capital markets provide the only funding alternative. Although trading regulations require
firms to disclose price-sensitive information when it appears, there seem to be at least some
managerial discretion in the wording of clinical trial announcements. Regulators should
provide a robust framework regarding the information content in press releases. Second, the
firm’s managers may use the value-relevant R&D news as an instrument to access the capital
markets when information asymmetries are low and when there is a chance that investors will
understand the firm’s prospects better.
References
Ajinkya, B. B., Jain, P. C., 1989. The behavior of daily stock market trading volume. Journal
of Accounting and Economics 11, 331-359.
Amir, E., Lev, B., 1996. Value-relevance of nonfinancial information: The wireless
communications industry. Journal of Accounting and Economics 22, 3-30.
Bamber, L., 1986. The information content of annual earnings releases: A trading volume
approach. Journal of Accounting Research 24, 40-56.
Barth, M. E., Beaver, W. H., Landsman, W. R., 2001. The relevance of the value-relevance
literature for financial standard setting: Another view. Journal of Accounting and Economics
31, 77-104.
Beaver, W. H., 1968. The information content of annual earnings announcements. Journal of
Accounting Research 6, 67-92.
Behn, B., Riley, R., 1999. Using nonfinancial information to predict financial performance:
The case of the U.S. airline industry. Journal of Accounting, Auditing, and Finance (Winter),
29-56.
Botosan, C. A., 1997. Disclosure level and the cost of capital. The Accounting Review 72,
323-349.
- 94 -
Campbell, J. Y., Lo, A. W., MacKinlay, C. A., 1997. The econometrics of financial markets.
Princeton: Princeton University Press.
Cerbioni, F., Parbonetti, A., 2007. Exploring the effects of corporate governance on
intellectual capital disclosure: An analysis of European biotechnology companies. European
Accounting Review 16, 791-826.
Collins, D. W., Maydew, E. L., Weiss, I. S., 1997. Changes in the value-relevance of earnings
and book values over the past forty years. Journal of Accounting and Economics 24, 39-67.
Dedman, E., Lin, S. W-J., Prakash, J. A., Chang, C-H., 2008. Voluntary disclosure and its
impact on share prices: Evidence from the UK biotechnology sector. Journal of Accounting
and Public Policy 27, 195-216.
Diamond, D., Verrecchia, R., 1991. Disclosure, liquidity, and the cost of capital. Journal of
Finance 46, 1325-1359.
DiMasi, J., 2001. Risks in new drug development: Approval success rates for investigational
drugs. Clinical Pharmacology & Therapeutics 69, 297-307.
Easton, P., Harris, T., 1991. Earnings as an explanatory variable for returns. Journal of
Accounting Research 29, 19-36.
Ely, K., Simko, P. J., Thomas, L. G., 2003. The usefulness of biotechnology firms: Drug
development status in the evaluation of research and development costs. Journal of
Accounting, Auditing and Finance 18, 163-196.
Fisher, W. O., 2002. Key disclosure issues for life sciences companies: FDA product
approval, clinical test results, and government inspections. Michigan Telecommunications
and Technology Law Review 8, 115-193.
Francis, J., Schipper, K., 1999. Have financial statements lost their relevance? Journal of
Accounting Research 37, 319-352.
Guo, R-J., Lev, B., Zhou, N., 2004. Competitive costs of disclosure by biotech IPOs. Journal
of Accounting Research 42, 319-355.

- 95 -
Healy, P. M., Palepu, K. J., 2001. Information asymmetry, corporate disclosure and the
capital markets: A review of the empirical disclosure literature. Journal of Accounting and
Economics 31, 405-440.
Holthausen, R. W., Watts, R. L., 2001. The relevance of the value-relevance literature for
financial accounting standard setting. Journal of Accounting and Economics 31, 3-75.
Joos, P., 2003. Discussion – The usefulness of biotechnology firms: Drug development status
in the evaluation of research and development costs. Journal of Accounting, Auditing and
Finance 18, 197-205.
Kale, P., Dyer, J., Singh, H., 2002. Allicance capability, stock market response, and long term
alliance success: The role of the alliance function. Strategic Management Journal 23, 747-
767.
Karpoff, J. M., 1986. A theory of trading volume. Journal of Finance 41, 1069-1087.
Kim, O., Verrecchia, R., 1991a. Market reaction to anticipated announcements. Journal of
Financial Economics 30, 273-309.
Kim, O., Verrecchia, R., 1991b. Trading volume and price reactions to public announcements.
Journal of Accounting Research 29, 302-321.
Kothari, S., Zimmerman, J., 1995. Price and return models. Journal of Accounting and
Economics 20, 155-192.
La Porta, R., Lopez-de-Silanes, F., Shleifer, A., Vishny, R. W., 1998. Law and finance.
Journal of Political Economy 106, 1113-1155.
Lang, M., Lundholm, R., 1996. Corporate disclosure policy and analyst behavior. The
Accounting Review 71, 467–493.
Lev, B., Sougiannis, T., 1996. The capitalization, amortization, and value-relevance of R&D.
Journal of Accounting and Economics 21, 107-138.
Lin, Y-M., You, S-J., Lin, F-J., 2008. The effects of pre-issue information releases on
seasoned equity offerings. Journal of Business Finance & Accounting 35, 1138-1163.
MacKinlay, C. A., 1997. Event studies in economics and finance. Journal of Economic
Literature 35, 13-39.
- 96 -
McConomy, B., Xu, B., 2004. Value creation in the biotechnology industry. CMA
Management, 29-31.
Oswald, R. D., Zarowin, P., 2007. Capitalization of R&D and the informativeness of stock
prices. European Accounting Review 16, 703-726.
Roni, M., Jean-Luc, V., 1996. Trading volume with private valuation: Evidence from the ex-
dividend day. The Review of Financial Studies 9, 471–509.
Schultz, P., 2003. Pseudo market timing and the long-run underperformance of IPOs. Journal
of Finance 58, 483-517.
Viswanathan, S., Wei, B., 2008. Endogenous events and long-run returns. Review of
Financial Studies 21, 855-888.
Yang, Y., 2008. The value-relevance of nonfinancial information: The biotechnology
industry. Advances in Accounting 23, 287-314.

II

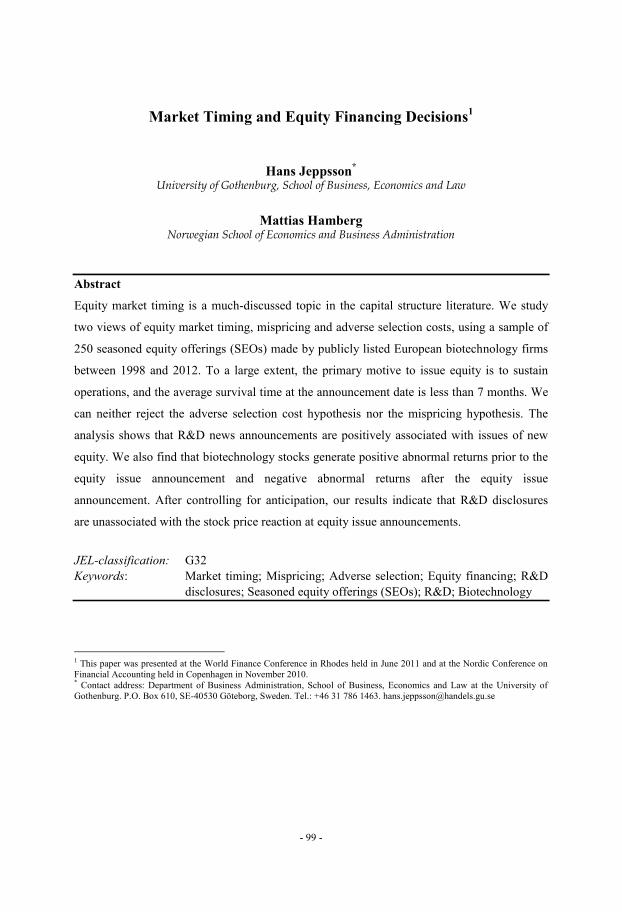
- 99 -
Market Timing and Equity Financing Decisions1
Hans Jeppsson*
University of Gothenburg, School of Business, Economics and Law
Mattias Hamberg Norwegian School of Economics and Business Administration
Abstract
Equity market timing is a much-discussed topic in the capital structure literature. We study
two views of equity market timing, mispricing and adverse selection costs, using a sample of
250 seasoned equity offerings (SEOs) made by publicly listed European biotechnology firms
between 1998 and 2012. To a large extent, the primary motive to issue equity is to sustain
operations, and the average survival time at the announcement date is less than 7 months. We
can neither reject the adverse selection cost hypothesis nor the mispricing hypothesis. The
analysis shows that R&D news announcements are positively associated with issues of new
equity. We also find that biotechnology stocks generate positive abnormal returns prior to the
equity issue announcement and negative abnormal returns after the equity issue
announcement. After controlling for anticipation, our results indicate that R&D disclosures
are unassociated with the stock price reaction at equity issue announcements.
JEL-classification: G32
Keywords: Market timing; Mispricing; Adverse selection; Equity financing; R&D
disclosures; Seasoned equity offerings (SEOs); R&D; Biotechnology
1 This paper was presented at the World Finance Conference in Rhodes held in June 2011 and at the Nordic Conference on
Financial Accounting held in Copenhagen in November 2010. * Contact address: Department of Business Administration, School of Business, Economics and Law at the University of
Gothenburg. P.O. Box 610, SE-40530 Göteborg, Sweden. Tel.: +46 31 786 1463. [email protected]
- 100 -
1. Introduction
Growing enterprises usually require external capital to fund their operations. Accessing
capital markets is a balancing act that depends on both firm- and market-specific factors.
Somewhat surprisingly, academic research is still puzzled by management’s decisions over
when and why to seek external equity financing. Over the years, two main theories have
emerged: the mispricing and the adverse selection cost theories. According to the mispricing
theory, managers seek external financing when it is easily available at favorable prices (Ritter,
1991; Loughran and Ritter, 1995; Baker and Wurgler, 2002). For the same reason, they
repurchase shares when prices are excessively low (Ikenberry et al., 1995). The mispricing
theory suggests that managers believe the firm is not always correctly priced and that
managers want to capitalize on the mispricing. In contrast, the adverse selection cost theory is
built on a dynamic framework of the Myers and Majluf (1984) model, where time-varying
asymmetric information plays a major role. The rationale goes that firms issue equity when
adverse selection costs are low, that is, following credible information releases (Korajczyk et
al., 1991). Consequently, the adverse selection cost theory suggests there are moments when
it is more favorable for managers to issue equity without necessarily acting solely in their own
interest.
Past empirical research has verified the importance of both theories; but the emphasis has
been on the mispricing theory. As accounting information provides credible signals of how an
economic entity performs, the adverse selection cost theory tends to be tested in association
with the release of accounting information (e.g. Korajczyk et al., 1991; 1992). However, an
issue of new equity might be made after accounting information has been disclosed because
management believes that the firm’s prospects are mispriced. In particular, accounting
information is discretionary and an issue of new equity is likely to influence accounting
choices and perhaps even provoke earnings management. While it is likely that the disclosure
of accounting information reduces information asymmetry, it is unlikely that accounting
information provides a clean test of the adverse selection cost hypothesis.
With these issues in mind, we study an industry; biotechnology, that has some attractive
characteristics. Equity capital is a primary source of funding for publicly listed early-stage
and not yet profitable growth firms (Bolton and Freixas, 2000; Rajan and Zingales, 1998;
Ravid and Spiegel, 1997). Typically, biotechnology firms are in an early life-cycle stage with
no commercial products and, hence, their investments cannot be internally funded. Because
- 101 -
investments are mainly in unrecognized intangible assets they cannot use debt financing
either, and instead they issue new equity on a regular basis. The biotechnology industry,
therefore, permits a study of equity market timing without having to think about alternative
sources of external capital. Because biotechnology firms are in the early life-cycle stage and
invest heavily in R&D, accounting information is a poor indicator of value creation (Dedman
et al., 2008; McConomy and Xu, 2004). However, indirectly, regulatory authorities, such as
the US Food & Drug Administration (FDA), make independent assessments of the research
projects. These R&D disclosures are mandatory, non-discretionary and value-relevant (e.g.
Fisher, 2002).
In this setting, we study equity market timing and assess the mispricing and adverse selection
cost arguments. Similar to Loughran and Ritter (1995, 1997), Baker et al. (2003), Huang and
Ritter (2009), DeAngelo et al. (2010), mispricing is measured using stock returns (pre-
abnormal return and post-abnormal return). We expect the prior (future) stock abnormal
return to be positively (negatively) associated with the probability that a firm conducts an
SEO. The adverse selection cost hypothesis is tested using the mandatory non-discretionary
information that biotechnology firms have to release about their research projects’ progress.
We expect firms to issue new equity when the degree of asymmetric information is lower, i.e.,
following announcements of the research projects’ current status.
The primary motive for seeking external financing is a need to sustain operations. Therefore,
we expect market timing (either because of mispricing or adverse selection costs) to provide
incremental explanatory power to the biotechnology firm’s survival time.2 The sample
consists of 87 European biotechnology firms that have been publicly listed sometime between
1998 and 2012. In total, these firms have made 250 equity offerings and 561 public
announcements concerning their research projects’ progress as compared with regulatory
authorities’ assessment criteria.
The empirical data confirms that new equity, to a large extent, is issued to sustain operations;
the average survival time at the announcement date is 7 months. This is consistent with
DeAngelo et al. (2010). In addition to the survival time, there is support for both the adverse
selection cost hypothesis and the mispricing hypothesis, and both have incremental effects.
2 An example of market timing is exemplified by the following paragraph from a press release on March 23,
2010, for the French biotechnology firm Transgene, which went public in 1998: “In light of its net cash position
at December 31, 2009, of €64.7 million, the Company is able to determine the timing of the fund raising and its
announcement when it deems the conditions most appropriate”.
- 102 -
We find that biotechnology stocks generate positive abnormal returns prior to the equity issue
announcement and negative abnormal returns after the equity issue announcement. However,
the mispricing measure is sensitive to the length of the selected time period prior to and after
the equity issue announcement. We also find that R&D news announcements are positively
associated with issues of new equity. Although R&D news announcements are helpful to
investors to anticipate equity issues our results indicate that they are unable to reduce the
information asymmetry at the equity issue announcement. Controlling for anticipation using
the conditional event study methodology (Acharya, 1988) we do not find that R&D
disclosures are associated with the stock price reaction at the equity issue announcement.
The remainder of the paper is outlined in the following way. Section two provides a
theoretical framework, an overview of prior studies and a presentation of the two research
hypotheses. Section three discusses methodological issues related to the study. Section four
contains the empirical results. Section five includes additional tests and, finally, section six
concludes.
2. Theory and research hypotheses
2.1 Market timing and capital structure
The capital structure decision has puzzled finance researchers for decades (Lintner, 1965;
Myers, 1984), and two main capital structure theories dominate research: the “static trade-off”
and the “pecking-order” theories. According to the static trade-off theory, firms have a target
capital structure, determined by advantages and disadvantages of debt financing (Jensen and
Meckling, 1976; Myers, 1977). Although agency costs are important in this setting, the capital
structure decision depends on a rational analysis of relevant factors, and there is little room
for managerial opportunism or for the timing of capital markets.
According to the pecking-order theory, firms follow a financing hierarchy, in which they
prefer to finance their investments with internal funds, then with external debt, and with
issues of new equity as a last resort (Myers and Majluf, 1984; Myers, 1984). The pecking-
order theory considers that agents make the decision, and that information is asymmetrically
distributed between the firm’s management and shareholders. In a similar vein, it is suggested
that a firm’s capital structure is an effect of management’s ability to seek external financing
- 103 -
when easily accessible at a low cost (Baker and Wurgler, 2002). Two views on equity market
timing have emerged: the mispricing and the adverse selection cost hypotheses3.
2.2 The mispricing theory
The standard finance model, in which rational investors ensure that stock prices equal the
present value of expected future cash flows, has considerable problems explaining many stock
market events (Shiller, 2000; Baker and Wurgler, 2007). Empirical research has come across
several factors, such as size and the book-to-market ratio, which seems to be associated with
stock returns without necessarily being measures of systematic risk. It is, therefore, not
surprising that corporate finance decisions (e.g., initial public offerings, mergers, acquisitions
and issues of equity and debt) are non-random. Just like investors, managers make use of
capital markets as if they are predictable. The seemingly systematic variations in the
association between stock price and fundamentals form the basis for the mispricing
hypothesis of equity issuance.
There are many reasons for taking a privately owned firm public, including investment needs
and public attention. However, a most important reason is that owners of the private firm
believe they get a good price. Initial public offerings (IPOs) occur in cycles (Ibbotson and
Jaffe, 1975; Ritter, 1984; Ibbotson et al., 1988, 1994) that seem to follow stock market
sentiments; when prices are high, there are more IPOs (Pástor and Veronesi, 2005). In a
similar vein, Alti, (2006) shows that market sentiments increase not only the number of IPOs
but also their size and the proportion of the firm that is sold.
Research on mergers and acquisitions also reveal patterns, usually referred to as merger
waves (Rhodes-Kropf et al., 2005; Harford, 2005; Martynova and Renneboog, 2008). While
merger waves are more complicated to pinpoint – as dependent on prices of both acquiring
and target firms and the method of payment – they stem from the idea of predictable stock
prices. Harford (2005) explain merger waves as the outcome of market timing, where
industries respond to shocks and reorganize through mergers and acquisitions, creating a
clustering of merger activity, in which liquidity plays an important role.
A clustering of seasoned equity offerings (SEOs) in “hot issue” markets is well known in the
finance literature (Hickman, 1953; Choe et al., 1993; Bayless and Chaplinsky, 1996). Starting
with Taggart (1977), many studies also show how firms make more SEOs when market
3 The mispricing hypothesis is built on the notion of market inefficiency, whereas the adverse selection costs
hypothesis assumes market efficiency.
- 104 -
valuations are high relative to book values or historical market values. Survey evidence in
Graham and Harvey (2001) reveals that market timing is a primary concern of corporate
executives: CFOs admit that timing considerations influence financing decisions. In a very
influential study, Baker and Wurgler (2002) find that the capital structure is, by and large, a
product of capital market timing. Several empirical studies have examined the stock market
performance of firms conducting equity issues. For example, Loughran and Ritter (1995) find
that firms issuing stock, either through IPOs or SEOs, experience low returns in subsequent
years. In summary, there is ample evidence that firms take advantage of temporary mispricing
in financial markets and thus issue equity when it is perceived as being overvalued.
The mispricing hypothesis suggests that managers issue new shares when market prices are
high (Ritter, 1991; Loughran and Ritter, 1995, 1997), and repurchase shares when market
prices are low (Ikenberry et al., 1995). There are two possible reasons for this behavior. First,
managers have access to private information and might know better than investors what the
firm’s true performance is. Essentially, managers make use of asymmetrically distributed
information. Second, equity markets, in general, are “hot”, in the sense that investors
temporarily seem to be more optimistic about expected growth rates, profit margins, etc.
Thus, managers make use of market sentiments, rather than asymmetric information, and the
firm’s operating performance is unassociated with the decision to issue new equity (Alti,
2006). We refer our measure of market sentiments to the mispricing theory, which suggests
that prior (future) stock abnormal return is positively (negatively) associated with the
probability of issuing equity (e.g. Baker and Wurgler, 2007; DeAngelo et al., 2010). While
the asymmetric information argument is interesting in itself, our first hypothesis relies on the
latter aspect of mispricing:
H1: Biotechnology firms issue new equity to a greater extent when equity market sentiments
are strong.
2.3 The adverse selection cost theory
In the presence of information asymmetry, the information asymmetry model by Myers and
Majluf (1984) for public offerings suggests that equity issues to outside investors are
associated with an adverse selection problem as managers will issue equity only when they
- 105 -
believe the firm is overvalued. Their model assumes managers act only in the interest of
existing investors, managers have superior information and existing investors do not
participate in the equity issue. Eckbo and Masulis (1992) extend the information asymmetry
framework by Myers and Majluf (1984) and show that rights offerings to existing investors
are associated with a similar adverse selection problem when the anticipated current
shareholder participation is less than 100 percent.
Information asymmetries decrease when new value-relevant information is made public.
Given that the disclosure of value-relevant information varies between firms and over time,
the level of asymmetrically distributed information also varies (Dierkens, 1991; Lucas and
McDonald, 1990; Choe et al., 1993). Immediately following relevant news announcements,
asymmetries are low, but the information advantage of management increases with time.
Korajczyk et al. (1991, 1992) suggest that the perceived change in information asymmetry
raise the adverse selection costs of equity investments. There is thus a rational expectation
that corporate financial decisions, such as issues of new equity, are influenced by information
asymmetry and the release of new credible information. We refer to this as the adverse
selection cost hypothesis of equity issuance, which suggests that firms issue equity when the
market is comparatively better informed.
Empirical research tends to use mandated accounting information as a measure of credible
value-relevant information. Korajzcyk et al. (1991; 1992) find that firms issue more equity
following the disclosure of financial reports, when the asymmetry of information is small. In
addition, the price drop at the announcement of a new equity issue increases with the time
since credible information has been disclosed. All in all, they suggest that adverse selection
costs influence equity issuances negatively and that mandatorily reported accounting
information reduces these costs.
Investors react to different types of information in the equity issuance setting. Korajczyk et al.
(1991) find that accounting earnings have a significant effect on the market’s reaction to the
issuance of new equity. This is supported by Denis and Sarin (2001) who find earnings
announcements from four quarters prior to the offer significantly associated with the market’s
reaction. Therefore, equity issues tend to follow informative earnings releases. Information of
a more discretionary character seems less informative. Loderer and Mauer (1992) find that
dividend announcements do not reduce valuation uncertainty. Lin et al. (2008) get similar
price reactions, although dividends appear to be associated with volume reactions. Most non-
- 106 -
accounting disclosures are discretionary and firms tend to make more such disclosures prior
to issues of new equity (Cooper and Grinder, 1996; Lang and Lundholm, 2000). In summary,
the association between disclosure and issuances of new equity supports the adverse selection
cost hypothesis, and the association improves with the disclosed information’s credibility.
Healy and Palepu (1990) document that firms perform better than usual when they issue new
equity; however, after the issue, their profitability decreases (Loughran and Ritter, 1997).
Quite the same, IPO firms are more profitable than similar firms already listed (Pagano et al.,
1998) and more profitable than they are subsequent to the public listing (Jain and Kini, 1994;
Mikkelson et al., 1997). The excess performance around the time of the issue of new equity
can be a function of equity market timing, but a number of studies suggest that information
disclosures are used opportunistically around the time of the SEO (Rangan, 1998;
Shivakumar, 2000), and the IPO (Teoh et al., 1998a; Teoh et al., 1998b; Roosenboom et al.,
2003). Although accounting information is informative and reduces adverse selection costs
surrounding issuances of equity, it is still manipulable. Other type of announcements, such as
information about major investments, product launches, and collaborations, are even more
discretionary. When tests of the adverse selection cost hypothesis are based on discretionary
information, it is impossible to avoid biases from manipulated information and thus
mispricing issues.
Studying firms in the biotechnology sector is particularly interesting given the problems
highlighted above. Biotechnology firms are in early life-cycle stages, and, with their future
performance being considerably uncertain, the adverse selection cost problems are likely to be
substantial. Because biotechnology firms tend to be unprofitable and are unable to capitalize
their investments as assets, accounting information is less value-relevant (Amir and Lev,
1996; Dedman et al., 2008; McConomy and Xu, 2004). However, regulatory authorities have
to assess biotechnology firms’ investment projects whenever they are in critical stages;
therefore, there are mandatory non-discretionary evaluations of the value-creation process.
Disclosure of how clinical trials progress is known to impact security prices and volumes
(McConomy and Xu, 2004). On the basis of the above-mentioned discussion, we expect the
following:
H2: Biotechnology firms issue new equity to a greater extent after they have released
disclosures of R&D
- 107 -
3. Methodology
3.1 Research setting
The study is based on firms operating in the biotechnology industry, as it offers unique
opportunities to study the decision to issue new equity. Biotechnology firms invest heavily on
a continuous basis, but they can rarely fund these investments internally. Consequently, they
regularly turn to the equity market for new capital.
Two issues make the biotechnology setting interesting. First, investors are unable to use
accounting information in any meaningful way when assessing the biotechnology firm’s
future prospects. If a loss is indicative of future performance, then the firm has no value
(Hayn, 1995). In this case, investments are expensed immediately and, hence, both the income
statement and the balance sheet contain little information useful to forecast future cash flows.
Investors are, therefore, fully dependent on other type of information. Second, biotechnology
firms differ from other research-intensive firms in the sense that the development process is
closely monitored by regulatory authorities with considerable experience of how to evaluate
drugs on issues such as efficacy and safety. Biotechnology firms usually cooperates with
regulatory authorities in early phases of research as a failure to comply with recommendations
might ultimately prolong the development process, inhibit a future drug approval, and even
lead to private lawsuits and enforcement actions by agencies such as the Securities and
Exchange Commission (SEC). Although accounting information has a low association to the
value of biotechnology firms (Dedman et al., 2008; McConomy and Xu, 2004), investors can
rely on information that is verified by regulatory authorities acting independently. A
candidate drug’s progress in clinical trials is a strong signal to investors that the firm creates
value (e.g., Amir and Lev, 1996; McConomy and Xu, 2004).
The equity announcement
Because biotech firms invest substantial amounts in research projects and tend to have few
projects with positive operating cash flows, they need to issue new equity on a regular basis.
From an economic perspective, the main motive for issuing new equity is that projects with a
positive net present value exist and need to be funded. Therefore, when future investment
cash flows cannot be covered by existing funds, the firm seeks external funding to sustain its
survival.4 A negative aspect of issuing new equity is that pre-issue shareholders have to split
4 There might be other options available for the biotech firm. One option is to cancel, or delay, investments. A
considerable portion of the biotech firm’s resources consist of human capital, and while a temporary reduction of

- 108 -
the value of future cash flows with others. Pre-issue shareholders lose rights to future cash
flows unless they subscribe for their part of the new issue.
If a new issue of equity is used to finance previously unconsidered operating activities, the
market’s reactions to the new issue of equity can be positive. However, if the capital is used
to finance ongoing activities, there may be a share price decline following the announcement
of a new issue. Although we make no distinction between different forms of equity issuances
in the empirical study, we acknowledge that there are some notable differences between them.
Eckbo and Masulis (1992) extend the Myers and Majluf (1984) model to explain the adverse
selection problem by issuers with access to alternative flotation methods, such as
pure(uninsured) rights, standby rights and firm-commitment underwritten offerings.
3.2 Research design
R&D disclosures prior to seasoned equity offerings in this study refer to managers’
mandatory disclosures5. Let vi represent public information and managers’ private information
regarding the effects of equity issues on the value of firm i, then:
vi = ui + ηi (1)
where ui represents the public’s prior expectation of vi, and ηi is the managers’ private
information, which outside investors cannot obtain or predict via publicly available
information. Managers are assumed to maximize the interests of existing shareholders and
only issue equity when vi ≥ 0. Accordingly, when ηi ≥ - ui, the managers will choose to issue
equity and when ηi < - ui, the managers will decide not to issue equity. Managers’ private
information is assumed to be independently and normally distributed with mean zero and
variance σ2. Although managers’ private information, ηi, is unobservable, at the time an
equity issue is publicly announced, outside investors recognize both managers’ incentives and
personnel expenses reduces overall costs, it is in reality difficult not to make it a permanent reduction. From a
strategic point of view, it might be undesirable and an absolute last resort. Another option is to sell valuable
resources, should there be any, to another biotech firm. This alternative has two drawbacks; resources are often
difficult to disentangle, and, if so, they often carry a lower value when disentangled. In addition, the choice to
sell assets only exists if there is excess cash in the biotech industry and this tends to be positively correlated with
market sentiments. In other words, it might be just as difficult to sell assets as it is to issue new equity. A final
option is to enter a partnership with another firm on a candidate drug and thereby achieve an upfront cash
payment. 5 Publicly-listed firms are subject to certain requirements about trading rules and regulations. Following general
disclosure rules, firms have an obligation to disclose all information material to stock prices as soon as news
comes into possession. For small biotechnology firms, all results that relate to clinical projects are considered as
price-sensitive information. For a review of disclosure issues for biotechnology and pharmaceutical firms, see
Fisher (2002).
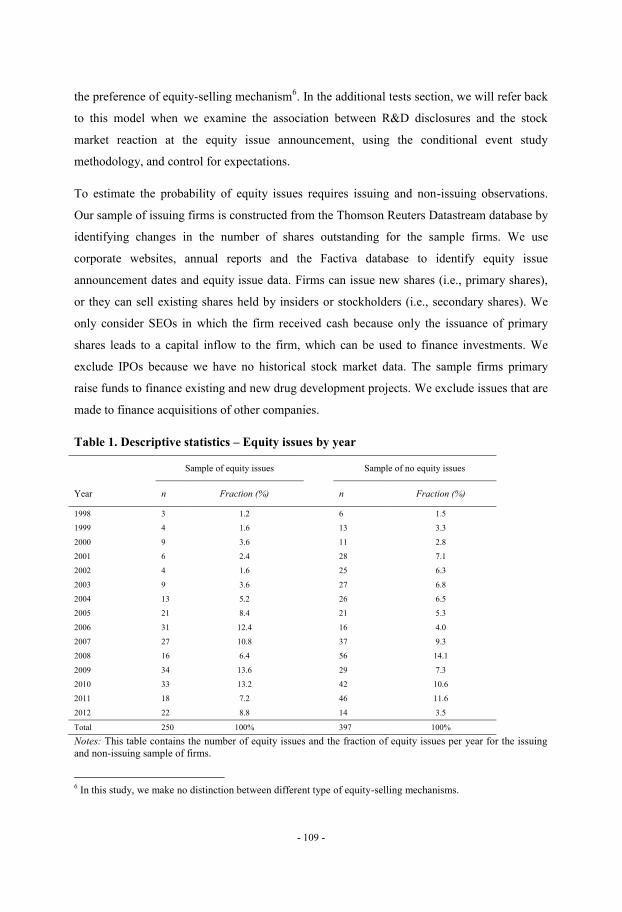
- 109 -
the preference of equity-selling mechanism6. In the additional tests section, we will refer back
to this model when we examine the association between R&D disclosures and the stock
market reaction at the equity issue announcement, using the conditional event study
methodology, and control for expectations.
To estimate the probability of equity issues requires issuing and non-issuing observations.
Our sample of issuing firms is constructed from the Thomson Reuters Datastream database by
identifying changes in the number of shares outstanding for the sample firms. We use
corporate websites, annual reports and the Factiva database to identify equity issue
announcement dates and equity issue data. Firms can issue new shares (i.e., primary shares),
or they can sell existing shares held by insiders or stockholders (i.e., secondary shares). We
only consider SEOs in which the firm received cash because only the issuance of primary
shares leads to a capital inflow to the firm, which can be used to finance investments. We
exclude IPOs because we have no historical stock market data. The sample firms primary
raise funds to finance existing and new drug development projects. We exclude issues that are
made to finance acquisitions of other companies.
Table 1. Descriptive statistics – Equity issues by year
Sample of equity issues
Sample of no equity issues
Year n Fraction (%)
n Fraction (%)
1998 3 1.2 6 1.5
1999 4 1.6 13 3.3
2000 9 3.6 11 2.8
2001 6 2.4 28 7.1
2002 4 1.6 25 6.3
2003 9 3.6 27 6.8
2004 13 5.2 26 6.5
2005 21 8.4 21 5.3
2006 31 12.4 16 4.0
2007 27 10.8 37 9.3
2008 16 6.4 56 14.1
2009 34 13.6 29 7.3
2010 33 13.2 42 10.6
2011 18 7.2 46 11.6
2012 22 8.8 14 3.5
Total 250 100% 397 100%
Notes: This table contains the number of equity issues and the fraction of equity issues per year for the issuing
and non-issuing sample of firms.
6 In this study, we make no distinction between different type of equity-selling mechanisms.

- 110 -
Following Guo and Mech (2000), the sample of non-issuing firms is built using a random
number generator (without replacement) to randomly select 400 security-days from the
sample of firms from 1998 to 2012. We restrict the non-issuing sample and exclude
observations for which there was an equity issue in the subsequent 150 trading days. Three
observations are deleted due to incomplete data. The final sample contains 250 observations
for issuing firms and 397 observations for non-issuing firms. In the probit model, issuing
observations take the value 1, whereas non-issuing observations take the value 0. Table 1
displays the distribution of the number of equity issues per year and the fraction of equity
issues for the sample of issuing and non-issuing firms.
3.3 Research model
We use a probit regression model and differentiate between issuing and non-issuing firms. We
expect both mispricing (pre-abnormal return and post-abnormal return) and adverse selection
costs (R&D news) to have incremental effects beyond those of survival time. This is
consistent with the view of DeAngelo et al. (2010), who find that the primary motive for firms
to issue equity is to meet a short-term need for cash7.
We employ the following model:
( )
(2)
Survival time
Financial distress has a well-known effect on capital structure decisions (Miller and
Modigliani, 1966), and analyses of the decision to issue equity often employ the level of debt
as a proxy of it (e.g., Mackie-Mason, 1990). Biotechnology firms tend not to hold debt, but
given that their cash flows are almost always negative (large continuous investments and little
revenue) costs associated with financial distress are captured using the firm’s expected
“survival time”; the time that the firm can sustain its operations without seeking additional
financing or cutting back on its research activities (Lerner et al., 2003).
Following Lerner et al. (2003) survival time is measured for each quarter as the firm’s
beginning-of-period cash balance scaled by net income. Net income is used as a proxy for
7 DeAngelo et al. (2010) find that 63 percent of issures would run out of cash and 81 percent would operate on
subnormal cash levels without the offer proceeds.

- 111 -
cash flows because biotechnology firms tend to expense most investments immediately and,
in addition, these firms rarely gain revenue from continuous operations. In the regression
models, we use the inverse of the firms’ survival time. There is no association between
positive earnings and survival time (i.e., when earnings are positive, the survival time is
infinite); therefore, the measure is set to zero for profitable firms (Lerner et al., 2003). In
summary, because shorter survival time increases the probability of encountering financial
distress costs, we expect the probability of issuing new equity to decrease with survival time.
Mispricing
The mispricing hypothesis suggests that managers can predict stock returns more precisely
than investors can. Since biotechnology firms expense most of their investments immediately,
the market-to-book ratio to be likely to be a biased measure of mispricing.8 Instead, we use
historic and realized future abnormal stock returns as indicators of mispricing9 (Baker and
Wurgler, 2007; DeAngelo et al., 2010). Our use of realized future stock abnormal returns as a
proxy for managers’ expectations of the firm’s share price performance is similar to Spiess
and Affleck-Graves (1995), Baker et al. (2003), Huang and Ritter (2009), and DeAngelo et al.
(2010). For each firm in the sample, we use the following measures:
Absolute firm stock return: the dividend- and split-adjusted stock return in the 6 months (120
trading days) before and after the equity issue announcement date.
Index stock return: the equal-weighted dividend- and split-adjusted stock return of all other
biotechnology firms (included in the sample) in the 6 months before and after the equity issue
announcement date.
Abnormal stock return: the difference between the absolute and index stock returns. We
assume unsystematic risk is similar across the industry (DeAngelo et al., 2010).
In the empirical analysis, we test for differences in abnormal stock returns between our
sample of issuing and non-issuing firms. We expect the prior (future) stock abnormal return to
be positively (negatively) associated with the probability that a firm conducts an SEO.
8 Indeed, all measures involving accounting information are likely to suffer from biases.
9 Our sample of issuing and non-issuing observations are predominantly made by growth-stage firms. Carlson et
al. (2006) argue that the stock price run-up prior to the seasoned equity offering (SEO) is a reflection of an
increase in the value of growth options, with a subsequent need for capital to exercise them and the exercise
explains the negative returns post the SEO.
- 112 -
Adverse selection costs
We expect the issue of new equity to be positively associated with announcements of the
progress of the biotechnology firm’s candidate drugs in clinical trial. Credible announcements
of the status of research projects reduce adverse selection costs, and, as a result, managers
make use of investors’ better understanding of the firm’s prospects and issue equity shortly
after public news announcements about their R&D projects.
Our main variable for measuring adverse selection costs, R&D news, is a dummy variable
taking the value 1 if a disclosure of R&D is made in days t-40 to t0 preceding the equity issue
announcement date, otherwise 0. We also distinguish between positive and negative news
announcements. Both provide information to investors that reduces adverse selection costs,
but their propensity to do so, as well as their association to other variables might differ.
Although negative news announcements do not carry a subsequent capital requirement, they
generally have a significant negative share price reaction. Dittmar and Thakor (2007) argue
that firms will issue equity when stock prices are high, but only if a high stock price coincides
with low adverse selection. Consequently, we expect to see firms to issue equity only
following positive R&D news1011
. We make no distinction between R&D disclosures that
relate to separate phases in the drug development12
. We also include the variable R&D
newsday, which represents the number of days between a R&D disclosure and an issue
announcement. We use the inverse of the number of days between the R&D disclosure and
the equity issue announcement. This variable is used in the additional tests section.
Control variables
To ensure that results are not driven by omitted correlated variables, we include a number of
control variables. Table 2 provides variable definitions control variables as well as
experimental variables.
10
In this study, no equity issues for issuing firms are preceded by a negative R&D news announcement, whereas
22 equity issues for the non- issuing firms are preceded by negative R&D news announcements. 11
Often, a larger firm is less dependent on individual news announcements; therefore, the control variable firm
size also reduces scaling problems associated with news announcements. 12
Although the information asymmetry may vary between R&D announcements across firms and also concering
R&D announcements for different projects within the same firm, we argue that the disclosure of R&D
information convey a strong signal as the average firm only have around 3-4 clinical projects in different clinical
phases and each phase takes between 1 to 4 years to complete.

- 113 -
Table 2. Variable definitions
Variable Definition/description
Survival time The cash balance (including marketable securities) scaled by net income from the
preceding quarterly report. The inverse of the survival time is used in the
regressions.
Pre-firm return The firm return over the 6 months (120 trading days) preceding the equity issue
announcement date.
Pre-index return The equal-weighted dividend- and split-adjusted stock return of all other
biotechnology firms (included in the sample) over the 6 months preceding the
equity issue announcement date.
Pre-abnormal return The difference between the pre-firm return and the pre-index return.
Post-firm return The firm return over the 24 months after the equity issue announcement date.
Post-index return The equal-weighted dividend- and split-adjusted stock return of all other
biotechnology firms (included in the sample) over the 24 months after the equity
issue announcement date.
Post-abnormal return The difference between post-firm return and the post-index return
R&D news Dummy taking the value 1 if a disclosure of R&D is made in days t-40 to t0
preceding the equity issue announcement date. Otherwise 0.
R&D newsday The number of days between a R&D disclosure and an issue announcement
Bid-ask spread The mean daily bid-ask spread over a six-month period preceding the equity issue
announcement date.
Stock return volatility The standard deviation of daily stock returns over a six-month period prior to the
equity issue.
MTB The market value of equity divided by book value of equity for the quarter closest
in time, but prior to the SEO. Values greater are truncated at 15, i.e. values that are
greater than 15 are set equal to 15.
Firm age Number of years since the firm was incorporated.
Public firm age Number of years since the firm went public.
Firm size The log of the average market value of equity over a six-month period prior to the
equity issue announcement date.
Region dummy Regions classified according to La Porta et al. (1998): Anglo-Saxon, Germanic,
French and Scandinavian legal origins. Anglo-Saxon legal system is used as the
reference.
Notes: This table provides variable definitions of experimental and control variables.
Most shareholders are outsiders and rely on public information alone. They have to rely on
information given to them by management and on insider owners acting in the interest of all
shareholders. The extent to which the biotech firm has been publicly listed and thus upholds a
track record is likely to be an indicator of how well investors know the firm. We measure this
as the number of months that the firm has been publicly listed (public firm age). A firm’s size
(firm size) and market-to-book ratio (MTB) are used to control for several concerns, including
risk and growth opportunities. We also include region dummies to control for potential
differences across institutional settings (La Porta et al., 1998). The four region dummies are:
Anglo-Saxon, Germanic, French and Scandinavian legal origins. We use the Anglo-Saxon
legal system as the reference.
- 114 -
The Pearson correlation matrix for the dependent and independent variables is presented in
Table 3. We note, in particular, that the equity issue decision is positively associated with
survival time, pre-firm return, pre-index return, pre-abnormal return, R&D news, firm age
and public firm age, and negatively associated with post-abnormal return and firm size. As
expected, the two variables pre-firm return and pre-index return are highly correlated with
pre-abnormal return. However, these variables are not included in the same multivariate
regressions. None of the other bivariate correlations between independent variables exceeds a
value of 0.31.
3.4 Interaction effects
We also examine interaction effects between survival time, pre-abnormal return, post-
abnormal return, and R&D news. In contrast to interaction effects in linear models, the
interaction effect in non-linear models is conditional on the independent variables (e.g. Ai and
Norton, 2003; Powers, 2005). We follow the methodology developed by Norton et al. (2004)
to calculate the correct marginal effect of the interaction variables. Norton et al. (2004) show
that the interaction effect may have different signs for different values of covariates.
Therefore, we display the graphs of the distribution of marginal effects and the associated z-
statistics over the entire range of predicted probabilities.
3.5 Conditional event study
In the additional tests section, we examine the association between pre-issue disclosures of
R&D information and the stock market reaction at equity issue announcements. We employ
the conditional event-study methodology (Acharya, 1988), but allow the variance of the
managers’ private information to vary across firms (Guo and Mech, 2000). By incorporating
investor’s expectations, the cumulative abnormal return (CARi), can be expressed as:
( | ) ( | ) ( | ) ( )
( ) (3)
where , and ( ) and ( ) represent the standard normal density and distribution
functions, respectively. We employ a two-stage procedure, as suggested by Acharya (1988)
and Prabhala (1997). In the first stage, we estimate ( ) ( ). We employ the probit
regression model (see equation 2) to estimate ( ) and calculate ( ) from this estimate.
In the second stage, we incorporate ( ) ( ) in the regression model to control for
investor’s expectations.
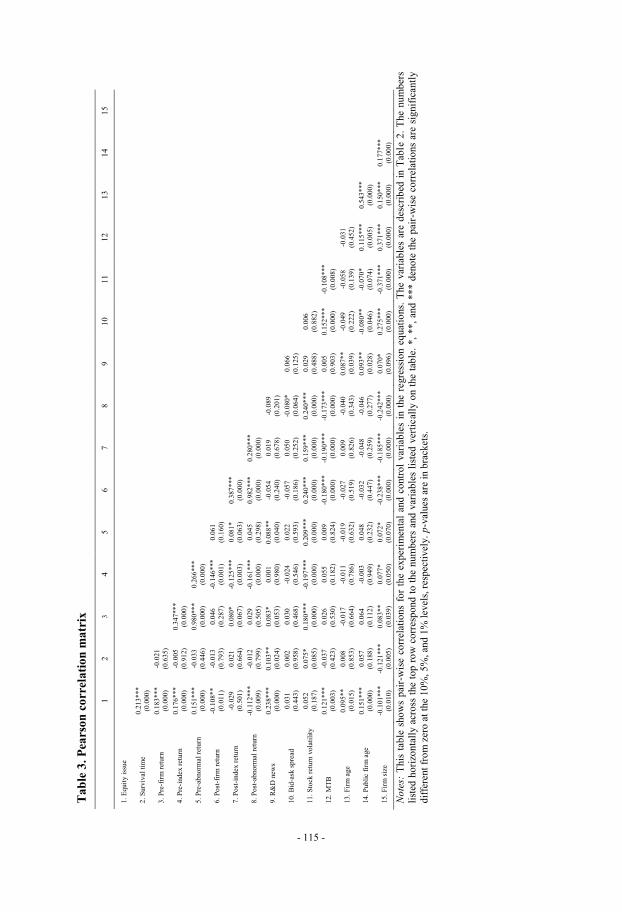
Tab
le 3
. P
ears
on
co
rrel
ati
on
matr
ix
1
2
3
4
5
6
7
8
9
10
1
1
12
13
14
15
1.
Eq
uit
y i
ssue
2.
Surv
ival
tim
e
0.2
13
**
*
(0.0
00
)
3.
Pre
-fir
m r
etu
rn
0.1
83
**
*
(0.0
00
)
-0.0
21
(0.6
35
)
4.
Pre
-ind
ex r
etu
rn
0.1
76
**
*
(0.0
00
)
-0.0
05
(0.9
12
)
0.3
47
**
*
(0.0
00
)
5.
Pre
-ab
no
rmal
retu
rn
0.1
51
**
*
(0.0
00
)
-0.0
33
(0.4
46
)
0.9
80
**
*
(0.0
00
)
0.2
66
**
*
(0.0
00
)
6.
Po
st-f
irm
ret
urn
-0
.10
8*
*
(0.0
11
)
-0.0
13
(0.7
93
)
0.0
46
(0.2
87
)
-0.1
46
**
*
(0.0
01
)
0.0
61
(0.1
60
)
7.
Po
st-i
nd
ex r
etu
rn
-0.0
29
(0.5
01
)
0.0
21
(0.6
64
)
0.0
80
*
(0.0
67
)
-0.1
25
**
*
(0.0
03
)
0.0
81
*
(0.0
63
)
0.3
87
**
*
(0.0
00
)
8.
Po
st-a
bno
rmal
retu
rn
-0.1
12
**
*
(0.0
09
)
-0.0
12
(0.7
99
)
0.0
29
(0.5
05
)
-0.1
61
**
*
(0.0
00
)
0.0
45
(0.2
98
)
0.9
82
**
*
(0.0
00
)
0.2
80
**
*
(0.0
00
)
9.
R&
D n
ews
0.2
38
**
*
(0.0
00
)
0.1
03
**
(0.0
24
)
0.0
83
*
(0.0
53
)
0.0
01
(0.9
80
)
0.0
88
**
(0.0
40
)
-0.0
54
(0.2
40
)
0.0
19
(0.6
78
)
-0.0
89
(0.2
01
)
10
. B
id-a
sk s
pre
ad
0.0
31
(0.4
43
)
0.0
02
(0.9
58
)
0.0
30
(0.4
68
)
-0.0
24
(0.5
46
)
0.0
22
(0.5
93
)
-0.0
57
(0.1
86
)
0.0
50
(0.2
52
)
-0.0
80
*
(0.0
64
)
0.0
66
(0.1
25
)
11
. S
tock
ret
urn
vo
lati
lity
0
.05
2
(0.1
87
)
0.0
75
*
(0.0
85
)
0.1
80
**
*
(0.0
00
)
-0.1
97
**
*
(0.0
00
)
0.2
09
**
*
(0.0
00
)
0.2
40
**
*
(0.0
00
)
0.1
59
**
*
(0.0
00
)
0.2
40
**
*
(0.0
00
)
0.0
29
(0.4
88
)
0.0
06
(0.8
82
)
12
. M
TB
0
.12
1*
**
(0.0
03
)
-0.0
37
(0.4
23
)
0.0
26
(0.5
30
)
0.0
55
(0.1
82
)
0.0
09
(0.8
24
)
-0.1
80
**
*
(0.0
00
)
-0.1
90
**
*
(0.0
00
)
-0.1
73
**
*
(0.0
00
)
0.0
05
(0.9
03
)
0.1
52
**
*
(0.0
00
)
-0.1
08
**
*
(0.0
08
)
13
. F
irm
age
0.0
95
**
(0.0
15
)
0.0
08
(0.8
53
)
-0.0
17
(0.6
64
)
-0.0
11
(0.7
86
)
-0.0
19
(0.6
32
)
-0.0
27
(0.5
19
)
0.0
09
(0.8
26
)
-0.0
40
(0.3
43
)
0.0
87
**
(0.0
39
)
-0.0
49
(0.2
22
)
-0.0
58
(0.1
39
)
-0.0
31
(0.4
52
)
14
. P
ub
lic
firm
age
0.1
51
**
*
(0.0
00
)
0.0
57
(0.1
88
)
0.0
64
(0.1
12
)
-0.0
03
(0.9
49
)
0.0
48
(0.2
32
)
-0.0
32
(0.4
47
)
-0.0
48
(0.2
59
)
-0.0
46
(0.2
77
)
0.0
93
**
(0.0
28
)
-0.0
80
**
(0.0
46
)
-0.0
70
*
(0.0
74
)
0.1
15
**
*
(0.0
05
)
0.5
43
**
*
(0.0
00
)
15
. F
irm
siz
e
-0.1
01
**
*
(0.0
10
)
-0.1
21
**
*
(0.0
05
)
0.0
83
**
(0.0
39
)
0.0
77
*
(0.0
50
)
0.0
72
*
(0.0
70
)
-0.2
38
**
*
(0.0
00
)
-0.1
85
**
*
(0.0
00
)
-0.2
42
**
*
(0.0
00
)
0.0
70
*
(0.0
96
)
0.2
75
**
*
(0.0
00
)
-0.3
71
**
*
(0.0
00
)
0.3
71
**
*
(0.0
00
)
0.1
50
**
*
(0.0
00
)
0.1
77
**
*
(0.0
00
)
No
tes:
This
tab
le s
ho
ws
pai
r-w
ise
corr
elat
ions
for
the
exp
eri
men
tal
and
co
ntr
ol
var
iab
les
in t
he
regre
ssio
n e
quat
ions.
The
var
iab
les
are
des
crib
ed i
n T
able
2.
The
nu
mb
ers
list
ed h
ori
zonta
lly a
cro
ss t
he
top
ro
w c
orr
esp
ond
to t
he
nu
mb
ers
and
var
iab
les
list
ed v
erti
cal
ly o
n t
he
tab
le.
*,
**,
and
**
* d
eno
te t
he
pai
r-w
ise
corr
elat
ions
are
sig
nif
icantl
y
dif
fere
nt
fro
m z
ero
at
the
10
%,
5%
, an
d 1
% l
evel
s, r
esp
ecti
vel
y.
p-v
alues
are
in b
rack
ets.
- 115 -
- 116 -
We use the event study methodology (Brown and Warner, 1985; Campbell et al., 1997) to
compute the cumulative abnormal returns around the time of the issue announcement.
Predicted returns are calculated using the market model with a value weighted market index
(MSCI Europe) over an estimation period of 221 days (t-250 to t-30, where t is the equity issue
announcement date). We use an event window of three days, which includes the day of the
announcement as well as the day before and after. We use the following model:
( )
( ) (4)
R&D news is a dummy variable taking the value 1 if a disclosure of R&D is made in days t-40
to t0 preceding the equity issue announcement date, otherwise 0. The R&D newsday variable
measures the number of days between the equity issue announcement and the R&D
announcement. In the regression models, we use the inverse of the number of days between
the equity issue announcement and the disclosure of R&D. The term ( ) ( ) is the
Heckman’s (1979) inverse Mills’ ratio. The control variables are described in Table 2.
3.6 R&D announcements
This study employs a hand-collected dataset of R&D announcements made by 87 publicly
listed biotechnology firms between 1998 and 2012. In total, these firms have made 561 public
announcements on clinical trial results. These announcements are classified on a good news-
bad news ranking as suggested by Guo et al. (2004). The details of this classification are
discussed in McConomy and Xu (2004). There are some discretionary elements in the
disclosure of news announcements concerning, in particular, research projects in their early
stages. Before initiation, regulatory authorities approve the design of a study, including
primary and secondary endpoints, but they often do not scrutinize the clinical results before
the biotechnology firm initiates the next phase. Opportunistic interpretations of results would,
however, lead to serious discontent from both investors and regulatory authorities.
Table 4 reports the distribution of positive and negative R&D announcements related to
different stages. There are more news announcements concerning phase II projects than there
are concerning phase I projects (and more news announcements concerning phase I projects
than pre-clinical projects). Positive news announcements are more common than negative
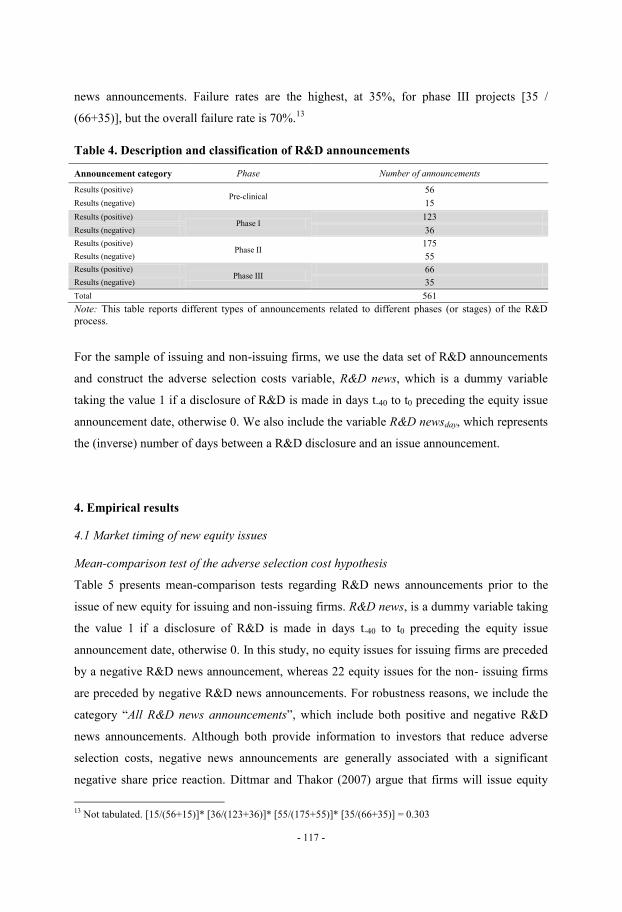
- 117 -
news announcements. Failure rates are the highest, at 35%, for phase III projects [35 /
(66+35)], but the overall failure rate is 70%.13
Table 4. Description and classification of R&D announcements
Announcement category Phase Number of announcements
Results (positive) Pre-clinical
56
Results (negative) 15
Results (positive) Phase I
123
Results (negative) 36
Results (positive) Phase II
175
Results (negative) 55
Results (positive) Phase III
66
Results (negative) 35
Total 561
Note: This table reports different types of announcements related to different phases (or stages) of the R&D
process.
For the sample of issuing and non-issuing firms, we use the data set of R&D announcements
and construct the adverse selection costs variable, R&D news, which is a dummy variable
taking the value 1 if a disclosure of R&D is made in days t-40 to t0 preceding the equity issue
announcement date, otherwise 0. We also include the variable R&D newsday, which represents
the (inverse) number of days between a R&D disclosure and an issue announcement.
4. Empirical results
4.1 Market timing of new equity issues
Mean-comparison test of the adverse selection cost hypothesis
Table 5 presents mean-comparison tests regarding R&D news announcements prior to the
issue of new equity for issuing and non-issuing firms. R&D news, is a dummy variable taking
the value 1 if a disclosure of R&D is made in days t-40 to t0 preceding the equity issue
announcement date, otherwise 0. In this study, no equity issues for issuing firms are preceded
by a negative R&D news announcement, whereas 22 equity issues for the non- issuing firms
are preceded by negative R&D news announcements. For robustness reasons, we include the
category “All R&D news announcements”, which include both positive and negative R&D
news announcements. Although both provide information to investors that reduce adverse
selection costs, negative news announcements are generally associated with a significant
negative share price reaction. Dittmar and Thakor (2007) argue that firms will issue equity
13
Not tabulated. [15/(56+15)]* [36/(123+36)]* [55/(175+55)]* [35/(66+35)] = 0.303
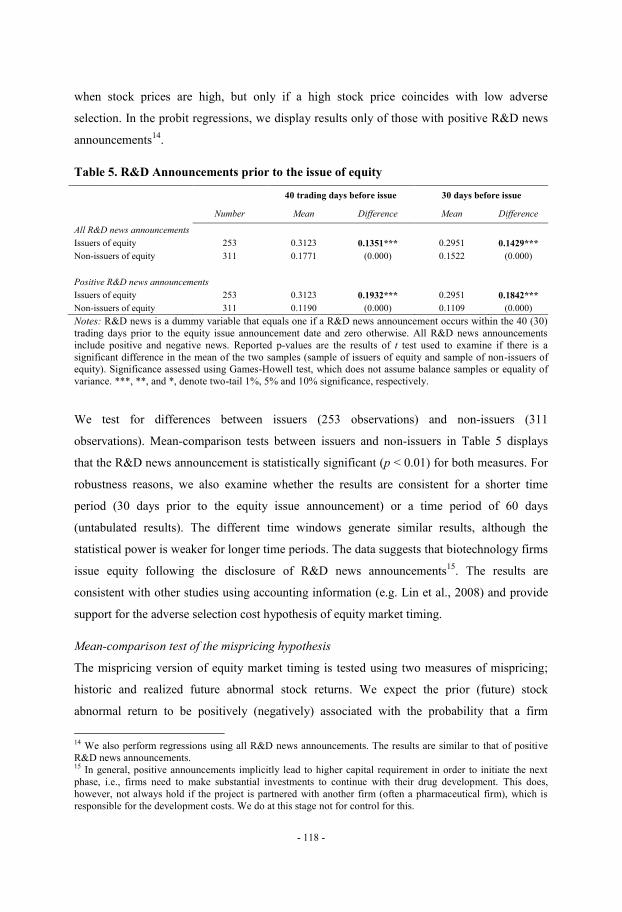
- 118 -
when stock prices are high, but only if a high stock price coincides with low adverse
selection. In the probit regressions, we display results only of those with positive R&D news
announcements14
.
Table 5. R&D Announcements prior to the issue of equity
40 trading days before issue 30 days before issue
Number Mean Difference Mean Difference
All R&D news announcements
Issuers of equity 253 0.3123 0.1351*** 0.2951 0.1429***
Non-issuers of equity 311 0.1771 (0.000) 0.1522 (0.000)
Positive R&D news announcements
Issuers of equity 253 0.3123 0.1932*** 0.2951 0.1842***
Non-issuers of equity 311 0.1190 (0.000) 0.1109 (0.000)
Notes: R&D news is a dummy variable that equals one if a R&D news announcement occurs within the 40 (30)
trading days prior to the equity issue announcement date and zero otherwise. All R&D news announcements
include positive and negative news. Reported p-values are the results of t test used to examine if there is a
significant difference in the mean of the two samples (sample of issuers of equity and sample of non-issuers of
equity). Significance assessed using Games-Howell test, which does not assume balance samples or equality of
variance. ***, **, and *, denote two-tail 1%, 5% and 10% significance, respectively.
We test for differences between issuers (253 observations) and non-issuers (311
observations). Mean-comparison tests between issuers and non-issuers in Table 5 displays
that the R&D news announcement is statistically significant (p < 0.01) for both measures. For
robustness reasons, we also examine whether the results are consistent for a shorter time
period (30 days prior to the equity issue announcement) or a time period of 60 days
(untabulated results). The different time windows generate similar results, although the
statistical power is weaker for longer time periods. The data suggests that biotechnology firms
issue equity following the disclosure of R&D news announcements15
. The results are
consistent with other studies using accounting information (e.g. Lin et al., 2008) and provide
support for the adverse selection cost hypothesis of equity market timing.
Mean-comparison test of the mispricing hypothesis
The mispricing version of equity market timing is tested using two measures of mispricing;
historic and realized future abnormal stock returns. We expect the prior (future) stock
abnormal return to be positively (negatively) associated with the probability that a firm
14
We also perform regressions using all R&D news announcements. The results are similar to that of positive
R&D news announcements. 15
In general, positive announcements implicitly lead to higher capital requirement in order to initiate the next
phase, i.e., firms need to make substantial investments to continue with their drug development. This does,
however, not always hold if the project is partnered with another firm (often a pharmaceutical firm), which is
responsible for the development costs. We do at this stage not for control for this.

- 119 -
conducts an SEO. Table 6 tabulates a mean-comparison analysis of market sentiments around
the issue of equity using different time windows. The means for the 249 issuing and 379 non-
issuing firms are reported separately and t-statistics for differences across these groups are
presented.16
Panel A, B, and C report stock market returns over three different time periods
prior to and after the equity issue announcement; 6, 12 and 24 months, respectively.
In panel A of Table 6, issuers of equity have a higher absolute stock return prior to an equity
issue than non-issuing firms. This is consistent with Asquith and Mullins (1986), Masulis and
Korwar (1986), Lucas and McDonald (1990) and Guo and Mech (2000), who show that firms
tend to issue equity following large stock price run-ups. The result is robust to an event
window of 12 months (Panel B), but becomes statistically insignificant for 24 months (panel
C). Prior index returns are positive and statistically significant across all time periods
preceding the equity issue announcement. Turning over to prior abnormal returns, issuing
firms tend to have experienced high abnormal stock returns over the most recent 6-month
period (0.1511, p < 0.000, panel A), and the relation is even stronger when we extend the time
period to 12 months (0.1917, p < 0.000, panel B). However, prior abnormal return becomes
insignificant (p >0.10) when extending the time period to 24 months (panel C). Post abnormal
returns are negative across all three time periods, but only statistically significant for the 12-
month (p < 0.10) and 24-month window (p < 0.01). One potential reason why the shorter
window do not generate statistically significant results may be due to the timing of new equity
issues occurs in the beginning or the middle of a financing window. Although this analysis
indicates that the mispricing measure is sensitive to the length of the selected time period, our
results from the mean- are largely consistent with Baker et al. (2003), Baker and Wurgler
(2007), DeAngelo et al. (2010) and other studies.
16
The reason for the sample size of issuing and non-issuing rims differ across Panel A, B, and, C in Table 6
is due to lack of historical data when the event window is expanded from 6 months in Panel A to 24 months in
Panel C. Therefore, the abnormal stock return cannot be calculated. For the same reason, in the multiple
regressions in Table 6, there are slightly fewer observations in those quarters when post-abnormal return is used
as an explanatory variable. These differences in sample size have no material effects on the empirical results. To
have a representative sample, we use samples that are as large as possible.
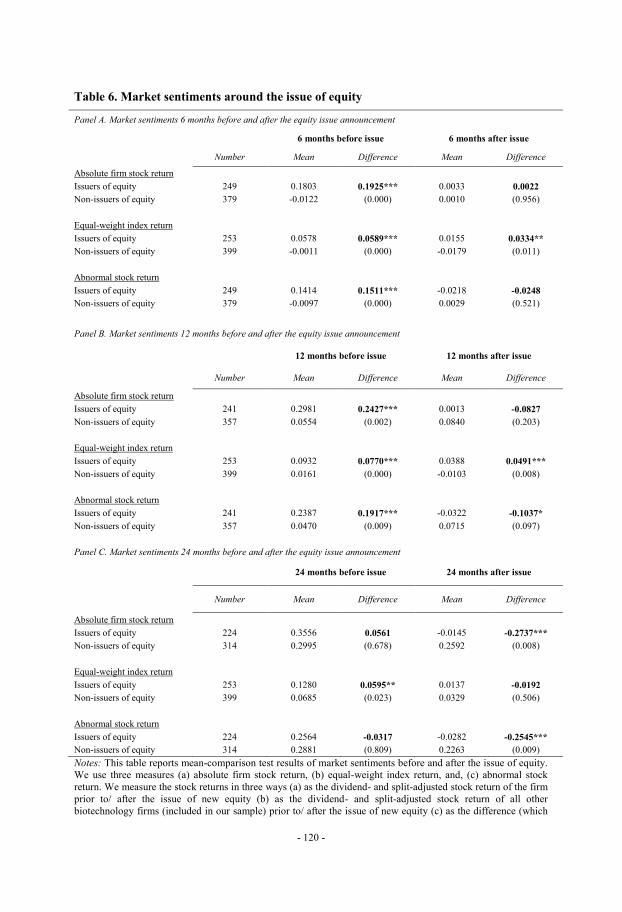
- 120 -
Table 6. Market sentiments around the issue of equity
Panel A. Market sentiments 6 months before and after the equity issue announcement
6 months before issue 6 months after issue
Number Mean Difference Mean Difference
Absolute firm stock return
Issuers of equity 249 0.1803 0.1925*** 0.0033 0.0022
Non-issuers of equity 379 -0.0122 (0.000) 0.0010 (0.956)
Equal-weight index return
Issuers of equity 253 0.0578 0.0589*** 0.0155 0.0334**
Non-issuers of equity 399 -0.0011 (0.000) -0.0179 (0.011)
Abnormal stock return
Issuers of equity 249 0.1414 0.1511*** -0.0218 -0.0248
Non-issuers of equity 379 -0.0097 (0.000) 0.0029 (0.521)
Panel B. Market sentiments 12 months before and after the equity issue announcement
12 months before issue 12 months after issue
Number Mean Difference Mean Difference
Absolute firm stock return
Issuers of equity 241 0.2981 0.2427*** 0.0013 -0.0827
Non-issuers of equity 357 0.0554 (0.002) 0.0840 (0.203)
Equal-weight index return
Issuers of equity 253 0.0932 0.0770*** 0.0388 0.0491***
Non-issuers of equity 399 0.0161 (0.000) -0.0103 (0.008)
Abnormal stock return
Issuers of equity 241 0.2387 0.1917*** -0.0322 -0.1037*
Non-issuers of equity 357 0.0470 (0.009) 0.0715 (0.097)
Panel C. Market sentiments 24 months before and after the equity issue announcement
24 months before issue 24 months after issue
Number Mean Difference Mean Difference
Absolute firm stock return
Issuers of equity 224 0.3556 0.0561 -0.0145 -0.2737***
Non-issuers of equity 314 0.2995 (0.678) 0.2592 (0.008)
Equal-weight index return
Issuers of equity 253 0.1280 0.0595** 0.0137 -0.0192
Non-issuers of equity 399 0.0685 (0.023) 0.0329 (0.506)
Abnormal stock return
Issuers of equity 224 0.2564 -0.0317 -0.0282 -0.2545***
Non-issuers of equity 314 0.2881 (0.809) 0.2263 (0.009)
Notes: This table reports mean-comparison test results of market sentiments before and after the issue of equity.
We use three measures (a) absolute firm stock return, (b) equal-weight index return, and, (c) abnormal stock
return. We measure the stock returns in three ways (a) as the dividend- and split-adjusted stock return of the firm
prior to/ after the issue of new equity (b) as the dividend- and split-adjusted stock return of all other
biotechnology firms (included in our sample) prior to/ after the issue of new equity (c) as the difference (which
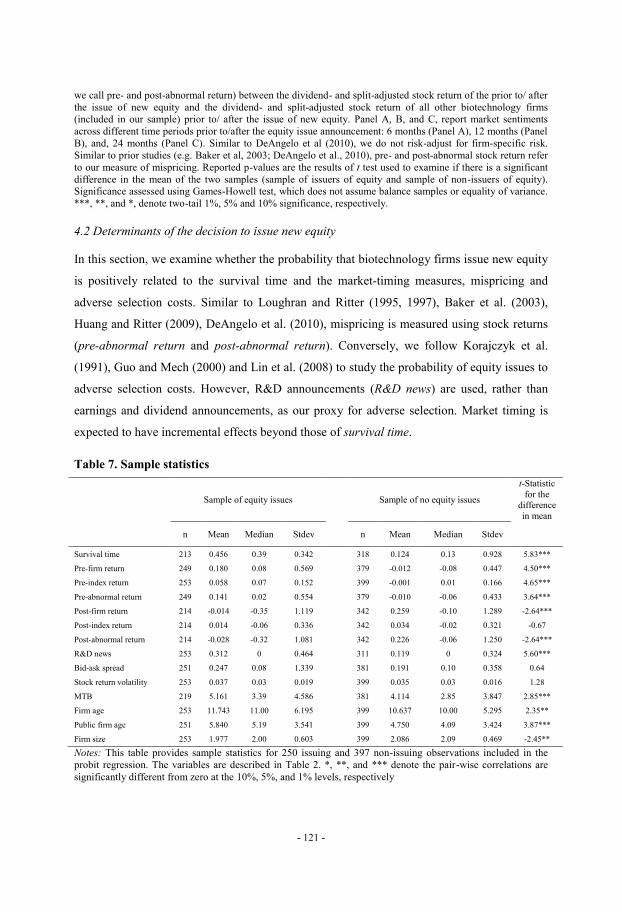
- 121 -
we call pre- and post-abnormal return) between the dividend- and split-adjusted stock return of the prior to/ after
the issue of new equity and the dividend- and split-adjusted stock return of all other biotechnology firms
(included in our sample) prior to/ after the issue of new equity. Panel A, B, and C, report market sentiments
across different time periods prior to/after the equity issue announcement: 6 months (Panel A), 12 months (Panel
B), and, 24 months (Panel C). Similar to DeAngelo et al (2010), we do not risk-adjust for firm-specific risk.
Similar to prior studies (e.g. Baker et al, 2003; DeAngelo et al., 2010), pre- and post-abnormal stock return refer
to our measure of mispricing. Reported p-values are the results of t test used to examine if there is a significant
difference in the mean of the two samples (sample of issuers of equity and sample of non-issuers of equity).
Significance assessed using Games-Howell test, which does not assume balance samples or equality of variance.
***, **, and *, denote two-tail 1%, 5% and 10% significance, respectively.
4.2 Determinants of the decision to issue new equity
In this section, we examine whether the probability that biotechnology firms issue new equity
is positively related to the survival time and the market-timing measures, mispricing and
adverse selection costs. Similar to Loughran and Ritter (1995, 1997), Baker et al. (2003),
Huang and Ritter (2009), DeAngelo et al. (2010), mispricing is measured using stock returns
(pre-abnormal return and post-abnormal return). Conversely, we follow Korajczyk et al.
(1991), Guo and Mech (2000) and Lin et al. (2008) to study the probability of equity issues to
adverse selection costs. However, R&D announcements (R&D news) are used, rather than
earnings and dividend announcements, as our proxy for adverse selection. Market timing is
expected to have incremental effects beyond those of survival time.
Table 7. Sample statistics
Sample of equity issues Sample of no equity issues
t-Statistic
for the
difference
in mean
n Mean Median Stdev n Mean Median Stdev
Survival time 213 0.456 0.39 0.342 318 0.124 0.13 0.928 5.83***
Pre-firm return 249 0.180 0.08 0.569 379 -0.012 -0.08 0.447 4.50***
Pre-index return 253 0.058 0.07 0.152 399 -0.001 0.01 0.166 4.65***
Pre-abnormal return 249 0.141 0.02 0.554 379 -0.010 -0.06 0.433 3.64***
Post-firm return 214 -0.014 -0.35 1.119 342 0.259 -0.10 1.289 -2.64***
Post-index return 214 0.014 -0.06 0.336 342 0.034 -0.02 0.321 -0.67
Post-abnormal return 214 -0.028 -0.32 1.081 342 0.226 -0.06 1.250 -2.64***
R&D news 253 0.312 0 0.464 311 0.119 0 0.324 5.60***
Bid-ask spread 251 0.247 0.08 1.339 381 0.191 0.10 0.358 0.64
Stock return volatility 253 0.037 0.03 0.019 399 0.035 0.03 0.016 1.28
MTB 219 5.161 3.39 4.586 381 4.114 2.85 3.847 2.85***
Firm age 253 11.743 11.00 6.195 399 10.637 10.00 5.295 2.35**
Public firm age 251 5.840 5.19 3.541 399 4.750 4.09 3.424 3.87***
Firm size 253 1.977 2.00 0.603 399 2.086 2.09 0.469 -2.45**
Notes: This table provides sample statistics for 250 issuing and 397 non-issuing observations included in the
probit regression. The variables are described in Table 2. *, **, and *** denote the pair-wise correlations are
significantly different from zero at the 10%, 5%, and 1% levels, respectively
- 122 -
Table 7 shows sample statistics for issuing and non-issuing firms including the experimental
and control variables. The variables are described in Table 2. The average survival time is 7
months17
for issuing firms, which means that firms can sustain operations for less than one
year before the cash balance falls to zero. In comparison, non-issuing firms have an average
survival time of 25 months. Mean-comparison tests of the experimental variables are the same
as in section 4.1. With regard to the control variables, MTB, firm age, public firm age and firm
size are all statistically significant. MTB is positive and statistically significant (p < 0.01). The
mean public firm age is 6 years, indicating that biotechnology firms tend to be quite young.
Firm age and public firm age are both positive and statistically significant (p < 0.01), which
implies that older firms are more likely to issue equity than younger firms. In the probit
regression, we include only the public firm age variable. The firm size variable is negative and
statistically significant (p < 0.05), which indicates that smaller firms are more likely seek
external financing. The stock return volatility variable is statistically insignificant (p > 0.10).
We exclude the stock return volatility control variable from the regression models due to
correlation with several of the experimental variables (see Table 3).
Table 8 presents the results from the probit regressions. We control for bid-ask spread, public
firm age and firm size. In untabulated regressions we also control for growth opportunities
using market-to-book (MTB) as a control variable, but exclude it from the above regression
due to a reduction in sample size due to missing data. A discussion of the MTB variable is
presented after the below section, which shows the main results.
The coefficient of survival time is positive and significant at the 1% level in all models,
indicating that biotechnology firms are more likely to issue equity when they have a near-term
need of cash. The marginal effect indicates that an increase of one unit in survival time
increases the probability of an equity issue by between 79-109%. This is consistent with
DeAngelo et al. (2010). Across most of the models, the intercept is negative and statistically
significant, which implies that the probability of an equity issue is low when all explanatory
variables take values close to zero. In models 2-4, we evaluate the mispricing hypothesis
(H1), which states that biotechnology firms prior (future) abnormal stock return is positively
(negatively) related to the probability of issuing new equity.
17
Survival time (survival time) is computed as the inverse of the ratio of the sum of the company’s cash and
short-term investments at the end of the previous quarter divided by the absolute value of the net income in the
previous firm quarter. A survival time of 0.456 is then equal to 2.2 firm quarters, or 6.6 firm months.
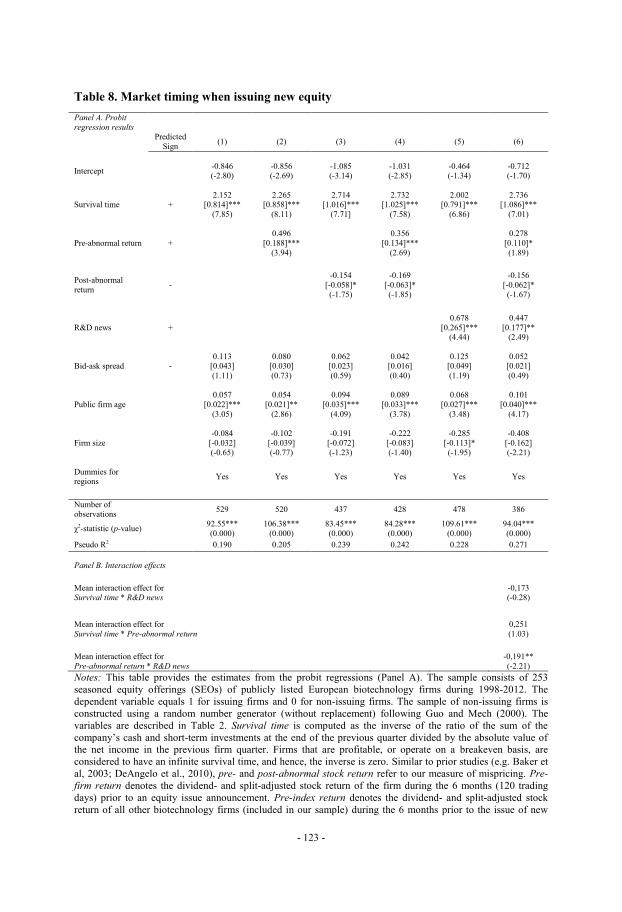
- 123 -
Table 8. Market timing when issuing new equity
Panel A. Probit
regression results
Predicted
Sign (1) (2) (3) (4) (5) (6)
Intercept -0.846 (-2.80)
-0.856 (-2.69)
-1.085 (-3.14)
-1.031 (-2.85)
-0.464 (-1.34)
-0.712 (-1.70)
Survival time + 2.152
[0.814]***
(7.85)
2.265 [0.858]***
(8.11)
2.714 [1.016]***
(7.71]
2.732 [1.025]***
(7.58)
2.002 [0.791]***
(6.86)
2.736 [1.086]***
(7.01)
Pre-abnormal return +
0.496
[0.188]***
(3.94)
0.356
[0.134]***
(2.69)
0.278
[0.110]*
(1.89)
Post-abnormal
return -
-0.154
[-0.058]* (-1.75)
-0.169
[-0.063]* (-1.85)
-0.156
[-0.062]* (-1.67)
R&D news +
0.678
[0.265]*** (4.44)
0.447
[0.177]** (2.49)
Bid-ask spread - 0.113
[0.043]
(1.11)
0.080 [0.030]
(0.73)
0.062 [0.023]
(0.59)
0.042 [0.016]
(0.40)
0.125 [0.049]
(1.19)
0.052 [0.021]
(0.49)
Public firm age
0.057
[0.022]***
(3.05)
0.054
[0.021]**
(2.86)
0.094
[0.035]***
(4.09)
0.089
[0.033]***
(3.78)
0.068
[0.027]***
(3.48)
0.101
[0.040]***
(4.17)
Firm size
-0.084
[-0.032]
(-0.65)
-0.102
[-0.039]
(-0.77)
-0.191
[-0.072]
(-1.23)
-0.222
[-0.083]
(-1.40)
-0.285
[-0.113]*
(-1.95)
-0.408
[-0.162]
(-2.21)
Dummies for regions
Yes Yes Yes Yes Yes Yes
Number of observations
529 520 437 428 478 386
χ2-statistic (p-value) 92.55***
(0.000)
106.38***
(0.000)
83.45***
(0.000)
84.28***
(0.000)
109.61***
(0.000)
94.04***
(0.000)
Pseudo R2 0.190 0.205 0.239 0.242 0.228 0.271
Panel B. Interaction effects
Mean interaction effect for Survival time * R&D news
-0,173 (-0.28)
Mean interaction effect for
Survival time * Pre-abnormal return
0,251
(1.03)
Mean interaction effect for
Pre-abnormal return * R&D news
-0,191**
(-2.21)
Notes: This table provides the estimates from the probit regressions (Panel A). The sample consists of 253
seasoned equity offerings (SEOs) of publicly listed European biotechnology firms during 1998-2012. The
dependent variable equals 1 for issuing firms and 0 for non-issuing firms. The sample of non-issuing firms is
constructed using a random number generator (without replacement) following Guo and Mech (2000). The
variables are described in Table 2. Survival time is computed as the inverse of the ratio of the sum of the
company’s cash and short-term investments at the end of the previous quarter divided by the absolute value of
the net income in the previous firm quarter. Firms that are profitable, or operate on a breakeven basis, are
considered to have an infinite survival time, and hence, the inverse is zero. Similar to prior studies (e.g. Baker et
al, 2003; DeAngelo et al., 2010), pre- and post-abnormal stock return refer to our measure of mispricing. Pre-
firm return denotes the dividend- and split-adjusted stock return of the firm during the 6 months (120 trading
days) prior to an equity issue announcement. Pre-index return denotes the dividend- and split-adjusted stock
return of all other biotechnology firms (included in our sample) during the 6 months prior to the issue of new
- 124 -
equity. Pre-abnormal return is the difference between the pre-firm return and the pre-index return. Post-firm
return denotes the dividend- and split-adjusted stock return of the firm during the 24 months (240 trading days)
after an equity issue announcement. Post-index return denotes the dividend- and split-adjusted stock return of all
other biotechnology firms (included in our sample) during the 24 months after the issue of new equity. Post-
abnormal return is the difference between the post-firm return and the post-index return. R&D news is the
measure related to adverse selection cost. R&D news is a dummy taking the value 1 if a disclosure of R&D is
made in the 40 trading days preceding the equity issue announcement date, zero otherwise. Bid-ask spread,
public firm age and firm size are control variables. We include region dummies as defined by La Porta et al
(1998), which equal one if the firm is of French-, German-, or Scandinavian origin, otherwise zero (English-
origin). In untabulated regressions we include MTB as a control, but exclude the variable from the above
regression due to a reduction in sample size due to missing data. Inclusion/exclusion of MTB does not alter the
overall results. We report coefficient estimates, marginal effects (within angle brackets), and, z-statistics for
marginal effects (within brackets). All regressions contain robust standard errors. ***, **, and *, denote two-tail
1%, 5% and 10% significance, respectively. Panel B reports interaction effects using the methodology suggested
by Norton et al. (2004). The mean interaction effect is reported with corresponding z-statistic within brackets.
In model 2, the firm’s prior abnormal stock return (pre-abnormal return) is positively and
statistically significant (z-statistic = 3.94), which indicates that biotechnology firms tend to
time equity issues following positive abnormal stock returns. In model 3, the coefficient of
post-abnormal return is negative and statistically significant at 10 percent level (z-statistic = -
1.75). This indicates that biotechnology firms perform significantly worse relative to the
market in general in the time period after the equity issue. A comparison of model (2) and (3)
to model (1) shows that both pre-abnormal return and post-abnormal return provide
incremental explanatory power on a stand-alone basis as the pseudo R2 increases from 0.190
to 0.205 (model 2) and to 0.239 (model 3). Although the number of observations is reduced in
model 3 and model 4, due to missing data for the post-abnormal return variable, the results are
still robust. In summary, these findings lend support for the mispricing hypothesis (H1).
In models 5 and 6, we find support for the adverse selection costs hypothesis (H2) that
managers are more likely to issue equity when asymmetric information (or adverse selection
costs) is relatively low. In model 5, the coefficient of R&D news announcements (R&D news)
is positive and statistically significant (z-statistic = 4.44). The marginal effect indicates that an
increase of one unit in R&D news, i.e. going from the case when the discrete dummy variable
R&D news = 0 to the case when R&D news = 1, increases the probability of an equity issue
by 27%. A comparison between model (5) and model (1) shows that R&D news
announcements provide incremental explanatory power (pseudo R2 increases from 0.190 to
0.228). The results are robust (z-statistic = 2.63) when we include all R&D news
announcements (positive and negative) as displayed in Table 5.
Carlson et al. (2006) argue that the stock price run-up prior to the seasoned equity offering
(SEO) is a reflection of an increase in the value of growth options, with a subsequent need for
capital to exercise them and the exercise explains the negative returns in the period after the
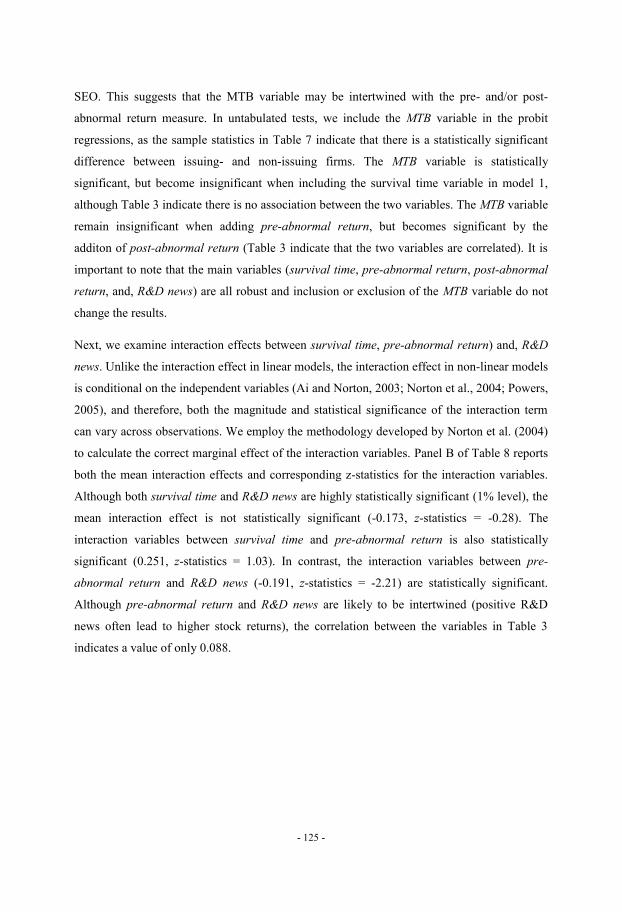
- 125 -
SEO. This suggests that the MTB variable may be intertwined with the pre- and/or post-
abnormal return measure. In untabulated tests, we include the MTB variable in the probit
regressions, as the sample statistics in Table 7 indicate that there is a statistically significant
difference between issuing- and non-issuing firms. The MTB variable is statistically
significant, but become insignificant when including the survival time variable in model 1,
although Table 3 indicate there is no association between the two variables. The MTB variable
remain insignificant when adding pre-abnormal return, but becomes significant by the
additon of post-abnormal return (Table 3 indicate that the two variables are correlated). It is
important to note that the main variables (survival time, pre-abnormal return, post-abnormal
return, and, R&D news) are all robust and inclusion or exclusion of the MTB variable do not
change the results.
Next, we examine interaction effects between survival time, pre-abnormal return) and, R&D
news. Unlike the interaction effect in linear models, the interaction effect in non-linear models
is conditional on the independent variables (Ai and Norton, 2003; Norton et al., 2004; Powers,
2005), and therefore, both the magnitude and statistical significance of the interaction term
can vary across observations. We employ the methodology developed by Norton et al. (2004)
to calculate the correct marginal effect of the interaction variables. Panel B of Table 8 reports
both the mean interaction effects and corresponding z-statistics for the interaction variables.
Although both survival time and R&D news are highly statistically significant (1% level), the
mean interaction effect is not statistically significant (-0.173, z-statistics = -0.28). The
interaction variables between survival time and pre-abnormal return is also statistically
significant (0.251, z-statistics = 1.03). In contrast, the interaction variables between pre-
abnormal return and R&D news (-0.191, z-statistics = -2.21) are statistically significant.
Although pre-abnormal return and R&D news are likely to be intertwined (positive R&D
news often lead to higher stock returns), the correlation between the variables in Table 3
indicates a value of only 0.088.
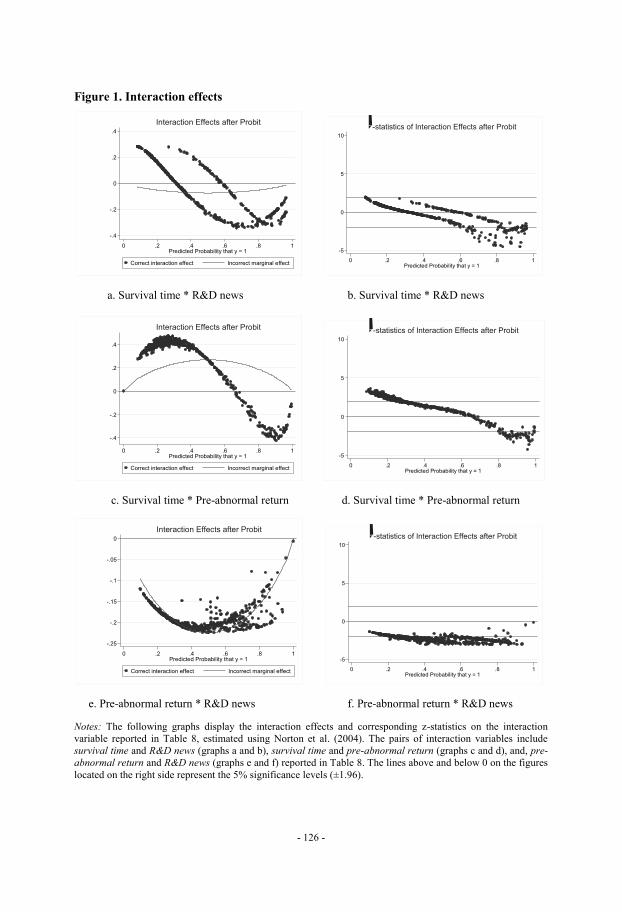
- 126 -
Figure 1. Interaction effects
a. Survival time * R&D news b. Survival time * R&D news
c. Survival time * Pre-abnormal return d. Survival time * Pre-abnormal return
e. Pre-abnormal return * R&D news f. Pre-abnormal return * R&D news
Notes: The following graphs display the interaction effects and corresponding z-statistics on the interaction
variable reported in Table 8, estimated using Norton et al. (2004). The pairs of interaction variables include
survival time and R&D news (graphs a and b), survival time and pre-abnormal return (graphs c and d), and, pre-
abnormal return and R&D news (graphs e and f) reported in Table 8. The lines above and below 0 on the figures
located on the right side represent the 5% significance levels (±1.96).
-.4
-.2
0
.2
.4
Inte
raction
Effe
ct (p
erc
en
tage
po
ints
)
0 .2 .4 .6 .8 1Predicted Probability that y = 1
Correct interaction effect Incorrect marginal effect
Interaction Effects after Probit
-5
0
5
10
z-s
tatistic
0 .2 .4 .6 .8 1Predicted Probability that y = 1
z-statistics of Interaction Effects after Probit
-.25
-.2
-.15
-.1
-.05
0
Inte
raction
Effe
ct (p
erc
en
tage
po
ints
)
0 .2 .4 .6 .8 1Predicted Probability that y = 1
Correct interaction effect Incorrect marginal effect
Interaction Effects after Probit
-5
0
5
10
z-s
tatistic
0 .2 .4 .6 .8 1Predicted Probability that y = 1
z-statistics of Interaction Effects after Probit
- 127 -
However, the interaction effect may have different signs for different values of covariates
(Norton et al., 2004). Figure 1 displays the graphs of the distribution of marginal effects and
the associated z-statistics over the entire range of predicted probabilities for our main models.
In Figure 1a and 1b, for firms with a predicted probability of issuing equity is around 0.2, the
interaction effect between survival time and R&D news is largely positive, although
statistically insignificant. If we look at the right hand side of Figure 1a, where the predicted
probability is above 0.8, the interaction effect is largely negative and statistically significant
for most observations. The main effects imply that firms that have are running out of cash (the
survival time variable is close to one) and disclose positive R&D news are likely to issue new
equity. Although the interaction term between survival time and pre-abnormal return is
statistically insignificant, the right hand side of Figure 1c and 1d shows that when the
predicted probability is between above 0.8, the interaction effect is largely negative and
statistically significant for most observations. In Figure 1e and 1f, the interaction effect is
negative and statistically significant across most observations.
5. Additional tests
In this section, we examine the association between pre-issue disclosures of R&D information
and the stock market reaction at equity issue announcements. Korajczyk et al. (1991 and
1992) suggest the degree of asymmetric information is time-varying and that immediately
following an information release, the information asymmetry between corporate insiders and
outsiders are small. However, the information asymmetry increases over time, as corporate
insiders receive private signals. Therefore, firms have incentives to issue new equity when the
information asymmetry is small. Past empirical studies have examined if different types of
pre-issue disclosures can reduce the price drop at equity announcements18
. Korajczyk et al.
(1991 and 1992) find that earnings disclosures prior to equity issues are able to reduce the
18
Past studies have primarily used rights offerings and/or public offerings assuming a negative stock price
reaction to issue announcements. For example, Korajczyk et al. (1991) use a sample of seasoned underwritten
primary and secondary equity issue by US industrial firms for the period 1978-1983. Loderer and Mauer (1992)
use a sample of primary offerings of seasoned common stock by US industrial firms, whereas Lin et al. (2008)
use a sample of seasoned equity offerings of firms listed on the Taiwan Stock Exchange. To our knowledge, this
study is the first that evaluates if pre-issue information disclosures have different effect on market reactions to
differenct type of issuance methods. We evaluate the association between R&D disclosures and equity issue
announcements of rights offerings and private placements, rather than evaluating if pre-issue disclosures can
reduce the price-drop at equity issue announcements, as our descriptive statistics show that the two issuance
methodes on average lead to different price reactions. In addition, not all rights offerings result in negative price
reactions; 15 of 77 rights offerings in our sample result in a positive CAR (over a three-day period).
- 128 -
price drop at equity issue announcements and that the price reaction is positively associated
with the time interval since the earnings disclosure. In contrast, Loderer and Mauer (1992)
find that dividend disclosures are unable to reduce the price drop at the equity issue
announcement. Similarly, Lin et al. (2008) find that pre-issue disclosures of major
investments, financial forecast revisions and dividends are unable to reduce the price drop at
announcements of rights offerings.
To examine if R&D disclosures are associated with the CAR at the equity issue
announcement, we employ the conditional event-study methodology (Acharya, 1988). Before
we present cross-sectional regression results, we display descriptive statistics of the
distribution of cumulative abnormal returns (CARs) and distinguish between rights offerings
and private placements.
5.1 Distribution of CARs for rights offerings and private placements
Table 9, panel A, presents distribution of CARs for rights offerings and private placements,
respectively, sorted on different ranges. This panel displays that 80.5 of rights offerings and
56.9 percent of private placements results in a negative returns over a three-day event
window. The table also shows that 58.5 and 75 percent of rights offerings and private
placements, respectively, have CARs in the range of -5 to +5 percent. In an unreported graph,
we plot the CARs against their frequency and find that the sample is slightly skewed to the
left of zero19
.
5.2 Stock market reaction to equity issue announcements
Panel B of Table 9 reports abnormal returns and cumulative abnormal returns around equity
issue announcements for rights offerings and private placements. The stock market reaction to
rights offerings is negative and statistically significant. The mean abnormal return at the day
of the equity issue announcement is -4.6 percent (t-statistic -6.35) for rights offerings and the
seven-day cumulative abnormal return (the three days before and after the equity issue
announcement) is -2.96 percent (t-statistic -14.46). This is consistent with prior studies that
document negative to insignificant to positive reactions to rights offerings (see Eckbo and
Masulis (1995) for a review of previous research). Contrary to rights offerings, the stock
market reaction to private placements at the day of the announcement is positive, although not
19
We perform the non parametric Wilcoxon signed rank test, which takes both the sign and magnitude of each
equity issues CAR into account. We reject the null hypothesis of zero CAR with a z-value of 4.784. We use the
logarithmic value of CAR (plus a constant) in the cross-sectional regressions.
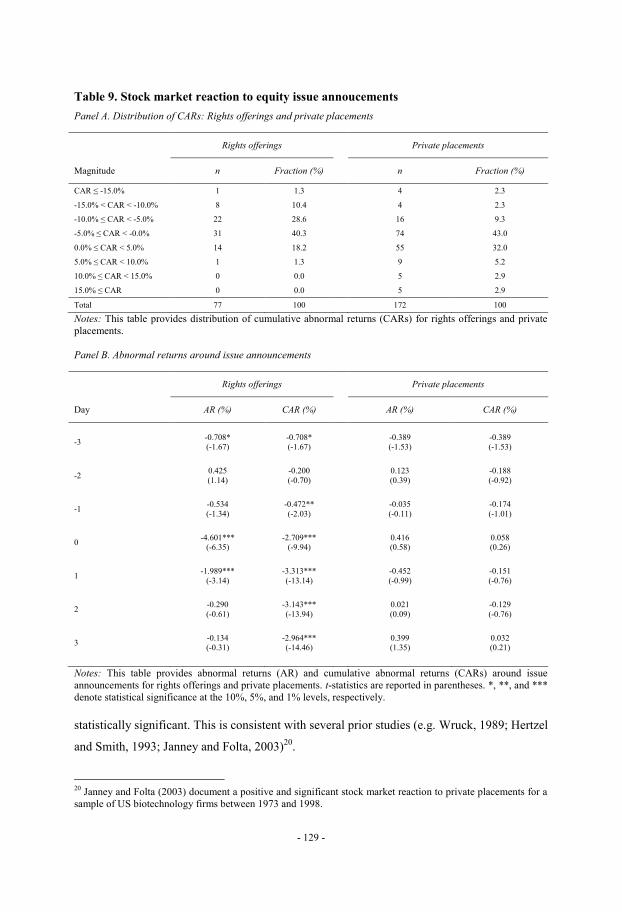
- 129 -
Table 9. Stock market reaction to equity issue annoucements
Panel A. Distribution of CARs: Rights offerings and private placements
Rights offerings Private placements
Magnitude n Fraction (%) n Fraction (%)
CAR ≤ -15.0% 1 1.3 4 2.3
-15.0% < CAR < -10.0% 8 10.4 4 2.3
-10.0% ≤ CAR < -5.0% 22 28.6 16 9.3
-5.0% ≤ CAR < -0.0% 31 40.3 74 43.0
0.0% ≤ CAR < 5.0% 14 18.2 55 32.0
5.0% ≤ CAR < 10.0% 1 1.3 9 5.2
10.0% ≤ CAR < 15.0% 0 0.0 5 2.9
15.0% ≤ CAR 0 0.0 5 2.9
Total 77 100 172 100
Notes: This table provides distribution of cumulative abnormal returns (CARs) for rights offerings and private
placements.
Panel B. Abnormal returns around issue announcements
Rights offerings Private placements
Day AR (%) CAR (%) AR (%) CAR (%)
-3 -0.708*
(-1.67)
-0.708*
(-1.67)
-0.389
(-1.53)
-0.389
(-1.53)
-2 0.425
(1.14)
-0.200
(-0.70)
0.123
(0.39)
-0.188
(-0.92)
-1 -0.534
(-1.34)
-0.472**
(-2.03)
-0.035
(-0.11)
-0.174
(-1.01)
0 -4.601***
(-6.35) -2.709***
(-9.94)
0.416 (0.58)
0.058 (0.26)
1 -1.989***
(-3.14)
-3.313***
(-13.14)
-0.452
(-0.99)
-0.151
(-0.76)
2 -0.290
(-0.61)
-3.143***
(-13.94)
0.021
(0.09)
-0.129
(-0.76)
3 -0.134 (-0.31)
-2.964*** (-14.46)
0.399 (1.35)
0.032 (0.21)
Notes: This table provides abnormal returns (AR) and cumulative abnormal returns (CARs) around issue
announcements for rights offerings and private placements. t-statistics are reported in parentheses. *, **, and ***
denote statistical significance at the 10%, 5%, and 1% levels, respectively.
statistically significant. This is consistent with several prior studies (e.g. Wruck, 1989; Hertzel
and Smith, 1993; Janney and Folta, 2003)20
.
20
Janney and Folta (2003) document a positive and significant stock market reaction to private placements for a
sample of US biotechnology firms between 1973 and 1998.
- 130 -
Next we examine the association between pre-issue disclosures of R&D and the CAR at the
equity issue announcement. We employ the conditional event-study methodology (Acharya,
1988), but allow the variance of the managers’ private information to vary across firms (Guo
and Mech, 2000). We first run the probit regression on equation (1) and include the R&D
newsday variable as well to estimate the standard normal distribution function, N(Zi), and then
calculate the standard normal density function, n(Zi), from this estimate. In the second stage
regression, we then include the term n(Zi)/N(Zi), known as the Heckman’s (1979) inverse
Mills’ ratio, to control for investors’ expectations21
and to correct for the selection bias
problem22
related to managers’ equity issue decisions (Lin et al., 2008). In addition, the non-
discretionary nature of disclosures in the biotechnology industry overcomes the common
criticism of endogenous event in the event study literature (Schultz, 2003; Viswanathan and
Wei, 2008). Regression results of the effects of R&D disclosures on CAR around issue
announcements are reported in Table 10. If the coefficient on the variable R&D news is
positive and statistically significant, it implies that R&D disclosures are associated with the
stock price reaction at equity issue announcements. We also examine if the price reaction is
dependent on the time interval between the R&D disclosure and the equity issue
announcement. We use the inverse of the number of days between the equity issue
announcement and the disclosure of R&D. Hence, we expect to see a positive association
between the inverse of the interval between the R&D disclosures and the market reaction to
equity issue announcements.
In model 2 of Table 10, the coefficient of the dummy variable R&D news is statistically
insignificant, which indicates that R&D disclosures are not associated with the stock market
reaction at equity issue announcement. Consistent with these results, the interval variable,
R&D newsday, is also insignificant (see model 3 of Table 10). The issue type variable, which
takes a value of one for rights offerings and zero for private placements, is negative and
statistically significant (p < 0.05). This verifies the findings in Table 5 that rights offerings are
associated with a negative stock market reaction. In untabulated regressions for private
placements and rights offerings, separately, the R&D news variable remains statistically
insignificant.
21
By not controlling for investors’ expectation (known as «truncated residuals»), in traditional event studies
using OLS and GLS methods could induce inconsitent and inefficient estimation (Eckbo et al., 1990). 22
Since R&D disclosures generally are mandatory in the biotechnology industry, we do not believe the self-
selection problem is a major issue in this setting.
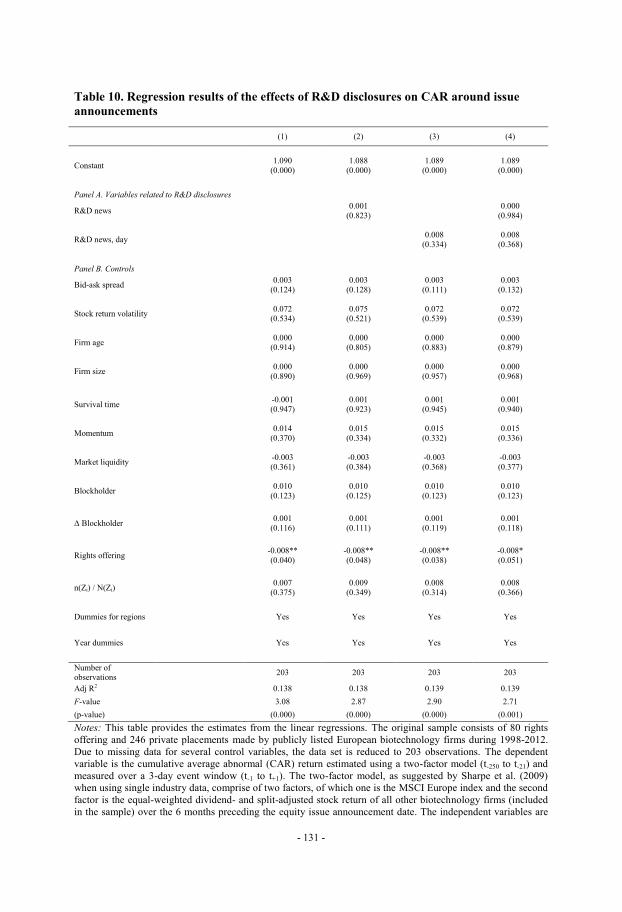
- 131 -
Table 10. Regression results of the effects of R&D disclosures on CAR around issue
announcements
(1) (2) (3) (4)
Constant 1.090
(0.000)
1.088
(0.000)
1.089
(0.000)
1.089
(0.000)
Panel A. Variables related to R&D disclosures
R&D news 0.001
(0.823)
0.000
(0.984)
R&D news, day 0.008
(0.334)
0.008
(0.368)
Panel B. Controls
Bid-ask spread 0.003
(0.124)
0.003
(0.128)
0.003
(0.111)
0.003
(0.132)
Stock return volatility 0.072
(0.534)
0.075
(0.521)
0.072
(0.539)
0.072
(0.539)
Firm age 0.000
(0.914)
0.000
(0.805)
0.000
(0.883)
0.000
(0.879)
Firm size 0.000
(0.890)
0.000
(0.969)
0.000
(0.957)
0.000
(0.968)
Survival time -0.001
(0.947)
0.001
(0.923)
0.001
(0.945)
0.001
(0.940)
Momentum 0.014
(0.370)
0.015
(0.334)
0.015
(0.332)
0.015
(0.336)
Market liquidity -0.003
(0.361)
-0.003
(0.384)
-0.003
(0.368)
-0.003
(0.377)
Blockholder 0.010
(0.123)
0.010
(0.125)
0.010
(0.123)
0.010
(0.123)
Δ Blockholder 0.001
(0.116)
0.001
(0.111)
0.001
(0.119)
0.001
(0.118)
Rights offering -0.008**
(0.040)
-0.008**
(0.048)
-0.008**
(0.038)
-0.008*
(0.051)
n(Zi) / N(Zi) 0.007
(0.375)
0.009
(0.349)
0.008
(0.314)
0.008
(0.366)
Dummies for regions Yes Yes Yes Yes
Year dummies Yes Yes Yes Yes
Number of observations
203 203 203 203
Adj R2 0.138 0.138 0.139 0.139
F-value 3.08 2.87 2.90 2.71
(p-value) (0.000) (0.000) (0.000) (0.001)
Notes: This table provides the estimates from the linear regressions. The original sample consists of 80 rights
offering and 246 private placements made by publicly listed European biotechnology firms during 1998-2012.
Due to missing data for several control variables, the data set is reduced to 203 observations. The dependent
variable is the cumulative average abnormal (CAR) return estimated using a two-factor model (t-250 to t-21) and
measured over a 3-day event window (t-1 to t+1). The two-factor model, as suggested by Sharpe et al. (2009)
when using single industry data, comprise of two factors, of which one is the MSCI Europe index and the second
factor is the equal-weighted dividend- and split-adjusted stock return of all other biotechnology firms (included
in the sample) over the 6 months preceding the equity issue announcement date. The independent variables are
- 132 -
defined in Table 2. All regressions contain robust standard errors using the Huber-White sandwich estimators. p-
values are displayed in parentheses. *, **, and *** denote the value is significantly different from zero at the
10%, 5%, and 1% levels, respectively.
Although R&D disclosures are helpful for investors to anticipate equity issues, we do not find
support that they are associated with the stock market reaction at the equity issue
announcement. This finding is consistent with Guo and Mech (2000), Lin et al. (2008),
Loderer and Mauer (1992) and Siougle (2007). Siougle (2007) examines the association of
disclosures of indended uses of the SEO proceeds and the stock returns subsequent to the
SEO and suggests that the insignificance of pre-issue disclosures to explain stock returns
following an SEO is consistent with efficient pricing of this information by the underwriters.
6. Conclusions
When biotechnology firms publicly announce the progress of research projects, investors
know these results is the outcome of a well-defined research plan set up by the firm in
collaboration with regulatory authorities. Therefore, the mandatory disclosure contains both
reliable and value-relevant information. Past studies of market timing in relation to
disclosures of accounting information can be biased given the discretionary nature of
accounting information. In comparison with previous studies on the mispricing theory and
particularly those on the adverse selection cost theory, our measures are essentially unaffected
by managerial discretion.
The empirical study is based on 87 biotechnology firms listed across Europe in the years 1998
through 2012. In total, these firms made 250 issues of new equity and 561 publicly disclosed
announcements about the progress of their research projects. We find support for both the
adverse selection cost theory and the mispricing hypothesis. They are significant explanatory
factors on a stand-alone basis, and, notably, they provide incremental explanatory power
beyond that of survival time. As the market mispricing hypothesis assume, managers can
predict stock returns more accurately than investors can. New equity is issued to a
considerably greater extent following positive abnormal stock returns. We also find that
biotechnology firms on average generate negative abnormal returns after the equity issue
announcement, although the mispricing measure is sensitive to the length of the selected time
period prior to and after the equity issue announcement.

- 133 -
The adverse selection cost theory suggests that rational managers decide to issue new equity
when there is relatively little asymmetric information between shareholders and management.
We find that R&D news announcements are positively associated with issues of new equity.
Although R&D news announcements are helpful to investors to anticipate equity issues our
results indicate that R&D disclosures are not associated with the stock market reaction at
issue announcements. It needs to be mentioned that, overall, a firm’s survival time is the best
indicator of a new equity issue and equity market timing theories are secondary
considerations. On average, firms that issue new equity can sustain their ongoing operations
less than a year.
The biotechnology industry is, arguably, different from other industries in the sense that firms
usually operate with large negative free cash flows and have no other choice but to regularly
ask investors for (equity) financing of their research projects. From an investor perspective,
there is considerable asymmetric information and, given the inherent risk of the industry, a
search for credible signals of a biotechnology firm’s prospects seems to be a clear-cut
requirement before buying into an issue of new shares. Although an investor’s search for
credible signals is particularly important in this setting, we are convinced that it is not unique
to the biotechnology industry. In other words, our findings lend support for studying market
timing not only from the point of view that managers want to capitalize on mispricing, but
also from the point of view that they rationally go to equity markets when there is a chance
that investors will understand the firm’s prospects better. In the last decade, a vast amount of
empirical support has been given to the idea that market timing is about opportunistic
managers trying to capitalize on moments when markets are mispriced. The adverse selection
cost theory seems to be an important factor to be considered when understanding firms’
decisions to finance their ventures.
While the study is made on the basis of non-accounting information, the implications are
likely to also cover the disclosure of accounting information. Although accounting
information is discretionary it is, overall, one of the best indicators of firm performance. For
many firms, it makes sense to issue new equity subsequent of the disclosure of e.g. a quarterly
report, when the time-varying level of asymmetric information is comparatively low. Such
behaviors are likely to be evidence of accounting information’s relevance, and not necessarily
provoked earnings management.

- 134 -
References
Acharya, S., 1988. A generalized econometric model and tests of a signalling hypothesis with
two discrete signals. Journal of Finance 43, 413-429.
Ai, C., Norton, E. C., 2003. Interaction terms in logit and probit models. Economics Letters 80,
123-129.
Alti, A., 2006. How persistent is the impact of market timing on capital structure? Journal of
Finance 61, 1681-1710.
Asquith, P., Mullins, D., 1986. Equity issues and offering dilution. Journal of Financial
Economics 15, 61–89.
Baker, M., Wurgler, J., 2002. Market timing and capital structure. Journal of Finance 57, 1-32.
Baker, M., Wurgler, J., 2007. Investor sentiment in the stock market. Journal of Economic
Perspectives 21, 129-151.
Baker, M., Stein, J., Wurgler, J., 2003. When does the stock market matter? Stock prices and
the investment of equity-dependent firms. Quarterly Journal of Economics 118, 969-1005.
Bayless, M., Chaplinsky, S., 1996. Is there a window of opportunity for seasoned equity
issuance? Journal of Finance 51, 253-278.
Bolton, P., Freixas, X., 2000. Equity, bonds, and bank debt: capital structure and financial
market equilibrium under asymmetric information. Journal of Political Economy 108, 324–
351.
Brown, S., Warner, J., 1985. Using daily stock returns: the case of event studies. Journal of
Financial Economics 14, 3-31.
Campbell, J., Lo, A., MacKinlay, A., 1997. The econometrics of financial markets. Princeton:
Princeton University Press.
Carlson, M., Fisher, A., Giammarion, R., 2006. Corporate investment and asset price
dynamics: implications for SEO event studies and long-run performance. Journal of Finance
61, 1009-1034.
Choe, H., Masulis, R., Nanda, V., 1993. Common stock offerings across the business cycle:
Theory and evidence. Journal of Empirical Finance 1, 3-31.

- 135 -
Cooper, D. W., Grinder, B., 1996. Voluntary information disclosure during periods of stock
price vulnerability. Journal of Business Finance and Accounting 23, 461-472.
DeAngelo, H., DeAngelo, L., Stulz, R. M., 2010. Seasoned equity offerings, market timing,
and the corporate lifecycle. Journal of Financial Economics 95, 275-295.
Dedman, E., Lin, S. W-J., Prakash, A., Chang, C-H., 2008. Voluntary disclosure and its impact
on share prices: Evidence from the UK biotechnology sector. Journal of Accounting and Public
Policy 27, 195-216.
Denis, D. J., Sarin, A., 2001. Is the market surprised by poor earnings realizations following
seasoned equity offerings. Journal of Financial and Quantitative Analysis 30, 169-193.
Dierkens, N., 1991. Information asymmetry and equity issues. Journal of Financial and
Quantitative Analysis 26, 181-199.
Dittmar, A., Thakor, A., 2007. Why do firms issue equity? Journal of Finance 62, 1-54.
Eckbo, B. E., Maksimovic, V., Williams, J., 1990. Consistent estimation of cross-sectional
models in event studies. Review of Financial Studies 3, 343-366.
Eckbo, B. E., Masulis, R. W., 1992. Adverse selection and the rights offer paradox. Journal of
Financial Economics 32, 293-332.
Eckbo, B. E., Masulis, R. W., 1995. Seasoned equity offerings: a survey. In: Jarrow, R.,
Maksimovic, V., Ziemba, W.T. (Eds.), Finance, Handbooks in Operations Management and
Management Science. North-Holland, Amsterdam, pp. 1017-1070.
Fisher, W. O., 2002. Key disclosure issues for life sciences companies: FDA product
approval, clinical test results, and government inspections. Michigan Telecommunications
and Technology Law Review 8, 115-193.
Graham, J. R., Harvey, C. R., 2001. Theory and practice of corporate finance: Evidence from
the field. Journal of Financial Economics 60, 187-243.
Guo, R-J., Lev, B., Zhou, N., 2004. Competitive costs of disclosure by biotech IPOs. Journal of
Accounting Research 42, 319-355.

- 136 -
Guo, L., Mech, T. S., 2000. Conditional event studies, anticipation, and asymmetric
information: The case of seasoned equity issues and pre-issue information releases. Journal of
Empirical Finance 7, 113-141.
Harford, J., 2005. What drives merger waves? Journal of Financial Economics 77, 529-560.
Hayn, C., 1995. The information content of losses. Journal of Accounting and Economics 20,
125-153.
Healy, P. M., Palepu, K. G., 1990. Earnings and risk changes surrounding primary stock offers.
Journal of Accounting Research 28, 25-48.
Heckman, J., 1979. Sample selection bias as a specification error. Econometrica 47, 153−161.
Hertzel, M.G., Smith, R.L., 1993. Market discounts and shareholder gains for placing equity
privately. Journal of Finance 48, 459-485.
Hickman, B., 1953. The volume of corporate bond financing. New York: National Bureau of
Economic Research.
Huang, R., Ritter, J., 2009. Testing theories of capital structure and estimating the speed of
adjustment. Journal of Financial and Quantitative Analysis 44, 237-271.
Ibbotson, R. G., Jaffe, J. F., 1975. “Hot issue” markets. Journal of Finance 30, 1027-1042.
Ibbotson, R. G., Sindelar, J. L., Ritter, J. R., 1988. Initial public offerings. Journal of Applied
Corporate Finance 1, 37-45.
Ibbotson, R. G., Sindelar, J. L., Ritter, J. R., 1994. The market’s problems with the pricing of
initial public offerings. Journal of Applied Corporate Finance 7, 66-74.
Ikenberry, D., Lakonishok, J., Vermaelen, T., 1995. Market underreaction to open market share
repurchases. Journal of Financial Economics 39, 181-208.
Jain, B. A., Kini, O., 1994. The post-issue operating performance of IPO firms. Journal of
Finance 49, 1699-1726.
Janney, J. J., Folta, T. B., 2003. Signaling through private equity placements and its impact on
the valuation of biotechnology firms. Journal of Business Venturing 18, 361-380.

- 137 -
Jensen, M. C., Meckling, W., 1976. Theory of the firm: Managerial behavior, agency costs and
capital structure. Journal of Financial Economics 3, 305-360.
Korajczyk, R. A., Lucas, D. J., McDonald, R. L., 1991. The effect of information releases on
the pricing and timing of equity issues. The Review of Financial Studies 4, 685-708.
Korajczyk, R. A., Lucas, D. J., McDonald, R. L., 1992. Equity issues with time-varying
asymmetric information. Journal of Financial and Quantitative Analysis 27, 397-417.
La Porta, R., Lopez-de-Silanes, F., Shleifer, A., Vishny, R. W., 1998. Law and Finance.
Journal of Political Economy 106, 1113-1155.
Lang, M. H., Lundholm, R. J., 2000. Voluntary disclosure and equity offerings: Reducing
information asymmetry of hyping the stock? Contemporary Accounting Research 17, 623-662.
Lerner, J., Shane, H., Tsai, A., 2003. Do equity financing cycles matter? Evidence from
biotechnology alliances. Journal of Financial Economics 67, 411-446.
Lin, Y-M., You, S-J., Lin, F-J., 2008. The effects of pre-issue information releases on seasoned
equity offerings. Journal of Business Finance & Accounting 35, 1138-1163.
Lintner, J., 1965. The valuation of risk assets and the selection of risky investments in stock
portfolios and capital budgets. The Review of Economics and Statistics 47, 13-37.
Loderer, C. F., Mauer, D. C., 1992. Corporate dividends and seasoned equity issues: An
empirical investigation. Journal of Finance 47, 201-225.
Loughran, T., Ritter, J., 1995. The new issues puzzle. Journal of Finance 50, 23-51.
Loughran, T., Ritter, J., 1997. The operating performance of firms conducting seasoned equity
offerings. Journal of Finance 52, 1823-1850.
Lucas, D., McDonald, R., 1990. Equity issues and stock price dynamics. Journal of Finance 45,
1019-1043.
Mackie-Mason, J. K., 1990. Do taxes affect corporate financing decisions? Journal of Finance
45, 1471-1493.
Martynova, M., Renneboog, L., 2008. A century of corporate takeovers: What have we learned
and where do we stand? Journal of Banking and Finance 32, 1723-1742.
- 138 -
Masulis, R., Korwar, A., 1986. Seasoned equity offerings: an empirical investigation. Journal
of Financial Economics 15, 91–118.
McConomy, B., Xu, B., 2004. Value creation in the biotechnology industry. CMA
Management, 29-31.
Mikkelson, W. H., Partch, M. M., Shah, K., 1997. Ownership and operating performance of
companies that go public. Journal of Financial Economics 44, 281-307.
Miller, M., Modigliani, F., 1966. Some estimates of the cost of capital to the utility industry,
1954-7. American Economic Review 56, 333-391.
Myers, S. C., 1977. Determinants of corporate borrowing. Journal of Financial Economics 5,
147-175.
Myers, S. C., 1984. The capital structure puzzle. Journal of Finance 39, 575-592.
Myers, S. C., Majluf, N. S., 1984. Corporate financing and investment decisions when firms
have information that investors do not have. Journal of Financial Economics 13, 187-221.
Norton, E. C., Wang, H, Ai, C., 2004. Computing interaction effects and standard errors in
logit and probit models. The Stata Journal 4, 154-167.
Pagano, M., Panetta, F., Zingales, L., 1998. Why do companies go public? An empirical
analysis. Journal of Finance 53, 27-64.
Pástor, L., Veronesi, P., 2005. Rational IPO waves. Journal of Finance 60, 1713-1757.
Powers, E., 2005. Interpreting logit regressions with interaction terms: An application to the
management turnover literature. Journal of Corporate Finance 11, 504-522.
Prabhala, N. R., 1997. Conditional methods in event studies and an equilibrium justification for
standard event-study procedures. Review of Financial Studies 10, 1-38.
Rangan, S., 1998. Earnings management and the performance of seasoned equity offerings.
Journal of Financial Economics 50, 101-122.
Rajan, R. G., Zingales, L., 1998. Financial dependence and growth. American Economic
Review 88, 559–586.

- 139 -
Ravid, S. A., Spiegel, M., 1997. Optimal financial contracts for a start-up with unlimited
operating discretion. Journal of Financial and Quantitative Analysis 32, 269–287.
Rhodes-Kropf, M., Robinson, D., Viswanathan, S., 2005. Valuation waves and merger activity:
The empirical evidence. Journal of Financial Economics 77, 561-603.
Ritter, J., 1984. The “hot issue” market of 1980. Journal of Business 57, 215-240.
Ritter, J., 1991. The long-run performance of initial purchase offerings. Journal of Finance 46,
3-27.
Roosenboom, P., van der Goot, T., Mertens, G., 2003. Earnings management and initial public
offerings: Evidence from the Netherlands. International Journal of Accounting 38, 243-266.
Schultz, P., 2003. Pseudo market timing and the long-run underperformance of IPOs. Journal
of Finance 58, 483-517.
Sharpe, W.F., Alexander, G., Bailey, J.V., 1999. Investments. Prentice-Hall, Upper Saddle
River, NJ.
Shiller, R. J., 2000. Irrational exuberance. Princeton: Princeton University Press.
Shivakumar, L., 2000. Do firms mislead investors by overstating before seasoned equity
offerings? Journal of Accounting and Economics 29, 339-371.
Siougle, G., 2007. Accounting information and the valuation of seasoned equity offerings
(SEOs). The International Journal of Accounting 42, 380-395.
Spiess, D. K., Affleck-Graves, J., 1995. Underperformance in long-run stock returns following
seasoned equity offerings. Journal of Financial Economics 38, 243-267.
Taggart, R. A., 1977. A model of corporate financing decisions. Journal of Finance 32, 1467-
1484.
Teoh, S. H., Wong, T. J., Rao, G. R., 1998a. Are accruals during initial public offerings
opportunistic? Review of Accounting Studies 3, 175-208.
Teoh, S. H., Welch, I., Wong, T. J., 1998b. Earnings management and the long-run market
performance of initial public offerings. Journal of Finance 53, 1935-1974.

- 140 -
Viswanathan, S., Wei, B., 2008. Endogenous events and long-run returns. Review of
Financial Studies 21, 855-888.
Wruck, H.K., 1989. Equity ownership concentration and firm value: evidence from private
equity financings. Journal of Financial Economics 23, 3-28.

III

- 143 -
Information asymmetry, R&D disclosures and the choice of equity-
selling mechanisms
Hans Jeppsson*
University of Gothenburg, School of Business, Economics and Law
Abstract
This study examines the impact of information asymmetry and corporate management
monitoring on the choice among different mechanisms for selling equity. More specifically, I
study the link between R&D disclosures and other measures of information asymmetry, in
addition to ownership measures and firms’ choices among various types of rights offerings
and private placements. Using a hand-collected sample of mandatory and non-discretionary
R&D disclosures from publically listed biotechnology firms, I find that firms tend to issue
equity publicly rather than privately following credible R&D disclosures, i.e., when
information asymmetry is low. By contrast, I find no support for the monitoring hypothesis. A
detailed analysis by investor type confirms that monitoring does not seem to be an important
determinant in the choice between private and public financing.
JEL-classification: G32
Keywords: Adverse selection; Equity financing; R&D disclosures; Seasoned equity
offerings (SEOs); Rights offerings; Private placements; Monitoring
* The author is a PhD student at the Department of Business Administration, School of Business, Economics and
Law at the University of Gothenburg. P.O. Box 610, SE-40530 Gothenburg, Sweden. Tel.: +46 31 786 1463.
Email: [email protected]. This paper was written while he was a visiting scholar at UC Berkeley,
and he is appreciative of the opportunity given to him by the Department of Economics at UC Berkeley. This
paper was presented at the IV World Finance conference in Cyprus in July 2013 and at the Wolpertinger
conference in Gothenburg in August 2013. He would like to thank Ted Lindblom, Stefan Sjögren and Taylan
Mavruk at the University of Gothenburg and the seminar participants at the IV World Finance Conference and
the Wolpertinger 2013 conference for useful comments. All errors are the author's.

- 144 -
1. Introduction
When corporate managers decide to raise capital externally by selling equity to finance new
investment opportunities, they also must decide which type of equity-selling mechanism to
employ: private or public financing1,2
. Lerner (1994) shows that venture-backed private firms
go public when equity valuations are high and employ private financing when equity
valuations are lower. For public firms, two main theories have evolved that explain the
rationale behind the choice of equity-selling mechanisms: the information asymmetry
hypothesis and the monitoring hypothesis. The monitoring hypothesis suggests that private
placements—which are associated with more concentrated ownership that can more
effectively monitor management—are used when there is a perceived need for such
monitoring (e.g., Shleifer and Vishny, 1986). According to the information asymmetry
hypothesis, the degree of asymmetric information about firm value affects the choice of
equity-selling mechanism (e.g., Hertzel and Smith, 1993). Eckbo and Masulis (1992) show
that when the degree of asymmetric information about firm value is high, i.e., when the
expected current shareholder take-up is expected to be low, firms may choose more costly
standby rights offerings instead of pure uninsured equity rights offerings. However, the
degree of asymmetric information is not fixed over time. The time-varying asymmetric
information model by Korajczyk et al. (1991, 1992) suggests that few managers will have
received a private signal immediately following a release of relevant information and the
adverse selection problem is small. As time passes, the adverse selection problem becomes
more severe. Therefore, managers have an incentive to issue equity publicly rather than
privately following credible information releases.
This paper examines the impact of information asymmetry and the monitoring of corporate
managers on the choice among various types of rights offerings and private placements in the
biotechnology industry. I study the biotechnology industry for the following five reasons.
1 A popular topic in the academic literature is why firms tend to use private placements in which direct costs can
be 20 percent or more (Hertzel and Smith, 1993). 2 The two most commonly used equity issuance methods for stock markets outside the US are rights offerings
and private placements. A private placement is a non-public offering in which securities are typically sold to a
small number of chosen private institutional investors (e.g., banks, insurance companies, pension funds, etc.). In
a rights offering (or rights issue), existing shareholders are given the preemptive (preferential) “rights” or option
to purchase a certain number of shares (on a pro rata basis) at a fixed price within a specified time. A rights
offering can be either uninsured (non-underwritten) or insured (underwritten). There are two variants of insured
rights offerings: standby rights and firm-commitment offers. In a standby rights offer, an investment bank
guarantees that any unsubscribed rights or shares are taken up. In a firm-commitment offer, the investment bank
assumes the risk of selling the shares to the market by buying the issue from the issuer. With the exceptions of
Japan and France, firm-commitment underwritten offers have not yet spread outside the U.S. (Eckbo, 2008).
- 145 -
(1) Because of the relative scarcity of public information about firms’ R&D activities and the
importance of these activities to the operations of biotech firms, I use R&D disclosures as the
major proxy for information asymmetry. Biotech firms differ from other research-intensive
firms because their development processes are closely monitored by external regulatory
authorities that have considerable experience in evaluating drugs with respect to issues such
as efficacy and safety. Biotechnology projects must undergo a thorough and well-documented
regulatory review process; therefore, there are mandatory non-discretionary evaluations of the
value-creation process. Although disclosures of accounting information may be biased due to
the discretionary nature of such information, value-relevant R&D disclosures are thus more
likely to be a clean test of the information asymmetry hypothesis.
(2) Information asymmetry is particularly evident in R&D-intensive industries such as the
high-technology sector (Himmelberg and Petersen, 1994) and particularly the biotechnology
industry (Lerner et al., 2003; Hall, 2002). Because of the considerable information asymmetry
associated with R&D (Hall and Lerner, 2009), managers generally know considerably more
than outsiders about the specifications of products under development, their likelihood of
success, the results of product feasibility tests, and marketing prospects (Aboody and Lev,
2000). Hall and Lerner (2009) argue that the marketplace for financing the development of
R&D may look like the ‘lemons’ market, as suggested by Akerlof (1970, 2002). High-quality
firms seeking external financing, therefore, have an incentive to reveal their qualities to the
market place when such financing is accessible at low cost.
(3) Most biotech firms are in an early life-cycle stage and invest heavily and on a continuous
basis in intangible assets such as research and development (R&D), but they can rarely fund
these investments internally. Consequently, they depend on external financing and regularly
turn to the equity markets for fresh capital.
(4) The industry-specific sample provides an opportunity to use more direct and less noisy
proxies of information asymmetry, which increases the power of testing for the presence of
information asymmetry.
(5) Because few biotech firms are profitable and investments are mainly in intangible assets,
biotech firms cannot use debt financing and instead typically turn to the equity markets.
Therefore, a sample of biotech firms enables a study of private versus public equity financing
without having to consider alternative sources of external capital.
- 146 -
Past empirical research on the choice that firms have between private and public financing has
verified the importance of both ownership control and asymmetric information3, but the
emphasis has been on ownership control. Using a sample of Swedish publicly listed firms
over the period from 1986 to 1999, Cronqvist and Nilsson (2004) find that families’ corporate
control considerations are important determinants of the choice between private placements
and rights offerings, i.e., family-controlled firms tend to avoid issuing methods that dilute the
benefits of control or subject the firm to more monitoring. Wu (2004) examines the choice
between private placements and public offerings using a sample of US high-technology public
firms between 1986 and 1997. He finds partial support for the information asymmetry
hypothesis by using microstructure variables as proxies for information asymmetry. However,
contrary to prior studies (e.g., Wruck, 1989; Kahn and Winton, 1998), Wu finds that private
placements do not result in enhanced monitoring of managers. Chen et al. (2010) examine
firms’ choices between seasoned equity offerings and private investment in public equity
offerings and find that information asymmetry and weak operating performance are key
determinants in the choice of equity-selling mechanisms. Gomes and Phillips (2012) verify
the importance of information asymmetry as a key determinant in the choice of security type
(debt, equity or convertibles) in public and private markets and in the choice of the market in
which to issue securities.
The empirical data confirm that firms tend to issue equity publicly rather than privately
following credible R&D disclosures, which supports the information asymmetry hypothesis.
By contrast, I do not find any support for the monitoring hypothesis. A detailed
decomposition of monitoring versus non-monitoring investors also supports the view that
monitoring is not an important determinant in the decision about whether to issue equity
privately or publicly. The main contribution of this paper is to verify the importance of
information asymmetry on the choice between rights offerings and private placements and the
use of mandatory non-discretionary R&D disclosures as a proxy for information asymmetry.
This is the first study to extensively verify the importance of information asymmetry
regarding the choice between private and public financing outside the US. This paper adds to
the growing literature addressing the choice of equity-selling mechanisms (e.g., Hertzel and
Smith, 1993; Cronqvist and Nilsson, 2004; Wu, 2004; Chen et al., 2010; Gomes and Phillips,
2012).
3 Although firm size and firm age are frequently used as proxies for the level of information asymmetry in the
literature, they do not fit well with the time-varying asymmetric information model developed by Korajczyk et
al. (1991, 1992).

- 147 -
The remainder of the paper is outlined as follows. Section two provides a theoretical
framework, an overview of prior studies and the research hypotheses. Section three discusses
methodological issues related to the study. Section four contains the empirical results. Section
five provides additional analyses, and section six concludes.
2. Theory and research hypotheses
When a firm without financial slack has an opportunity to accept a positive net present value
project that requires equity financing, it faces a dilemma. Management, who is assumed to act
in the interests of current shareholders, will choose to issue equity if the net issue benefit is
non-negative, that is, when b – [d + w(k)] ≥ 0, where b is the value of the project, d is the
direct flotation cost and w(k) is the expected wealth transfer from old to new investors. If the
firms’ managers believe the firm’s stock is undervalued, issuing equity to outside investors is
costly because it dilutes the value of its existing shareholder stock. If the total flotation cost of
issuing exceeds the value of the project, the firm will decide not to issue equity and forego an
investment opportunity, which Myers and Majluf (1984) refer to as the “underinvestment
problem”. Myers and Majluf assume that existing shareholders do not participate in the equity
issue, i.e., the flotation method implicit in their model is a direct issue to outside investors.
The researchers also rule out an informational role for underwriters.
Eckbo and Masulis (1992) extend the Myers and Majluf model to explain the adverse
selection problem by issuers with access to alternative flotation methods, such as pure
(uninsured) rights, standby rights and firm-commitment underwritten offerings. Eckbo and
Masulis (1992) show that an adverse selection cost problem such as that presented by Myers
and Majluf (1984) exists when the fraction of the stock issue (k) expected to be taken up by
existing shareholders is less than 100 percent. For a given level of current shareholder take-up
(below 100 percent), the greater the undervaluation of the firm’s shares, the more likely the
firm is not to issue equity. Eckbo and Masulis (1992) argue that certification by an
underwriter can mitigate the adverse selection problem. Although k is largely beyond
managerial control4, managers are assumed to have better information than the market about k
because subscription pre-commitments from existing shareholders give them a good
4 The value of k is assumed to be an exogenous factor determined by shareholder characteristics, such as wealth
constraints, diversification benefits, and benefits from maintaining a shareholder’s proportional ownership of the
issuer’s equity (Bøhren et al, 1997; Eckbo and Masulis, 1992). In addition, investment funds may have rules that
forbid ownership exceding a certain percentage of any given company because of reporting regulations that may
become applicable at that level of investment.
- 148 -
approximation of the expected take-up of the issue. If management believes k to be high, i.e.,
if existing shareholders are expected to buy and hold the new shares, a pure (uninsured) rights
offer is the lowest-cost flotation method. In the extreme case of k = 15, current shareholders
purchase and hold the entire issue, and there is no wealth transfer to outside investors such
that w(1) = 0.6 This is essentially equivalent to having access to an internal source of funds
that is not disadvantaged by asymmetric information costs. In this case, both the subscription
price7 and the degree of undervaluation (or mispricing) are irrelevant to shareholders because
there is no wealth transfer from current investors (no adverse selection). This implies that
adverse selection is low in the pool of uninsured rights, and the market reaction to the
announcement is expected to be relatively small (close to zero)8. However, if k is expected to
be less than one, some undervalued firms may find it too costly to issue new equity because of
the costs to existing shareholders of selling shares to outsiders at a price below the intrinsic
value. Adverse selection effects, and thus w(k), increase as k decreases. Hence, low-k issuers
are likely to employ a more expensive flotation alternative (standby or firm-commitment) that
involves underwriter certification to narrow—but not fully remove—the information
asymmetry between the firm and the market as long as the sum of the expected certification
benefit and the net project value exceeds the underwriter fee. A negative stock market
reaction to rights offerings implies the presence of adverse selection costs. The average
market reaction for a sample of US firms to the announcement of standby rights and firm-
commitment underwritten is -1.3 and -2.5, respectively (Eckbo, 2008).
Under Myers and Majluf’s information asymmetry model for public offerings, the
“underinvestment problem” can be avoided if managers are able to convey their private
information to the market at no cost. Hertzel and Smith (1993) extend the Myers and Majluf
(1984) model to allow for the possibility that private placement investors can assess firm
value through their negotiations with management and that private placements confer benefits
similar to those suggested for mergers by Myers and Majluf (1984). When k is expected to be
5 Eckbo and Masulis (1992) report average shareholder take-up above 90 percent in pure (uninsured) rights
offerings compared to approximately 65 percent for standby rights. Consequently, it is reasonable to assume that
k < 0 in the majority of rights offerings. 6 Although there may also be asymmetric information among current shareholders, this study makes no such
distinction, i.e., managers act in the interest of current shareholders and only consider wealth transfer effects
from current shareholders to outside investors. 7 Although a deeply discounted rights offering may help ensure the success of an offering, Heinkel and Schwartz
(1986) and Loderer and Zimmermann (1988) argue that the subscription price is a signal of firm quality, and that
a deep discount conveys negative information to outside investors about the true value of the issue. Managers are
therefore reluctant to issue rights with a deep subscription-price discount (Smith, 1977). 8 If the equity issue announcement discloses the existence of an investment project with a value that is higher
than the market anticipates, the stock market reaction may even be positive.
- 149 -
low, in addition to hiring an underwriter (or when no underwriter agrees to underwrite the
offering), issuers can attempt to minimize a costly9 market reaction to SEOs (seasoned equity
offerings) by choosing a private placement in which sophisticated investors are given access
to proprietary firm information. Therefore, instead of foregoing an investment opportunity
and issuing no equity, undervalued firms can choose a private placement over a public issue if
this enables existing shareholders to retain a larger fraction of the firm, i.e., when the net
present value of the investment opportunity exceeds the total cost of informing private
investors about firm value. That is, b ≥ w(k) because private placements are assumed to have
no direct flotation cost (d = 0).
In summary, the public10
firm’s choice between private and public financing may stem from
information asymmetry about firm value, which is known as the information asymmetry
hypothesis. Another determinant proposed by the theoretical literature is the monitoring
hypothesis. The following sections provide details about these two theories.
2.1 The information asymmetry hypothesis
The information asymmetry hypothesis suggests that firms are more likely to choose private
placements than public offerings when the degree of asymmetric information about firm value
is high (and the expected take-up, k, by existing shareholders is assumed to be low) because
private placement investors can learn the true value of the firm at some cost (Chemmanur and
Fulghieri, 1999; Hertzel and Smith, 1993). Private placements generally involve fewer
investors than do public offerings, which indicates that at a given level of information
asymmetry, private placements incur lower information production costs (Wu, 2004).
Consequently, firms with high information asymmetry may have strong incentives to issue
equity privately instead of publicly to reduce the costs of information production. MacKie-
Mason (1990) refers to the “hidden-information view” and shows that information problems
appear to influence publicly traded firms’ choices between private and public financing.
According to the “hidden-information view”, firms will seek better-informed investors when
the hidden-information advantage is high or when the potential difference in valuations due to
hidden-information is high (MacKie-Mason, 1990).
9 Eckbo (2008) demonstrates that a stock market reaction of -2 percent to SEOs translates into an amount equal
to 15 percent of the proceeds of the average issue, which is equivalent to more than three times the direct costs of
an issue. 10
Lerner (1994) shows that venture-backed private firms go public when valuations are high and employ private
financing when equity values are lower.
- 150 -
Information asymmetries decrease when new value-relevant information is made public.
Korajczyk et al. (1991, 1992) argue that information asymmetry is time varying and that,
immediately following an information release, few managers will have received a private
signal and the adverse selection problem is therefore small. However, as time passes, the
adverse selection problem worsens as more managers receive private signals. Investors react
to different types of information in the equity issuance setting. Korajczyk et al. (1991) and
Denis and Sarin (2001) find that accounting earnings and earnings announcements,
respectively, have a significant effect on the market’s reaction to the issuance of new equity.
Therefore, equity issues tend to follow informative earnings announcements. Information of a
more discretionary character appears to be less informative. Loderer and Mauer (1992) find
that dividend announcements do not reduce valuation uncertainty. Lin et al. (2008) document
similar price reactions, although dividends appear to be associated with volume reactions.
Most non-accounting disclosures are discretionary and firms tend to make more such
disclosures prior to new equity issuances (Cooper and Grinder, 1996; Lang and Lundholm,
2000).
2.1.1 Information asymmetry, R&D and disclosures of R&D
Corporate investments in intangible assets create information asymmetries because managers
can continually observe changes on an individual asset basis (e.g., a drug’s pros and cons)11
,
whereas outsiders obtain only highly aggregated information at discrete points of time, i.e.,
when R&D information is made public. The disclosure of R&D information is important for
several reasons. First, R&D projects, such as a new drug under development, are unique to a
developing firm. Investors generally derive little or no information about the firm’s R&D
projects by observing the R&D performance of other drugs. Second, although financial assets
are traded in organized markets in which prices are observable and convey direct information
about values, there are no organized markets for R&D in which prices are available. Third,
because of accounting standards, investments in intangible assets, such as R&D, are generally
immediately expensed and less often capitalized12
. Given the relatively sparse amount of
11
Even when a drug is tested in randomized and double-blinded clinical trials in which either the clinician, the
patient or the company has direct information about the safety and efficacy of the drug being tested compared to
a placebo, companies generally run additional pre-clinical activities in parallel from which they generally gain
substantial knowledge about the drug. 12
According to International Accounting Standards (IAS38), research costs should be expensed when they are
incurred, and development costs can be capitalized if certain criteria are met. One such criterion is whether it is
probable that the expected future economic benefits will flow to the entity or not.
- 151 -
public information about firms’ R&D activities and the importance of these activities to the
operations and profit potential of technology and science-based companies, R&D contributes
substantially to information asymmetry between corporate insiders and outside investors
(Aboody and Lev, 2000). Consequently, Hall and Lerner (2009) suggest that the marketplace
for financing R&D looks like the “lemons” market modeled by Akerlof (1970). According to
Akerlof’s lemon principle (1970, 2002), high information asymmetry in the private equity
market is more likely to attract bad-quality firms. In the model by Chemmanur (1993), high-
quality firms have incentives to disclose their qualities to increase their market value, whereas
low-quality firms have few reasons to reveal their qualities. This discrepancy in incentives
implies an association between information asymmetry and firm quality. Managers of high-
quality firms with external financing needs will therefore issue new equity when the market is
most informed13
.
Biotech firms differ from other research-intensive firms in the sense that their development
processes are typically closely monitored by external regulatory authorities with considerable
experience in evaluating drugs with respect to issues such as efficacy and safety.
Biotechnology projects must undergo a thorough and well-documented regulatory review
process; therefore, there are mandatory non-discretionary evaluations of the value-creation
process14
. Thus, although accounting information has a weak association with the value of
biotech firms (Dedman et al., 2008; McConomy and Xu, 2004), investors can rely on
information that is verified by regulatory authorities acting independently. A candidate drug’s
progress in clinical trials is a strong signal to investors that the firm is creating value (e.g.,
Amir and Lev, 1996). R&D disclosures are generally mandatory, non-discretionary and value-
relevant. Thus, in particular, I expect that firms are more likely to use rights offerings instead
of private placements following credible R&D disclosures (the main proxy for information
asymmetry), i.e., when information asymmetry is low. This leads to the first hypothesis:
H1: Biotechnology firms use rights offerings to a greater extent after they have released
disclosures of R&D.
13
It is important to note that even if managers currently have no private information, they may prefer to wait to
issue equity until investors become better informed. 14
Biotech firms typically cooperate with regulatory authorities in the drug development process because failure
to comply with recommendations may ultimately prolong the development process, inhibit a future drug
- 152 -
2.2 Corporate control – the monitoring hypothesis
Corporate governance problems, i.e., agency problems between managers and shareholders,
can play a role in the choice of equity-selling mechanisms. In the R&D setting, two agency
cost scenarios may co-exist. First, managers may spend cash on activities that simply benefit
them (but not the existing shareholders). Second, risk-averse managers may be reluctant to, or
even avoid, investing in uncertain and high-risk R&D projects.
The monitoring hypothesis suggests that private placements are used when there is a demand
for monitoring. Private placements generally target a few sophisticated investors, which
suggests that they will be associated with more concentrated ownership (Shleifer and Vishny,
1986; Kahn and Winton, 1998). The higher the level of ownership concentration, the easier it
is for a small group of shareholders to influence management behavior through their voting
power. By contrast, the more diverse the shareholding, the easier it is for management to
expropriate current shareholders in favor of their own interests or to use cash inefficiently as
the level of influence by non-management shareholders decreases (Mitchell, 1983). Under the
monitoring hypothesis (Wruck, 1989), private placement investors are assumed to be active in
monitoring management to ensure that the resources of the firm are efficiently used.
The empirical findings on the monitoring hypothesis suggest mixed results. Wruck (1989)
proposes an ownership structure hypothesis and finds evidence that both changes in and the
level of ownership concentration are important. Positive abnormal returns surrounding private
placements were found that were directly related to changes in ownership level when the
firms were at a low or a high level of ownership concentration after private placements. An
inverse relationship was found for the sample of firms with a moderate level of ownership
concentration after the placements. Several studies report a positive stock market reaction to
the announcement of private placements (e.g., Wruck, 1989; Hertzel and Smith, 1993; Janney
and Folta, 2003). A positive stock market reaction to private placements may reflect the
market’s belief that the new blockholder will play a positive role in monitoring management
(Wruck, 1989). Eckbo (2008) provides an alternative explanation to the positive stock market
reaction to private placements. Because finding a private placement investor who is willing to
invest in the stock requires a favorable review of the issuing firms’ future prospects,
successful private placements can be viewed as the outcome of a positive selection process
that is consistent with the positive stock market reaction to private placements.
approval, and even lead to private lawsuits and enforcement actions by agencies such as the Securities and
Exchange Commission (SEC).
- 153 -
Cronqvist and Nilsson (2004) find that family controlled firms avoid equity issue methods
that dilute benefits or subject them to more monitoring. By contrast, Hertzel and Smith (1993)
find that institutional ownership decreases after private placements. This lends no support to
the monitoring hypothesis. Barclay et al. (2007) show that private placement investors
typically are passive but acquire large blocks of stock. Nor does Wu (2004) find evidence for
the monitoring view that private placement investors engage in more monitoring than public
offering investors. Wu reports that private placements generally target a few institutional
investors and because there are no formal methods for selecting private placement investors,
managers’ preferences can play a role in choosing them. In summary, if there is a demand for
monitoring, I expect the level of ownership held by blockholders to increase after private
placements. Thus, the second hypothesis is formulated as follows:
H2: Biotechnology firms use private placements to a greater extent when the level of
blockholder ownership is small.
However, it is important to note that monitoring and adverse selection effects are not mutually
exclusive. On the basis of the level of asymmetric information (high vs. low) and ownership
concentration (high vs. low), there are four different possible outcomes. To discriminate
between the monitoring and information asymmetry hypotheses, I include an interaction
variable between the proxies for information asymmetry and ownership concentration.
3. Data and model
3.1 Data
To construct the sample of rights offerings and private placements, I utilize the Thomson
Reuters Datastream database over the 1990-2012 period to identify changes in the number of
shares outstanding for a sample of European public biotechnology15
firms. I then impose
15
In this paper, I use the definition of biotechnology company that is common among industry practitioners: "a
firm that engages in the research and development of drugs and was founded after Genentech (1976)". Therefore,
companies developing tools, instruments, medical devices or providing technology-based services to other
healthcare companies are excluded. Although the difference between pharmaceutical and biotechnology
companies has become blurred as pharmaceutical companies have begun developing biologicals in addition to
small molecules, the key differences are primarily along several dimensions (firm size, number of projects and
sales). Most biotechnology companies generally have few clinical projects (and relatively small firm sizes); in
addition, in only a few cases do biotechnology companies have products on the market.
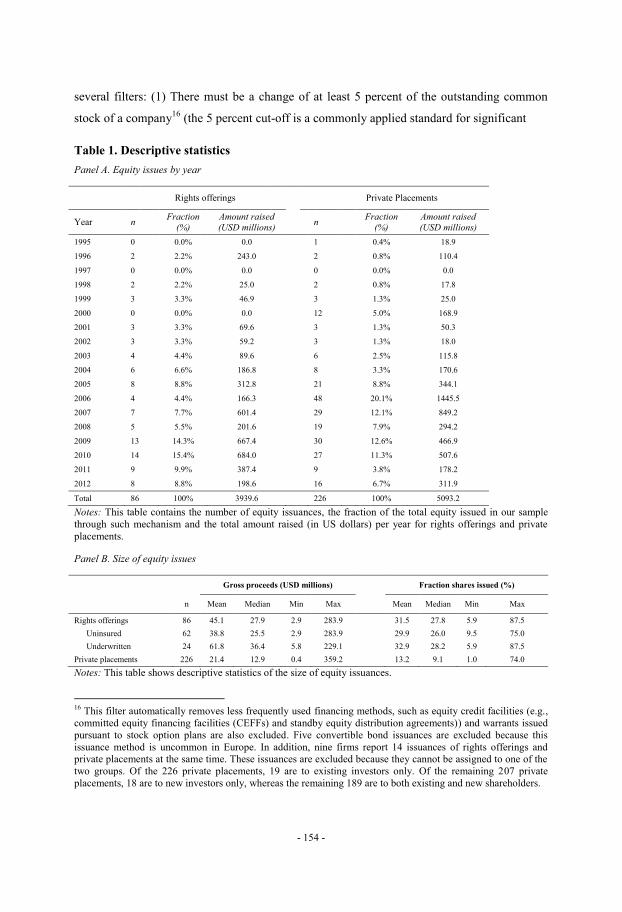
- 154 -
several filters: (1) There must be a change of at least 5 percent of the outstanding common
stock of a company16
(the 5 percent cut-off is a commonly applied standard for significant
Table 1. Descriptive statistics
Panel A. Equity issues by year
Rights offerings
Private Placements
Year n Fraction
(%)
Amount raised
(USD millions)
n
Fraction
(%)
Amount raised
(USD millions)
1995 0 0.0% 0.0 1 0.4% 18.9
1996 2 2.2% 243.0 2 0.8% 110.4
1997 0 0.0% 0.0 0 0.0% 0.0
1998 2 2.2% 25.0 2 0.8% 17.8
1999 3 3.3% 46.9 3 1.3% 25.0
2000 0 0.0% 0.0 12 5.0% 168.9
2001 3 3.3% 69.6 3 1.3% 50.3
2002 3 3.3% 59.2 3 1.3% 18.0
2003 4 4.4% 89.6 6 2.5% 115.8
2004 6 6.6% 186.8 8 3.3% 170.6
2005 8 8.8% 312.8 21 8.8% 344.1
2006 4 4.4% 166.3 48 20.1% 1445.5
2007 7 7.7% 601.4 29 12.1% 849.2
2008 5 5.5% 201.6 19 7.9% 294.2
2009 13 14.3% 667.4 30 12.6% 466.9
2010 14 15.4% 684.0 27 11.3% 507.6
2011 9 9.9% 387.4 9 3.8% 178.2
2012 8 8.8% 198.6 16 6.7% 311.9
Total 86 100% 3939.6 226 100% 5093.2
Notes: This table contains the number of equity issuances, the fraction of the total equity issued in our sample
through such mechanism and the total amount raised (in US dollars) per year for rights offerings and private
placements.
Panel B. Size of equity issues
Gross proceeds (USD millions) Fraction shares issued (%)
n Mean Median Min Max Mean Median Min Max
Rights offerings 86 45.1 27.9 2.9 283.9 31.5 27.8 5.9 87.5
Uninsured 62 38.8 25.5 2.9 283.9 29.9 26.0 9.5 75.0
Underwritten 24 61.8 36.4 5.8 229.1 32.9 28.2 5.9 87.5
Private placements 226 21.4 12.9 0.4 359.2 13.2 9.1 1.0 74.0
Notes: This table shows descriptive statistics of the size of equity issuances.
16
This filter automatically removes less frequently used financing methods, such as equity credit facilities (e.g.,
committed equity financing facilities (CEFFs) and standby equity distribution agreements)) and warrants issued
pursuant to stock option plans are also excluded. Five convertible bond issuances are excluded because this
issuance method is uncommon in Europe. In addition, nine firms report 14 issuances of rights offerings and
private placements at the same time. These issuances are excluded because they cannot be assigned to one of the
two groups. Of the 226 private placements, 19 are to existing investors only. Of the remaining 207 private
placements, 18 are to new investors only, whereas the remaining 189 are to both existing and new shareholders.
- 155 -
shareholdings); and (2) Detailed information about the equity issuance had to be reported on
corporate webpages or in the Factiva database, otherwise it was excluded. This collection
method results in a final sample of 86 rights offerings and 226 private placements made by 91
firms. These numbers indicate that several companies raised external capital more than once
over the sample period. Of the 78 firms that made private placements, 18 firms made one, 17
firms made two, and 43 firms made three or more. Of the 39 firms that made rights offerings,
17 firms made one, nine firms made two, and 13 firms made three or more17
. Table 1 contains
information about the private placements and rights offerings in the sample.
Panel A of Table 1 displays both the number and fraction of total equity issued in our sample
by year through the rights offering and private placement mechanisms. The largest fraction of
rights offerings occurred in 2009 and 2010. By contrast, private placements experienced a
peak in 2006 with 48 (20.1 percent of the total amount issued in our sample via private
placements), but there were only nine private placements (3.8 percent) in 2011. Panel B of
Table 1 shows the size of equity issuances measured as the gross proceeds and the fraction of
shares issued for each equity-selling mechanism. Gross proceeds and share proportions issued
from rights offerings are in general larger than for private placements. Mean (median) gross
proceeds from rights offerings are $45.1 ($27.9), whereas the corresponding figures for
private placements are $21.4 ($12.9). The mean (median) fraction of shares issued in rights
offerings is 31.5 (27.8) percent and 13.2 (9.1) percent for private placements.
3.2 Model
My main interest is to identify the determinants that affect the decision to raise equity capital
through a rights offering or a private placement. In this section, I discuss the dependent
variable (i.e., the equity announcement) and independent variables.
In Section 4, I employ a logit model to test the hypotheses regarding the choice between a
rights offering and a private placement. In Section 5, I employ a nested logit model
(McFadden, 1978, 1981) because this includes two decision levels. The first-level alternatives
are rights offerings versus private placements, and the second-level alternatives are uninsured
rights offerings and underwritten (standby) rights offerings.
The main proxies for measuring information asymmetry and monitoring are product-related
R&D disclosures and blockholder ownership, respectively. I anticipate R&D disclosures to
17
The regression models control for both year- and firm-specific effects.
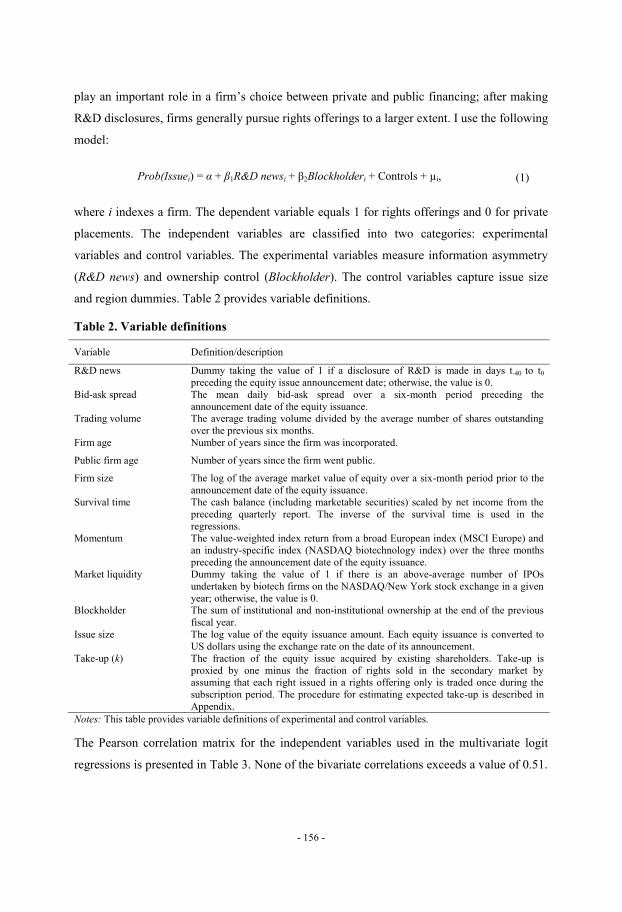
- 156 -
play an important role in a firm’s choice between private and public financing; after making
R&D disclosures, firms generally pursue rights offerings to a larger extent. I use the following
model:
Prob(Issuei) = α + β1R&D newsi + β2Blockholderi + Controls + µi, (1)
where i indexes a firm. The dependent variable equals 1 for rights offerings and 0 for private
placements. The independent variables are classified into two categories: experimental
variables and control variables. The experimental variables measure information asymmetry
(R&D news) and ownership control (Blockholder). The control variables capture issue size
and region dummies. Table 2 provides variable definitions.
Table 2. Variable definitions
Variable Definition/description
R&D news Dummy taking the value of 1 if a disclosure of R&D is made in days t-40 to t0
preceding the equity issue announcement date; otherwise, the value is 0.
Bid-ask spread The mean daily bid-ask spread over a six-month period preceding the
announcement date of the equity issuance.
Trading volume The average trading volume divided by the average number of shares outstanding
over the previous six months.
Firm age Number of years since the firm was incorporated.
Public firm age Number of years since the firm went public.
Firm size The log of the average market value of equity over a six-month period prior to the
announcement date of the equity issuance.
Survival time The cash balance (including marketable securities) scaled by net income from the
preceding quarterly report. The inverse of the survival time is used in the
regressions.
Momentum The value-weighted index return from a broad European index (MSCI Europe) and
an industry-specific index (NASDAQ biotechnology index) over the three months
preceding the announcement date of the equity issuance.
Market liquidity Dummy taking the value of 1 if there is an above-average number of IPOs
undertaken by biotech firms on the NASDAQ/New York stock exchange in a given
year; otherwise, the value is 0.
Blockholder The sum of institutional and non-institutional ownership at the end of the previous
fiscal year.
Issue size The log value of the equity issuance amount. Each equity issuance is converted to
US dollars using the exchange rate on the date of its announcement.
Take-up (k) The fraction of the equity issue acquired by existing shareholders. Take-up is
proxied by one minus the fraction of rights sold in the secondary market by
assuming that each right issued in a rights offering only is traded once during the
subscription period. The procedure for estimating expected take-up is described in
Appendix.
Notes: This table provides variable definitions of experimental and control variables.
The Pearson correlation matrix for the independent variables used in the multivariate logit
regressions is presented in Table 3. None of the bivariate correlations exceeds a value of 0.51.

Tab
le 3
. P
ears
on
co
rrel
ati
on
matr
ix
R
&D
new
s B
id-a
sk
spre
ad
Tra
din
g
volu
me
Fir
m a
ge
Pu
bli
c fi
rm
age
Fir
m s
ize
Su
rviv
al t
ime
Mom
entu
m
Mar
ket
liq
uid
ity
B
lock
hold
er
Issu
e si
ze
R&
D n
ews
Bid
-ask
sp
read
0
.06
4
(0.2
77
)
Tra
din
g v
olu
me
-0.0
36
(0.5
44
)
-0.0
46
(0.4
36
)
Fir
m a
ge
0.0
20
(0.7
28
)
0.0
12
(0.8
41
)
0.0
00
(0.9
97
)
Pu
bli
c fi
rm a
ge
0.0
12
(0.7
90
)
-0.0
54
(0.3
59
)
0.0
50
(0.3
94
)
0.4
64
**
*
(0.0
00
)
Fir
m s
ize
0.1
20
**
(0.0
38
)
0.3
08
**
*
(0.0
00
)
-0.1
28
**
(0.0
25
)
0.1
02
*
(0.0
76
)
0.2
04
**
*
(0.0
00
)
Su
rviv
al t
ime
-0.0
34
(0.5
92
)
0.0
19
(0.7
64
)
-0.1
51
**
(0.0
17
)
-0.1
28
**
(0.0
43
)
-0.1
54
**
(0.0
15
)
-0.3
68
**
*
(0.0
00
)
Mom
entu
m
0.0
08
(0.8
90
)
-0.0
36
(0.5
40
)
-0.0
51
(0.3
80
)
-0.0
06
(0.9
20
)
-0.0
05
(0.9
36
)
0.1
09
(0.0
55
)
0.0
23
(0.7
17
)
Mar
ket
liq
uid
ity
-0.0
39
(0.5
04
)
0.0
11
(0.8
47
)
0.0
92
(0.1
15
)
0.0
78
(0.1
73
)
0.0
39
(0.4
93
)
0.1
46
**
(0.0
11
)
-0.0
81
(0.2
02
)
0.1
21
**
(0.0
33
)
Blo
ckh
old
er
0.0
02
(0.9
80
)
-0.0
73
(0.2
30
)
-0.2
39
**
*
(0.0
00
)
-0.2
43
**
*
(0.0
00
)
-0.1
51
**
(0.0
12
)
-0.0
94
(0.1
15
)
0.2
86
**
*
(0.0
00
)
0.0
78
(0.1
91
)
-0.1
93
**
*
(0.0
01
)
Issu
e si
ze
0.3
00
**
*
(0.0
00
)
0.1
38
**
(0.0
17
)
0.1
11
*
(0.0
55
)
0.1
73
**
*
(0.0
02
)
0.0
96
*
(0.0
94
)
0.5
05
**
*
(0.0
00
)
-0.4
20
**
*
(0.0
00
)
0.0
03
(0.9
57
)
0.1
37
**
(0.0
16
)
-0.2
22
**
*
(0.0
00
)
No
tes:
This
tab
le s
ho
ws
pai
r-w
ise
corr
elat
ions
for
the
exp
erim
enta
l an
d c
ontr
ol
var
iab
les
in t
he
regre
ssio
n e
quati
ons.
The
var
iab
les
are
des
crib
ed i
n T
able
2.
*,
** a
nd
**
*
den
ote
that
the
pai
r-w
ise
corr
elat
ions
are
sig
nif
ican
tly d
iffe
rent
fro
m z
ero
at
the
10
%,
5%
, an
d 1
% l
evel
s, r
esp
ecti
vel
y.
P-v
alu
es
are
in b
rack
ets.
- 157 -
- 158 -
3.3 Variables associated with information asymmetry
3.3.1 Information asymmetry and R&D disclosures
Korajczyk et al. (1991, 1992) hypothesize that corporate managers can reduce information
asymmetry prior to issuing equity by releasing information before the announcement date. To
test the information asymmetry hypothesis, I include an R&D-related variable (R&D) in the
analysis. R&D is a dummy variable that equals 1 if an R&D announcement occurs within 40
trading days prior to announcement of the equity issuance and 0 otherwise18
. R&D news
announcements can be either positive (e.g., a drug demonstrates efficacy against a pre-defined
endpoint) or negative (e.g., the drug causes severe side effects). Whereas both positive and
negative R&D news announcements reduce information asymmetry, negative news
announcements do not carry a subsequent capital requirement and generally induce a
significant negative share price reaction. Dittmar and Thakor (2007) argue that firms will
issue equity when stock prices are high, but only if a high stock price coincides with low
adverse selection. In this study, neither private placements nor rights offerings are preceded
by negative R&D news announcements.
There are certain discretionary elements in the disclosure of R&D news announcements
regarding biotechnology research projects in their early stages, in particular. Before initiation,
regulatory authorities approve the design of a study, including primary and secondary
endpoints, but they frequently do not scrutinize the clinical results before the biotech firm
initiates the next phase. Opportunistic interpretations of results would, however, lead to
serious discontent from both investors and regulatory authorities. In addition, R&D
disclosures are generally mandatory, non-discretionary and value-relevant (e.g., Cerbioni and
Parbonetti, 2007).
3.3.2 Other firm-specific variables associated with information asymmetry
Bid-ask spread
Glosten and Milgrom (1985) document the relationship between bid-ask spreads and
information asymmetry by proposing that the larger the information asymmetry, the wider the
spread. Bid-ask spread is measured as the mean daily relative bid-ask spread over a six-month
period preceding the equity issuance.
18
In an untabulated test, I verify that expansion of the window to 30 and 60 calendar days does not have a
material effect on the inferences. A biotechnology company typically has few clinical research projects, and each
project separately takes approximately one to three years to complete, which indicates that major clinical results
are typically announced only a few times per year.
- 159 -
Stock return volatility
French and Roll (1986) find that stock return volatility is primarily related to the flow of
information to investors, i.e., the higher the quality and quantity of information, the lower the
stock return variability. Stock return volatility is measured as the standard deviation of daily
stock returns over a six-month period prior to the equity issuance.
Trading volume (liquidity)
Frequently traded stocks tend to have greater information production, whereas less frequently
traded stocks typically have more information problems (Diamond and Verrecchia, 1991). I
measure trading volume as the average trading volume divided by the average number of
shares outstanding over the previous six months.
Firm age and public firm age
Following James and Wier (1990), Krishnaswami et al. (1999) and Wu (2004), I use firm age
to measure the potential information asymmetries that a firm faces. I include the log of firm
age (number of years since the firm was founded) and public firm age (number of years since
the firm went public) as proxies for the level of asymmetric information.
Firm size
Information asymmetry tends to decrease with firm size (e.g., Vermaelen, 1981). Large firms
may face less information asymmetry because they tend to be more mature, have established
and time-tested disclosure policies and practices, and receive more attention from the market
and regulators (Diamond and Verrecchia (1991) and Harris (1994)). Because few biotech
firms hold debt capital and investments in R&D are generally not capitalized, I include the
average market value of equity over the six-month period prior to the announcement date of
the equity issuance as a proxy for the level of information asymmetry (instead of the log of
total assets)19
.
Financial distress (Survival time)
Firms in financial distress are generally considered to be suffering from severe information
asymmetries, such as a firm that is undergoing debt restructuring (Gilson et al., 1990).
Following Lerner et al. (2003), survival time is measured for each quarter as the firm’s
beginning-of-period cash balance scaled by net income. Net income is used as a proxy for
cash flows because biotech firms tend to expense most investments immediately and, in
19
Larger firms disclose more R&D news and are less dependent on individual news announcements. Therefore,
firm size reduces scaling problems associated with news announcements.

- 160 -
addition, these firms rarely gain revenue from continuous operations. In the nested logit
models, I use the inverse of the firms’ survival time. Because there is no association between
positive earnings and survival time (i.e., when earnings are positive, the survival time is
infinite), the measure is set to zero for profitable firms (Lerner et al., 2003).
3.3.3 Market specific variables associated with information asymmetry
Business cycle (Momentum)
Choe et al. (1993) show that the volume of equity issuances is higher during periods of
economic growth and after periods of a stock market run-up (which is an indication of
momentum); these authors propose that firms face less adverse selection at business cycle
peaks than at troughs. I measure business cycle (or momentum) as the value-weighted market
return from a broad European index (MSCI Europe) and an industry-specific index
(NASDAQ biotechnology) over the three months prior to the issuance ending the calendar
month before the issue occurs.
Market liquidity
I measure market liquidity as an indicator variable that takes the value of 1 if there are an
above-average number of IPOs (scaled by number of listed stocks) made by biotech firms on
the NASDAQ/New York stock exchange in a given year, and 0 otherwise.
3.4 Ownership structure variable
Blockholder
Similar to several prior studies (e.g., Wruck, 1989; Wu, 2004), I measure ownership by the
blockholder variable, which is defined as the sum of either institutional and/or non-
institutional ownership that owns more than 5 percent of the outstanding shares of common
stock at the end of the previous fiscal year. Changes in blockholder ownership are defined as
the difference between the sum of institutional and non-institutional ownership owning more
than 5 percent at the year-end of the previous fiscal year compared to the year-end after the
issuance.
3.5 Control variables
I also include three control variables—issue size, take-up and regional dummies. These
variables are briefly discussed below.
- 161 -
Issue size
Private placements tend to be smaller in issue size than public offerings20
. This also holds for
the fraction of shares issued. Issue size is measured as the log value of the equity issuance.
Take-up (k)
In the model by Eckbo and Masulis (1992), the adverse selection cost problem exists when
the fraction of the stock issue expected to be taken up by existing shareholders (denoted k) is
less than 100 percent. The procedure for estimating expected take-up is detailed in Appendix.
Region dummies
Market efficiency and the level of shareholder protection are known to vary across
institutional settings. To mitigate this problem, I use dummies for the four regions specified
by La Porta et al. (1998): Anglo-Saxon, Germanic, French and Scandinavian legal origins. I
use the Anglo-Saxon legal system as the reference.
3.5 Interaction effects
I also examine interaction effects between R&D news and blockholder. Unlike the interaction
effect in linear models, the interaction effect in non-linear models is conditional on the
independent variables (Ai and Norton, 2003; Norton et al., 2004; Powers, 2005); therefore,
both the magnitude and statistical significance of the interaction term can vary across
observations. For example, when one continuous variable (blockholder) and one dummy
variable (R&D news) are interacted, the interaction effect is the discrete difference (with
respect to R&D news) of the single derivative (with respect to blockholder). In the probit
model, the correct marginal effect of a change in the interaction variable between the R&D
news dummy variable and blockholder is:
( )
( ) [( ) ]
( )
(2)
20
The board of directors is typically given authorization by the prior annual shareholders meeting to resolve the
directed issuance of new shares with deviation from the existing shareholders’ pre-emptive rights. The
authorization generally restricts the board of directors to issuing no more than 5 to 10 percent of the outstanding
share capital on one or several occasions during the period before the next annual shareholders meeting. A
private placement is typically completed over several days or overnight through an accelerated bookbuilding
procedure. In rights offerings, the board’s resolution to issue new shares is typically subject to approval at an
extraordinary shareholders’ meeting. It is important to note that this study does not try to explain the relationship
between issue proceeds and equity-selling mechanism choices.
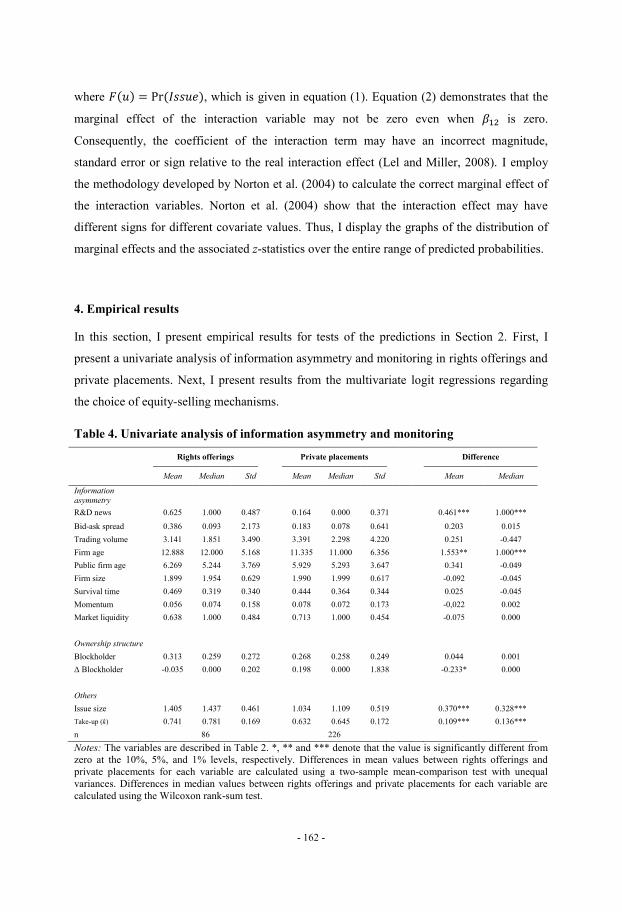
- 162 -
where ( ) ( ), which is given in equation (1). Equation (2) demonstrates that the
marginal effect of the interaction variable may not be zero even when is zero.
Consequently, the coefficient of the interaction term may have an incorrect magnitude,
standard error or sign relative to the real interaction effect (Lel and Miller, 2008). I employ
the methodology developed by Norton et al. (2004) to calculate the correct marginal effect of
the interaction variables. Norton et al. (2004) show that the interaction effect may have
different signs for different covariate values. Thus, I display the graphs of the distribution of
marginal effects and the associated z-statistics over the entire range of predicted probabilities.
4. Empirical results
In this section, I present empirical results for tests of the predictions in Section 2. First, I
present a univariate analysis of information asymmetry and monitoring in rights offerings and
private placements. Next, I present results from the multivariate logit regressions regarding
the choice of equity-selling mechanisms.
Table 4. Univariate analysis of information asymmetry and monitoring
Rights offerings
Private placements
Difference
Mean Median Std
Mean Median Std
Mean Median
Information
asymmetry
R&D news 0.625 1.000 0.487 0.164 0.000 0.371 0.461*** 1.000***
Bid-ask spread 0.386 0.093 2.173 0.183 0.078 0.641 0.203 0.015
Trading volume 3.141 1.851 3.490 3.391 2.298 4.220 0.251 -0.447
Firm age 12.888 12.000 5.168 11.335 11.000 6.356 1.553** 1.000***
Public firm age 6.269 5.244 3.769 5.929 5.293 3.647 0.341 -0.049
Firm size 1.899 1.954 0.629 1.990 1.999 0.617 -0.092 -0.045
Survival time 0.469 0.319 0.340 0.444 0.364 0.344 0.025 -0.045
Momentum 0.056 0.074 0.158 0.078 0.072 0.173 -0,022 0.002
Market liquidity 0.638 1.000 0.484 0.713 1.000 0.454 -0.075 0.000
Ownership structure
Blockholder 0.313 0.259 0.272 0.268 0.258 0.249 0.044 0.001
Δ Blockholder -0.035 0.000 0.202 0.198 0.000 1.838 -0.233* 0.000
Others
Issue size 1.405 1.437 0.461 1.034 1.109 0.519 0.370*** 0.328***
Take-up (k) 0.741 0.781 0.169 0.632 0.645 0.172 0.109*** 0.136***
n 86 226
Notes: The variables are described in Table 2. *, ** and *** denote that the value is significantly different from
zero at the 10%, 5%, and 1% levels, respectively. Differences in mean values between rights offerings and
private placements for each variable are calculated using a two-sample mean-comparison test with unequal
variances. Differences in median values between rights offerings and private placements for each variable are
calculated using the Wilcoxon rank-sum test.
- 163 -
4.1 Univariate analysis of information asymmetry and monitoring
Panel A of Table 4 shows the univariate analysis. I employ two tests: a two-sample mean-
comparison test with unequal variances and the non-parametric Wilcoxon rank-sum test. I
include several information asymmetry measures (for detailed definitions of the variables, see
Table 2). The information asymmetry proxy, R&D news, provides support for the information
asymmetry hypothesis, whereas the ownership variable (blockholder) does not support the
monitoring hypothesis. Of the rights offerings, 61 percent are preceded by the disclosure of
R&D news, whereas 17 percent of private placements disclose R&D news prior to the equity
issue announcement. The mean-comparison test is positive and statistically significant (p <
0.01). The mean blockholder ownership for rights offerings and private placements are 31.3
and 26.8 percent, respectively. The mean-comparison test indicates that there is no difference
between rights offerings and private placements (p > 0.10).
4.2 The choice of equity-selling mechanisms
The results of the multivariate logit regression analysis are summarized in Panel A of Table 5.
Consistent with expectations, the coefficients for R&D news are positive and statistically
significant (1 percent level). The results are robust when controlled for issue size and take-up
(see Model 3), which indicates that there is a higher probability that firms issue equity
publicly rather than privately following credible R&D disclosures. The marginal effects show
that firms that disclose R&D news are 40 percent more likely to choose a rights offering over
a private placement. In untabulated tests, I calculate the predicted probabilities if R&D news
is equal to 1 and all other variables are held constant. The predicted probabilities for rights
offerings and private placements are 0.699 and 0.301, respectively. In Model 4, the proxy for
the ownership variable (Blockholder) is insignificant (z-statistics = 1.08). However, when
controlling for issue size and take-up, the blockholder variable is significant at the 5 percent
level (z-statistics = 2.14).
Next, I examine other proxies for information asymmetry (see Panel B of Table 5). None of
the other proxies are significant at the 5 percent level (untabulated). However, when
controlling for the size of the issuance, three variables are significant (firm size, survival time
and market liquidity). The firm size variable is negative, which indicates that smaller firms
tend to issue equity publicly rather than privately. This contrasts with prior empirical studies
(e.g., Cronqvist and Nilsson, 2005), which suggest that larger and older firms are more likely
to issue equity publicly rather than privately. The financial distress variable (survival time) is
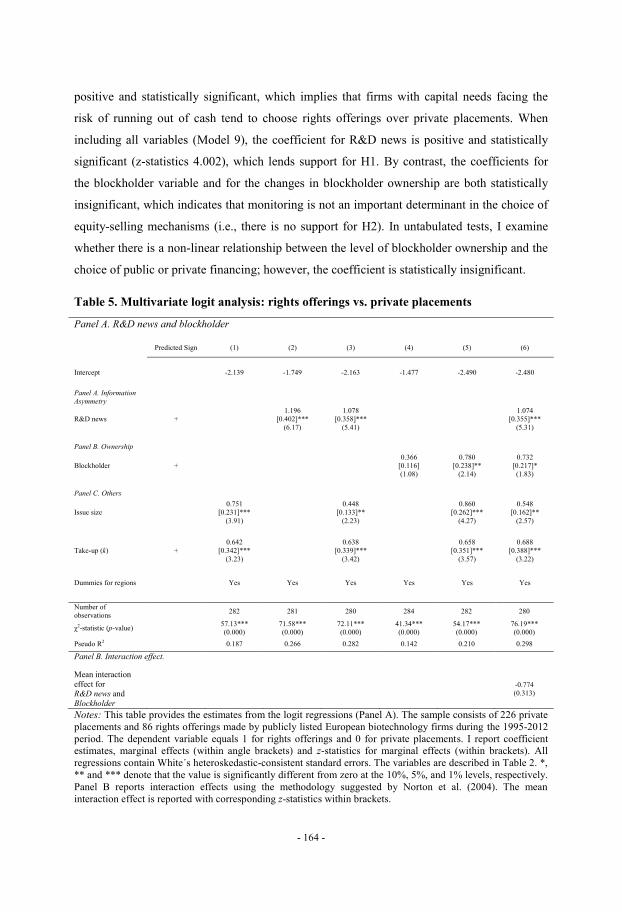
- 164 -
positive and statistically significant, which implies that firms with capital needs facing the
risk of running out of cash tend to choose rights offerings over private placements. When
including all variables (Model 9), the coefficient for R&D news is positive and statistically
significant (z-statistics 4.002), which lends support for H1. By contrast, the coefficients for
the blockholder variable and for the changes in blockholder ownership are both statistically
insignificant, which indicates that monitoring is not an important determinant in the choice of
equity-selling mechanisms (i.e., there is no support for H2). In untabulated tests, I examine
whether there is a non-linear relationship between the level of blockholder ownership and the
choice of public or private financing; however, the coefficient is statistically insignificant.
Table 5. Multivariate logit analysis: rights offerings vs. private placements
Panel A. R&D news and blockholder
Predicted Sign (1) (2) (3) (4) (5) (6)
Intercept -2.139 -1.749 -2.163 -1.477 -2.490 -2.480
Panel A. Information
Asymmetry
R&D news +
1.196
[0.402]***
(6.17)
1.078
[0.358]***
(5.41)
1.074
[0.355]***
(5.31)
Panel B. Ownership
Blockholder +
0.366
[0.116]
(1.08)
0.780
[0.238]**
(2.14)
0.732
[0.217]*
(1.83)
Panel C. Others
Issue size
0.751
[0.231]***
(3.91)
0.448
[0.133]**
(2.23)
0.860
[0.262]***
(4.27)
0.548
[0.162]**
(2.57)
Take-up (k) +
0.642
[0.342]***
(3.23)
0.638
[0.339]***
(3.42)
0.658
[0.351]***
(3.57)
0.688
[0.388]***
(3.22)
Dummies for regions Yes Yes Yes Yes Yes Yes
Number of
observations 282 281 280 284 282 280
χ2-statistic (p-value) 57.13***
(0.000)
71.58***
(0.000)
72.11***
(0.000)
41.34***
(0.000)
54.17***
(0.000)
76.19***
(0.000)
Pseudo R2 0.187 0.266 0.282 0.142 0.210 0.298
Panel B. Interaction effect.
Mean interaction
effect for R&D news and
Blockholder
-0.774
(0.313)
Notes: This table provides the estimates from the logit regressions (Panel A). The sample consists of 226 private
placements and 86 rights offerings made by publicly listed European biotechnology firms during the 1995-2012
period. The dependent variable equals 1 for rights offerings and 0 for private placements. I report coefficient
estimates, marginal effects (within angle brackets) and z-statistics for marginal effects (within brackets). All
regressions contain White´s heteroskedastic-consistent standard errors. The variables are described in Table 2. *,
** and *** denote that the value is significantly different from zero at the 10%, 5%, and 1% levels, respectively.
Panel B reports interaction effects using the methodology suggested by Norton et al. (2004). The mean
interaction effect is reported with corresponding z-statistics within brackets.
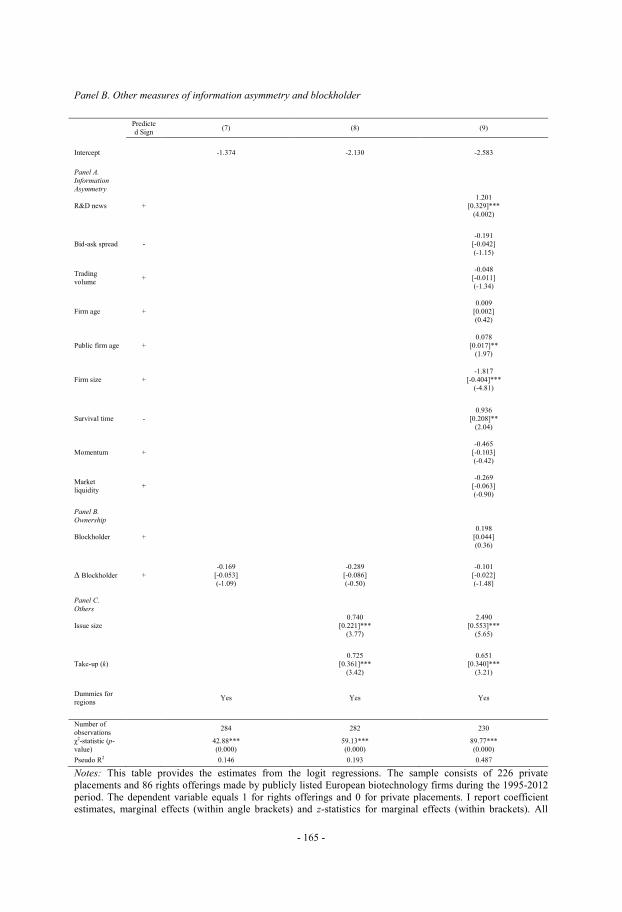
- 165 -
Panel B. Other measures of information asymmetry and blockholder
Predicte
d Sign (7) (8) (9)
Intercept -1.374 -2.130 -2.583
Panel A.
Information
Asymmetry
R&D news +
1.201
[0.329]***
(4.002)
Bid-ask spread -
-0.191
[-0.042]
(-1.15)
Trading
volume +
-0.048
[-0.011]
(-1.34)
Firm age +
0.009
[0.002]
(0.42)
Public firm age +
0.078
[0.017]**
(1.97)
Firm size +
-1.817
[-0.404]***
(-4.81)
Survival time -
0.936
[0.208]**
(2.04)
Momentum +
-0.465
[-0.103]
(-0.42)
Market
liquidity +
-0.269
[-0.063]
(-0.90)
Panel B.
Ownership
Blockholder +
0.198
[0.044]
(0.36)
Δ Blockholder +
-0.169
[-0.053]
(-1.09)
-0.289
[-0.086]
(-0.50)
-0.101
[-0.022]
(-1.48]
Panel C.
Others
Issue size
0.740
[0.221]***
(3.77)
2.490
[0.553]***
(5.65)
Take-up (k)
0.725
[0.361]***
(3.42)
0.651
[0.340]***
(3.21)
Dummies for
regions Yes Yes Yes
Number of
observations 284 282 230
χ2-statistic (p-
value)
42.88***
(0.000)
59.13***
(0.000)
89.77***
(0.000)
Pseudo R2 0.146 0.193 0.487
Notes: This table provides the estimates from the logit regressions. The sample consists of 226 private
placements and 86 rights offerings made by publicly listed European biotechnology firms during the 1995-2012
period. The dependent variable equals 1 for rights offerings and 0 for private placements. I report coefficient
estimates, marginal effects (within angle brackets) and z-statistics for marginal effects (within brackets). All
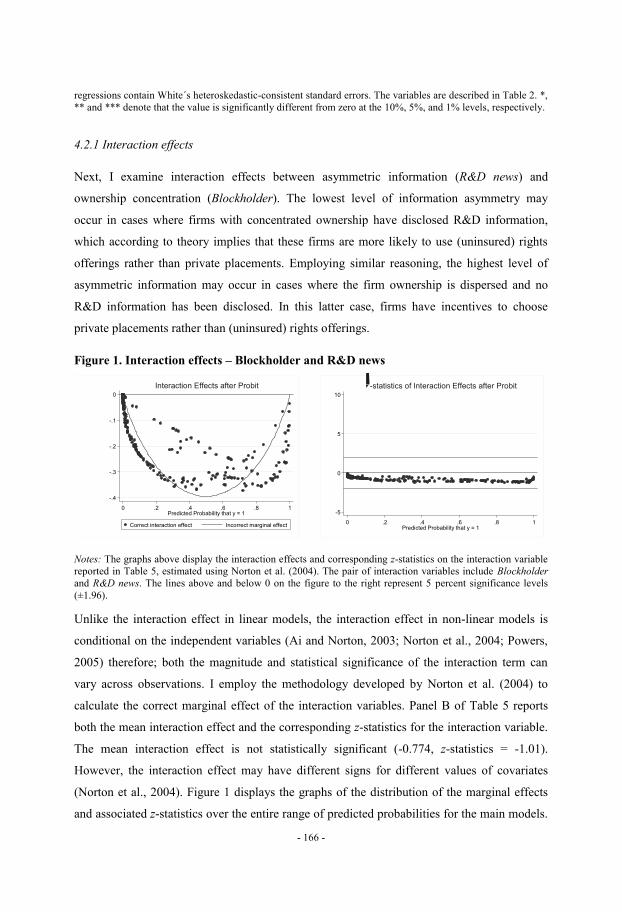
- 166 -
regressions contain White´s heteroskedastic-consistent standard errors. The variables are described in Table 2. *,
** and *** denote that the value is significantly different from zero at the 10%, 5%, and 1% levels, respectively.
4.2.1 Interaction effects
Next, I examine interaction effects between asymmetric information (R&D news) and
ownership concentration (Blockholder). The lowest level of information asymmetry may
occur in cases where firms with concentrated ownership have disclosed R&D information,
which according to theory implies that these firms are more likely to use (uninsured) rights
offerings rather than private placements. Employing similar reasoning, the highest level of
asymmetric information may occur in cases where the firm ownership is dispersed and no
R&D information has been disclosed. In this latter case, firms have incentives to choose
private placements rather than (uninsured) rights offerings.
Figure 1. Interaction effects – Blockholder and R&D news
Notes: The graphs above display the interaction effects and corresponding z-statistics on the interaction variable
reported in Table 5, estimated using Norton et al. (2004). The pair of interaction variables include Blockholder
and R&D news. The lines above and below 0 on the figure to the right represent 5 percent significance levels
(±1.96).
Unlike the interaction effect in linear models, the interaction effect in non-linear models is
conditional on the independent variables (Ai and Norton, 2003; Norton et al., 2004; Powers,
2005) therefore; both the magnitude and statistical significance of the interaction term can
vary across observations. I employ the methodology developed by Norton et al. (2004) to
calculate the correct marginal effect of the interaction variables. Panel B of Table 5 reports
both the mean interaction effect and the corresponding z-statistics for the interaction variable.
The mean interaction effect is not statistically significant (-0.774, z-statistics = -1.01).
However, the interaction effect may have different signs for different values of covariates
(Norton et al., 2004). Figure 1 displays the graphs of the distribution of the marginal effects
and associated z-statistics over the entire range of predicted probabilities for the main models.
-.4
-.3
-.2
-.1
0
Inte
raction
Effe
ct (p
erc
en
tage
po
ints
)
0 .2 .4 .6 .8 1Predicted Probability that y = 1
Correct interaction effect Incorrect marginal effect
Interaction Effects after Probit
-5
0
5
10
z-s
tatistic
0 .2 .4 .6 .8 1Predicted Probability that y = 1
z-statistics of Interaction Effects after Probit
- 167 -
The interaction effects are largely negative and statistically insignificant for most
observations, which implies that there is no association between information asymmetry and
ownership concentration with respect to the choice between private and public financing.
4.3 Additional analysis of monitoring
The theoretical literature explains that private placements are often motivated by management
monitoring because private placements are associated with concentrated ownership and
restrictions on post-placement trading (e.g., Wruck, 1989; Kahn and Winton, 1998). Although
concentrated ownership enhances monitoring incentives (Shleifer and Vishny, 1986), the
ownership concentration measure may be limited because private placements do not
necessarily improve monitoring if ownership is concentrated in the hands of passive investors.
Barclay et al. (2007) show that private placement investors typically are passive despite their
acquisitions of large blocks of stock. An alternative hypothesis might be related to managerial
entrenchment (e.g., Wruck, 1989); Wu (2004) argues that because there is no formal way to
select the investors for private placements, managerial preferences (e.g., investors who are
aligned with and vote in favor of the managers selected) can play a role in the choice of
private placement investors. In the US, most private placements involve restricted shares
(issued pursuant to registration exemptions under Regulation D or Regulation S), which
typically indicates that the shares purchased in such private placements cannot be sold until
two years after they are purchased (issued)21
. No such regulation on private placements exists
in Europe, which enables a clean-test of economic determinants that drives the choice of
equity-selling mechanisms as opposed to regulatory differences22
.
To further evaluate the monitoring hypothesis, I follow Wu (2004) and decompose aggregate
ownership according to the identities of blockholders and study changes in ownership
structure on investor identity levels before and after equity issuance announcements.
Consistent with several prior studies (e.g., Admati and Pfleiderer, 1994; Sahlman, 1990),
pension funds and venture capital funds are classified as monitoring agents. Ownership data
are mainly collected from annual reports and proxy statements. Pre-issuance ownership data
are collected from the nearest year prior to the equity issuance announcement date. Post-
21
For example, in the sample of private placements by Wu (2004), 37 private placements are unrestricted,
whereas 301 are restricted. 22
Nevertheless, when a private placement is directed only to new private placement investor(s), approval from
existing shareholders is frequently required in cases in which the existing shareholders hold a large fraction of
the shares in the firm. For example, on March 6, 2013, Active Biotech announced that its two largest
shareholders, with a joint holding of votes and shares of approximately 44 percent, had approved a private
placement to a new outside investor.
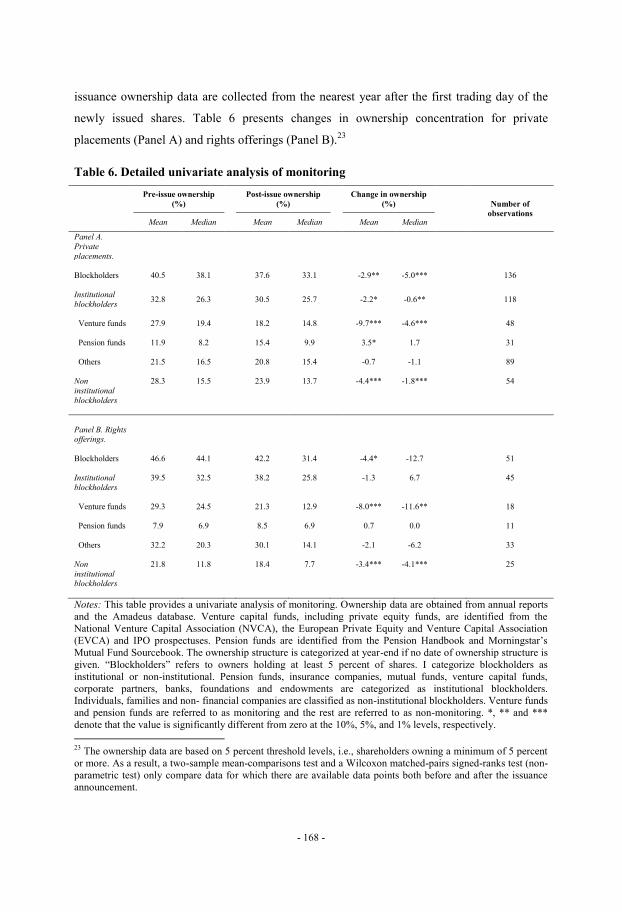
- 168 -
issuance ownership data are collected from the nearest year after the first trading day of the
newly issued shares. Table 6 presents changes in ownership concentration for private
placements (Panel A) and rights offerings (Panel B).23
Table 6. Detailed univariate analysis of monitoring
Pre-issue ownership
(%)
Post-issue ownership
(%)
Change in ownership
(%)
Number of
observations Mean Median Mean Median Mean Median
Panel A.
Private
placements.
Blockholders 40.5 38.1 37.6 33.1 -2.9** -5.0*** 136
Institutional
blockholders 32.8 26.3 30.5 25.7 -2.2* -0.6** 118
Venture funds 27.9 19.4 18.2 14.8 -9.7*** -4.6*** 48
Pension funds 11.9 8.2 15.4 9.9 3.5* 1.7 31
Others 21.5 16.5 20.8 15.4 -0.7 -1.1 89
Non
institutional
blockholders
28.3 15.5 23.9 13.7 -4.4*** -1.8*** 54
Panel B. Rights offerings.
Blockholders 46.6 44.1 42.2 31.4 -4.4* -12.7 51
Institutional
blockholders
39.5 32.5 38.2 25.8 -1.3 6.7 45
Venture funds 29.3 24.5 21.3 12.9 -8.0*** -11.6** 18
Pension funds 7.9 6.9 8.5 6.9 0.7 0.0 11
Others 32.2 20.3 30.1 14.1 -2.1 -6.2 33
Non
institutional blockholders
21.8 11.8 18.4 7.7 -3.4*** -4.1*** 25
Notes: This table provides a univariate analysis of monitoring. Ownership data are obtained from annual reports
and the Amadeus database. Venture capital funds, including private equity funds, are identified from the
National Venture Capital Association (NVCA), the European Private Equity and Venture Capital Association
(EVCA) and IPO prospectuses. Pension funds are identified from the Pension Handbook and Morningstar’s
Mutual Fund Sourcebook. The ownership structure is categorized at year-end if no date of ownership structure is
given. “Blockholders” refers to owners holding at least 5 percent of shares. I categorize blockholders as
institutional or non-institutional. Pension funds, insurance companies, mutual funds, venture capital funds,
corporate partners, banks, foundations and endowments are categorized as institutional blockholders.
Individuals, families and non- financial companies are classified as non-institutional blockholders. Venture funds
and pension funds are referred to as monitoring and the rest are referred to as non-monitoring. *, ** and ***
denote that the value is significantly different from zero at the 10%, 5%, and 1% levels, respectively.
23
The ownership data are based on 5 percent threshold levels, i.e., shareholders owning a minimum of 5 percent
or more. As a result, a two-sample mean-comparisons test and a Wilcoxon matched-pairs signed-ranks test (non-
parametric test) only compare data for which there are available data points both before and after the issuance
announcement.
- 169 -
On an aggregate level, the mean (median) blockholder ownership decreases significantly by
2.9 (5.0) percent and 4.4 (12.7) percent for private placements and rights offerings,
respectively. Although the decrease in blockholder ownership in private placements is smaller
in relative terms, the smaller pre-issue ownership levels in private placements compared to
rights offerings do not support the view that private placements are motivated by a demand
for monitoring.
To further illustrate the changes in ownership concentration, I decompose blockholders into
institutional and non-institutional categories. Pension funds, venture capital funds, mutual
funds, insurance companies and banks are classified as institutional blockholders. Individuals
and families are classified as non-institutional blockholders. Institutional blockholders are
further classified as either monitoring (venture capital funds and pension funds) or non-
monitoring. Venture capital funds, including private equity funds, are identified from
numerous sources, including the National Venture Capital Association (NVCA), the European
Private Equity and Venture Capital Association (EVCA) and from IPO prospectuses. Pension
funds are identified from the Pension Handbook and Morningstar’s Mutual Fund Sourcebook.
I crosscheck and confirm—and if necessary correct—the information with the classification
in the Amadeus database.
The decomposition highlights a few interesting observations that are illustrated in Table 6.
Panel A shows that the mean (median) institutional blockholder ownership decreases
significantly in private placements but not in rights offerings. Furthermore, studying the two
monitoring classes (venture capital funds and pension funds) separately reveals certain
interesting results. For private placements, the mean (median) venture fund ownership
significantly decreases by 9.7 (4.6) percent. Although the mean (but not the median) pension
fund ownership increases for private placements (3.5 percent, statistically significant at the 10
percent level), the net effect of monitoring shareholders is negative and statistically
significant (not tabulated). For rights offerings, the change in venture fund ownership is
negative and statistically significant, whereas the change in pension fund ownership is
statistically insignificant. Untabulated tests show that there is no significant difference
between private placements and rights offerings for either venture capital ownership or
pension fund ownership, which seems to be inconsistent with the monitoring hypothesis that
private placements are motivated by a demand for monitoring.
- 170 -
5. Additional tests
5.1 Uninsured vs. underwritten rights offerings
Firms issuing equity publicly can choose between an uninsured rights offering and the more
expensive underwritten rights offers, such as standby rights and firm-commitment offers24
.
The adverse selection model by Eckbo and Masulis (1992) suggests that firms should employ
lower-cost flotation methods, such as pure (uninsured rights), when managers believe the
expected take-up (k) by existing shareholders will be high. With intermediate expected levels
of k, firms should use standby rights, whereas firms should employ firm-commitment
underwritten offers with lower expected levels of k. Firm-commitment underwritten offers
have not yet spread outside the US—with the exception of Japan and France (Eckbo, 2008).
Consistent with this prediction, the actual shareholder take-up is higher for uninsured rights
offerings than for standby rights offerings (mean and median values of take-up are displayed
in Appendix.
Following Cronqvist and Nilsson (2005), I employ a nested logit model (McFadden, 1978,
1981) to examine the second-level decision between uninsured vs. standby rights offerings.
The proxies for information asymmetry, except for the bid-ask spread and firm size, are
statistically insignificant in all models (untabulated). Although the results indicate that larger
firms are more likely to use standbys than smaller firms, an alternative explanation may be
that underwriters do not take on standbys (and are even less likely to take on firm-
commitment offers) from small firms with illiquid stocks because of the financial and
reputational risk of being unable to sell the shares to the market; this observation might
indicate that there are determinants in addition to information asymmetry that impact the
choice between uninsured and standby rights offers.
5.2 Subscription pre-commitments
High-k issuers selecting uninsured rights have an incentive to inform the market about their
private information regarding subscription pre-commitments from large shareholders for
several reasons. First, the value of any underpricing is captured mainly by existing
shareholders (minimizing wealth transfers from current to new investors). Second,
24
The underwriter is generally paid an underwriting fee for its commitment (to compensate for the risk of
subscribing for shares that are not taken up by shareholders) and is frequently also paid an amount per share for
each unsubscribed share purchased in connection with the rights issuance. The underwriting fee in an
underwritten rights offering typically ranges from 2 to 6 percent of the total proceeds. In comparison, direct
issuance costs associated with an uninsured rights offering are generally 1 percent to 2 percent of total proceeds.
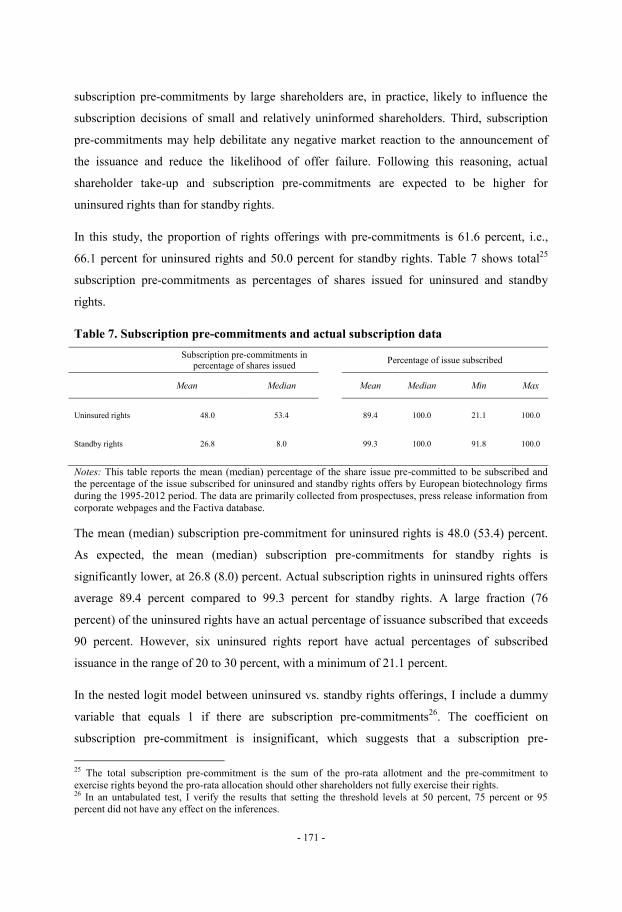
- 171 -
subscription pre-commitments by large shareholders are, in practice, likely to influence the
subscription decisions of small and relatively uninformed shareholders. Third, subscription
pre-commitments may help debilitate any negative market reaction to the announcement of
the issuance and reduce the likelihood of offer failure. Following this reasoning, actual
shareholder take-up and subscription pre-commitments are expected to be higher for
uninsured rights than for standby rights.
In this study, the proportion of rights offerings with pre-commitments is 61.6 percent, i.e.,
66.1 percent for uninsured rights and 50.0 percent for standby rights. Table 7 shows total25
subscription pre-commitments as percentages of shares issued for uninsured and standby
rights.
Table 7. Subscription pre-commitments and actual subscription data
Subscription pre-commitments in
percentage of shares issued
Percentage of issue subscribed
Mean Median
Mean Median Min Max
Uninsured rights 48.0 53.4 89.4 100.0 21.1 100.0
Standby rights 26.8 8.0 99.3 100.0 91.8 100.0
Notes: This table reports the mean (median) percentage of the share issue pre-committed to be subscribed and
the percentage of the issue subscribed for uninsured and standby rights offers by European biotechnology firms
during the 1995-2012 period. The data are primarily collected from prospectuses, press release information from
corporate webpages and the Factiva database.
The mean (median) subscription pre-commitment for uninsured rights is 48.0 (53.4) percent.
As expected, the mean (median) subscription pre-commitments for standby rights is
significantly lower, at 26.8 (8.0) percent. Actual subscription rights in uninsured rights offers
average 89.4 percent compared to 99.3 percent for standby rights. A large fraction (76
percent) of the uninsured rights have an actual percentage of issuance subscribed that exceeds
90 percent. However, six uninsured rights report have actual percentages of subscribed
issuance in the range of 20 to 30 percent, with a minimum of 21.1 percent.
In the nested logit model between uninsured vs. standby rights offerings, I include a dummy
variable that equals 1 if there are subscription pre-commitments26
. The coefficient on
subscription pre-commitment is insignificant, which suggests that a subscription pre-
25
The total subscription pre-commitment is the sum of the pro-rata allotment and the pre-commitment to
exercise rights beyond the pro-rata allocation should other shareholders not fully exercise their rights. 26
In an untabulated test, I verify the results that setting the threshold levels at 50 percent, 75 percent or 95
percent did not have any effect on the inferences.
- 172 -
commitment is not an important determinant between the choice of an uninsured and a
standby rights offering.
5.3 Stock market response to rights offerings and private placements
Similar to Cronqvist and Nilsson (2004), I examine whether the stock market reactions to the
announcement of rights offerings and private placements are consistent with the findings
previously reported. Stock market reactions provide important information about whether
there are adverse selection costs. According to the shareholder take-up model from Eckbo and
Masulis (1992), the market reaction to SEOs should be most negative for firm commitment
offerings (where the potential for wealth transfer is greatest) and least negative (or zero) for
pure rights, with standby rights in between. Several studies (e.g., Korajczyk et al., 1990;
Lucas and McDonald, 1990, Choe et al., 1992; Eckbo and Masulis, 1992) report negative
stock market reactions to standbys and firm-commitment offers. The negative stock market
reaction is consistent with the view that outside investors are hedging to compensate for their
informational disadvantage because those SEOs that tend to be issued are likely to be
overpriced (and thus the term “adverse selection”). The positive stock market reaction to
private placements, which may be viewed as a means of reducing adverse selection costs, may
be motivated by two alternative explanations. First, finding a private placement investor
willing to invest requires a favorable review of the issuing firms’ future prospects.
Consequently, successful private placements can be viewed as the outcome of a positive
selection process, which is consistent with positive stock market reactions at the
announcement of private placements (Eckbo, 2008). Second, a positive stock market reaction
to private placements may reflect the market’s belief that the new blockholder will play a
positive role in monitoring management (Wruck, 1989).
I use the event-study methodology (e.g., Brown and Warner, 1985; Campbell et al., 1997) to
document the stock-price reaction to announcements of rights offerings and private
placements. The market model27
is used to estimate predicted returns. The estimation period
includes day -250 through -30, with day 0 being the public announcement of the equity issue.
27
For robustness reasons, I also employ two additional models: 1) the Fama-French three factor model and 2) a
two-factor model, in which the first factor is the market index (MSCI Europe) and the second factor is an
industry index (STOXX Europe 600 Healthcare). Sharpe et al. (1999) suggest using a second factor when the
sample is comprised of rims in a single industry in order to explain more of the variation in the normal return.
All models yield similar results.
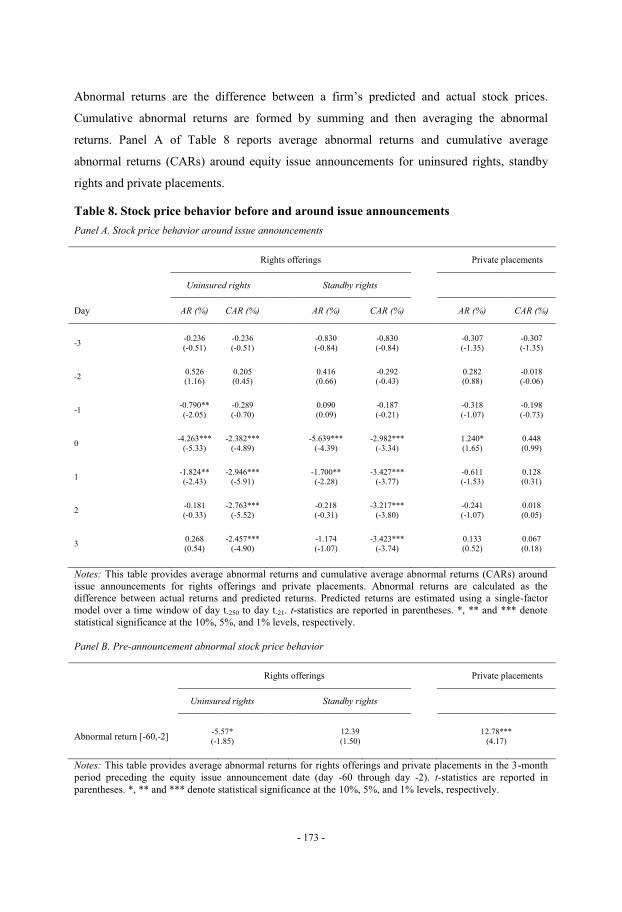
- 173 -
Abnormal returns are the difference between a firm’s predicted and actual stock prices.
Cumulative abnormal returns are formed by summing and then averaging the abnormal
returns. Panel A of Table 8 reports average abnormal returns and cumulative average
abnormal returns (CARs) around equity issue announcements for uninsured rights, standby
rights and private placements.
Table 8. Stock price behavior before and around issue announcements
Panel A. Stock price behavior around issue announcements
Rights offerings Private placements
Uninsured rights Standby rights
Day AR (%) CAR (%) AR (%) CAR (%) AR (%) CAR (%)
-3 -0.236
(-0.51)
-0.236
(-0.51)
-0.830
(-0.84)
-0.830
(-0.84)
-0.307
(-1.35)
-0.307
(-1.35)
-2 0.526 (1.16)
0.205 (0.45)
0.416 (0.66)
-0.292 (-0.43)
0.282 (0.88)
-0.018 (-0.06)
-1 -0.790**
(-2.05)
-0.289
(-0.70)
0.090
(0.09)
-0.187
(-0.21)
-0.318
(-1.07)
-0.198
(-0.73)
0 -4.263***
(-5.33)
-2.382***
(-4.89)
-5.639***
(-4.39)
-2.982***
(-3.34)
1.240*
(1.65)
0.448
(0.99)
1 -1.824** (-2.43)
-2.946*** (-5.91)
-1.700** (-2.28)
-3.427*** (-3.77)
-0.611 (-1.53)
0.128 (0.31)
2 -0.181
(-0.33)
-2.763***
(-5.52)
-0.218
(-0.31)
-3.217***
(-3.80)
-0.241
(-1.07)
0.018
(0.05)
3 0.268
(0.54)
-2.457***
(-4.90)
-1.174
(-1.07)
-3.423***
(-3.74)
0.133
(0.52)
0.067
(0.18)
Notes: This table provides average abnormal returns and cumulative average abnormal returns (CARs) around
issue announcements for rights offerings and private placements. Abnormal returns are calculated as the
difference between actual returns and predicted returns. Predicted returns are estimated using a single-factor
model over a time window of day t-250 to day t-21. t-statistics are reported in parentheses. *, ** and *** denote
statistical significance at the 10%, 5%, and 1% levels, respectively.
Panel B. Pre-announcement abnormal stock price behavior
Rights offerings Private placements
Uninsured rights Standby rights
Abnormal return [-60,-2] -5.57*
(-1.85)
12.39
(1.50)
12.78***
(4.17)
Notes: This table provides average abnormal returns for rights offerings and private placements in the 3-month
period preceding the equity issue announcement date (day -60 through day -2). t-statistics are reported in
parentheses. *, ** and *** denote statistical significance at the 10%, 5%, and 1% levels, respectively.
- 174 -
The mean abnormal return on the day of the equity issuance announcement for pure
(uninsured) rights is -4.3 percent (t-statistic = -5.33) and the three-day (+1, -1) cumulative
average abnormal return is -2.9 percent (t-statistic -5.91). In comparison, the average day-zero
market reaction to standbys is -5.6 percent (t-statistic = -4.39). This is consistent with prior
studies that document negative reactions to rights offerings (e.g., Eckbo and Masulis, 1992;
Eckbo, 2008). The negative stock market reaction to pure and standby rights offerings is
consistent with the existence of adverse selection costs, and shareholder take-up by existing
shareholders is less than one (k < 1). Contrary to rights offerings, the stock market reaction to
private placements on the day of announcement is positive and statistically significant at the
10 percent level (1.24 percent, t-statistic 1.65). This is consistent with several prior studies
(e.g., Wruck, 1989; Hertzel and Smith, 1993; Janney and Folta, 2003). For example, Janney
and Folta (2003) document CARs over a three-day period (-1, +1) of 2.65 percent for a
sample of US biotechnology firms between 1973 and 1998.28
To provide additional context to the stock market reactions to rights offerings and private
placements, I examine the average abnormal stock price run-up over the three months before
the announcement date for uninsured rights, standbys and private placements (see Panel B of
Table 8). Consistent with the adverse selection hypothesis, standbys are associated with a
positive stock market run-up of 12.4 percent prior to the announcement, but are not
statistically significant (t-statistic = 1.50). This is consistent with the view that adverse
selection problems arise when undervalued firms with low expected shareholder take-up do
not issue equity, whereas issuing firms that go ahead with standby rights tend to be
overvalued, on average. Because the probability of being overvalued is greater following a
period of a stock price run-up, it is reasonable to expect that the sample of standbys will have
a positive stock price run-up. By contrast, there is evidence of basically no stock price run-up
before uninsured rights offers (-5.6 percent, t-statistic = -1.85).
In summary, the results from these additional tests indicate that the stock market reacts
negatively to the disclosure of uninsured standby rights, according to the predictions. The
28
Although private placements are frequently employed in the biotechnology industry, and although the stock
market reacts positively to announcements of such placements, the disclosure of investor identity tends to be a
strategic decision by managers. For example, issuing firms only report the investor identity in less than one-third
of the 226 private placements in this study, a variable that may convey important information to potential
investors. This figure is significantly lower than the one found in the study by Janney and Folta (2003), who
report that approximately 50 percent of private placements convey information about investor identity. An
untabulated mean-comparison test shows that CARs to firms that disclose investor identity in private placements
is 1.7 percent higher (1.18 percent vs. -0.52 percent) than CARs to private placement firms that do not disclose
investor identity.
- 175 -
positive stock market reaction to private placements may be driven by a favorable review of
the issuing firms’ future prospects rather than by the belief that the new blockholder will play
a positive role in monitoring management.
6. Conclusions
This paper examines the impact of of information asymmetry and monitoring on the choice of
equity-selling mechanisms. The empirical study is based on 86 rights offerings and 226
private placements made by all publicly listed European biotechnology firms during the 1995-
2012 period. The results provide evidence that information asymmetry is an important
determinant of the choice of equity-selling mechanisms, whereas no support is found for the
monitoring hypothesis.
The information asymmetry hypothesis suggests that rational corporate managers acting in the
interest of existing shareholders issue equity publicly rather than privately when information
asymmetry about firm value is low (Chemmanur and Fulghieri, 1999; Hertzel and Smith,
1993). The time-varying asymmetric information model by Korajczyk et al. (1991, 1992)
suggests that information asymmetry is not fixed over time and that equity issues occur
following credible information disclosures. This paper uses R&D disclosures as the main
proxy for measuring information asymmetry and finds evidence that there is a higher
probability that firms will issue equity publicly rather than privately following credible R&D
disclosures, i.e., when information asymmetry is low.
The monitoring hypothesis suggests that private placements are used when there is a demand
for monitoring because private placements are associated with more concentrated ownership
(e.g., Shleifer and Vishny, 1986). The results of the analysis in this study indicate that
monitoring is not an important determinant in the choice of equity-selling mechanisms. A
detailed analysis of investor identities shows that the mean (median) of venture capital
ownership decreases for both private placements and rights offerings and that there are no
differences in means (medians) between the two equity issuance methods. Although there is
an increase in pension fund ownership following private placements, the net effect of
monitoring agents is negative.
Although the adverse selection costs hypothesis provides a rational and clear prediction for
which issue method is preferred based on the expected take-up levels of existing shareholders,
- 176 -
the monitoring hypothesis is more problematic because managerial objectives may play a
role. Wu and Wang (2005) argue that private placements may be inferior to uninsured rights
as a flotation method in cases where entrenched managers want to avoid creating a monitoring
blockholder. Wu (2004) suggests that private placements may be preferred in cases where
managers find investors willing to align with managers (in return for an offer price discount).
Furthermore, Hertzel and Smith (1993) propose that the relative importance of private
placements for resolving information asymmetries about firm value versus monitoring
management may depend on firm size. Morck et al. (1988) propose that monitoring and
aligning managerial incentives may be relatively less important for small firms, which
constitute the majority of the firms in this study and which typically tend to have high
managerial ownership compared to large firms.
The biotechnology industry is, arguably, different from other industries in the sense that firms
typically operate with large negative free cash flows and have no other choice but to regularly
ask investors for (equity) financing for their research projects. In other words, the findings
lend support for studying the choice of equity-selling mechanisms based on the argument that
managers rationally go to public equity markets when there is a chance that investors will
better understand the firm’s prospects. This is consistent with the adverse selection model by
Eckbo and Masulis (1992), which suggests that firms will employ lower-cost flotation
methods when the level of asymmetric information about firm value is low, i.e., when the
expected level of take-up in the equity issuance is high.
Further research can investigate questions such as: How does the private/public equity choice
interact with alliance funding? What is the relationship between the future performance of a
project and the choice of equity-selling mechanisms? How are private placement investors
chosen and what type of investors are likely to participate in private placements?
Appendix. Estimation of expected shareholder take-up (k)
This section describes the three-step procedure to estimate shareholder take-up. In the first
step, actual take-up is calculated for all firms selecting a rights offering. The fraction of rights
traded is observable during the subscription period and assuming that each right is only traded
once, take-up is defined as one minus the fraction of rights traded in the rights offering. In the
second step, a linear regression model of actual shareholder take-up is employed using several
ex ante explanatory variables, including ownership concentration (blockholder), issue size,
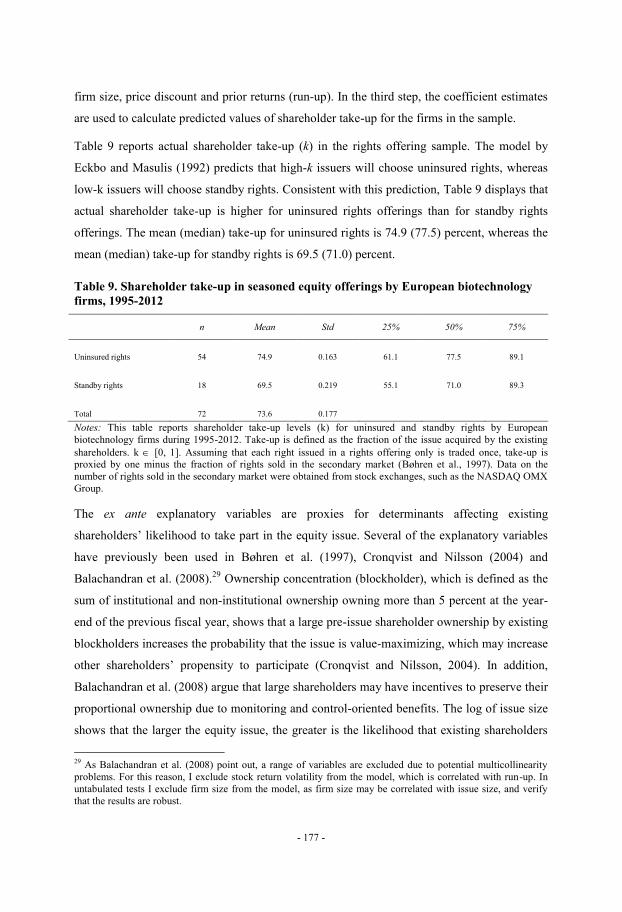
- 177 -
firm size, price discount and prior returns (run-up). In the third step, the coefficient estimates
are used to calculate predicted values of shareholder take-up for the firms in the sample.
Table 9 reports actual shareholder take-up (k) in the rights offering sample. The model by
Eckbo and Masulis (1992) predicts that high-k issuers will choose uninsured rights, whereas
low-k issuers will choose standby rights. Consistent with this prediction, Table 9 displays that
actual shareholder take-up is higher for uninsured rights offerings than for standby rights
offerings. The mean (median) take-up for uninsured rights is 74.9 (77.5) percent, whereas the
mean (median) take-up for standby rights is 69.5 (71.0) percent.
Table 9. Shareholder take-up in seasoned equity offerings by European biotechnology
firms, 1995-2012
n Mean Std 25% 50% 75%
Uninsured rights 54 74.9 0.163 61.1 77.5 89.1
Standby rights 18 69.5 0.219 55.1 71.0 89.3
Total 72 73.6 0.177
Notes: This table reports shareholder take-up levels (k) for uninsured and standby rights by European
biotechnology firms during 1995-2012. Take-up is defined as the fraction of the issue acquired by the existing
shareholders. k [0, 1]. Assuming that each right issued in a rights offering only is traded once, take-up is
proxied by one minus the fraction of rights sold in the secondary market (Bøhren et al., 1997). Data on the
number of rights sold in the secondary market were obtained from stock exchanges, such as the NASDAQ OMX
Group.
The ex ante explanatory variables are proxies for determinants affecting existing
shareholders’ likelihood to take part in the equity issue. Several of the explanatory variables
have previously been used in Bøhren et al. (1997), Cronqvist and Nilsson (2004) and
Balachandran et al. (2008).29
Ownership concentration (blockholder), which is defined as the
sum of institutional and non-institutional ownership owning more than 5 percent at the year-
end of the previous fiscal year, shows that a large pre-issue shareholder ownership by existing
blockholders increases the probability that the issue is value-maximizing, which may increase
other shareholders’ propensity to participate (Cronqvist and Nilsson, 2004). In addition,
Balachandran et al. (2008) argue that large shareholders may have incentives to preserve their
proportional ownership due to monitoring and control-oriented benefits. The log of issue size
shows that the larger the equity issue, the greater is the likelihood that existing shareholders
29
As Balachandran et al. (2008) point out, a range of variables are excluded due to potential multicollinearity
problems. For this reason, I exclude stock return volatility from the model, which is correlated with run-up. In
untabulated tests I exclude firm size from the model, as firm size may be correlated with issue size, and verify
that the results are robust.
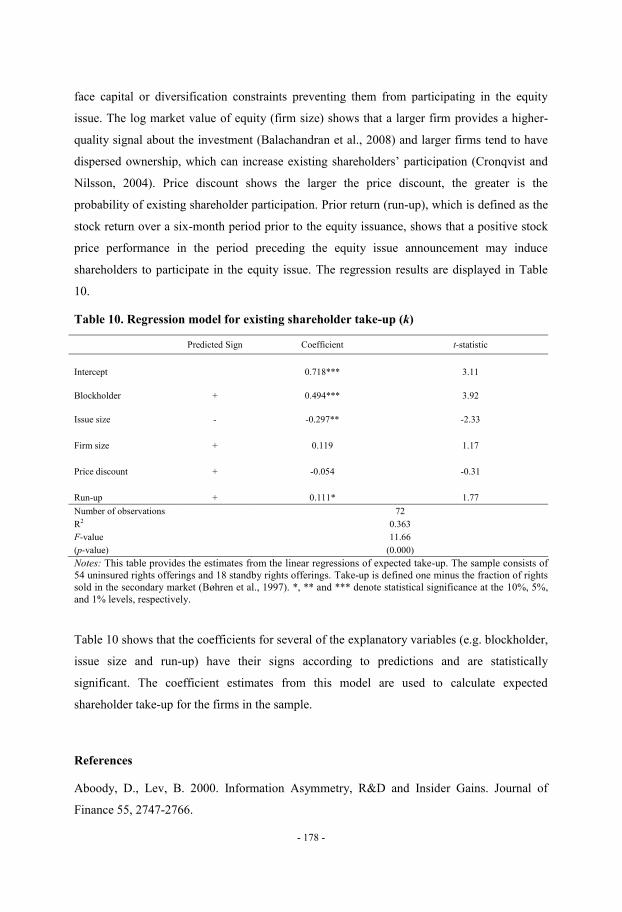
- 178 -
face capital or diversification constraints preventing them from participating in the equity
issue. The log market value of equity (firm size) shows that a larger firm provides a higher-
quality signal about the investment (Balachandran et al., 2008) and larger firms tend to have
dispersed ownership, which can increase existing shareholders’ participation (Cronqvist and
Nilsson, 2004). Price discount shows the larger the price discount, the greater is the
probability of existing shareholder participation. Prior return (run-up), which is defined as the
stock return over a six-month period prior to the equity issuance, shows that a positive stock
price performance in the period preceding the equity issue announcement may induce
shareholders to participate in the equity issue. The regression results are displayed in Table
10.
Table 10. Regression model for existing shareholder take-up (k)
Predicted Sign Coefficient t-statistic
Intercept 0.718*** 3.11
Blockholder + 0.494*** 3.92
Issue size - -0.297** -2.33
Firm size + 0.119 1.17
Price discount + -0.054 -0.31
Run-up + 0.111* 1.77
Number of observations 72
R2 0.363
F-value 11.66
(p-value) (0.000)
Notes: This table provides the estimates from the linear regressions of expected take-up. The sample consists of
54 uninsured rights offerings and 18 standby rights offerings. Take-up is defined one minus the fraction of rights
sold in the secondary market (Bøhren et al., 1997). *, ** and *** denote statistical significance at the 10%, 5%,
and 1% levels, respectively.
Table 10 shows that the coefficients for several of the explanatory variables (e.g. blockholder,
issue size and run-up) have their signs according to predictions and are statistically
significant. The coefficient estimates from this model are used to calculate expected
shareholder take-up for the firms in the sample.
References
Aboody, D., Lev, B. 2000. Information Asymmetry, R&D and Insider Gains. Journal of
Finance 55, 2747-2766.

- 179 -
Admati, A. R., Pleiderar, P., 1994. Robust financial contracting and the role of venture
capitalists. Journal of Finance 49, 371-402.
Ai, C., Norton, E. C., 2003. Interaction terms in logit and probit models. Economics Letters 80,
123-129.
Akerlof, G. A., 1970. The market for “lemons”: quality uncertainty and the market and
mechanism. The Quarterly Journal of Economics 84, 488-500.
Akerlof, G. A., 2002. Behavioral macroeconomics and macroeconomic behavior. American
Economic Review 92, 411-433.
Amir, E., Lev, B., 1996. Value-relevance of nonfinancial information: The wireless
communications industry. Journal of Accounting and Economics 22, 3-30.
Balachandran, B., Faff, R, Theobald, M., 2008. Rights offerings, takeup, renounceability, and
underwriting status. Journal of Financial Economics 89, 328-346.
Barclay, M. J., Holderness, C. G., Sheehan, D.P., 2007. Private placements and managerial
entrenchment. Journal of Corporate Finance 13, 461-484.
Bøhren, Ø., Eckbo, B. E., Michalsen, D., 1997. Why underwrite rights offerings? Some new
evidence. Journal of Financial Economics 46, 223–261.
Brown, S., Warner, J., 1985. Using daily stock returns: the case of event studies. Journal of
Financial Economics 14, 3-31.
Campbell, J., Lo, A., MacKinlay, A., 1997. The econometrics of financial markets. Princeton:
Princeton University Press.
Cerbioni, F., Parbonetti, A., 2007. Exploring the effects of corporate governance on intellectual
capital disclosure: an analysis of European biotechnology companies. European Accounting
Review 16, 791-826.
Chemmanur, T. J., 1993. The pricing of initial public offerings: a dynamic model with
information production. Journal of Finance 48, 285-304.
Chemmanur, T. J., Fulghieri, P., 1999. A theory of the going-public decision. Review of
Financial Studies 12, 249-279.

- 180 -
Chen, H-C, Dai, N., Schatzberg, J. D., 2010. The choice of equity selling mechanisms: PIPEs
versus SEOs. Journal of Corporate Finance 16, 104-119.
Choe, H., Masulis, R., Nanda, V., 1993. Common stock offerings across the business cycle:
Theory and evidence. Journal of Empirical Finance 1, 3-31.
Cooper, D. W., Grinder, B., 1996. Voluntary information disclosure during periods of stock
price vulnerability. Journal of Business Finance and Accounting 23, 461-472.
Cronqvist, H, Nilsson, M., 2004. The choice between rights offerings and private equity
placements. Journal of Financial Economics 78, 375-407.
Dedman, E., Lin, S. W-J., Prakash, A., Chang, C-H., 2008. Voluntary disclosure and its impact
on share prices: Evidence from the UK biotechnology sector. Journal of Accounting and Public
Policy 27, 195-216.
Denis, D. J., Sarin, A., 2001. Is the market surprised by poor earnings realizations following
seasoned equity offerings. Journal of Financial and Quantitative Analysis 30, 169-193.
Diamond, D., Verrecchia, R., 1991. Disclosure, liquidity, and the cost of capital. Journal of
Finance 46, 1325-1359.
Dittmar, A., Thakor, A., 2007. Why do firms issue equity? Journal of Finance 62, 1-54.
Eckbo, B. E., Masulis, R. W., 1992. Adverse selection and the rights offer paradox. Journal of
Financial Economics 32, 293-332.
Eckbo, B. E, 2008. Equity issues and the disappearing rights offer phenomenon. Journal of
Applied Corporate Finance 20, 72-85.
French, K., Roll, R., 1986. Stock return variances: the arrival of information and the reaction of
traders. Journal of Financial Economics 17, 5-26.
Gilson, S., John, K., Lang, L. H. P., 1990. Troubled debt restructuring: an empirical study of
private reorganization of firms in default. Journal of Financial Economics 27, 315-353.
Glosten, L. R., Milgrom, P. R., 1985. Bid, ask and transaction prices in a specialist market with
heterogeneously informed traders. Journal of Financial Economics 14, 71-100.

- 181 -
Gomes, A., Phillips, G., 2012. Why do public firms issue private and public securities? Journal
of Financial Intermediation 21, 619-658.
Hall, B. H., 2002. The financing of research and development. Oxford Review of Economic
Policy 18, 35-51.
Hall, B. H., Lerner, J., 2009. The financing of R&D and innovation. NBER Working paper no.
w15325, 1-55.
Harris, L. E., 1994. Minimum price variations, discrete bid-ask spreads, and quotation sizes.
Review of Financial Studies 7, 149-178.
Heinkel, R., Schwartz, E. S., 1986. Rights vs. underwritten offers: An asymmetric information
approach. Journal of Finance 41, 1-18.
Hertzel, M. G., Smith, R. L., 1993. Market discounts and shareholder gains for placing equity
privately. Journal of Finance 48, 459-485.
Himmelberg, C. P., Petersen, B. C., 1994. R&D and internal finance: a panel study of small
firms in high-tech industries. Review of Economics and Statistics 76, 38-51.
James, C., Wier, P., 1990. Borrowing relationships, intermediation, and the cost of issuing
public securities. Journal of Financial Economics 28, 149-171.
Kahn, C., Winton, A., 1998. Ownership structure, speculation, and shareholder intervention.
Journal of Finance 53, 99-129.
Korajczyk, R. A., Lucas, D. J., McDonald, R. L., 1991. The effect of information releases on
the pricing and timing of equity issues. The Review of Financial Studies 4, 685-708.
Korajczyk, R. A., Lucas, D. J., McDonald, R. L., 1992. Equity issues with time-varying
asymmetric information. Journal of Financial and Quantitative Analysis 27, 397-417.
Krishnaswami, S, Spindt, P. A., Subramaniam, V., 1999. Information asymmetry, monitoring,
and the placement structure of corporate debt 51, 407-434.
La Porta, R., Lopez-de-Silanes, F., Shleifer, A., Vishny, R. W., 1998. Law and Finance.
Journal of Political Economy 106, 1113-1155.

- 182 -
Lang, M. H., Lundholm, R. J., 2000. Voluntary disclosure and equity offerings: Reducing
information asymmetry of hyping the stock? Contemporary Accounting Research 17, 623-662.
Lel, U., Miller, P. D., 2008. International cross-listing, firm performance and top management
turnover: A test of the bonding hypothesis. Journal of Finance 63, 1897-1937.
Lerner, J., 1994. Venture capitalists and the decision to go public. Journal of Financial
Economics 35, 293-316.
Lerner, J., Shane, H., Tsai, A., 2003. Do equity financing cycles matter? Evidence from
biotechnology alliances. Journal of Financial Economics 67, 411-446.
Lin, Y-M., You, S-J., Lin, F-J., 2008. The effects of pre-issue information releases on seasoned
equity offerings. Journal of Business Finance & Accounting 35, 1138-1163.
Loderer, C. F., Mauer, D. C., 1992. Corporate dividends and seasoned equity issues: An
empirical investigation. Journal of Finance 47, 201-225.
Loderer, C., Zimmerman, H., 1988. Stock offerings in a different institutional setting: The
Swiss case. Journal of Banking and Finance 12, 353-378.
Mackie-Mason, J. K., 1990. Do firms care who provides their financing? Working Paper no.
3039. National Bureau of Economic Research.
McConomy, B., Xu, B., 2004. Value creation in the biotechnology industry. CMA
Management, 29-31.
McFadden, D., 1978. Modeling the choice of residential location. In: Karlqvist, A., Lundqvist,
L., Snickars, F., Weibull, J. (Eds.), Spatial Interaction Theory and Planning Models. North-
Holland, Amsterdam, pp. 75-96.
McFadden, D., 1981. Econometric models of probabilistic choice. In: McFAdden, D., Manski,
C. (Eds.), Structural Analysis of Discrete Data with Econometric Applications. MIT Press.
Cambridge, MA, pp. 198-272.
Mitchell, H., 1983. Ownership, control and social policy. Research in Corporate Social
Performance Policy 5, 205-230.
Morck, R., Shleifer, A., Vishny, R., 1988. Management ownership and market valuation: An
empirical analysis. Journal of Financial Economics 20, 293-315.

- 183 -
Myers, S. C., Majluf, N. S., 1984. Corporate financing and investment decisions when firms
have information that investors do not have. Journal of Financial Economics 13, 187-221.
Norton, E. C., Wang, H, Ai, C., 2004. Computing interaction effects and standard errors in
logit and probit models. The Stata Journal 4, 154-167.
Powers, E., 2005. Interpreting logit regressions with interaction terms: An application to the
management turnover literature. Journal of Corporate Finance 11, 504-522.
Sahlman, W. A., 1990. The structure and governance of venture-capital organizations. Journal
of Financial Economics 27, 473-521.
Sharpe, W. F., Alexander, G., Bailey, J.V., 1999. Investments. Prentice-Hall, Upper Saddle
River, NJ.
Shleifer, A., Vishny, R. W., 1986. Large shareholders and corporate control. Journal of
Political Economy 94, 461-488.
Smith, C. W. Jr., 1977. Alternative methods for raising capital: Rights vs. underwritten offers.
Journal of Financial Economics 5, 273-307.
Vermaelen, T, 1981. Common stock repurchases and market signaling: An empirical study.
Journal of Financial Economics 9, 139-183.
Wruck, H. K., 1989. Equity ownership concentration and firm value: evidence from private
equity financings. Journal of Financial Economics 23, 3-28.
Wu, Y., 2004. The choice of equity-selling mechanisms. Journal of Financial Economics 74,
93-119.
Wu, X., Wang, Z., 2005. Seasoned equity issues and ownership concentration in a closely held
market: An alignment effect test free from the unobserved firm heterogeneity problem.
Working paper.


IV

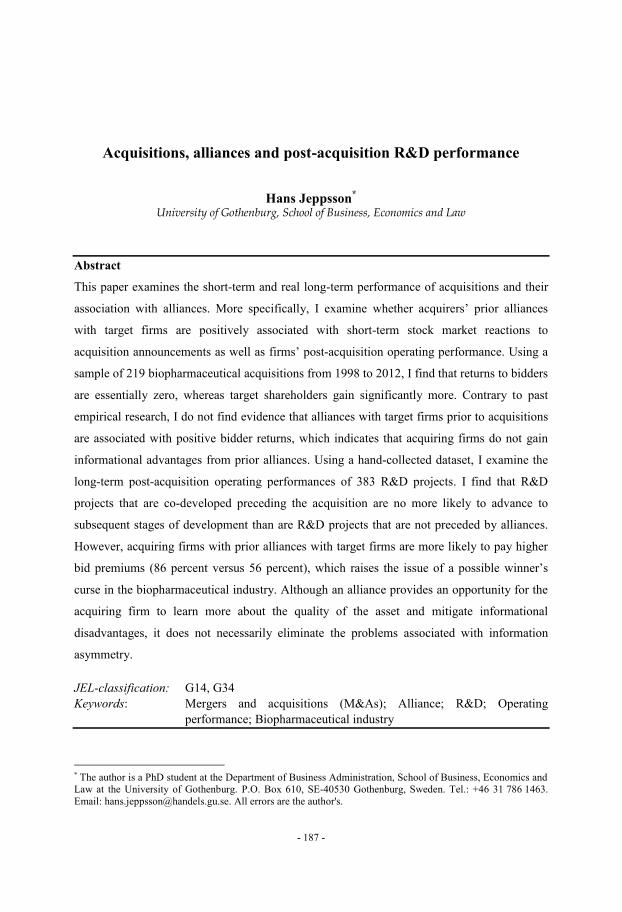
- 187 -
Acquisitions, alliances and post-acquisition R&D performance
Hans Jeppsson*
University of Gothenburg, School of Business, Economics and Law
Abstract
This paper examines the short-term and real long-term performance of acquisitions and their
association with alliances. More specifically, I examine whether acquirers’ prior alliances
with target firms are positively associated with short-term stock market reactions to
acquisition announcements as well as firms’ post-acquisition operating performance. Using a
sample of 219 biopharmaceutical acquisitions from 1998 to 2012, I find that returns to bidders
are essentially zero, whereas target shareholders gain significantly more. Contrary to past
empirical research, I do not find evidence that alliances with target firms prior to acquisitions
are associated with positive bidder returns, which indicates that acquiring firms do not gain
informational advantages from prior alliances. Using a hand-collected dataset, I examine the
long-term post-acquisition operating performances of 383 R&D projects. I find that R&D
projects that are co-developed preceding the acquisition are no more likely to advance to
subsequent stages of development than are R&D projects that are not preceded by alliances.
However, acquiring firms with prior alliances with target firms are more likely to pay higher
bid premiums (86 percent versus 56 percent), which raises the issue of a possible winner’s
curse in the biopharmaceutical industry. Although an alliance provides an opportunity for the
acquiring firm to learn more about the quality of the asset and mitigate informational
disadvantages, it does not necessarily eliminate the problems associated with information
asymmetry.
JEL-classification: G14, G34
Keywords: Mergers and acquisitions (M&As); Alliance; R&D; Operating
performance; Biopharmaceutical industry
* The author is a PhD student at the Department of Business Administration, School of Business, Economics and
Law at the University of Gothenburg. P.O. Box 610, SE-40530 Gothenburg, Sweden. Tel.: +46 31 786 1463.
Email: [email protected]. All errors are the author's.
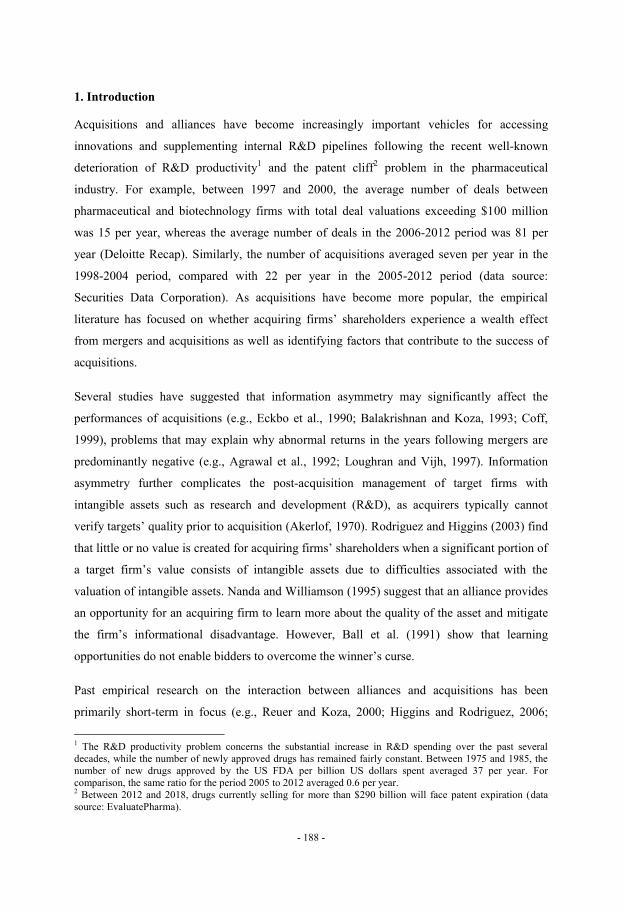
- 188 -
1. Introduction
Acquisitions and alliances have become increasingly important vehicles for accessing
innovations and supplementing internal R&D pipelines following the recent well-known
deterioration of R&D productivity1 and the patent cliff
2 problem in the pharmaceutical
industry. For example, between 1997 and 2000, the average number of deals between
pharmaceutical and biotechnology firms with total deal valuations exceeding $100 million
was 15 per year, whereas the average number of deals in the 2006-2012 period was 81 per
year (Deloitte Recap). Similarly, the number of acquisitions averaged seven per year in the
1998-2004 period, compared with 22 per year in the 2005-2012 period (data source:
Securities Data Corporation). As acquisitions have become more popular, the empirical
literature has focused on whether acquiring firms’ shareholders experience a wealth effect
from mergers and acquisitions as well as identifying factors that contribute to the success of
acquisitions.
Several studies have suggested that information asymmetry may significantly affect the
performances of acquisitions (e.g., Eckbo et al., 1990; Balakrishnan and Koza, 1993; Coff,
1999), problems that may explain why abnormal returns in the years following mergers are
predominantly negative (e.g., Agrawal et al., 1992; Loughran and Vijh, 1997). Information
asymmetry further complicates the post-acquisition management of target firms with
intangible assets such as research and development (R&D), as acquirers typically cannot
verify targets’ quality prior to acquisition (Akerlof, 1970). Rodriguez and Higgins (2003) find
that little or no value is created for acquiring firms’ shareholders when a significant portion of
a target firm’s value consists of intangible assets due to difficulties associated with the
valuation of intangible assets. Nanda and Williamson (1995) suggest that an alliance provides
an opportunity for an acquiring firm to learn more about the quality of the asset and mitigate
the firm’s informational disadvantage. However, Ball et al. (1991) show that learning
opportunities do not enable bidders to overcome the winner’s curse.
Past empirical research on the interaction between alliances and acquisitions has been
primarily short-term in focus (e.g., Reuer and Koza, 2000; Higgins and Rodriguez, 2006;
1 The R&D productivity problem concerns the substantial increase in R&D spending over the past several
decades, while the number of newly approved drugs has remained fairly constant. Between 1975 and 1985, the
number of new drugs approved by the US FDA per billion US dollars spent averaged 37 per year. For
comparison, the same ratio for the period 2005 to 2012 averaged 0.6 per year. 2 Between 2012 and 2018, drugs currently selling for more than $290 billion will face patent expiration (data
source: EvaluatePharma).
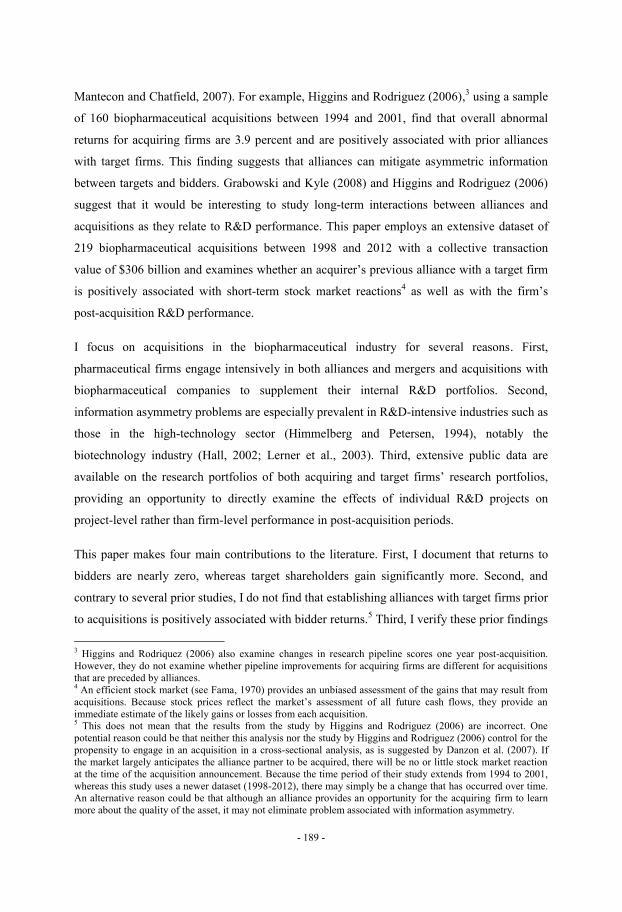
- 189 -
Mantecon and Chatfield, 2007). For example, Higgins and Rodriguez (2006),3 using a sample
of 160 biopharmaceutical acquisitions between 1994 and 2001, find that overall abnormal
returns for acquiring firms are 3.9 percent and are positively associated with prior alliances
with target firms. This finding suggests that alliances can mitigate asymmetric information
between targets and bidders. Grabowski and Kyle (2008) and Higgins and Rodriguez (2006)
suggest that it would be interesting to study long-term interactions between alliances and
acquisitions as they relate to R&D performance. This paper employs an extensive dataset of
219 biopharmaceutical acquisitions between 1998 and 2012 with a collective transaction
value of $306 billion and examines whether an acquirer’s previous alliance with a target firm
is positively associated with short-term stock market reactions4 as well as with the firm’s
post-acquisition R&D performance.
I focus on acquisitions in the biopharmaceutical industry for several reasons. First,
pharmaceutical firms engage intensively in both alliances and mergers and acquisitions with
biopharmaceutical companies to supplement their internal R&D portfolios. Second,
information asymmetry problems are especially prevalent in R&D-intensive industries such as
those in the high-technology sector (Himmelberg and Petersen, 1994), notably the
biotechnology industry (Hall, 2002; Lerner et al., 2003). Third, extensive public data are
available on the research portfolios of both acquiring and target firms’ research portfolios,
providing an opportunity to directly examine the effects of individual R&D projects on
project-level rather than firm-level performance in post-acquisition periods.
This paper makes four main contributions to the literature. First, I document that returns to
bidders are nearly zero, whereas target shareholders gain significantly more. Second, and
contrary to several prior studies, I do not find that establishing alliances with target firms prior
to acquisitions is positively associated with bidder returns.5 Third, I verify these prior findings
3 Higgins and Rodriquez (2006) also examine changes in research pipeline scores one year post-acquisition.
However, they do not examine whether pipeline improvements for acquiring firms are different for acquisitions
that are preceded by alliances. 4 An efficient stock market (see Fama, 1970) provides an unbiased assessment of the gains that may result from
acquisitions. Because stock prices reflect the market’s assessment of all future cash flows, they provide an
immediate estimate of the likely gains or losses from each acquisition. 5 This does not mean that the results from the study by Higgins and Rodriguez (2006) are incorrect. One
potential reason could be that neither this analysis nor the study by Higgins and Rodriguez (2006) control for the
propensity to engage in an acquisition in a cross-sectional analysis, as is suggested by Danzon et al. (2007). If
the market largely anticipates the alliance partner to be acquired, there will be no or little stock market reaction
at the time of the acquisition announcement. Because the time period of their study extends from 1994 to 2001,
whereas this study uses a newer dataset (1998-2012), there may simply be a change that has occurred over time.
An alternative reason could be that although an alliance provides an opportunity for the acquiring firm to learn
more about the quality of the asset, it may not eliminate problem associated with information asymmetry.
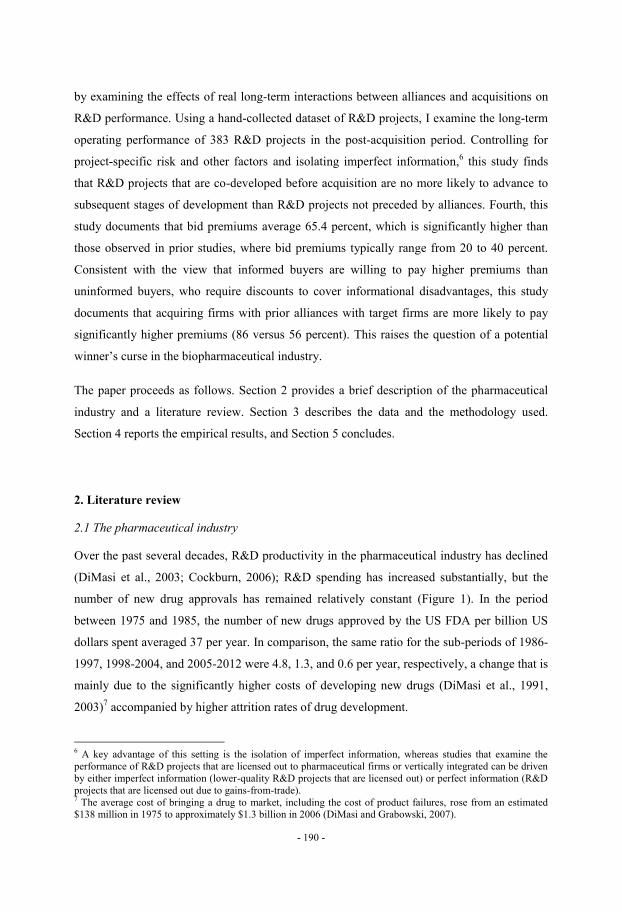
- 190 -
by examining the effects of real long-term interactions between alliances and acquisitions on
R&D performance. Using a hand-collected dataset of R&D projects, I examine the long-term
operating performance of 383 R&D projects in the post-acquisition period. Controlling for
project-specific risk and other factors and isolating imperfect information,6 this study finds
that R&D projects that are co-developed before acquisition are no more likely to advance to
subsequent stages of development than R&D projects not preceded by alliances. Fourth, this
study documents that bid premiums average 65.4 percent, which is significantly higher than
those observed in prior studies, where bid premiums typically range from 20 to 40 percent.
Consistent with the view that informed buyers are willing to pay higher premiums than
uninformed buyers, who require discounts to cover informational disadvantages, this study
documents that acquiring firms with prior alliances with target firms are more likely to pay
significantly higher premiums (86 versus 56 percent). This raises the question of a potential
winner’s curse in the biopharmaceutical industry.
The paper proceeds as follows. Section 2 provides a brief description of the pharmaceutical
industry and a literature review. Section 3 describes the data and the methodology used.
Section 4 reports the empirical results, and Section 5 concludes.
2. Literature review
2.1 The pharmaceutical industry
Over the past several decades, R&D productivity in the pharmaceutical industry has declined
(DiMasi et al., 2003; Cockburn, 2006); R&D spending has increased substantially, but the
number of new drug approvals has remained relatively constant (Figure 1). In the period
between 1975 and 1985, the number of new drugs approved by the US FDA per billion US
dollars spent averaged 37 per year. In comparison, the same ratio for the sub-periods of 1986-
1997, 1998-2004, and 2005-2012 were 4.8, 1.3, and 0.6 per year, respectively, a change that is
mainly due to the significantly higher costs of developing new drugs (DiMasi et al., 1991,
2003)7 accompanied by higher attrition rates of drug development.
6 A key advantage of this setting is the isolation of imperfect information, whereas studies that examine the
performance of R&D projects that are licensed out to pharmaceutical firms or vertically integrated can be driven
by either imperfect information (lower-quality R&D projects that are licensed out) or perfect information (R&D
projects that are licensed out due to gains-from-trade). 7 The average cost of bringing a drug to market, including the cost of product failures, rose from an estimated
$138 million in 1975 to approximately $1.3 billion in 2006 (DiMasi and Grabowski, 2007).
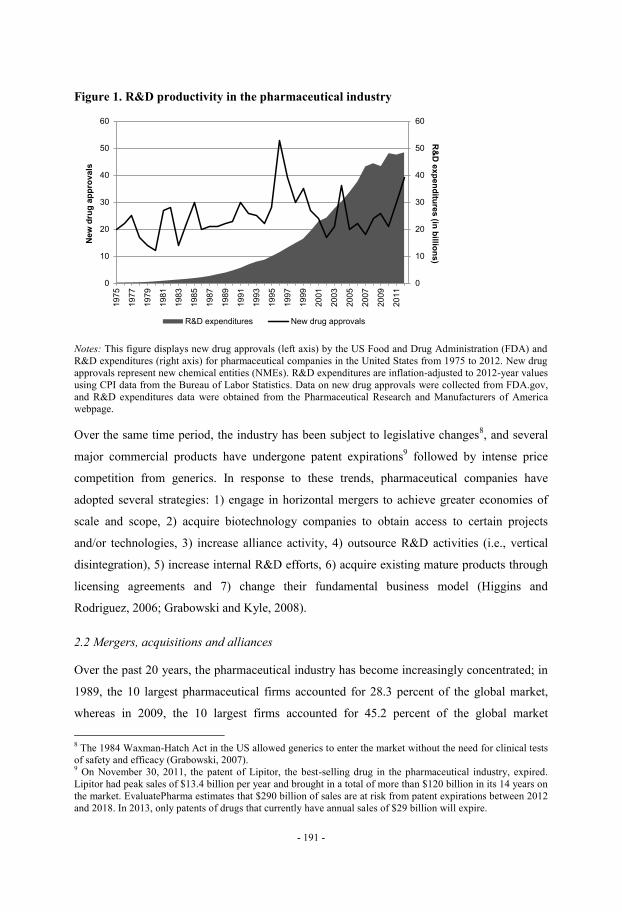
- 191 -
Figure 1. R&D productivity in the pharmaceutical industry
Notes: This figure displays new drug approvals (left axis) by the US Food and Drug Administration (FDA) and
R&D expenditures (right axis) for pharmaceutical companies in the United States from 1975 to 2012. New drug
approvals represent new chemical entities (NMEs). R&D expenditures are inflation-adjusted to 2012-year values
using CPI data from the Bureau of Labor Statistics. Data on new drug approvals were collected from FDA.gov,
and R&D expenditures data were obtained from the Pharmaceutical Research and Manufacturers of America
webpage.
Over the same time period, the industry has been subject to legislative changes8, and several
major commercial products have undergone patent expirations9 followed by intense price
competition from generics. In response to these trends, pharmaceutical companies have
adopted several strategies: 1) engage in horizontal mergers to achieve greater economies of
scale and scope, 2) acquire biotechnology companies to obtain access to certain projects
and/or technologies, 3) increase alliance activity, 4) outsource R&D activities (i.e., vertical
disintegration), 5) increase internal R&D efforts, 6) acquire existing mature products through
licensing agreements and 7) change their fundamental business model (Higgins and
Rodriguez, 2006; Grabowski and Kyle, 2008).
2.2 Mergers, acquisitions and alliances
Over the past 20 years, the pharmaceutical industry has become increasingly concentrated; in
1989, the 10 largest pharmaceutical firms accounted for 28.3 percent of the global market,
whereas in 2009, the 10 largest firms accounted for 45.2 percent of the global market
8 The 1984 Waxman-Hatch Act in the US allowed generics to enter the market without the need for clinical tests
of safety and efficacy (Grabowski, 2007). 9 On November 30, 2011, the patent of Lipitor, the best-selling drug in the pharmaceutical industry, expired.
Lipitor had peak sales of $13.4 billion per year and brought in a total of more than $120 billion in its 14 years on
the market. EvaluatePharma estimates that $290 billion of sales are at risk from patent expirations between 2012
and 2018. In 2013, only patents of drugs that currently have annual sales of $29 billion will expire.
0
10
20
30
40
50
60
0
10
20
30
40
50
601975
1977
1979
1981
1983
1985
1987
1989
1991
1993
1995
1997
1999
2001
2003
2005
2007
2009
2011
R&
D e
xp
en
ditu
res (in
billio
ns
)
New
dru
g a
pp
rov
als
R&D expenditures New drug approvals
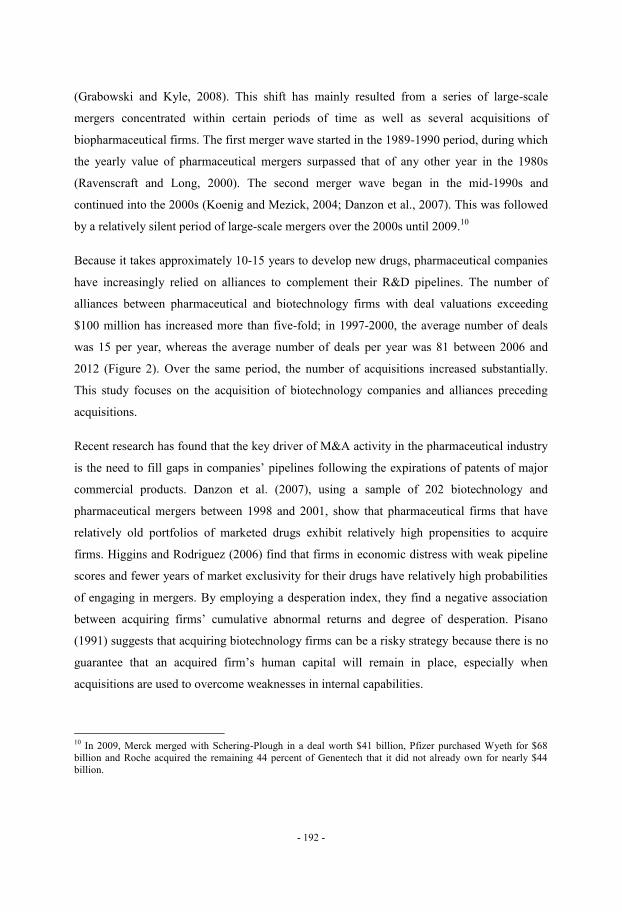
- 192 -
(Grabowski and Kyle, 2008). This shift has mainly resulted from a series of large-scale
mergers concentrated within certain periods of time as well as several acquisitions of
biopharmaceutical firms. The first merger wave started in the 1989-1990 period, during which
the yearly value of pharmaceutical mergers surpassed that of any other year in the 1980s
(Ravenscraft and Long, 2000). The second merger wave began in the mid-1990s and
continued into the 2000s (Koenig and Mezick, 2004; Danzon et al., 2007). This was followed
by a relatively silent period of large-scale mergers over the 2000s until 2009.10
Because it takes approximately 10-15 years to develop new drugs, pharmaceutical companies
have increasingly relied on alliances to complement their R&D pipelines. The number of
alliances between pharmaceutical and biotechnology firms with deal valuations exceeding
$100 million has increased more than five-fold; in 1997-2000, the average number of deals
was 15 per year, whereas the average number of deals per year was 81 between 2006 and
2012 (Figure 2). Over the same period, the number of acquisitions increased substantially.
This study focuses on the acquisition of biotechnology companies and alliances preceding
acquisitions.
Recent research has found that the key driver of M&A activity in the pharmaceutical industry
is the need to fill gaps in companies’ pipelines following the expirations of patents of major
commercial products. Danzon et al. (2007), using a sample of 202 biotechnology and
pharmaceutical mergers between 1998 and 2001, show that pharmaceutical firms that have
relatively old portfolios of marketed drugs exhibit relatively high propensities to acquire
firms. Higgins and Rodriguez (2006) find that firms in economic distress with weak pipeline
scores and fewer years of market exclusivity for their drugs have relatively high probabilities
of engaging in mergers. By employing a desperation index, they find a negative association
between acquiring firms’ cumulative abnormal returns and degree of desperation. Pisano
(1991) suggests that acquiring biotechnology firms can be a risky strategy because there is no
guarantee that an acquired firm’s human capital will remain in place, especially when
acquisitions are used to overcome weaknesses in internal capabilities.
10
In 2009, Merck merged with Schering-Plough in a deal worth $41 billion, Pfizer purchased Wyeth for $68
billion and Roche acquired the remaining 44 percent of Genentech that it did not already own for nearly $44
billion.
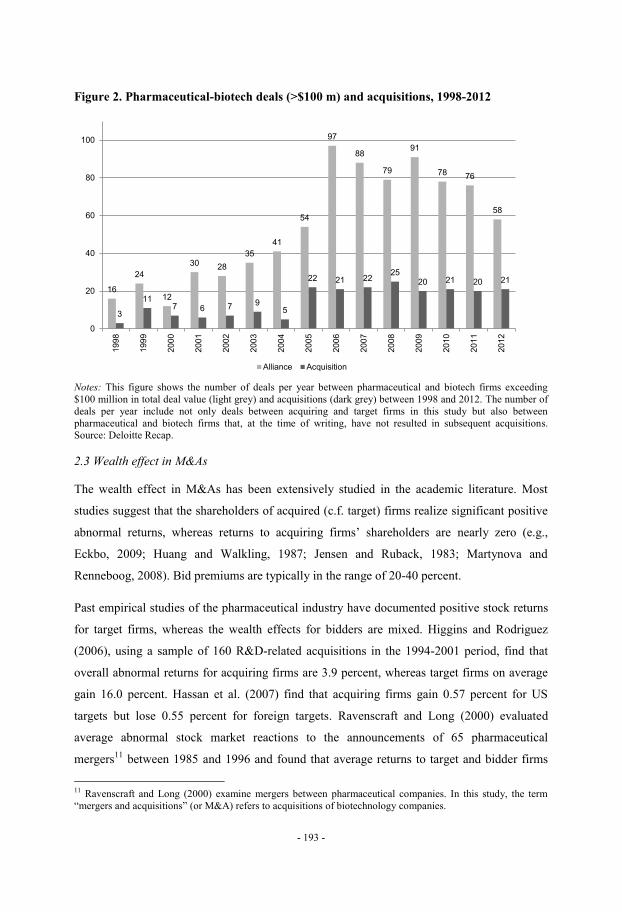
- 193 -
Figure 2. Pharmaceutical-biotech deals (>$100 m) and acquisitions, 1998-2012
Notes: This figure shows the number of deals per year between pharmaceutical and biotech firms exceeding
$100 million in total deal value (light grey) and acquisitions (dark grey) between 1998 and 2012. The number of
deals per year include not only deals between acquiring and target firms in this study but also between
pharmaceutical and biotech firms that, at the time of writing, have not resulted in subsequent acquisitions.
Source: Deloitte Recap.
2.3 Wealth effect in M&As
The wealth effect in M&As has been extensively studied in the academic literature. Most
studies suggest that the shareholders of acquired (c.f. target) firms realize significant positive
abnormal returns, whereas returns to acquiring firms’ shareholders are nearly zero (e.g.,
Eckbo, 2009; Huang and Walkling, 1987; Jensen and Ruback, 1983; Martynova and
Renneboog, 2008). Bid premiums are typically in the range of 20-40 percent.
Past empirical studies of the pharmaceutical industry have documented positive stock returns
for target firms, whereas the wealth effects for bidders are mixed. Higgins and Rodriguez
(2006), using a sample of 160 R&D-related acquisitions in the 1994-2001 period, find that
overall abnormal returns for acquiring firms are 3.9 percent, whereas target firms on average
gain 16.0 percent. Hassan et al. (2007) find that acquiring firms gain 0.57 percent for US
targets but lose 0.55 percent for foreign targets. Ravenscraft and Long (2000) evaluated
average abnormal stock market reactions to the announcements of 65 pharmaceutical
mergers11
between 1985 and 1996 and found that average returns to target and bidder firms
11
Ravenscraft and Long (2000) examine mergers between pharmaceutical companies. In this study, the term
“mergers and acquisitions” (or M&A) refers to acquisitions of biotechnology companies.
16
24
12
30 28
35
41
54
97
88
79
91
78 76
58
3
11 7 6 7 9
5
22 21 22 25
20 21 20 21
0
20
40
60
80
100
1998
1999
2000
2001
2002
2003
2004
2005
2006
2007
2008
2009
2010
2011
2012
Alliance Acquisition
- 194 -
were 13.3 and -2.2 percent, respectively. Consequently, it remains unclear whether bidder
returns gain or lose upon announcements of acquisitions.
2.4. Information asymmetry and alliances
Because of the asymmetric distribution of information between the parties involved in
transactions, a corporate acquisition gives rise to adverse selection (Myers & Majluf, 1984).
Although corporate bidders have access to publicly available information and due diligence
information about target companies, they have only imperfect information about a target
company’s future cash flow contribution and the prospects of a competing bid. Information
asymmetry problems are more common in certain industries than in others and are especially
common in R&D-intensive industries such as the high-technology sector (Himmelberg and
Petersen, 1994) and the biotechnology industry12
(Lerner et al., 2003; Hall, 2002), owing to
large investments in intangible assets. Investments in intangible assets such as research and
development (R&D) create information asymmetries because corporate insiders (i.e.,
managers) can continuously observe changes on an individual-asset basis, whereas outsiders
obtain only highly aggregated information at discrete points in time when R&D information is
made public (Aboody and Lev, 2000). Rodriguez and Higgins (2003) find that, due to the
difficulties associated with the valuation of intangible assets, little or no value is created for
the acquiring firms’ shareholders when a significant portion of a target firm’s value consists
of intangible assets.
The acquisition literature has examined variables such prior alliances with target firms,
methods of payment, the use of contingent payments, toehold investments, acquisition
premiums, degree of relatedness between acquirers and targets and acquirers’ acquisition
experience as factors in acquisition performance (e.g., Mantecon, 2009; Reuer, 2005). An
alliance13
provides an opportunity for an acquiring firm to learn more about the quality of the
asset and mitigate its informational disadvantages (e.g., Nanda and Williamson, 1995).
Several studies (e.g., Mantecon and Chatfield, 2007; Reuer and Koza, 2000) suggest that
12
Given the considerable information asymmetry associated with R&D (Hall and Lerner, 2009), managers
generally know considerably more than outsiders do about the specification of products under development, their
likelihood of success, the results of product feasibility tests, and marketing prospects (Aboody and Lev, 2000).
Because R&D projects, such as new drugs under development, are unique to the developing firm, investors can
generally derive little or no information about a firm’s R&D projects by observing the R&D performances of
other drugs. 13
Alliances and joint ventures are used interchangeably in the finance and strategic literature. In a joint venture,
two companies invest funds and jointly operate assets in a new company that is jointly owned. A strategic
alliance is a legal agreement between two (or more) companies to share access to their technology or other
- 195 -
alliances can mitigate asymmetric information between targets and bidders. In addition, the
role of information-producing intermediaries has been studied in the finance literature. Leland
and Pyle (1977), for example, argue that “moral hazard problems can be alleviated if the firm
gathering the information becomes an intermediary, buying and holding assets on the basis of
its specialized information.” Empirical studies (e.g., Chan et al., 1997; Porrini, 2004; Higgins
and Rodriguez, 2006; Mantecon, 2009) also find that positive announcement periods and
abnormal returns to acquirers are positively associated with prior alliances with target firms.
However, Ball et al. (1991) show that learning opportunities do not enable bidders to avoid
the winner’s curse. Pisano (1997) finds that biotech firms exploit their informational
advantage regarding the quality of their drug candidates by licensing to pharmaceutical firms
candidates that have relatively poor prospects. Mantecon (2009) verifies the importance of the
use of alliances in cross-border acquisitions, but the small fraction of alliances preceding
acquisitions suggests that preferences for control outweigh gains derived from information
exchanges in alliances made prior to acquisitions.14
Therefore, the question of whether prior
alliances can mitigate information asymmetries in acquisitions remains unanswered.
Consequently, I hypothesize that:
H1: Cumulative abnormal returns of acquiring firms are positively associated with prior
alliances with target firms.
2.5. Post-acquisition performance
A key challenge in analyzing mergers and acquisitions is to find appropriate measures of
transaction success in addition to the commonly used cumulative abnormal returns. While
most empirical research on mergers and acquisitions focuses on short-term stock returns
surrounding announcement dates, some studies have examined the long-term performance of
acquiring firms after mergers and acquisitions by measuring a stock’s abnormal performance
or examining changes in operating performance using accounting data from the post-merger
period. Most empirical studies find predominantly negative post-merger performance in the
assets. Unlike a joint venture, a strategic alliance does not create a new company. This study exclusively focuses
on alliances. 14
In the study of Mantecon (2009), only 4.51% of cross-border acquisitions were jointly owned in joint-
ventures.
- 196 -
years following mergers.15
Agrawal et al. (1992) examine post-merger performance in a
sample of 937 US mergers, reporting significant negative abnormal returns of approximately
10 percent over the five-year post-merger period. Loughran and Vijh (1997) find significant
negative abnormal returns of 15.9 percent less than matching firms during the five-year period
after acquisition. Several studies suggest that the problems associated with information
asymmetry may significantly affect the likelihood and performance implications of
acquisitions (e.g., Eckbo et al., 1990; Balakrishnan and Koza, 1993; Coff, 1999). An
alternative to abnormal stock performance as a measure of long-term performance is adopted
by Healy et al. (1992), who use accounting data to study changes in post-acquisition operating
performance in a sample of 50 US mergers. They document significant improvements in asset
productivity of such firms relative to their respective industry averages, leading to higher
operating cash flow returns. However, accounting information may be a poor indicator of
transaction success for development-stage research-intensive target companies (Amir and
Lev, 1996). Large investments in R&D that are immediately expensed and less frequently
capitalized will have two major consequences.16
First, current performance measures are
excessively low (often negative), although one may expect that the more negative current
performance is, the more positive future performance is likely to be. Second, measures of
current resources and equity are excessively low because few investments are booked as
assets. Higgins and Rodriguez (2006) adopt an alternative approach to measuring operating
performance in a sample of biopharmaceutical companies by evaluating changes in research
pipelines and in the revenues17
of acquiring firms in the year following acquisition. They find
positive changes in acquiring firms’ score values and product sales figures in the year
following acquisitions. However, they do not examine whether pipeline improvements in
acquiring firms differ for acquisitions that are preceded by alliances. Grabowski and Kyle
15
This result led Jensen and Ruback (1983) to make the following comment: “These post-outcome negative
abnormal returns are unsettling because they are inconsistent with market efficiency and suggest that changes in
stock prices during takeovers overestimate the future efficiency gains from mergers.” 16
For these firms, accounting information will explain very little of the cross-sectional variation in stock price
(e.g., Amir and Lev, 1996; Ely et al., 2003). 17
Although revenues probably provide the best indicator of transaction success in the long term, a majority of
acquisitions in the biopharmaceutical industry involve development-stage companies with no currently approved
drugs. In this analysis, the lead R&D projects of 66 percent of companies considered were in the regulatory stage
or before. Because marketed drugs must go through an extensive review process by regulatory authorities, such
as the FDA, there is reason to believe that information asymmetries are less pronounced for drugs that have been
approved for marketing. For approved drugs, there are likely to be other determinants not necessarily attributable
to asymmetric information that are more important. Sanofi’s acquisition of Genzyme provides an illustrative
example. According to the SEC-filings (SC 14D9/ SC 14D9/A), there were major differences of opinion
regarding peak sales of the multiple sclerosis drug Lemtrada (although the drug was not yet approved). Genzyme
projected peak sales of $3.5 billion per year, while Sanofi projected about $700 million. The companies resolved
their difference by agreeing to contingent value rights (CVRs).
- 197 -
(2008) and Higgins and Rodriguez (2006) suggest that it would be interesting to study the
long-term effects on R&D performance of interactions between alliances and acquisitions.
Several prior studies have examined the effects of alliances on R&D and innovation, although
not within the context of mergers and acquisitions. Pisano (1997) examines the performances
of vertically integrated projects versus collaborative projects in the biopharmaceutical
industry, finding that collaborative projects have a higher failure rate than vertically integrated
projects and concluding that biotechnology firms are likely to exploit their informational
advantages and license out low-quality projects. In contrast, Nicholson et al. (2005) do not
find a “lemons” problem in what they call the market for know-how. They evaluate
productivity at each phase of the drug development process for 900 firms over the 1988-2000
period, finding that products developed in alliances are relatively likely to succeed, at least in
later stages of clinical development and especially when the licensee is a large firm. In the
context of mergers and acquisitions, if an alliance with a target firm provides an acquiring
firm with an informational advantage, i.e., mitigates information asymmetry, then R&D
projects co-developed prior to an acquisition should be more likely to advance than projects
not preceded by an alliance. Higgins and Rodriquez (2006) argue that it is likely that pre-
acquisition information-gathering activities lead to more successful post-acquisition
integration. To empirically test this prediction, I hypothesize the following:
H2: An acquirer’s previous alliance with a target correlates positively with post-acquisition
R&D performance.
3. Data and methodology
3.1 Data
3.1.1 Sample of acquisitions
The sample of acquisition deals was collected from several sources. I selected completed
acquisitions, classified as biotechnology, pharmaceuticals or life sciences in the Zephyr
database for the years 1998-2012. This search method also identified acquisitions outside the
biopharmaceutical sector; such acquisitions were deleted from the dataset. Unrelated
transactions were considered to be those that involved the animal health business, over-the-
- 198 -
counter (OTC) or generic drugs, consumer products and medical devices. I also excluded
merger transactions, asset purchases or similar transactions. Ten acquisitions were dropped
from the final sample due to inadequate data, and two acquisitions were excluded due to the
existence of call options embedded in the alliance contracts prior to acquisitions. The dataset
obtained from the Zephyr database was supplemented by transactions data from the HBM
Partners website (Pharma/Biotech M&A report) and the Deloitte Recap database. This
filtering process yielded 219 acquisitions completed by 70 different firms.
Acquisition dates for the sample were verified using corporate webpages and the Factiva
database. Stock price data were obtained from the Thomson Reuters Datastream database.
Information on the relatedness of transactions was collected from press releases, obtained
from either corporate webpages or the Factiva database, and from S1 filings of acquiring
firms in the year prior to acquisition. Transaction details (such as the use of contingent
payments and whether the acquisition was financed with cash, stock or both) were obtained
from press releases on the corporate webpage or the Factiva database. Data on toehold
investments were mainly collected from the Zephyr database and supplemented with
information obtained from the Factiva database.
Table 1, Panel A, provides summary statistics for biopharmaceutical acquisitions by year,
including the number of acquisitions and mean and median values. In total, 219
biopharmaceutical firms, with a total deal value of $306 billion, were acquired over the 15-
year period. There were variations in the number of acquisitions per year. The number of
acquired companies reached a record high of 25 acquisitions in 2008, whereas only five firms
were acquired in 2004. The number of biopharmaceutical acquisitions was significantly
higher in more recent years than at the beginning of the period: 22 percent of the acquisitions
occurred between 1998 and 2004, whereas 78 percent occurred between 2005 and 2012. The
average (median) deal value was $1,250 ($505). The difference between mean and median
deal values indicates that some much larger acquisitions occurred during these years.
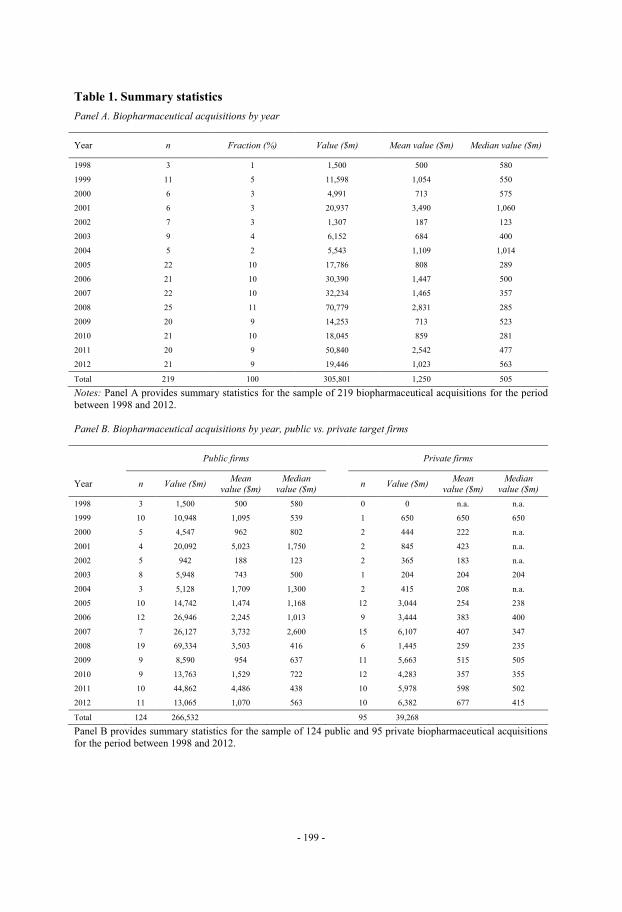
- 199 -
Table 1. Summary statistics
Panel A. Biopharmaceutical acquisitions by year
Year n Fraction (%) Value ($m) Mean value ($m) Median value ($m)
1998 3 1 1,500 500 580
1999 11 5 11,598 1,054 550
2000 6 3 4,991 713 575
2001 6 3 20,937 3,490 1,060
2002 7 3 1,307 187 123
2003 9 4 6,152 684 400
2004 5 2 5,543 1,109 1,014
2005 22 10 17,786 808 289
2006 21 10 30,390 1,447 500
2007 22 10 32,234 1,465 357
2008 25 11 70,779 2,831 285
2009 20 9 14,253 713 523
2010 21 10 18,045 859 281
2011 20 9 50,840 2,542 477
2012 21 9 19,446 1,023 563
Total 219 100 305,801 1,250 505
Notes: Panel A provides summary statistics for the sample of 219 biopharmaceutical acquisitions for the period
between 1998 and 2012.
Panel B. Biopharmaceutical acquisitions by year, public vs. private target firms
Public firms Private firms
Year n Value ($m) Mean
value ($m)
Median
value ($m) n Value ($m)
Mean
value ($m)
Median
value ($m)
1998 3 1,500 500 580 0 0 n.a. n.a.
1999 10 10,948 1,095 539 1 650 650 650
2000 5 4,547 962 802 2 444 222 n.a.
2001 4 20,092 5,023 1,750 2 845 423 n.a.
2002 5 942 188 123 2 365 183 n.a.
2003 8 5,948 743 500 1 204 204 204
2004 3 5,128 1,709 1,300 2 415 208 n.a.
2005 10 14,742 1,474 1,168 12 3,044 254 238
2006 12 26,946 2,245 1,013 9 3,444 383 400
2007 7 26,127 3,732 2,600 15 6,107 407 347
2008 19 69,334 3,503 416 6 1,445 259 235
2009 9 8,590 954 637 11 5,663 515 505
2010 9 13,763 1,529 722 12 4,283 357 355
2011 10 44,862 4,486 438 10 5,978 598 502
2012 11 13,065 1,070 563 10 6,382 677 415
Total 124 266,532 95 39,268
Panel B provides summary statistics for the sample of 124 public and 95 private biopharmaceutical acquisitions
for the period between 1998 and 2012.
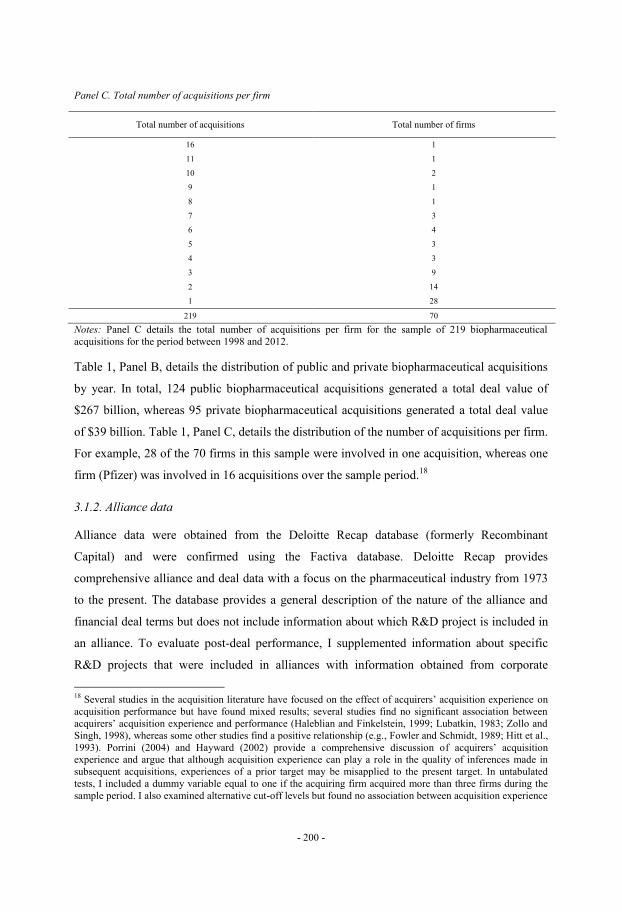
- 200 -
Panel C. Total number of acquisitions per firm
Total number of acquisitions Total number of firms
16 1
11 1
10 2
9 1
8 1
7 3
6 4
5 3
4 3
3 9
2 14
1 28
219 70
Notes: Panel C details the total number of acquisitions per firm for the sample of 219 biopharmaceutical
acquisitions for the period between 1998 and 2012.
Table 1, Panel B, details the distribution of public and private biopharmaceutical acquisitions
by year. In total, 124 public biopharmaceutical acquisitions generated a total deal value of
$267 billion, whereas 95 private biopharmaceutical acquisitions generated a total deal value
of $39 billion. Table 1, Panel C, details the distribution of the number of acquisitions per firm.
For example, 28 of the 70 firms in this sample were involved in one acquisition, whereas one
firm (Pfizer) was involved in 16 acquisitions over the sample period.18
3.1.2. Alliance data
Alliance data were obtained from the Deloitte Recap database (formerly Recombinant
Capital) and were confirmed using the Factiva database. Deloitte Recap provides
comprehensive alliance and deal data with a focus on the pharmaceutical industry from 1973
to the present. The database provides a general description of the nature of the alliance and
financial deal terms but does not include information about which R&D project is included in
an alliance. To evaluate post-deal performance, I supplemented information about specific
R&D projects that were included in alliances with information obtained from corporate
18
Several studies in the acquisition literature have focused on the effect of acquirers’ acquisition experience on
acquisition performance but have found mixed results; several studies find no significant association between
acquirers’ acquisition experience and performance (Haleblian and Finkelstein, 1999; Lubatkin, 1983; Zollo and
Singh, 1998), whereas some other studies find a positive relationship (e.g., Fowler and Schmidt, 1989; Hitt et al.,
1993). Porrini (2004) and Hayward (2002) provide a comprehensive discussion of acquirers’ acquisition
experience and argue that although acquisition experience can play a role in the quality of inferences made in
subsequent acquisitions, experiences of a prior target may be misapplied to the present target. In untabulated
tests, I included a dummy variable equal to one if the acquiring firm acquired more than three firms during the
sample period. I also examined alternative cut-off levels but found no association between acquisition experience
- 201 -
webpages and the Factiva database. The alliance data were also verified from an analysis of
the project portfolios from the S1-filings of target firms prior to acquisition. Based on prior
research, I expect that prior alliances provide opportunities for acquiring firms to learn about
the quality of target firms.
3.1.3 Post-deal performance
To analyze the performance of R&D projects in clinical trials, I employed the following
methodology. For the target firm, all R&D projects under development were collected from
the most recent quarterly or annual report prior to the acquisition. I noted the product ID,
molecular target, mechanism of action, indication, therapeutic area, stage of development and
whether the R&D project was developed in collaboration with a partner. If a single R&D
project had been developed against several indications, I assigned a dummy to the project that
was assumed to be the primary indication. In a majority of cases, the indication that was most
advanced in the R&D pipeline was the primary indication. To analyze the post-deal
performance of R&D projects, I tracked the progress of R&D projects using the acquiring
firm’s quarterly and annual reports in the years following the acquisition. Most often, the
acquiring firm assigned a new product ID to projects, which made data on the molecular
target, mechanism of action and indication very helpful in matching R&D projects. For each
subsequent year, I noted the stage of development of each acquired R&D project. In most
cases, the acquiring firm did not continue development of all of a target firm’s R&D projects.
Consequently, R&D projects that did not appear in the acquiring firm’s R&D portfolio post-
acquisition were excluded from the analysis because classifying such projects as failures
could bias the results.19
and acquisition performance. Separately, I controlled for firm-specific effects. To ensure that the results were
robust, I estimated a fixed effects model. The results did not change. 19
For example, prior to Roche’s acquisition of Memory Pharmaceuticals, the R&D portfolio of Memory
Pharmaceuticals contained the following projects: MEM 3454 (Phase 2), MEM63908 (Phase 1), MEM 1003
(Phase 2), MEM 1414 (Phase 1), MEM 1917 (Preclinical), as well as inhibitors targeting PDE 10 and antagonists
targeting 5-HT in preclinical trials. The only R&D projects that appeared in Roche’s disclosed R&D pipeline
post-acquisition were MEM 3454 (R1589) and MEM63908 (R4996), both developed against Alzheimer’s
disease and which were also included in their preceding alliance. Both projects disappeared from Roche’s
pipeline, according to the annual report and never advanced to another development stage. As illustrated in this
case, only these two projects were included in the analysis.

- 202 -
3.2 Methodology
3.2.1 Event study methodology
I employed the event study methodology to measure stock price reactions around the time of
acquisition announcements. First, I employed OLS regression methods to estimate predicted
returns, using the following market model20
:
(1)
where is the daily market return of acquiring firm i over day t, is the return of the
value-weighted market portfolio over day t, αi and βi are the parameters of the market model
and εi,t is a zero mean disturbance term. Predicted returns were estimated using ordinary least
squares (OLS) over an estimation period of 221 days (the time period starting 250 days prior
to the equity acquisition announcement and ending 30 days prior to the event). I used an event
window of three days, which included the day of the announcement as well as the days before
and after. The abnormal return is the difference between a firm’s predicted and actual stock
price for any given day, derived from the market model:
( ) (2)
where and are estimates of the regression parameters. For each event in the sample,
cumulative abnormal returns were calculated over the event window. The cumulative average
abnormal returns across all events, N, in the sample are thus:
∑∑
(3)
3.2.2 Combined firm returns
Past empirical research on stock market reactions to announcements of biopharmaceutical
mergers or acquisitions focuses on the valuation effect on bidders and/or targets, whereas for
a sample of large pharmaceutical mergers, only the study of Ravenscraft and Long (2000)
20
For robustness reasons, I also employed two additional models: 1) the Fama-French three-factor model and 2)
a two-factor model in which one factor is the market index (S&P500 index) and the second factor is an industry
index (NASDAQ Biotechnology index). Sharpe et al. (1999) suggest using a second factor when the sample is
comprised of firms in a single industry to explain more of the variation in the normal return. All models yielded
similar results.

- 203 -
considers the valuation effect on combined firms, finding that the effects for combined firms
are not significantly different from zero. Following Houston and Ryngaert (1994), cumulative
abnormal returns of a combined firm were calculated as the weighted average of gains of
bidder and target firms:
(4)
where is the market value of the bidding firm’s stock five days before the bid
announcement date, is the market value of the target firm’s stock five days before the
first acquisition bid of the target and and are the cumulative abnormal returns
for the ith bidder and target, respectively, over an 11-day window. Statistical significance was
evaluated using a t-test and a Wilcoxon signed-rank test.
3.2.3 Multivariate regression
To examine the effect of prior alliances with target firms on the cumulative abnormal returns
of acquiring firms’ shareholders, I used the following model:
(5)
The dependent variable, cumulative average abnormal returns (CAR), was estimated using the
market model (t-250 to t-21) and measured over a three-day event window (t-1 to t+1). The
independent variables were classified into two categories: test variables and control variables.
The main variable of interest, alliance, is expected to improve an acquiring firm’s ability to
evaluate the scientific and managerial expertise of a biotechnology company. The alliance
variable takes a value of 1 if the acquiring and target firms had an alliance prior to an
acquisition and zero otherwise. A positive value of the coefficient for alliance indicates that
an acquiring firm gained an informational advantage through the alliance. The results of the
analysis of the interaction between alliance and CAR relates to the first hypothesis (H1).
I included ten control variables that have been used in prior studies in the acquisition
literature (e.g., Higgins and Rodriguez, 2006; Mantecon, 2009; Travlos, 1987): relatedness,
toehold, earnout, stock, market sentiment, public, cross border, R&D intensity, MV buyer,
relative size, bid premium and public firm age. For example, relatedness measures the
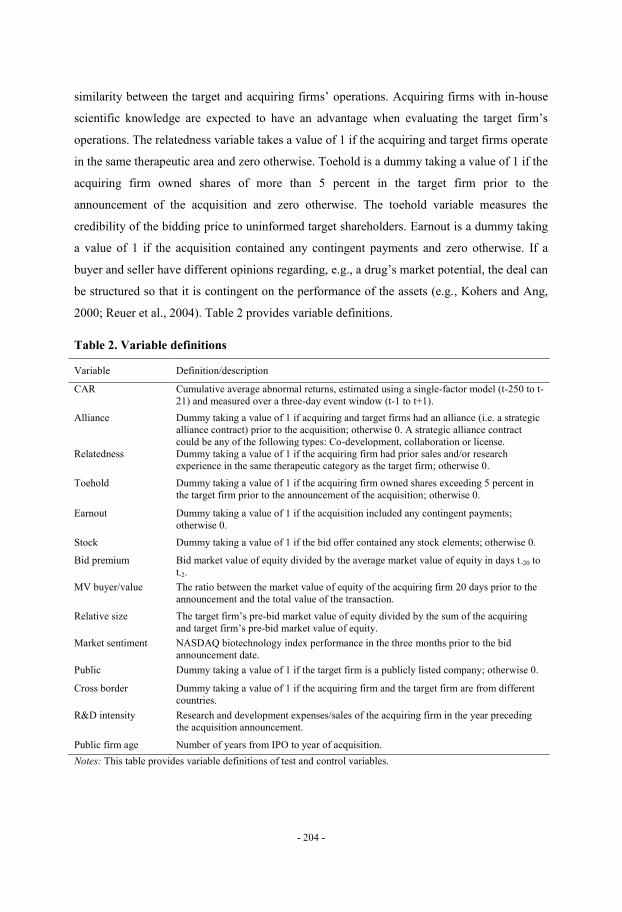
- 204 -
similarity between the target and acquiring firms’ operations. Acquiring firms with in-house
scientific knowledge are expected to have an advantage when evaluating the target firm’s
operations. The relatedness variable takes a value of 1 if the acquiring and target firms operate
in the same therapeutic area and zero otherwise. Toehold is a dummy taking a value of 1 if the
acquiring firm owned shares of more than 5 percent in the target firm prior to the
announcement of the acquisition and zero otherwise. The toehold variable measures the
credibility of the bidding price to uninformed target shareholders. Earnout is a dummy taking
a value of 1 if the acquisition contained any contingent payments and zero otherwise. If a
buyer and seller have different opinions regarding, e.g., a drug’s market potential, the deal can
be structured so that it is contingent on the performance of the assets (e.g., Kohers and Ang,
2000; Reuer et al., 2004). Table 2 provides variable definitions.
Table 2. Variable definitions
Variable Definition/description
CAR Cumulative average abnormal returns, estimated using a single-factor model (t-250 to t-
21) and measured over a three-day event window (t-1 to t+1).
Alliance Dummy taking a value of 1 if acquiring and target firms had an alliance (i.e. a strategic
alliance contract) prior to the acquisition; otherwise 0. A strategic alliance contract
could be any of the following types: Co-development, collaboration or license.
Relatedness Dummy taking a value of 1 if the acquiring firm had prior sales and/or research
experience in the same therapeutic category as the target firm; otherwise 0.
Toehold Dummy taking a value of 1 if the acquiring firm owned shares exceeding 5 percent in
the target firm prior to the announcement of the acquisition; otherwise 0.
Earnout Dummy taking a value of 1 if the acquisition included any contingent payments;
otherwise 0.
Stock Dummy taking a value of 1 if the bid offer contained any stock elements; otherwise 0.
Bid premium Bid market value of equity divided by the average market value of equity in days t-20 to
t-2.
MV buyer/value The ratio between the market value of equity of the acquiring firm 20 days prior to the
announcement and the total value of the transaction.
Relative size The target firm’s pre-bid market value of equity divided by the sum of the acquiring
and target firm’s pre-bid market value of equity.
Market sentiment NASDAQ biotechnology index performance in the three months prior to the bid
announcement date.
Public Dummy taking a value of 1 if the target firm is a publicly listed company; otherwise 0.
Cross border Dummy taking a value of 1 if the acquiring firm and the target firm are from different
countries.
R&D intensity Research and development expenses/sales of the acquiring firm in the year preceding
the acquisition announcement.
Public firm age Number of years from IPO to year of acquisition.
Notes: This table provides variable definitions of test and control variables.
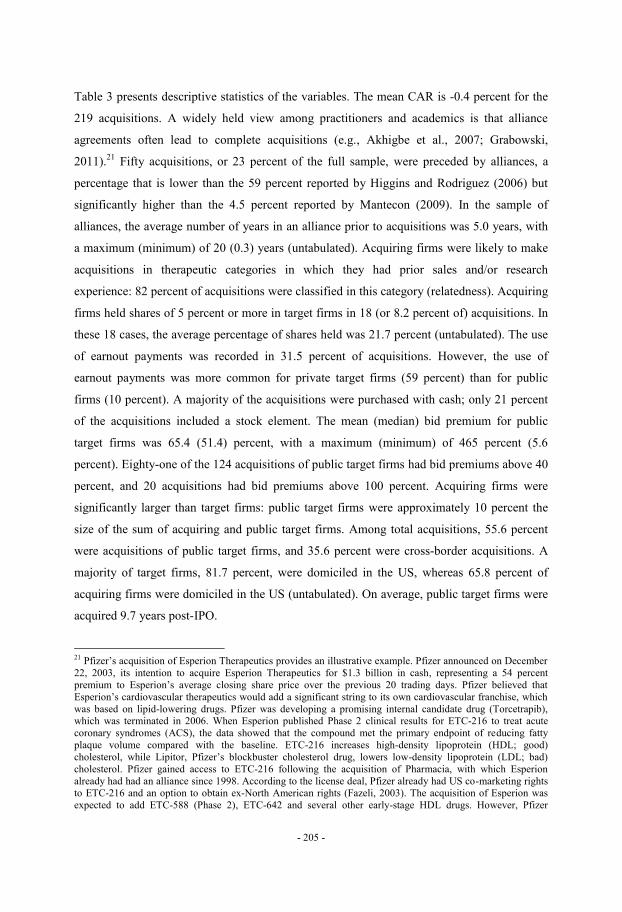
- 205 -
Table 3 presents descriptive statistics of the variables. The mean CAR is -0.4 percent for the
219 acquisitions. A widely held view among practitioners and academics is that alliance
agreements often lead to complete acquisitions (e.g., Akhigbe et al., 2007; Grabowski,
2011).21
Fifty acquisitions, or 23 percent of the full sample, were preceded by alliances, a
percentage that is lower than the 59 percent reported by Higgins and Rodriguez (2006) but
significantly higher than the 4.5 percent reported by Mantecon (2009). In the sample of
alliances, the average number of years in an alliance prior to acquisitions was 5.0 years, with
a maximum (minimum) of 20 (0.3) years (untabulated). Acquiring firms were likely to make
acquisitions in therapeutic categories in which they had prior sales and/or research
experience: 82 percent of acquisitions were classified in this category (relatedness). Acquiring
firms held shares of 5 percent or more in target firms in 18 (or 8.2 percent of) acquisitions. In
these 18 cases, the average percentage of shares held was 21.7 percent (untabulated). The use
of earnout payments was recorded in 31.5 percent of acquisitions. However, the use of
earnout payments was more common for private target firms (59 percent) than for public
firms (10 percent). A majority of the acquisitions were purchased with cash; only 21 percent
of the acquisitions included a stock element. The mean (median) bid premium for public
target firms was 65.4 (51.4) percent, with a maximum (minimum) of 465 percent (5.6
percent). Eighty-one of the 124 acquisitions of public target firms had bid premiums above 40
percent, and 20 acquisitions had bid premiums above 100 percent. Acquiring firms were
significantly larger than target firms: public target firms were approximately 10 percent the
size of the sum of acquiring and public target firms. Among total acquisitions, 55.6 percent
were acquisitions of public target firms, and 35.6 percent were cross-border acquisitions. A
majority of target firms, 81.7 percent, were domiciled in the US, whereas 65.8 percent of
acquiring firms were domiciled in the US (untabulated). On average, public target firms were
acquired 9.7 years post-IPO.
21
Pfizer’s acquisition of Esperion Therapeutics provides an illustrative example. Pfizer announced on December
22, 2003, its intention to acquire Esperion Therapeutics for $1.3 billion in cash, representing a 54 percent
premium to Esperion’s average closing share price over the previous 20 trading days. Pfizer believed that
Esperion’s cardiovascular therapeutics would add a significant string to its own cardiovascular franchise, which
was based on lipid-lowering drugs. Pfizer was developing a promising internal candidate drug (Torcetrapib),
which was terminated in 2006. When Esperion published Phase 2 clinical results for ETC-216 to treat acute
coronary syndromes (ACS), the data showed that the compound met the primary endpoint of reducing fatty
plaque volume compared with the baseline. ETC-216 increases high-density lipoprotein (HDL; good)
cholesterol, while Lipitor, Pfizer’s blockbuster cholesterol drug, lowers low-density lipoprotein (LDL; bad)
cholesterol. Pfizer gained access to ETC-216 following the acquisition of Pharmacia, with which Esperion
already had had an alliance since 1998. According to the license deal, Pfizer already had US co-marketing rights
to ETC-216 and an option to obtain ex-North American rights (Fazeli, 2003). The acquisition of Esperion was
expected to add ETC-588 (Phase 2), ETC-642 and several other early-stage HDL drugs. However, Pfizer
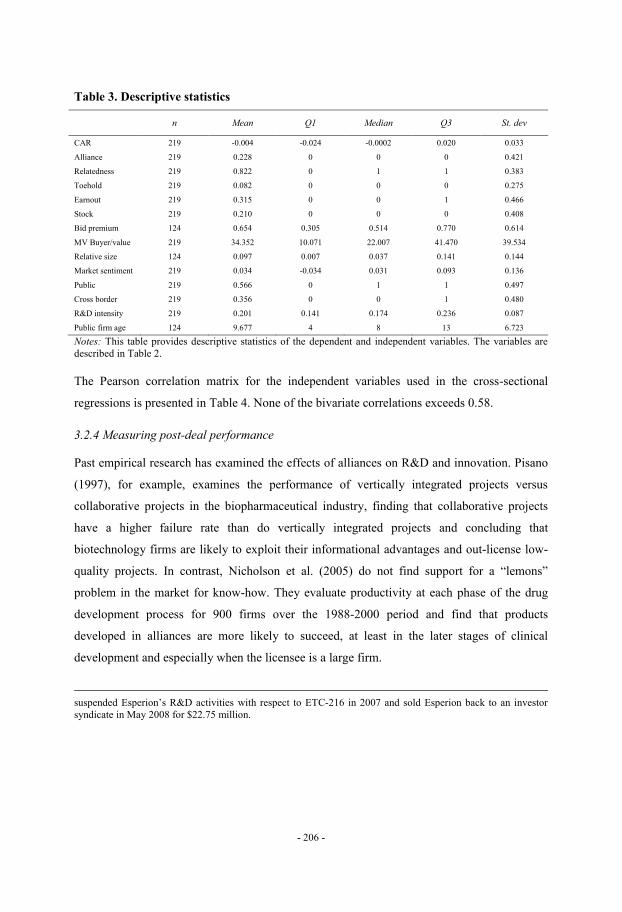
- 206 -
Table 3. Descriptive statistics
n Mean Q1 Median Q3 St. dev
CAR 219 -0.004 -0.024 -0.0002 0.020 0.033
Alliance 219 0.228 0 0 0 0.421
Relatedness 219 0.822 0 1 1 0.383
Toehold 219 0.082 0 0 0 0.275
Earnout 219 0.315 0 0 1 0.466
Stock 219 0.210 0 0 0 0.408
Bid premium 124 0.654 0.305 0.514 0.770 0.614
MV Buyer/value 219 34.352 10.071 22.007 41.470 39.534
Relative size 124 0.097 0.007 0.037 0.141 0.144
Market sentiment 219 0.034 -0.034 0.031 0.093 0.136
Public 219 0.566 0 1 1 0.497
Cross border 219 0.356 0 0 1 0.480
R&D intensity 219 0.201 0.141 0.174 0.236 0.087
Public firm age 124 9.677 4 8 13 6.723
Notes: This table provides descriptive statistics of the dependent and independent variables. The variables are
described in Table 2.
The Pearson correlation matrix for the independent variables used in the cross-sectional
regressions is presented in Table 4. None of the bivariate correlations exceeds 0.58.
3.2.4 Measuring post-deal performance
Past empirical research has examined the effects of alliances on R&D and innovation. Pisano
(1997), for example, examines the performance of vertically integrated projects versus
collaborative projects in the biopharmaceutical industry, finding that collaborative projects
have a higher failure rate than do vertically integrated projects and concluding that
biotechnology firms are likely to exploit their informational advantages and out-license low-
quality projects. In contrast, Nicholson et al. (2005) do not find support for a “lemons”
problem in the market for know-how. They evaluate productivity at each phase of the drug
development process for 900 firms over the 1988-2000 period and find that products
developed in alliances are more likely to succeed, at least in the later stages of clinical
development and especially when the licensee is a large firm.
suspended Esperion’s R&D activities with respect to ETC-216 in 2007 and sold Esperion back to an investor
syndicate in May 2008 for $22.75 million.
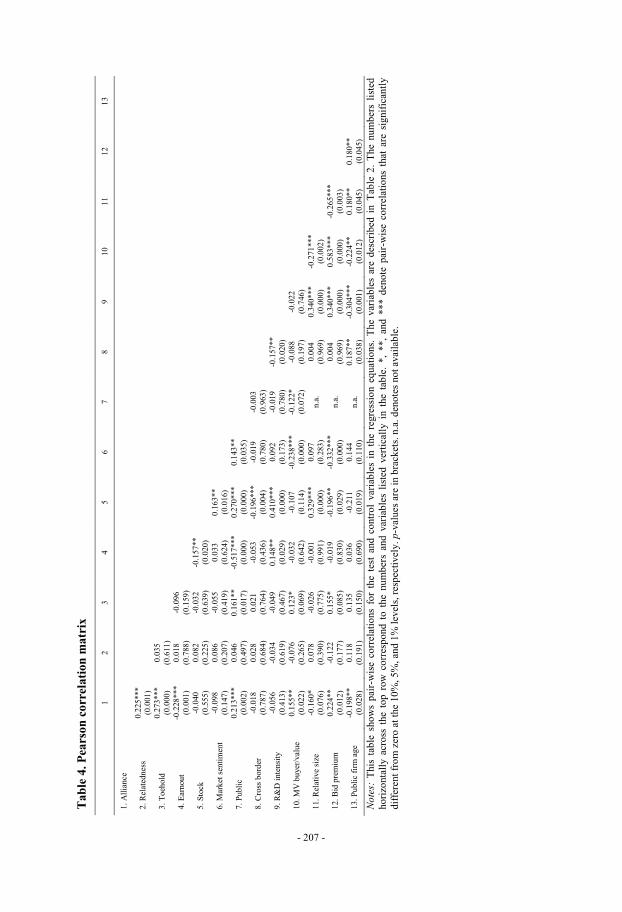
Tab
le 4
. P
ears
on
co
rrel
ati
on
matr
ix
1
2
3
4
5
6
7
8
9
10
11
12
13
1.
All
ian
ce
2. R
elat
edn
ess
0.2
25
***
(0.0
01
)
3.
Toeh
old
0
.273
***
(0.0
00
)
0.0
35
(0.6
11
)
4. E
arn
ou
t -0
.228
***
(0.0
01
)
0.0
18
(0.7
88
)
-0.0
96
(0.1
59
)
5.
Sto
ck
-0.0
40
(0.5
55
) 0
.082
(0.2
25
) -0
.032
(0.6
39
) -0
.157
**
(0.0
20
)
6. M
ark
et s
enti
men
t -0
.098
(0.1
47
)
0.0
86
(0.2
07
)
-0.0
55
(0.4
19
)
0.0
33
(0.6
24
)
0.1
63
**
(0.0
16
)
7.
Pub
lic
0.2
13
***
(0.0
02
)
0.0
46
(0.4
97
)
0.1
61
**
(0.0
17
)
-0.5
17
***
(0.0
00
)
0.2
70
***
(0.0
00
)
0.1
43
**
(0.0
35
)
8. C
ross
bord
er
-0.0
18
(0.7
87
) 0
.028
(0.6
84
) 0
.021
(0.7
64
) -0
.053
(0.4
36
) -0
.196
***
(0.0
04
) -0
.019
(0.7
80
) -0
.003
(0.9
63
)
9. R
&D
inte
nsi
ty
-0.0
56
(0.4
13
)
-0.0
34
(0.6
19
)
-0.0
49
(0.4
67
)
0.1
48
**
(0.0
29
)
0.4
10
***
(0.0
00
)
0.0
92
(0.1
73
)
-0.0
19
(0.7
80
)
-0.1
57
**
(0.0
20
)
10. M
V b
uyer
/val
ue
0.1
55
**
(0.0
22
)
-0.0
76
(0.2
65
)
0.1
23
*
(0.0
69
)
-0.0
32
(0.6
42
)
-0.1
07
(0.1
14
)
-0.2
38
***
(0.0
00
)
-0.1
22
*
(0.0
72
)
-0.0
88
(0.1
97
)
-0.0
22
(0.7
46
)
11. R
elat
ive
size
-0
.160
*
(0.0
76
)
0.0
78
(0.3
90
)
-0.0
26
(0.7
75
)
-0.0
01
(0.9
91
)
0.3
29
***
(0.0
00
)
0.0
97
(0.2
83
) n
.a.
0.0
04
(0.9
69
)
0.3
40
***
(0.0
00
)
-0.2
71
***
(0.0
02
)
12. B
id p
rem
ium
0
.224
**
(0.0
12
)
-0.1
22
(0.1
77
)
0.1
55
*
(0.0
85
)
-0.0
19
(0.8
30
)
-0.1
96
**
(0.0
29
)
-0.3
32
***
(0.0
00
) n
.a.
0.0
04
(0.9
69
)
0.3
40
***
(0.0
00
)
0.5
83
***
(0.0
00
)
-0.2
65
***
(0.0
03
)
13.
Pu
bli
c fi
rm a
ge
-0.1
98
**
(0.0
28
)
0.1
18
(0.1
91
)
0.1
35
(0.1
50
)
0.0
36
(0.6
90
)
-0.2
11
(0.0
19
)
0.1
44
(0.1
10
) n
.a.
0.1
87
**
(0.0
38
)
-0.3
04
***
(0.0
01
)
-0.2
24
**
(0.0
12
)
0.1
80
**
(0.0
45
)
0.1
80
**
(0.0
45
)
No
tes:
This
tab
le s
ho
ws
pai
r-w
ise
corr
elat
ions
for
the
test
and
co
ntr
ol
var
iab
les
in t
he
regre
ssio
n e
quati
ons.
The
var
iab
les
are
des
crib
ed i
n T
able
2.
The
nu
mb
ers
list
ed
ho
rizo
nta
lly a
cro
ss t
he
top
row
co
rres
po
nd
to
the
nu
mb
ers
and
var
iab
les
list
ed v
erti
call
y i
n t
he
tab
le.
*,
**,
and
**
* d
eno
te p
air-
wis
e co
rrel
atio
ns
that
are
sig
nif
ican
tly
dif
fere
nt
fro
m z
ero
at
the
10
%,
5%
, an
d 1
% l
evel
s, r
esp
ecti
vel
y.
p-v
alues
are
in b
rack
ets.
n.a
. d
eno
tes
no
t av
aila
ble
.
- 207 -
- 208 -
No previous studies have examined the performance of R&D projects after acquisition. The
advantage in the present setting arises from the isolation of imperfect information, whereas
R&D projects that are out-licensed or vertically integrated can be driven by either imperfect
information (lower-quality R&D projects that are out-licensed) or perfect information (R&D
projects that are out-licensed due to gains-from-trade). I examined whether R&D projects are
more likely to succeed when acquisitions are preceded by alliances than when they are not
preceded by prior alliances. I employed the model developed by Nicholson et al. (2005)22
, in
which the probability that R&D project j originated by company i will advance to the next
development stage (A=1) is a function of drug characteristics (Xj) and a dummy variable
(Allianceij) that equals 1 if R&D project j of company i is developed in an alliance:
( ) (6)
A positive and statistically significant coefficient for β1 is consistent with the view that
acquiring firms gain an informational advantage from a preceding alliance with target firms.
The present study focuses on R&D projects in any of the following stages of the drug
development process: preclinical, Phase 1, Phase 2, Phase 3 and regulatory (FDA-filed).23
The
lead R&D projects of 66 percent of the companies considered were in the regulatory stage or
earlier.24
Because marketed drugs must undergo an extensive review process by regulatory
authorities such as the FDA, there is reason to believe that information asymmetry is less
pronounced for drugs that have been approved for marketing.
Information asymmetry may differ across individual stages of the development process.25
In
addition, different phases of research are characterized by different probabilities of success
(DiMasi and Grabowski, 2007). Therefore, I performed five separate logit regressions for
R&D projects that were in the preclinical stage, Phase 1, Phase 2, Phase 3 and the regulatory
22
Nicholson et al. (2005) also control for firm size of the acquiring firm by specifying three categories: small
companies that originated three or fewer drugs during the sample period, medium-sized companies that
originated between four and 24 drugs, and large companies that originated 25 or more drugs. Due to the small
variation in the dataset of the present study and because a majority of acquiring firms had more than 25 drugs in
their research pipeline, I did not control for the characteristics of the involved firms. 23
In general, the different phases can be described as follows. Phase 1 trials examine the safety of the drug with
healthy volunteers. Phase 2 examines drug efficacy in small-scale patient groups. Phase 3 examines drug
efficacy in large-scale patient groups. All pre-Phase 1 activities, such as preclinical research and preclinical
development, are grouped into the preclinical category. 24
More specifically, the distributions are as follows: 10% in regulatory, 10% in Phase 3, 26% in Phase 2, 8% in
Phase 1, and 12% in the preclinical stage. 25
Nicholson et al. (2005) argue that information asymmetry may be particularly severe in the preclinical phase
before R&D projects have demonstrated safety and efficacy in humans.
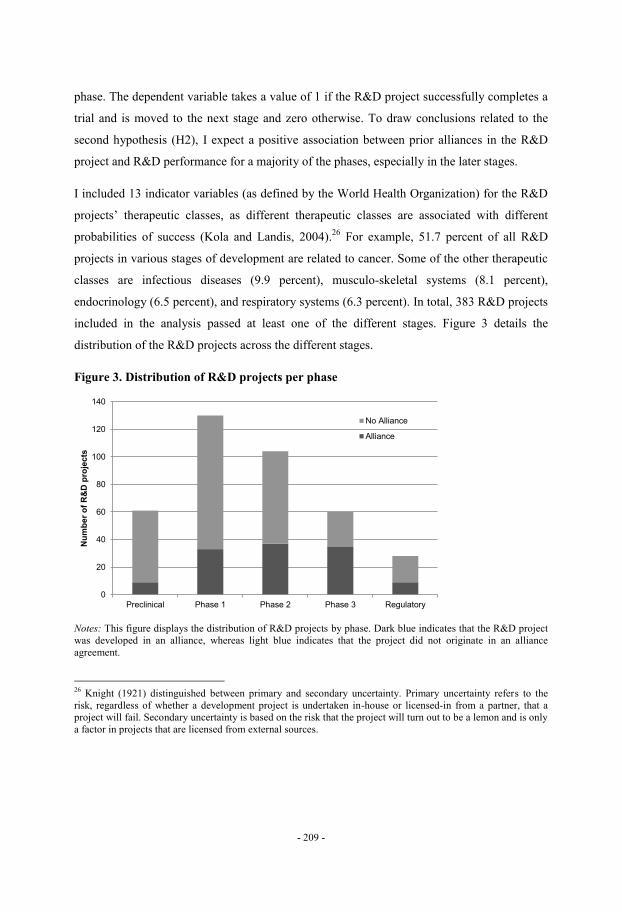
- 209 -
phase. The dependent variable takes a value of 1 if the R&D project successfully completes a
trial and is moved to the next stage and zero otherwise. To draw conclusions related to the
second hypothesis (H2), I expect a positive association between prior alliances in the R&D
project and R&D performance for a majority of the phases, especially in the later stages.
I included 13 indicator variables (as defined by the World Health Organization) for the R&D
projects’ therapeutic classes, as different therapeutic classes are associated with different
probabilities of success (Kola and Landis, 2004).26
For example, 51.7 percent of all R&D
projects in various stages of development are related to cancer. Some of the other therapeutic
classes are infectious diseases (9.9 percent), musculo-skeletal systems (8.1 percent),
endocrinology (6.5 percent), and respiratory systems (6.3 percent). In total, 383 R&D projects
included in the analysis passed at least one of the different stages. Figure 3 details the
distribution of the R&D projects across the different stages.
Figure 3. Distribution of R&D projects per phase
Notes: This figure displays the distribution of R&D projects by phase. Dark blue indicates that the R&D project
was developed in an alliance, whereas light blue indicates that the project did not originate in an alliance
agreement.
26
Knight (1921) distinguished between primary and secondary uncertainty. Primary uncertainty refers to the
risk, regardless of whether a development project is undertaken in-house or licensed-in from a partner, that a
project will fail. Secondary uncertainty is based on the risk that the project will turn out to be a lemon and is only
a factor in projects that are licensed from external sources.
0
20
40
60
80
100
120
140
Preclinical Phase 1 Phase 2 Phase 3 Regulatory
Nu
mb
er
of
R&
D p
roje
cts
No Alliance
Alliance
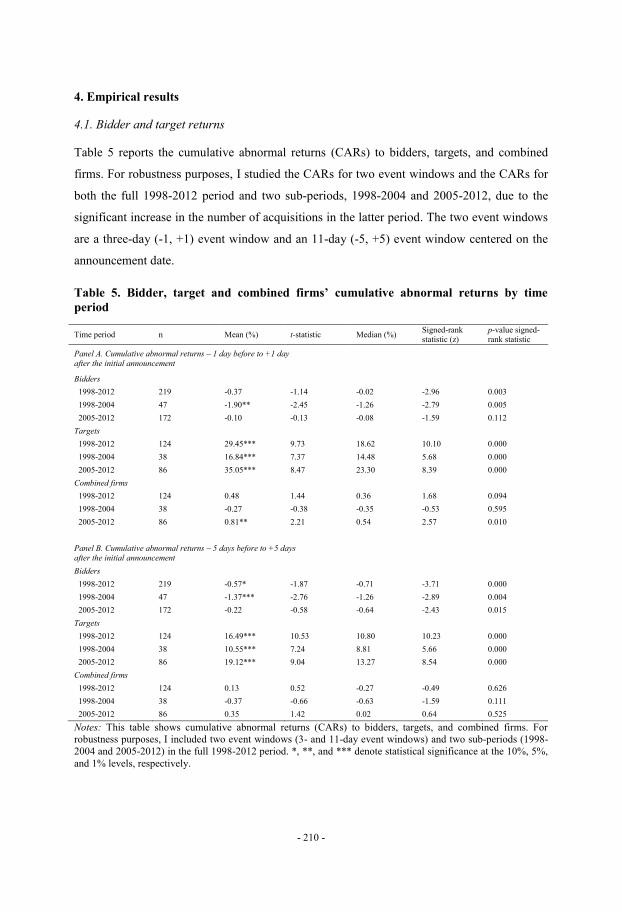
- 210 -
4. Empirical results
4.1. Bidder and target returns
Table 5 reports the cumulative abnormal returns (CARs) to bidders, targets, and combined
firms. For robustness purposes, I studied the CARs for two event windows and the CARs for
both the full 1998-2012 period and two sub-periods, 1998-2004 and 2005-2012, due to the
significant increase in the number of acquisitions in the latter period. The two event windows
are a three-day (-1, +1) event window and an 11-day (-5, +5) event window centered on the
announcement date.
Table 5. Bidder, target and combined firms’ cumulative abnormal returns by time
period
Time period n Mean (%) t-statistic Median (%) Signed-rank statistic (z)
p-value signed-rank statistic
Panel A. Cumulative abnormal returns – 1 day before to +1 day
after the initial announcement
Bidders
1998-2012 219 -0.37 -1.14 -0.02 -2.96 0.003
1998-2004 47 -1.90** -2.45 -1.26 -2.79 0.005
2005-2012 172 -0.10 -0.13 -0.08 -1.59 0.112
Targets
1998-2012 124 29.45*** 9.73 18.62 10.10 0.000
1998-2004 38 16.84*** 7.37 14.48 5.68 0.000
2005-2012 86 35.05*** 8.47 23.30 8.39 0.000
Combined firms
1998-2012 124 0.48 1.44 0.36 1.68 0.094
1998-2004 38 -0.27 -0.38 -0.35 -0.53 0.595
2005-2012 86 0.81** 2.21 0.54 2.57 0.010
Panel B. Cumulative abnormal returns – 5 days before to +5 days
after the initial announcement
Bidders
1998-2012 219 -0.57* -1.87 -0.71 -3.71 0.000
1998-2004 47 -1.37*** -2.76 -1.26 -2.89 0.004
2005-2012 172 -0.22 -0.58 -0.64 -2.43 0.015
Targets
1998-2012 124 16.49*** 10.53 10.80 10.23 0.000
1998-2004 38 10.55*** 7.24 8.81 5.66 0.000
2005-2012 86 19.12*** 9.04 13.27 8.54 0.000
Combined firms
1998-2012 124 0.13 0.52 -0.27 -0.49 0.626
1998-2004 38 -0.37 -0.66 -0.63 -1.59 0.111
2005-2012 86 0.35 1.42 0.02 0.64 0.525
Notes: This table shows cumulative abnormal returns (CARs) to bidders, targets, and combined firms. For
robustness purposes, I included two event windows (3- and 11-day event windows) and two sub-periods (1998-
2004 and 2005-2012) in the full 1998-2012 period. *, **, and *** denote statistical significance at the 10%, 5%,
and 1% levels, respectively.
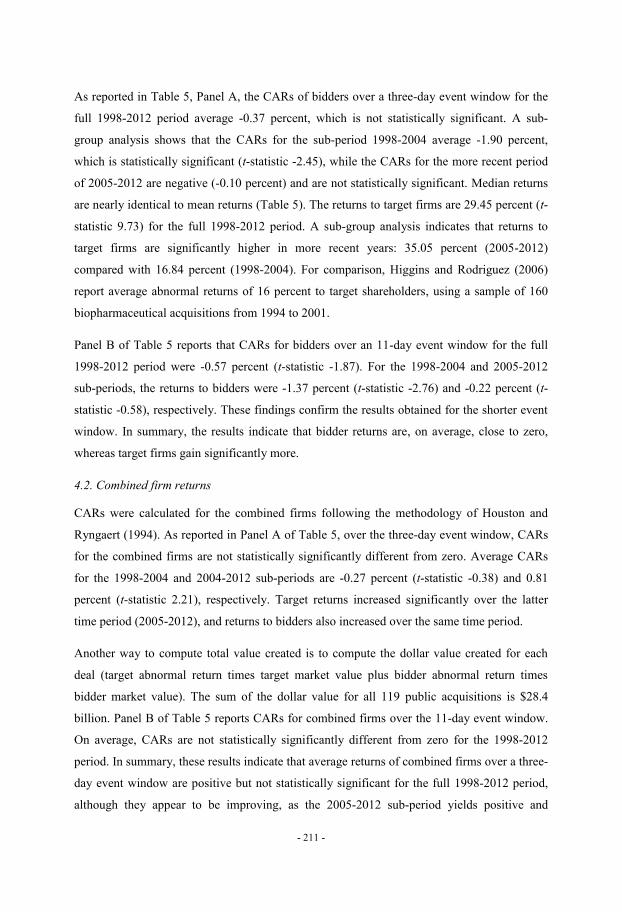
- 211 -
As reported in Table 5, Panel A, the CARs of bidders over a three-day event window for the
full 1998-2012 period average -0.37 percent, which is not statistically significant. A sub-
group analysis shows that the CARs for the sub-period 1998-2004 average -1.90 percent,
which is statistically significant (t-statistic -2.45), while the CARs for the more recent period
of 2005-2012 are negative (-0.10 percent) and are not statistically significant. Median returns
are nearly identical to mean returns (Table 5). The returns to target firms are 29.45 percent (t-
statistic 9.73) for the full 1998-2012 period. A sub-group analysis indicates that returns to
target firms are significantly higher in more recent years: 35.05 percent (2005-2012)
compared with 16.84 percent (1998-2004). For comparison, Higgins and Rodriguez (2006)
report average abnormal returns of 16 percent to target shareholders, using a sample of 160
biopharmaceutical acquisitions from 1994 to 2001.
Panel B of Table 5 reports that CARs for bidders over an 11-day event window for the full
1998-2012 period were -0.57 percent (t-statistic -1.87). For the 1998-2004 and 2005-2012
sub-periods, the returns to bidders were -1.37 percent (t-statistic -2.76) and -0.22 percent (t-
statistic -0.58), respectively. These findings confirm the results obtained for the shorter event
window. In summary, the results indicate that bidder returns are, on average, close to zero,
whereas target firms gain significantly more.
4.2. Combined firm returns
CARs were calculated for the combined firms following the methodology of Houston and
Ryngaert (1994). As reported in Panel A of Table 5, over the three-day event window, CARs
for the combined firms are not statistically significantly different from zero. Average CARs
for the 1998-2004 and 2004-2012 sub-periods are -0.27 percent (t-statistic -0.38) and 0.81
percent (t-statistic 2.21), respectively. Target returns increased significantly over the latter
time period (2005-2012), and returns to bidders also increased over the same time period.
Another way to compute total value created is to compute the dollar value created for each
deal (target abnormal return times target market value plus bidder abnormal return times
bidder market value). The sum of the dollar value for all 119 public acquisitions is $28.4
billion. Panel B of Table 5 reports CARs for combined firms over the 11-day event window.
On average, CARs are not statistically significantly different from zero for the 1998-2012
period. In summary, these results indicate that average returns of combined firms over a three-
day event window are positive but not statistically significant for the full 1998-2012 period,
although they appear to be improving, as the 2005-2012 sub-period yields positive and
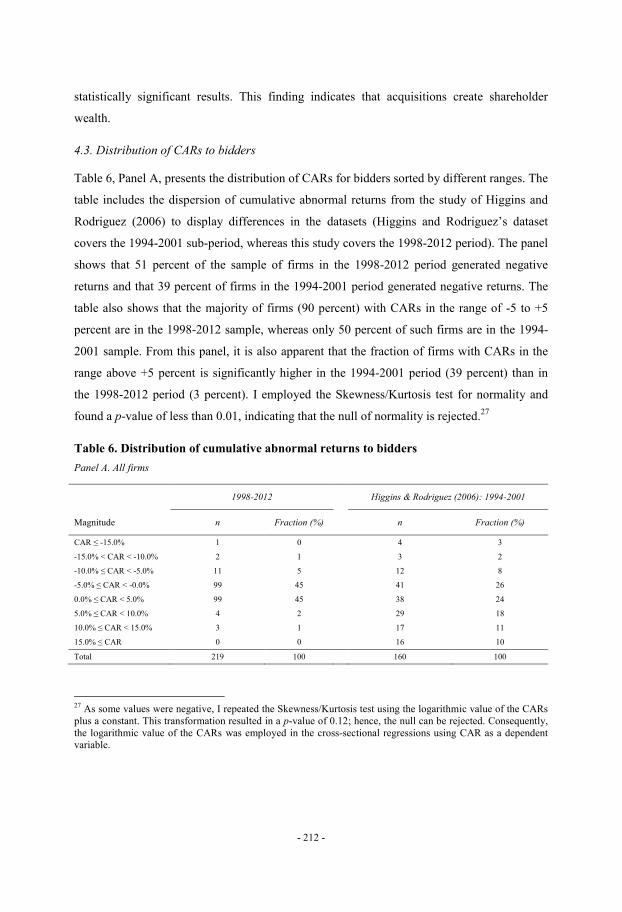
- 212 -
statistically significant results. This finding indicates that acquisitions create shareholder
wealth.
4.3. Distribution of CARs to bidders
Table 6, Panel A, presents the distribution of CARs for bidders sorted by different ranges. The
table includes the dispersion of cumulative abnormal returns from the study of Higgins and
Rodriguez (2006) to display differences in the datasets (Higgins and Rodriguez’s dataset
covers the 1994-2001 sub-period, whereas this study covers the 1998-2012 period). The panel
shows that 51 percent of the sample of firms in the 1998-2012 period generated negative
returns and that 39 percent of firms in the 1994-2001 period generated negative returns. The
table also shows that the majority of firms (90 percent) with CARs in the range of -5 to +5
percent are in the 1998-2012 sample, whereas only 50 percent of such firms are in the 1994-
2001 sample. From this panel, it is also apparent that the fraction of firms with CARs in the
range above +5 percent is significantly higher in the 1994-2001 period (39 percent) than in
the 1998-2012 period (3 percent). I employed the Skewness/Kurtosis test for normality and
found a p-value of less than 0.01, indicating that the null of normality is rejected.27
Table 6. Distribution of cumulative abnormal returns to bidders
Panel A. All firms
1998-2012 Higgins & Rodriguez (2006): 1994-2001
Magnitude n Fraction (%) n Fraction (%)
CAR ≤ -15.0% 1 0 4 3
-15.0% < CAR < -10.0% 2 1 3 2
-10.0% ≤ CAR < -5.0% 11 5 12 8
-5.0% ≤ CAR < -0.0% 99 45 41 26
0.0% ≤ CAR < 5.0% 99 45 38 24
5.0% ≤ CAR < 10.0% 4 2 29 18
10.0% ≤ CAR < 15.0% 3 1 17 11
15.0% ≤ CAR 0 0 16 10
Total 219 100 160 100
27
As some values were negative, I repeated the Skewness/Kurtosis test using the logarithmic value of the CARs
plus a constant. This transformation resulted in a p-value of 0.12; hence, the null can be rejected. Consequently,
the logarithmic value of the CARs was employed in the cross-sectional regressions using CAR as a dependent
variable.

- 213 -
Panel B. Public vs. private target firms
Public target firms Private target firms
Magnitude n Fraction (%) n Fraction (%)
CAR ≤ -15.0% 1 1 0 0
-15.0% < CAR < -10.0% 2 2 0 0
-10.0% ≤ CAR < -5.0% 11 9 0 0
-5.0% ≤ CAR < -0.0% 57 46 42 44
0.0% ≤ CAR < 5.0% 49 40 50 53
5.0% ≤ CAR < 10.0% 2 2 2 2
10.0% ≤ CAR < 15.0% 2 2 1 1
15.0% ≤ CAR 0 0 0 0
Total 124 100 95 100
Notes: Panel A provides the distribution of cumulative abnormal returns (CARs) for bidder firms. For
comparative purposes, the distribution of CARs from the study of Higgins and Rodriguez (2006) is included.
Panel B provides the distribution of cumulative abnormal returns (CARs) for bidder firms when the target firm is
either public or private.
Table 6, Panel B, presents the distribution of cumulative abnormal returns for bidders sorted
by different ranges as well as for public and private target firms. The panel shows that 86
percent (97 percent) of firms with CARs in the range of -5 to +5 percent are public (private)
target firms. Interestingly, 12 percent of bidders for public target firms have CARs of -5
percent or below, whereas the corresponding figure for private target firms is zero percent.
4.4 Univariate analysis of CARs of bidders
A univariate analysis of the relationship between CARs of bidders and a set of test
variables—alliance, relatedness, earnout payments, and toehold investments—is reported in
Table 7 (the variables are defined in Table 2.) The purpose of this section is to evaluate which
of these mechanisms are most beneficial to acquiring firms. I anticipate that all four test
variables should generate high CARs for acquiring firms, although I primarily focus on the
alliance variable as a key indicator of whether information asymmetries can be mitigated.
In Table 7, Panel A reports CARs of acquiring firms for the overall sample, while Panel B
reports CARs of bidders for public and private target firms. Panel A shows that mean
(median) cumulative abnormal returns to bidders in the overall sample is -0.37 percent (-
0.02), which is not statistically significant. This result contrasts with the results of Higgins
and Rodriguez (2006), who find overall CARs of 3.91 percent. Panel B of Table 7 shows that
mean CARs of bidders differ slightly, depending on whether the target firm is public or
private, but this result is not statistically significant.
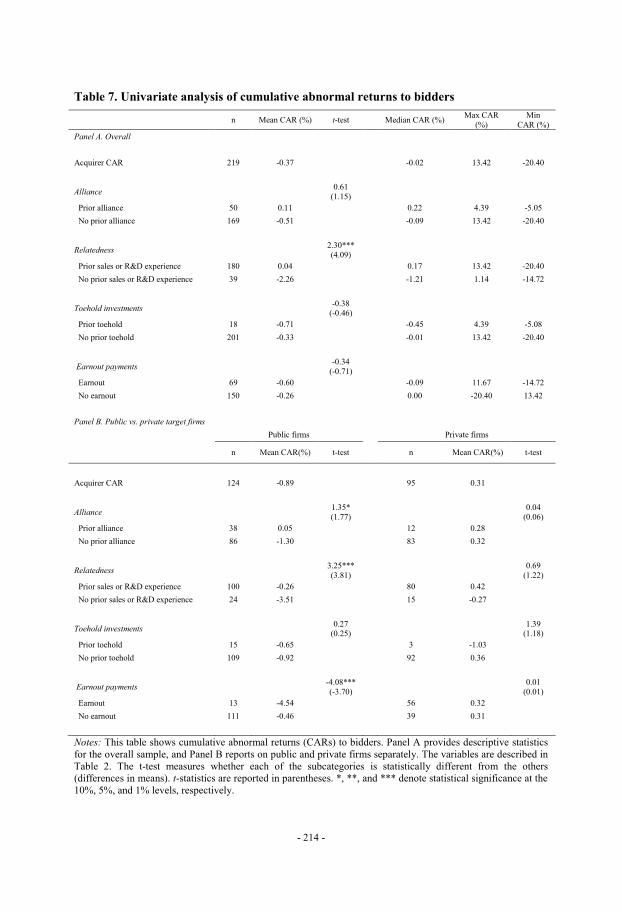
- 214 -
Table 7. Univariate analysis of cumulative abnormal returns to bidders
n Mean CAR (%) t-test
Median CAR (%) Max CAR
(%)
Min
CAR (%)
Panel A. Overall
Acquirer CAR 219 -0.37 -0.02 13.42 -20.40
Alliance 0.61
(1.15)
Prior alliance 50 0.11 0.22 4.39 -5.05
No prior alliance 169 -0.51 -0.09 13.42 -20.40
Relatedness 2.30***
(4.09)
Prior sales or R&D experience 180 0.04 0.17 13.42 -20.40
No prior sales or R&D experience 39 -2.26 -1.21 1.14 -14.72
Toehold investments -0.38
(-0.46)
Prior toehold 18 -0.71 -0.45 4.39 -5.08
No prior toehold 201 -0.33 -0.01 13.42 -20.40
Earnout payments -0.34
(-0.71)
Earnout 69 -0.60 -0.09 11.67 -14.72
No earnout 150 -0.26 0.00 -20.40 13.42
Panel B. Public vs. private target firms
Public firms Private firms
n Mean CAR(%) t-test n Mean CAR(%) t-test
Acquirer CAR 124 -0.89 95 0.31
Alliance 1.35*
(1.77)
0.04
(0.06)
Prior alliance 38 0.05 12 0.28
No prior alliance 86 -1.30 83 0.32
Relatedness 3.25***
(3.81)
0.69
(1.22)
Prior sales or R&D experience 100 -0.26 80 0.42
No prior sales or R&D experience 24 -3.51 15 -0.27
Toehold investments 0.27
(0.25)
1.39
(1.18)
Prior toehold 15 -0.65 3 -1.03
No prior toehold 109 -0.92 92 0.36
Earnout payments -4.08***
(-3.70)
0.01
(0.01)
Earnout 13 -4.54 56 0.32
No earnout 111 -0.46 39 0.31
Notes: This table shows cumulative abnormal returns (CARs) to bidders. Panel A provides descriptive statistics
for the overall sample, and Panel B reports on public and private firms separately. The variables are described in
Table 2. The t-test measures whether each of the subcategories is statistically different from the others
(differences in means). t-statistics are reported in parentheses. *, **, and *** denote statistical significance at the
10%, 5%, and 1% levels, respectively.
- 215 -
Next, CARs are examined in relation to the alliance variable. Average CARs of firms with
prior alliances with target firms are 0.11 percent, which is not statistically different from zero.
By comparison, returns of firms without prior alliances with target firms are -0.51 percent
(statistically different from zero at the 10 percent level). The difference in means is positive
but not statistically significant. This finding indicates that prior alliances with target firms are
not associated with higher bidder returns. Panel B of Table 7 shows that the difference in
means between CARs of firms with prior alliances and CARs of firms without such alliances
is positive and statistically significant at the 10 percent level when the target firm is publicly
listed. Having a prior alliance with a target firm is more common among public target firms
than private target firms; approximately 31 percent of public target firms have prior alliances
with acquiring firms compared to only 13 percent of private target firms.
Table 7 additionally provides average CARs for other factors, such as related transactions,
toeholds and earnout payments, that are associated with information asymmetry between
bidder and target. Average CARs of firms in related transactions are 0.04 percent, which is
not statistically different from zero, whereas returns to firms in non-related transactions are -
2.26 percent (statistically significant at the 1 percent level). The difference in means is
positive and statistically significant at the 1 percent level for the overall sample and for the
sub-sample of public target firms. These descriptive statistics show that acquiring firms tend
to acquire firms in therapeutic areas in which they either have prior research and/or sales
experience; 82 percent of acquisitions are made within the same therapeutic area. Average
CARs of firms with a prior toehold in the target firm is -0.71, which is not statistically
different from zero. By comparison, average CARs of firms without a prior toehold is -0.33,
which is also not statistically different from zero. The difference in means is -0.38, which is
not statistically significant (t-statistic -0.46). The low proportion of prior toehold investments
preceding acquisitions suggests that toehold investments are not an important determinant of
CARs.
Finally, average CARs of firms in which transactions include earnout payments is -0.60
percent, which is not statistically different from zero. Average CARs of firms with no earnout
payments are -0.33 percent, which is also not statistically different from zero. The difference
in means is -0.34, which is not statistically significant (t-statistic -0.71). However, sub-group
analysis shows that the difference in means is negative and statistically significant at the 1
percent level for public target firms. A potential explanation for the negative stock price
reaction is that although contingent payments are used in acquisitions to address adverse

- 216 -
selection in the presence of information asymmetries (Akerlof, 1970), such payments may
also signal a high degree of market uncertainty (Bruner, 2002). A comparison between public
and private target firms shows that the use of contingent payments is much more common in
acquisitions of private target firms (59 percent) than of public target firms (10 percent).
4.5 Multivariate regression analysis of CARs
The results from the regression analysis are reported in Table 8 across seven specifications of
the test variables both separately and with controls. The dependent variable in these
regressions is the three-day CAR for each acquiring firm in the sample. The first hypothesis
(H1) refers to the alliance variable. I also included several control variables, such as
relatedness, toehold, and earnout. The adjusted R-square values for the models are higher than
those reported in other studies (e.g., Mantecon, 2009; Moeller & Schlingemann, 2005), and
all models are characterized by statistically significant F-values. A comparison across the
models in Table 8 shows that the variables provide incremental explanatory power.
In Model 1, the coefficient for the alliance variable is positive but statistically insignificant (p-
value = 0.165). This indicates that acquiring firms do not gain from prior alliances with target
firms (i.e., there is no support for H1). This result contrasts with the results of Higgins and
Rodriguez (2006), Chan et al. (1997), Mantecon (2009) and Porrini (2004) but supports the
view of Ball et al. (1991) that alliances do not necessarily help acquiring firms learn about the
true quality of target firms. There are several reasons why prior alliances may play a role in
the process of learning about the quality of target firms. For example, the nature of an alliance
(licensing or co-development) may be an important factor in learning about the true quality of
a target. In the majority of alliance agreements, buyers assume full responsibility for the
development of R&D projects, in contrast to projects that are co-developed and in which
scientists from both companies collaborate closely and exchange information. Furthermore,
the study of Higgins and Rodriguez (2006) finds that target and acquiring firms have an
average of four alliances prior to acquisitions, which is considerably more alliances than are
observed in this study, where the average is approximately 1. Another important factor is
whether the preceding alliance is primary or secondary in nature.28
28
For example, on July 26, 2000, Immunex and Abgenix entered into a joint development and
commercialization agreement for ABX-EGF in Phase 1, created by Abgenix. On December 17, 2001, Amgen
acquired Immunex and thus inherited the ABX-EFG program. When Amgen acquired Abgenix on December 12,
2005, ABX-EFG was in the regulatory phase for colorectal cancer (primary indication) and in Phase 2 for other
cancers.
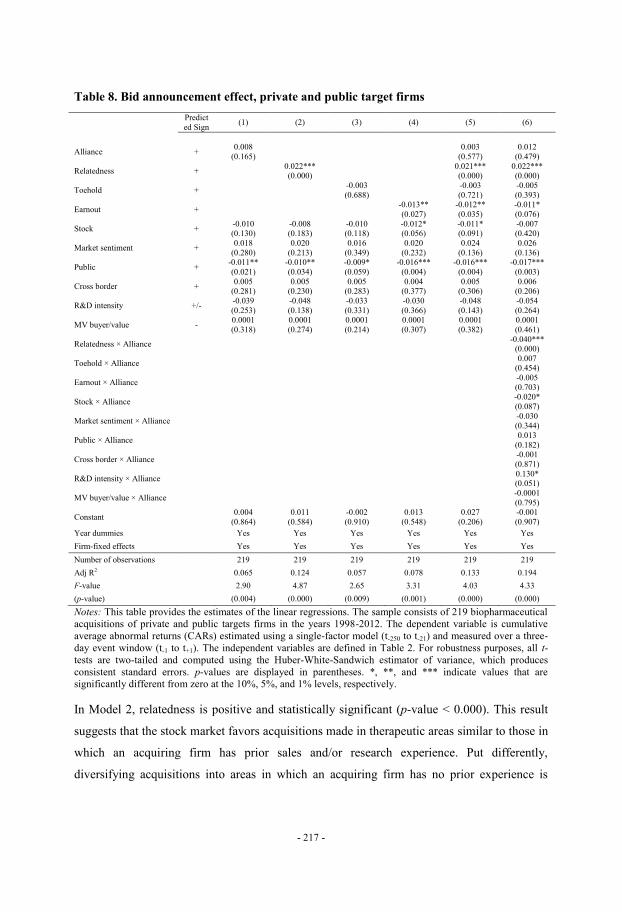
- 217 -
Table 8. Bid announcement effect, private and public target firms
Predict
ed Sign (1) (2) (3) (4) (5) (6)
Alliance + 0.008
(0.165)
0.003
(0.577)
0.012
(0.479)
Relatedness + 0.022*** (0.000)
0.021*** (0.000)
0.022*** (0.000)
Toehold + -0.003
(0.688)
-0.003
(0.721)
-0.005
(0.393)
Earnout + -0.013**
(0.027)
-0.012**
(0.035)
-0.011*
(0.076)
Stock + -0.010 (0.130)
-0.008 (0.183)
-0.010 (0.118)
-0.012* (0.056)
-0.011* (0.091)
-0.007 (0.420)
Market sentiment + 0.018
(0.280)
0.020
(0.213)
0.016
(0.349)
0.020
(0.232)
0.024
(0.136)
0.026
(0.136)
Public + -0.011**
(0.021)
-0.010**
(0.034)
-0.009*
(0.059)
-0.016***
(0.004)
-0.016***
(0.004)
-0.017***
(0.003)
Cross border + 0.005
(0.281) 0.005
(0.230) 0.005
(0.283) 0.004
(0.377) 0.005
(0.306) 0.006
(0.206)
R&D intensity +/- -0.039
(0.253)
-0.048
(0.138)
-0.033
(0.331)
-0.030
(0.366)
-0.048
(0.143)
-0.054
(0.264)
MV buyer/value - 0.0001
(0.318)
0.0001
(0.274)
0.0001
(0.214)
0.0001
(0.307)
0.0001
(0.382)
0.0001
(0.461)
Relatedness × Alliance -0.040***
(0.000)
Toehold × Alliance 0.007
(0.454)
Earnout × Alliance -0.005
(0.703)
Stock × Alliance -0.020*
(0.087)
Market sentiment × Alliance -0.030 (0.344)
Public × Alliance 0.013
(0.182)
Cross border × Alliance -0.001
(0.871)
R&D intensity × Alliance 0.130* (0.051)
MV buyer/value × Alliance -0.0001
(0.795)
Constant 0.004
(0.864)
0.011
(0.584)
-0.002
(0.910)
0.013
(0.548)
0.027
(0.206)
-0.001
(0.907)
Year dummies Yes Yes Yes Yes Yes Yes
Firm-fixed effects Yes Yes Yes Yes Yes Yes
Number of observations 219 219 219 219 219 219
Adj R2 0.065 0.124 0.057 0.078 0.133 0.194
F-value 2.90 4.87 2.65 3.31 4.03 4.33
(p-value) (0.004) (0.000) (0.009) (0.001) (0.000) (0.000)
Notes: This table provides the estimates of the linear regressions. The sample consists of 219 biopharmaceutical
acquisitions of private and public targets firms in the years 1998-2012. The dependent variable is cumulative
average abnormal returns (CARs) estimated using a single-factor model (t-250 to t-21) and measured over a three-
day event window (t-1 to t+1). The independent variables are defined in Table 2. For robustness purposes, all t-
tests are two-tailed and computed using the Huber-White-Sandwich estimator of variance, which produces
consistent standard errors. p-values are displayed in parentheses. *, **, and *** indicate values that are
significantly different from zero at the 10%, 5%, and 1% levels, respectively.
In Model 2, relatedness is positive and statistically significant (p-value < 0.000). This result
suggests that the stock market favors acquisitions made in therapeutic areas similar to those in
which an acquiring firm has prior sales and/or research experience. Put differently,
diversifying acquisitions into areas in which an acquiring firm has no prior experience is

- 218 -
negatively associated with bidder returns. This supports the view of Haeussler (2007) that
internal scientific capabilities are necessary for knowledge exploitation.
In Model 3, toehold investments are found to be statistically insignificant (p-value = 0.688).
The low proportion of prior toehold investments suggests that they are not an important factor
in bidder returns, a conclusion that is consistent with the findings of Mantecon (2009). In
Model 4, earnout is negative and statistically significant (p-value = 0.027). This result
contrasts that of Kohers and Ang (2000) and provides support for the view that earnout may
signal a high degree of market uncertainty (Bruner, 2002). Model 5 includes all test and
control variables, with results that are robust to prior specifications.
The main finding presented thus far is that there is no association between the alliance
variable and stock market reactions with respect to acquiring firms. Firms with prior alliances
that own shares in the target firm may deter other companies from acquiring the target firm.
To examine this issue, I constructed interaction variables using the independent variables and
the alliance dummy variable. The results are shown in Model 6. The interaction variable
between toehold and alliance is statistically insignificant, which implies that acquiring firms
with prior alliances and equity ownership in target firms do not necessarily bid from a
favorable position. Contrary to expectations, the interaction variable between alliance and
relatedness is negative and statistically significant (p-value < 0.000). One possible reason for
this variable is that the informed buyer is willing to pay more, even when the stock market
does not reward the purchase price.
The regressions were re-run for the sub-sample of public target firms. In this regression, I
included some additional variables that are available for public firms: relative size, bid
premium, and public firm age (Table 2 presents the variable definitions). Firms with prior
alliances with target firms tend to pay significantly higher bid premiums than firms without
prior alliances (86 versus 56 percent; untabulated). This result is consistent with the notion
that informed buyers are willing to pay more, whereas uninformed buyers require discounts.
The results, reported in Table 9, are similar to those for the overall sample. Although the
univariate analysis for public target firms in Panel B of Table 7 indicates that the difference
between the CARs of bidders with prior alliances and bidders without prior alliances is
statistically significant at the 10 percent level when controlling for relative size, bid premium,
and public firm age, the coefficient for the alliance variable is statistically insignificant (p-
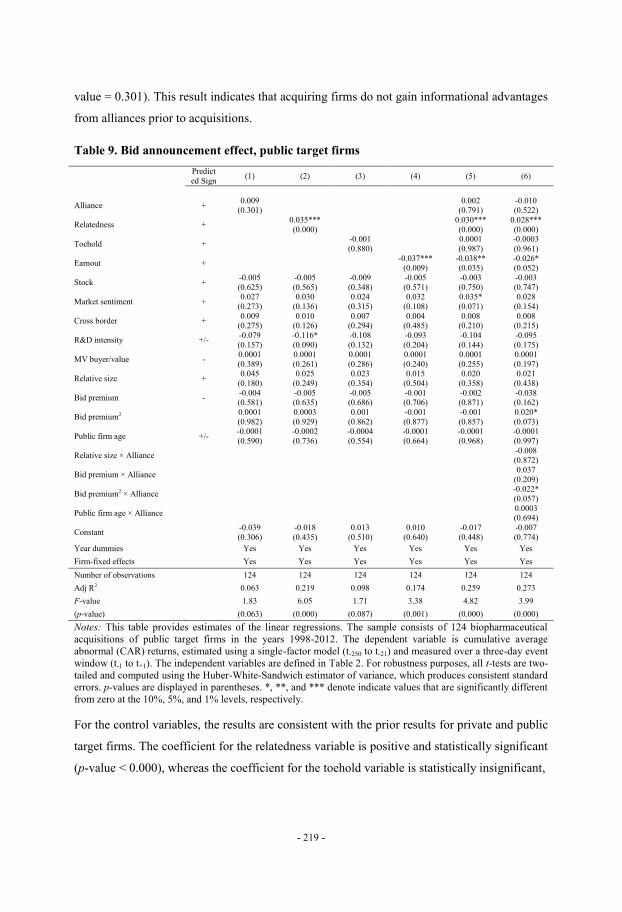
- 219 -
value = 0.301). This result indicates that acquiring firms do not gain informational advantages
from alliances prior to acquisitions.
Table 9. Bid announcement effect, public target firms
Predict
ed Sign (1) (2) (3) (4) (5) (6)
Alliance + 0.009
(0.301)
0.002 (0.791)
-0.010 (0.522)
Relatedness + 0.035***
(0.000)
0.030***
(0.000)
0.028***
(0.000)
Toehold + -0.001
(0.880)
0.0001
(0.987)
-0.0003
(0.961)
Earnout + -0.037***
(0.009) -0.038** (0.035)
-0.026* (0.052)
Stock + -0.005
(0.625)
-0.005
(0.565)
-0.009
(0.348)
-0.005
(0.571)
-0.003
(0.750)
-0.003
(0.747)
Market sentiment + 0.027
(0.273)
0.030
(0.136)
0.024
(0.315)
0.032
(0.108)
0.035*
(0.071)
0.028
(0.154)
Cross border + 0.009
(0.275) 0.010
(0.126) 0.007
(0.294) 0.004
(0.485) 0.008
(0.210) 0.008
(0.215)
R&D intensity +/- -0.079
(0.157)
-0.116*
(0.090)
-0.108
(0.132)
-0.093
(0.204)
-0.104
(0.144)
-0.095
(0.175)
MV buyer/value - 0.0001
(0.389)
0.0001
(0.261)
0.0001
(0.286)
0.0001
(0.240)
0.0001
(0.255)
0.0001
(0.197)
Relative size + 0.045
(0.180)
0.025
(0.249)
0.023
(0.354)
0.015
(0.504)
0.020
(0.358)
0.021
(0.438)
Bid premium - -0.004 (0.581)
-0.005 (0.635)
-0.005 (0.686)
-0.001 (0.706)
-0.002 (0.871)
-0.038 (0.162)
Bid premium2 0.0001
(0.982)
0.0003
(0.929)
0.001
(0.862)
-0.001
(0.877)
-0.001
(0.857)
0.020*
(0.073)
Public firm age +/- -0.0001
(0.590)
-0.0002
(0.736)
-0.0004
(0.554)
-0.0001
(0.664)
-0.0001
(0.968)
-0.0001
(0.997)
Relative size × Alliance -0.008 (0.872)
Bid premium × Alliance 0.037
(0.209)
Bid premium2 × Alliance -0.022*
(0.057)
Public firm age × Alliance 0.0003 (0.694)
Constant -0.039
(0.306)
-0.018
(0.435)
0.013
(0.510)
0.010
(0.640)
-0.017
(0.448)
-0.007
(0.774)
Year dummies Yes Yes Yes Yes Yes Yes
Firm-fixed effects Yes Yes Yes Yes Yes Yes
Number of observations 124 124 124 124 124 124
Adj R2 0.063 0.219 0.098 0.174 0.259 0.273
F-value 1.83 6.05 1.71 3.38 4.82 3.99
(p-value) (0.063) (0.000) (0.087) (0.001) (0.000) (0.000)
Notes: This table provides estimates of the linear regressions. The sample consists of 124 biopharmaceutical
acquisitions of public target firms in the years 1998-2012. The dependent variable is cumulative average
abnormal (CAR) returns, estimated using a single-factor model (t-250 to t-21) and measured over a three-day event
window (t-1 to t+1). The independent variables are defined in Table 2. For robustness purposes, all t-tests are two-
tailed and computed using the Huber-White-Sandwich estimator of variance, which produces consistent standard
errors. p-values are displayed in parentheses. *, **, and *** denote indicate values that are significantly different
from zero at the 10%, 5%, and 1% levels, respectively.
For the control variables, the results are consistent with the prior results for private and public
target firms. The coefficient for the relatedness variable is positive and statistically significant
(p-value < 0.000), whereas the coefficient for the toehold variable is statistically insignificant,
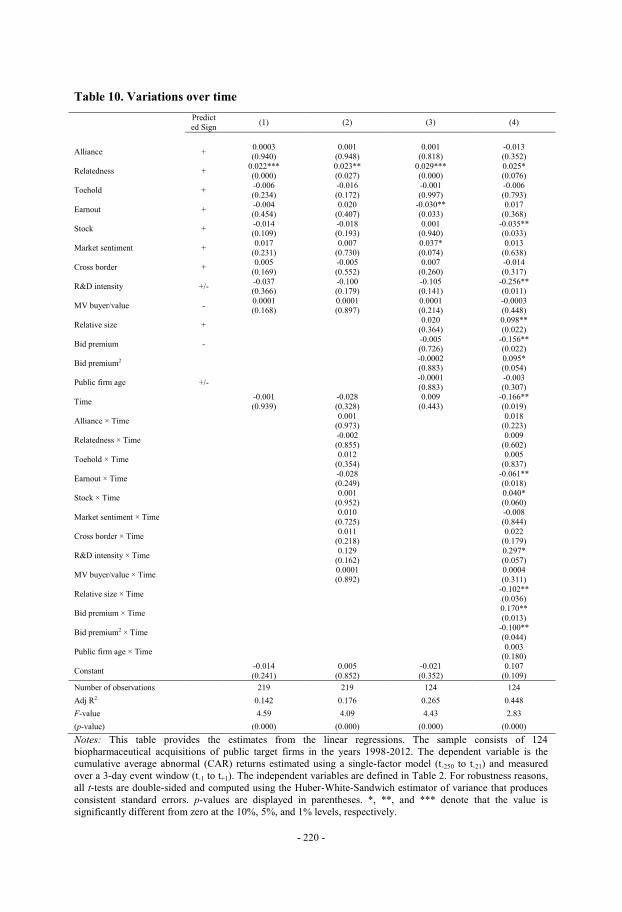
- 220 -
Table 10. Variations over time
Predict
ed Sign (1) (2) (3) (4)
Alliance + 0.0003
(0.940)
0.001
(0.948)
0.001
(0.818)
-0.013
(0.352)
Relatedness + 0.022*** (0.000)
0.023** (0.027)
0.029*** (0.000)
0.025* (0.076)
Toehold + -0.006
(0.234)
-0.016
(0.172)
-0.001
(0.997)
-0.006
(0.793)
Earnout + -0.004
(0.454)
0.020
(0.407)
-0.030**
(0.033)
0.017
(0.368)
Stock + -0.014 (0.109)
-0.018 (0.193)
0.001 (0.940)
-0.035** (0.033)
Market sentiment + 0.017
(0.231)
0.007
(0.730)
0.037*
(0.074)
0.013
(0.638)
Cross border + 0.005
(0.169)
-0.005
(0.552)
0.007
(0.260)
-0.014
(0.317)
R&D intensity +/- -0.037 (0.366)
-0.100 (0.179)
-0.105 (0.141)
-0.256** (0.011)
MV buyer/value - 0.0001
(0.168)
0.0001
(0.897)
0.0001
(0.214)
-0.0003
(0.448)
Relative size + 0.020
(0.364)
0.098**
(0.022)
Bid premium - -0.005 (0.726)
-0.156** (0.022)
Bid premium2 -0.0002 (0.883)
0.095* (0.054)
Public firm age +/- -0.0001
(0.883)
-0.003
(0.307)
Time -0.001
(0.939)
-0.028
(0.328)
0.009
(0.443)
-0.166**
(0.019)
Alliance × Time 0.001
(0.973)
0.018 (0.223)
Relatedness × Time -0.002
(0.855)
0.009
(0.602)
Toehold × Time 0.012
(0.354)
0.005
(0.837)
Earnout × Time -0.028 (0.249)
-0.061** (0.018)
Stock × Time 0.001
(0.952)
0.040*
(0.060)
Market sentiment × Time 0.010
(0.725)
-0.008
(0.844)
Cross border × Time 0.011
(0.218)
0.022 (0.179)
R&D intensity × Time 0.129
(0.162)
0.297*
(0.057)
MV buyer/value × Time 0.0001
(0.892)
0.0004
(0.311)
Relative size × Time -0.102** (0.036)
Bid premium × Time 0.170**
(0.013)
Bid premium2 × Time -0.100**
(0.044)
Public firm age × Time 0.003
(0.180)
Constant -0.014
(0.241)
0.005
(0.852)
-0.021
(0.352)
0.107
(0.109)
Number of observations 219 219 124 124
Adj R2 0.142 0.176 0.265 0.448
F-value 4.59 4.09 4.43 2.83
(p-value) (0.000) (0.000) (0.000) (0.000)
Notes: This table provides the estimates from the linear regressions. The sample consists of 124
biopharmaceutical acquisitions of public target firms in the years 1998-2012. The dependent variable is the
cumulative average abnormal (CAR) returns estimated using a single-factor model (t-250 to t-21) and measured
over a 3-day event window (t-1 to t+1). The independent variables are defined in Table 2. For robustness reasons,
all t-tests are double-sided and computed using the Huber-White-Sandwich estimator of variance that produces
consistent standard errors. p-values are displayed in parentheses. *, **, and *** denote that the value is
significantly different from zero at the 10%, 5%, and 1% levels, respectively.
- 221 -
and the coefficient for the earnout variable remains negative and statistically significant (p-
value = 0.009). For public firms, I included the bid premium (Travlos, 1987) and bid premium
squared to examine whether there is a positive relationship between bidders and target returns
up to a threshold. Contrary to expectations, the coefficient for bid premium squared is
statistically insignificant, which indicates that there is no non-linear relationship between
bidder returns and takeover premiums. However, in Model 6, the interaction between bid
premium and alliance is statistically insignificant, whereas the interaction between bid
premium squared and alliance is negative and statistically significant. This indicates that there
is a non-linear relationship between bidder returns and takeover premiums when acquisitions
are preceded by alliances.
Due to the significant increase in the number of alliances and acquisitions in the 2005-2012
period compared with the 1998-2004 period, I examined whether the results are robust to
different time periods. The results are displayed in Table 10. Models 3 and 4 specify the same
regressions for public firms but with four additional control variables included. For the
sample of public and private firms, the time variable is statistically insignificant in Models 1
and 2, which indicates that returns to acquiring firms did not change over time. The
interaction between alliance and time is statistically insignificant in both Models 2 and 4,
which indicates that there is no change between the two time periods.
4.6 Post-acquisition R&D performance
The findings of the first section suggest that acquiring firms cannot exploit informational
advantages from alliances with target firms prior to acquisitions.29
It is therefore interesting to
evaluate the long-term impact on R&D performance of the interaction between alliances and
acquisitions. If an alliance with a target firm provides the acquiring firm with an
informational advantage, i.e., mitigates information asymmetry, then R&D projects that are
co-developed prior to acquisition should be more likely to advance to subsequent stages of
development than should projects that are not preceded by such alliances.
I performed five separate logit regressions for R&D projects that were in the preclinical stage,
Phase 1, Phase 2, Phase 3 and the regulatory phase. The dependent variable takes a value of 1
if an R&D project successfully completes a trial and moves to the next stage and zero
otherwise. A positive and statistically significant coefficient for β1 is consistent with the view
29
A potential limitation of the short-term event study methodology is that the likelihood of acquisition of a target
firm is already incorporated into the stock price at the time of the announcement.
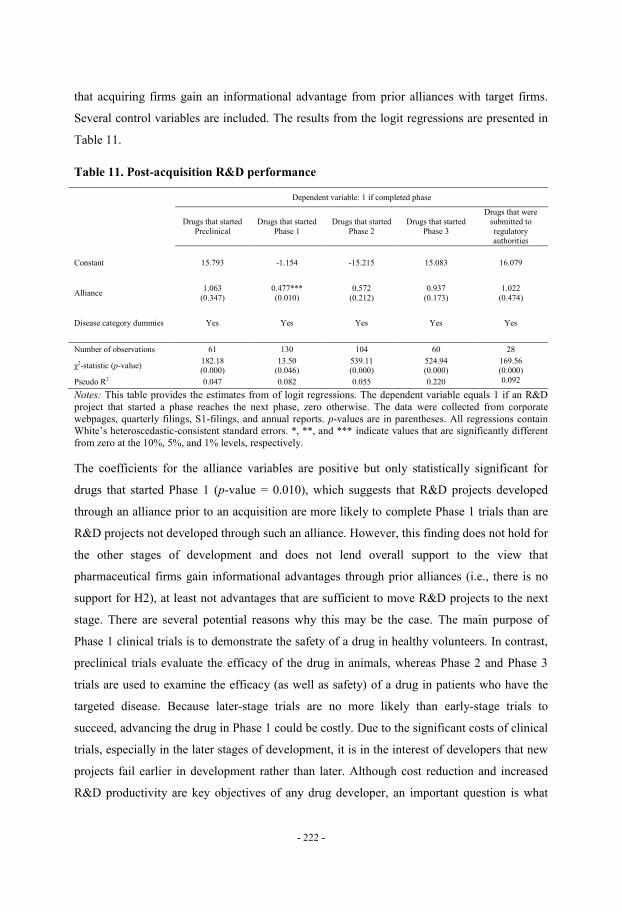
- 222 -
that acquiring firms gain an informational advantage from prior alliances with target firms.
Several control variables are included. The results from the logit regressions are presented in
Table 11.
Table 11. Post-acquisition R&D performance
Dependent variable: 1 if completed phase
Drugs that started
Preclinical
Drugs that started
Phase 1
Drugs that started
Phase 2
Drugs that started
Phase 3
Drugs that were
submitted to
regulatory authorities
Constant 15.793 -1.154 -15.215 15.083 16.079
Alliance 1.063
(0.347)
0.477***
(0.010)
0.572
(0.212)
0.937
(0.173)
1.022
(0.474)
Disease category dummies Yes Yes Yes Yes Yes
Number of observations 61 130 104 60 28
χ2-statistic (p-value) 182.18 (0.000)
13.50 (0.046)
539.11 (0.000)
524.94 (0.000)
169.56 (0.000)
Pseudo R2 0.047 0.082 0.055 0.220 0.092
Notes: This table provides the estimates from of logit regressions. The dependent variable equals 1 if an R&D
project that started a phase reaches the next phase, zero otherwise. The data were collected from corporate
webpages, quarterly filings, S1-filings, and annual reports. p-values are in parentheses. All regressions contain
White’s heteroscedastic-consistent standard errors. *, **, and *** indicate values that are significantly different
from zero at the 10%, 5%, and 1% levels, respectively.
The coefficients for the alliance variables are positive but only statistically significant for
drugs that started Phase 1 (p-value = 0.010), which suggests that R&D projects developed
through an alliance prior to an acquisition are more likely to complete Phase 1 trials than are
R&D projects not developed through such an alliance. However, this finding does not hold for
the other stages of development and does not lend overall support to the view that
pharmaceutical firms gain informational advantages through prior alliances (i.e., there is no
support for H2), at least not advantages that are sufficient to move R&D projects to the next
stage. There are several potential reasons why this may be the case. The main purpose of
Phase 1 clinical trials is to demonstrate the safety of a drug in healthy volunteers. In contrast,
preclinical trials evaluate the efficacy of the drug in animals, whereas Phase 2 and Phase 3
trials are used to examine the efficacy (as well as safety) of a drug in patients who have the
targeted disease. Because later-stage trials are no more likely than early-stage trials to
succeed, advancing the drug in Phase 1 could be costly. Due to the significant costs of clinical
trials, especially in the later stages of development, it is in the interest of developers that new
projects fail earlier in development rather than later. Although cost reduction and increased
R&D productivity are key objectives of any drug developer, an important question is what
- 223 -
organizational and strategic factors affect decision-making regarding advancement of a
project to the next stage and the role of alliances.
Target firms generally have several R&D projects in different stages of development at a
given time. In press releases announcing corporate acquisitions, acquiring firms generally
state the acquisition motive and list the key R&D projects of the target firm. In untabulated
tests, I included a dummy for R&D projects mentioned in press releases because non-core
projects have a greater likelihood of being terminated or sold for strategic reasons. The
dummy variable is statistically insignificant.
In summary, the results of this study indicate that acquiring firms do not gain an informational
advantage from prior alliances and that several factors may play a role in the process of
learning about the quality of target firms. For example, the nature of an alliance (e.g., whether
scientists of both companies collaborate closely and exchange information or whether
licensees assume full responsibility for development) and the number of alliances with a
target firm may be important factors in learning about the true quality of a target. A closely
related strand of research relates to the allocation of property rights. Aghion and Tirole (1994)
argue that property rights (e.g., responsibility for the management of clinical trials) should be
assigned to the R&D firm when the marginal impact of its activities on the product’s value
exceeds the marginal impact of the licensing firm’s financial investment. Lerner and Merges
(1998) empirically examine the allocation of property rights in biotech-pharmaceutical
alliances and find evidence that biotech firms with more financial resources retain relatively
large shares of property rights, which is consistent with the efficient allocation of rights.
However, Lerner et al. (2003) find that deals signed during periods when it is difficult for
biotechnology firms to raise private or public equity capital assign more property rights to
licensees (usually pharmaceutical firms) and that these alliances are less likely to lead to the
development of drugs approved by the FDA. Nicholson et al. (2006) suggest that this
inefficiency in the allocation of rights most likely results from imperfections in the market for
biotechnology deals.
It is important to note that although the likelihood of advancing R&D projects, except in cases
of drugs that started Phase 1, is not associated with prior alliances with target firms, there are
other potential advantages of establishing an alliance with a target firm. With respect to
information asymmetry, a prior alliance with a target firm could place an acquiring firm in an
advantageous negotiating position. For example, if the acquiring firm already has an alliance
- 224 -
with a target firm, that may deter other buyers from bidding because the contractual cash flow
rights that are granted to the alliance partner often place a cap on the upside of the equity
value of a small company (Ozmel et al., 2012).30
5. Conclusions
This paper has examined whether an acquirer’s prior alliance with a target firm is positively
associated with short-term stock market reactions to acquisition announcements as well as the
real post-acquisition operating performances of firms. Empirical data were gathered from a
sample of 219 biopharmaceutical acquisitions that occurred between 1998 and 2012, with a
collective transaction value of $306 billion. The paper documents that returns to bidders are
essentially zero, whereas target shareholders gain significantly more.
The main finding of this study is that there is no association between acquirers’ prior alliances
with target firms and short- or long-term performance. Using the event study methodology, I
do not find support for the hypothesis that establishing alliances with target firms prior to
acquisitions is associated with positive bidder returns, which indicates that acquiring firms do
not gain informational advantages from prior alliances. This result contrasts those of several
prior studies in the acquisition literature (e.g., Chan et al., 1997; Porrini, 2004; Higgins and
Rodriguez, 2006; Mantecon, 2009), which may indicate that several factors affect the process
of learning about the quality of a target firm. For example, the nature of an alliance (whether
scientists of both companies collaborate closely and exchange information or whether the
licensee assumes full responsibility for development), the number of alliances with a target
firm and whether an alliance was inherited from an acquisition of another company may
affect the process of learning about the true quality of a target.
An alternative to the short-term event study methodology would be to examine long-term
operating performance in the post-acquisition period and its association with alliances. Such
an approach provides an opportunity to directly examine the real performance of individual
30
An example is Glaxosmithkline’s acquisition of Human Genome Sciences. On April 19, 2012, the British
pharmaceutical company GlaxoSmithKline (GSK) announced an unsolicited offer of $2.6 billion for Human
Genome Sciences (HGS), representing an 81 percent premium over its closing stock price of $7.17 on April 18.
GSK had been in partnership with HGS since 1993, and these companies were already collaborating on a
number of projects, including the lupus drug Benlysta, while also promising experimental drugs for heart disease
and diabetes. GSK chief executive Andrew Witty wrote to HGS in a public letter, saying he was prepared to
commence a cash tender offer with no financing or due diligence conditions. Although other potential bidders
were rumored, no other bidders emerged in the bidding process.
- 225 -
R&D projects at the project level rather than the firm level. Using a hand-collected dataset of
383 R&D projects in the post-acquisition period, I found that R&D projects that are co-
developed prior to acquisitions are no more likely to advance than R&D projects not preceded
by alliances, which indicates that acquiring firms do not gain informational advantages from
alliances.
Consistent with the view that informed buyers are willing to pay higher premiums than
uninformed buyers, who require discounts to compensate for their informational
disadvantages, this study documents that acquiring firms with prior alliances with target firms
are likely to pay significantly higher premiums than firms without such alliances (86 versus
56 percent). This finding raises the question of a potential winner’s curse in the
biopharmaceutical industry and may indicate that learning opportunities do not enable bidders
to avoid the winner’s curse (Ball et al., 1991). Although an alliance provides an opportunity
for an acquiring firm to learn more about the quality of the asset and mitigate its informational
disadvantages (e.g., Nanda and Williamson, 1995; Mantecon and Chatfield, 2007), it may not
eliminate problems associated with information asymmetry.
The results of this study have implications for the acquisition strategies of pharmaceutical
firms. Further research should examine situations in which alliances are an alternative to
acquisitions and situations in which they are complementary. Additional research topics could
include the determinants of significant bid premiums and whether there is a winner’s curse in
the biopharmaceutical industry.
References
Aboody, D., Lev, B., 2000. Information Asymmetry, R&D and Insider Gains. Journal of
Finance 55, 2747-2766.
Aghion, P., Tirole, J., 1994. On the management of innovation. Quarterly Journal of
Economics 109, 1185-1207.
Agrawal, A., Jaffe, J.F., Mandelker, G.N., 1992. The post-merger performance of acquiring
firms: a re-examination of an anomaly. Journal of Finance 47, 1605-1621.
Akerlof, G. A., 1970. Market for lemons: quality uncertainty and market mechanism.
Quarterly Journal of Economics 84, 488-500.

- 226 -
Akhigbe, A., Martin, A. D., Whyte, A. M., 2007. Partial acquisitions, the acquisition
probability hypothesis, and the abnormal returns to partial targets. Journal of Banking and
Finance 24, 3080–3101.
Amir, E., Lev, B., 1996. Value-relevance of nonfinancial information: The wireless
communications industry. Journal of Accounting and Economics 22, 3-30.
Balakrishnan, S., Koza, M. P., 1993. Information asymmetry, adverse selection, and joint
ventures. Journal of Economic Behavior and Organization 20, 99-117.
Ball, S., Bazerman, M., Carroll, J., 1991. An evaluation of learning in a bilateral winner’s
curse. Organizational Behavior and Human Decision Processes 48, 1-22.
Bazerman, M., Samuelson, W., 1983. I won the auction but don’t want the prize. Journal of
Conflict Resolution 27, 618-634.
Betton, S., Eckbo, E. B., 2000. Bid jumps, and expected payoffs in takeovers. Review of
Financial Studies 13, 841–882.
Brown, S., Warner, J., 1985. Using daily stock returns: the case of event studies. Journal of
Financial Economics 14, 3-31.
Bruner, R., 2002. Does M&A pay? A survey of evidence for the decision-maker. Journal of
Applied Finance 12, 48-68.
Campbell, J., Lo, A., MacKinlay, A., 1997. The econometrics of financial markets. Princeton:
Princeton University Press.
Chan, S., Kensinger, J., Keown, A., Martin, J., 1997. Do strategic alliances create value?
Journal of Financial Economics 46, 199-221.
Chowdry, B., Jegadeesh, N., 1994. Pre-tender offer share acquisition strategy in takeovers.
Journal of Financial and Quantitative Analysis 29, 117–129.
Cockburn, I., 2006. Is the pharmaceutical industry in a productivity crisis? In: Innovation
Policy and the Economy, eds. A. Jaffe, J. Lerner, and S. Stern, 1-32. Cambridge, MA: MIT
Press.
Coff, R. W., 1999. How buyers cope with uncertainty when acquiring firms in knowledge-
intensive industries: caveat emptor. Organization Science 10, 144-161.
- 227 -
Danzon, P., Epstein, A., Nicholson, S., 2007. Mergers and acquisitions in the pharmaceutical
and biotech industries. Managerial and Decision Economics 28, 307-328.
DiMasi, J. A., Hansen, R. W., Grabowski, H. G., 2003. The price of innovation: new
estimates of drug development costs. Journal of Health Economics 22, 151-185.
DiMasi, J. A., Grabowski, H. G., 2007. The cost of biopharmaceutical R&D: is biotech
different? Managerial and Decision Economics 28, 469-479.
Eckbo, B. E., Giammarino, R. M., Heinkel, R. L., 1990. Asymmetric information and the
medium of exhange in takeovers: Theory and tests. Review of Financial Studies 3, 651-675.
Eckbo, B. E., 2009. Bidding strategies and takeover premiums: A review. Journal of
Corporate Finance 15, 149-178.
Ely, K., Simko, P. J., Thomas, L. G., 2003. The usefulness of biotechnology firms: Drug
development status in the evaluation of research and development costs. Journal of
Accounting, Auditing and Finance 18, 163-196.
Fama, E., 1970. Efficient capital markets: a review of theory and empirical work. Journal of
Finance 25, 383-417.
Fazeli, M. S., 2004. 2003: What lessons for European biotechnology? Journal of Commercial
Biotechnology 10, 304-311.
Fowler, K. L., Schmidt, D. R., 1989. Determinants of tender offer post-acquisition financial
performance. Strategic Management Journal 10, 339-350.
Grabowski, H., 2007. Competition between generic and branded drugs. In Pharmaceutical
Innovation: Incentives, Competition, and Cost-Benefit Analysis in International Perspective,
eds. F.A. Sloan and C.-R. Heish, 153-173. Cambridge, UK: Cambridge University Press.
Grabowski, H., 2011. The evolution of the pharmaceutical industry over the past 50 years: a
personal reflection. International Journal of the Economics of Business 18, 161-176.
Grabowski, H., Kyle, M., 2008. The economics of corporate governance and mergers. Edward
Elgar Publishing Limited, Northampton, MA.
Haeussler, C., 2007. Proactive versus reactive M&A activities in the biotechnology industry.
Journal of High Technology Management Research 17, 109-123.
- 228 -
Haleblian, J., Finkelstein, S, 1999. The influence of organization acquisition hisotry on
acquisition performance: A behavioral learning perspective. Administrative Science Quarterly
44, 29-56.
Hall, B. H., 2002. The financing of research and development. Oxford Review of Economic
Policy 18, 35-51.
Hall, B. H., Lerner, J., 2009. The financing of R&D and innovation. NBER Working paper no.
w15325, 1-55.
Hassan, M., Patro, D. K., Tuckman, H., Wang, X., 2007. Do mergers and acquisitions create
shareholder wealth in the pharmaceutical industry? International Journal of Pharmaceutical
and Healthcare Marketing 1, 58-78.
Hayward, M. L. A., 2002. When do firms learn from their acquisition experience? Evidence
from 1990-1995. Strategic Management Journal 23, 21-39.
Healy, P. M., Palepu, K. G., Ruback, R. S., 1992. Does corporate performance improve after
mergers? Journal of Financial Economics 31, 135-175.
Higgins, M. J., Rodriguez, D., 2006. The outsourcing of R&D through acquisitions in the
pharmaceutical industry. Journal of Financial Economics 80, 351-383.
Himmelberg, C. P., Petersen, B. C., 1994. R&D and internal finance: a panel study of small
firms in high-tech industries. Review of Economics and Statistics 76, 38-51.
Hitt, M. A., Hoskisson, R. E., Ireland, R. D., Harrison, J. S., 1991. Effects of acquisitions on
R&D inputs and outputs. Academy of Management Journal 34, 693-706.
Houston, J.F., Ryngaert, M.D., 1994. The overall gains from large bank mergers. Journal of
Banking and Finance 18, 1155-1176.
Huang, Y-S., Walkling, R. A., 1987. Target abnormal returns associated with acquisition
announcements: Payment, acquisition form, and managerial resistance. Journal of Financial
Economics 19, 329-349.
Jensen, M. C., Ruback, R. S., 1983. The market for corporate control: The scientific evidence.
Journal of Financial Economics 11, 5-50.
Knight, F., 1921. Risk, uncertainty and profit. New York: Houghton Mifflin company.

- 229 -
Koenig, M., Mezick, E., 2004. Impact of mergers and acquisitions on research productivity
within the pharmaceutical industry. Scientometrics 59, 157-169.
Kohers, N., Ang, J., 2000. Earnouts in mergers: agreeing to disagree and agreeing to stay.
Journal of Business 73, 445-476.
Kola, I, Landis, J., 2004. Can the pharmaceutical industry reduce attrition rates? Nature
Reviews of Drug Discovery 3, 711-715.
Leland, H. E., Pyle, D. H., 1977. Informational asymmetries, financial structure, and financial
intermediation. Journal of Finance 32, 371-387.
Lerner, J., Merges, R. P., 1998. The control of technological alliances: An empirical analysis of
the biotechnology industry. Journal of Industrial Economics 46, 125-156.
Lerner, J., Shane, H., Tsai, A., 2003. Do equity financing cycles matter? Evidence from
biotechnology alliances. Journal of Financial Economics 67, 411-446.
Loughran, T. and Vijh, A.M., 1997. Do long-term shareholders benefit from corporate
acquisitions. Journal of Finance 52, 1765-1790.
Lubatkin, M., 1983. Mergers and the performance of the acquiring firm. Academy of
Management Review 8, 218-225.
Mantecon, T., 2009. Mitigating risks in cross-border acquisitions. Journal of Banking and
Finance 33, 640-651.
Mantecon, T., Chatfield, R., 2007. An analysis of the disposition of assets in a joint venture.
Journal of Banking and Finance 31, 31, 2591-2611.
Martynova, M., Renneboog, L., 2008. A century of corporate takeovers: What have we
learned and where do we stand? Journal of Banking and Finance 32, 2148-2177.
Moeller, S. B., Schlingemann, F. P., 2005. Global diversification and bidder gains: a
comparison between cross-border and domestic acquisitions. Journal of Banking and Finance
29, 533–564.
Myers, S., Majluf, N., 1984. Corporate financing and investment decisions when firms have
information that investors do not have. Journal of Financial Economics 13, 187-221.

- 230 -
Nanda, A., Williamson, J., 1995. Use of joint ventures to ease the pain of structuring. Harvard
Business Review Nov-Dec, 119-128.
Nicholson, S., Danzon, P. M., McCullough, J., 2005. Biotech-pharmaceutical alliances as a
signal of asset and firm quality. Journal of Business 78, 1433-1464.
Ozmel, U., Robinson, D. T., Stuart, T. E., 2013. Strategic alliances, venture capital, and exit
decisions in early stage high-tech firms. Journal of Financial Economics 41, 655-670.
Pisano, G., 1991. The governance of innovation: vertical integration and collaborative
arrangements in the biotechnology industry. Research Policy 20, 237-249.
Pisano, G., 1997. R&D performance, collaborative arrangements, and the market-for-know-
how: A test of the “lemons” hypothesis in biotechnology. Harvard Business School,
Cambridge, MA, mimeo.
Porrini, P., 2004. Can a previous alliance between an acquirer and a target affect acquisition
performance? Journal of Management 30, 545-562.
Ravenscraft, D. J., Long, W. F., 2000. Paths to creating value in pharmaceutical mergers.
Mergers and Productivity. Chicago: University of Chicago Press.
Reuer, J. J., 2005. Avoiding lemons in M&A deals. MIT Sloan Management Review 46, 15-
17.
Reuer, J. J., Koza, M., 2000. Asymmetric information and joint venture performance: Theory
and evidence for domestic and international joint ventures. Strategic Management Journal 21,
81-88.
Reuer, J. J., Shenkar, O., Ragozzino, R., 2004. Mitigating risk in international mergers and
acquisitions: the role of contingent payouts. Journal of International Business Studies 35, 19–
32.
Rodriguez, D., Higgins, M., 2003. Growth or gluttony: binge acquisitions in the US software
industry. Unpublished working paper. Georgia Institute of Technology, Atlanta, GA.
Sharpe, W.F., Alexander, G., Bailey, J.V., 1999. Investments. Prentice-Hall, Upper Saddle
River, NJ.

- 231 -
Stulz, R. M., Walkling, R. A., Song, M.H., 1990. The distribution of target ownership and the
division of gains in successful takeovers. Journal of Finance 45, 817-833.
Travlos, N. G., 1987. Corporate takeover bids, methods of payment, and bidding firms’ stock
returns. Journal of Finance 42, 943-963.
Zollo, M., Singh, H., 1998. The impact of knowledge codification, experience trajectories and
integration strategies on the performance of corporate acquisitions. Academy of Management
Proceedings, L1-10.