Embed Size (px)
Citation preview

Essays on innovation, productivity and knowledge flows: evidence for Spanish firms
Esther Goya Carrillo
ADVERTIMENT. La consulta d’aquesta tesi queda condicionada a l’acceptació de les següents condicions d'ús: La difusió d’aquesta tesi per mitjà del servei TDX (www.tdx.cat) i a través del Dipòsit Digital de la UB (diposit.ub.edu) ha estat autoritzada pels titulars dels drets de propietat intel·lectual únicament per a usos privats emmarcats en activitats d’investigació i docència. No s’autoritza la seva reproducció amb finalitats de lucre ni la seva difusió i posada a disposició des d’un lloc aliè al servei TDX ni al Dipòsit Digital de la UB. No s’autoritza la presentació del seu contingut en una finestra o marc aliè a TDX o al Dipòsit Digital de la UB (framing). Aquesta reserva de drets afecta tant al resum de presentació de la tesi com als seus continguts. En la utilització o cita de parts de la tesi és obligat indicar el nom de la persona autora. ADVERTENCIA. La consulta de esta tesis queda condicionada a la aceptación de las siguientes condiciones de uso: La difusión de esta tesis por medio del servicio TDR (www.tdx.cat) y a través del Repositorio Digital de la UB (diposit.ub.edu) ha sido autorizada por los titulares de los derechos de propiedad intelectual únicamente para usos privados enmarcados en actividades de investigación y docencia. No se autoriza su reproducción con finalidades de lucro ni su difusión y puesta a disposición desde un sitio ajeno al servicio TDR o al Repositorio Digital de la UB. No se autoriza la presentación de su contenido en una ventana o marco ajeno a TDR o al Repositorio Digital de la UB (framing). Esta reserva de derechos afecta tanto al resumen de presentación de la tesis como a sus contenidos. En la utilización o cita de partes de la tesis es obligado indicar el nombre de la persona autora. WARNING. On having consulted this thesis you’re accepting the following use conditions: Spreading this thesis by the TDX (www.tdx.cat) service and by the UB Digital Repository (diposit.ub.edu) has been authorized by the titular of the intellectual property rights only for private uses placed in investigation and teaching activities. Reproduction with lucrative aims is not authorized nor its spreading and availability from a site foreign to the TDX service or to the UB Digital Repository. Introducing its content in a window or frame foreign to the TDX service or to the UB Digital Repository is not authorized (framing). Those rights affect to the presentation summary of the thesis as well as to its contents. In the using or citation of parts of the thesis it’s obliged to indicate the name of the author.

Department of Econometrics, Statistics and Spanish Economy
Faculty of Economics and Business
University of Barcelona
ESSAYS ON INNOVATION, PRODUCTIVITY AND
KNOWLEDGE FLOWS: EVIDENCE FOR SPANISH FIRMS
Esther Goya Carrillo
Supervisors: Dr. Esther Vayá Valcarce and Dr. Jordi Suriñach Caralt
Ph.D. Dissertation
Ph.D. program in Statistics
January 2015


To my family


v
Acknowledgments
At this moment of my life, I feel happy and very lucky. During these years,
many wonderful people and opportunities have surrounded me. This is the
moment where I express my gratitude to everyone who has been there to
help and support me.
Above all, I would like to thank my supervisors, because without them this
thesis would have never seen the light of day. Firstly, I am very grateful to
Jordi Suriñach for introducing me into the “world of research” and for the
trust he placed in me from the beginning. Certainly, his guidance, support
and encouraging words have helped me throughout the course of this thesis.
Secondly, I am indebted to Esther Vayá for her dedication and total
commitment with this thesis. She has been a tremendous mentor for me. I
am completely sure that without her I would never have finished this thesis
and I am truly and deeply grateful to you, Esther, for having been “the best
supervisor ever!”.
I am thankful to the Catalan Government for their financial assistance and
to the Department of Econometrics, Statistics and Spanish Economy for its
support. In addition, I am very grateful to the AQR Research Group for
giving me the opportunity to be part of it, in addition to the assistance I
received during these years. I want to express my gratitude to everyone who
kindly gave me advice and support at some point, in particular, Raul Ramos,
Vicente Royuela, Enrique López-Bazo, Elisabeth Motellón, Rosina Moreno
and Bibiana Barnadas.
In addition, I express my sincere gratitude to my colleagues at the
University for the great moments that we shared and all the fun we had. A

vi
special mention goes to Ernest Miguélez, for the great time we spent in
room 100, and Erika Badillo, for listening to me when needed, but more
importantly, for her friendship. I could not have wished for better office-
mates.
On the other hand, I appreciate all the support from the University of
Reading and my host Professor Uma Kambhampati during my visit. It was
a pleasure to meet such a lovely people, especially in the Graduate School.
It would not have been the same without them.
I also would like to express my gratitude to my friends for their support and
cheered me up when I needed it most. I am especially grateful to Sandra
Nieto, with whom I started this adventure and share a strong friendship. For
her affection and moral support, “thank you”.
Lastly, my most sincere and biggest thank you is reserved for the most
important people in my life, my family. To my mother, Raquel and Pablo
for their unconditional love. For believing in me and always being there.
For much more than I can write here, “moltes gràcies”.

vii
Contents List of Tables ............................................................................................ xi
List of Figures.......................................................................................... xii
Chapter 1: General framework and outline of the thesis ................ 1
1.1 Introduction and motivation .............................................................3
1.2 General background ..........................................................................7
1.3 Outline of the thesis and research questions...................................11
Chapter 2: Data ............................................................................................... 15
2.1 The Technological Innovation Panel (PITEC) ...............................17
2.2 Innovation and productivity............................................................22
2.2.1 How to measure innovation and productivity with PITEC .....23
2.2.2 Evidence for the period 2004-2011 .........................................26
Chapter 3: R&D, firm performance and spillovers.......................... 33
3.1 Introduction.....................................................................................35
3.2 What do we know so far? ...............................................................40
3.3 Model and estimation strategy ........................................................45
3.3.1 Olley & Pakes (1996) estimator...............................................48
3.4 Data and variables ..........................................................................51
3.4.1 Dependent variable ..................................................................52
3.4.2 Independent variables ..............................................................52
3.5 Results.............................................................................................56
3.5.1 Descriptive analysis .................................................................56
3.5.2 Empirical results ......................................................................59
3.6 Further explorations ........................................................................64
3.7 Concluding remarks ........................................................................65
Chapter 4: The importance of spillovers using the CDM model 69
4.1 Introduction.....................................................................................71
4.2 What do we know so far? ...............................................................73
4.3 Model and estimation strategy ........................................................77
4.3.1 First stage: The research equations ..........................................78

viii
4.3.2 Second stage: The innovation equation ...................................80
4.3.3 Third stage: The productivity equation ....................................81
4.4 Data and variables ..........................................................................82
4.4.1 First stage .................................................................................85
4.4.2 Second stage ............................................................................88
4.4.3 Third stage ...............................................................................89
4.5 Results.............................................................................................91
4.5.1 Descriptive analysis .................................................................91
4.5.2 Estimation results .....................................................................94
4.6 Concluding remarks ......................................................................103
Chapter 5: How important are internal knowledge flows for firm’s innovative performance? ................................................................ 107
5.1 Introduction...................................................................................109
5.2 What do we know so far? .............................................................112
5.2.1 Voluntary knowledge flows ...................................................112
5.2.2 Involuntary knowledge flows ................................................114
5.2.3 The role of absorptive capacity ..............................................115
5.3 Model and estimation strategy ......................................................117
5.4 Data and variables ........................................................................119
5.4.1 Dependent variable: Innovation performance .......................120
5.4.2 Independent variables ............................................................120
5.5 Results...........................................................................................125
5.5.1 Descriptive analysis ...............................................................125
5.5.2 Estimation results ...................................................................128
5.6 Further Explorations .....................................................................132
5.6.1 Alternative measure of involuntary knowledge flows ...........132
5.6.2 Absorptive capacity as a discrete measure ............................135
5.6.3 Alternative measure for Absorptive Capacity: Personnel in R&D....................................................................................................137
5.6.4 Is the degree of novelty in the innovation important? ...........139
5.7 Concluding remarks ......................................................................142

ix
Chapter 6: General conclusions............................................................. 145
6.1 Summary and policy implications ................................................147
6.2 Limitations and future research ....................................................153
Appendices 157
References 167

x
xi
List of Tables
Table 1.1 Real GDP and employment (annual growth rates) ........................5
Table 2.1 Industry classification according to technological intensity ........20
Table 2.2 Innovation activities .....................................................................24
Table 2.3 Evolution of innovation 2004-2011 (in %) ..................................26
Table 3.1 Descriptive statistics by technology level ....................................58
Table 3.2 OP estimates. Estimation results of Equation [3.4] 2004-2009. Dependent variable: ln(sales). ......................................................................61
Table 3.3 OP estimates. Estimation results of Equation [3.4] 2004-2009. Dependent variable: ln(sales). ......................................................................65
Table 4.1 Definition of variables .................................................................83
Table 4.2 Descriptive statistics ....................................................................92
Table 4.3 Research Equations (2004-2010) .................................................96
Table 4.4 Innovation Equation (2007-2010) ................................................99
Table 4.5 Productivity Equation (2007-2010) ...........................................102
Table 5.1 Definition of variables ...............................................................124
Table 5.2 Descriptive statistics for innovative firms .................................126
Table 5.3 Estimates of Equation [5.5] using Wooldridge (1995) consistent estimator for panel data with sample selection. PITEC 2004-2011...........131
Table 5.4 Estimates of Equation [5.5] using Wooldridge (1995) consistent estimator for panel data with sample selection. PITEC 2004-2011. Alternative definition for involuntary spillovers. ......................................134
Table 5.5 Estimates of Equation [5.5] using Wooldridge (1995) consistent estimator for panel data with sample selection. PITEC 2004-2011. Dummy variables to proxy absorptive capacity. ......................................................136
Table 5.6 Estimates of Equation [5.5] using Wooldridge (1995) consistent estimator for panel data with sample selection. PITEC 2004-2011. Alternative definition of absorptive capacity. ............................................138
Table 5.7 Estimates of Equation [5.5] using Wooldridge (1995) consistent estimator for panel data with sample selection. PITEC 2004-2011. Estimations according to the degree of novelty .........................................141

xii
Table A. 1 Outliers by technological level ................................................159
Table A. 2 Descriptive statistics Chapter 3 before filters ..........................160
Table A. 3 Descriptive statistics Chapter 4 before filters ..........................161
Table A. 4 Descriptive statistics Chapter 5 ................................................164
Table A. 5 Estimates of the Equation [5.1]. Probit models. 2006- 2011 ...165
List of Figures
Figure 1.1 Real labour productivity (annual growth rate) .............................4
Figure 2.1 Distribution of innovation activities. 2005-2011 ........................28
Figure 2.2 Innovation intensity. 2005-2011 .................................................29
Figure 2.3 Productivity (Sales/Employment) 2004-2011 ............................30
Figure 2.4 Evolution according technology level ........................................31
Figure 3.1 Gross domestic expenditure on R&D (% of GDP).....................36
Figure 3.2 Gross domestic expenditure on R&D in 2012 (% of GDP). Cross-country comparison. ..........................................................................37
Figure 3.3 Business sector expenditure on R&D (% of GDP).....................38
Figure 5.1 High important sources of information (% of innovative firms) ....................................................................................................................127
Figure 5.2 Cooperation in innovation activities with different types of partners (% of innovative firms) ................................................................128

1
Chapter 1: General framework and
outline of the thesis

2

3
1.1 Introduction and motivation
The relationship between innovation and productivity has been widely
studied for many decades, and nowadays this topic continues to generate
great interest among the scientific community. How to increase firms’
performance is a key factor, not only at firm level, but also at a national
level, especially in today’s globalized world. This is why the study of its
determinants has been at the centre of attention of many researchers over
the past few years. As extensively acknowledged, innovation is an essential
element and, as it will be seen below, its importance for productivity
growth is undeniable.
But what does innovation mean? Despite its relevance, the literature does
not provide a clear and accurate definition of innovation. It is a wide and
complex concept which can be understood in different ways and can be
approximated using different variables. All in all, it seems plausible to
assume that innovation is something new, not only for products, but also
corresponding to a better ways of doing something, and the root of this
“newness” is knowledge.
Interestingly, knowledge can be created inside firms, shared between
different companies or simply spill over firm’s boundaries. As first stated
by Griliches (1979), the level of knowledge in one sector depends on own
research efforts as well as external knowledge, or as the author puts it
“knowledge borrow or stolen from other sector or industries”. Thus, firm
performance not only depends on its own knowledge, but also on the
knowledge and experience generated by others that it is present in the
society. The reason is that knowledge is a (quasi-) public good. In other
words, it is non-rival -it can be consumed without depleting it, so its use by

4
one firm does not impede others from doing the same- and (at least partially)
non-excludable -(almost) no one can be excluded from using it.
Taking this into account, this dissertation aims to further understand the
bond between innovation and firms’ performance in Spain considering
these knowledge flows. In this regard, two distinctions will be drawn in this
study: i) depending on the “origin” of knowledge one can distinguish
between internal knowledge (transfers within the firm) and external
knowledge (coming from outside the company), and ii) depending on the
“willingness”, knowledge flows can be voluntary (for example, cooperation
agreements) or involuntary (also known as spillovers).
The motivation to study Spain lays on the fact that even though productivity
has increased in recent years (Figure 1.1), this growth is largely attributable
to a drastic reduction in employment instead of an increase in production
(Table 1.1).
Figure 1.1 Real labour productivity (annual growth rate)
Source: Eurostat; own representation.
-4
-3
-2
-1
0
1
2
3
4
2000 2001 2002 2003 2004 2005 2006 2007 2008 2009 2010 2011 2012 2013
European Union (27) European Union (15) Spain

5
Table 1.1 Real GDP and employment (annual growth rates)
GDP growth Employment growth
Spain EU 27 EU 15 Spain EU 27 EU 15
2000 5.0 3.9 3.9 5.1 2.2 2.4 2001 3.7 2.0 2.0 3.2 0.8 1.3 2002 2.7 1.3 1.2 2.5 -0.1 0.7 2003 3.1 1.5 1.3 3.2 0.4 0.5 2004 3.3 2.6 2.4 3.6 0.6 0.8 2005 3.6 2.2 2.0 4.1 1.0 1.0 2006 4.1 3.4 3.2 4.0 1.6 1.5 2007 3.5 3.2 3.0 3.0 1.8 1.6 2008 0.9 0.4 0.1 -0.1 1.0 0.8 2009 -3.8 -4.5 -4.6 -6.5 -1.8 -1.8 2010 -0.2 2.0 2.0 -2.2 -0.7 -0.3 2011 0.1 1.7 1.5 -1.9 0.3 0.3 2012 -1.6 -0.4 -0.5 -4.2 -0.2 -0.3 2013 -1.2 0.1 0.0 -3.0 -0.3 -0.4
Source: Eurostat.
As shown in Figure 1.1, up until 2007, Spanish firms presented lower rates
of labour productivity growth than those recorded by their European
counterparts (both EU-27 and EU-15). Since that date, however, Spain’s
growth rates have risen notably taking them to the top of Europe’s rankings,
with the exception of 2010. This might suggest successful adaptation to the
economic crisis; but, the reality is quite different. As can be seen in Table
1.1, the fall in employment in Spain has been much greater than that
recorded in the rest of the continent since 2008. As a result, Spanish firms
have increased their productivity via the destruction of jobs, as opposed to a
production growth. Actually, Spain’s GDP growth rate has been lower than
Europe’s during the last years. This fact raises concern about the role
played by innovation, since innovation is a key determinant for economic
growth, as emphasized by numerous articles. For this reason, it becomes
very interesting to obtain a better understanding of the situation in Spain
during these recent years.

6
All in all, the main goal of this dissertation is to investigate the relationship
between innovation and firm performance taking into account the impact of
knowledge flows on firm’s innovative behaviour and performance, as well
as, on firm productivity. To this end, Spanish firms from both
manufacturing and services sectors are considered. As it will be seen in next
sections, the evidence for Spain is scant. There has been little discussion
about involuntary knowledge flows, both external and internal. In addition,
most studies are exclusively focused on the manufacturing sector, while
little attention has been paid to the service sector. Therefore, this inquiry
attempts to modestly contribute to the literature to some extent.
Escalating from a basic and traditional model towards a more complex
structural model, each chapter attempts to improve and overcome the
limitations encountered along the way. This gradual process has had as a
result the following three pieces of research:
Goya, E.; Vayá, E. and Suriñach, J. (2012) “Productivity and
innovation spillovers: Micro evidence from Spain (2004-2009)” 1 .
Submitted to Journal of Productivity Analysis (2nd round evaluation)
Goya, E.; Vayá, E. and Suriñach, J. (2013) “Do spillovers matter?
CDM model estimates for Spain using panel data” 2 . SEARCH
working paper collection, WP4/28.
1 Presented at the 51th ERSA and 37th AECR Congress 2011, Barcelona (Spain), August 2011, and XV Spanish Applied Economics Meetings, Coruña (Spain), June 2012.
2 Presented at the Workshop on Firm Growth and Innovation, Tarragona (Spain), June 2012; XVI Spanish Applied Economics Meetings, Granada (Spain), June 2013; 40th Annual Conference of the European Association for Research in Industrial Economics, Évora (Portugal), August 2013; XXVIII Industrial Economics Meetings, Segovia (Spain), September 2013; and XXXVIII Spanish Economic Association Meeting, Santander (Spain), December2013.

7
Goya, E. (2014) “How important are internal knowledge flows for
innovative firm’s performance?”. CIP Discussion Paper No. 112,
University of Reading. Submitted to Journal of Technology Transfer.
While it is true that each of the above is a separate paper, they all pursue the
same goal: to have a better understanding of the impact of knowledge flows
on innovation and productivity in Spain.
The rest of this introduction provides a brief overview of the relationship
between innovation and productivity, followed by a basic review of some
concepts regarding knowledge flows. Finally, the outline and research
questions are summarized in the last section.
1.2 General background
According to the endogenous growth models (Lucas, 1988; Romer, 1986,
1990), economic growth is driven by investments in human capital and
innovation, as well as knowledge spillovers. Therefore, both creation and
diffusion of knowledge are key elements in economic development.
From an empirical point of view, numerous studies in the previous decades
point out the importance of these factors as drivers of productivity. As for
human capital, the literature shows its positive influence on productivity; as
workers become better trained and acquire more skills, they can carry out
tasks more efficiently (Black and Lynch, 1996; Haltiwanger et al., 1999 for
the United States; Turcotte and Rennison, 2004 for Canada; Arvanitis and
Loukis, 2009 for Greece and Switzerland; Yang, et al., 2010 for China; Lee
2011 for Malaysia).
As far as the purpose of this study is concerned, the relationship between
innovation and productivity has been widely studied by many authors since

8
the pioneering work of Griliches (1979, 1986). Investments in innovation
activities lead to a higher stock of knowledge and technological capability
having as a result new or improved goods and services and/or higher levels
of efficiency in the production process. Thereby, innovation may have an
impact on increasing sales and/or reducing costs of production; raising
productivity consequently. The results obtained from empirical studies
seem to depend on the geographical area analysed and the database and
methodology used. Yet in general, the evidence certainly points to a
positive and significant relationship between innovation and productivity at
the firm level (see Chapter 3 for a review). Nonetheless, it is worthy bearing
in mind the “file drawer” problem (Rosenthal, 1979). As argue by Tsai and
Wang (2004), the empirical evidence could be “over-optimistic” as for the
impact of innovation in productivity, since those papers that do not support
such a positive effect have a higher probability of not being published.
As mentioned in the previous section, not all of the benefits derived from
research efforts are fully appropriable by its producer. On the contrary,
when a firm innovates, part of the knowledge generated spills over -being
available for others to use it due to the firm’s incapacity to keep it within its
boundaries. According to Griliches (1979), there are two types of
externalities: rent spillovers and pure knowledge spillovers. The former
appears when the market transactions do not reflect the full quality of goods
that are purchased at a lower price than their quality improvements, while
the latter does not occur in relation to economic transactions but they
basically capture flows of ideas and information. Although some studies
argue that rent spillovers should not be considered spillovers since they
arise from mis-measurements, other papers state the opposite. If a firm pays
less than the cost to create the knowledge on its own, then it can be
assumed to benefit from spillovers (Keller, 2004). In addition, as Belderbos

9
and Mohnen (2013) point out, rent spillovers can include or be correlated
with pure knowledge spillovers. For instance, even if the firm pays a price
that reflects the technology embodied in the product, it might own some
complementary technology that allows it to obtain a higher profit from the
good purchased. Moreover, in order to buy and sell products, face-to-face
meetings are sometimes necessary, which may have as a result knowledge
flows. In any case, as pointed out by several authors, it is very difficult to
distinguish between both types of spillovers empirically. For that reason,
most articles employ the general notion of ‘knowledge spillovers’ 3
(Mohnen, 1996; Ornaghi, 2006; Bloch, 2013).
Another distinction that the literature undertakes is the difference between
explicit and tacit knowledge (Polanyi, 1966). Explicit knowledge can be
understood as knowledge which can be codified and which is easier to
protect (for instance, in a book). On the other hand, tacit knowledge is
embodied in people’s abilities being difficult to write down or codify
somehow. As Kaiser (2002) points out, tacit knowledge is transmitted
involuntarily between firms and, as the author puts it “[it] is a main source
of research spillovers”.
As mentioned in the previous section, knowledge flows can be considered
from different perspectives depending on their “origin” and “willingness”.
As for the “origin”, here it will be distinguished between: i) internal
knowledge flows (transfers within the firm) and external knowledge flows
(information coming from outside the company). As regards the
“willingness”, a distinction will be made between: i) voluntary and ii)
3 In this line, here it is also going to be used this broad concept to refer to any kind of externality related to research activities. For that reason, ‘knowledge spillover’, ‘spillover’, ‘externality’ or ‘external knowledge flows’ are going to be used interchangeably henceforth.

10
involuntary. Generally speaking spillovers are involuntary as it is supposed
that the firm who innovates would like to appropriate of all the benefits
from its investment; thus it is considered that knowledge which spills over
firm’s boundaries happens involuntarily. However, voluntary knowledge
flows can occur if firms decide deliberately to cooperate in order to carry
out innovation projects. Although cooperation between firms is beyond the
scope of this study, voluntary knowledge flows are going to be taken under
consideration when internal transfers are analysed, since the benefits from
these internal collaborations are going to remain inside the company (see
Chapter 5 for full details).
All in all, the diffusion of knowledge can come about in different ways:
movements of workers between firms, scientific articles in journals,
conferences, informal communications among scientists, disclosure of
patents, reverse-engineering, etc. The result, however, is the same: one firm
uses the knowledge generated by others without paying for it directly.
Nonetheless, the acquisition of external knowledge is not always free.
According to Cohen and Levinthal (1989), firms need to be able to
recognize external information in order to absorb it and use it for their own
benefit. Being exposed to external knowledge is not enough to acquire it. In
their seminal article, the authors develop the notion of “absorptive
capacity”. This ability is acquired through its own investments in R&D,
thus firms with greater technological capital are the ones who obtain the
most benefit from external knowledge.
Finally, it should be borne in mind that, as knowledge can be transmitted
through many different channels, measuring spillovers becomes a
complicated task. Thus, despite their recognised importance, there is no
established method to quantify them. In fact, several proxies have been used

11
in empirical studies to approximate such effects, having a variety of
different conclusions as a result (see Chapter 3 for a literature review).
Therefore, although the impact of spillovers on firm productivity have been
widely analysed, this topic still continues to catch researchers’ attention in
both innovation economics as well as industrial organization literature.
Capturing knowledge flows and their impact on firms’ performance, as well
as firms’ innovative performance is a challenge to be faced. That is why
this dissertation will humbly try to shed some light on this issue.
1.3 Outline of the thesis and research questions
As discussed above, this thesis intends to provide a deeper understanding of
the role played by knowledge flows on the relationship between innovation
and productivity. Below is a summary of the content of each chapter, along
with the research questions that this dissertation seeks to address.
First of all, Chapter 2 presents the data employed in this thesis. The
Technological Innovation Panel (PITEC) is described in detail, highlighting
its advantages. In addition, evidence for the period under analysis is
presented.
Secondly, Chapter 3 analyses the impact that R&D expenditure and intra-
and inter-industry externalities have on Spanish firms’ performance. While
there is an extensive literature analysing the relationship between
innovation and productivity, there are far fewer studies in this particular
area examining the importance of sectoral externalities, especially focused
on Spain. One novelty of this study, conducted for the industrial and service
sectors, is that it considers the technology level of the sector in which the
firm operates. Following the literature on spillovers, an extended Cobb-
Douglas production function is presented. The Olley and Pakes (1996)

12
estimator is applied to control for both selection bias and simultaneity
problems providing consistent estimates.
Research questions Chapter 3:
(i) Does the impact of innovation on firm performance differ according
to a firm’s technology level?
(ii) Are Spanish firms able to benefit from externalities?
(iii) If so, do these benefits vary according to a firm’s technology level?
Thirdly, Chapter 4 improves and extends the previous chapter by using a
structural model to analyse the impact of innovation activities and
externalities on the productivity of Spanish firms. To the best of our
knowledge, no previous paper has examined spillover effects by adopting
such an approach. This chapter, therefore, is intended to determine the
extent to which external knowledge may affect both firms’ behaviour (first
stage of the model) and firms’ performance (last stage). Additionally, the
firm’s technology level is taken into account in order to ascertain whether
there are any differences in this regard between high-tech and low-tech
firms both in industrial and service sectors.
Research questions Chapter 4:
(i) Is the firm’s decision to engage in R&D activities or not affected by
what other firms in its sector do?
(ii) Do Spanish firms benefit from innovations carried out by the rest of
the firms in its sector and in other sectors?
After having investigated the relevance of external knowledge flows,
Chapter 5 aims to analyse the extent to which internal knowledge flows
may have an impact on a firm’s innovative performance. As most
innovation literature has focused its attention on external knowledge
transfers, internal knowledge flows have faded into the background.

13
However, the transference of information and experience within firms can
improve their technological performance, impacting positively on their
innovativeness and boosting its innovative sales. Voluntary and involuntary
knowledge flows are taken under consideration in this chapter as well as
firm’s absorptive capacity.
Research questions Chapter 5:
(i) Are internal knowledge flows (voluntary and involuntary) important
for firm’s innovative performance?
(ii) Does this impact differ depending on a firm’s absorptive capacity?
Finally, Chapter 6 summarises the main conclusions and draws some policy
implications.

14

15
Chapter 2: Data

16

17
2.1 The Technological Innovation Panel (PITEC)
The dataset used is the Technology Innovation Panel (PITEC) 4 , which
provides information on the innovation activities of Spanish firms. The
National Institute of Statistics (INE), in consultation with a group of experts
and under the sponsorship of the Spanish Foundation for Science and
Technology (FECYT) and the Foundation for Technological Innovation
(COTEC), is responsible for building up this database.
PITEC has a panel structure containing information on about 12,000 firms
over time. This information comes from successive waves of the Spanish
Innovation Survey which is based on the Community Innovation Survey
(CIS) following the guidelines of the Oslo Manual (OECD, 2005) and
Frascati Manual (OECD, 2002) using a standardized questionnaire.
Although these surveys are carried out every two years in most European
countries, it is conducted yearly in Spain. Participation in the Spanish
Innovation Survey is mandatory. Firms receive the questionnaires via mail
and they are requested to complete them in fifteen days. Since 2009 some
companies have the option to perform the survey on the Internet.
CIS surveys carried out around Europe have proved to be a powerful tool to
study innovation activities, and most papers analysing this topic employ
CIS type data. In the case of Spain, PITEC has been used in pioneering
innovation studies over the last years (see for instance, García-Vega and
Huergo, 2011; Montoro-Sánchez, et al., 2011; Nieto and Rodriguez 2011;
Santamaría et al., 2012; Trigo and Vence, 2012; Herrera and Sánchez-
González, 2013; Trigo, 2013 to name a few). The reason is that it provides
information on individual firm characteristics (employment, sales, exports, 4 Available on the FECYT website: http://icono.fecyt.es/PITEC/Paginas/descarga_bbdd.aspx

18
the market in which the firm operates, industry sector, etc.), along with
detailed information on innovation activities. For instance, it offers
information on different types of innovation expenditures as well as
innovation outputs, cooperation, barriers to innovation, public financial
support to engage in innovation activities, etc.
PITEC is made up of four non-excludable samples: (i) firms with 200 or
more employees, (ii) firms with internal R&D expenditures, (iii) firms with
fewer than 200 employees with external R&D expenditures but which carry
out no internal R&D, and (iv) firms with fewer than 200 employees with no
innovation expenditures. Although it is carried out since 2003, the
information for that year has a severe limitation (only includes samples (i)
and (ii)). The restriction was overcome next year incorporating the four
samples mentioned above. For that reason, only data from 2004 is used in
this thesis.
For the analysis carried out in the upcoming chapters, a filtering process is
undertaken. In particular, those observations with any kind of incident (for
instance, confidentiality problems, takeovers, mergers, employment
incidents, etc.) are eliminated from the sample. Additionally, those
observations containing obvious anomalies, such as, null sales are also
deleted. Following the population defined in the Spanish Innovation Survey,
only firms with ten or more employees are included in the analysis.
Furthermore, the sample is restricted to firms belonging to the
manufacturing and services sectors (as can be seen in Table 2.1), whereas
the primary and construction sector are excluded from the analysis. Besides
that, the influence of extreme values has been treated to avoid estimation
problems. In particular, those observations of physical capital and
innovation expenditures (including R&D) which are two times the volume

19
of sales have been replaced with this value (see Table A.1 in Appendix).
The eventual sample is different in each chapter according to the
information available when the papers were written.
On the other hand, PITEC can be divided up according to different factors
of interest. In the first two chapters of this thesis, the technology level of the
sector in which the firm operates is considered. Following the Eurostat
classification, firms can be group into the following categories: (i) low and
medium-low tech manufacturing industries (LTMI), (ii) medium-high and
high-tech manufacturing industries (HTMI), (iii) non-knowledge-intensive
services (NKIS), and (iv) knowledge-intensive services (KIS). Table 2.1
provides the correspondence between PITEC and NACE classification by
technology level.
Finally, PITEC has a triple advantage. Firstly, it is based on a standardised
questionnaire, enabling comparisons with other studies. Secondly, it
provides information on both the industrial and service sectors. As will be
explained in the upcoming chapters, most studies in Spain focus solely on
the manufacturing sector, generally using the dataset Encuesta sobre
Estrategias Empresariales (ESEE)5. PITEC, however, makes possible to
overcome this limitation including the service sector under analysis. Finally,
it contains a high level of sectoral information covering 55 sectors
(following NACE Rev 1.1). This level of detail enables a rich study to be
undertaken, examining differences in behaviour between sectors with
5 The ESEE is a firm-level survey of Spanish manufacturing which has been collecting annual information since 1990.

20
different technology levels and, in turn, making a more interesting study of
inter-industry externalities possible (Chapters 3 and 4)6.
Table 2.1 Industry classification according to technological intensity Branches of business activity by PITEC NACE Rev 1.1
Low-tech manufacturing industries Food products and beverages 15 Tobacco 16 Textile products 17 Clothing and furriers 18 Leather and leather products 19 Wood and wood products 20 Pulp, paper and paper products 21 Publishing and printing 22 Furniture 361 Games and toys 365 Other manufactures 36 (exc. 361, 365) Recycling 37 Medium-low-tech manufacturing industries Rubber and plastic products 25 Ceramic tiles and flags 263 Non-metallic mineral products (except tiles and flags) 26 (exc. 263) Ferrous metallurgic products 271, 272, 273, 2751, 2752 Non-ferrous metallurgic products 274, 2753, 2754 Metal products (except machinery and equipment) 28 Building and repairing of ships and boats 351 Medium-high-tech manufacturing industries Chemical products (except pharmaceuticals) 24 (exc. 244) Machinery and equipment 29 Electrical machinery and apparatus 31 Motor vehicles, trailer and semi-trailers 34 Other transport equipment 35 (exc. 351, 353)
To be continued on the next page
6 It is worth mentioning that PITEC is representative at sectoral level, but not at regional level. For that reason, spatial analysis cannot be carried out.

21
Table 2.1 – continued from the previous page Branches of business activity by PITEC NACE Rev 1.1
High-tech manufacturing industries Manufacture of pharmaceutical products 244
Office machinery and computers 30 Electronic components 321 Radio, TV and communication equipment and apparatus 32 (exc. 321) Medical, precision and optical instruments, watches and clocks 33
Aircraft and spacecraft 353 Non-knowledge-intensive services Sales and repair of motor vehicles 50 Wholesale trade 51 Retail trade 52 Hotels and restaurants 55 Transport 60, 61, 62 Supporting and auxiliary transport activities, travel agencies 63
Knowledge-intensive services Post 641 Telecommunications 642 Financial intermediation 65, 66, 67 Real estate activities 70 Renting of machinery and equipment 71 Computer activities 722 Other related computer activities 72 (exc.722) Research and development 73 Architectural and engineering activities 742 Technical testing and analysis 743 Other business activities 74 (exc. 742, 743) Education 80 (exc. 8030) Motion picture, video and television programme production 921
Programming and broadcasting activities 922
Other human health and social activities 85, 90, 91, 92 (exc. 921,922), 93
Source: PITEC and Eurostat.

22
2.2 Innovation and productivity
As mentioned previously, PITEC offers highly detailed information on
innovation activities. It includes several indicators of innovation (from both
the input and output sides) as well as of other related variables. In this
section definitions of the main variables of interest related to innovation and
productivity are presented (however, see each chapter for a detailed
definition of all the variables used in the econometric analyses).
First of all, it is worth bearing in mind just how the questionnaire itself is
organized. At the outset, firms are asked to answer a set of general
questions: that is, to provide information about their business activity,
ownership (public, private, etc.), year of creation, sales, exports, number of
employees, distribution of employees by level of studies, geographical
market in which the firm operates (local, national, European, etc.),
innovation expenditures, personnel dedicated to R&D activities, financial
support for conducting innovation activities, etc.7.
Firms are then questioned about their innovation activities. They are
specifically asked if they have introduced a product or process innovation
or if they have undertaken an innovation project in the preceding three
years (either one that is still in progress or that has subsequently been
abandoned). These questions serve as a filter, so only those firms that have
initiated an innovation project (regardless of its success and regardless of
whether it remains incomplete or has been abandoned) go on to answer a
7 Unlike PITEC, in CIS questionnaires items related to innovation expenditures or public funding are asked only once firms have confirmed their engagement in innovation activities.

23
series of additional questions8. The additional questions are concerned with
finding out about any cooperation agreements they might have signed in
order to carry out innovation activities, sources from which firms can obtain
information when undertaking or completing innovation projects and the
different objectives pursued in their undertaking of innovation activities.
Finally, all firms are requested to respond to an additional set of questions,
some of which are related to innovation. Thus, for example, they are asked
to identify factors hampering innovation activities9 and about their use of
different innovation protection methods. Other questions address non-
technological innovations, including, organizational and marketing
innovations.
2.2.1 How to measure innovation and productivity with PITEC
According to PITEC, innovation activities include all the scientific,
technological, organizational, financial and marketing steps taken in
developing or implementing innovations. For that reason, they are known as
“innovation inputs” in the literature.
Although of these inputs, R&D investment is usually the most important, it
constitutes just one of them. Table 2.2 outlines the different types of
innovation expenditures and includes a corresponding brief description.
8 R&D expenditure is by definition an innovation activity. Therefore, R&D performers are considered to be firms with innovation activities and so are required to respond to the additional set of questions.
9 The fact that this question is asked to the whole sample (not only to firms with innovation activities) has generated counter-intuitive results in the literature of obstacles to innovation using CIS type data. The reason is that, in general, innovative firms are the ones who perceive these barriers (see Savignac, 2008, and D’Este et al., 2008).

24
Table 2.2 Innovation activities Innovation activities Definition
In-house R&D Creative work undertaken within the enterprise to increase the stock of knowledge for developing innovations.
External R&D
Same activities as above, but performed by other enterprises (including other enterprises or subsidiaries within the group) or by public or private research organizations and purchase by the firm.
Acquisition of machinery, equipment and software
Acquisition of advanced machinery, equipment (including computer hardware) or software to produce innovations.
Acquisition of external knowledge (not included in R&D)
Purchase or licensing of patents and non-patented inventions, know-how, and other types of knowledge from other enterprises or organizations for the development of innovations.
Training for innovative activities
Internal or external training for firm’s personnel specifically for the development or introduction of innovations.
Market introduction of innovations
Activities for the market introduction of firm’s innovation, including market research and launch advertising.
Design and others
Activities to design, improve or change the shape or appearance of innovations, and other activities to implement innovations (not included in the previous categories).
Source: PITEC and CIS.
The outcome of investment in innovation activities is an innovation,
referred to as the “innovation output”. Here, two types of innovation are
considered: product and process innovations10.
PITEC defines a product innovation as the market introduction of a new, or
significantly improved, good or service, in terms of its basic characteristics,
technical specifications, incorporated software or other components, or user
friendliness. It can be originally developed by the firm or by others, but it
has to be new to the firm in question, although not necessarily to the market.
As such, a distinction can be drawn between product innovations that are
new to the firm and the market (what some authors refer to as “radical” or
10 PITEC also provides information about non-technological (organizational and marketing) innovations as well as about patents.

25
“true” innovations) and product innovations that are new only to the firm
(or “incremental” innovations or “imitations”). Indeed, PITEC provides
information about their respective economic impacts; that is, the percentage
of total sales attributable to true innovations and the percentage attributable
to incremental innovations.
A process innovation, by contrast, is defined as the implementation of a
new, or significantly improved, production process, distribution method or
supporting activity 11 . As with a product innovation, it may have been
developed by the firm or by others and, while it has to be new to the firm, it
does not have to be new to the market.
It is worth mentioning that while input innovation variables refer to the
current period (t), innovation output indicators refer to the preceding three
years [t-2, t].
The concept of productivity has been defined in many different ways in the
literature, the definition depending basically on the availability of data.
Here, the information available on PITEC allows us to compute labour
productivity12, a measure that has been widely used in the literature to
approximate productivity, especially by those authors that use CIS data.
Examples of studies adopting this approach include Harhoff (1998) for
Germany; Los and Verspagen (2000) for the USA; Lotti and Santarelli
(2001) for Germany and Italy; Wakelin (2001) for the UK; Vivero (2002)
for Spain; Aiello and Cardamore (2005, 2008) for Italy; Ballot et al. (2006)
for France and Sweden; Kafouros and Buckley (2008) for the UK; Mate
11 Purely organizational innovations are excluded.
12 PITEC does not contain any data on intermediate inputs or any information from which to build input cost shares, which would be required to compute the total factor productivity (TFP).

26
and Rodriguez (2008) for Spain; Ortega-Argiles (2010, 2011) for Europe
and Segarra-Blasco (2010) for Catalonia. Given that PITEC is the Spanish
version of the CIS questionnaire, labour productivity – defined as firm sales
per employee – is adopted here.
2.2.2 Evidence for the period 2004-2011
In this section the evolution taken by innovation and productivity is
presented, along with evidence of the level of technology of the sector in
which firms operate, to determine whether differences exist with regard to
this factor.
Table 2.3 Evolution of innovation 2004-2011 (in %)
2004 2005 2006 2007 2008 2009 2010 2011
Innovation input Firms with innovation activities 5128 6424 5988 5605 5202 4868 4473 4036
Share of firms with innovation activities 67.8 70.9 67.3 65.0 62.8 61.8 59.7 57.2 Share of firms with R&D expenditures1 64.7 64.4 58.9 56.8 54.9 52.7 51.1 49.9 Intensity of innovation activities2 1.31 1.55 1.49 1.54 1.71 1.66 1.73 1.58
Innovation Output Share of firms with an innovation output 65.1 72.1 72.3 70.7 71.6 73.8 74.9 63.0 Process innovation 50.0 55.9 57.4 54.6 56.7 60.1 61.7 48.6 Product innovation 50.4 55.0 54.4 52.2 54.3 57.0 58.3 46.2 New firm3 77.4 77.7 76.5 76.9 77.9 77.5 77.7 77.7 New market3 60.1 56.6 56.9 58.8 59.9 57.5 56.7 58.1
Notes: Input innovation variables refer to year t, while innovation output indicators refer to the period [t-2, t]. (1) It includes internal and external R&D. (2) Intensity is defined as total innovation expenditures over sales. (3) Share of product innovators with an innovation new only to the firm (market). Source: PITEC; own calculations.
As shown in Table 2.3, the share of firms reporting involvement in
innovation activities has fallen since 2005 as has the share of firms
investing in R&D. As can be seen, most firms engaging in innovation do so,
at least, in R&D (but not exclusively), with only about 7% of firms
engaging in innovation activities other than R&D. Interestingly, even

27
though the proportion of innovative firms has decreased, the intensity of
investment has risen. In particular, since 2008 the percentage of innovation
expenditures over sales has presented a higher coefficient than in earlier
years (for instance, total innovation expenditures represented 1.73% of sales
in 2010). However, in 2011 this figure had fallen to levels comparable with
those for 2007.
Figure 2.1 allows us to analyse the distribution of innovation expenditure
and its intensity over the period 2005-201113. The first graph indicates that,
in real terms, innovation spending has risen, since the average innovation
expenditure in 2011 was higher than that in 2005. The second graph shows
that the distribution seems to have remained stable over time. Specifically,
around three quarters of total innovation expenditure is dedicated to R&D
(internal and external), some 17% to the acquisition of machinery,
equipment and software, with the remaining being distributed among the
other four categories. Finally, Figure 2.2 indicates that, in general, R&D
(internal and external) accounts for a large proportion of the innovation
intensity, followed by investment in machinery, equipment and software.
In-house R&D intensity presented a positive trend up to 2008 before falling.
Similar results can be found for investment in machinery, while the
opposite is true for external R&D intensity, which has increased after 2008.
An examination of the innovation output measure (see Table 2.3) indicates
that, on average, around 70% of firms have made at least one innovation in
the period 2004-2011, the percentage being slightly higher for process than
for product innovations. In terms of novelty, about 77% of product
innovators have developed a product that was new to the firm (though not
13 Information on training, market, design and other innovation activities is available from 2005 onward.

28
to the market), while this number fell to 58% when considering a “true”
innovation.
Figure 2.1 Distribution of innovation activities. 2005-2011
Source: PITEC, own calculations.
0
200.000
400.000
600.000
800.000
1.000.000
1.200.000
1.400.000
2005 2006 2007 2008 2009 2010 2011
Innovation expenditures (in euros)
48% 52% 54% 55% 54% 50% 53%
19% 17% 18% 14% 15% 18% 20%
21% 15% 16% 17% 17% 16% 14%
00%
20%
40%
60%
80%
100%
2005 2006 2007 2008 2009 2010 2011
Innovation expenditure (%)
In-house R&D External R&D Machinery External Know
Design & others Training Market

29
Figure 2.2 Innovation intensity. 2005-2011
Source: PITEC and own calculations.
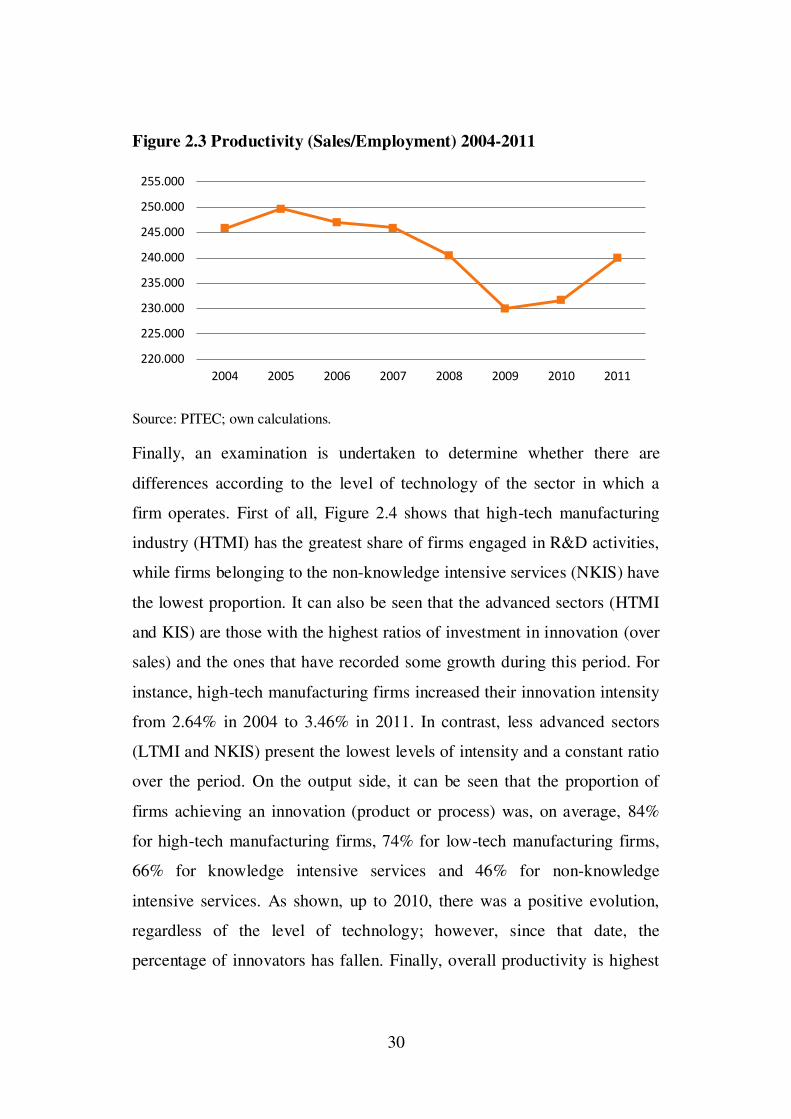
Figure 2.3 shows a fall in productivity between 2005 and 2009, at which
point it began to climb. As discussed in the first chapter, however, this ratio
may have been affected by the evolution of employment. Specifically, the
rise recorded in recent years could be due to a fall in the number of
employees as opposed to an actual increase in sales. The information
supplied by PITEC does not seem to capture this trend over the last few
years (i.e., no reduction in employment); however, it should be borne in
mind that these graphs show the sample aggregated. In other words, it is
possible that in recent years some firms might have suffered the effects of
the economic crisis and reduced the size of their workforce (and/or their
sales), especially small and medium-sized firms, whereas large companies
with huge workforces may not have experienced the same difficulties.
0,74% 0,78% 0,83% 0,94% 0,90% 0,87% 0,84%
0,29% 0,25% 0,28% 0,23% 0,25% 0,31% 0,31%
0,32% 0,22% 0,24%
0,30% 0,28% 0,28% 0,22%
0,0%
0,5%
1,0%
1,5%
2,0%
2005 2006 2007 2008 2009 2010 2011
In-house R&D External R&D Machinery External KnowDesign & others Training Market
30
Figure 2.3 Productivity (Sales/Employment) 2004-2011
Source: PITEC; own calculations.
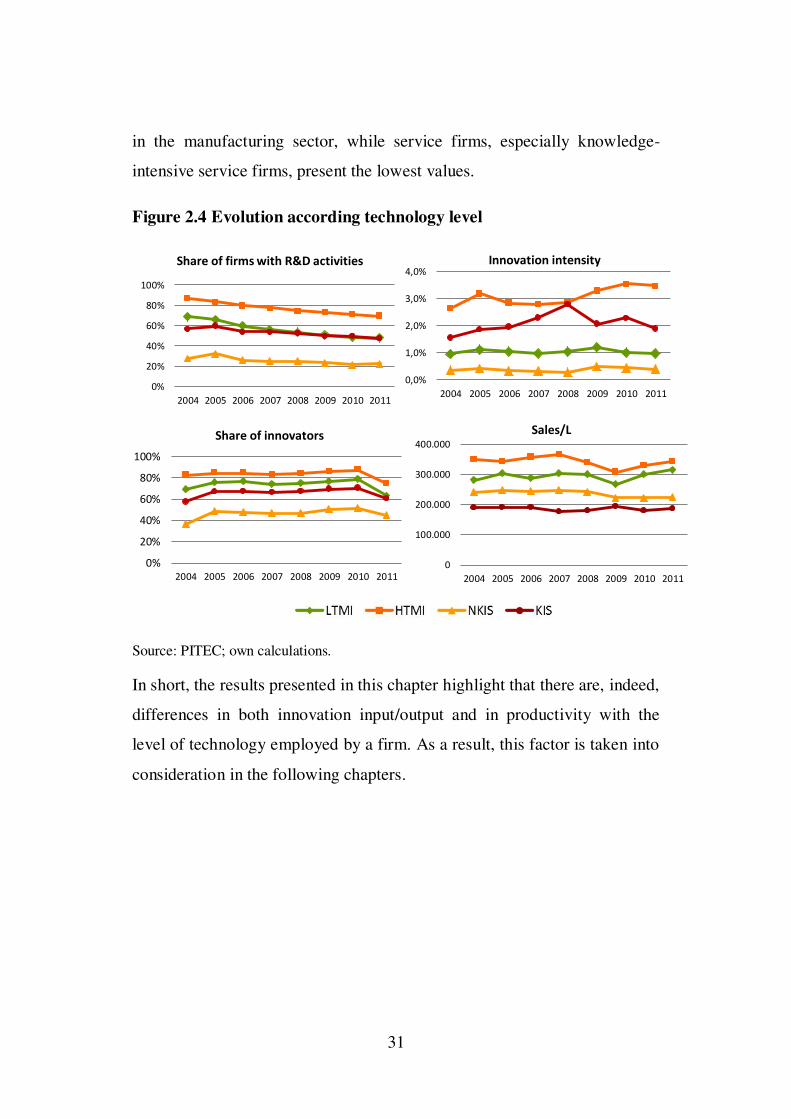
Finally, an examination is undertaken to determine whether there are
differences according to the level of technology of the sector in which a
firm operates. First of all, Figure 2.4 shows that high-tech manufacturing
industry (HTMI) has the greatest share of firms engaged in R&D activities,
while firms belonging to the non-knowledge intensive services (NKIS) have
the lowest proportion. It can also be seen that the advanced sectors (HTMI
and KIS) are those with the highest ratios of investment in innovation (over
sales) and the ones that have recorded some growth during this period. For
instance, high-tech manufacturing firms increased their innovation intensity
from 2.64% in 2004 to 3.46% in 2011. In contrast, less advanced sectors
(LTMI and NKIS) present the lowest levels of intensity and a constant ratio
over the period. On the output side, it can be seen that the proportion of
firms achieving an innovation (product or process) was, on average, 84%
for high-tech manufacturing firms, 74% for low-tech manufacturing firms,
66% for knowledge intensive services and 46% for non-knowledge
intensive services. As shown, up to 2010, there was a positive evolution,
regardless of the level of technology; however, since that date, the
percentage of innovators has fallen. Finally, overall productivity is highest
220.000
225.000
230.000
235.000
240.000
245.000
250.000
255.000
2004 2005 2006 2007 2008 2009 2010 2011
31
in the manufacturing sector, while service firms, especially knowledge-
intensive service firms, present the lowest values.
Figure 2.4 Evolution according technology level
Source: PITEC; own calculations.
In short, the results presented in this chapter highlight that there are, indeed,
differences in both innovation input/output and in productivity with the
level of technology employed by a firm. As a result, this factor is taken into
consideration in the following chapters.
0%
20%
40%
60%
80%
100%
2004 2005 2006 2007 2008 2009 2010 2011
Share of firms with R&D activities
0,0%
1,0%
2,0%
3,0%
4,0%
2004 2005 2006 2007 2008 2009 2010 2011
Innovation intensity
0%
20%
40%
60%
80%
100%
2004 2005 2006 2007 2008 2009 2010 2011
Share of innovators
0
100.000
200.000
300.000
400.000
2004 2005 2006 2007 2008 2009 2010 2011
Sales/L

32

33
Chapter 3: R&D, firm performance
and spillovers

34

35
3.1 Introduction
As discussed in the introduction of this dissertation, the decline in GDP
highlights the importance of innovation as an economic growth factor. This
raises a number of questions that need to be addressed: Does Spain suffer
from a lack of innovation activity? Or is Spain unable to translate its
investments into production growth? This last issue is critical, since it is
widely acknowledged that if a firm can increase its productivity it is likely
to gain in competitiveness, an essential attribute in today’s globalized world.
In recent decades, the number of studies examining the relationship
between innovation and firm productivity has increased (see following
section for a literature review). In general, the findings stress the
importance of R&D as a determinant of economic performance. According
to the Frascati Manual (2002): “Research and experimental development
(R&D) comprise creative work undertaken on a systematic basis in order to
increase the stock of knowledge, including knowledge of man, culture and
society and the use of this stock of knowledge to devise new applications”.
As stated by the Lisbon Strategy, all EU members were expected to be
investing 3% of their GDP in R&D activities by 2010. Since most countries
failed to reach the target, the Europe 2020 Strategy, approved in 2010,
opted to maintain the same objective for the next ten years. Thus, the
member states are expected to invest 3% of their GDP in R&D activities by
2020. Despite this, a number of countries have adopted their national R&D
intensity targets, which is the case of Spain. Specifically, the Spanish
government has set an R&D intensity target of 2% (0.8% of this investment
to be made by the public sector14 and 1.2% by the business sector).
14 Public sector includes the government and the higher-education sector.

36
As shown in Figure 3.1, up until 2009 Spain presented a positive evolution
in its investment in R&D. The European Commission reported that Spanish
R&D intensity increased with an annual average growth of 4.3% over the
period 2000-2009, well above the European average. However, after that
date, and contrary to the overall trend in Europe, Spanish R&D intensity
has fallen reaching just 1.3% of GDP in 201215.
Figure 3.1 Gross domestic expenditure on R&D (% of GDP)
Source: Eurostat; own representation.
In general, R&D investment has grown substantially in Spain over the last
decade. Nevertheless, despite this positive evolution, investment levels are
still below European levels (2.08% for EU-27 and 2.16% for EU-15 in 2012)
and fall well short of meeting the target set for 2020 (see Figure 3.2).
15 This figure can be broken down according to the source of funding: 0.69% was invested by the business sector and 0.61% by the public sector (0.25% by the government and 0.36% by higher education) in 2012.
0,0
0,5
1,0
1,5
2,0
2,5
2000 2001 2002 2003 2004 2005 2006 2007 2008 2009 2010 2011 2012
European Union (27) European Union (15) Spain

37
Figure 3.2 Gross domestic expenditure on R&D in 2012 (% of GDP). Cross-country comparison.
Source: Eurostat; own representation.
A considerable amount of this R&D investment is undertaken by the
business sector. Specifically, roughly two thirds of the total R&D intensity
should be carried out by the private sector. Figure 3.3 highlights two facts:
first, Spain’s business R&D to GDP ratio is much lower than that of the
European Union and, second, private R&D investment has been affected by
the economic crisis. Although, in general, Spain presents a positive
evolution, since 2008, investment in R&D has gone into decline, unlike in
the rest of Europe, where investments present a positive trend. Based on the
national target, Spain faces a major challenge with the private sector having
to increase its R&D intensity from 0.61 in 2012 to 1.20% in 2020.
0,0
0,5
1,0
1,5
2,0
2,5
3,0
3,5
4,0
Finl
and
Sw
eden
Den
mar
kG
erm
any
Aus
tria
Slo
veni
aFr
ance
Bel
gium
Esto
nia
Net
herl
ands
Cze
ch R
epubl
icIr
elan
dU
nite
d Kin
gdom
Port
ugal
Luxe
mbo
urg
Spa
inH
unga
ryIt
aly
Lith
uani
aPo
land
Mal
taSlo
vaki
aC
roat
iaG
reec
eLa
tvia
Bul
garia
Rom
ania
Cyp
rus
Spanish Target = 2%
EU Target =3%

38
Figure 3.3 Business sector expenditure on R&D (% of GDP)
Source: Eurostat; own representation.
On the basis of the previous discussion, it is essential to gain a better picture
of Spain’s R&D-productivity relationship if we are to further our
understanding of it and if we hope to design policies that can raise
productivity, especially in the current economic climate. For this reason, the
primary goal of this chapter is to analyse the relationship between R&D and
firm performance in Spain over the last few years. In the light of previous
studies that report differences in the productivity gains attributable to
innovation in accordance with a firm’s level of technology, and given that
few studies of the Spanish case take this factor into account, here we assess
whether differences can be found between high- and low-tech firms.
Additionally, as explained in section 1.2, it should be borne in mind that the
knowledge derived from a firm’s investment in innovation is likely to spill
over, given its inability to reap all the benefits from its investment.
Therefore, when examining the impact of innovation on productivity, the
diffusion of the innovation and any externalities generated also need to be
0,0
0,2
0,4
0,6
0,8
1,0
1,2
1,4
1,6
2000 2001 2002 2003 2004 2005 2006 2007 2008 2009 2010 2011 2012
European Union (27) European Union (15) Spain

39
taken into account. Several papers have analysed the importance of
spillovers; however, there has been little discussion about this aspect from a
sectoral perspective, particularly in Spain. Thus, the second goal of this
chapter is to study the extent to which a firm’s performance is influenced by
the innovation carried out by other firms in the same sector (intra-industry
externality) or by the innovation activities of firms in other sectors (inter-
industry externality).
The study is conducted using PITEC (see Chapter 2 for a full description of
the database) for the period 2004 to 2009. The Olley and Pakes (1996)
estimator is adopted for the econometric analysis. By doing so, unobserved
heterogeneity, simultaneity issues and selection biases can be accounted for.
These are common problems that arise when a productivity analysis is
carried out. However, by using this method, consistent and reliable
coefficients can be obtained.
To sum up, the aim of this chapter is twofold. First, it seeks to analyse the
extent to which the technology level of Spanish firms affects their returns
from their investment in innovation. Second, it assesses how this factor
influences potential knowledge flows from other firms’ innovations, both
intra- and inter-industry externalities. Thus, this chapter aims to answer the
following questions: (i) Does the impact of innovation on firm performance
differ according to a firm’s level of technology? (ii) Are Spanish firms able
to benefit from externalities? (iii) And if so, do these benefits vary
according to a firm’s technology level?
This chapter is organized as follows. Section 3.2 presents the literature
review, section 3.3 the model, section 3.4 describes the variables used in the
analysis, section 3.5 shows the results, section 3.6 presents some further
explorations and finally the conclusions are drawn in section 3.7.

40
3.2 What do we know so far?
Since the pioneering work of Griliches (1979, 1986), the relationship
between innovation and productivity has been widely studied by many
authors at both national and sectoral levels as well as at the firm level. The
well-known Cobb-Douglas production function is normally used to conduct
the empirical analysis, with the traditional inputs of physical capital and
labour being extended to include innovation expenditures. In general, the
evidence reveals a positive and significant relationship between innovation
and productivity at the firm level (see Hall and Mairesse, 1995 for France;
Harhoff, 1998 for Germany; Lotti and Santarelli, 2001 for a comparative
study of Germany and Italy; Parisi et al., 2006 for Italy and Ballot et al.,
2006 for France and Sweden; Ortega-Argilés et al., 2010 and 2011 for
European firms). However, the results obtained seem to depend on the
geographical area being analysed as well as on the nature of the database
and methodology used.
It is worth mentioning that most of these articles undertake cross-country
analyses, and pay scant attention to the impact that the sector in which a
firm operates might have. As stressed in the previous section, the first goal
in this chapter is to determine whether there are any differences in the
impact of innovation on productivity depending on the level of technology
of the firm’s sector. Empirical evidence to date suggests that the impact of
R&D expenditures on a firm’s productivity is more marked in high-tech
sectors than it is in their low-tech counterparts (see Verspagen, 1995 for
nine OECD countries; Tsai and Wang, 2004 for Taiwan; Ortega-Argilés et
al., 2010 and 2011 for European firms).
In addition, this chapter seeks to determine if the stock of knowledge
available at the firm level is dependent on both the firm’s own innovation

41
and on externalities. As discussed above, the benefits derived from
innovation in a firm (or sector) are likely to spill over because of the firm’s
inability to channel all of the benefits obtained from its investment effort.
Thus, a firm’s performance can be explained by its own knowledge as well
as by the knowledge generated somewhere else which is in the public
domain. For this reason, externalities need to be taken into consideration.
From an empirical perspective, most articles employ a production function
where spillovers are included as an additional input (following Griliches,
1979). Although there has been a considerable number of studies that have
analysed the impact of R&D spillovers on productivity, a general consensus
has yet to be reached on just what that effect might be. Despite the positive
impact reported by some authors (Griliches, 1992; Nadiri, 1993; Cincera,
2005 for a worldwide analysis; Wiese, 2005 who reviews various studies
conducted in the ‘80s and ‘90s; Aiello and Cardamone, 2005 and 2008;
Cardamore, 2012 for Italy and Bloch, 2013 for Denmark), others draw
different conclusions. For example, Klette (1994), in an examination of the
effect of R&D spillovers in Norway for the period 1975-1986, concludes
that the impact depends on the technological level of the recipient firm.
Thus, only high-tech industries are able to benefit from spillovers; low-tech
firms, by contrast, present a negative coefficient. Similarly, Los and
Verspagen (2000) study the impact of technological spillovers on the
productivity of 7,000 American firms between 1977 and 1991. They
consider four definitions of spillovers and offer different conclusions
depending on technology level and the kind of estimation conducted (within
or between). While within estimations present a positive impact of spillover
regardless of the definition adopted, between estimations lead to positive,
non-significant and negative results. Harhoff (2000) analyses 443 German
firms for the period 1977-1989 and finds that the effect of spillovers is

42
positive only for high-tech firms and that it is conditioned by the firm’s own
R&D intensity. However, negative elasticities are reported for firms in less
sophisticated industries. Wakelin (2001) investigates the impact of intra-
and inter-industry spillovers on the productivity of 170 UK manufacturing
firms between 1988 and 1996. Although spillovers are not a relevant factor
in the enhancement of productivity in general, when firms are separated
according to their innovation history new evidence comes to light.
Specifically, firms belonging to sectors defined as “net users of innovation”
present a strong positive impact of intra-industry spillovers. Kafouros and
Buckley (2008) using a balanced panel of 117 UK manufacturing firms for
the period 1995-2002 analyse intra- and inter-industry externalities
according to technology level and firm size. Their findings show that high-
tech firms are able to benefit from the innovation of others; whereas low-
tech firms present a negative coefficient. Firm size is also a relevant factor
in this study, with small firms increasing their labour productivity with both
types of externalities, unlike large firms which record a negative impact
from intra-industry externalities. Finally, Medda and Piga (2014) study the
impact of intra- and inter-industry spillovers on the TFP growth of 3,077
Italian firms from 1998 to 2000. While intra-industry spillovers present a
clearly positive coefficient, inter-industry externalities show different
effects. Specifically, spillovers originating from supply sectors have a
positive impact whereas knowledge coming from customers presents a
negative coefficient.
Overall, the evidence is unclear, with spillovers having an apparently
heterogeneous effect (being positive, negative or not significant). Yet, it
should be borne in mind that the results are conditioned by the sector or
country under analysis and that they are highly dependent on the way in
which externalities are quantified. In this regard, it seems that most papers

43
opt to use a weighted sum of R&D as a measure of spillover. However,
there is no general agreement on how these weights should be defined. The
guiding idea is that the closer two firms are the more likely it is that
spillovers will occur16. This proximity can be measured in different ways
with technological similarity, geographical distance and commercial
relations being the principal types considered in the literature. In the case of
the former, technological proximity, most papers follow Jaffe (1986), who
defines proximity between firms using patent data (Cincera, 2005). Others,
however, employ a set of firm characteristics in their approximations
(Aiello and Cardamore, 2008). The strand of the literature that uses
geographical distance to formalise spillovers relies on the idea that the
greater the spatial proximity the more firms can gain from each other’s
knowledge17 (Bloch, 2013). Finally, some researchers adopt an input-output
approach using trade flows to weight the external pool of knowledge; thus,
the more commercial relationships a firm establishes, the more it will
benefit from the research activities of these other firms (Medda and Piga,
2014). To sum up, although the importance of spillovers is beyond question,
how they should be measured at the micro level and what their effect is on
firm performance remain far from clear.
If we focus on the case of Spain, the relationship between innovation and
productivity has been examined by a number of authors, who conclude that
innovation has a positive impact on productivity. However, a general
limitation of most of these studies is that their analyses are restricted to
16 Interestingly, Nooteboom et al. (2007) point out that being too far apart or too close is not beneficial for a firm. If two firms have very different knowledge bases there is less chance of knowledge flowing, whereas if there are overlaps because firms are very similar technologically then there are fewer learning opportunities or complementarities.
17 Despite the importance of spatial proximity (see Audretsch and Feldman, 1996; Döring et al. 2006), its analysis lies beyond the scope of this study.

44
manufacturing firms based on the ESEE dataset. Among the most recent
papers employing this database we find Vivero (2002), Huergo and Moreno
(2004), Huergo and Jaumandreu (2004a), Maté-García and Rodríguez-
Fernández (2002, 2008), Rodríguez-Fernández and Maté-García (2006),
Rochina-Barrachina et al. (2010) and Casiman et al. (2010), to name but a
few. By contrast, only a few papers have carried out a joint analysis of both
manufacturing and service sectors, most notably Segarra-Blasco (2010) and
Segarra-Blasco and Teruel (2011) who analyse the case of Catalonia using
data from the fourth Community Innovation Survey (CIS4).
In the case of external knowledge, far too little attention has been paid to
the effect of spillovers on the productivity of Spanish firms. Some articles,
including Ornaghi (2006), argue that externalities are positive and
significant in explaining productivity. In this study the impact of spillovers
on productivity growth is examined in 3,151 manufacturing firms from
1990 to 1999. Spillovers are measured by taking into account firm size and
the results indicate a positive impact of technological externalities on
growth in productivity. However, the results in other studies differ
according to the economic sector in which the firm operates and its level of
technology. For instance, Beneito (2001) analyses the impact of intra-
industry externalities on productivity for 501 Spanish manufacturing firms
distinguishing them according to technology level during the period 1990-
96. The author concludes that only firms using advanced technologies are
able to benefit from the knowledge in their technological neighbourhood. In
particular, the spillover effect depends on the intensity of R&D, with firms
in the intermediate quartile being the ones that experience the largest
productivity gains.

45
All in all, the question that still needs to be addressed is whether differences
are to be found in the returns that Spanish firms obtain from their
innovation investments in relation to their technology level. In addition,
given the paucity of studies assessing the impact of spillovers in Spain, this
chapter will examine if firms in the sample are able to benefit from the
innovation carried out by others.
3.3 Model and estimation strategy
The model adopted to estimate the relationship between innovation and
firm performance is the extended Cobb-Douglas production function, which
apart from including conventional production factors (physical capital and
labour) also incorporates human capital and innovation18. Human capital
has been included in the Equation [3.1] given that the more qualified
workers the firm has, the more effectively they are likely to perform their
tasks and the more productive the firm is likely to be. Additionally,
innovation, the variable of interest in this study, has been included as a
production function input. Investment in innovation can reduce the costs of
production or raise firm sales, thus increasing production.
???? = ???? · ?????1 · ????
?2 · ?????3 · ?????
?4 [3.1]
where ???? is the output of firm i belonging to sector s in year t, ????is the
firm’s technology level, ????is physical capital, ????is labour, ????is human
capital, ?????is innovation and ?1, ?2, ?3, ?4, are the returns on each variable
respectively.
18 It should be pointed out that only a few microeconomic studies, especially for the case of Spain, have incorporated human capital and innovation as factors in the production function.

46
With respect to the technology level ???? in Equation [3.1], in this chapter it
is assumed that an external effect exists due to the public nature of
knowledge. Hence one firm’s level of technology is dependent on the
innovation made by all the other firms:
???? = ? · (????????? )?1 · (?????????)?2 [3.2]
where ? is a constant denoting a common technology level for all the firms;
????????? is the intra-industry externality of firm i in sector s capturing the
innovative effort made by all the other firms in the same sector; and ?????????is
the inter-industry externality understood as the innovation made by the
firms in the rest of the sectors.
Thus by combining Equations [3.1] and [3.2] it can be seen that a firm’s
output is explained in terms of its own investments (in physical capital,
human capital and innovation) and of the knowledge generated outside the
firm:
???? = ? · ?????1 · ????
?2 · ?????3 · ?????
?4 · (????????? )?1 · (?????????)?2 [3.3]
From Equation [3.3] it can be concluded that (under the assumption that
?1 ≠ 0 and ?2 ≠ 0), even though a firm does not invest in innovation, it
can still benefit from the innovation carried out by all the other firms and,
thereby, increase its performance.
Expressing [3.3] in log form the following empirical model is specified:
???? = ?0 + ?1???? + ?2???? + ?3ℎ??? + ?4????? + ?1????−2????? + ?2 ????−2????? + ???????? + ???? [3.4]
???? = ω??? + ???? [3.5]

47
where ???? is a productivity shock and ???? is the error term. Lower case
letters indicates log-transformed variables (with the exception of human
capital which is a percentage). See next section for a detailed definition.
As far as the estimation method is concerned, it is well known in the
literature that estimates from a production function may suffer from
simultaneity as well as selection bias. As such, OLS estimates are biased
and inconsistent.
The former problem, simultaneity (first noted by Marschak and Andrews,
1944), arises because productivity shocks (????) are known to the firm but
not to the econometrician. Thus, when the firm has to determine the usage
of inputs its decision is influenced by its beliefs about productivity.
Therefore, input choices will be correlated with productivity shocks. So if a
firm faces a positive (negative) productivity shock, its use of inputs is going
to increase (decrease) accordingly. Not taking this issue into consideration
leads to biased and inconsistent estimates since the error term is correlated
with the explanatory variables (breaking one of the basic hypotheses of
OLS). The second problem, selection bias, manifests itself because of the
exit of inefficient firms (not randomly). A firm with higher capital is
expected to obtain higher profits in the future and so is more likely to stay
in the market despite a negative productivity shock (given that in the future
it is thought it will produce more) than a firm with a lower level of capital19.
In order to deal with these problems and to ensure the reliability of the
coefficients we use the estimator proposed by Olley and Pakes in 1996
(hereafter OP). Other methods are employed in the literature, but they only
19 Even though the evidence suggests that simultaneity bias is more important than selection bias, the estimator used here controls for both.

48
address simultaneity bias20. In contrast, the OP estimator addresses both
simultaneity as well as selection bias 21. For this reason, this estimation
method has been used by several authors who seek to analyse, for instance,
the impact of trade and tariffs on firm productivity (see for example,
Pavcnick, 2002; Schor, 2004; Amiti and Koungs, 2007; De Loecker, 2007;
Loung, 2011; Van Beveren, 2012 and Arvas and Uyar, 2014). While it is
true that it is not one of the most common approaches in the innovation
literature, some papers have recently applied this estimator to obtain
unbiased and consistent estimates of the production function (see Marrocu
et al.; 2011 and Añón-Higón and Manjón-Antonlín, 2012).
3.3.1 Olley & Pakes (1996) estimator
Intuitively, the idea behind the OP method is to make “observable” the
“unobservable”; in other words, to use an equation to proxy for the
unobserved productivity shock. By doing so, the econometrician can control
for the correlation between the error term and the inputs and obtain
consistent results. Below, the main features of the OP approach are
described (using the same notation as that employed by Olley and Pakes,
20 As shown in the literature, simultaneity problems can be addressed by using instrumental variables or fixed effect estimators. However, given that the panel is short and instrumental variables use lagged values as instruments, their suitability is reduced (facing a problem of weak instruments). The fixed effects estimator, on the other hand, relies on the assumption that productivity shocks are constant over time, which is an excessively strong premise from our point of view, especially bearing in mind the economic situation in the period under analysis.
21 Another option might be the Levinsohn and Petrin (2003) estimator, but intermediate inputs are needed in this case (and this information is not provided by PITEC). Thus, we strongly believe that the best option available is the OP estimator.

49
1996)22. After that, the changes introduced in order to adapt the method to
our case are explained.
First of all, the authors base their analysis on the traditional Cobb-Douglas
production function:
??? = ?0 + ????? + ????? + ????? + ??? [3.6]
where the log of output (???) is explained by the age of the firm (???), the
log of capital (???), the log of labour (???) and an error term (???) that is
decomposed in two components: a productivity shock ( ??? ) and a
measurement error term (???). The former is observed by the firm but not by
the econometrician and affects the firm’s decision, while the latter is
unobserved by both and does not affect firm’s decision.
As for the inputs in the production function, the authors differentiate
between variable factors (such as, ???), which can be easily adjusted given a
productivity shock, and fixed factors (also known as “state variables”)
which depend on information from the previous period and are costly to
adjust with productivity shocks (??? and ???).
As explained by the authors, at the beginning of every period an incumbent
firm has to decide whether to exit or to continue in the market. The firm
remains in the market if its productivity is higher than a certain threshold
(referred to as the “exit rule”). In that case, it has to choose a level of inputs
( ??? ) and a level of investment (“investment decision rule”) according
to ??? , ??? and ??? : ?? = ??( ?? , ?? , ??). Here, it is assumed that ?? > 0 and
investment is increasing in productivity, conditional on the values of all
22 For a detailed explanation of the equations and estimation strategy see Olley and Pakes (1996).

50
observed state variables (positive productivity shocks will increase the
investment in the next period). By doing so, the investment function can be
inverted as follows: ?? = ℎ?( ?? , ?? , ??) where ℎ?(∙) = ??−1(∙) . As the
authors put it “this expression allows us to express the unobservable
productivity variable as a function of observables, and hence to control for
?? in the estimation”, thereby removing the simultaneity bias.
The production function can then be rewritten as:
??? = ????? + ??( ??? , ??? , ???) + ??? [3.7]
where ??( ??? , ??? , ???) = ?0 + ????? + ????? + ℎ?( ??? , ??? , ???).
This semi-parametric regression model identifies ?? but not ?? or ??. To do
so, estimates of the survival probabilities ( ? ) are needed; that is, the
probability of the firm surviving in the market. Using a probit model and
the exit rule mentioned earlier these probabilities are computed. By doing
so, the model accounts for selection bias. Finally, estimated coefficients of
capital and age are obtained running non-linear least squares using ?̂? , ?̂
and ?̂.
To summarize, OP methodology comprises three stages. The first one
controls for unobserved productivity shocks including the inverse of the
investment demand function in the estimation. Thus, as the error term is no
longer correlated with the inputs, the simultaneity bias can be removed. The
second estimates the survival probabilities in order to address selection bias.
The third and final stage obtains the coefficients of the state variables (??
and ?? ) by including the survival probabilities and the inputs estimates
computed in the previous steps.

51
We modify this method slightly to adapt it to our specific requirements.
First of all, age is not included in the analysis since this information is not
available for all firms23. Second, R&D expenditures are incorporated in the
analysis. We follow Amiti and Koungs (2007)24 and include R&D stock as
a state variable since treating it as exogenous is inappropriate. As with
physical capital, we assume that the decision to invest in R&D is taken in t-
1. Thus, the investment demand function depends on: ?? = ??( ?? , ?? , ???).
The rest of the procedure is the same as described above, apart from the fact
that we include ??? as state variable instead of ??.
3.4 Data and variables
The data used in this chapter consist of an unbalanced panel of 9,115 firms
(50,349 observations) for the period 2004-2009. For estimation purposes,
only firms that remain at least three years in the panel are included in the
study since some variables are lagged two periods25. This filter leads to a
sample which is around 91% of the whole sample (55,303 observations).
Table A.2 in the Appendix shows that the sample preserves the properties
after applying this filter and that it does not lead to any selection bias.
Next, definitions of the variables used in Equation [3.4] are presented. All
monetary variables are expressed at constant values at 2009 base prices
(nominal values have been deflated using the GDP deflator).
23 PITEC includes this information from 2009.
24 The authors modify the OP framework by introducing the decision to engage in international trade.
25 Results without this filter remain almost identical.

52
3.4.1 Dependent variable
Firm output is approximated by the total sales that firm i has declared at
time t.
3.4.2 Independent variables
Inputs
As explanatory variables in Equation [3.4], we include the traditional inputs
in the production function, namely, the physical capital stock, computed
using the perpetual inventory method (see below) and labour, defined as the
number of employees. In addition, human capital, measured as the
percentage of employees with higher education, and innovation, defined as
internal and external R&D stock26, are also incorporated in the analysis.
As is widely accepted in the literature27, a firm’s output is assumed to be
affected by accumulated stocks of physical capital and R&D expenditure,
rather than by current flows. We use the well-known perpetual inventory
method:
?? = ??−1 ∙ (1 − ?ℎ?) + ???0 = ?0
???+?ℎ? [3.8]
and
26 As acknowledged in Chapter 2, the concept of innovation is very wide including not only R&D expenditure, but also the acquisition of machinery, equipment and hardware/software, training staff directly involved in developing the innovation, introduction of innovation in the market, design, etc. However, it has been seen that most firms that engage in innovation activities also do so in R&D. In addition, R&D is the main component of innovation activities, accumulating three quarters of total spending. Finally, the literature usually approximates innovation by using R&D expenditures. For all of these reasons, here innovation is proxied by R&D stock.
27 See Hall and Mairesse (1995), Bönte (2003) and Ortega-Argilés et al. (2011) to name just a few.

53
??? = ???−1 ∙ (1 − ?ℎ??) + ??????0 = ???0
????+?ℎ?? [3.9]
with t = 2004, …, 2009 h = 1, 2, 3, 4 s = 1, ..., 51.
where ?? is the real investment in material goods and ???? is the real R&D
expenditure. We apply different depreciation rates according to the
technology level (h). Following Ortega-Argilés (2011), the more advanced
the sector, the faster is the technological progress accelerating the
obsolescence of its current physical capital and knowledge. Thus, we apply
sectoral depreciation rates of 6 and 7% for physical capital (?ℎ?) and 15 and
18% for innovation (?ℎ??) to low-tech and high-tech sectors respectively28.
In the case of growth rates, if we use the initial periods for their
computation, we lose a considerable amount of information given that our
panel has a short time dimension (2004-2009). Thus, we opted to calculate
??? and ???? as the average rate of change in real investment in material
goods and real R&D expenditure in each sector(s) over the period 1995-
200329 . We used the OECD’s ANBERD database to calculate physical
capital growth rates (???) and the OECD’s STAN database for innovation
growth rates(????).
Externalities
As discussed in Chapter 1, due to the many different ways in which
spillovers can occur (movements of workers between firms, scientific
articles in journals, conferences, informal communication between
28 The results are almost identical if a fix depreciation rate is used (6% for physical capital and 15% for innovation).
29 Note, however, that the choice of g does not modify the results greatly. As Hall and Mairesse (1995) report: “In any case, the precise choice of growth rate affects only the initial stock, and declines in importance as time passes…”.

54
scientists, disclosure of patents, reverse-engineering, etc.), measuring them
is a far from easy task. If we consult the literature, there is no generally
accepted method for formalising these external knowledge flows. While
R&D expenditures are typically used to approximate existing knowledge in
the environment, different weights are employed to measure the influence
of this external knowledge on the firm (geographical distance, technological
proximity and/or input-output linkages).
The simplest measure to compute, and also one of the most frequently
employed in the literature, is the unweighted sum of the R&D stock
(Beneito, 2001; Los and Verspagen, 2001; Wakelin, 2001; Bloch, 2013;
Medda and Piga, 2014). Thus intra-industry externality corresponding to
firm i belonging to sector s is defined as:
????????? = ∑ ??????≠? [3.10]
where ????? is total R&D stock carried out in sector s at time t (except the
firm’s own R&D investment); in other words, the total R&D expenditure
made by all the other firms in the same sector. As acknowledged in the
literature, this definition is open to criticism since it attaches the same
weight to all the firms in the same sector. Thus, it assumes that the
propensity to benefit from the R&D expenditure in the sector is the same
for all firms. However, by employing this definition, the technological
effort of the sector in which the firm is located is captured and so it serves
as an indicator of the magnitude of the technological effort currently
available in the sector.
On the other hand, it can be supposed that firms which maintain
commercial relationships benefit from the knowledge embodied in the
products in which they trade. Thus, the more they buy and sell, the more

55
they benefit from the knowledge originated in the other sector. This
approach has been called into question by a number of authors on the
grounds that it does not reflect pure knowledge spillovers. However, given
the tacit and “non-codifiable” nature of knowledge, any interaction between
firms is likely to create information flows that generate spillovers. In fact,
the literature highlights the difficulty of drawing a distinction between rent
and pure knowledge spillovers and, for this reason, spillovers here are
defined in this broad sense. Additionally, it is believed that using products
originated in another sector reflects the knowledge associated with them,
assuming that technology is embodied in the purchased goods. For instance,
products bought from the IT industry are likely to have an impact on the
performance of firms in other sectors. Several authors have used this
approach to approximate spillovers (Medda and Piga, 2014). Here,
therefore, the inter-industry externality corresponding to firm i belonging to
sector s is defined in the following way:
????????? = ∑ ??? ∙ ??????≠??≠?
[3.11]
where ????? is R&D stock undertaken in all the other sectors and ??? is
defined as the quotient between the intermediate purchase by sector s of
goods and services supplied by sector m and the total sum of intermediate
purchases of sector s. Thus, the influence that the R&D expenditures of
firms in sector m has on the productivity of firm i in sector s is based on the
relative importance that sector m has as a supplier to sector s. To construct
the weights the symmetric input-output table for Spain for 2005 (the latest
year available) has been used. An exercise of correspondence has had to be
carried out between the branches of business activity according to which
PITEC data are classified and the branches of business activity in the input-
output table.

56
As seen in section 3.2, both positive and negative coefficients are possible.
On the one hand, an external pool of knowledge is expected to have a
positive impact on the production of other firms, since they can benefit
from new knowledge and ideas. However, on the other hand, if rival firms
increase their R&D investment a competitive effect might appear. This is
what some authors refer to as the “market-stealing effect” (De Bondt, 1996;
Bitzer and Geishecker, 2006; Kafouros and Buckley, 2008; Bloom et al.,
2013). Therefore, both possibilities need to be taken into consideration.
As can be seen in expression [3.4], both externalities have been lagged two
periods, since the assumption of a contemporary relationship between them
and firm performance seems inappropriate, given that there is no
immediate impact. On the contrary, it is likely that the diffusion of external
knowledge takes some time before it can affect the firm30.
Controls
The regression controls are represented by technology level and a trend to
capture time changes31.
3.5 Results
3.5.1 Descriptive analysis
Table 3.1 shows the descriptive statistics for the main variables in the
model across the different technology levels.
30 Since the panel is short, externalities have been lagged two years; however, similar results are obtained when they are lagged three or four years.
31 Although industry dummies would capture technological opportunities as well as specificities of the sector, they cannot be included since this would give rise to perfect multicollinearity with the inter-industry externalities.

57
First, it can be seen that sales in manufacturing firms vary slightly with the
level of technology. However, in the case of the service sector, firms that
operate in non-knowledge-intensive services present higher sales than those
reported by their counterparts operating in knowledge-intensive services. In
the case of physical capital, low-tech firms (LTMI and NKIS) show a
somewhat higher ratio than that recorded by high-tech firms (HTMI and
KIS). As expected, firms belonging to service sectors are larger (higher
number of employees) than manufacturing firms. As far as human capital is
concerned, the average percentage of qualified employees is much higher in
more advanced firms. Specifically, in knowledge-intensive services
approximately 42% of workers have completed higher education, a number
that is almost twice that of the average (22.8%).
Innovation is also greater in technologically advanced firms (in both the
industrial and service sectors). In particular, firms belonging to non-
knowledge-intensive services are the ones that invest least in R&D, with a
value (4.97) far below the average (9.95). On the other hand, in both sectors,
firms present higher capital stock than R&D stock. This differential is most
marked in low tech-firms (13.9 vs 10.3 in the industrial sector and 13.7 vs 5
in the service sector). Thus, low-tech firms would appear to be much more
capital intensive than their high-tech counterparts. Finally, the intra-
industry externality presents much greater values in high-tech firms (HTMI
and KIS) – values that are notably above the average, while the inter-
industry externality shows a more uniform distribution.

58
Table 3.1 Descriptive statistics by technology level
Total sample LTMI HTMI NKIS KIS
Mean Sd. Mean Sd. Mean Sd. Mean Sd. Mean Sd.
Sales overall 16.22 1.79 16.24 1.63 16.22 1.60 17.14 1.83 15.78 1.98
between
1.77
1.60
1.58
1.82
1.94
within
0.35
0.32
0.32
0.29
0.42
Physical overall 13.50 4.76 13.87 4.88 13.59 4.23 13.73 5.32 12.81 4.74
capital between
4.36
4.52
3.87
4.77
4.30
within
2.09
2.05
1.89
2.46
2.11
Labour overall 4.44 1.41 4.26 1.20 4.18 1.22 5.10 1.60 4.59 1.60
between
1.40
1.18
1.21
1.60
1.59
within
0.19
0.18
0.17
0.18
0.23
Human overall 22.79 25.66 12.16 13.61 20.88 18.64 13.93 20.03 42.25 33.26
capital between
23.58
11.63
16.63
17.55
29.95
within
10.44
7.13
8.77
9.79
14.78
Innovation overall 9.95 5.99 10.35 5.43 12.69 4.10 4.97 6.15 9.22 6.44
between
5.78
5.23
3.92
5.96
6.20
within
1.45
1.49
1.26
1.57
1.52
Intra-industry overall 698.9 699.05 386.43 276.54 1205.35 671.75 425.35 475.17 755.31 879.20
externality between
674.74
267.28
655.30
406.28
839.13
within
190.49
70.05
130.33
251.15
286.08
Inter-industry overall 489.5 180.90 525.75 163.62 556.25 142.74 426.85 250.83 410.46 153.60
externality between
147.92
124.95
89.01
237.09
113.94
within 103.94 106.42 112.56 74.42 104.37
Obs 50,349
17,470
12,764
6,483
13,632
(%)
(34.7)
(25.3)
(12.9)
(27.1)
Firms 9,115
3,160
2,291
1,152
2,512
(%) (34.7) (25.1) (12.6) (27.6)
Notes: LTMI (low and medium-low tech manufacturing industries), HTMI (medium-high and high tech manufacturing industries), NKIS (non-knowledge-intensive services), KIS (knowledge-intensive services). Between variation means variation across individuals and within variation means variation over time around individual mean. Source: PITEC; own calculations.
In order to test whether there are differences in sales according to
technology level, we conducted a Kruskal-Wallis test. The result clearly
rejects the null hypothesis (p-value=0.0001) of equal population medians32.
32 The nonparametric Kruskal-Wallis test is a safer alternative than parametric tests in which there are concerns about the normality assumptions or suspicions of outlier problems.

59
In addition, from Table 3.1 it can be seen that between variation, i.e.
variation across individuals, is much higher than within variation, i.e.
variation over time for each individual (around the individual mean).
3.5.2 Empirical results
In this section we present the results of the estimates of Equation [3.4]. For
this we use the OP estimator using the “opreg” command from Stata (Yasar,
et al. 2008) to account for the existence of simultaneity and selection bias.
To derive the OP estimator, we define physical capital stock and R&D
stock as “state variables” (since they are quasi-fixed inputs), we consider
labour, human capital and externalities as “free” inputs, the investment in
both physical capital and R&D is our “proxy variable” (or in other words,
the variable that controls for unobserved productivity) and, finally, the
remaining variables are controls.
Table 3.4 shows the results of the estimation for the sample as a whole and
for the sub-samples according to the technology level of the sector in which
the firm operates. Our aim is to determine whether there are differences in
the returns firms obtain from their own R&D expenditures and those
obtained from externalities.
First, it can be seen that, in general, capital stock has a positive impact on
firm performance. Second, the results presented in Table 3.4 show a
positive elasticity regarding the number of employees and, in consonance
with previous research, our findings highlight the role played by human
capital in firm performance.
In line with the literature, R&D stock has a positive impact on the sample as
a whole. However, once the level of technology is taken into account, only
firms belonging to the knowledge-intensive service sector present a positive

60
influence. Surprisingly, in the rest of the sectors the level of a firm’s output
is not related to R&D stock. Although this finding is not common in the
literature, it is not as counterintuitive as it might seem at first glance. First
of all, this result could be related to the motive to invest in R&D. If firms
undertake R&D investment in order to reduce the taxes they have to pay,
their expenditure does not necessarily increase their production. Second, as
pointed out by Griliches (1979), R&D investments might take several years
to have an impact on a firm’s performance. Finally, this result is in line with
the new approach introduced by Crépon, Duguet and Mairesse (1998). In
their seminal paper the authors argue that R&D expenditures do not have a
direct effect on firm productivity, or as the authors say “we explicitly
account for the fact that it is not innovation input (R&D) but innovation
output that increases productivity” (page 116). To sum up33: it is the firm’s
capacity to generate innovations and its ability to translate innovations into
economic performance, rather than R&D investment itself, that might have
an impact on firm’s production. It is our belief that this line of thinking is
quite logical and, moreover, it helps shed light on the results obtained here.
Bearing this in mind, the differences reported here in relation to the level of
technology may suggest, first, that firms in the knowledge-intensive service
sector have a greater capacity to manage their R&D expenditures efficiently.
KIS sectors are characterised by high technology industries (such as
telecommunications, research and development and computer activities)
that could be more adept at transferring their research effort into
innovations, which in turn have a positive impact on production. Second,
manufacturing firms may need more time to generate innovation outcomes
from their R&D investments. For instance, from some interviews conducted
33 It should be borne in mind that the aim here is not to compare the two approaches, but rather to provide a plausible explanation for the results obtained.

61
with Spanish firms it emerged that R&D may take from four to ten years in
the automotive, pharmaceutical or chemistry industry to materialize into
new products. Whereas in the KIS sector new software or a new mobile
phone application, for example, may need less time to be implemented and
to be profitable.
Table 3.2 OP estimates. Estimation results of Equation [3.4] 2004-2009. Dependent variable: ln(sales). Total LTMI HTMI NKIS KIS (1) (2) (3) (4) (5) Physical 0.0367*** 0.0260*** 0.0284*** 0.0218 0.0567*** capital (0.0068) (0.0081) (0.0097) (0.0170) (0.0164) Labour 0.8793*** 0.9464*** 0.9817*** 0.8786*** 0.8000*** (0.0101) (0.0181) (0.0221) (0.0267) (0.0177) Human 0.0030*** 0.0058*** 0.0026*** 0.0082*** 0.0019** capital (0.0004) (0.0009) (0.0008) (0.0018) (0.0007) R&D 0.0122** 0.0108 -0.0059 0.0012 0.0314*** stock (0.0053) (0.0069) (0.0110) (0.0131) (0.0112) Intra-industry -0.0000* 0.0004*** 0.0000* 0.0010*** -0.0003*** externality (0.0000) (0.0001) (0.0000) (0.0001) (0.0000) Inter-industry -0.0002** -0.0001 0.0004* 0.0007*** -0.0012*** externality (0.0001) (0.0001) (0.0002) (0.0001) (0.0001) Trend -0.0131* -0.0394*** -0.0855*** -0.1925*** 0.1240*** (0.0069) (0.0098) (0.0186) (0.0168) (0.0133) HTMI 0.0835*** (0.0217) NKIS 0.1359*** (0.0377) KIS -0.7224*** (0.0275) Obs 50,349 17,470 12,764 6,483 13,632
Note: Low and medium-low tech manufacturing industries (LTMI), medium-high and high tech manufacturing industries (HTMI), non-knowledge-intensive services (NKIS), and knowledge-intensive services (KIS). Externalities are lagged two periods. Reference group: LTMI. Bootstrapped errors in parenthesis (100 replications).*** Significant at 1%, ** significant at 5%, * significant at 10%.
As for the intra-industry externalities, although very small, they present a
negative coefficient in the sample as a whole. Thus, if the rest of the firms
in the same sector increase their R&D expenditure, the production of the
firm falls. Although, if other firms invest in R&D, the pool of knowledge
available in the sector will rise, a competition effect may also appear as

62
firms might be rivals. This could compensate for, or even come to dominate
(as in this case), the benefits derived from the R&D investment of others,
suggesting the existence of a “market-stealing effect”.
The breakdown by technology level illustrates that, in general, intra-
industry externalities have a positive effect on firm output, except in the
case of firms operating in knowledge-intensive services that show negative
return from intra-industry externalities. Although a negative coefficient is
not an “attractive” result, it is completely plausible since firms in this sector
are characterised by a higher degree of technology and this might give rise
to a higher degree of competition. In contrast, the impact is positive on the
rest of the sub-samples. This may seem to contradict the fact that firms do
not increase their production with their own R&D expenditures; however,
the lack of ability to turn investments into innovation does not mean they
cannot benefit indirectly from external knowledge. A possible explanation
might be that firms use the existing external knowledge in the sector to
imitate or “copy” what other firms do, thus acting as “free-riders”. By doing
so, they benefit from the R&D expenditures of others and increase their
sales. Additionally, it might reflect the fact that firms might observe the
results of their competitors’ investment (their successes and failures) and
learn from them, using this external pool of knowledge to be more efficient
in their own production.
In contrast to Beneito’s (2001) findings, here it can be seen that firms
operating in advanced high-tech sectors (HTMI and KIS) benefit less from
the R&D expenditure made by all other firms in their sector than is the case
of firms in less technologically advanced sectors (LTMI and NKIS). There
would appear to be, therefore, a “technology threshold” beyond which firms
benefit less from the R&D expenditure made by all other firms in the sector.

63
This might reflect the fact that in high-tech sectors (especially in KIS) there
is a competition effect which compensates for (or even dominates) the
benefits stemming from external R&D, unlike the situation that prevails in
low-tech sectors.
As for inter-industry externalities, our estimates present a high degree of
heterogeneity. First, in the sample as a whole they affect firm’s sales
negatively. Second, when the sample is broken down according to
technology level, these externalities are not significant for firms operating
in low-tech manufacturing industries. This suggests that firm performance
is not influenced by the innovation carried out by the rest of the sectors that
serve as its suppliers. On the contrary, their effect is positive and significant
in the case of high-tech manufacturing industries. This result is consistent
with the “absorption capacity” hypothesis forwarded by Cohen and
Levinthal (1989), which suggests that the degree to which a firm benefits
from external innovation is strongly dependent on its own innovation
expenditure. Thus, firms with greater technological capital are the ones that
obtain the most benefits from externalities. Advanced firms have better
infrastructure and are probably more capable of understanding and
integrating external knowledge in their products and processes. In the case
of the service sector, once again knowledge-intensive services present a
negative coefficient. This finding could be related to a price increase, given
that suppliers may charge more after investing in R&D and, so, the firm
also raises its prices. Thus, in a competitive environment, as in knowledge-
intensive sectors, this might result in a reduction in sales. On the other hand,
inter-industry externalities show a positive and significant coefficient for
non-knowledge-intensive services, i.e. firms belonging to these sectors
increase their performance thanks to the R&D expenditure of firms
operating in other sectors. This result could reflect the complementarity of

64
the technology effort between the supplier sectors and non-knowledge-
intensive services. It should be remembered that non-knowledge-intensive
services present the lowest R&D stock (see Table 3.1), which would
explain why they benefit most from the investments made by all the other
firms (both in their own sector and in other sectors).
3.6 Further explorations
This section seeks to shed some light on the non-significant impact of R&D
stock on firms’ production (see Table 3.2.). In line with Crépon, Duguet
and Mairesse (1998), there would appear to be a process that leads from
R&D investments to innovation outputs and from there to productivity.
Thus, here, as an initial attempt at adopting this new approach, innovation is
defined from an output perspective. Specifically, innovation is proxied with
a dummy variable that takes a value of 1 if the firm declares that it has
obtained a product or process innovation during the period [t-2, t]. It is
expected that firm’s sales in time t increase if the firm has obtained an
innovation output in the preceding three years.
As can be seen in Table 3.3, when adopting this new definition, innovation
is clearly positive and significant in the sample as a whole and in all sub-
samples. Although, as discussed above, the aim of this chapter is not to
undertake a structural analysis, the results of this section are highly
informative as they suggest that Spanish firms are able to generate a profit
and increase their sales from their innovation outcomes. As such what
needs to be explored in greater depth is the ability to turn R&D investment
into innovation outputs. In line with the literature, advanced firms (HTMI
and KIS) present a greater impact than less advanced companies.

65
Finally, with regard to externalities, it can be seen that the results in Table
3.3 are very similar to those obtained earlier. Low-tech firms benefit from
intra-industry externalities, while knowledge-intensive services show a
negative coefficient. In the case of inter-industry externalities, the same
heterogeneous impact can be observed.
Table 3.3 OP estimates. Estimation results of Equation [3.4] 2004-2009. Dependent variable: ln(sales). Total LTMI HTMI NKIS KIS (1) (2) (3) (4) (5) Physical 0.0381*** 0.0316*** 0.0290*** 0.0159 0.0713*** capital (0.0071) (0.0088) (0.0101) (0.0189) (0.0216) Labour 0.8833*** 0.9675*** 1.0117*** 0.8916*** 0.7914*** (0.0099) (0.0170) (0.0205) (0.0251) (0.0156) Human 0.0045*** 0.0073*** 0.0042*** 0.0090*** 0.0033*** capital (0.0004) (0.0010) (0.0008) (0.0015) (0.0006) Innovation 0.1771*** 0.0581** 0.0904*** 0.1550*** 0.2650*** (output) (0.0194) (0.0255) (0.0342) (0.0576) (0.0484) Intra-industry 0.0000 0.0004*** 0.0000 0.0010*** -0.0002*** externality (0.0000) (0.0001) (0.0000) (0.0001) (0.0000) Inter-industry -0.0001* -0.0000 0.0004** 0.0007*** -0.0011*** externality (0.0001) (0.0001) (0.0002) (0.0002) (0.0002) Trend -0.0175** -0.0449*** -0.0866*** -0.1967*** 0.1109*** (0.0072) (0.0112) (0.0178) (0.0202) (0.0147) HTMI 0.0914*** (0.0261) NKIS 0.1172*** (0.0318) KIS -0.7289*** (0.0286) Obs 50,349 17,470 12,764 6,483 13,632
Note: Low and medium-low tech manufacturing industries (LTMI), medium-high and high tech manufacturing industries (HTMI), non-knowledge-intensive services (NKIS), and knowledge-intensive services (KIS). Externalities are lagged two periods. Reference group: LTMI. Bootstrapped errors in parenthesis (100 replications).*** Significant at 1%, ** significant at 5%, * significant at 10%.
3.7 Concluding remarks
This chapter has studied the extent to which the level of technology of a
firm affects the returns that firms in Spain can obtain from their own
investment in R&D activities and from the R&D carried out by all other

66
firms (both in the same sector and in other sectors). In particular, the
research questions posed at the beginning of this chapter were: (i) Does the
impact of innovation on firm performance differ according to a firm’s level
of technology? (ii) Are Spanish firms able to benefit from externalities? (iii)
And if so, do these benefits vary according to a firm’s technology level?
A Cobb-Douglas production function has been employed, including not
only firm own R&D investments but also intra-industry and inter-industry
externalities. The empirical analysis is applied to a panel data of Spanish
firms from 2004 to 2009 using the Olley and Pakes estimator to account for
simultaneity and selection bias. By doing so, it is possible to obtain robust
and consistent estimates allowing for firm heterogeneity, simultaneity and
selection biases.
The following conclusions can be drawn. In the first place, when the whole
sample is taken into consideration, the expected positive impact of R&D
investment is found. In the second place, and contrary to expectations, the
results according to the level of technology suggest that, in general (with
the exception of KIS), R&D expenditures do not have a direct impact on
firm sales. Although this result is unexpected, it is in line with the Crépon,
Duguet and Mairesse (1998) approach, which holds that there is a
sequential process leading from R&D to innovation outputs and from there
to productivity. Therefore, the result obtained here, although somewhat
surprising, provides us with valuable information in this regard. Specifically,
when innovation is proxied by innovation output (as opposed to innovation
input, i.e., R&D), the results clearly present positive coefficients. Therefore,
with respect to the first research question, it can be concluded that the
impact of innovation output differs according to the level of technology,

67
being notably greater for those firms that operate in high-tech sectors
(HTMI and KIS).
Interestingly, the “inability” of firms to benefit from their own R&D efforts
does not prevent them from benefiting from external knowledge. In
particular, it has been seen that, although the impact is negative for the
sample as a whole, in most technology levels Spanish firms increase their
sales when the rest of the firms in their sector increase their R&D
expenditure. Specifically, low-tech sectors manage to benefit to a greater
extent from the R&D expenditure carried out by all the other firms in the
same sector. This result could indicate that firms of this type seek to
compensate for their smaller investment effort by taking advantage of
innovation originating in firms in the same sector. It might also reflect the
fact that high-tech sectors face higher competition, probably due to the
higher degree of technology, which compensates or dominate the benefits
stemming from external R&D.
Inter-industry externalities have been shown to play an ambiguous role and
there would appear to be no specific pattern of behaviour associated with
different levels of technology. However, the results suggest the presence of
a certain complementarity for the technological efforts with supplier sectors
in the case of firms belonging to high-tech manufacturing industries and
non-knowledge-intensive services.
In short, and in answer to the second research question, it has been shown
that Spanish firms are able to benefit from spillovers. Moreover, these
benefits depend to some extent on the technology level – which results in an
affirmative answer to the last question. More specifically, technology level
appears to have an influence on intra-industry externalities, i.e., the more
advanced the firm, the less benefits it derives from intra-industry

68
externalities, while its effect is much more ambiguous in the case of inter-
industry externalities.

69
Chapter 4: The importance of
spillovers using the CDM model

70

71
4.1 Introduction34
Since the publication of Crépon, Duguet and Mairesse’s seminal paper in
1998, the way of examining the relationship between innovation and
productivity has changed. Whereas the traditional literature relied on R&D
expenditure as a proxy for innovation – including it as an additional input in
the production function, these authors proposed fitting a structural model
(also known as CDM model). This new approach allows us to distinguish
between two processes: (i) the generation of innovations from R&D
expenditures and (ii) the impact of these innovations on firm performance.
Thus, the topic that for so many decades has generated so much interest
among researchers is now being addressed from a different perspective.
It might be thought that the more a firm invests in R&D, the more its
productivity rises. However, unfortunately, this is not true. Why? Because
the firm first has to be able to turn its investment into innovations and then
translate these innovations into economic performance 35 . As one can
imagine, not all R&D expenditures result in successful innovations and not
all innovations have an immediate impact on productivity. Hence, if a firm
seeks to increase its productivity, it not only needs to invest in R&D
activities, it must also have the necessary mechanisms to transform this
investment into innovations that can raise its productivity.
The results obtained in the previous chapter suggest that R&D does not
have the expected strong, positive effect when it is used as a proxy for
innovation. On the contrary, when innovation is defined from an output
34 I am very grateful to Elena Huergo and Joaquín Artés who kindly read this chapter. Their comments and suggestions have been very useful.
35 At the end of the day, innovations are designed to improve firm performance and competitiveness (Peters, 2008).

72
perspective, a clear positive impact emerges. This chapter, therefore, aims
at enhancing the ideas developed in the previous chapter by analysing the
relationship between innovation and productivity from the perspective
provided by the CDM model. Specifically, the main goal of this chapter is
to assess the extent to which the innovations carried out by others might
impact on a firm’s behaviour and on a firm’s performance. As explained in
earlier sections, the benefits from research efforts are not fully appropriable
by their producers. On the contrary, knowledge generated inside a firm may
spill over and become available for other firms that can use it for “free”
(assimilation costs aside – see Chapter 1). To the best of our knowledge, no
previous paper has examined spillover effects by applying the CDM model.
It is also worth mentioning that most papers employing a structural model
use cross-sectional data 36 and control for neither unobserved firm
heterogeneity nor the time lag between the different stages of the model. In
this regard, this study seeks to shed further light on the research question by
analysing the case of Spain drawing on the PITEC database for the period
2004 to 2010. An additional improvement on other studies is that here both
manufacturing and service firms are considered, together with their
different levels of technology.
Overall, our purpose is to determine the extent to which external knowledge
can have an impact across the structural model. For this reason not only do
we consider the effect of external knowledge on a firm’s productivity (last
stage of the model), but we also take into consideration whether a firm’s
decision to engage in R&D activities or not might be influenced by the
actions taken by other firms (first stage). Specifically, this chapter seeks to
address the following questions: (i) Is a firm’s decision as to whether or not 36 Exceptions include Chudonovsky et al. (2006) and Huergo and Moreno (2011).

73
to engage in R&D activities affected by what other firms in its sector do? (ii)
Do Spanish firms benefit from the innovations carried out by the rest of the
firms in its sector and in other sectors?
Chapter 3 concluded that the level of technology of the sector in which a
firm operates leads to different results; however, it was not possible to
establish a clear pattern. For this reason, this factor is again taken into
consideration in order to see if a clearer pattern emerges.
The rest of the chapter presents the literature review in section 4.2, the
empirical model in section 4.3, the variables in section 4.4, the main
findings in section 4.5 and finally the conclusions are drawn in section 4.6.
4.2 What do we know so far?
As discussed in the previous chapter, since the seminal papers of Griliches
(1979, 1986), many studies have been published analysing the impact of
innovation on firm productivity. However since the publication of Crépon,
Duguet and Mairesse (1998), the approach taken in this line of the literature
has shifted, moving from an input definition of innovation37 to an output
perspective. These authors estimate a structural model involving three steps:
(i) the firm’s decision whether or not to engage in R&D activities, and the
intensity of that investment, (ii) the realization of innovations from R&D
expenditures and (iii) the relationship between innovation output and firms
productivity. In this way, the structural model enables an analysis to be
undertaken not solely of the relationship between innovation input and
productivity, but of the whole process (the firm’s decision to innovate, its
37 Typically this has been proxied as R&D expenditures and included in the production function as an additional input.

74
innovative effort, production of innovation outcomes and the impact of
these “successful” innovations on the firm’s productivity).
Due to the increasing availability of innovation survey data at the micro
level, many authors rely on the CDM model to analyse the impact of
innovation on firm productivity (see Hall and Mairesse, 2006 for a survey,
as well as Janz et al., 2004 for Germany and Sweden; Lööf and Heshmati,
2006 for Sweden; Benavente, 2006 for Chile; Jefferson et al., 2006 for
China; Griffith et al., 2006, who carry out a comparative study of France,
Germany, Spain and the United Kingdom; Masso and Vahter, 2008 for
Estonia; Raffo et al., 2008 for a comparison across European and Latin
American countries; Hall et al., 2009 and Antonietti and Cainelli, 2011 for
Italy to name just a few). In the case of Spain no more than a few papers
have attempted to apply the structural model and then, in some instances,
the sample has been restricted to the manufacturing firms using the ESEE
dataset (Huergo and Moreno, 2004; 2011). Other papers have sought to
overcome this limitation and study both manufacturing and service sectors;
yet, here the geographical area of analysis has been more limited (see for
example, Segarra-Blasco, 2010, and Segarra-Blasco and Teruel, 2011 for
Catalonia).
As discussed previously, most studies use cross-sectional data and only a
few employ panel data. Some exceptions are Chudnovsky et al. (2006) who
applies a CDM model to a balanced panel of Argentinian manufacturing
firms for the period 1992-2001. Heshmati and Kim (2011) use a structural
model for Korean firms from 1986 to 2002. Finally, Huergo and Moreno
(2011) study the case of Spain using an unbalanced panel of 1,072

75
manufacturing firms (ESEE database) for 1990-200538. In line with these,
the present study contributes to the scarce literature by using a panel
structure with a CDM model. This enables us to control for both
unobserved firm heterogeneity and the time lag across the whole process
(from the firm’s decision to engage in R&D activities or not to its impact on
productivity through innovation output).
It is worth mentioning that other authors also employ panel data; however,
they focus on just one part of the structural model. For instance, Artés
(2009) studies the relationship between R&D and market concentration in
Spain using data from ESEE. The author adopts a Heckman-type model to
capture both the long-run decision (whether to conduct R&D activities or
not) and the short-run decision (how much to invest in these projects).
Lhuillery (2011) also focuses his attention on the first stage of the CDM
model (the research equation) using the Swiss innovation panel to measure
the importance of incoming external knowledge. In contrast, Huergo (2006),
Du et al. (2007) and Raymond et al. (2010) consider the innovation
equation (the second stage of the CDM model) to analyse the role played by
R&D in the process of generating innovations using panel data (for Spain,
Ireland and the Netherlands).
As some evidence points out, the impact of innovation on firm productivity
may depend on the level of technology operated by that firm (as noted in
Chapter 3). While many articles tackle this question from the production
function perspective (see for instance, Verspagen, 1995; Tsai and Wang,
38 In this case, the authors focus their attention on the persistence in firms’ behaviour.
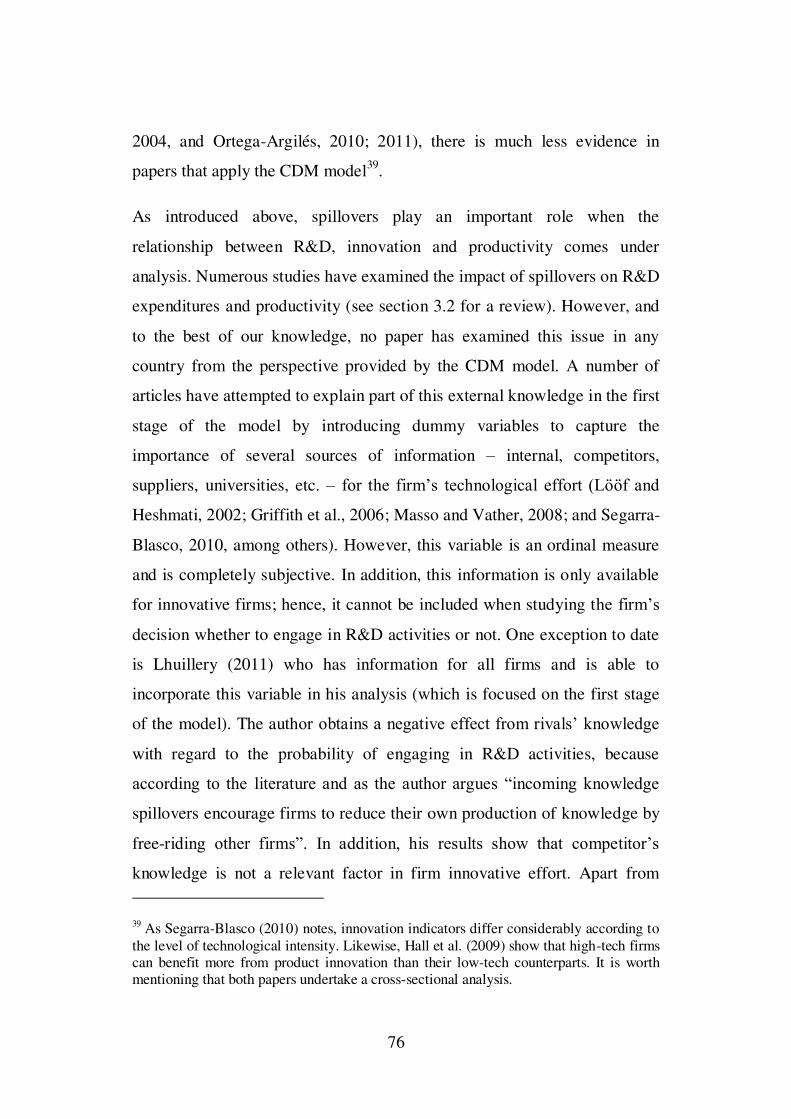
76
2004, and Ortega-Argilés, 2010; 2011), there is much less evidence in
papers that apply the CDM model39.
As introduced above, spillovers play an important role when the
relationship between R&D, innovation and productivity comes under
analysis. Numerous studies have examined the impact of spillovers on R&D
expenditures and productivity (see section 3.2 for a review). However, and
to the best of our knowledge, no paper has examined this issue in any
country from the perspective provided by the CDM model. A number of
articles have attempted to explain part of this external knowledge in the first
stage of the model by introducing dummy variables to capture the
importance of several sources of information – internal, competitors,
suppliers, universities, etc. – for the firm’s technological effort (Lööf and
Heshmati, 2002; Griffith et al., 2006; Masso and Vather, 2008; and Segarra-
Blasco, 2010, among others). However, this variable is an ordinal measure
and is completely subjective. In addition, this information is only available
for innovative firms; hence, it cannot be included when studying the firm’s
decision whether to engage in R&D activities or not. One exception to date
is Lhuillery (2011) who has information for all firms and is able to
incorporate this variable in his analysis (which is focused on the first stage
of the model). The author obtains a negative effect from rivals’ knowledge
with regard to the probability of engaging in R&D activities, because
according to the literature and as the author argues “incoming knowledge
spillovers encourage firms to reduce their own production of knowledge by
free-riding other firms”. In addition, his results show that competitor’s
knowledge is not a relevant factor in firm innovative effort. Apart from 39 As Segarra-Blasco (2010) notes, innovation indicators differ considerably according to the level of technological intensity. Likewise, Hall et al. (2009) show that high-tech firms can benefit more from product innovation than their low-tech counterparts. It is worth mentioning that both papers undertake a cross-sectional analysis.

77
these attempts to include spillovers in the first stage of model, no other
evidence using the CDM approach is available, to the best of our
knowledge.
Given this preliminary evidence, this chapter aims to contribute to the
existing (and short) literature with regard to the use of panel data within a
structural model framework. The main challenge is to determine whether
external knowledge has an impact on the firm’s decision to engage or not in
R&D projects (first stage of the model) and/or on firm’s productivity (last
stage of the model) in Spain. Finally, given that Chapter 3 points to
different outcomes depending on the level of technology, but do not allow
the drawing of relevant conclusions, it would be interesting to assess the
role played by technology in this process. In addition, given the small body
of literature examining this question from the perspective provided by the
CDM model, and the lack of consensus, it would be interesting to clarify
this issue for the Spanish case.
4.3 Model and estimation strategy
The model adopted to estimate the relationship between innovation and
productivity is a modified version of the CDM model (see Griffith et al.,
2006). Moreover, we extend the original model by introducing measures of
external knowledge in two equations as is shown below. The model, which
consists of three stages, can be formalized in four sequential equations40.
See section 4.4 for a full description of the variables.
40 It is worth pointing out that it is a recursive model, hence feedback effects are not allowed (Griffith, et al., 2006).

78
4.3.1 First stage: The research equations
This first stage of the model is concerned with the firm’s research activities,
modelling the process that leads the firm to decide whether or not to
undertake a research project, and how much to invest in it. The intensity of
R&D investment can be observed if, and only if, firms actually choose to
spend on R&D. So, the first equation is a selection equation indicating
whether the firm performs R&D activities or not, and can be specified as:
???? = { 1 ?? ????∗ = ???(1)?(1) + ???−1
? + ??(1) + ???
(1) > ? 0 ?? ????∗ = ???
(1)?(1) + ???−1? + ??
(1) + ??? (1) ≤ ? [4.1]
where i indexes the firm, j indexes the firm’s sector and t indexes the
year.???? is an (observable) indicator function that takes a value of 1 if the
firm decides to undertake R&D activities, ????∗ is a latent indicator variable
whereby the firm incurs R&D expenditures if these are above given a
threshold ?̅, ???(1) is a set of explanatory variables and ??−1
? is our measure of
external knowledge lagged one year. Finally, ??(1) captures the unobserved
firm heterogeneity and ??? (1) is an error term.
In line with our main goal, the most relevant variable here is the spillover
measure that seeks to assess how a firm’s decision to engage in R&D
activities might be affected by what other firms have done in the previous
period (see next section for a detailed definition).
We estimate Equation [4.1] using a random effects probit model given the
panel structure and the binary character of the dependent variable (see Artés,
2009; Heshmati and Kim, 2011 and Lhiullery, 2011). This random effect
structure has a major limitation since it relies on the assumption that the
errors are not correlated with the regressors. In the case of this assumption

79
not holding, the estimates would be inconsistent. To deal with this problem
it is possible to parameterise the effect. To do so we augment the model
with the Mundlak specification41; in other words, we include a vector of the
means of the time-variant regressors as control variables to allow for some
correlation between the random effect and the regressors (Mundlak, 1978).
The second equation is the intensity equation that can be specified as:
????? = {?????∗ = ???(2)?(2) + ??
(2) + ??? (2) ?? ???? = 1
0 ?? ???? = 0 [4.2]
where RDIit* is the unobserved latent variable accounting for firm’s
innovative effort, ???(2) is a set of determinants of innovation expenditures,
??(2) captures the unobserved firm heterogeneity and ???
(2) is an error term. In
this equation, we do not incorporate a spillovers measure, because we
believe that the investment intensity is much more dependent on internal
factors (such as, availability of funding) than on what other firms do42.
This equation is estimated using the consistent estimator proposed by
Wooldridge (1995)43. This method consists of two steps. In the first, a
selection equation for each year is estimated using a probit model. By doing
so, T inverse Mills ratios are obtained (one for each year). The second step
is to estimate a pooled OLS including the T inverse Mills ratios interacted
with time dummies for the selected sample (???? = 1). This procedure
41 Thus, we allow the individual effects to be correlated with the within-individual means of the regressors.
42 Besides, as discussed in the previous section, Lhuillery (2011) finds that knowledge spillovers originating from competitors are a factor to take into account in the first but not in the second equation.
43 Given that Heckman type selection model (1979) is not available for panel data; Wooldridge (1995) is followed to address the selection problem.
80
allows us to account for the selection bias through the inclusion of the
correction terms, the inverse Mills ratios, in the second step. In addition, as
Wooldridge (2002) points out, an exclusion restriction is needed in order to
avoid multicollinearity problems, since inverse Mills ratios have been
incorporated in the second equation.
4.3.2 Second stage: The innovation equation (innovation
production function)
This step links the research activities above to innovation output. Thus, the
third equation is the innovation production function:
??(?−2,?) = ????̂ ??−2 + ???(3)?(3) + ??
(3) + ???(3) [4.3]
where ??(?−2,?) is an innovation output indicator that takes a value of 1 if the
firm develops an innovation during the preceding three years (t-2, t-1 or t),
and ???̂ ??−2 is the innovation effort predicted from Equation [4.2] and
lagged two periods44. ???(3) is a vector of other determinants of knowledge
production, ??(3) captures the unobserved firm heterogeneity and ???
(3) is an
error term.
The innovation production function is estimated using a random effect
probit model (see Huergo, 2006) and includes a vector of the means of the
time-variant regressors as control variables. This allows individual effects
44 Two lags (R&Dt-2) are chosen because this is the minimum lag for explaining innovation (Ii(t-2,t)). R&Dt-1 would not explain innovation obtained in the period [t-2,t], since innovations in t-2 cannot be due to investments in t-1. Certainly, more lags may be needed since it is generally accepted that investments in R&D take some time to materialise in something new or because completing an R&D project might take more than one year. However, as PITEC is a short panel and the information available at this stage of the model will be reduced to four years, it is decided to work with two lags. In addition, by including lags a possible simultaneity problem may be mitigated.

81
to be correlated with the within-individual means of the regressors
(Mundlak, 1978).
4.3.3 Third stage: The productivity equation (production function)
This last step is modelled using an augmented Cobb-Douglas production
function. It is assumed that a firm’s productivity is dependent both on its
own investment and on external knowledge:
??? = ??̂?(?−2,?) + ???(4)?(4) + ????−1
?,????? + ????−1?,????? + ??
(4) + ???(4) [4.4]
where i indexes the firm, j indexes the firm’s sector and t indexes the year.
??? is labour productivity; ?̂?(?−2,?) is the innovation output predicted from
Equation [4.3]; ???(4) is a set of explanatory variables (which include: labour,
physical and human capital); ???−1?,????? and ???−1
?,????? are the intra- and inter-
industry externalities lagged one period respectively. Last, ??(4) captures the
unobserved firm heterogeneity and ???(4) is the error term.
As can be seen in Equation [4.4], and as a key feature of this study, industry
spillovers are incorporated in the Cobb-Douglas production function. Thus,
assuming that an external effect exists because of the public nature of
knowledge, two types of externality are considered: intra-industry
externalities (????,?????) which capture the innovation effort made by all the
other firms in the same sector, and inter-industry externalities (????,?????),
understood as the innovation effort made by the rest of the firms in all other
sectors (see next section for a detailed definition).
In line with previous equations, this final step is estimated by a random
effects model. To sum up, our model comprises Equations [4.1], [4.2], [4.3]
and [4.4] which are estimated sequentially. Following Griffith et al (2006),

82
all firms are included in the analysis even if they do not report any R&D
expenditures. As the authors explain, it is believed that all firms engage in
some innovative effort, albeit that they do not report it. For instance, firms
may invest in other innovation expenditures, not just in R&D. In addition,
as the authors recognise, workers are likely to spend some of their time
thinking about how to improve their performance and how they can be
more efficient in their jobs. Finally, firms may well invest in physical
capital, which incorporates new knowledge. Therefore, although it is
perhaps most logical for an innovation to be developed once a firm invests
in R&D, this does not rule out other possibilities.
To the best of our knowledge, none of the empirical articles analysing the
relationship between innovation and productivity based on the CDM model
considers externalities.
4.4 Data and variables
The data used in this chapter comprise an unbalanced panel of 9,042 firms
(57,379 observations) for the period 2004-2010. According to the model
adopted in this chapter, the sample is restricted to firms that are present in
the three stages of the model. Therefore, we retain all those that remain at
least three years in a row in the panel. This filter results in a sample that is
more than 90% of the whole unbalanced panel (63,615 observations). Table
A.3 in the Appendix shows that the properties of the sample are preserved
after this change.
Below we present the variables used in estimating each stage of the model.
A detailed definition of each variable can be found in Table 4.1.

83
Table 4.1 Definition of variables Firms’ characteristics Labour productivity Sales per employee in t (in logs). Firm size Number of employees in t (in logs). Physical capital Physical capital per employee in t. Stock measure using the
perpetual inventory method (in logs). Advanced machinery Investment in acquisition of advanced machinery, equipment
(including computer hardware) or software to produce innovations per employee in t-2. Stock measure using the perpetual inventory method (in logs).
Human capital Percentage of employees with higher education in t. Group Dummy variable that takes the value 1 if the firm belongs to a
group in t; 0 otherwise. International competition
Dummy variable that takes the value 1 if the firm traded in an international market during the period [t-2, t]; 0 otherwise.
Knowledge / Innovation R&D engagement Dummy variable that takes the value 1 if the firm has a positive
R&D expenditure (intramural and/or extramural) in t; 0 otherwise. R&D intensity Intramural and/or extramural R&D expenditure per employee in t
(in logs). Continuous R&D Dummy variable equals 1 if the firm performs R&D continuously,
and 0 if it is occasional or the firm does not perform any R&D. Personnel in R&D Personnel working on internal R&D in t-2 (in logs). Process innovation Dummy variable which takes the value 1 if the firm reports having
introduced a new or significantly improved production process during the period [t-2, t]; 0 otherwise.
Product innovation Dummy variable which takes the value 1 if the firm reports having introduced a new or significantly improved product during the period [t-2, t]; 0 otherwise.
Protection Dummy variable which takes the value 1 if the firm uses patents, a design pattern, trademarks or copyright to protect inventions or innovations during the period [t-2, t]; 0 otherwise.
Cooperation Dummy variable which takes the value 1 if the firm cooperated with others to carry out innovation activities during the period [t-2, t]; 0 otherwise.
External knowledge Spillover (Eq [4.1])
Proportion of firms in the same sector undertaking R&D activities in t-1.
Intra-industry Spillover (process) (Eq [4.4])
Sum of the R&D stock incurred by the rest of the firms in the same sector in the previous two years provide that they achieve a successful process innovation in the next three years; 0 otherwise.
Intra-industry Spillover (product) (Eq [4.4])
Sum of the R&D stock incurred by the rest of the firms in the same sector in the previous two years provide that they achieve a successful product innovation in the next three years; 0 otherwise.
To be continued on the next page
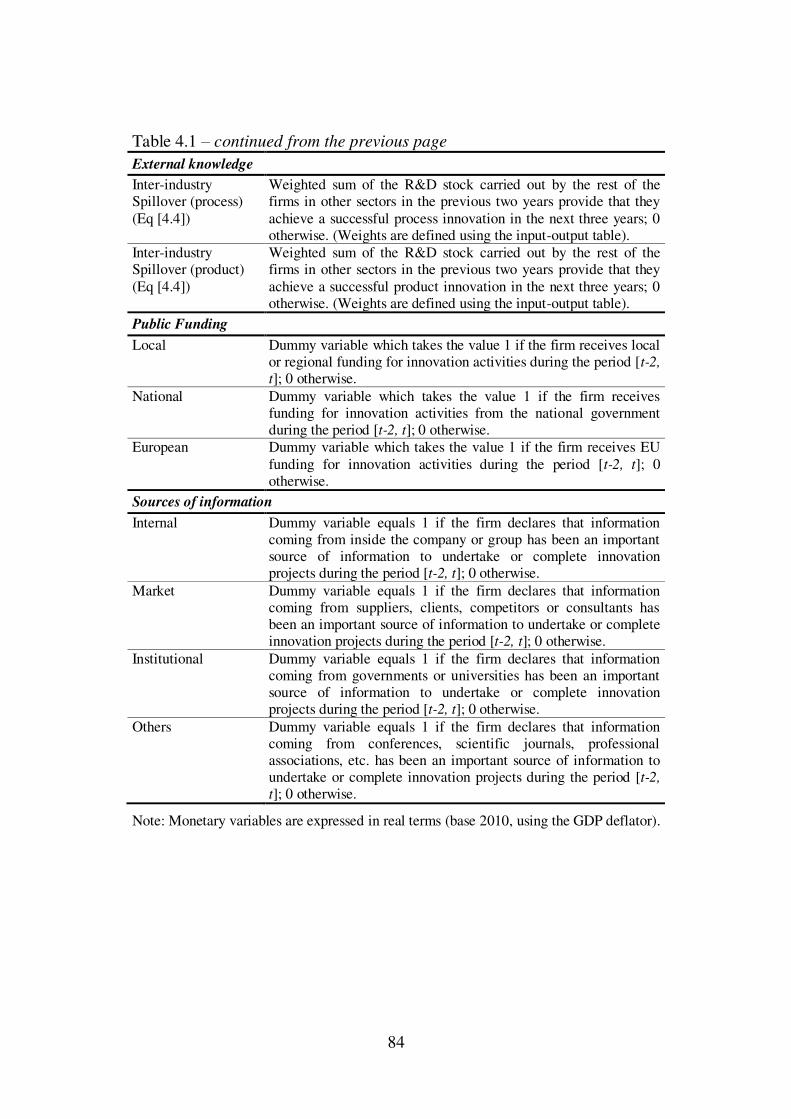
84
Table 4.1 – continued from the previous page External knowledge Inter-industry Spillover (process) (Eq [4.4])
Weighted sum of the R&D stock carried out by the rest of the firms in other sectors in the previous two years provide that they achieve a successful process innovation in the next three years; 0 otherwise. (Weights are defined using the input-output table).
Inter-industry Spillover (product) (Eq [4.4])
Weighted sum of the R&D stock carried out by the rest of the firms in other sectors in the previous two years provide that they achieve a successful product innovation in the next three years; 0 otherwise. (Weights are defined using the input-output table).
Public Funding Local Dummy variable which takes the value 1 if the firm receives local
or regional funding for innovation activities during the period [t-2, t]; 0 otherwise.
National Dummy variable which takes the value 1 if the firm receives funding for innovation activities from the national government during the period [t-2, t]; 0 otherwise.
European Dummy variable which takes the value 1 if the firm receives EU funding for innovation activities during the period [t-2, t]; 0 otherwise.
Sources of information Internal Dummy variable equals 1 if the firm declares that information
coming from inside the company or group has been an important source of information to undertake or complete innovation projects during the period [t-2, t]; 0 otherwise.
Market Dummy variable equals 1 if the firm declares that information coming from suppliers, clients, competitors or consultants has been an important source of information to undertake or complete innovation projects during the period [t-2, t]; 0 otherwise.
Institutional Dummy variable equals 1 if the firm declares that information coming from governments or universities has been an important source of information to undertake or complete innovation projects during the period [t-2, t]; 0 otherwise.
Others Dummy variable equals 1 if the firm declares that information coming from conferences, scientific journals, professional associations, etc. has been an important source of information to undertake or complete innovation projects during the period [t-2, t]; 0 otherwise.
Note: Monetary variables are expressed in real terms (base 2010, using the GDP deflator).

85
Apart from the variables described, we control for time and industry
effects45. Industry dummies capture technological opportunities and specific
industry characteristics. Note, however, that they are not included in either
the first or the last equations given that we incorporate spillovers. We are
aware, especially in the last equation, that spillovers might be capturing not
only external knowledge but also specificities of the sector. Unfortunately,
industry dummies cannot be incorporated since there would be perfect
multicollinearity with the inter-industry spillover variable. This is mitigated
to some extent by the fact that we estimate according to technology level
(low-tech and high-tech manufacturing firms, and knowledge-intensive and
non-knowledge-intensive services).
4.4.1 First stage
In Equation [4.1] our endogenous variable is proxied by a dummy variable
that takes a value of 1 if the firm has positive R&D expenditures
(intramural and/or extramural).
As determinants of a firm’s engagement in R&D activities, we include firm
size, measured as the logarithm of the number of workers – which reflects
scale economies and access to finance; physical capital stock per employee,
using the perpetual inventory method (see section 3.4.2); and human capital,
measured as the percentage of workers with higher education. We also
include a dummy variable that takes a value of 1 if the firm belongs to a
group – which might not only reflect access to finance, but also (as Mohnen
et al., 2006, points out) intra-group knowledge spillovers, or other synergies
in different areas such as marketing or distribution. We incorporate a
dummy variable indicating whether the firm has operated in an international 45 Although it would be interesting to control also for firm age, PITEC did not provide this information until 2009. Therefore it is not available for all firms in the sample.

86
market in the preceding three years. As Ganotakis and Love (2011) explain
strong competition in foreign markets encourages firms to invest in R&D in
order to be competitive. Besides, a “learning by doing” effect could appear
as well as a scale effect, given that most R&D costs are fixed, and exporting
to new markets increases sales. We capture appropriability conditions
through a dummy variable equal to 1 if the firm protected its innovations
during the previous three years (here we take into account not only patents,
but also copyrights, trademarks and so on). It is believed that the
appropriation of benefits from innovation activities increases the likelihood
of undertaking R&D projects. Three dummy variables indicating whether
the firm received public funding for R&D activities over the preceding
three years are also included – those firms that receive such subsidies are
expected to have a greater propensity to carry out R&D activities.
Finally, the main variable of interest at this point is the spillover, which is
introduced in the model in order to capture if a firm’s decision to undertake
R&D projects is affected by the decisions of other firms in its sector. It is
defined as follows:
??? = ??
?
??? ∙ 100 [4.5]
where ??? is the number of firms undertaking R&D projects in the sector j
and ??? is the total number of firms in sector j. Thus, assuming that firm i
operates in sector j, we define the spillover as the proportion of firms in the
same sector undertaking R&D activities46. This variable is lagged 1 year.
46 We have also taken into consideration other definitions of spillover (for example, a definition based on intra-industry R&D expenditures), but they were found not to be relevant.

87
There are two different consequences of knowledge spillovers. On the one
hand, a positive effect might be recorded, given that an external pool of
knowledge could serve as an incentive and encourage firms to undertake
R&D activities. This would be in line with the idea of absorptive capacity
(Cohen and Levinthal, 1989), whereby firms are interested in investing in
R&D so as to be able to benefit from external knowledge. Additionally,
firms might decide to take part in R&D projects because they want to
improve their competitiveness vis-à-vis their rivals. Therefore, the greater
the proportion of firms undertaking R&D projects in a sector, the higher the
probability a firm would have of engaging in such activities. On the other
hand, a negative effect is also plausible. In particular, a disincentive effect
might arise as firms may see external knowledge as a substitute for their
own production of knowledge. Thus, they prefer to adopt a free-riding
behaviour instead of making their own technological effort (in line with
Lhuillery, 2011).
In equation [4.2] we define our endogenous variable, R&D intensity, as the
logarithm of intramural and extramural R&D expenditures per employee.
The explanatory variables in this case are the same as those in Equation [4.1]
with the exception of firm size. Following the literature, this variable is
selected as an exclusion restriction to provide more robust estimations. A
dummy variable indicating whether a firm cooperated with others to carry
out its R&D projects in the previous three years is also added. This variable
captures the external knowledge shared between firms that decide to
collaborate. It is worth stressing that this information is only available for

88
innovative firms, which is why we have been unable to include it in
Equation [4.1] 47.
4.4.2 Second stage
In Equation [4.3] two definitions of innovation output are considered:
process innovation and product innovation. The former is defined as a
dummy variable equal to 1 if the firm has introduced at least one process
innovation over the last three years. Process innovation improves
production techniques, reduces costs, etc. leading to higher productivity
performance. On the other hand, product innovation is defined as a dummy
variable equal to 1 if the firm has introduced at least one product innovation
over the last three years. This kind of innovation is more closely associated
with product differentiation and the creation of new markets, leading to an
increase in a firm’s sales48.
As explanatory variables in Equation [4.3], we include the predicted value
of R&D intensity obtained in Equation [4.2] lagged two years as a proxy for
innovative effort. By so doing, R&D investments carried out in t-2 may turn
into an innovation in t-2, t-1 and/or t. Firm size, investment in advanced
machinery, equipment or software to produce innovations and personnel in
R&D are included and lagged two periods. We also incorporate a set of
dummy variables, including having used protection methods, operating in
international markets, declaring information from outside the company as
47 As discussed in Chapter 2, unfortunately not all firms are requested to answer all the survey questions, while the firms that engage in innovation activities have to complete a larger number of items. For this reason more information is available for Equation [4.2], while we only have limited information for Equation [4.1].
48 Some articles analyse solely the impact of process innovation on productivity (see for instance Vivero, 2002; Huergo and Jaumandreu, 2004b; Rochina-Barrachina et al., 2010 and Mañez et al., 2013). However, here, both definitions are considered so as to obtain a broader picture of the situation.

89
an important source of information and performing R&D continuously
(lagged two years). It is thought that by regularly investing in R&D a firm
can increase its probability of obtaining an innovation, unlike a firm which
only occasionally makes such investment49.
4.4.3 Third stage
In the final step of the model, Equation [4.4], labour productivity is defined
as the logarithm of sales per employee. As explanatory variables we include
the traditional inputs of labour and physical capital defined previously.
Human capital is also included in order to capture the fact that the higher
the workers’ qualifications, the more efficiently they carry out their tasks,
and the more productive the firm tends to be. We also incorporate
innovation output, proxied by the process or product innovations predicted
in Equation [4.3] and which refers to period [t-2, t]. Finally, two measures
of spillovers are included: intra-industry and inter-industry externalities.
These externalities are defined in line with Chapter 3 above, although they
are modified in order to fit the CDM approach better. In other words, the
CDM model explains productivity in terms of innovation output as opposed
to innovation input. Thus, here, our definition of externalities also needs to
be in line with this idea. The definition of spillovers presented below seeks
to capture, therefore, not only the knowledge flow in the sector, but also the
fact that firms achieve a successful innovation output thanks to this
knowledge (see Beneito, 2001).
49 Continuity is a factor to take into consideration, as pointed out by several authors (for instance, Huergo and Moreno, 2011) that study the persistence of innovation.

90
Hence, intra-industry spillovers corresponding to firm i belonging to sector
j in year t are defined as follows:
????,????? = ∑ (???−2
? ∗ ??(?−2,?)? )?≠? [4.6]
where ???−2?
is R&D stock incurred by the rest of the firms in the same
sector in the previous two years and ??(?−2,?)? is an indicator variable equals
to 1 if firms have achieved successful innovation output (process or product
innovation) in the following three years, or 0 otherwise. By using this
definition we are able to capture the technological effort of the sector in
which the firm is located, bearing in mind that firms not reporting any
effective innovation results are not included in the calculation of the
spillover variable50.
Likewise, inter-industry spillovers corresponding to firm i belonging to
sector j at year t are defined as:
????,????? = ∑ ???(???−2? ∗ ??(?−2,?)? )?≠?
?≠? [4.7]
where ???−2? is R&D stock carried out by the rest of the firms that operate in
the rest of the sectors in the previous two years; ??(?−2,?)? is an indicator
variable equal to 1 if these firms have achieved successful innovation
output (process or product innovation) in the following three years, or 0
otherwise; and wjm are the weighs indicating the relative importance that
sector m has as a supplier to sector j. As in Chapter 3, they are defined as
the quotient between the intermediate purchase by sector j of goods and
50 As pointed out in Chapter 3, not all the R&D expenditure incurred by all the other firms will benefit firm i, but it will serve as an indicator of the magnitude of the effective technological knowledge current in the sector.

91
services supplied by sector m and the total sum of intermediate purchase of
sector j using the symmetric input-output table for Spain for 2005.
As discussed above in section 3.4.2, assuming a contemporary relationship
between spillovers and productivity seems inappropriate since the diffusion
of external knowledge requires some time before it can have an impact on
the firm. Even though the definition itself includes R&D lagged two periods
(since the innovation indicator is for the period [t-2, t]), the externalities in
expression [4.4] are lagged 1 year51.
4.5 Results
4.5.1 Descriptive analysis
Table 4.2 shows the descriptive statistics for the main variables in the
model across the different technology levels. First, it can be seen that labour
productivity is slightly higher in high-tech industries than it is in low-tech
industries unlike the situation that prevails in services. Not surprisingly, the
average percentage of qualified employees is much higher in more
advanced firms.
In the case of the knowledge variables, high-tech firms (HTMI and KIS) are
more likely to engage in R&D activities, their intensity is usually greater,
their investment in R&D more continuous and the number of personnel
working on R&D activities is higher than it is in low-tech firms (LTMI and
NKIS). Likewise, the proportion of firms reporting a process or product
innovation is higher among high-tech firms. Moreover, the latter protect
their innovations and cooperate more than is the case of their low-tech
counterparts.
51 The same results are obtained when externalities are not lagged.

92
As for external knowledge, in the high-tech sector the proportion of firms
that engage in R&D activities is substantially higher than it is in less
advanced sectors. Likewise, intra-industry spillover (defined in terms of
process or product innovations) presents a higher coefficient for high-tech
firms (especially in HTMI), while inter-industry externality shows a more
ambiguous pattern. Finally, the number of firms that employ some source of
information or receive government financial support is also higher in high-
tech sectors. Therefore, given the differences presented it is worth analysing
each technology level separately.
Table 4.2 Descriptive statistics
TOTAL LTMI HTMI NKIS KIS
mean st dv mean st dv mean st dv mean st dv mean st dv
Firms’ characteritics
Labour overall 11.788 1.018 11.985 0.839 12.037 0.736 12.041 1.102 11.184 1.156
productivity a, d between 0.968
0.796
0.692
1.063
1.074
(cont.) within 0.332
0.297
0.287
0.282
0.422
Firm size a overall 4.433 1.410 4.253 1.196 4.169 1.215 5.095 1.602 4.593 1.602
(cont.) between 1.400
1.182
1.203
1.599
1.593
within 0.205
0.193
0.185
0.197
0.240
Physical overall 9.563 3.314 10.087 3.445 9.778 2.936 9.304 3.474 8.820 3.250
capital a, d between 3.065
3.230
2.708
3.137
2.985
(cont.) within 1.421
1.442
1.344
1.577
1.385
Advanced overall 3.598 4.088 4.012 4.298 4.012 4.056 2.347 3.556 3.280 3.929
machinery a, d between 3.563 3.779 3.455 3.143 3.407
(cont.) within 2.017 2.079 2.146 1.670 1.964
Human overall 22.722 25.600 12.136 13.538 20.882 18.457 13.762 19.817 42.157 33.358
Capital a between 23.770
11.603
16.577
17.438
30.191
(cont.) within 10.407
7.139
8.659
9.835
14.761
Group a overall 0.407 0.491 0.362 0.481 0.421 0.494 0.510 0.500 0.402 0.490
(0/1) between 0.459
0.450
0.464
0.468
0.454
within 0.172
0.163
0.168
0.177
0.183
International overall 0.479 0.500 0.583 0.493 0.718 0.450 0.283 0.451 0.215 0.411
Competition a between 0.434
0.418
0.378
0.375
0.349
(0/1) within 0.247
0.264
0.252
0.252
0.214
To be continued on the next page

93
Table 4.2 – continued from the previous page TOTAL LTMI HTMI NKIS KIS
mean st dv mean st dv mean st dv mean st dv mean st dv
Knowledge / Innovation R&D overall 0.576 0.494 0.578 0.494 0.782 0.413 0.256 0.437 0.535 0.499
engagement a between 0.412
0.391
0.329
0.367
0.425
(0/1) within 0.273
0.303
0.255
0.242
0.260
R&D overall 9.458 1.555 9.023 1.329 9.835 1.216 8.386 1.855 9.784 1.882
intensity b between 1.692
1.401
1.270
1.995
2.039
(cont.) within 0.446
0.454
0.342
0.661
0.498
Continuous overall 0.787 0.409 0.735 0.441 0.825 0.380 0.710 0.454 0.819 0.385
R&D b between 0.376
0.395
0.337
0.431
0.354
(0/1) within 0.261
0.283
0.248
0.260
0.248
Personnel in overall 1.128 1.275 0.954 1.076 1.598 1.258 0.416 0.919 1.248 1.459
R&D a between 1.141 0.913 1.140 0.806 1.312
(cont.) within 0.540 0.549 0.518 0.429 0.593
Process overall 0.568 0.495 0.633 0.482 0.634 0.482 0.381 0.486 0.513 0.500
innovator a between 0.398
0.383
0.385
0.390
0.398
(0/1) within 0.297
0.295
0.295
0.291
0.304
Product overall 0.544 0.498 0.546 0.498 0.730 0.444 0.269 0.443 0.500 0.500
Innovator a between 0.418 0.408 0.367 0.375 0.417
(0/1) within 0.270 0.286 0.256 0.240 0.276
Protection a overall 0.271 0.445 0.273 0.446 0.337 0.473 0.183 0.386 0.249 0.432
(0/1) between 0.342
0.339
0.368
0.292
0.331
within 0.285
0.287
0.297
0.256
0.282
Cooperation c overall 0.373 0.483 0.326 0.469 0.373 0.484 0.312 0.463 0.459 0.498
(0/1) between 0.386
0.365
0.382
0.370
0.408
within 0.295
0.295
0.298
0.285
0.294
External knowledge
% firms with overall 57.63 22.20 57.77 10.50 78.15 7.87 25.65 15.40 53.48 24.66
R&D activities a between 21.36 7.45 5.63 14.82 24.24
[0-100] within 5.93 7.49 5.51 4.27 4.60
Intra-industry overall 525.11 533.25 307.66 234.65 914.9 575.96 306.36 361.31 541.69 616.99
spillover (process)a, d between 516.17 225.49 558.70 299.29 600.47
(cont.) within 135.38 58.435 117.67 207.47 172.49
Intra-industry overall 563.51 598.13 291.64 223.73 1047.09 631.33 334.66 398.29 566.15 685.06
spillover (product)a, d between 579.42 215.64 611.44 346.06 663.21
(cont.) within 148.17 52.95 126.00 201.94 207.79
Inter-industry overall 362.58 142.57 386.89 128.59 406.01 108.10 330.26 217.54 307.14 119.62
spillover (process) a, d between 114.88 92.523 68.233 206.95 85.726
(cont.) within 86.036 91.66 87.55 64.12 86.30
Inter-industry overall 373.60 154.74 403.42 139.60 417.82 120.44 327.33 238.20 317.04 125.25
spillover (product) a, d between 128.01 106.44 82.41 226.87 92.12
(cont.) within 87.80 92.07 91.00 67.95 87.57
To be continued on the next page

94
Table 4.2 – continued from the previous page
TOTAL LTMI HTMI NKIS KIS mean st dv mean st dv mean st dv mean st dv mean st dv
Public funding a Local overall 0.217 0.412 0.216 0.411 0.262 0.440 0.080 0.272 0.240 0.427
(0/1) between 0.316
0.293
0.325
0.200
0.360
within 0.265
0.289
0.295
0.189
0.233
National overall 0.200 0.400 0.170 0.376 0.256 0.436 0.065 0.247 0.250 0.433
(0/1) between 0.309
0.272
0.325
0.179
0.356
within 0.255
0.259
0.291
0.172
0.247
European overall 0.050 0.218 0.029 0.169 0.041 0.199 0.020 0.140 0.100 0.299
(0/1) between 0.168
0.109
0.137
0.100
0.251
within 0.138
0.129
0.144
0.099
0.159
Sources of information c Internal overall 0.598 0.490 0.551 0.497 0.642 0.479 0.536 0.499 0.633 0.482
(0/1) between 0.376 0.384 0.363 0.387 0.366
within 0.330 0.331 0.325 0.331 0.333
Market overall 0.483 0.500 0.456 0.498 0.514 0.500 0.485 0.500 0.486 0.500
(0/1) between 0.379 0.375 0.381 0.383 0.378
within 0.337 0.338 0.331 0.338 0.341
Institutional overall 0.150 0.357 0.139 0.346 0.142 0.349 0.095 0.293 0.192 0.394
(0/1) between 0.274 0.266 0.266 0.215 0.303
within 0.225 0.221 0.222 0.189 0.244
Others overall 0.175 0.380 0.152 0.359 0.179 0.384 0.137 0.344 0.213 0.409
(0/1) between 0.288 0.266 0.291 0.273 0.315
within 0.245 0.243 0.246 0.215 0.257
Firms 9,042 3,126 2,272 1,140 2,504
(%) (34.6) (25.1) (12.6) (27.7)
Observations 57,379 19,838 14,547 7,400 15,594
(%) (34.6) (25.3) (12.9) (27.2)
Notes: LTMI (low and medium-low tech manufacturing industries), HTMI (medium-high and high tech manufacturing industries), NKIS (non-knowledge-intensive services), KIS (knowledge-intensive services). In brackets type of variables (continue, dycothomic, or percentage) a Variables computed for total sample. b Variables computed for R&D performers sub-sample. c Variables computed for innovative sub-sample. d Mean in thousands of euros. Source: PITEC; own calculations.
4.5.2 Estimation results
First stage: Research Equations
Table 4.3 presents the results for Equations [4.1] and [4.2]. The first four
columns show the estimates of the determinants of whether a firm engages
in R&D activities, using a random effects probit model. The right hand side

95
of the table (columns 5 - 8) shows the intensity of R&D investment,
conditional on a firm engaging in R&D, by using the consistent estimator
proposed by Wooldridge (1995) in order to account for the selection bias.
The results are presented for each technology sector in order to highlight
any differences. The numbers reported for columns 1-4 are marginal effects
evaluated at the sample means. Most of the variables are dummies (except
firm size, physical capital stock, human capital and spillover); thus, the
coefficients show the effect of changing the dummy variable from 0 to 1.
First of all, the results of this first stage of the model suggest that the
determinants of R&D intensity differ between industry and the services
sector.
Specifically, in the case of manufacturing firms: the larger the firm
(according to Chudnovsky, 2006; Artés, 2009 and Lhuillery, 2011) and the
greater the physical and human capital, the more likely a firm is to engage
in R&D activities and the greater its investment is likely to be. In addition,
those firms that operate in international markets (in line with Artés, 2009,
and Huergo and Moreno, 2011, who use exports to capture the importance
of the external market), protect their innovations (in consonance with
Lhuillery, 2011, who shows that protection has a strong impact on the
decision to engage in R&D activities) and receive public funding – both
national and local, are more likely to carry out R&D projects and to invest
more money in them. However, group membership seems to have a weak
influence on the decision to engage in R&D activities and then only in low-
tech firms, while its impact is negative on a firm’s investment intensity
(columns 5 and 6). This might be because firms benefit from innovation
carried out by other firms within their group, so they need to invest less
money in R&D activities.

96
Table 4.3 Research Equations (2004-2010) (Dep var) Engage in R&D activities
(RE Probit) R&D intensity
(Consistent estimator, Wooldridge1995)
LTMI HTMI NKIS KIS LTMI HTMI NKIS KIS
(1) (2) (3) (4) (5) (6) (7) (8) Firm size 0.116*** 0.0128*** -0.00549* -0.0016 -- -- -- -- (0.0151) (0.00304) (0.00307) (0.0117)
Physical capital 0.0217*** 0.0022*** 0.0070*** 0.018*** 0.0410*** 0.0477*** 0.00520 0.057***
(0.00419) (0.000785) (0.00195) (0.00604) (0.00602) (0.00523) (0.0209) (0.00972) Human capital 0.005*** 0.001*** 0.0009*** 0.0023*** 0.0083*** 0.0049*** -0.0005 -0.0010
(0.000887) (0.000177) (0.000237) (0.00044) (0.0017) (0.0012) (0.003) (0.0012) Group 0.0603* 0.00159 0.0185* 0.0293 -0.110*** -0.062*** -0.099 -0.10***
(0.0331) (0.0042) (0.0096) (0.0297) (0.0265) (0.0202) (0.0731) (0.0355) International 0.136*** 0.0204*** 0.0229** 0.0724** 0.151*** 0.116*** 0.0588 -0.0309 Competition (0.0249) (0.00591) (0.0101) (0.0314) (0.0365) (0.0354) (0.0738) (0.0363) Protection 0.163*** 0.015*** 0.00939 0.130*** 0.232*** 0.107*** 0.0467 -0.0729
(0.0228) (0.00368) (0.0111) (0.0241) (0.0484) (0.0382) (0.110) (0.0571) Public Funding Local 0.254*** 0.022*** 0.087*** 0.306*** 0.519*** 0.202*** 0.0673 -0.0204
(0.0207) (0.0047) (0.0336) (0.0247) (0.0510) (0.0404) (0.158) (0.0702) National 0.280*** 0.021*** 0.191*** 0.304*** 0.635*** 0.247*** -0.0514 -0.107
(0.0202) (0.0050) (0.0584) (0.0280) (0.0531) (0.0345) (0.146) (0.0683) European 0.156*** -0.0025 0.158 0.222*** 0.115 0.0707 -0.0776 0.0746
(0.0542) (0.0136) (0.131) (0.0566) (0.0889) (0.0747) (0.282) (0.0747) Spillover 0.010*** 0.002*** 0.0021*** 0.012***
-- -- -- -- (0.00179) (0.00042) (0.00043) (0.00096)
Cooperation -- -- -- -- 0.0700* 0.0491 -0.0565 0.151***
(0.0421) (0.0361) (0.115) (0.0548)
IMR*Time dummies(1) -- -- -- -- Yes*** Yes*** Yes*** Yes***
Means(2) Yes*** Yes*** Yes*** Yes*** Yes*** Yes*** Yes*** Yes*** Time dummies Yes*** Yes*** Yes*** Yes*** No No No No
Industry dummies No No No No Yes*** Yes*** Yes*** Yes***
Observations 16,712 12,275 6,26 13,09 9,111 9,36 1,468 6,701
Number of groups 3,126 2,272 1,14 2,504 -- -- -- --
Rho (3) 0.783 0.797 0.789 0.767 -- -- -- -- Corrected predictions 72.14% 79.37% 84.55% 79.98% -- -- -- -- Adjusted R2 (4) 0.1579 0.1608 0.1992 0.2411 0.225 0.335 0.416 0.459
Notes: LTMI (low and medium-low tech manufacturing industries), HTMI (medium-high and high tech manufacturing industries), NKIS (non-knowledge-intensive services), KIS (knowledge-intensive services). Reported marginal effects (at the sample means) are for the probability of engaging in R&D (dummy variable). Bootstrapped standard errors are in brackets. (1) The interaction between IMR (inverse Mills ratio) and time dummies is significant at 1% confirming the inclusion of a selection equation. (2) We have incorporate only means of these variables that do not have a strong correlation with their within mean. We undertake this decision following Raymond et al. (2010, footnote 8), who assume that individual effects are not correlated with the regressors due to the lack of variation over time. (3) Rho is the percentage of total variance contributed by the panel-level variance component (if rho=0, the panel estimator is not different from the pooled estimator). (4) Adjusted McFadden's pseudo R2 in Equation [4.1] and adjusted R2 in Equation [4.2]. *** Significant at 1%, ** significant at 5%, * significant at 10%.
On the other hand, the fact of having cooperated with other firms also
increases innovative effort but only in low-tech firms. Finally, and

97
regarding our main contribution at this stage of the model, the results
presented in Table 4.3 show that a firm’s decision as to whether or not to
engage in R&D activities is positively influenced by the fact that the rest of
the firms in its sector performed R&D in the previous period. This might
reflect an incentive effect 52 , since the greater the number of firms
undertaking R&D activities in the same sector, the more likely a firm is to
engage in R&D projects. One implication of this is the possible existence of
a “virtuous cycle”, given that if firms in one sector innovate this is likely to
stimulate the others to do likewise, and so on and so forth.
Last of all, and regarding the level of technology operated by the firm, it
seems that the impact of all the variables is greater for low-tech than it is for
high-tech manufacturing firms.
In the case of the service sector, physical and human capital have a positive
impact on the propensity of firms to engage in R&D activities, while firm
size is not relevant. As in the case of the manufacturing sector, having
operated in international markets, using protection methods and receiving
public funding increase the likelihood of carrying out R&D projects. If we
now turn to our variable of interest, we can see that spillover is also
important in the case of service firms. Particularly, knowledge-intensive
services (column 4) increase their probability of engaging in R&D activities
1.20 percentage points if the proportion of firms in the same sector that
perform R&D increased by 1 percentage point in the previous year.
52 As explained in Section 4.4.1, this incentive effect could be due to two factors: i) investment in R&D generates a pool of knowledge in the sector and allows firms to benefit from this information and expertise (through their absorptive capacity), ii) the fact that the rest of the firms undertake R&D projects could encourage firms to make an effort to improve their competitiveness in order not to lose market share.

98
Finally, there is no clear pattern – not in the first or in the second equation –
regarding the firm’s level of technology in the service sector. Specifically,
no variable is significant when explaining R&D intensity in the case of non-
knowledge-intensive services, while only physical capital and belonging to
a group are significant in the case of knowledge-intensive services.
Last of all, the inverse Mills ratios obtained from Equation [4.1] are clearly
significant, showing the importance of taking the selection problem into
consideration. In addition, the control variables are also statistically
significant.
Second stage: Innovation equation
Table 4.4 reports the estimates of the knowledge production function. The
first four columns show the results for process innovation and the last four
columns those for product innovation. The numbers reported are marginal
effects evaluated at the sample means. Most of the variables are dummies
(except R&D intensity, firm size, personnel in R&D and investment in
advanced machinery); thus, the coefficients show the effect of changing the
dummy variable from 0 to 1.
As expected, the greater the R&D intensity (predicted by Equation [4.2])
carried out two years previously, the greater the probability of achieving
both a process and product innovation. If we analyse the differences
between technology levels, we observe that among manufacturing sectors,
low-tech firms are more likely than high-tech firms to report a successful
innovation given their R&D intensity. For instance, a unit increase in the
logarithm of R&D intensity results in an increase of 20 (45) percentage
points in the probability of achieving a process (product) innovation in low-
tech firms vs. 5.25 (1.5) percentage points in high-tech firms. While it is
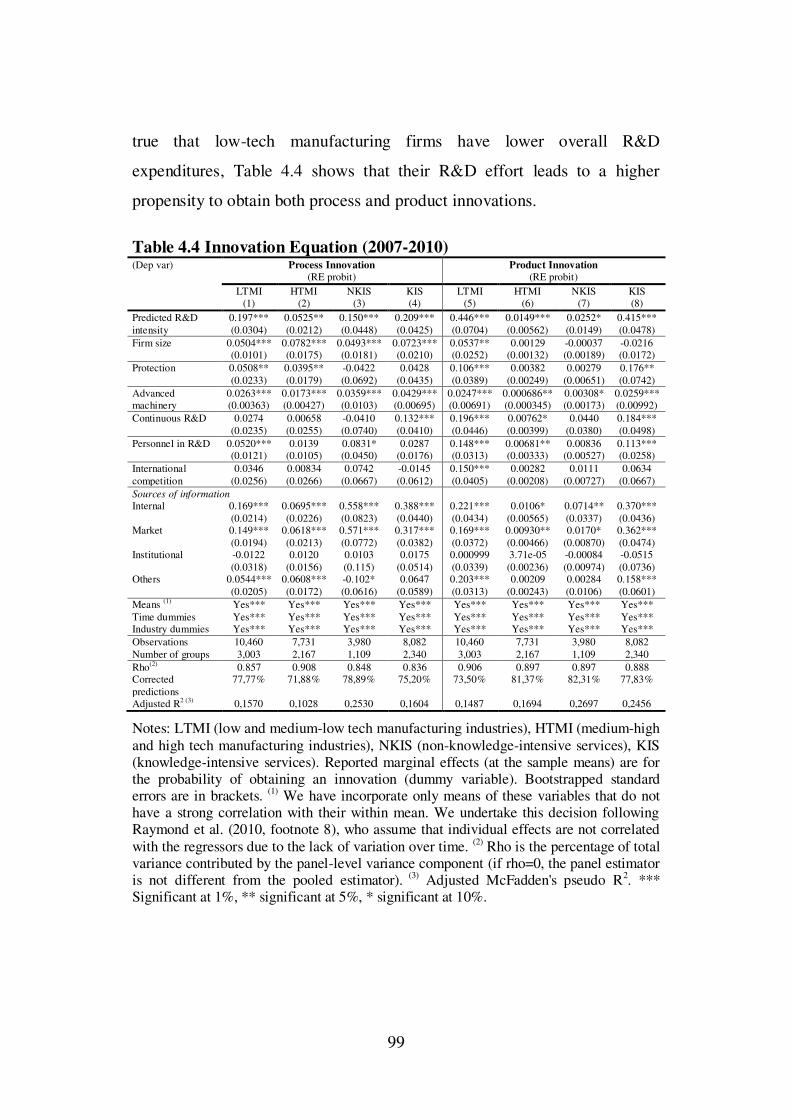
99
true that low-tech manufacturing firms have lower overall R&D
expenditures, Table 4.4 shows that their R&D effort leads to a higher
propensity to obtain both process and product innovations.
Table 4.4 Innovation Equation (2007-2010) (Dep var) Process Innovation
(RE probit) Product Innovation
(RE probit) LTMI HTMI NKIS KIS LTMI HTMI NKIS KIS (1) (2) (3) (4) (5) (6) (7) (8) Predicted R&D 0.197*** 0.0525** 0.150*** 0.209*** 0.446*** 0.0149*** 0.0252* 0.415*** intensity (0.0304) (0.0212) (0.0448) (0.0425) (0.0704) (0.00562) (0.0149) (0.0478) Firm size 0.0504*** 0.0782*** 0.0493*** 0.0723*** 0.0537** 0.00129 -0.00037 -0.0216 (0.0101) (0.0175) (0.0181) (0.0210) (0.0252) (0.00132) (0.00189) (0.0172) Protection 0.0508** 0.0395** -0.0422 0.0428 0.106*** 0.00382 0.00279 0.176** (0.0233) (0.0179) (0.0692) (0.0435) (0.0389) (0.00249) (0.00651) (0.0742) Advanced 0.0263*** 0.0173*** 0.0359*** 0.0429*** 0.0247*** 0.000686** 0.00308* 0.0259*** machinery (0.00363) (0.00427) (0.0103) (0.00695) (0.00691) (0.000345) (0.00173) (0.00992) Continuous R&D 0.0274 0.00658 -0.0410 0.132*** 0.196*** 0.00762* 0.0440 0.184*** (0.0235) (0.0255) (0.0740) (0.0410) (0.0446) (0.00399) (0.0380) (0.0498) Personnel in R&D 0.0520*** 0.0139 0.0831* 0.0287 0.148*** 0.00681** 0.00836 0.113*** (0.0121) (0.0105) (0.0450) (0.0176) (0.0313) (0.00333) (0.00527) (0.0258) International 0.0346 0.00834 0.0742 -0.0145 0.150*** 0.00282 0.0111 0.0634 competition (0.0256) (0.0266) (0.0667) (0.0612) (0.0405) (0.00208) (0.00727) (0.0667) Sources of information Internal 0.169*** 0.0695*** 0.558*** 0.388*** 0.221*** 0.0106* 0.0714** 0.370*** (0.0214) (0.0226) (0.0823) (0.0440) (0.0434) (0.00565) (0.0337) (0.0436) Market 0.149*** 0.0618*** 0.571*** 0.317*** 0.169*** 0.00930** 0.0170* 0.362*** (0.0194) (0.0213) (0.0772) (0.0382) (0.0372) (0.00466) (0.00870) (0.0474) Institutional -0.0122 0.0120 0.0103 0.0175 0.000999 3.71e-05 -0.00084 -0.0515 (0.0318) (0.0156) (0.115) (0.0514) (0.0339) (0.00236) (0.00974) (0.0736) Others 0.0544*** 0.0608*** -0.102* 0.0647 0.203*** 0.00209 0.00284 0.158*** (0.0205) (0.0172) (0.0616) (0.0589) (0.0313) (0.00243) (0.0106) (0.0601) Means (1) Yes*** Yes*** Yes*** Yes*** Yes*** Yes*** Yes*** Yes*** Time dummies Yes*** Yes*** Yes*** Yes*** Yes*** Yes*** Yes*** Yes*** Industry dummies Yes*** Yes*** Yes*** Yes*** Yes*** Yes*** Yes*** Yes*** Observations 10,460 7,731 3,980 8,082 10,460 7,731 3,980 8,082 Number of groups 3,003 2,167 1,109 2,340 3,003 2,167 1,109 2,340 Rho(2) 0.857 0.908 0.848 0.836 0.906 0.897 0.897 0.888 Corrected predictions
77,77% 71,88% 78,89% 75,20% 73,50% 81,37% 82,31% 77,83%
Adjusted R2 (3) 0,1570 0,1028 0,2530 0,1604 0,1487 0,1694 0,2697 0,2456
Notes: LTMI (low and medium-low tech manufacturing industries), HTMI (medium-high and high tech manufacturing industries), NKIS (non-knowledge-intensive services), KIS (knowledge-intensive services). Reported marginal effects (at the sample means) are for the probability of obtaining an innovation (dummy variable). Bootstrapped standard errors are in brackets. (1) We have incorporate only means of these variables that do not have a strong correlation with their within mean. We undertake this decision following Raymond et al. (2010, footnote 8), who assume that individual effects are not correlated with the regressors due to the lack of variation over time. (2) Rho is the percentage of total variance contributed by the panel-level variance component (if rho=0, the panel estimator is not different from the pooled estimator). (3) Adjusted McFadden's pseudo R2. *** Significant at 1%, ** significant at 5%, * significant at 10%.

100
This finding is in line with Hall et al. (2009), who point out that this might
be because innovating in less advanced sectors requires less R&D effort,
given that innovation output is linked to changes in the organizational
process that are unlikely to be so strongly linked to the firm’s technology.
This result might also indicate that high-tech manufacturing firms need a
longer period of time to obtain an innovation. In contrast, in the case of the
services sector the probability of achieving a process or product innovation
is clearly higher for knowledge-intensive services than non-knowledge
intensive services.
Additionally, the probability of obtaining a process innovation increases
with firm size, while the propensity to introduce a product innovation rises
with the fact that R&D investment is made on a regular basis. Finally,
personnel in R&D, investment in advanced machinery and information
from inside the company and from the market all seem to increase the
likelihood of obtaining process and product innovations. However,
operating in an international market (Harris et al., 2003, and Woerter and
Roper, 2010) does not seem have an influence on the development of an
innovation in most cases. Finally, no clear pattern can be established
according to a firm’s level of technology.
Third stage: Productivity Equation
Table 4.5 shows the estimates of the production function equation. To
account for the high correlation between process and product innovation53
and to avoid multicollineartity problems, two separate estimations are
performed (see other authors who have encountered the same problem, for
example, Raffo et al., 2008). The first four columns show the results when
53 The correlation between the predicted process innovation and the predicted product innovation is 0.65 on average.

101
the predicted values for process innovation are included, while the last four
columns show the results for product innovation. The main interest at this
stage of the model is to analyse the impact of innovation and spillovers on
firm labour productivity.
As in the first stage of the model, the respective results from this last step
for industry and the services sector clearly differ.
First of all, manufacturing firms increase their productivity with firm size,
physical and human capital. In line with the literature, the results confirm
the positive effect of process and product innovations. Thus, generating an
innovation in the preceding three years (value predicted in Equation [4.3])
has a positive effect on the productivity of a manufacturing firm.
Turning now to our variables of interest, it can be seen that both intra- and
inter-industry externalities have a positive impact on the productivity of
manufacturing firms. Even though the coefficients are low, they are clearly
significant. Thus, R&D expenditures carried out by firms in the same sector
or in other sectors54 – provided they achieve an innovation – increase their
productivity. In particular, low-tech manufacturing firms present a similar
coefficient regardless of the type of externality (intra or inter) or innovation
(process or product). Therefore, if the rest of the firms increase their R&D
expenditures by 1 million euros and obtain an innovation (process or
product), then the productivity of low-tech industries would rise by around
0.06 %. In the case of high-tech manufacturing firms there is a difference in
this magnitude. As can be seen in Table 4.5, companies benefit more from
innovation carried out by firms in other sectors (0.12% for process and 0.15%
54 Here, we take into account those sectors that are suppliers of the sector in which the firm operates (according to the definition of spillover that we have considered in section 4.4.3).

102
for product) than that conducted by firms in the same sector (0.02% for
process and product). A possible explanation for this might be that the
rivalry between these firms is greater, which reduces the positive impact of
the external R&D of firms in their same sector55.
Table 4.5 Productivity Equation (2007-2010) (Dep var) Labour Productivity
(RE) LTMI HTMI NKIS KIS LTMI HTMI NKIS KIS
(1) (2) (3) (4) (5) (6) (7) (8) Predicted process 0.038** 0.041** 0.020 0.073***
-- -- -- -- innovation (0.0149) (0.0184) (0.0191) (0.0197) Predicted product
-- -- -- -- 0.059*** 0.039** 0.063** 0.048
innovation (0.0103) (0.0197) (0.0252) (0.0322) Firm 0.0326 0.0872*** -0.180*** -0.052** 0.029 0.089*** -0.179*** -0.051** size (0.0221) (0.0146) (0.0298) (0.0220) (0.0255) (0.0159) (0.0281) (0.0204) Physical 0.057*** 0.048*** 0.036*** 0.101*** 0.056*** 0.048*** 0.036*** 0.102*** capital (0.0054) (0.0073) (0.0102) (0.0144) (0.0051) (0.0061) (0.0100) (0.0121) Human 0.002*** 0.002*** 0.001 0.000 0.002*** 0.002*** 0.001 0.000 capital (0.0007) (0.0004) (0.0005) (0.0004) (0.0006) (0.0004) (0.0005) (0.0004) Intra-industry 0.0006*** 0.0002*** 0.0000 -0.0001*** 0.0007*** 0.0002*** 0.0000 -0.0001*** spillover t-1 (0.0001) (0.0000) (0.0000) (0.0000) (0.0001) (0.0000) (0.0000) (0.0000) Inter-industry 0.0006*** 0.0012*** 0.0001 -0.0003 0.0005*** 0.0015*** -0.0001 -0.0003 spillover t-1 (0.0001) (0.0002) (0.0001) (0.0002) (0.0001) (0.0002) (0.0001) (0.0002) Constant 10.995*** 10.761*** 12.597*** 10.575*** 10.994*** 10.605*** 12.635*** 10.588*** (0.1074) (0.0935) (0.2021) (0.1659) (0.0989) (0.1021) (0.1893) (0.1528)
Time dummies Yes*** Yes*** Yes*** Yes*** Yes*** Yes*** Yes*** Yes*** Ind dummies No No No No No No No No Observations 10,460 7,731 3,980 8,082 10,460 7,731 3,980 8,082
Number of groups 3,003 2,167 1,109 2,340 3,003 2,167 1,109 2,340 R2 within 0.0995 0.0834 0.0960 0.0305 0.106 0.0881 0.0964 0.0301 R2 between 0.139 0.180 0.0383 0.108 0.135 0.175 0.0417 0.106 R2 overall 0.147 0.176 0.0472 0.110 0.144 0.173 0.0503 0.108
Notes: LTMI (low and medium-low tech manufacturing industries), HTMI (medium-high and high tech manufacturing industries), NKIS (non-knowledge-intensive services), KIS (knowledge-intensive services). Bootstrapped standard errors are in brackets. *** Significant at 1%, ** significant at 5%, * significant at 10%.
In the case of the service sector, physical capital increases firm productivity
whereas firm size has a negative impact. Moreover, process innovation has
a positive impact on the productivity of knowledge-intensive services,
while the opposite is the case of product innovation. More interestingly, the
rest of the variables, even spillovers, are not, in general, relevant, one 55 This result is consistent with findings in Chapter 3.

103
exception being the case of knowledge-intensive services that present a
negative coefficient. In keeping with Chapter 3, this finding might reflect
the competitive effect discussed earlier; in other words, a firm might reduce
its productivity if its competitors increase their R&D expenditure and
obtain an innovation. This apart, the results in Table 4.5 suggest that firms
in the service sector are not influenced by what other firms do.
Finally, although the coefficients vary across technology levels, they do not
follow any specific pattern.
4.6 Concluding remarks
This chapter has analysed the impact of innovation activities on firm
productivity using the CDM model. The main goal has been to assess the
extent to which external knowledge may have an impact on firm behaviour
and its performance. In particular, the following research questions are
posed: (i) Is the firm’s decision to engage in R&D activities or not affected
by what other firms do? (ii) Do Spanish firms benefit from the innovation
carried out by the rest of the firms in its sector and in other sectors?
In seeking to answer these questions, information has been drawn from the
PITEC database for the period 2004-2010. Generally speaking, this study
tries to shed some light to the scarce literature that analyses this topic, given
that most papers tend to use cross-sectional data. Working with panel data
enables us to control for both unobserved firm heterogeneity and the time
lag in the whole process. To the best of our knowledge, no previous paper
has examined the spillover effect in any country by adopting the CDM
perspective.
Returning to the hypothesis posed at the beginning of this chapter, the
structural model shows that not only is R&D important to increase a firm’s

104
productivity, but so is the firm’s ability to turn this investment into
innovations (what some authors refer to as “innovativity”). In fact, this
study shows that innovation input (R&D intensity) affects innovation
output and that in turn this output has a positive impact on a firm’s
productivity.
The following conclusions can be drawn from this chapter. First of all,
manufacturing and service firms cannot be treated equally, since their
behaviour differs in the course of the process. Specifically, the findings
indicate that some variables that are relevant for manufacturing firms are
not significant for the service sector. Thus, the results presented here need
to be interpreted with caution as far as the service sector is concerned.
Secondly, although the coefficients vary with technology level across the
model, they do not adhere to any specific pattern. One exception, however,
is the higher returns of low-tech manufacturing firms in relation to the
determinants of the R&D decision. Thirdly, and in answer to the first
research question, it has been found that the firm’s decision to engage in
R&D activities or not is influenced in some degree by what other firms opt
to do. The results show that the higher the number of firms undertaking
R&D activities in a given sector, the more likely a firm in that sector is to
engage in R&D projects. This means that an external pool of knowledge
encourages firms to carry out R&D activities (both in the industrial and
service sectors). Finally, and in answer to the second research question, the
results suggest that there is an element of complementarity between
manufacturing firms (but not those in the service sector), both between
firms in the same sector and firms operating in different sectors. Thus, the
R&D expenditures incurred by firms in the same sector (intra-industry
externalities) or in other sectors (inter-industry externalities) – provided an
innovation is produced as a result of the investment – have a positive

105
impact on a firm’s productivity. Furthermore, it has been shown that high-
tech manufacturing firms increase their productivity more when adopting
R&D from other sectors (inter-industry externality) than when employing
the R&D from their own sector.

106

107
Chapter 5: How important are
internal knowledge flows for firm’s
innovative performance?

108

109
5.1 Introduction
Knowledge within a firm is one of its most valuable resources. Like fuel for
a car, knowledge is the information that nourishes new ideas, generating
improvements and innovations that can boost a firm’s performance. It is not
surprising, therefore, that firms seek to maximize this input. One means
available to a firm to achieve just that is to transfer knowledge within the
firm. The transmission of information inside the company broadens firm
knowledge and can contribute positively to its innovativeness and
performance. As Argote et al. (2000) argue “organizations that are able to
transfer knowledge effectively from one unit to another are more productive
and more likely to survive than those that are less adept at knowledge
transfer”.
Many papers in the field of organizational learning have analysed
knowledge transfers within (as well as between) organizations56. However,
in the innovation literature most of the articles focus their attention on the
impact of external knowledge flows on innovation performance, while there
is little discussion about the relevance of internal knowledge transfers. Thus,
cooperation with different partners (Belderbos et al., 2004) and the
information sources used to carry out innovation projects (Escribano et al.,
2009) have been considered throughout the literature as the means for
capturing external knowledge. One question that needs to be addressed,
however, is whether internal knowledge flows are also relevant. Although a
number of papers include among their explanatory variables an indicator as
to whether a firm has obtained information from an internal source or not, it
56 See for instance, Argote et al. (2002), van Wijk et al. (2008) and Maurer et al. (2011). Many studies examine organizational knowledge transfer from a management perspective. However, our goal here is somewhat different so that social network analysis and knowledge management lie beyond the scope of this study.

110
tends merely to be a control since the interest of the authors typically lies
elsewhere (R&D, collaborative agreements with several partners, etc.). To
the best of our knowledge, no further research into the importance of
internal knowledge on a firm’s innovative performance has been carried out.
Given that sharing knowledge within a firm can, for example, allow one
department to benefit from the experience of another or help its workers
perform a task more efficiently, it is interesting to analyse the extent to
which internal knowledge flows affect innovation performance. Despite the
interest in external knowledge flows, it is not unreasonable to think that it is
easier for a firm to benefit from knowledge generated from within the firm
(or within the group) than from that originating from outside the firm (or
group). For instance, there is a shared network, internal compilation of
information (research reports, technical documents, databases etc.),
exchange of information between workers (via email, company meetings,
workshops and so on), training programs, social interaction between
colleagues (in other words, daily situations which can lead to informal
knowledge sharing), job rotation (between departments or firms that
belongs to the same group), etc.
Therefore, even though internal information transfers have faded into the
background since the literature has preferred to focus its attention on
external knowledge, internal knowledge flows are believed to play a role in
a firm’s performance. For this reason, the aim of this chapter is to analyse
the impact of internal knowledge flows on firm innovative sales. In order to
do so, a distinction is drawn between voluntary and involuntary knowledge
flows; the former arise as a result of (intended) formal collaborations, while
the latter emerge unintentionally. Both voluntary and involuntary
knowledge flows can be seen as instruments for disseminating information

111
and sharing experience within a firm, thus improving its technological
performance and boosting its innovative sales. An additional question that
needs to be taken into consideration is whether a firm’s absorptive capacity
(Cohen and Levinthal, 1989) increases the impact that internal knowledge
transfers have on innovation performance. Given that there is evidence that
internal R&D improves a firm’s learning capacity, it is clearly of interest to
assess whether this ability enhances the efficiency of internal knowledge
transfers making firms more innovative.
The data used for this study cover the period 2004-2011 (see Chapter 2 for
a full description of the dataset). Although in previous chapters the level of
technology of the sector in which the firm operates is taken into account,
the results do not suggest any specific pattern or point to any clear
behaviour. As a consequence, here the analysis is undertaken for the whole
sample and no differentiation is made according to technology level.
To sum up, after controlling for a firm’s own R&D investment and external
knowledge flows, the role played by internal knowledge spillovers is
examined. In particular, this chapter seeks to address the following
questions: (i) Are internal knowledge flows (voluntary and involuntary)
important for the performance of innovative firms? (ii) Does this impact
differ depending on a firm’s absorptive capacity?
The remainder of the chapter is organised as follows. The next section
presents an overview of the previous literature regarding the different
sources of knowledge. Section 5.3 forwards the empirical model, while data
and variable definitions are explained in section 5.4. The main results are
shown in section 5.5 whilst section 5.6 presents some further explorations.
Finally, the main conclusions are discussed in the last section.

112
5.2 What do we know so far?
In recent years, there has been a growing interest in the literature to
examine the impact of external knowledge flows on firm’s innovative
performance. Many studies have analysed intentional knowledge transfers
between companies embodied in formal collaboration agreements, while
others have recognised the importance of (unintended) knowledge
spillovers. Both voluntary and involuntary knowledge flows can be
considered as mechanisms for spreading information and experience within
companies, thus helping them to perform better technologically. Despite
this evidence, internal knowledge transfers within a firm or group have
rarely been examined in depth.
In this section previous research on the relationship between knowledge
flows and innovation performance is examined differentiating between
voluntary and involuntary knowledge transfers.
5.2.1 Voluntary knowledge flows
Cooperation between firms when undertaking their innovation activities is
identified as a channel for increasing innovation performance. Given that
firms cannot always have access to everything they need, collaboration with
others allows them to engage in innovation activities. For this reason,
several authors include a variable indicating whether a firm collaborates
with others or not. Some report a positive impact of cooperation on
innovation performance (Klomp and van Leeuwen, 2001 and Mohnen et al.
2006), but others fail to identify this effect (Frenz and Ietto-Gillies, 2009,
and Raymond et al. 2010).
A number of empirical studies have assessed whether this impact depends
on the type of partner and they obtain a range of different results. Belderbos

113
et al. (2004), in a study including 2,056 firms in the Netherlands, find that
competitor and university cooperation increase innovative sales of products
new to the market. Nieto and Santamaria (2007), with a sample of 1,300
Spanish manufacturing firms, show that collaborative agreements with
other partners have a positive impact on product innovation as well as on
the degree of product novelty. Aschhoff and Schmidt (2008) analyse 699
German firms and find that competitors and research institutions have a
positive impact on innovation performance, whilst suppliers and customers
do not have any influence. Tsai and Wang (2009) study 753 Taiwanese
firms and show that in no instance does a cooperation partner increase
innovation performance. Finally, Zeng et al. (2010), in a study of 137
Chinese manufacturing firms, report that collaboration agreements have a
positive impact on firm performance, especially vertical cooperation. Other
papers turn their attention to a specific kind of innovation. For instance,
Lööf and Brostrom (2008) and Monjon and Waelbroeck (2003) investigate
collaborations with universities and Robin and Schubert (2013) analyse the
impact of cooperation with public research bodies.
Nevertheless, all of these studies focus only on cooperation agreements
with external partners and do not deal with the possibility of internal
collaborations. Since cooperation partners of different types may not have
the same impact on firm performance, it is interesting to enquire as to the
impact of internal collaboration. As pointed out in the literature, belonging
to a group of companies benefits firms not only in terms of economies of
scale and access to finance, but also in terms of intra-group knowledge
spillovers (Mohnen et al., 2006 and Frenz and Ietto-Gillies, 2009). In order
to capture these effects, previous studies incorporate a dummy variable to
indicate whether a firm belongs to a group of companies or not. So far,
however, no attention has been paid to the possible collaboration between

114
these firms. Sharing a common internal network can increase the
transmission of knowledge and experience, while collaboration between
these companies could stimulate even more information flows and
technological expertise, or improve distribution and the organizational
process. Thus, cooperation between firms that form part of the same group
(internal cooperation) can generate positive synergies leading to a higher
innovation performance, while appropriability is not an overriding concern
since the benefits will remain in the same group of companies.
5.2.2 Involuntary knowledge flows
As explained in previous chapters, unintended knowledge transfers need to
be taken into account when innovation performance is analysed. Such
knowledge transfers occur when information from one firm flows beyond
its boundaries, enabling others to use this information even if they have not
paid for it. Recently, the increasing availability of innovation surveys has
led to information sources being used as a proxy for involuntary knowledge
flows 57 . Firms are asked to identify which sources have provided
information for their undertaking of innovation projects or for finishing an
existing project. Numerous studies have adopted such measures in their
analyses. In particular, information coming from different types of partners
is often included as a control variable (Lööf and Heshmati, 2002; Janz et al.,
2004; Griffith et al., 2006; Masso and Vather, 2008; Raffo et al., 2008).
Nevertheless, sometimes only information coming from research
institutions or universities is taken into consideration. Mohnen et al. (2006)
and Raymond et al. (2010) are two examples of such studies, since the 57 Various articles have relied on other proxies for these incoming spillovers, such as, the pool of external knowledge. Bearing in mind that any measure has its advantages and disadvantages, here it is decided to use a direct measure that enables researchers to determine which information has been important (and to what extent) in undertaking or completing an innovation project.

115
authors only include a dummy variable to capture proximity to basic
research. Elsewhere, involuntary knowledge sources are used to build an
indicator of external knowledge (see Escribano et al., 2009) or openness
(Robin and Schubert 2013). Interestingly, Belderbos et al. (2004) go a step
further and estimate an auxiliary regression in order to separate the effect of
incoming spillovers from cooperation. Their findings suggest that customer
and university spillovers (which are not due to formal collaborations)
increase innovative sales.
Likewise in the case of voluntary knowledge flows, far too little attention
has been paid to knowledge flows originating from within the firm or the
group of companies. Even though some articles control for internal
information transfers in their equations (Lööf and Heshmati, 2002; Masso
and Vather, 2008 and Raffo et al., 2008), their research is focused on the
impact of R&D on innovation output rather than on the effect of internal
knowledge flows. However, their results indicate that internal knowledge is
an important source of information.
5.2.3 The role of absorptive capacity
Cohen and Levinthal (1989) claim that firms with the greatest technological
capital are the ones that benefit most from external knowledge. In their
seminal article, the authors develop the notion of “absorptive capacity”
which has become a key factor in recent years. Firms need to be able to
recognize external information in order to absorb it and use it for their own
benefit. Being exposed to external knowledge is not enough to acquire it.
Therefore, firms that perform better technologically and own a high level of
knowledge not only increase their innovation performance per se but also
are more able to identify and exploit information outside their boundaries
(also known as “the dual role of R&D”).

116
Some recent studies have investigated this hypothesis. Escribano et al.
(2009), using a sample of 2,265 Spanish firms, show that firms with higher
levels of absorptive capacity can handle external information more
effectively. The authors apply principal component analysis to create an
indicator to capture absorptive capacity, which they interact with
involuntary knowledge flows. Their results suggest that absorptive capacity
positively affects the impact of these transfers on innovation performance.
A similar result is reported by Tsai and Wang (2009), who argue that
internal R&D investment (used as a proxy for absorptive capacity)
increases both innovation performance and the efficiency of collaboration
with different partners. However, Frenz and Ietto-Gillies (2009), who take
into account the possible complementarity between internal and external
sources, reach different conclusions. Although the authors expected firms
with in-house R&D to benefit more from external knowledge and to
generate higher innovative sales, the results do not support their hypothesis.
In line with Frenz and Ietto-Gillies (2009), the second goal of this chapter is
to determine if absorptive capacity affects the relationship between internal
knowledge flows and innovation performance. Given that there is evidence
that internal R&D improves a firm’s learning capacity, it would be
interesting to assess if this ability enhances the efficiency of internal
knowledge transfers resulting in more innovative firms.
To the best of our knowledge, no previous research has considered
information originating from inside the firm or group itself as the main
focus of its analysis and no evidence regarding the effect of absorptive
capacity on such internal knowledge flows has been taken into
consideration to date.

117
5.3 Model and estimation strategy
The goal of this study is to analyse how internal knowledge flows affect the
innovation performance of firms. However, the way in which PITEC, as
well as other innovation surveys, is organised leads to selection problems,
since only innovative firms are required to answer an additional set of
questions regarding innovation activities (see Chapter 2 for further details).
This means that measures of innovation performance are only observed for
innovative firms. It is important to bear this point in mind given the
selection bias the estimates are likely to suffer. In order to deal with this
problem, a Heckman type selection model is used58. This comprises two
equations: i) a selection equation indicating whether the firm innovates or
not and ii) an intensity equation accounting for the firm’s innovative
performance. The second equation includes a correction term, the inverse
Mills ratio, computed in the first equation, to cope with the fact that
innovation performance can only be estimated for those firms that innovate.
Both equations can be specified as follows (Wooldridge, 1995, 2002):
?1?? = { 1 ?? ???(1)?(1) + ??
(1) + ??? (1) > 0
0 ??ℎ?????? [5.1]
?2?? = {???(2)?(2) + ??
(2) + ?̂?? + ??? (2) ?? ?1?? = 1
0 ?? ?1?? = 0 [5.2]
where i and t index firm and year respectively. ?1?? takes a value of 1 if the
firm is an innovator. Here, an innovator is defined as a firm that has
introduced at least one product or process innovation during the last three
58 This kind of model has been widely used in the literature to handle selection bias problems (see Mohnen et al., 2006; Griffith et al., 2006; Artes 2009; Frenz and Ietto-Gillies, 2009; Raymond et al., 2010; Antonietti and Cainelli, 2011; Lhuillery, 2011 and Robin and Shubert, 2013, among others).

118
years [t-2, t]. ?2?? is equal to the firm’s innovation intensity, define as the
share of innovative sales in t, and it is observed only if the firm is
innovative (?1?? = 1). xit(1) and xit
(2)are a set of explanatory variables and
β(1) and β(2) are the parameters to be estimated. αi(1) and αi
(2) capture the
unobserved firm heterogeneity, ?̂?? is the inverse Mills ratio computed in the
first equation, and finally εit (1) and εit
(2) are the error terms. Following
Wooldridge (2002) an exclusion restriction is needed. In other words, xit(1)
should contain an additional variable (not included in xit(2) ) to avoid
multicollinearity problems, since the inverse Mills ratios are incorporated in
the second equation59.
Since our interest in this chapter is focused on innovation performance and
not on the determinants of the qualitative decision to innovate, the analysis
is concerned primarily with the second equation60. In particular, in order to
analyse the impact of internal knowledge flows on firm innovative
performance, Equation [5.2] can be specified as follows:
?2?? = ?0 + ?1????(?−2,?) + ?2????(?−2,?) + ?2 Υ + ??(2) + ?̂?? + ???
(2) ?? ?1?? = 1 [5.3]
where VKF refers to voluntary knowledge flows and IKF to involuntary
knowledge flows for the period [t-2, t] that might have an impact on
innovative performance in t. X2 refers to a group of control variables.
59 In this case, human capital is used as exclusion restriction since it is likely that the percentage of workers with higher education affects the probability of achieving an innovation but not the amount of innovative sales. On the other hand, it is worth remembering that not all firms are requested to answer all the questions on the questionnaire. Only innovative firms are asked about various aspects of their innovation activities. For this reason, there is plenty of information available for Equation [5.2], but information is more limited for Equation [5.1].
60 See Chapter 4 for a structural model that includes an analysis of the determinants to achieve an output innovation.

119
As for the second goal, this chapter seeks to assess if firms with higher
levels of absorptive capacity can handle internal knowledge flows more
effectively, and thus increase their innovative performance. To do so, the
coefficients of internal knowledge flows are expected to depend on the
absorptive capacity (AC) of each firm (lagged two years61):
?? = ?? + ?? ∙ ????−2 ?ℎ??? ? = 1,2 [5.4]
By combining Equations [5.3] and [5.4]:
?2?? = ?0 + ?1 ????(?−2,?) + ?1????(?−2,?) ∙ ????−2 + ?2????(?−2,?) + ?2????(?−2,?) ∙ ????−2+ ?2 Υ + ??
(2) + ?̂?? + ??? (2) ?? ?1?? = 1
+ [5.5]
See next section for a detailed definition of the variables.
As in Chapter 4, the consistent estimator proposed by Wooldridge (1995) is
used to account for selection bias. Equation [5.5] is therefore estimated
using a pooled OLS including T inverse Mills ratios interacted with time
dummies (obtained from estimating the selection equation for each year
separately using a probit model).
5.4 Data and variables
The data used in this chapter consist of an unbalanced panel containing
8,932 firms (63,644 observations), of which 7,665 are innovative firms
(45,036 observations), for the period 2004-2011. In consonance with the
previous chapters, firms that remain at least three years in the panel are
considered since some variables are lagged two periods 62 . This filter
provides a sample that is more than 91% of the whole sample of innovative
61 Absorptive capacity is lagged two periods since it is supposed to affect internal knowledge flows which are produced from t-2 to t.
62 Results without this filter remain almost identical.

120
firms (49,436 observations). Table A.4 in the Appendix shows that the
sample preserves the properties after applying this filter and that it does not
lead to any bias.
The definition of the variables used in the econometric analysis can be
found below. See Table 5.1 for a detailed definition.
5.4.1 Dependent variable: Innovation performance
A firm’s innovation performance is defined as the share of innovative sales
due to new or significantly improved products in t. This measure includes
both innovative sales new only to the firm but not to the market (which
could be considered as imitations) and innovative sales new to the market
(true innovations). The main analysis is conducted without drawing any
distinction between the two since we are interested in the impact of internal
knowledge flows on a firm’s innovative performance as a whole. However,
section 5.6.4 analyses the differences specifically with regard to the novelty
of the innovation. To handle the fact that the endogenous variable is a
proportion, a logit transformation is performed63.
5.4.2 Independent variables
Voluntary and involuntary knowledge flows
As discussed at the beginning of this chapter, two kinds of internal
knowledge flows can be distinguished. The first appear as a result of
(intentional) formal collaboration and are viewed as “voluntary” spillovers,
while the second do not arise out of cooperation agreements and are viewed
63 Since the endogenous variable is a proportion, its values are bounded by 0 and 1. Applying the logit transformation, ln(y2 1-y2⁄ ), real values are obtained (from -∞ to +∞). To do so, 0 values (value for process innovators only) are replaced by 0.01 and 1 by 0.99 (see Mohnen et al., 2006, and Raymond et al., 2010).

121
as unintentional. In other words, the firm does not engage in any particular
action or make any commitment in order to benefit from internal
information; thus, they are considered to be “involuntary”. They include,
for example, information garnered from interactions between employees, at
company meetings, or as a result of worker mobility between different
offices and so on.
Voluntary knowledge flows are proxied by internal cooperation, which is
defined as a dummy variable that takes a value of 1 if the firm belongs to a
group and has cooperated in innovation activities with other firms within
that group. It is expected that internal cooperation agreements entered into
in the period [t-2, t] will have an impact on the innovation performance in t.
Involuntary knowledge flows are calculated by using a direct measure of the
importance of internal information sources. According to PITEC, firms can
identify different information sources (internal, clients, suppliers,
competitors, universities, etc.) in their innovation activities as well as their
degree of importance. In other words, firms declare whether or not they
have used a source and at what level of intensity (low, medium or high on a
four-point Likert scale). Thus, a dummy variable, which takes a value of 1
if the firm declares that internal information (within the company or group)
has been used at a high level of intensity to undertake or finish innovation
projects during the period [t-2, t], is employed to measure involuntary
knowledge flows.
As Belderbos et al. (2004) point out, the effect of the knowledge flows that
arise from formal cooperation has to be separated from the effect arising
from involuntary knowledge transfers. To do so, involuntary spillovers are
defined only for those firms that do not engage in internal cooperation.
PITEC shows that 99% of firms that collaborate in innovation activities

122
with other firms in their group declare that internal information is, to some
extent (low, medium or high), a relevant source. Hence, in order to separate
both effects, collaborative firms are excluded from the definition of the
involuntary spillover variable. This means that a value of 0 is assigned to
those firms that declare that internal information is not an important source
of information, and also to those firms that declare that it is an important
source of information but that they engage in cooperation activities with
other firms within their group. In contrast, a value of 1 is given to those
firms for which internal information is important and which do not enter
into internal collaboration agreements.
Finally, innovation intensity is also included as an explanatory variable in
order to account for accumulated knowledge and experience. This variable
is used in the literature as a proxy for research effort and has a positive
impact on innovation output. Here, it is defined as the ratio of innovation
expenditures over sales (in logarithm) and it is lagged two years64.
Control variables
In line with the previous literature, firm size, measured as the logarithm of
the number of employees, is included to capture economies of scale and
access to finance. Its quadratic form is also incorporated to account for
possible non-linearities. In addition, a dummy variable indicating whether
the firm has operated in an international market in the preceding three years
64 This is a plausible assumption since innovation efforts do not have an immediate impact on innovative performance, rather time is needed. In addition, it helps to mitigate possible simultaneity problems. Certainly, a longer lag phase may be required since it is generally accepted that investments in innovation take some time to materialise in something new or because completing an R&D project might take more than one year. However, this variable is also included in Equation [5.1] where it is lagged two periods since the innovation indicator refers to the period [t-2, t]. In addition, as PITEC is a short panel it is decided to work with a two-year lag.

123
is introduced. Firms that face high levels of competition are encouraged to
invest in innovation and improve their innovation performance in order to
be competitive. A dummy variable indicating if a firm does not belong to a
group of companies is also incorporated. This variable seeks to compensate
for the fact that internal cooperation (voluntary knowledge flows) is only
defined for those firms that belong to a group65. Additionally, a dummy
variable that takes a value of 1 for non-innovation performer firms (lagged
two years) is included.
Two dummy variables to control for external knowledge flows and to
compare with the impact of internal knowledge transfers are also
incorporated66. The first of these is a dummy variable referring to external
cooperation, which takes a value of 1 if the firm has cooperated in
innovation activities with other firms (outside its group) over the last three
years (including suppliers, competitors, clients, universities, etc.). Likewise,
a dummy variable for external information sources (originating from
suppliers, competitors, clients, competitors, etc.) is introduced in the model.
Following the definition of internal information, only those firms that do
not engage in cooperation activities with other firms (outside their group)
are considered at this point (see Table 5.1 for a detailed definition).
65 In practice, this variable can be considered to have three categories: i) firms not belonging to a group, ii) firms belonging to a group but not undertaking internal cooperation (reference group), iii) firms belonging to a group and involved in internal cooperation. By doing so, it is possible to see not only the effect on firms of not forming part of a group, but also the effect of voluntary knowledge flows compared to firms that can cooperate (because they belong to a group of companies) but decide not to do so.
66 Both variables are defined as general measures of external cooperation and external information since the interest here does not lay in analysing differences between types of partners (see Belderbos et al., 2004; Amara and Landry, 2005; or Tsai and Wang, 2009 for such kind of analysis). The concern at this point is to compare the effect of external and internal knowledge flows on innovation performance.

124
Table 5.1 Definition of variables Dependent variable
Innovation performance Ratio of innovative sales due to new or significantly improved products over total sales in t.
Independent variables Internal Cooperation (voluntary knowledge flows)
Dummy variable equals 1 if the firm belongs to a group of companies and has cooperated in innovation activities with other firms of its group over the last three years; 0 otherwise.
Internal information (involuntary knowledge flows)
Dummy variable equals 1 if the firm declares that information coming from the firm or group has been an important source to undertake or finish innovation projects during the last three years as long as it has not cooperated with other firms of its group during that period; 0 otherwise.
Innovation intensity (1)
Ratio of the innovation expenditures over total sales in t-2 (in logs). This measure includes intramural R&D investment, external R&D, acquisition of machinery, equipment and software, acquisition of external knowledge (not included in R&D), training for innovative activities, market introduction of innovation, design and others. It is computed as a stock measure using the perpetual inventory method (depreciate rate of 15%).
Absorptive capacity Ratio of intramural R&D stock over total sales in t-2 (in logs) using the perpetual inventory method.
Controls
Size (1) Number of employees in t-2 (in logs).
International market Dummy variable equals1 if the firm trades in an international market in the previous three years; 0 otherwise.
No group (1) Dummy variable equals 1 if the firm does not belong to a group of companies in t-2; 0 otherwise.
Non-innovation performer(1)
Dummy variable equals 1 if the firm does not engage in any innovation activity in t-2; 0 otherwise.
External cooperation
Dummy variable equals 1 if the firm has cooperated in innovation activities with other firms (including suppliers, clients, competitors, universities, etc.) over the last three years; 0 otherwise.
External information
Dummy variable equals 1 if the firm declares that information coming from suppliers, clients, competitors, universities, etc. has been an important source of information to undertake or finish innovation projects during the last three years as long as it has not cooperated with other firms at the same time; 0 otherwise.
Note: Monetary variables are expressed in real terms (base 2011, using the GDP deflator). (1) These variables are lagged two periods since they are included in Equation [5.1], where they explain the probability of obtaining a product or a process innovation for the period [t-2, t].

125
Finally, industry dummies, time dummies and the inverse Mills ratio are
included to capture specific industry characteristics and technological
opportunities, time trends and selection bias respectively.
Absorptive capacity
Even though there are different measures to proxy absorptive capacity, here
it is employed one of the most commonly used in the literature: R&D
intensity (Cohen and Levinthal, 1989). However, in order to capture the
accumulation of knowledge absorptive capacity is defined as the ratio of
internal R&D stock over sales (in logarithm).
5.5 Results
5.5.1 Descriptive analysis
Table 5.2 presents the descriptive statistics for the dependent, independent
and control variables used in the econometric analysis.
As can be seen, 52% of the innovative firms recognise that internal
information is an important source of information for undertaking new
innovation projects or finishing existing ones. Additionally, 26% of the
firms that belong to a group (42.2%) opted to engage in cooperation
agreements with other firms in the same group.
As shown in columns 7 and 8, the share of innovative sales differs
statistically between groups. In particular, firms that consider internal
information to be highly important have a greater share of innovative sales
(0.32) than firms that do not (0.28). A similar result is found for those firms
that cooperate internally (0.32 vs. 0.27). Significant differences can also be
found in relation to the control variables. The share of innovative sales is
higher for those firms that operate in an international market, those that do

126
not belong to a group67, those that undertake innovation expenditures and
those firms that cooperate with external partners.
Table 5.2 Descriptive statistics for innovative firms
Standard deviations Share of innovative sales per group
Type Mean overall between within 0 1 Test 11 Test 22
(1) (2) (3) (4) (5) (6) (7) (8)
Dependent variable
Share innovative sales [0-1] 0.30 0.37 0.28 0.25
New to the firm only [0-1] 0.177 0.29 0.22 0.21
New to the market [0-1] 0.123 0.25 0.18 0.17
Independent variables
Innovation intensity cont. 0.233 0.39 0.37 0.14 Internal information
(involuntary) (0/1) 0.519 0.50 0.37 0.34 0.28 0.32 -9.3*** -15.2***
Internal cooperation (voluntary) (0/1) 0.259 0.44 0.34 0.27 0.27 0.32 -9.3*** -18.0***
Absorptive Capacity cont. 0.171 0.35 0.33 0.12
Control variables
Size cont. 4.389 1.34 1.34 0.19
International market (0/1) 0.560 0.50 0.44 0.25 0.28 0.31 -7.4*** -19.8***
No group (0/1) 0.578 0.49 0.46 0.17 0.28 0.31 -9.1*** -7.5*** Non-innovation
performer (0/1) 0.167 0.37 0.27 0.28 0.32 0.23 18.7*** 36.8***
External information (0/1) 0.313 0.46 0.33 0.33 0.30 0.30 0.27 -0.26
External cooperation (0/1) 0.355 0.48 0.37 0.30 0.29 0.33 -10.7*** -21.8***
Number of observations 45,036
Note: It is tested whether there are significant differences in the share of innovative sales within two groups. Column 5 indicates the mean of innovative sales for the first group (i.e. Xi=0) and column 6 for the second group (i.e. Xi=1). In order to do so, two tests are used: parametric test (column 7) and non-parametric test (column 8). (1) Test 1 is a parametric test to check whether the share of innovative sales has the same mean within two groups. (2) Test 2 is the non-parametric Wilcoxon rank-sum test, also known as Mann–Whitney two-sample statistic, which tests the hypothesis that two independent samples are from populations with the same distribution. Source: PITEC; own calculations.
67 Even though firms that belong to a group present greater innovation sales than those who do not belong to any group, their sales are much higher, leading to a lower ratio (innovative sales/sales).

127
A comparison of internal and external knowledge flows shows that the
proportion of firms declaring internal information as important is higher
(52%) than that recognising the importance of external information (31%),
while the opposite is the case with cooperation (26% vs. 35%). As
discussed above, a global measure for external knowledge transfer has been
used. If instead all types of information flow are taken into account, it can
be seen that internal knowledge flows are the most relevant for both
voluntary and involuntary spillovers. Figure 5.1 presents the distribution of
the different sources of information that have been considered in terms of as
a highly important. As shown, information originating from within the firm
or the group is clearly the most important. Likewise, Figure 5.2 illustrates
that internal cooperation is the most frequent kind of cooperation adopted
when undertaking innovation activities.
Figure 5.1 High important sources of information (% of innovative firms)
Source: PITEC; own calculations.
51,9
16,1
21,6
11,0 7,0
3,3 2,7 3,6
17,5
00
10
20
30
40
50
60

128
Figure 5.2 Cooperation in innovation activities with different types of partners (% of innovative firms)
Source: PITEC; own calculations.
5.5.2 Estimation results
Table 5.3 presents the results for Equation [5.5], which is estimated by
using the consistent estimator proposed by Wooldridge (1995) to account
for the selection bias arising from the fact that only innovative firms are
included in the regression. Results of the Equation [5.1], estimated for each
year, are provided in Table A.5 in the Appendix. Column (1) in Table 5.3
shows the general results in which the importance of voluntary and
involuntary internal knowledge flows are analysed (our first research
question). The rest of the table includes the interaction terms described in
section 5.3 in order to verify whether absorptive capacity affects the impact
of internal knowledge transfers on innovation performance (our second
research question). As can be seen, these interactions are incorporated
separately (columns 2 and 3) and then jointly (column 4).
Following Escribano et al. (2009), these interaction terms are
orthogonalized to reduce multicollinearity problems. The variance inflation
25,9
17,5
13,0
8,4
12,1
16,1
8,7
15,0
00
05
10
15
20
25
30

129
factors (VIF) have been computed to detect such problems and the values
for all the interaction terms are below 3, indicating that there are no
multicollinerarity problems. On the other hand, the inverse Mills ratio is
significant. Although some of the interactions with the time dummies are
not significant, the Wald test (performed to check for joint significance)
clearly identifies a selection bias problem and a correction is necessary to
ensure consistent results. Finally, the errors are bootstrapped in order to
account for the generated regressor problem, which is likely to appear given
that the inverse Mills ratio (predicted in Equation [5.1]) is included as an
explanatory variable.
Turning now to the variables of interest, it can be seen that both internal
knowledge flows (voluntary and involuntary) have a positive and
significant impact on innovation performance. In particular, those firms that
cooperate with firms from their own group present a ratio of innovative
sales greater than those firms that do not engage in cooperation of this kind.
Likewise, those firms that identify internal information as an important
source for undertaking or completing innovation projects record a higher
share of innovation sales than those firms that do not. In addition, the
results obtained show firms benefit more from voluntary (originating from
collaborative agreements within the group) than involuntary spillovers. This
result is not surprising since the information obtained from cooperative
agreements is expected to be more desirable or to provide a better fit than
information gathered unintentionally.
Interestingly enough, internal knowledge flows, both voluntary and
involuntary, present higher coefficients than those presented by external
knowledge transfers. In other words, information exchange within the
company, or with other companies in the same group, is more relevant for

130
explaining innovation performance than information received from outside
the firm (or group). Bearing in mind that knowledge transfer involves
people, a possible explanation for this result might be that people within
firms are more similar to one another than are people working in different
firms (Argote and Ingram, 2000). Thus, the absorption of knowledge
originating from within the company may be faster or easier, resulting in
greater innovative sales. By contrast, acquiring knowledge from a different
firm might require more time for its implementation while workers may
require training in order to use it. In addition, information gathered from
within the company is probably more straightforward to exploit than
information originating from other companies. Finally, another possible
explanation might be that everyone within the company strives to move in
the same direction to achieve the firm’s goals (from the individual level to
that of management policies), whereas knowledge acquired from firms
outside the group may have different purposes and may need to be adapted
to the new context. To sum up, this result highlights the relevance of
internal information, which has tended to be ignored with the literature
opting to focus its attention on external knowledge.
As for the second goal of this chapter, it can be seen that absorptive
capacity (proxied by internal R&D stock) affects the relationship between
internal knowledge flows and innovation performance in different ways.
Columns 2 and 4 show that, while firms that collaborate with other firms in
their group present greater innovation performance, this result is not
influenced by their own R&D stock. Yet, in the case of involuntary
knowledge flows, the results suggest that the more absorptive capacity the
firm has, the greater the performance of involuntary knowledge transfers
(columns 3 and 4). Thus, if two firms that declare internal information to be
an important source are compared, innovation performance tends to be

131
higher for that firm with greater investment in R&D. This points to the dual
role of R&D, since own-generation of knowledge not only increases
innovation performance per se, but it also provides the firm with the ability
to exploit involuntary spillovers more efficiently.
Table 5.3 Estimates of Equation [5.5] using Wooldridge (1995) consistent estimator for panel data with sample selection. PITEC 2004-2011. Dependent variable Share of innovative sales
(logit transformation) (1) (2) (3) (4) Innovation intensity 1.053*** 1.052*** 1.055*** 1.056*** (0.0712) (0.0698) (0.0707) (0.0722) Internal cooperation 0.406*** 0.405*** 0.415*** 0.416*** (voluntary) (0.0705) (0.0627) (0.0601) (0.0649) Internal information 0.253*** 0.252*** 0.256*** 0.257*** (involuntary) (0.0415) (0.0353) (0.0391) (0.0403) Abs Cap * Internal cooperation -0.00938 0.0102 (0.0178) (0.0203) Abs Cap * Internal information 0.0366* 0.0416* (0.0198) (0.0231) Control Variables Size 4.480*** 4.439*** 4.463*** 4.506*** (1.631) (1.427) (1.439) (1.591) Size2 -2.270*** -2.250*** -2.262*** -2.283*** (0.806) (0.703) (0.711) (0.784) International market 0.171*** 0.170*** 0.169*** 0.169*** (0.0470) (0.0447) (0.0509) (0.0417) No group 0.0491 0.0473 0.0437 0.0450 (0.0496) (0.0442) (0.0390) (0.0404) Non-innovation performer -0.282 -0.282 -0.280 -0.279 (0.210) (0.185) (0.220) (0.198) External cooperation 0.230*** 0.230*** 0.229*** 0.229*** (0.0478) (0.0431) (0.0475) (0.0432) External information 0.187*** 0.187*** 0.188*** 0.189*** (0.0475) (0.0434) (0.0420) (0.0447) ?̂?? -0.527** -0.526** -0.533** -0.534** (0.247) (0.247) (0.263) (0.234) ?̂?? * 2007 -0.424*** -0.424*** -0.424*** -0.424** (0.139) (0.144) (0.112) (0.166) ?̂?? * 2008 0.0261 0.0259 0.0258 0.0259 (0.123) (0.150) (0.135) (0.152)
To be continued on the next page

132
Table 5.3 - continued from the previous page (1) (2) (3) (4) ?̂?? * 2009 0.0553 0.0551 0.0541 0.0542 (0.165) (0.138) (0.155) (0.147) ?̂?? * 2010 0.0220 0.0219 0.0193 0.0190 (0.177) (0.163) (0.152) (0.147) ?̂?? * 2011 -0.252* -0.253* -0.251** -0.251* (0.130) (0.137) (0.128) (0.130) Constant -2.239*** -2.231*** -2.228*** -2.235*** (0.201) (0.200) (0.199) (0.236) Industry dummies Yes Yes Yes Yes Wald Test: Industry dummies 1245.13*** 1182.52*** 974.53*** 1112.35*** ?̂?? * T 44.57*** 45.98*** 54.75*** 60.83*** Observations 32,481 32,481 32,481 32,481 Adjusted R2 0.07 0.07 0.07 0.07
Notes: Bootstrapped standard errors are in brackets. *** Significant at 1%, ** significant at 5%, * significant at 10%.
Finally, the control variables have the expected sign. Clearly, innovation
investment shows a positive and significant coefficient, increasing a firm’s
innovative performance. Firm size presents an inverted U-shaped
relationship. Operating in an international market increases innovation
performance. Last of all, firms benefit from external knowledge flows (both
voluntary and involuntary), albeit to a lesser extent than they benefit from
internal knowledge transfers as has been shown above.
5.6 Further Explorations
5.6.1 Alternative measure of involuntary knowledge flows
As discussed in section 5.4.2, it is important to distinguish between the
effects of voluntary and involuntary spillovers, since they are prone to
overlap (the more a firm cooperates, the greater the importance attached to
information flows). In order to avoid this, information flows originating
from cooperative firms are deducted from the previously used definition of
involuntary knowledge flows.

133
Here, an alternative measure of involuntary knowledge transfer is adopted.
Following Belderbos et al. (2004), who conduct an auxiliary regression in
which involuntary spillovers are explained by voluntary spillovers, industry
dummies and time dummies is estimated68. The former is a dummy equal to
1 if the firm declares that information originating from the firm or group
has been an important source for undertaking or finishing innovation
projects in the last three years. The residuals are then used to approximate
involuntary knowledge flows, since the effect of internal cooperation has
been removed from them. The same strategy is applied to external
knowledge flows.
As can be seen, the results are largely unaltered. Internal knowledge flows
are clearly significant in explaining a firm’s innovation sales. Nonetheless,
now the magnitude of the impact is very similar with both voluntary and
involuntary spillovers presenting similar coefficients. Additionally, and in
line with the main results, internal knowledge flows are more relevant than
external information transfers, stressing the importance of information
exchange inside the company. As far as absorptive capacity is concerned, it
can be observed that it does not affect the relationship between involuntary
knowledge flows and innovation performance when this new definition is
applied.
Tables 5.3 and 5.4 appear to indicate that the effectiveness of internal
knowledge flows is not particularly related to the firm’s stock in R&D. It is
possible that organizational abilities and management policies have a
greater impact on the efficiency of internal information transfers. For
instance, improving workplace organization or undertaking a good
68 A random effect probit model is employed given the panel structure of the data and the binary character of the dependent variable.

134
knowledge management program could stimulate knowledge sharing and
make internal information flows more profitable.
Table 5.4 Estimates of Equation [5.5] using Wooldridge (1995) consistent estimator for panel data with sample selection. PITEC 2004-2011. Alternative definition for involuntary spillovers. Dependent variable Share of innovative sales
(logit transformation) (1) (2) (3) (4) Innovation intensity 1.053*** 1.052*** 1.054*** 1.053*** (0.0721) (0.0727) (0.0638) (0.0753) Internal cooperation 0.222*** 0.222*** 0.222*** 0.223*** (voluntary) (0.0646) (0.0539) (0.0581) (0.0561) Internal information (1) 0.218*** 0.218*** 0.218*** 0.217*** (involuntary) (0.0344) (0.0365) (0.0311) (0.0336) Abs Cap * Internal cooperation -0.0126 -0.0132 (0.0177) (0.0159) Abs Cap * Internal information 0.0177 0.0182 (0.0239) (0.0233) Control Variables Size 4.489*** 4.434*** 4.513*** 4.457*** (1.610) (1.616) (1.619) (1.589) Size2 -2.274*** -2.248*** -2.286*** -2.259*** (0.795) (0.799) (0.799) (0.785) International market 0.178*** 0.177*** 0.177*** 0.177*** (0.0451) (0.0419) (0.0489) (0.0427) No group 0.0466 0.0442 0.0461 0.0435 (0.0481) (0.0444) (0.0488) (0.0414) Non-innovation performer -0.328 -0.328* -0.328* -0.328* (0.200) (0.181) (0.185) (0.199) External cooperation 0.169*** 0.168*** 0.168*** 0.167*** (0.0421) (0.0407) (0.0363) (0.0394) External information (1) 0.109*** 0.109*** 0.109*** 0.109*** (0.0307) (0.0346) (0.0311) (0.0357) ?̂?? -0.431* -0.430* -0.434* -0.433* (0.258) (0.220) (0.233) (0.235) ?̂?? * 2007 -0.442*** -0.443*** -0.441*** -0.442*** (0.146) (0.138) (0.124) (0.135) ?̂?? * 2008 -0.0279 -0.0281 -0.0259 -0.0260 (0.147) (0.151) (0.123) (0.135)
To be continued on the next page

135
Table 5.4 – continued from the previous page (1) (2) (3) (4) ?̂?? * 2009 -0.0181 -0.0183 -0.0162 -0.0163 (0.140) (0.158) (0.132) (0.135) ?̂?? * 2010 -0.107 -0.107 -0.104 -0.104 (0.164) (0.157) (0.143) (0.161) ?̂?? * 2011 -0.295** -0.297** -0.294** -0.295** (0.133) (0.139) (0.122) (0.133) Constant -2.004*** -1.994*** -2.006*** -1.995*** (0.181) (0.171) (0.204) (0.207) Industry dummies Yes Yes Yes Yes Wald Test: Industry dummies 1298.04*** 1068.37*** 1184.88*** 1310.11*** ?̂?? * T 50.86*** 42.73*** 47.07*** 50.91*** Observations 32,481 32,481 32,481 32,481 Adjusted R2 0.07 0.07 0.07 0.07
Notes: Bootstrapped standard errors are in brackets. (1) New definition for involuntary spillovers: internal and external information are proxied by the residuals obtained from an auxiliary regression where information is regress against cooperation, industry dummies and time dummies using a RE probit model. *** Significant at 1%, ** significant at 5%, * significant at 10%.
5.6.2 Absorptive capacity as a discrete measure
In this section, the role of absorptive capacity is addressed from a discrete
perspective. Since absorptive capacity – defined as intramural R&D stock
over sales – is a variable that can vary greatly, it is decided to introduce it in
the model in a discrete form. In this regard, three levels are considered: low,
medium and high. The interactions between these dummies and internal
knowledge flows are included in Equation [5.3], as opposed to internal
knowledge flows on their own. By doing so, it is possible to observe if the
impact of internal knowledge flows differs according to the level of
absorptive capacity (low, medium or high) and whether that impact is
different to that experienced by firms that do not benefit from internal
knowledge flows whatsoever.
The results in Table 5.5 suggest that absorptive capacity plays a clear role.
First of all, it can be seen that a firm that cooperates with other firms in its

136
same group and which has a low absorptive capacity presents a higher ratio
of innovative sales than those presented by firms that do not engage in such
kind of activity (reference group). Second, firms that cooperate internally
and which have medium absorptive capacity present a higher value, while
those with high absorptive capacity benefit the most from internal
cooperation. Yet, when internal information is analysed it can be seen that
there is no difference between firms that do not identify internal
information as an important source and those which do so but whose
absorptive capacity is low. By contrast, companies with medium or high
absorptive capacity increase their innovative sales with internal information.
All in all, the performance attributable to internal knowledge transfers is
clearly influenced by a firm’s level of absorptive capacity.
Table 5.5 Estimates of Equation [5.5] using Wooldridge (1995) consistent estimator for panel data with sample selection. PITEC 2004-2011. Dummy variables to proxy absorptive capacity. Dependent variable Share of innovative sales
(logit transformation) (1) (2) (3) (4) Innovation intensity 1.053*** 1.029*** 1.010*** 0.971*** (0.0712) (0.0716) (0.0883) (0.0726) Internal cooperation 0.406*** 0.403*** (voluntary) (0.0705) (0.0683) Internal information 0.253*** 0.255*** (involuntary) (0.0415) (0.0399) AbsCap low * Internal Coop 0.280*** 0.221** (0.0926) (0.107) AbsCap med * Internal Coop 0.339*** 0.339*** (0.0914) (0.0876) AbsCap high * Internal Coop 0.594*** 0.644*** (0.0950) (0.0789) AbsCap low * Internal Info -0.0171 -0.0302 (0.0596) (0.0629) AbsCap med * Internal Info 0.378*** 0.377*** (0.0515) (0.0575) AbsCap high * Internal Info 0.370*** 0.393*** (0.0480) (0.0491) Size 4.480*** 4.734*** 4.736*** 5.068*** (1.631) (1.453) (1.648) (1.507)
To be continued on the next page

137
Table 5.5 – continued from the previous page
(1) (2) (3) (4) Size2 -2.270*** -2.393*** -2.389*** -2.550*** (0.806) (0.718) (0.815) (0.743) International market 0.171*** 0.172*** 0.163*** 0.164*** (0.0470) (0.0503) (0.0425) (0.0445) No group 0.0491 0.0568 0.0343 0.0433 (0.0496) (0.0479) (0.0509) (0.0439) Non-innovation performer -0.282 -0.284 -0.234 -0.235 (0.210) (0.190) (0.205) (0.174) External cooperation 0.230*** 0.230*** 0.219*** 0.217*** (0.0478) (0.0477) (0.0481) (0.0472) External information 0.187*** 0.187*** 0.186*** 0.186*** (0.0475) (0.0426) (0.0484) (0.0455) ?̂?? -0.527** -0.522** -0.476* -0.464** (0.247) (0.258) (0.251) (0.230) ?̂?? * 2007 -0.424*** -0.426*** -0.452*** -0.457*** (0.139) (0.134) (0.145) (0.137) ?̂?? * 2008 0.0261 0.0241 -0.0204 -0.0258 (0.123) (0.123) (0.147) (0.145) ?̂?? * 2009 0.0553 0.0534 0.00257 -0.00312 (0.165) (0.127) (0.138) (0.138) ?̂?? * 2010 0.0220 0.0192 -0.0431 -0.0506 (0.177) (0.135) (0.157) (0.152) ?̂?? * 2011 -0.252* -0.255** -0.308** -0.316** (0.130) (0.127) (0.135) (0.146) Constant -2.239*** -2.283*** -2.276*** -2.336*** (0.201) (0.216) (0.207) (0.214) Industry dummies Yes Yes Yes Yes Wald Test: Industry dummies 1245.13*** 1535.04*** 1161.89*** 721.44*** ?̂?? * T 44.57*** 49.80*** 36.77*** 51.83*** Observations 32,481 32,481 32,481 32,481 Adjusted R2 0.07 0.068 0.069 0.070
Notes: Bootstrapped standard errors are in brackets. *** Significant at 1%, ** significant at 5%, * significant at 10%.
5.6.3 Alternative measure for Absorptive Capacity: Personnel in
R&D
As discussed, absorptive capacity can be proxied by different variables.
Although R&D is one of the most frequently used in the literature, other
variables have also been employed (e.g., operating an R&D department,
human capital, etc.). In consonance with the concept of absorptive capacity,

138
external knowledge needs to be recognized, assimilated and exploited. A
firm’s ability to do this depends to a great extent on its workforce. For this
reason, absorptive capacity is defined here as the number of employees
engaged in R&D activities.
Table 5.6 shows that the main results are almost identical; however, when
using this new definition of absorptive capacity both interactions present a
positive coefficient. This means that the impact of internal knowledge flows
on innovation performance increases with absorptive capacity. Thus, those
firms with more personnel engaged in R&D activities will manage internal
information flows more efficiently. A possible explanation for this could be
that this definition refers to those working in R&D activities that can both
share knowledge accurately as well as increase the firm’s ability to
assimilate and exploit knowledge acquired (internally).
Table 5.6 Estimates of Equation [5.5] using Wooldridge (1995) consistent estimator for panel data with sample selection. PITEC 2004-2011. Alternative definition of absorptive capacity. Dependent variable Share of innovative sales
(logit transformation) (1) (2) (3) (4) Innovation intensity 1.053*** 1.037*** 0.977*** 0.950*** (0.0712) (0.0700) (0.0720) (0.0787) Internal cooperation 0.406*** 0.118 0.472*** 0.120 (voluntary) (0.0705) (0.103) (0.0648) (0.109) Internal information 0.253*** 0.258*** 0.0387 0.0259 (involuntary) (0.0415) (0.0405) (0.0566) (0.0459) Abs Cap(1) * Internal cooperation 0.129*** 0.161*** (0.0307) (0.0341) Abs Cap(1) * Internal information 0.147*** 0.160*** (0.0264) (0.0195) Control Variables Size 4.480*** 4.002** 4.911*** 4.353*** (1.631) (1.816) (1.558) (1.289) Size2 -2.270*** -2.038** -2.492*** -2.224*** (0.806) (0.897) (0.769) (0.636)
To be continued on the next page

139
Table 5.6 – continued from the previous page
(1) (2) (3) (4) International market 0.171*** 0.167*** 0.153*** 0.146*** (0.0470) (0.0434) (0.0436) (0.0426) No group 0.0491 0.0439 0.0518 0.0455 (0.0496) (0.0422) (0.0412) (0.0484) Non-innovation performer -0.282 -0.269 -0.191 -0.166 (0.210) (0.182) (0.180) (0.200) External cooperation 0.230*** 0.227*** 0.209*** 0.202*** (0.0478) (0.0514) (0.0455) (0.0462) External information 0.187*** 0.187*** 0.188*** 0.188*** (0.0475) (0.0475) (0.0458) (0.0421) ?̂?? -0.527** -0.521** -0.526** -0.519** (0.247) (0.230) (0.213) (0.257) ?̂?? * 2007 -0.424*** -0.429*** -0.427*** -0.433*** (0.139) (0.119) (0.130) (0.151) ?̂?? * 2008 0.0261 0.0187 0.0275 0.0184 (0.123) (0.134) (0.129) (0.139) ?̂?? * 2009 0.0553 0.0466 0.0450 0.0334 (0.165) (0.150) (0.129) (0.134) ?̂?? * 2010 0.0220 0.0108 0.00834 -0.00681 (0.177) (0.155) (0.132) (0.142) ?̂?? * 2011 -0.252* -0.256* -0.243* -0.246* (0.130) (0.135) (0.135) (0.139) Constant -2.239*** -2.149*** -2.151*** -2.030*** (0.201) (0.196) (0.224) (0.214) Industry dummies Yes Yes Yes Yes Wald Test: Industry dummies 1245.13*** 1070.56*** 1255.13*** 980.12*** ?̂?? * T 44.57*** 48.98*** 36.77*** 50.16*** Observations 32,481 32,481 32,481 32,481 Adjusted R2 0.07 0.07 0.07 0.07
Notes: Bootstrapped standard errors are in brackets. (1) Absorptive capacity is defined as the number of employees working on R&D activities (in logs). *** Significant at 1%, ** significant at 5%, * significant at 10%.
5.6.4 Is the degree of novelty in the innovation important?
Finally, PITEC offers information about the novelty of the innovation
distinguishing between innovations new only to the firm (but already
available on the market) and innovations that are new to the market.
According to the literature, the former can be considered to be “imitations”,
while the second types are known as “true innovations”.

140
This raises the question as to whether the impact of internal knowledge
flows differs depending on the type of innovation (imitation vs. true). Table
5.7 seems to suggest it is, though it should be stressed that the first four
columns of the model are poorly adjusted, indicating that these findings
should be interpreted with caution. However, generally speaking, both
internal and external knowledge flows appear to have a greater impact on
the share of innovative sales that are new to the market.
In the case of internal knowledge flows, while it is true that internal
cooperation is relevant for both innovative sales new to the firm and to the
market, internal information only has a positive impact on the development
of “true innovations” (and no significance can be found for innovative sales
of products that are only new to the firm). This might be because internal
information transfers are not relevant in the case of imitations, since the
firm is basically reproducing something completed outside its boundaries.
However, sharing information and experience within the company helps
firms not only to be more efficient and to perform better technologically but
also to create something new, a “true innovation”. On the other hand,
external cooperation is only relevant for raising innovative sales of products
new to the market. This result may be explained by the fact that innovation
projects of this nature are usually risky and costly being cooperation with
other firms a good means for coping with these obstacles. Finally, Table 5.7
shows that the impact of absorptive capacity on involuntary spillovers is
relevant solely in the case of innovations new to the market.

141
Table 5.7 Estimates of Equation [5.5] using Wooldridge (1995) consistent estimator for panel data with sample selection. PITEC 2004-2011. Estimations according to the degree of novelty Dependent variable
Share of innovative sales (logit transformation)
New to the firm (only) New to the market (1) (2) (3) (4) (5) (6) (7) (8) Innov inten. 0.305*** 0.305*** 0.305*** 0.307*** 0.883*** 0.882*** 0.885*** 0.886*** (0.0640) (0.0597) (0.0625) (0.0653) (0.0700) (0.0667) (0.0636) (0.0579) Int coop 0.282*** 0.283*** 0.284*** 0.286*** 0.285*** 0.285*** 0.295*** 0.296*** (voluntary) (0.0532) (0.0513) (0.0656) (0.0531) (0.0460) (0.0524) (0.0516) (0.0553) Int infor 0.0123 0.0128 0.0129 0.0145 0.328*** 0.326*** 0.331*** 0.331*** (involuntary) (0.0315) (0.0279) (0.0345) (0.0362) (0.0294) (0.0249) (0.0304) (0.0285) Abs Cap * 0.00700 0.0136 -0.0162 0.00433 Int coop (0.0160) (0.0138) (0.0153) (0.0194) Abs Cap * 0.00733 0.0140 0.0415** 0.0436** Int infor (0.0154) (0.0166) (0.0168) (0.0212)
Controls Size -1.939* -1.909 -1.943* -1.886 7.33*** 7.26*** 7.31*** 7.33*** (1.148) (1.374) (1.116) (1.297) (1.144) (1.149) (1.158) (1.214) Size2 0.917 0.902 0.919* 0.891 -3.640*** -3.60*** -3.63*** -3.64*** (0.567) (0.680) (0.551) (0.640) (0.565) (0.568) (0.572) (0.600) Inter market 0.0938** 0.0940*** 0.0934** 0.0934** 0.143*** 0.143*** 0.141*** 0.141*** (0.0368) (0.0364) (0.0369) (0.0370) (0.0325) (0.0287) (0.0293) (0.0283) No group 0.0404 0.0418 0.0394 0.0410 0.0227 0.0196 0.0166 0.0171 (0.0367) (0.0385) (0.0418) (0.0391) (0.0297) (0.0301) (0.0291) (0.0305) Non-innov -0.402** -0.402** -0.401** -0.400** 0.105 0.104 0.108 0.108 performer (0.163) (0.190) (0.176) (0.175) (0.135) (0.127) (0.114) (0.128) Ext coop 0.0134 0.0140 0.0130 0.0140 0.341*** 0.339*** 0.339*** 0.339*** (0.0380) (0.0414) (0.0384) (0.0422) (0.0329) (0.0346) (0.0344) (0.0306) Ext infor 0.0975** 0.0975*** 0.0978*** 0.0981*** 0.165*** 0.165*** 0.167*** 0.167*** (0.0390) (0.0367) (0.0375) (0.0351) (0.0299) (0.0315) (0.0274) (0.0292)
?̂?? 0.034 0.033 0.033 0.030 -0.69*** -0.69*** -0.69*** -0.70***
(0.212) (0.228) (0.224) (0.218) (0.171) (0.152) (0.134) (0.152)
?̂?? * 2007 -0.40*** -0.40*** -040*** -0.40*** -0.0043 -0.0046 -0.0040 -0.0039
(0.127) (0.112) (0.119) (0.125) (0.0793) (0.0713) (0.0734) (0.0808)
?̂?? * 2008 -0.0321 -0.0319 -0.0321 -0.0319 0.113 0.113 0.112 0.113
(0.127) (0.131) (0.138) (0.115) (0.0806) (0.0800) (0.0782) (0.0770)
?̂?? * 2009 0.00586 0.00599 0.00564 0.00568 0.0954 0.0951 0.0941 0.0941
(0.130) (0.139) (0.122) (0.121) (0.0814) (0.0847) (0.0734) (0.0814)
?̂?? * 2010 0.0406 0.0406 0.0401 0.0397 -0.0270 -0.0271 -0.0300 -0.0301
(0.128) (0.144) (0.134) (0.136) (0.0859) (0.103) (0.0811) (0.0843)
To be continued on the next page

142
Table 5.7 - continued from the previous page
(1) (2) (3) (4) (5) (6) (7) (8) ?̂?? * 2011 -0.254* -0.253** -0.254** -0.253** -0.0051 -0.0064 -0.0044 -0.0040
(0.133) (0.110) (0.112) (0.118) (0.0872) (0.0817) (0.0715) (0.0736) Constant -2.43*** -2.44*** -2.43*** -2.44*** -4.43*** -4.42*** -4.42*** -4.42*** (0.175) (0.186) (0.166) (0.174) (0.137) (0.122) (0.139) (0.142)
Ind dummies Yes Yes Yes Yes Yes Yes Yes Yes
Wald Test: Ind dummy 608.2*** 958.7*** 631.6*** 660.68*** 1400.6*** 1333.5*** 1233.4*** 1651.8***
?̂?? * T 21.16*** 29.35*** 41.25*** 26.53*** 39.93*** 48.11*** 40.45*** 34.18***
Observations 32,481 32,481 32,481 32,481 32,481 32,481 32,481 32,481
Adjusted R2 0.023 0.023 0.023 0.023 0.084 0.084 0.084 0.084
Notes: Bootstrapped standard errors are in brackets. *** Significant at 1%, ** significant at 5%, * significant at 10%.
5.7 Concluding remarks
The purpose of this study has been to analyse the extent to which internal
knowledge flows affect firm performance. Since most of the innovation
literature to date has focused its attention on external knowledge transfers,
internal flows have gone largely ignored. However, the transmission of
information and experience within a company can help firms to perform
better technologically and to be more efficient, making a positive
contribution to their innovativeness and performance. For this reason, the
goal of this chapter has been to assess the impact of internal knowledge
flows – distinguishing between voluntary and involuntary flows – on
innovative sales. Drawing on a sample of Spanish innovators for the period
2004-2011, the following research questions have been posed: (i) Are
internal knowledge flows (voluntary and involuntary) important for the
performance of innovative firms? (ii) Does this impact differ depending on
a firm’s absorptive capacity?
In seeking a response to these questions, a Heckman-type selection model
has been applied so as to correct for selectivity bias. In the case of the first
research question, the results show that internal knowledge transfers

143
increase innovation performance, an impact that is greater for voluntary
than it is for involuntary knowledge flows. Interestingly, the results also
indicate that even though external knowledge transfers have a positive
impact on innovation performance, this is not as great as the effect of
internal flows. Thus, external cooperation or information originating from
outside the firm does not affect innovative sales as much as that knowledge
which stems from inside the company. Additionally, this study indicates
that knowledge transfers are more relevant for innovative sales attributable
to products new to the market than products new only to the firm.
In relation to the second research question, the findings of this study show,
in general, an ambiguous effect of absorptive capacity on the relationship
between internal knowledge flows and innovative sales. According to the
literature, absorptive capacity can be expected to enhance a firm’s ability to
recognize and absorb external knowledge. However, the results of this
study suggest that this is not the case for internal knowledge transfers.
More specifically, the absorptive capacity only affects the impact that
involuntary knowledge transfers have on innovative performance. Thus,
firm own-generation of knowledge not only increases innovation
performance but also makes the firm more efficient at exploiting
involuntary (though not voluntary) knowledge flows. Interestingly, when
absorptive capacity is categorised (low, medium and high), its role becomes
readily apparent. Thus, firms with a medium or high absorptive capacity
enjoy a better performance from internal knowledge flows (both voluntary
and involuntary). By contrast, when an alternative definition of involuntary
knowledge transfer is used, the positive effect of absorptive capacity
disappears. On the other hand, when the number of personnel in R&D is
used as definition of absorptive capacity, a positive effect is observed. The

144
more personnel that the firm employs in R&D, the more efficiently it
manages both voluntary and involuntary internal flows.
To conclude, the results of this research highlight the importance of internal
knowledge flows and their positive effect on innovation performance.
However, no clear conclusions can be drawn about the role played by
absorptive capacity, its role varying with the definition adopted.

145
Chapter 6: General conclusions

146

147
6.1 Summary and policy implications
This dissertation has investigated the relationship between innovation and
productivity, taking into account the impact of spillovers. In particular, the
third and fourth chapters have analysed the importance of external
knowledge flows on firm’s innovative behaviour and productivity, while
the fifth chapter focused its attention on internal knowledge transfers and
their impact on firm’s innovative performance. On balance, the purpose of
this thesis is to provide a better understanding of the impact of involuntary
knowledge flows on innovation and productivity.
This last section brings together the main findings of each chapter. It also
includes some policy implications, as well as limitations and futures lines of
research.
Chapter 3 analyses the impact that R&D expenditures and intra- and inter-
industry externalities have on Spanish firms’ performance. Despite the
extensive literature studying the link innovation - productivity, there are
only few articles examining the importance of sectoral externalities,
especially focused on Spain. In particular, the goal of this chapter is twofold.
First, it seeks to analyse the extent to which the level of technology of the
sector in which the firm operates affects the returns that firms obtain from
their investment in innovation. Second, it assesses if firms benefit from
external knowledge flows coming from other firms’ R&D investment (both
in the same sector and in other sectors). The results, obtained from a
traditional Cobb Douglass production function, suggest that, unlike
previous studies, there is no direct impact of R&D investment on firm
performance. However, once the innovation is measured from the output
side, a positive effect is found. This finding is in line with Crépon, Duguet
and Mairesse (1998) approach which hold that there is a sequential process
148
which drives from R&D to innovation outputs and from these outputs to
productivity. In addition, firm’s technology level affects this relationship
being the impact of innovation greater for those firms in high-tech sectors
(manufacturing and service sectors). As for spillovers, the results point out
that Spanish firms are able to benefit from external innovation. In most
technology levels, firms increase their sales if the rest of the firms in their
sector increase their R&D expenditure, especially low-tech sectors, while in
knowledge-intensive services a competitive effect would dominate. Inter-
industry externalities, however, present a more ambiguous effect and there
appears to be no specific behaviour pattern as for technology level.
Chapter 4 aims at improving and extending the previous chapter by
analysing the impact of innovation activities and externalities on firms’
productivity using a structural model. The main goal is to determine the
extent to which external knowledge may affect both firm behaviour and
firm performance. In fact, the results show that the greater the number of
firms undertaking R&D activities in the same sector the more likely to
engage in R&D projects the firm is. Therefore, an external pool of
knowledge would encourage firms to carry out R&D activities suggesting
the existence of “an incentive effect”. In addition, R&D expenditures
incurred by others firms (provided that an innovation is achieved with their
investment) have a positive impact on a firm’s productivity. However, this
is only true for manufacturing firms. Finally, regarding the technology level,
no clear pattern has been found.
All in all, it seems that external knowledge flows play a role along the
process of engaging innovation activities and their translation into
economic performance. Internal knowledge flows, on the other hand, have
faded into the background as most the innovation literature focused its

149
attention on external knowledge transfers. Nevertheless, transmission of
information and experience within the company can improve its
technological performance impacting positively on their innovativeness and
leading to higher innovative sales. For that reason, Chapter 5 examines the
importance of such kind of flows, which are born, grown and shared within
a company.
The objective of the final empirical analysis undertaken in this dissertation
is, therefore, to study the impact of internal knowledge flows on firm’s
innovative performance. A distinction between voluntary and involuntary
knowledge transfers is made. In addition, the role of absorptive capacity is
analysed to assess if it enhances the efficiency of internal knowledge flows
to some extent. The main findings point out that internal knowledge flows
have a clearly positive impact on innovation performance. In particular,
firms increase more innovative sales with voluntary knowledge transfers
than with involuntary. More interestingly, the effect of internal knowledge
flows is greater than the impact of external knowledge transfers. In other
words, information exchange within the company (or group) is more
relevant for innovation performance than information received from outside
the firm, thereby highlighting the importance of internal knowledge flows.
Last of all, the effect of absorptive capacity depends on how it is proxied.
Positive results can be found when personnel in R&D are used or when it is
defined as internal R&D expenditures and introduced in the model as a
discrete variable.
In view of the findings of this study, it would be interesting to design
certain policies to foster innovation in order to increase firms’ performance
and competitiveness, which is essential in today’s globalized world.

150
First of all, the results in Chapter 4 show that the more a firm invests in
R&D and the fact that it is done on a continuous basis, the more likely it is
to achieve an innovation. Therefore, it would be interesting to design some
policies to promote R&D investment given that, in general, Spanish firms
face a number of difficulties to engage in such kind of activity. In particular,
Spanish business owners take various factors into account, including the
high risks associated with such uncertain ventures and the difficulty in
retaining exclusive control over all of the benefits that such investment
might generate. To break this first barrier and encourage firms to start R&D
projects, the government could offer tax breaks and savings in social
security payments when hiring qualified personnel, supporting high-risk
undertakings and reducing bureaucratic procedures, etc. Likewise, it should
be noted that the Spanish business sector is made up of mainly small and
medium-sized firms, which might find raising the funds needed to carry out
such projects beyond their capabilities. In fact, results obtained in Chapter 4
point out that public funding is a clear determinant not only in the
innovative effort but also in the firm’s decision whether to engage in R&D
activities or not. Nevertheless, the access to loans has decreased since 2007,
reaching one of the lowest values in Europe in 2011. Therefore, even
though the current economic situation, the government should find a way to
increase its financial support for innovation projects. As reported by the
findings in this thesis, cutting back public subsidies will determine Spanish
firms’ behaviour. Moreover, innovate is a learning process being the
probability of achieving an innovation greater when it is done regularly, as
evidenced by the results. For this reason, financial support would be more
profitable if it was addressed to promote R&D activities in a continuous
way instead of isolated projects.

151
Although innovation policies need to be aimed at providing incentives to
help with investments, they should not be applied on a one-size-fits-all
basis, but rather, they need to be designed according to different profile
types. For instance, it has been seen that firm size favour both firm decision
whether to engage in R&D activities or not and the probability of achieving
a process innovation. However, Spanish economy consists of small and
medium-sized firms. Consequently, policies might take this factor into
consideration, prioritising somehow their necessities, seeking cooperation
between firms in order to palliate their small size and promoting
enlargement or fusion of firms. As recommended by the European
Commission (2013) “Spain should review spending priorities and reallocate
funds to support SMEs”.
Finally, the positive effect of spillovers should be taken under consideration
when policies are designed. Even though the business owner might perceive
this phenomenon as a negative consequence since part of their investment
spills over to other companies, it is a positive side-effect for the economy as
a whole. As it has been seen in this dissertation, an incentive effect can
appear since the more firms undertaking R&D projects, the better, given
that this increases the probability of starting R&D activities. On the other
hand, the higher the R&D expenditures in a sector or in other sectors, the
more a firm is going to increase its performance. Thereby, government
support to help one particular firm would overtake the boundaries of this
company, having a positive effect on other firms’ behaviour as well as
performance.
Having said that, and more as a reflection than an implication from the
findings of this thesis, the government efforts might not have the desired
results if the motive driving firms R&D investment is other than increasing

152
their ability and knowledge. For instance, if firms engage in R&D in order
to obtain tax shelters, it is likely that their investment does not lead to a
higher production. Strategies to control and avoid that kind of situation
should be applied to ensure a good use of the available funds.
Needless to say, investment in innovation activities is a considerable
challenge in the current economic situation. According to the Europe 2020
strategy and the national target adopted by the Spanish government, Spain
should invest 2% of its GDP in R&D activities by 2020. Last information
available shows that Spain is far from reaching this goal as R&D intensity
was 1.3% in 2012, far from the European standards. Therefore, despite the
economic situation Spain should make an effort to promote innovation. As
reported by the European Commission, “the main challenges for Spain
remain, therefore, to invest in knowledge and to better ensure the
effectiveness of this investment in creating a more knowledge-intensive
economy.” It should not be forgotten though that R&D does not increase
firm performance per se. As discussed earlier, innovation policies should
not be applied to one-size-fits-all basis as R&D do not always raise
productivity. This will depend on the type of firm including R&D intensity,
technology level, innovative behaviour, etc. (see Del Monte and Papagni,
2003 and Demirel and Mazzucato, 2012).
Lastly, the results from Chapter 5 highlight the importance of internal
knowledge flows and their positive effect on innovation performance.
Therefore, authorities could encourage companies to make an effort to
optimize knowledge already existing inside their boundaries. Fostering the
flow of ideas, rewarding employees, promoting teamwork and job rotation,
and especially stimulating internal collaborations could be, among others,
good practices to make the most of knowledge already existing in the firm.

153
Policies should aim at improving firms’ innovation management capacity.
By doing so, organizations could manage information and knowledge more
efficiently, thereby increasing the probability of translating new ideas into
real innovations which would boost their economic performance.
6.2 Limitations and future research
A number of caveats need to be considered regarding the present study. The
first limitation lies in the definition of spillovers. Although it is believed
that any interaction between firms might generate information flows, the
approximation of spillovers using commercial relationships can be
considered a shortcoming. Other definitions using firms’ characteristics or
geographical proximity may broaden the knowledge of external flows, as
well as allow for comparison between different channels through which
knowledge can spill over. Unfortunately, PITEC does not provide
information to undertake such kind of analysis. However, an alternative
measure could be pursued through the use of patents (information available
with PITEC). While it is true that several articles have employed this
variable, other papers have recognised that it is a restrictive measure, since
only a small number of firms patent (Peters, 2009 and Bloch, 2013). As
Griliches (1998, page 296) points out “not all inventions are patentable, not
all inventions are patented”. Chapter 4 goes a step further and includes an
innovation indicator in the spillover definition. By doing so, it follows the
same approach than the CDM model and also improves slightly the
definition of spillover since not only commercial interactions are considered
but only R&D coming from suppliers who are innovators is taken under
consideration. All in all, there is room for improvement in defining
spillovers, using PITEC or other databases.

154
The current dissertation is also limited by the fact that R&D expenditures
are used as a proxy for innovative effort in Chapters 3 and 4. This decision
was undertaken following the literature, however it is acknowledged that
investing in R&D is not the only way to increase innovation input. In
particular, as it was seen in Chapter 2, Spanish firms spend a significant
amount of money on acquisition of advanced machinery, equipment and
software designated to innovation. Therefore, using R&D measure might
underestimate the results for innovation activities. In Chapter 5, this
limitation is overcome and the entire innovation investments are
incorporated.
An issue that is not addressed in this thesis is persistence. However, it is
possible that the probability to invest in R&D in one period increases if the
firm has already invested in the previous period, or the probability of
obtaining an innovation is higher if the company has achieved one during
the previous years. In fact, several studies have revealed the importance of
this factor from an input and output perspective. For instance, Peters (2009)
provides evidence of true state of dependence on innovation investment
decision for German firms. On the other hand, Raymond et al. (2010)
analyse the persistence in innovation output of Dutch manufacturing firms.
The authors find that there is persistence on both the probability of
innovation, as well as the intensity of the innovation output but only in
high-tech firms. Another recent study is the one carried out by Huergo and
Moreno in 2011, which accounts for persistence on both the input and
output side. Thereby, using a sample of Spanish manufacturing firms, the
authors show the existence of true state of dependence in the decision of
R&D investment and in the probability of obtaining an innovation.
Therefore, it would be very interesting to investigate the persistence of

155
innovation and allow for a dynamic framework, at the same time where
spillovers are considered.
Another weakness of this dissertation is the poor quality of the service
sector estimates. As mentioned at the beginning of this thesis, this is only a
first attempt to study the service sector and, according to Chapter 4, the
results presented here need to be interpreted with caution. Manufacturing
and service firms should not be treated equally. Consequently, more
research regarding this issue would be of a great help in order to have a
better understanding of the situation in the service sector.
In addition, more work needs to be done in evaluating the impact of
absorptive capacity when internal knowledge flows are analysed. After
observing the importance of internal knowledge flows on firm’s innovative
performance in Chapter 5, it would be interesting to assess more accurately
the effect of absorptive capacity. It is probable that, not only R&D or
personnel in R&D, but also other factors play a role in managing internal
information transfers.
Finally, a future study analysing the effect of firm size could be very
interesting. External and internal knowledge flows are likely to be different
according to the number of employees. On the one hand, it is possible that
large firms benefit to a greater extent from information flows since they
have better equipment, specialised workers, technological expertise, etc. On
the other hand, given the better financial situation of large firms, they may
not pay that much attention to external information and they rely on their
own capacity to generate knowledge. By contrast, it seems plausible that
knowledge shared within firms is more likely to happen when the
workforce is low, whereas large firms might suffer from “departmentalism”,
power struggles and turf wars. Consequently, instead of being a mere

156
control variable firm size may play an important role on the transmission of
knowledge.

157
Appendices

158

159
Table A. 1 Outliers by technological level LTI HTI NKIS KIS Total
Chapter 3 Physical capital 51 18 39 158 266 R&D expenditure 17 18 9 322 366 Observations 17,470 12,764 6,483 13,632 50,349 Chapter 4 Physical capital 56 19 46 184 305 R&D expenditure 22 22 10 365 419 Observations 19,838 14,547 7,400 15,594 57,379 Chapter 5 Physical capital 64 21 50 201 336 R&D expenditure 24 24 10 404 462 Observations 21,977 16,172 8,222 17,273 63,644
Source: PITEC; own calculations.

160
Table A. 2 Descriptive statistics Chapter 3 before filters
Total LTMI HTMI NKIS KIS
Mean Sd. Mean Sd. Mean Sd. Mean Sd. Mean Sd.
Sales overall 16.21 1.83 16.24 1.65 16.22 1.64 17.11 1.83 15.77 2.01
betw 1.83 1.64 1.65 1.84 2.00
within 0.36 0.33 0.32 0.30 0.43
Physical overall 13.36 4.90 13.77 5.01 13.54 4.30 13.59 5.45 12.63 4.92
capital betw 4.76 4.92 4.13 5.16 4.79
within 2.09 2.05 1.90 2.48 2.11
Labour overall 4.46 1.45 4.26 1.21 4.18 1.24 5.11 1.61 4.63 1.66
betw 1.46 1.21 1.25 1.62 1.68
within 0.21 0.19 0.18 0.20 0.26
Human overall 22.83 25.92 12.11 13.66 21.03 18.87 13.95 20.16 41.07 33.60
capital betw 24.11 11.76 17.10 18.04 30.50
within 10.59 7.20 8.86 9.87 14.79
Innovation overall 9.74 6.09 10.25 5.50 12.63 4.21 4.89 6.13 8.89 6.52
betw 5.94 5.37 4.16 5.91 6.30
within 1.48 1.49 1.27 1.61 1.55
Intra- overall 748.58 756.17 403.76 287.57 1346.72 745.63 432.16 478.45 785.76 908.28
industry betw 734.31 278.60 724.05 407.06 875.16
externality within 194.03 68.52 158.07 255.05 273.76
Inter- overall 484.17 181.10 523.30 163.75 553.68 143.58 422.50 245.00 406.26 155.08
industry betw 151.44 127.77 97.10 229.40 121.82
externality within 103.37 106.06 111.82 74.95 103.85
Obs 55,303 18,652 13,617 7,267 15,767 (%)
(37.1)
(27.1)
(14.5)
(31.3)
Firms 10,834 3,573 2,603 1,399 3,259
(%) (33.0) (24.0) (12.9) (30.1)
Notes: LTMI (low and medium-low tech manufacturing industries), HTMI (medium-high and high tech manufacturing industries), NKIS (non-knowledge-intensive services), KIS (knowledge-intensive services). Between variation means variation across individuals and within variation means variation over time around individual mean. Source: PITEC; own calculations.

161
Table A. 3 Descriptive statistics Chapter 4 before filters
TOTAL LTI HTI NKIS KIS
mean st dv mean st dv mean st dv mean st dv mean st dv
Firm’s characteristics
Labour over 11.756 1.048 11.978 0.851 12.038 0.756 11.999 1.112 11.140 1.181
productivity a, d betw
1.015
0.812
0.731
1.080
1.118
(cont.) with
0.344
0.312
0.291
0.305
0.430
Firm size a over 4.456 1.452 4.253 1.213 4.179 1.243 5.107 1.614 4.634 1.663
(cont.) betw
1.463
1.212
1.245
1.626
1.680
with
0.230
0.212
0.200
0.220
0.275
Physical over 9.418 3.450 10.000 3.547 9.732 2.991 9.129 3.626 8.596 3.446
capital a, d betw
3.406
3.542
2.907
3.496
3.412
(cont.) with
1.434
1.450
1.352
1.593
1.406
Advanced over 3.456 4.063 3.911 4.290 3.935 4.055 2.251 3.518 3.063 3.871
machinery a, d betw
3.550
3.782
3.487
3.091
3.359
(cont.) with
1.993
2.069
2.145
1.630
1.916
Human over 22.948 25.873 12.380 13.741 21.381 19.105 14.166 20.272 40.967 33.587
Capital a betw
24.329
12.196
17.592
18.569
31.022
(cont.) with
9.733
6.646
8.234
8.902
13.610
Group a over 0.412 0.492 0.366 0.482 0.427 0.495 0.506 0.500 0.409 0.492
(0/1) betw
0.461
0.451
0.466
0.468
0.458
with
0.172
0.162
0.169
0.181
0.181
International over 0.465 0.499 0.575 0.494 0.714 0.452 0.284 0.451 0.205 0.404
Competition a betw
0.436
0.423
0.386
0.380
0.341
(0/1) with
0.245
0.264
0.252
0.250
0.212
Knowledge / Innovation
R&D over 0.564 0.496 0.570 0.495 0.777 0.416 0.254 0.435 0.516 0.500
engagement a betw
0.418
0.395
0.336
0.370
0.432
(0/1) with
0.272
0.304
0.255
0.240
0.259
R&D over 9.436 1.579 9.011 1.341 9.837 1.224 8.316 1.866 9.723 1.910
intensity b betw
1.717
1.415
1.284
1.973
2.055
(cont.) with
0.449
0.452
0.348
0.661
0.500
Continuous over 0.785 0.411 0.732 0.443 0.825 0.380 0.699 0.459 0.816 0.387
R&D b betw
0.381
0.399
0.344
0.435
0.363
(0/1) with
0.259
0.282
0.246
0.262
0.246
Personnel in over 1.103 1.274 0.942 1.078 1.598 1.273 0.412 0.913 1.186 1.437
R&D a betw
1.136
0.913
1.155
0.788
1.277
(cont.) with
0.543
0.555
0.525
0.435
0.585
To be continued on the next page

162
Table A.3 – Continued from the previous page
TOTAL LTI HTI NKIS KIS
mean st dv mean st dv mean st dv mean st dv mean st dv
Process over 0.555 0.497 0.624 0.484 0.630 0.483 0.369 0.483 0.496 0.500
innovator a betw
0.407
0.393
0.392
0.395
0.408
(0/1) with
0.295
0.295
0.294
0.285
0.301
Product over 0.532 0.499 0.538 0.499 0.725 0.447 0.262 0.440 0.482 0.500
Innovator a betw
0.424
0.413
0.375
0.376
0.424
(0/1) with
0.270
0.285
0.258
0.237
0.274
Protection a over 0.267 0.442 0.271 0.445 0.337 0.473 0.181 0.385 0.242 0.428
(0/1) betw
0.345
0.343
0.373
0.292
0.335
with
0.283
0.286
0.296
0.256
0.279
Cooperation c over 0.373 0.483 0.325 0.469 0.376 0.484 0.312 0.464 0.452 0.498
(0/1) betw
0.392
0.371
0.388
0.379
0.415
with
0.292
0.293
0.296
0.281
0.292
External knowledge
% firms with over 56.40 22.54 57.04 10.68 77.72 7.84 25.39 14.84 51.63 25.10
R&D activities a betw
21.93
8.00
5.83
14.34
24.68
[0-100] with
5.85
7.46
5.38
4.22
4.58
Intra-industry over 414.42 438.49 239.58 182.24 752.15 468.07 227.01 306.25 415.60 502.95 spillover (process)a, d betw
412.99
176.39
434.83
218.16
477.44
(cont.) with
145.41
43.89
162.59
216.96
165.43
Intra-industry over 467.35 504.02 229.59 174.20 865.07 530.13 350.60 435.87 457.79 562.10 spillover (product)a, d betw
481.29
168.34
500.22
372.56
541.56
(cont.) with
143.62
43.15
158.62
231.29
153.86
Inter-industry over 360.95 142.14 387.01 128.74 405.75 108.32 329.25 212.33 306.89 119.88 spillover (process) a, d betw
115.41
93.58
70.00
200.79
88.41
(cont.) with
85.64
91.46
87.16
64.47
85.83
Inter-industry over 371.77 154.07 403.53 139.66 417.57 120.71 325.90 232.01 316.67 125.44 spillover (product) a, d betw
128.11
107.27
84.024
219.40
94.67
(cont.) with
87.37
91.89
90.615
67.846
87.07
Public Funding
Local over 0.212 0.409 0.213 0.409 0.260 0.439 0.080 0.271 0.230 0.421
(0/1) betw
0.320
0.296
0.331
0.202
0.360
with
0.261
0.287
0.292
0.189
0.228
National over 0.197 0.398 0.170 0.375 0.258 0.438 0.066 0.248 0.238 0.426
(0/1) betw
0.312
0.276
0.331
0.186
0.355
with
0.252
0.257
0.290
0.170
0.241
To be continued on the next page

163
Table A.3 – Continued from the previous page
TOTAL LTI HTI NKIS KIS
mean st dv mean st dv mean st dv mean st dv mean st dv
European over 0.050 0.218 0.030 0.170 0.043 0.202 0.020 0.140 0.095 0.293
(0/1) betw
0.172
0.114
0.147
0.105
0.244
with
0.138
0.130
0.144
0.096
0.156
Sources of information
Internal over 0.596 0.491 0.547 0.498 0.644 0.479 0.530 0.499 0.630 0.483
(0/1) betw
0.384
0.389
0.369
0.394
0.378
with
0.328
0.330
0.323
0.330
0.330
Market over 0.481 0.500 0.454 0.498 0.512 0.500 0.483 0.500 0.480 0.500
(0/1) betw
0.386
0.380
0.388
0.388
0.389
with
0.334
0.336
0.329
0.336
0.338
Institutional over 0.147 0.355 0.137 0.344 0.142 0.349 0.094 0.292 0.185 0.388
(0/1) betw
0.277
0.267
0.268
0.224
0.309
with
0.222
0.218
0.222
0.187
0.238
Others over 0.173 0.379 0.152 0.360 0.177 0.382 0.139 0.346 0.208 0.406
(0/1) betw
0.294
0.270
0.291
0.282
0.325
with
0.243
0.242
0.244
0.213
0.251
Firms
10870
3581
2610
1404
3275
(%)
(32.9)
(24.0)
(12.9)
(30.1)
Observations
63615
21,385
15643
8389
18198
(%)
(33.6)
(24.6)
(13.2)
(28.6)
Notes: LTMI (low and medium-low tech manufacturing industries), HTMI (medium-high and high tech manufacturing industries), NKIS (non-knowledge-intensive services), KIS (knowledge-intensive services). a Variables computed for total sample. b Variables computed for R&D performers sub-sample. c Variables computed for innovative sub-sample. d Mean in thousands of euros.

164
Table A. 4 Descriptive statistics Chapter 5 Standard deviations Share of innovative sales per
group
Type Mean over betw with 0 1 Test 11 Test 22
(1) (2) (3) (4) (5) (6) (7) (8)
Dependent variable
Share innovative sales [0-1] 0.30 0.37 0.29 0.25
New to the firm only [0-1] 0.18 0.29 0.23 0.21 New to the market [0-1] 0.12 0.25 0.19 0.17
Independent variables Innovation intensity cont. 0.23 0.39 0.37 0.14 Internal information
(involuntary) (0/1) 0.51 0.50 0.38 0.34 0.28 0.31 -9.89*** -15.8***
Internal cooperation (voluntary) (0/1) 0.26 0.44 0.34 0.27 0.26 0.32 -10.5*** -19.8***
Absorptive Capacity cont. 0.18 0.36 0.35 0.13 Control variables
Size cont. 4.40 1.38 1.40 0.21 International market (0/1) 0.55 0.50 0.44 0.25 0.29 0.31 -7.58*** -20.8***
No group (0/1) 0.57 0.49 0.47 0.17 0.28 0.31 -10.3*** -8.63***
Non-innovation performer (0/1) 0.17 0.38 0.28 0.28 0.31 0.22 20.94*** 39.59***
External information (0/1) 0.31 0.46 0.34 0.33 0.30 0.30 -0.11 -0.52
External cooperation (0/1) 0.35 0.48 0.38 0.30 0.29 0.33 -11.3*** -22.9***
Number of observations 49,436
Note: We test whether there are significant differences in the share of innovative sales within two groups. Column 5 indicates the mean of innovative sales for the first group (i.e. Xi=0) and column 6 for the second group (i.e. Xi=1). In order to do so, two tests are used: parametric test (column 7) and non-parametric test (column 8). (1) Test 1 is a parametric test to check whether the share of innovative sales has the same mean within two groups. (2) Test 2 is the non-parametric Wilcoxon rank-sum test, also known as Mann–Whitney two-sample statistic, which tests the hypothesis that two independent samples are from populations with the same distribution.

165
Table A. 5 Estimates of the Equation [5.1]. Probit models. 2006- 2011 Dependent
variable Probability of achieving an innovation
(product and/or process) in [t-2, t] T=2006 T=2007 T=2008 T=2009 T=2010 T=2011
Innovation intt-2 0.152 0.228*** 0.237** 0.263** 0.401*** 0.0664 (0.107) (0.0803) (0.114) (0.117) (0.110) (0.0710) Sizet-2 -2.137 -0.417 -2.173 -2.057 -2.872* -0.985 (1.697) (1.500) (1.565) (1.614) (1.696) (1.572) Size2
t-2 1.058 0.230 1.075 1.029 1.427* 0.507 (0.836) (0.739) (0.772) (0.797) (0.837) (0.776) No groupt-2 -0.0272 0.00235 -0.0451 -0.0213 0.0295 -0.0549 (0.0448) (0.0403) (0.0427) (0.0438) (0.0446) (0.0421) International 0.294*** 0.246*** 0.172*** 0.144*** 0.174*** 0.172*** market (t-2, t) (0.0440) (0.0388) (0.0412) (0.0436) (0.0459) (0.0428) Human 0.132*** 0.101*** 0.0982*** 0.0628*** 0.0337** 0.0499*** capitalt-2 (0.0145) (0.0135) (0.0138) (0.0140) (0.0133) (0.0130) Non-innov -1.468*** -1.512*** -1.651*** -1.641*** -1.633*** -1.757*** performer t-2 (0.0450) (0.0400) (0.0416) (0.0431) (0.0434) (0.0415) Constant 0.775*** 0.334* 0.962*** 0.960*** 1.187*** 0.709*** (0.202) (0.184) (0.186) (0.188) (0.196) (0.185) Ind. dummies Yes Yes Yes Yes Yes Yes Wald test 148.79*** 171.63*** 171.84*** 180.37*** 235.14*** 90.05*** Observations 7,047 8,403 8,126 7,765 7,415 7,000 McFadden’s pseudo R2
0.4690 0.3368 0.3766 0.3754 0.3770 0.3670
Notes: Robust standard errors are in brackets. *** Significant at 1%, ** significant at 5%, * significant at 10%.

166

167
References
Aiello, F., and Cardamone, P. (2005). R&D spillovers and productivity growth: evidence from Italian manufacturing microdata. Applied Economics Letters, 12(10), 625–631.
Aiello, F., and Cardamone, P. (2008). R&D spillovers and firms’ performance in Italy. Evidence from a flexible production function. Empirical Economics, 34(1), 143–166.
Amara, N., and Landry, R. (2005). Sources of information as determinants of novelty of innovation in manufacturing firms: evidence from the 1999 statistics Canada innovation survey. Technovation, 25(3), 245–259.
Amiti, M., and Konings, J. (2007). Trade liberalization, intermediate inputs, and productivity: Evidence from Indonesia. American Economic Review, 97(5), 1611–1638.
Antonietti, R., and Cainelli, G. (2011). The role of spatial agglomeration in a structural model of innovation, productivity and export: a firm-level analysis. The Annals of Regional Science, 46(3), 577–600.
Añón-Higón, D., and Manjón-Antolín, M. (2012). Multinationality, foreignness and institutional distance in the relation between R&D and productivity. Research Policy, 41(3), 592–601.
Argote, L., and Ingram, P. (2000). Knowledge transfer: A basis for competitive advantage in firms. Organizational Behavior and Human Decision Processes, 82(1), 150–169.
Argote, L., Ingram, P., Levine, J. M., and Moreland, R. L. (2000). Knowledge transfer in organizations: Learning from the experience of others. Organizational Behavior and Human Decision Processes, 82(1), 1–8.
Argote, L., and Ophir, R. (2002). Intraorganizational Learning. Companion to organization, Vol. 15213, 181–207. Blackwell Publishers.
Artés, J. (2009). Long run versus short-run decisions: R&D and market structure in Spanish firms. Research Policy, 38, 120–132.
Arvanitis, S., and Loukis, E. N. (2009). Information and communication technologies, human capital, workplace organization and labour productivity: a comparative study based on firm-level data for Greece and Switzerland. Information Economics and Policy, 21(1), 43–61.
Arvas, M. A., and Uyar, B. (2014). Exports and firm productivity in Turkish manufacturing : An Olley-Pakes estimation. International Journal of Economics and Financial Issues, 4(2), 243–257.
Aschhoff, B., and Schmidt, T. (2008). Empirical evidence on the success of R&D cooperation—Happy together? Review of Industrial Organization, 33(1), 41–62.
Audretsch, D. B., and Feldman, M. P. (1996). R&D Spillovers and the Geography of Innovation and Production. American Economic Association, 86(3), 630–640.
Ballot, G., Fakhfakh, F., and Taymaz, E. (2006). Who Benefits from Training and R&D, the firm or the workers? British Journal of Industrial Relations, 44(3), 473–495.

168
Belderbos, R., Carree, M., and Lokshin, B. (2004). Cooperative R&D and firm performance. Research Policy, 33(10), 1477–1492.
Belderbos, R., and Mohnen, P. (2013). Intersectoral and international R&D spillovers. UNU-MERIT, SIMPATIC Working Paper, No 2, 1–37.
Benavente, J. M. (2006). The role of research and innovation in promoting productivity in Chile. Economics of Innovation and New Technology, 15(4-5), 301–315.
Beneito, P. (2001). R&D productivity and spillovers at the firm level: evidence from Spanish panel data. Investigaciones Económicas, XXV(2), 289–313.
Bitzer, J., and Geishecker, I. (2006). What drives trade-related R&D spillovers? Decomposing knowledge-diffusing trade flows. Economics Letters, 93(1), 52–57.
Black, S. E., and Lynch, L. M. (1996). Human-capital investments and productivity. American Economic Review, 86(2), 263–267.
Bloch, C. (2013). R&D spillovers and productivity: an analysis of geographical and technological dimensions. Economics of Innovation and New Technology, 22(5), 447–460.
Bönte, W. (2003). R&D and productivity: Internal vs. external R&D - evidence from west german manufacturing industries. Economics of Innovation and New Technology, 12(4), 343–360.
Bloom, N., Schankerman, M., and Van Reenen, J. (2013). Identifying technology spillovers and product market rivalry. Econometrica, 81(4), 1347–1393.
Cardamone, P. (2012). A micro-econometric analysis of the role of R&D spillovers using a nonlinear translog specification. Journal of Productivity Analysis, 37(1), 41–58.
Cassiman, B., Golovko, E., and Martínez-Ros, E. (2010). Innovation, exports and productivity. International Journal of Industrial Organization, 28(4), 372–376.
Chudnovsky, D., López, A., and Pupato, G. (2006). Innovation and productivity in developing countries: A study of Argentine manufacturing firms’ behavior (1992–2001). Research Policy, 35(2), 266–288.
Cincera, M. (2005). Firms’ productivity growth and R&D spillovers: An analysis of alternative technological proximity measures. Economics of Innovation and New Technology, 14(8), 657–682.
Cohen, W. M., and Levinthal, D. A. (1989). Innovation and learning: the two faces of R&D. Economic Journal, 99(397), 569–596.
Crepon, B., Duguet, E., and Mairesse, J. (1998). Research, Innovation and Productivity: An Econometric Analysis at the firm level. Economics of Innovation and New Technology, 7(2), 115–158.
De Bondt, R. (1996). Spillovers and innovative activities. International Journal of Industrial Organization, 15, 1–28.
D’Este, P., Iammarino, S., Savona, M., and Tunzelmann, N. Von. (2008). What hampers innovation ? Evidence from the UK CIS4. University of Sussex, SPRU Working Paper Series, No 168, Vol. 44, 1–33.
Del Monte, A. and Papagni, E. (2003) R&D and the growth of firms: empirical analysis of a panel of Italian firms. Research Policy, 32, 1003-1014.

169
De Loecker, J. (2007). Do exports generate higher productivity? Evidence from Slovenia. Journal of International Economics, 73(1), 69–98.
Demirel, P. and Mazzucato, M. (2012) Innovation and Firm Growth: Is R&D Worth It?. Industry and Innovation, 19(1), 45-62.
Döring, T., and Schnellenbach, J. (2006). What do we know about geographical knowledge spillovers and regional growth?: A survey of the literature. Regional Studies, 40(3), 375–395.
Du, J., Love, J. H., and Roper, S. (2007). The innovation decision: An economic analysis. Technovation, 27(12), 766–773.
Escribano, A., Fosfuri, A., and Tribó, J. A. (2009). Managing external knowledge flows: The moderating role of absorptive capacity. Research Policy, 38(1), 96–105.
European Commision (2013). Research and Innovation performance in Spain. Country profile. Publications Office of the European Union 2013, 1-24, Luxembourg.
Frenz, M., and Ietto-Gillies, G. (2009). The impact on innovation performance of different sources of knowledge: Evidence from the UK Community Innovation Survey. Research Policy, 38(7), 1125–1135.
Ganotakis, P., and Love, J. H. (2010). R&D, product innovation, and exporting: evidence from UK new technology based firms. Oxford Economic Papers, 63(2), 279–306.
García-Vega, M. and Huergo, E. (2011). Determinants of international R&D outsourcing: the role of trade. Review of Development Economics, 15, 93-107.
Griffith, R., Huergo, E., Mairesse, J., and Peters, B. (2006). Innovation and productivity across four european countries. Oxford Review of Economic Policy, 22(4), 483–498.
Griliches, Z. (1979). Issues in assessing the contribution of research and development to productivity growth. Bell Journal of Economics, 10(1), 92–116.
Griliches, Z. (1986). Productivity , R&D, and basic research at the firm level in the 1970’s. American Economic Association, 76(1), 141–154.
Griliches, Z. (1992). The search for R&D spillovers. Scandinavian Journal of Economics, 94, 29–47.
Griliches, Z. (1998). Patent Statistics as economic indicators: A survey. R&D and productivity: the econometric evidence. University of Chicago Press, Vol. I, 287–343.
Goya, E., Vayá, E. and Suriñach, J. (2012). Productivity and innovation spillovers: Micro evidence from Spain (2004-2009). Submitted to Jounal of Productivity Analysis (2nd round evaluation).
Goya, E., Vayá, E. and Suriñach, J. (2013). Do spillovers matter? CDM model estimates for Spain using panel data. SEARCH working paper collection, No 4/28.
Goya, E. (2014). How important are internal knowledge flows for innovative firm’s performance?. University of Reading, CIP Discussion Paper No 112. Submitted to Journal of Technology Transfer.
Hall, B. H., Lotti, F., and Mairesse, J. (2009). Innovation and productivity in SMEs: empirical evidence for Italy. Small Business Economics, 33(1), 13–33.

170
Hall, B. H., and Mairesse, J. (1995). Exploring the relationship between R&D and productivity in French manufacturing firms. Journal of Econometrics, 65(1), 263–293.
Hall, B. H., and Mairesse, J. (2006). Empirical studies of innovation in the knowledge-driven economy. Economics of Innovation and New Technology, 15(4-5), 289–299.
Haltiwanger, J. C., Lane, J. I., and Spletzer, J. R. (1999). Productivity differences across employers: the roles of employer size, age, and human capital. American Economic Association, 89(2), 94–98.
Harhoff, D. (1998). R&D and productivity in German manufacturing firms. Economics of Innovation and New Technology, 6(1), 29–50.
Harhoff, D. (2000). R&D spillovers, technological proximity, and productivity growth - Evidence from German panel data. Schmalenbach Business Review, 52(3), 238 – 260.
Harris, M. N., Rogers, M., and Siouclis, A. (2003). Modelling firm innovation using panel probit estimators. Applied Economics Letters, 10(11), 683–686.
Heckman, J. J. (1979). Sample selection bias as a specification error. Econometrica, 47(1), 153–161.
Herrera, L. and Sánchez-González, G. (2013). Firm size and innovation policy. International Small Business Journal, 31,137-155.
Heshmati, A., and Kim, H. (2011). The R&D and productivity relationship of Korean listed firms. Journal of Productivity Analysis, 36(2), 125–142.
Huergo, E. (2006). The role of technological management as a source of innovation: Evidence from Spanish manufacturing firms. Research Policy, 35(9), 1377–1388.
Huergo, E., and Jaumandreu, J. (2004a). How does probability of innovation change with firm age? Small Business Economics, 22(3-4), 193–207.
Huergo, E., and Jaumandreu, J. (2004b). Firms’ age, process innovation and productivity growth. International Journal of Industrial Organization, 22(4), 541–559.
Huergo, E., and Moreno, L. (2004). La innovación y el crecimiento de la productividad en España. Ekonomiaz, 56(2), 208–231.
Huergo, E., and Moreno, L. (2011). Does history matter for the relationship between R&D, innovation, and productivity? Industrial and Corporate Change, 20(5), 1335–1368.
Jaffe, A. B. (1986). Technological opportunity and spillovers of R&D : Evidence from firms’ patents, profits , and market value. American Economic Review, 76(5), 984–1001.
Janz, N., Lööf, H., and Peters, B. (2004). Firm level innovation and productivity - Is there a common story across countries? Problems and perspectives in managment, 2, 184–204.
Jefferson, G. H., Huamao, B., Xiaojing, G., and Yu Xiaoyun. (2006). R&D performance in Chinese industry. Economics of Innovation and New Technology, 15(4-5), 345–366.

171
Kafouros, M. I., and Buckley, P. J. (2008). Under what conditions do firms benefit from the research efforts of other organizations? Research Policy, 37(2), 225–239.
Kaiser, U. (2002). Measuring knowledge spillovers in manufacturing and services: an empirical assessment of alternative approaches. Research Policy, 31(1), 125–144.
Keller, W. (2004). International technology diffusion. Journal of Economic Literature, 42(3), 752–782.
Klette, T. J. (1994). R&D, spillovers and performance among heterogenous firms. An empirical study using microdata. Statistics Norway, Discussion Papers, No 133.
Klomp, L., and Van Leeuwen, G. (2001). Linking innovation and firm performance: A new approach. International Journal of the Economics of Business, 8(3), 343–364.
Lee, C. (2011). Trade, productivity, and innovation: Firm-level evidence from Malaysian manufacturing. Journal of Asian Economics, 22(4), 284–294.
Levinsohn, J. and Petrin, A. (2003). Estimating production functions using inputs to control for unobservables. Review of Economic Studies, 70, 317–342.
Lhuillery, S. (2011). Absorptive capacity, efficiency effect and competitors’ spillovers. Journal of Evolutionary Economics, 21(4), 649–663.
Lööf, H., and Broström, A. (2008). Does knowledge diffusion between university and industry increase innovativeness? The Journal of Technology Transfer, 33(1), 73–90.
Lööf, H., and Heshmati, A. (2002). Knowledge capital and performance heterogeneity: A firm-level innovation study. International Journal of Production Economics, 76(1), 61–85.
Lööf, H., and Heshmati, A. (2006). On the relationship between innovation and performance: A sensitivity analysis. Economics of Innovation and New Technology, 15(4-5), 317–344.
Los, B., and Verspagen, B. (2000). R&D spillovers and productivity: Evidence from U.S. manufacturing microdata. Empirical Economics, 25(1), 127–148.
Lotti, F., and Santarelli, E. (2001). Linking knowledge to productivity: A Germany-Italy comparison using the CIS database. Empirica, 28(3), 293–317.
Lucas R. E. (1988). On the mechanics of economic development. Journal of Monetary Economics, 22 (1), 3-42.
Luong, T. A. (2011). The impact of input and output tariffs on firms’ productivity: Theory and evidence. Review of International Economics, 19(5), 821–835.
Mañez, J. A., Rochina-Barrachina, M. E., Sanchis, A., and Sanchis, J. A. (2013). Do process innovations boost SMEs productivity growth? Empirical Economics, 44(3), 1373–1405.
Marrocu, E., Paci, R., and Pontis, M. (2011). Intangible capital and firms’ productivity. Industrial and Corporate Change, 21(2), 377–402.
Marschak, J. and Andrews, W. H. (1944). Random simultaneous equations and the theory of production. Econometrica, 12, 143–205.

172
Masso, J., and Vahter, P. (2008). Technological innovation and productivity in late-transition Estonia: Econometric evidence from innovation surveys. European Journal of Development Research, 20(2), 240–261.
Maté-García, J. J., and Rodríguez-Fernández, J. M. (2002). Crecimiento de la productividad e inversión en I+D: un análisis empírico de las empresas manufactureras españolas. Economía Industrial, 347, 99–110.
Maté-García, J. J., and Rodríguez-Fernández, J. M. (2008). Productivity and R&D: An econometric evidence from Spanish firm-level data. Applied Economics, 40(14), 1827–1837.
Maurer, I., Bartsch, V., and Ebers, M. (2011). The Value of intra-organizational social capital: How it fosters knowledge transfer, innovation performance, and growth. Organization Studies, 32(2), 157–185.
Medda, G., and Piga, C. A. (2014). Technological spillovers and productivity in Italian manufacturing firms. Journal of Productivity Analysis, 41(3), 419–434.
Mohnen, P. (1996). R&D Externalities and Productivity Growth. STI Review, 18, 39–66.
Mohnen, P., Mairesse, J., and Dagenais, M. (2006). Innovativity: A comparison across seven European countries. Economics of Innovation and New Technology, 15(4-5), 391–413.
Monjon, S., and Waelbroeck, P. (2003). Assessing spillovers from universities to firms: evidence from French firm-level data. International Journal of Industrial Organization, 21, 1255–1270.
Montoro-Sánchez, A., Ortiz-de-Urbina-Criado, M. and Mora-Valentín, E.V. (2011). Effects of knowledge spillovers on innovation and collaboration in science and technology parks. Journal of Knowledge Management, 15, 948-970.
Mundlak, Y. (1978). On the pooling of time series and cross section data. Econometrica, 46(1), 69–85.
Nieto, M. J., and Santamaría, L. (2007). The importance of diverse collaborative networks for the novelty of product innovation. Technovation, 27(6-7), 367–377.
Nieto, M.J. and Rodríguez, A. (2011). Offshoring of R&D: Looking abroad to improve innovation performance. Journal of International Business Studies, 42, 345-361.
Nooteboom, B., Van Haverbeke, W., Duysters, G., Gilsing, V. and Van den Oord, A. (2007). Optimal cognitive distance and absorptive capacity. Research Policy 36 (7), 1016-1034.
OECD (2002). Frascati Manual, Proposed standard practise for surveys on reserach and experimental development. OECD, Paris.
OECD (2005). Oslo Manual, Guidlines for collecting and interpreting innovation. 3rd edition, OECD, Paris.
Olley, G. S., and Pakes, A. (1996). The dynamics of productivity in the telecommunications equipment industry. Econometrica, 64(6), 1263–1297.
Ornaghi, C. (2006). Spillovers in product and process innovation: Evidence from manufacturing firms. International Journal of Industrial Organization, 24(2), 349–380.

173
Ortega-Argilés, R., Piva, M., Potters, L., and Vivarelli, M. (2010). Is corporate R&D investment in high-tech sectors more effective? Contemporary Economic Policy, 28(3), 353–365.
Ortega-Argilés, R., Potters, L., and Vivarelli, M. (2011). R&D and productivity: Testing sectoral peculiarities using micro data. Empirical Economics, 41(3), 817–839.
Parisi, M. L., Schiantarelli, F., and Sembenelli, A. (2006). Productivity, innovation and R&D: Micro evidence for Italy. European Economic Review, 50(8), 2037–2061.
Pavcnik, N. (2002). Trade liberalization, exit , and productivity improvements: Evidence from Chilean plants. Review of Economic Studies, 69, 245–276.
Peters, B. (2008). Innovation and firm performance. An empirical investigation for German firms. ZEW Economic Studies, Vol. 38, 1–235.
Peters, B. (2009). Persistence of innovation: Stylised facts and panel data evidence. The Journal of Technology Transfer, 34(2), 226–243.
Polanyi, M. (1966). The tacit dimension. Doubleday, Garden City, NY.
Raffo, J., Lhuillery, S., and Miotti, L. (2008). Northern and southern innovativity: A comparison across European and Latin American countries. The European Journal of Development Research, 20(2), 219–239.
Raymond, W., Mohnen, P., Palm, F., and Loeff, S. S. Van Der. (2010). Persistence of innovation in Dutch manufacturing: Is it spurious? Review of Economics and Statistics, 92(3), 495–504.
Robin, S., and Schubert, T. (2013). Cooperation with public research institutions and success in innovation: Evidence from France and Germany. Research Policy, 42(1), 149–166.
Rochina-Barrachina, M. E., Mañez, J. A., and Sanchis-Llopis, J. A. (2010). Process innovations and firm productivity growth. Small Business Economics, 34(2), 147–166.
Rodríguez-Fernández, J. M., and Maté-García, J. J. (2006). Productividad del trabajo y continuidad en la inversión tecnológica: Un análisis empírico en las empresas manufactureras españolas. Cuadernos de Economía y Dirección de Empresa, 27, 61–84.
Romer, P. M. (1986). Increasing returns and long-run growth. Journal of Political Economy, 94(5), 1002–1037.
Romer, P. M. (1990). Endogenous technological change. Journal of Political Economy, 98(5), S71–S102.
Rosenthal, R. (1979). The “File Drawer Problem” and Tolerance for Null Results. Psychological Bulletin, 86, 638–41.
Santamaría, L., Nieto, M.J. and Miles, I. (2012). Service innovation in manufacturing firms: Evidence from Spain. Technovation, 32, 144-155.
Savignac, F. (2008). Impact of financial constraints on innovation: What can be learned from a direct measure? Economics of Innovation and New Technology, 17(6), 553–569.

174
Schor, A. (2004). Heterogeneous productivity response to tariff reduction. Evidence from Brazilian manufacturing firms. Journal of Development Economics, 75(2), 373–396.
Segarra, A., and Teruel, M. (2011). Productivity and R&D sources: evidence for Catalan firms. Economics of Innovation and New Technology, iFirst, 1–22.
Segarra-Blasco, A. (2010). Innovation and productivity in manufacturing and service firms in Catalonia: a regional approach. Economics of Innovation and New Technology, 19(3), 233–258.
Trigo, A., and Vence, X. (2012). Scope and patterns of innovation cooperation in Spanish service enterprises. Research Policy, 41(3), 602–613.
Trigo, A. (2013). The Nature of Innovation in R&D- and Non-R&D-Intensive Service Firms: Evidence from Firm-Level Latent Class Analysis. Industry and Innovation, 20, 48-68.
Tsai, K.-H., and Wang, J.-C. (2004). R&D productivity and the spillover effects of high-tech industry on the traditional manufacturing sector: The case of Taiwan. The World Economy, 27(10), 1555–1570.
Tsai, K.-H., and Wang, J.-C. (2009). External technology sourcing and innovation performance in LMT sectors: An analysis based on the Taiwanese technological innovation survey. Research Policy, 38(3), 518–526.
Turcotte, J., and Rennison, L. W. (2004). The link between technology use, human capital, productivity and wages: firm-level evidence. International Productivity Monitor, 9, 25–36.
Van Beveren, I. (2012). Total factor productivity estimation: A practical review. Journal of Economic Surveys, 26(1), 98–128.
Van Wijk, R., Jansen, J. J. P., and Lyles, M. A. (2008). Inter- and intra-organizational knowledge transfer: A meta-analytic review and assessment of its antecedents and consequences. Journal of Management Studies, 45(4), 830–853.
Verspagen, B. (1995). R&D and productivity: A broad cross-section cross-country look. The Journal of Productivity Analysis, 6(2), 117–135.
Vivero, R. L. (2002). The impact of process innovations on firm’s productivity growth: the case of Spain. Applied Economics, 34(8), 1007–1016.
Wakelin, K. (2001). Productivity growth and R&D expenditure in UK manufacturing firms. Research Policy, 30(7), 1079–1090.
Wieser, R. (2005). Research and development productivity and spillovers: Empirical evidence at the firm level. Journal of Economic Surveys, 19(4), 587–621.
Woerter, M., and Roper, S. (2010). Openness and innovation - Home and export demand effects on manufacturing innovation: Panel data evidence for Irland and Switzerland. Research Policy, 39, 155–164.
Wolff, E. N., and Nadiri, M. I. (1993). Spillover effects, linkage structure, and research and development. Structural Change and Economic Dynamics, 4(2), 315–331.
Wooldridge, J. M. (1995). Selection correction for panel data models under conditional mean independece assumptions. Journal of Econometrics, 68, 115–132.

175
Wooldridge, J. M. (2002). Econometric analysis of cross-section and panel data. MIT Press, Cambridge, Massachusetts.
Yang, C.-H., Lin, C.-H., and Ma, D. (2010). R&D, human capital investment and productivity: firm-level evidence from China’s electronics industry. China and World Economy, 18(5), 72–89.
Yasar, M., Raciborski, R., and Poi, B. (2008). Production function estimation in Stata using the Olley and Pakes method. Stata Journal, 8(2), 221–231.
Zeng, S. X., Xie, X. M., and Tam, C. M. (2010). Relationship between cooperation networks and innovation performance of SMEs. Technovation, 30(3), 181–194.

176