Embed Size (px)
Citation preview
Essity Aktiebolag (publ) - Interim Report Q3 2017
Essity Aktiebolag (publ), Box 200, SE-101 23 Stockholm, Sweden. www.essity.com. Corp. Reg. No 556325-5511 1
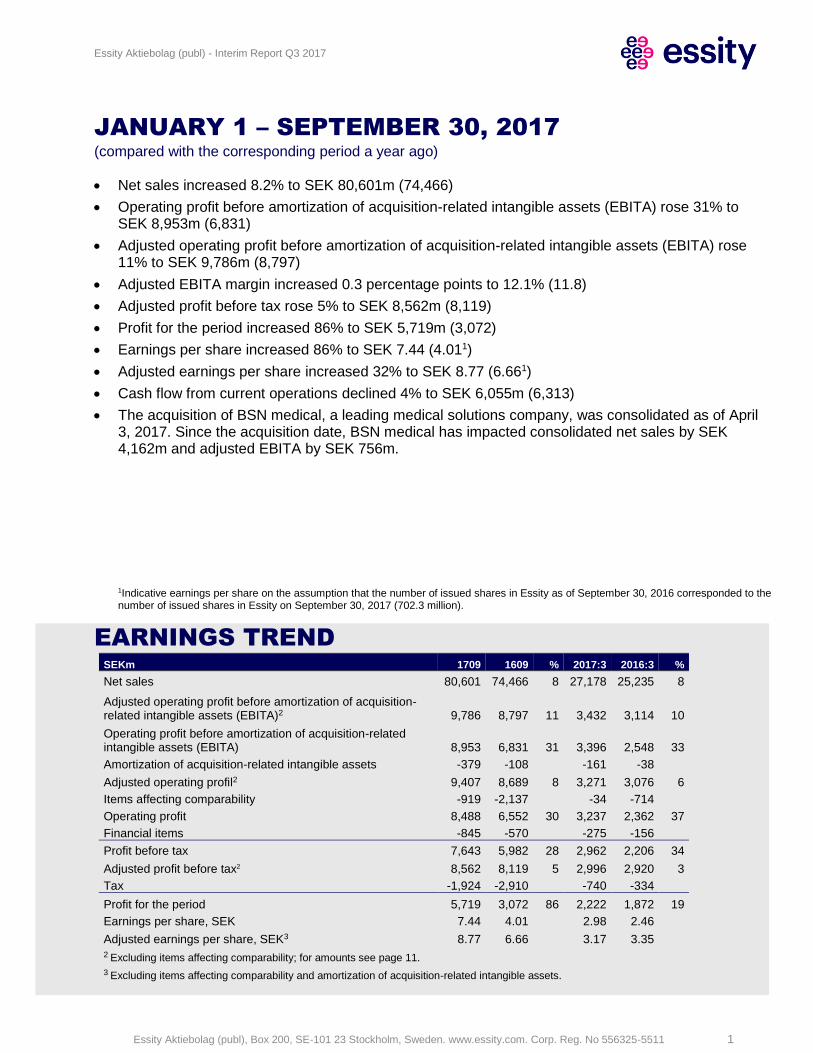
JANUARY 1 – SEPTEMBER 30, 2017
(compared with the corresponding period a year ago)
• Net sales increased 8.2% to SEK 80,601m (74,466)
• Operating profit before amortization of acquisition-related intangible assets (EBITA) rose 31% to SEK 8,953m (6,831)
• Adjusted operating profit before amortization of acquisition-related intangible assets (EBITA) rose 11% to SEK 9,786m (8,797)
• Adjusted EBITA margin increased 0.3 percentage points to 12.1% (11.8)
• Adjusted profit before tax rose 5% to SEK 8,562m (8,119)
• Profit for the period increased 86% to SEK 5,719m (3,072)
• Earnings per share increased 86% to SEK 7.44 (4.011)
• Adjusted earnings per share increased 32% to SEK 8.77 (6.661)
• Cash flow from current operations declined 4% to SEK 6,055m (6,313)
• The acquisition of BSN medical, a leading medical solutions company, was consolidated as of April 3, 2017. Since the acquisition date, BSN medical has impacted consolidated net sales by SEK 4,162m and adjusted EBITA by SEK 756m.
1Indicative earnings per share on the assumption that the number of issued shares in Essity as of September 30, 2016 corresponded to the number of issued shares in Essity on September 30, 2017 (702.3 million).
EARNINGS TREND
SEKm 1709 1609 % 2017:3 2016:3 %
Net sales 80,601 74,466 8 27,178 25,235 8
Adjusted operating profit before amortization of acquisition-related intangible assets (EBITA)2 9,786 8,797 11 3,432 3,114 10
Operating profit before amortization of acquisition-related intangible assets (EBITA) 8,953 6,831 31 3,396 2,548 33
Amortization of acquisition-related intangible assets -379 -108 -161 -38
Adjusted operating profil2 9,407 8,689 8 3,271 3,076 6
Items affecting comparability -919 -2,137 -34 -714
Operating profit 8,488 6,552 30 3,237 2,362 37
Financial items -845 -570 -275 -156
Profit before tax 7,643 5,982 28 2,962 2,206 34
Adjusted profit before tax2 8,562 8,119 5 2,996 2,920 3
Tax -1,924 -2,910 -740 -334
Profit for the period 5,719 3,072 86 2,222 1,872 19
Earnings per share, SEK 7.44 4.01 2.98 2.46
Adjusted earnings per share, SEK3 8.77 6.66 3.17 3.35 2 Excluding items affecting comparability; for amounts see page 11. 3 Excluding items affecting comparability and amortization of acquisition-related intangible assets.
Essity Aktiebolag (publ) - Interim Report Q3 2017
Essity Aktiebolag (publ), Box 200, SE-101 23 Stockholm, Sweden. www.essity.com. Corp. Reg. No 556325-5511 2
2,5002,6002,7002,8002,9003,0003,1003,2003,3003,4003,500
2015:3 2016:3 2017:3
Adjusted EBITA
SEKm
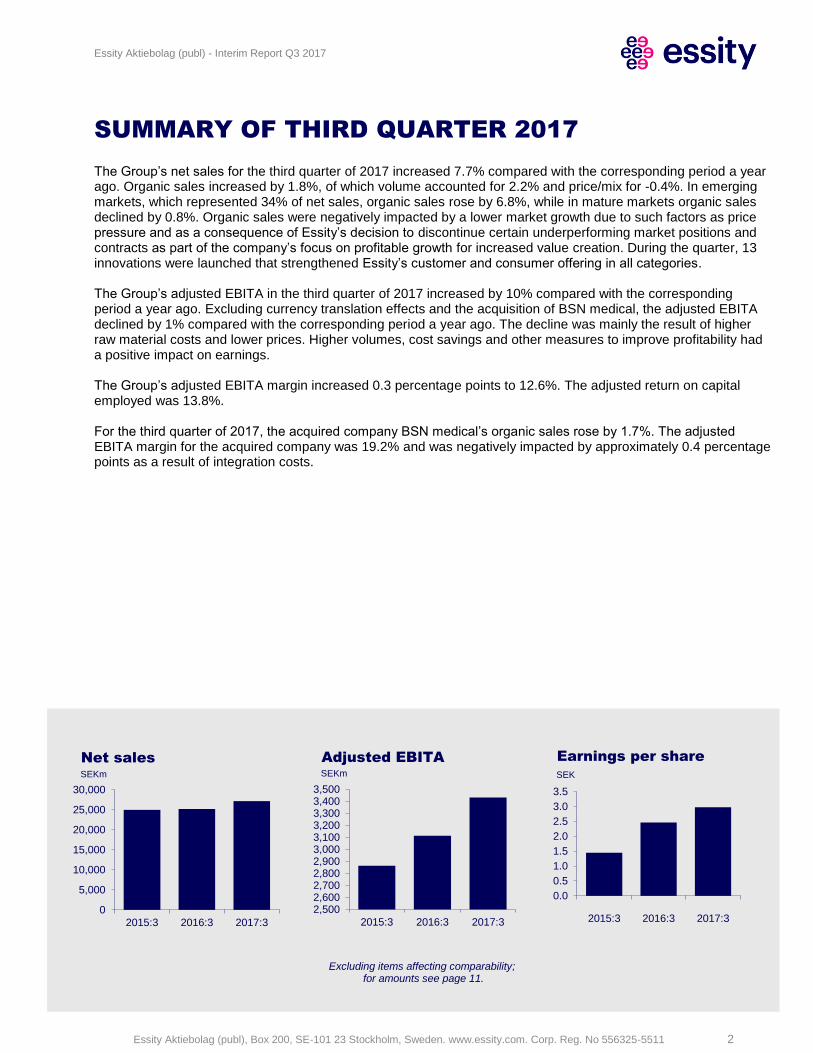
SUMMARY OF THIRD QUARTER 2017
The Group’s net sales for the third quarter of 2017 increased 7.7% compared with the corresponding period a year ago. Organic sales increased by 1.8%, of which volume accounted for 2.2% and price/mix for -0.4%. In emerging markets, which represented 34% of net sales, organic sales rose by 6.8%, while in mature markets organic sales declined by 0.8%. Organic sales were negatively impacted by a lower market growth due to such factors as price pressure and as a consequence of Essity’s decision to discontinue certain underperforming market positions and contracts as part of the company’s focus on profitable growth for increased value creation. During the quarter, 13 innovations were launched that strengthened Essity’s customer and consumer offering in all categories. The Group’s adjusted EBITA in the third quarter of 2017 increased by 10% compared with the corresponding period a year ago. Excluding currency translation effects and the acquisition of BSN medical, the adjusted EBITA declined by 1% compared with the corresponding period a year ago. The decline was mainly the result of higher raw material costs and lower prices. Higher volumes, cost savings and other measures to improve profitability had a positive impact on earnings. The Group’s adjusted EBITA margin increased 0.3 percentage points to 12.6%. The adjusted return on capital employed was 13.8%. For the third quarter of 2017, the acquired company BSN medical’s organic sales rose by 1.7%. The adjusted EBITA margin for the acquired company was 19.2% and was negatively impacted by approximately 0.4 percentage points as a result of integration costs.
Excluding items affecting comparability; for amounts see page 11.
0
5,000
10,000
15,000
20,000
25,000
30,000
2015:3 2016:3 2017:3
Net sales
SEKm
0.0
0.5
1.0
1.5
2.0
2.5
3.0
3.5
2015:3 2016:3 2017:3
Earnings per share
SEK
Essity Aktiebolag (publ) - Interim Report Q3 2017
Essity Aktiebolag (publ), Box 200, SE-101 23 Stockholm, Sweden. www.essity.com. Corp. Reg. No 556325-5511 3
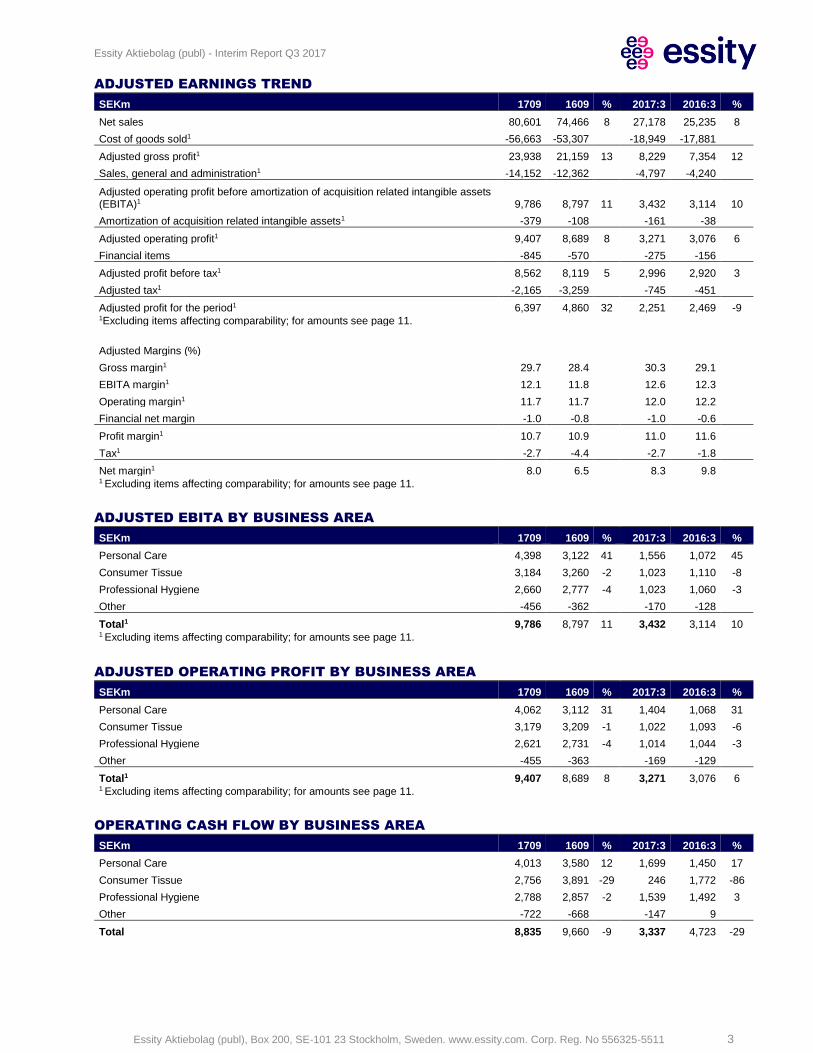
ADJUSTED EARNINGS TREND
SEKm 1709 1609 % 2017:3 2016:3 %
Net sales 80,601 74,466 8 27,178 25,235 8
Cost of goods sold1 -56,663 -53,307 -18,949 -17,881
Adjusted gross profit1 23,938 21,159 13 8,229 7,354 12
Sales, general and administration1 -14,152 -12,362 -4,797 -4,240
Adjusted operating profit before amortization of acquisition related intangible assets (EBITA)1 9,786 8,797 11 3,432 3,114 10
Amortization of acquisition related intangible assets1 -379 -108 -161 -38
Adjusted operating profit1 9,407 8,689 8 3,271 3,076 6
Financial items -845 -570 -275 -156
Adjusted profit before tax1 8,562 8,119 5 2,996 2,920 3
Adjusted tax1 -2,165 -3,259 -745 -451
Adjusted profit for the period1 6,397 4,860 32 2,251 2,469 -9 1Excluding items affecting comparability; for amounts see page 11.
Adjusted Margins (%) Gross margin1 29.7 28.4 30.3 29.1
EBITA margin1 12.1 11.8 12.6 12.3
Operating margin1 11.7 11.7 12.0 12.2
Financial net margin -1.0 -0.8 -1.0 -0.6
Profit margin1 10.7 10.9 11.0 11.6
Tax1 -2.7 -4.4 -2.7 -1.8
Net margin1 8.0 6.5 8.3 9.8 1 Excluding items affecting comparability; for amounts see page 11.
ADJUSTED EBITA BY BUSINESS AREA
SEKm 1709 1609 % 2017:3 2016:3 %
Personal Care 4,398 3,122 41 1,556 1,072 45
Consumer Tissue 3,184 3,260 -2 1,023 1,110 -8
Professional Hygiene 2,660 2,777 -4 1,023 1,060 -3
Other -456 -362 -170 -128
Total1 9,786 8,797 11 3,432 3,114 10 1 Excluding items affecting comparability; for amounts see page 11.
ADJUSTED OPERATING PROFIT BY BUSINESS AREA
SEKm 1709 1609 % 2017:3 2016:3 %
Personal Care 4,062 3,112 31 1,404 1,068 31
Consumer Tissue 3,179 3,209 -1 1,022 1,093 -6
Professional Hygiene 2,621 2,731 -4 1,014 1,044 -3
Other -455 -363 -169 -129
Total1 9,407 8,689 8 3,271 3,076 6 1 Excluding items affecting comparability; for amounts see page 11.
OPERATING CASH FLOW BY BUSINESS AREA
SEKm 1709 1609 % 2017:3 2016:3 %
Personal Care 4,013 3,580 12 1,699 1,450 17
Consumer Tissue 2,756 3,891 -29 246 1,772 -86
Professional Hygiene 2,788 2,857 -2 1,539 1,492 3
Other -722 -668 -147 9
Total 8,835 9,660 -9 3,337 4,723 -29
Essity Aktiebolag (publ) - Interim Report Q3 2017
Essity Aktiebolag (publ), Box 200, SE-101 23 Stockholm, Sweden. www.essity.com. Corp. Reg. No 556325-5511 4
Excluding items affecting comparability
Excluding items affecting comparability
Change in net sales (%) 1709 vs
1609 17:3 vs
16:3
Total 8.2 7.7
Price/mix 0.1 -0.4
Volume 0.8 2.2
Currency 1.5 -2.3
Acquisitions 5.8 8.2
Divestments 0 0
Change in adjusted EBITA (%) 1709 vs
1609 17:3 vs
16:3
Total 11 10
Price/mix 1 -4
Volume 3 5
Raw materials -11 -15
Energy -1 1
Currency 2 -2
Other 17 25
GROUP
MARKET/EXTERNAL ENVIRONMENT
January-September 2017 compared with the corresponding period a year ago The global market for hygiene and health products was challenging in the first nine months of 2017. The European and North American markets for incontinence products in the healthcare sector displayed higher demand, although with continued price pressure as a result of fierce competition, while the retail markets showed good growth but with a continued high level of competition. Emerging markets noted higher demand. The global market for medical solutions demonstrated stable growth but with continued price pressure. In Europe, demand for baby care and feminine care was stable. In emerging markets, demand rose for baby care and feminine care. The global market for baby care and several markets for feminine care were characterized by increased competition and campaign activity. The European market for consumer tissue demonstrated low growth and increased competition. The Chinese consumer tissue market noted higher demand. The European and North American markets for professional hygiene displayed low growth.
NET SALES AND EARNINGS
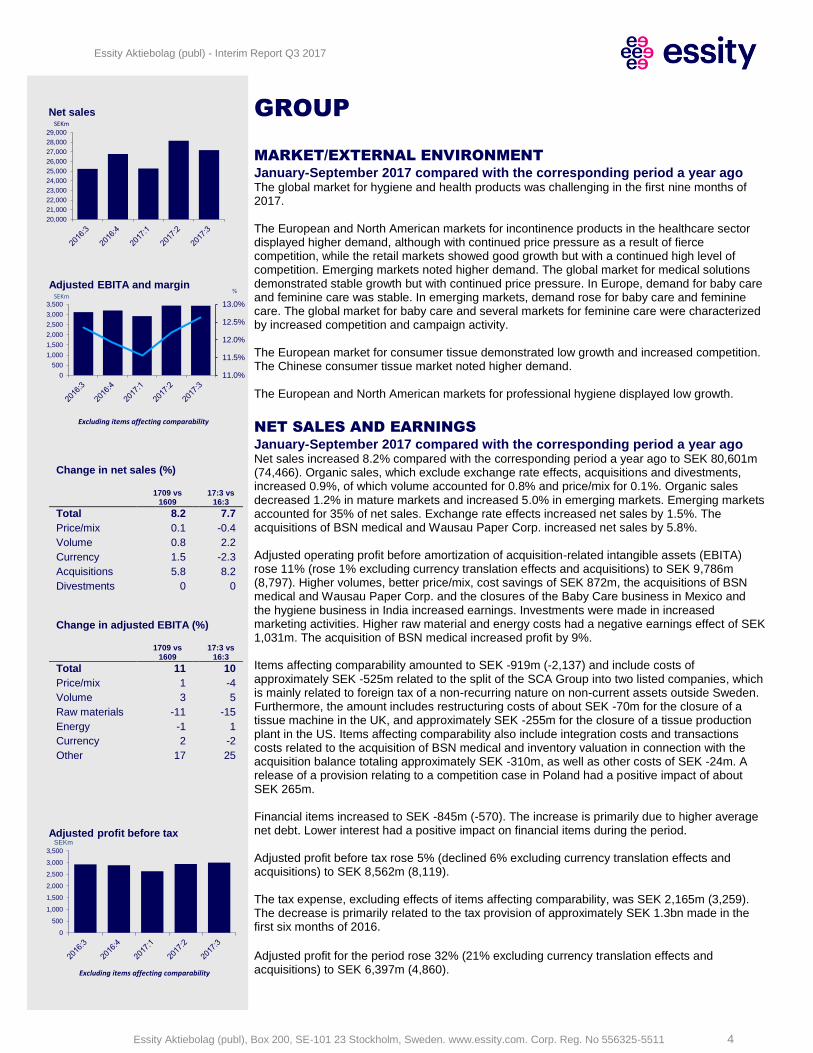
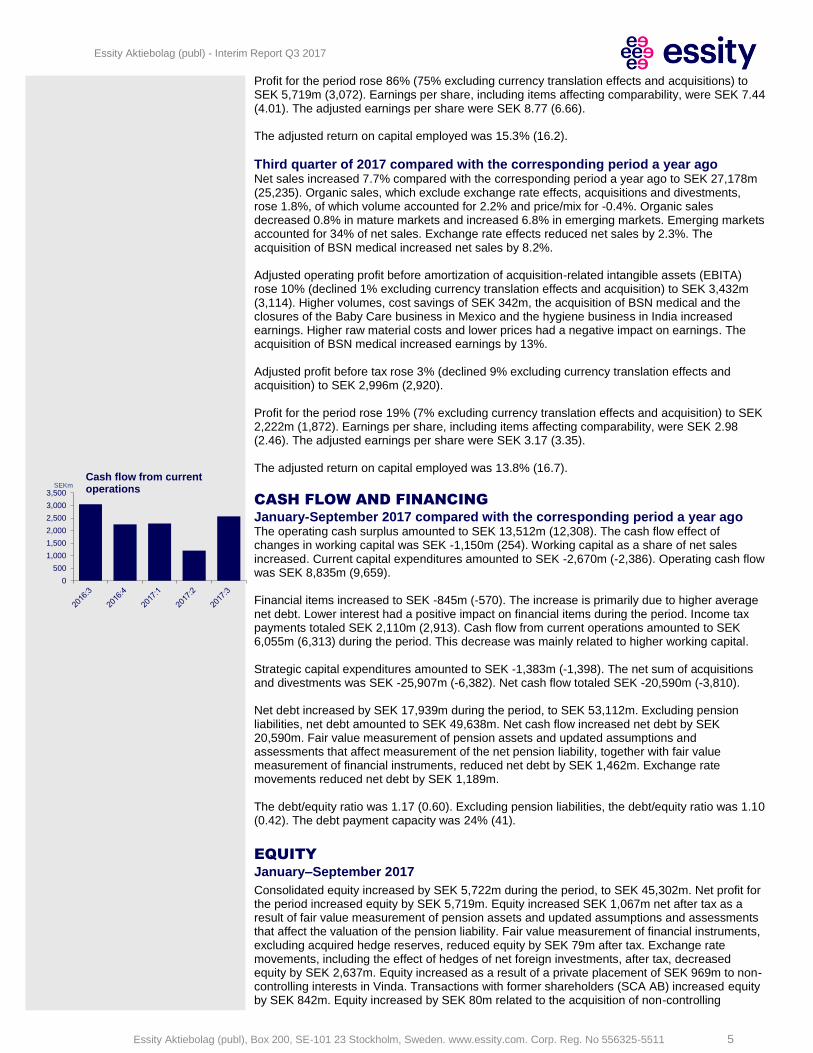
January-September 2017 compared with the corresponding period a year ago Net sales increased 8.2% compared with the corresponding period a year ago to SEK 80,601m (74,466). Organic sales, which exclude exchange rate effects, acquisitions and divestments, increased 0.9%, of which volume accounted for 0.8% and price/mix for 0.1%. Organic sales decreased 1.2% in mature markets and increased 5.0% in emerging markets. Emerging markets accounted for 35% of net sales. Exchange rate effects increased net sales by 1.5%. The acquisitions of BSN medical and Wausau Paper Corp. increased net sales by 5.8%. Adjusted operating profit before amortization of acquisition-related intangible assets (EBITA) rose 11% (rose 1% excluding currency translation effects and acquisitions) to SEK 9,786m (8,797). Higher volumes, better price/mix, cost savings of SEK 872m, the acquisitions of BSN medical and Wausau Paper Corp. and the closures of the Baby Care business in Mexico and the hygiene business in India increased earnings. Investments were made in increased marketing activities. Higher raw material and energy costs had a negative earnings effect of SEK 1,031m. The acquisition of BSN medical increased profit by 9%. Items affecting comparability amounted to SEK -919m (-2,137) and include costs of approximately SEK -525m related to the split of the SCA Group into two listed companies, which is mainly related to foreign tax of a non-recurring nature on non-current assets outside Sweden. Furthermore, the amount includes restructuring costs of about SEK -70m for the closure of a tissue machine in the UK, and approximately SEK -255m for the closure of a tissue production plant in the US. Items affecting comparability also include integration costs and transactions costs related to the acquisition of BSN medical and inventory valuation in connection with the acquisition balance totaling approximately SEK -310m, as well as other costs of SEK -24m. A release of a provision relating to a competition case in Poland had a positive impact of about SEK 265m. Financial items increased to SEK -845m (-570). The increase is primarily due to higher average net debt. Lower interest had a positive impact on financial items during the period. Adjusted profit before tax rose 5% (declined 6% excluding currency translation effects and acquisitions) to SEK 8,562m (8,119). The tax expense, excluding effects of items affecting comparability, was SEK 2,165m (3,259). The decrease is primarily related to the tax provision of approximately SEK 1.3bn made in the first six months of 2016. Adjusted profit for the period rose 32% (21% excluding currency translation effects and acquisitions) to SEK 6,397m (4,860).
20,000
21,000
22,000
23,000
24,000
25,000
26,000
27,000
28,000
29,000
Net salesSEKm
11.0%
11.5%
12.0%
12.5%
13.0%
0
500
1,000
1,500
2,000
2,500
3,000
3,500
Adjusted EBITA and marginSEKm
%
0
500
1,000
1,500
2,000
2,500
3,000
3,500
Adjusted profit before taxSEKm
Essity Aktiebolag (publ) - Interim Report Q3 2017
Essity Aktiebolag (publ), Box 200, SE-101 23 Stockholm, Sweden. www.essity.com. Corp. Reg. No 556325-5511 5
Profit for the period rose 86% (75% excluding currency translation effects and acquisitions) to SEK 5,719m (3,072). Earnings per share, including items affecting comparability, were SEK 7.44 (4.01). The adjusted earnings per share were SEK 8.77 (6.66). The adjusted return on capital employed was 15.3% (16.2).
Third quarter of 2017 compared with the corresponding period a year ago Net sales increased 7.7% compared with the corresponding period a year ago to SEK 27,178m (25,235). Organic sales, which exclude exchange rate effects, acquisitions and divestments, rose 1.8%, of which volume accounted for 2.2% and price/mix for -0.4%. Organic sales decreased 0.8% in mature markets and increased 6.8% in emerging markets. Emerging markets accounted for 34% of net sales. Exchange rate effects reduced net sales by 2.3%. The acquisition of BSN medical increased net sales by 8.2%. Adjusted operating profit before amortization of acquisition-related intangible assets (EBITA) rose 10% (declined 1% excluding currency translation effects and acquisition) to SEK 3,432m (3,114). Higher volumes, cost savings of SEK 342m, the acquisition of BSN medical and the closures of the Baby Care business in Mexico and the hygiene business in India increased earnings. Higher raw material costs and lower prices had a negative impact on earnings. The acquisition of BSN medical increased earnings by 13%. Adjusted profit before tax rose 3% (declined 9% excluding currency translation effects and acquisition) to SEK 2,996m (2,920). Profit for the period rose 19% (7% excluding currency translation effects and acquisition) to SEK 2,222m (1,872). Earnings per share, including items affecting comparability, were SEK 2.98 (2.46). The adjusted earnings per share were SEK 3.17 (3.35). The adjusted return on capital employed was 13.8% (16.7).
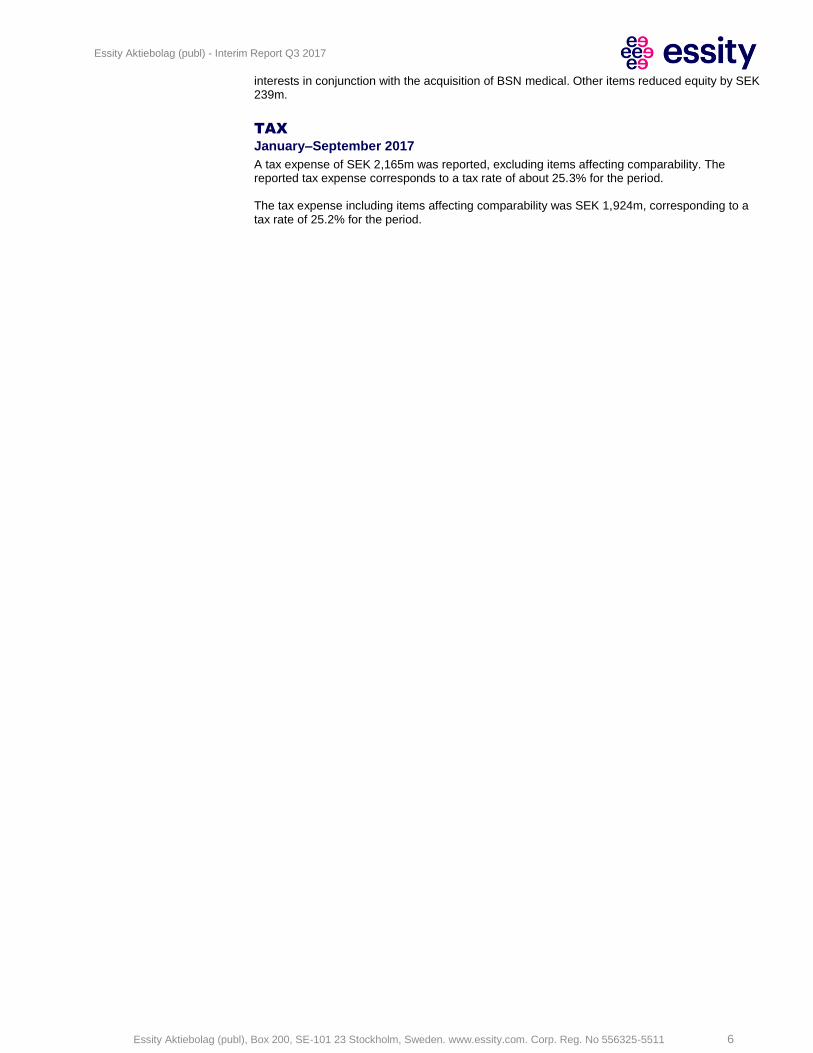
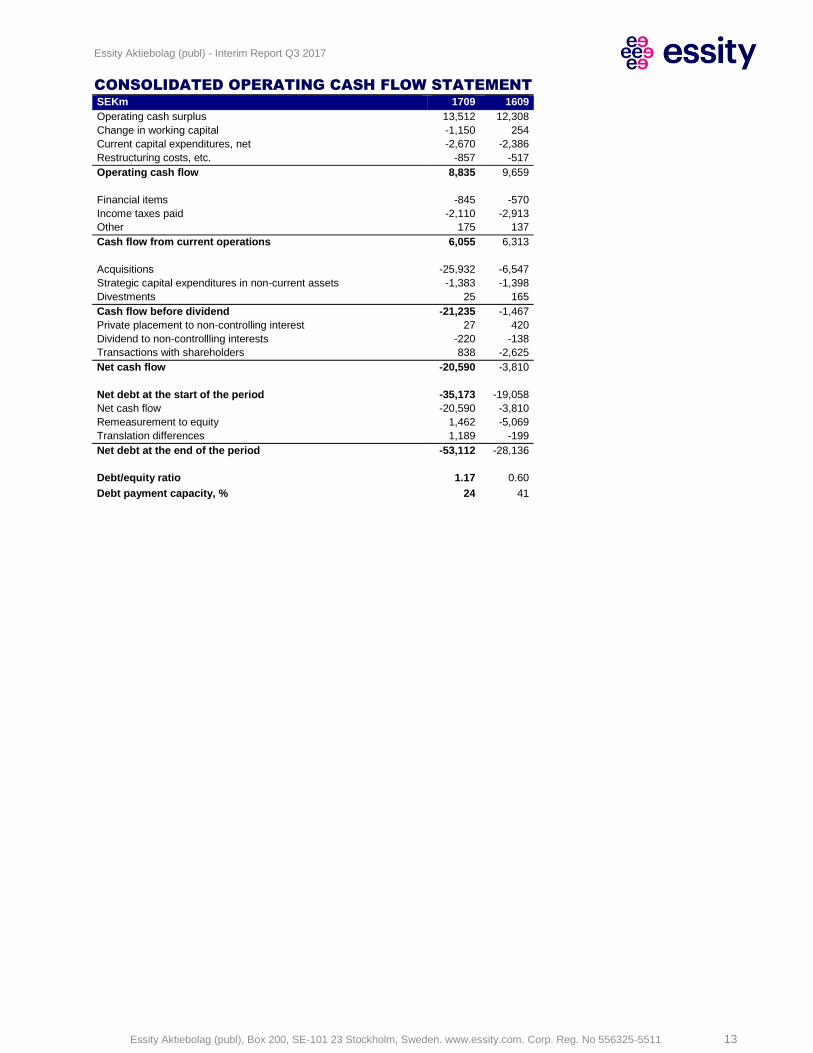
CASH FLOW AND FINANCING January-September 2017 compared with the corresponding period a year ago The operating cash surplus amounted to SEK 13,512m (12,308). The cash flow effect of changes in working capital was SEK -1,150m (254). Working capital as a share of net sales increased. Current capital expenditures amounted to SEK -2,670m (-2,386). Operating cash flow was SEK 8,835m (9,659). Financial items increased to SEK -845m (-570). The increase is primarily due to higher average net debt. Lower interest had a positive impact on financial items during the period. Income tax payments totaled SEK 2,110m (2,913). Cash flow from current operations amounted to SEK 6,055m (6,313) during the period. This decrease was mainly related to higher working capital. Strategic capital expenditures amounted to SEK -1,383m (-1,398). The net sum of acquisitions and divestments was SEK -25,907m (-6,382). Net cash flow totaled SEK -20,590m (-3,810). Net debt increased by SEK 17,939m during the period, to SEK 53,112m. Excluding pension liabilities, net debt amounted to SEK 49,638m. Net cash flow increased net debt by SEK 20,590m. Fair value measurement of pension assets and updated assumptions and assessments that affect measurement of the net pension liability, together with fair value measurement of financial instruments, reduced net debt by SEK 1,462m. Exchange rate movements reduced net debt by SEK 1,189m. The debt/equity ratio was 1.17 (0.60). Excluding pension liabilities, the debt/equity ratio was 1.10 (0.42). The debt payment capacity was 24% (41).
EQUITY January–September 2017
Consolidated equity increased by SEK 5,722m during the period, to SEK 45,302m. Net profit for the period increased equity by SEK 5,719m. Equity increased SEK 1,067m net after tax as a result of fair value measurement of pension assets and updated assumptions and assessments that affect the valuation of the pension liability. Fair value measurement of financial instruments, excluding acquired hedge reserves, reduced equity by SEK 79m after tax. Exchange rate movements, including the effect of hedges of net foreign investments, after tax, decreased equity by SEK 2,637m. Equity increased as a result of a private placement of SEK 969m to non-controlling interests in Vinda. Transactions with former shareholders (SCA AB) increased equity by SEK 842m. Equity increased by SEK 80m related to the acquisition of non-controlling
0
500
1,000
1,500
2,000
2,500
3,000
3,500
Cash flow from current operationsSEKm
Essity Aktiebolag (publ) - Interim Report Q3 2017
Essity Aktiebolag (publ), Box 200, SE-101 23 Stockholm, Sweden. www.essity.com. Corp. Reg. No 556325-5511 6
interests in conjunction with the acquisition of BSN medical. Other items reduced equity by SEK 239m.
TAX January–September 2017
A tax expense of SEK 2,165m was reported, excluding items affecting comparability. The reported tax expense corresponds to a tax rate of about 25.3% for the period. The tax expense including items affecting comparability was SEK 1,924m, corresponding to a tax rate of 25.2% for the period.
Essity Aktiebolag (publ) - Interim Report Q3 2017
Essity Aktiebolag (publ), Box 200, SE-101 23 Stockholm, Sweden. www.essity.com. Corp. Reg. No 556325-5511 7
Change in net sales (%)
1709 vs
1609 17:3 vs
16:3
Total 19.3 24.9
Price/mix -0.6 -1.9
Volume 1.9 4.9
Currency 1.3 -2.8
Acquisitions 16.7 24.7
Divestments 0 0
Change in adjusted EBITA (%)
-6
1709 vs 1609
17:3 vs 16:3
Total 41 45 Price/mix -4 -15
Volume 7 13
Raw materials -4 -5
Energy 0 0
Currency 1 -2
Other 41 54
PERSONAL CARE
SEKm 1709 1609 % 2017:3 2016:3 %
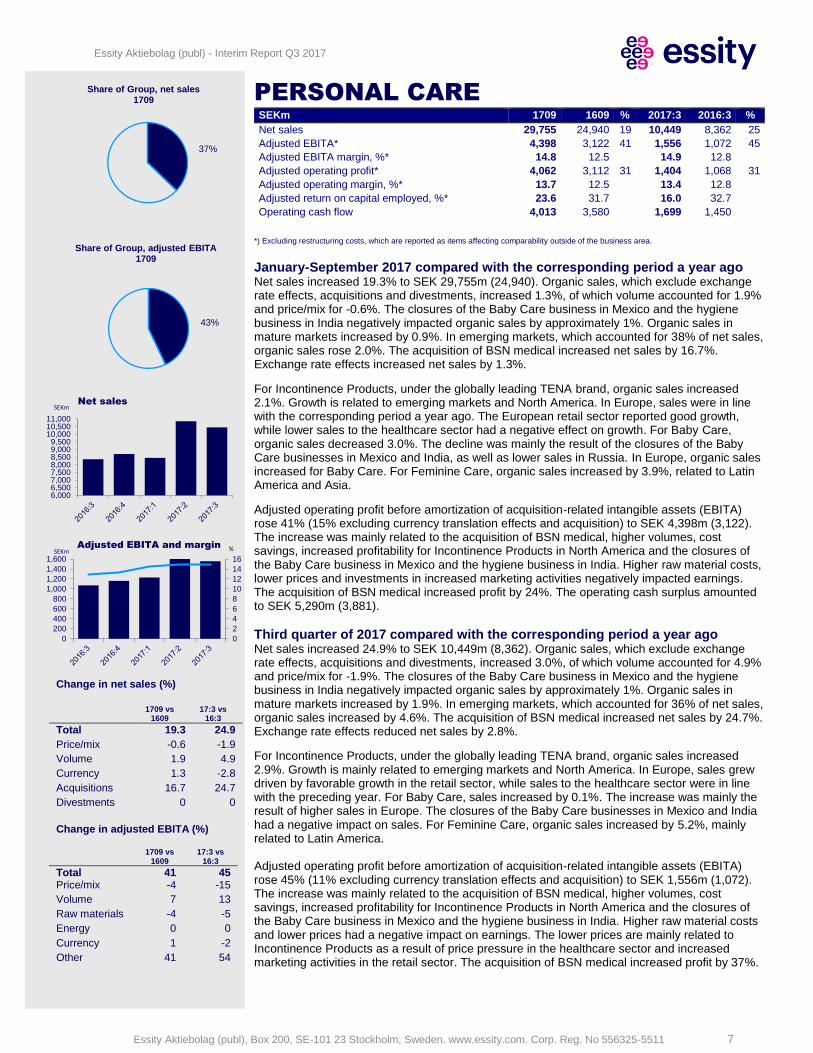
Net sales 29,755 24,940 19 10,449 8,362 25
Adjusted EBITA* 4,398 3,122 41 1,556 1,072 45
Adjusted EBITA margin, %* 14.8 12.5 14.9 12.8
Adjusted operating profit* 4,062 3,112 31 1,404 1,068 31
Adjusted operating margin, %* 13.7 12.5 13.4 12.8
Adjusted return on capital employed, %* 23.6 31.7 16.0 32.7
Operating cash flow 4,013 3,580 1,699 1,450
*) Excluding restructuring costs, which are reported as items affecting comparability outside of the business area.
January-September 2017 compared with the corresponding period a year ago Net sales increased 19.3% to SEK 29,755m (24,940). Organic sales, which exclude exchange rate effects, acquisitions and divestments, increased 1.3%, of which volume accounted for 1.9% and price/mix for -0.6%. The closures of the Baby Care business in Mexico and the hygiene business in India negatively impacted organic sales by approximately 1%. Organic sales in mature markets increased by 0.9%. In emerging markets, which accounted for 38% of net sales, organic sales rose 2.0%. The acquisition of BSN medical increased net sales by 16.7%. Exchange rate effects increased net sales by 1.3%.
For Incontinence Products, under the globally leading TENA brand, organic sales increased 2.1%. Growth is related to emerging markets and North America. In Europe, sales were in line with the corresponding period a year ago. The European retail sector reported good growth, while lower sales to the healthcare sector had a negative effect on growth. For Baby Care, organic sales decreased 3.0%. The decline was mainly the result of the closures of the Baby Care businesses in Mexico and India, as well as lower sales in Russia. In Europe, organic sales increased for Baby Care. For Feminine Care, organic sales increased by 3.9%, related to Latin America and Asia.
Adjusted operating profit before amortization of acquisition-related intangible assets (EBITA) rose 41% (15% excluding currency translation effects and acquisition) to SEK 4,398m (3,122). The increase was mainly related to the acquisition of BSN medical, higher volumes, cost savings, increased profitability for Incontinence Products in North America and the closures of the Baby Care business in Mexico and the hygiene business in India. Higher raw material costs, lower prices and investments in increased marketing activities negatively impacted earnings. The acquisition of BSN medical increased profit by 24%. The operating cash surplus amounted to SEK 5,290m (3,881).
Third quarter of 2017 compared with the corresponding period a year ago Net sales increased 24.9% to SEK 10,449m (8,362). Organic sales, which exclude exchange rate effects, acquisitions and divestments, increased 3.0%, of which volume accounted for 4.9% and price/mix for -1.9%. The closures of the Baby Care business in Mexico and the hygiene business in India negatively impacted organic sales by approximately 1%. Organic sales in mature markets increased by 1.9%. In emerging markets, which accounted for 36% of net sales, organic sales increased by 4.6%. The acquisition of BSN medical increased net sales by 24.7%. Exchange rate effects reduced net sales by 2.8%.
For Incontinence Products, under the globally leading TENA brand, organic sales increased 2.9%. Growth is mainly related to emerging markets and North America. In Europe, sales grew driven by favorable growth in the retail sector, while sales to the healthcare sector were in line with the preceding year. For Baby Care, sales increased by 0.1%. The increase was mainly the result of higher sales in Europe. The closures of the Baby Care businesses in Mexico and India had a negative impact on sales. For Feminine Care, organic sales increased by 5.2%, mainly related to Latin America. Adjusted operating profit before amortization of acquisition-related intangible assets (EBITA) rose 45% (11% excluding currency translation effects and acquisition) to SEK 1,556m (1,072). The increase was mainly related to the acquisition of BSN medical, higher volumes, cost savings, increased profitability for Incontinence Products in North America and the closures of the Baby Care business in Mexico and the hygiene business in India. Higher raw material costs and lower prices had a negative impact on earnings. The lower prices are mainly related to Incontinence Products as a result of price pressure in the healthcare sector and increased marketing activities in the retail sector. The acquisition of BSN medical increased profit by 37%.
37%
Share of Group, net sales1709
43%
Share of Group, adjusted EBITA1709
6,0006,5007,0007,5008,0008,5009,0009,500
10,00010,50011,000
Net salesSEKm
0
2
4
6
8
10
12
14
16
0
200
400
600
800
1,000
1,200
1,400
1,600
Adjusted EBITA and marginSEKm %
Essity Aktiebolag (publ) - Interim Report Q3 2017
Essity Aktiebolag (publ), Box 200, SE-101 23 Stockholm, Sweden. www.essity.com. Corp. Reg. No 556325-5511 8
Change in net sales (%)
1709 vs
1609 17:3 vs.
16:3
Total 1.8 -1.0
Price/mix -0.3 -0.7
Volume 0.8 1.4
Currency 1.3 -1.7
Acquisitions 0 0
Divestments 0 0
Change in adjusted EBITA (%)
-6
1709 vs 1609
17:3 vs 16:3
Total -2 -8 Price/mix -2 -4
Volume 2 3
Raw materials -13 -27
Energy -2 2
Currency 1 -2
Other 12 20
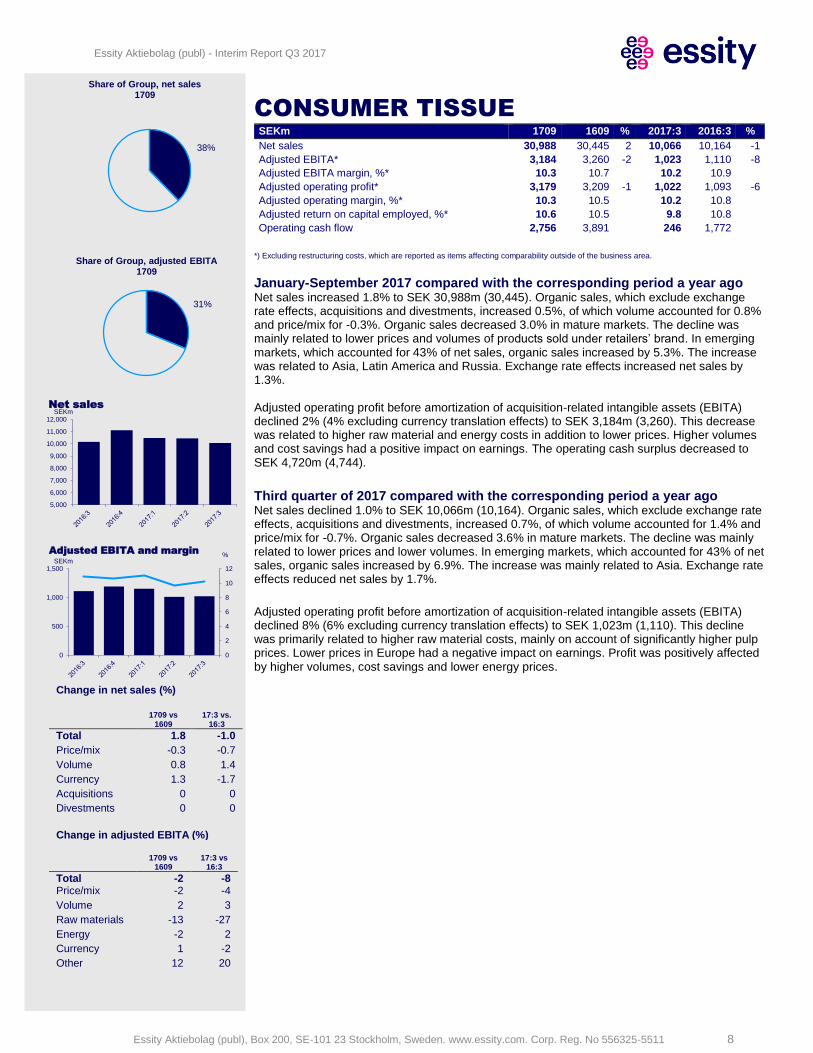
CONSUMER TISSUE
SEKm 1709 1609 % 2017:3 2016:3 %
Net sales 30,988 30,445 2 10,066 10,164 -1
Adjusted EBITA* 3,184 3,260 -2 1,023 1,110 -8
Adjusted EBITA margin, %* 10.3 10.7 10.2 10.9
Adjusted operating profit* 3,179 3,209 -1 1,022 1,093 -6
Adjusted operating margin, %* 10.3 10.5 10.2 10.8
Adjusted return on capital employed, %* 10.6 10.5 9.8 10.8
Operating cash flow 2,756 3,891 246 1,772
*) Excluding restructuring costs, which are reported as items affecting comparability outside of the business area.
January-September 2017 compared with the corresponding period a year ago Net sales increased 1.8% to SEK 30,988m (30,445). Organic sales, which exclude exchange rate effects, acquisitions and divestments, increased 0.5%, of which volume accounted for 0.8% and price/mix for -0.3%. Organic sales decreased 3.0% in mature markets. The decline was mainly related to lower prices and volumes of products sold under retailers’ brand. In emerging markets, which accounted for 43% of net sales, organic sales increased by 5.3%. The increase was related to Asia, Latin America and Russia. Exchange rate effects increased net sales by 1.3%. Adjusted operating profit before amortization of acquisition-related intangible assets (EBITA) declined 2% (4% excluding currency translation effects) to SEK 3,184m (3,260). This decrease was related to higher raw material and energy costs in addition to lower prices. Higher volumes and cost savings had a positive impact on earnings. The operating cash surplus decreased to SEK 4,720m (4,744).
Third quarter of 2017 compared with the corresponding period a year ago Net sales declined 1.0% to SEK 10,066m (10,164). Organic sales, which exclude exchange rate effects, acquisitions and divestments, increased 0.7%, of which volume accounted for 1.4% and price/mix for -0.7%. Organic sales decreased 3.6% in mature markets. The decline was mainly related to lower prices and lower volumes. In emerging markets, which accounted for 43% of net sales, organic sales increased by 6.9%. The increase was mainly related to Asia. Exchange rate effects reduced net sales by 1.7%.
Adjusted operating profit before amortization of acquisition-related intangible assets (EBITA) declined 8% (6% excluding currency translation effects) to SEK 1,023m (1,110). This decline was primarily related to higher raw material costs, mainly on account of significantly higher pulp prices. Lower prices in Europe had a negative impact on earnings. Profit was positively affected by higher volumes, cost savings and lower energy prices.
38%
Share of Group, net sales1709
31%
Share of Group, adjusted EBITA1709
5,000
6,000
7,000
8,000
9,000
10,000
11,000
12,000
Net salesSEKm
0
2
4
6
8
10
12
0
500
1,000
1,500
Adjusted EBITA and margin
SEKm%
Essity Aktiebolag (publ) - Interim Report Q3 2017
Essity Aktiebolag (publ), Box 200, SE-101 23 Stockholm, Sweden. www.essity.com. Corp. Reg. No 556325-5511 9
Change in net sales (%)
1709 vs
1609 17:3 vs
16:3
Total 4.3 -1.4
Price/mix 1.8 1.6
Volume -0.4 -0.4
Currency 2.1 -2.6
Acquisitions 0.8 0
Divestments 0 0
Change in adjusted EBITA (%)
-6
1709 vs 1609
17:3 vs 16:3
Total -4 -3 Price/mix 10 8
Volume -1 -1
Raw materials -15 -10
Energy -1 1
Currency 3 -1
Other 0 0
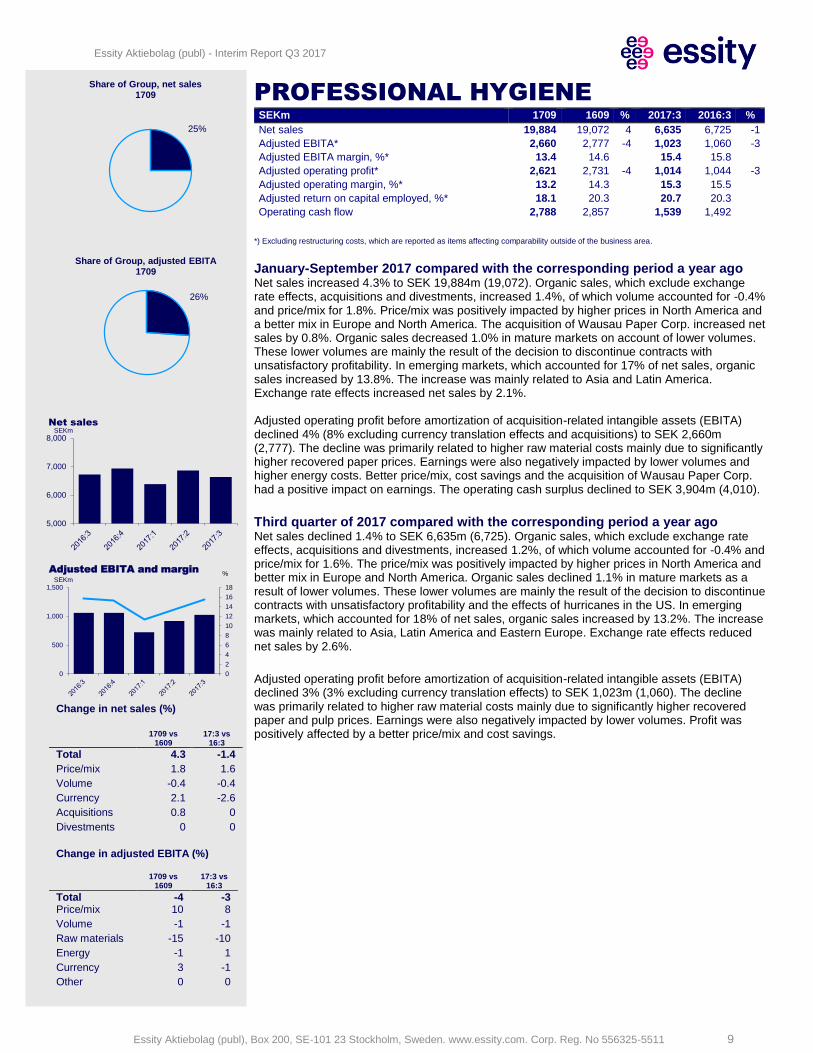
PROFESSIONAL HYGIENE
SEKm 1709 1609 % 2017:3 2016:3 %
Net sales 19,884 19,072 4 6,635 6,725 -1
Adjusted EBITA* 2,660 2,777 -4 1,023 1,060 -3
Adjusted EBITA margin, %* 13.4 14.6 15.4 15.8
Adjusted operating profit* 2,621 2,731 -4 1,014 1,044 -3
Adjusted operating margin, %* 13.2 14.3 15.3 15.5
Adjusted return on capital employed, %* 18.1 20.3 20.7 20.3
Operating cash flow 2,788 2,857 1,539 1,492
*) Excluding restructuring costs, which are reported as items affecting comparability outside of the business area.
January-September 2017 compared with the corresponding period a year ago Net sales increased 4.3% to SEK 19,884m (19,072). Organic sales, which exclude exchange rate effects, acquisitions and divestments, increased 1.4%, of which volume accounted for -0.4% and price/mix for 1.8%. Price/mix was positively impacted by higher prices in North America and a better mix in Europe and North America. The acquisition of Wausau Paper Corp. increased net sales by 0.8%. Organic sales decreased 1.0% in mature markets on account of lower volumes. These lower volumes are mainly the result of the decision to discontinue contracts with unsatisfactory profitability. In emerging markets, which accounted for 17% of net sales, organic sales increased by 13.8%. The increase was mainly related to Asia and Latin America. Exchange rate effects increased net sales by 2.1%. Adjusted operating profit before amortization of acquisition-related intangible assets (EBITA) declined 4% (8% excluding currency translation effects and acquisitions) to SEK 2,660m (2,777). The decline was primarily related to higher raw material costs mainly due to significantly higher recovered paper prices. Earnings were also negatively impacted by lower volumes and higher energy costs. Better price/mix, cost savings and the acquisition of Wausau Paper Corp. had a positive impact on earnings. The operating cash surplus declined to SEK 3,904m (4,010).
Third quarter of 2017 compared with the corresponding period a year ago Net sales declined 1.4% to SEK 6,635m (6,725). Organic sales, which exclude exchange rate effects, acquisitions and divestments, increased 1.2%, of which volume accounted for -0.4% and price/mix for 1.6%. The price/mix was positively impacted by higher prices in North America and better mix in Europe and North America. Organic sales declined 1.1% in mature markets as a result of lower volumes. These lower volumes are mainly the result of the decision to discontinue contracts with unsatisfactory profitability and the effects of hurricanes in the US. In emerging markets, which accounted for 18% of net sales, organic sales increased by 13.2%. The increase was mainly related to Asia, Latin America and Eastern Europe. Exchange rate effects reduced net sales by 2.6%.
Adjusted operating profit before amortization of acquisition-related intangible assets (EBITA) declined 3% (3% excluding currency translation effects) to SEK 1,023m (1,060). The decline was primarily related to higher raw material costs mainly due to significantly higher recovered paper and pulp prices. Earnings were also negatively impacted by lower volumes. Profit was positively affected by a better price/mix and cost savings.
25%
Share of Group, net sales1709
26%
Share of Group, adjusted EBITA1709
5,000
6,000
7,000
8,000
Net sales
SEKm
0
2
4
6
8
10
12
14
16
18
0
500
1,000
1,500
Adjusted EBITA and margin
SEKm%
Essity Aktiebolag (publ) - Interim Report Q3 2017
Essity Aktiebolag (publ), Box 200, SE-101 23 Stockholm, Sweden. www.essity.com. Corp. Reg. No 556325-5511 10
DISTRIBUTION OF SHARES September 30, 2017 Class A Class B Total
Registered number of shares 64,461,518 637,880,971 702,342,489
At the end of the reporting period, the proportion of Class A shares was 9.2%. During the third quarter, 132,421 Class A shares were converted into Class B shares at the request of shareholders. The total number of votes in the company thereafter amounts to 1,282,496,151.
FUTURE REPORTS
The year-end report for 2017 will be published on January 25, 2018. Essity’s 2017 Annual Report is scheduled for publication during the week beginning March 19. In 2018, interim reports will be published on April 27, July 19 and October 26.
ANNUAL GENERAL MEETING
The Annual General Meeting for Essity will be held on April 12, 2018 at 15:00 CET at the Stockholm Waterfront Congress Centre in Stockholm, Sweden.
INVITATION TO PRESS CONFERENCE ON Q3 2017 INTERIM REPORT
Media and analysts are invited to a press conference, where this interim report will be presented by Magnus Groth, President and CEO. Time: 10:00 CET, Thursday, October 26, 2017 Location: Essity’s headquarters, Waterfront Building, Klarabergsviadukten 63, Stockholm, Sweden The presentation will be webcasted at www.essity.com. To participate, call: +44 (0)20 7162 0077, +1 646 851 2407 or +46 8 5052 0110. Specify “Essity” or conference ID no. 962907. Stockholm, October 26, 2017 Essity Aktiebolag (publ) Magnus Groth President and CEO
For further information, please contact:
Fredrik Rystedt, CFO and Executive Vice President, +46 8 788 51 31
Johan Karlsson, Vice President Investor Relations, Group Function Communications, +46 8 788 51 30
Joséphine Edwall-Björklund, Senior Vice President, Group Function Communications, +46 8 788 52 34
Media Relations, Group Function Communications, +46 8 788 52 20
NB:
This information is such information that Essity Aktiebolag (publ) is obligated to make public pursuant to the EU Market Abuse
Regulation. This report has been prepared in both Swedish and English versions. In case of variations in the content between the two
versions, the Swedish version shall govern. The information was submitted for publication, through the agency of the contact person set
out below, at 08:00 CET on October 26, 2017. This interim report has not been reviewed by the company’s auditors.
Karl Stoltz, Media Relations Manager, +46 8 788 51 55
Essity Aktiebolag (publ) - Interim Report Q3 2017
Essity Aktiebolag (publ), Box 200, SE-101 23 Stockholm, Sweden. www.essity.com. Corp. Reg. No 556325-5511 11
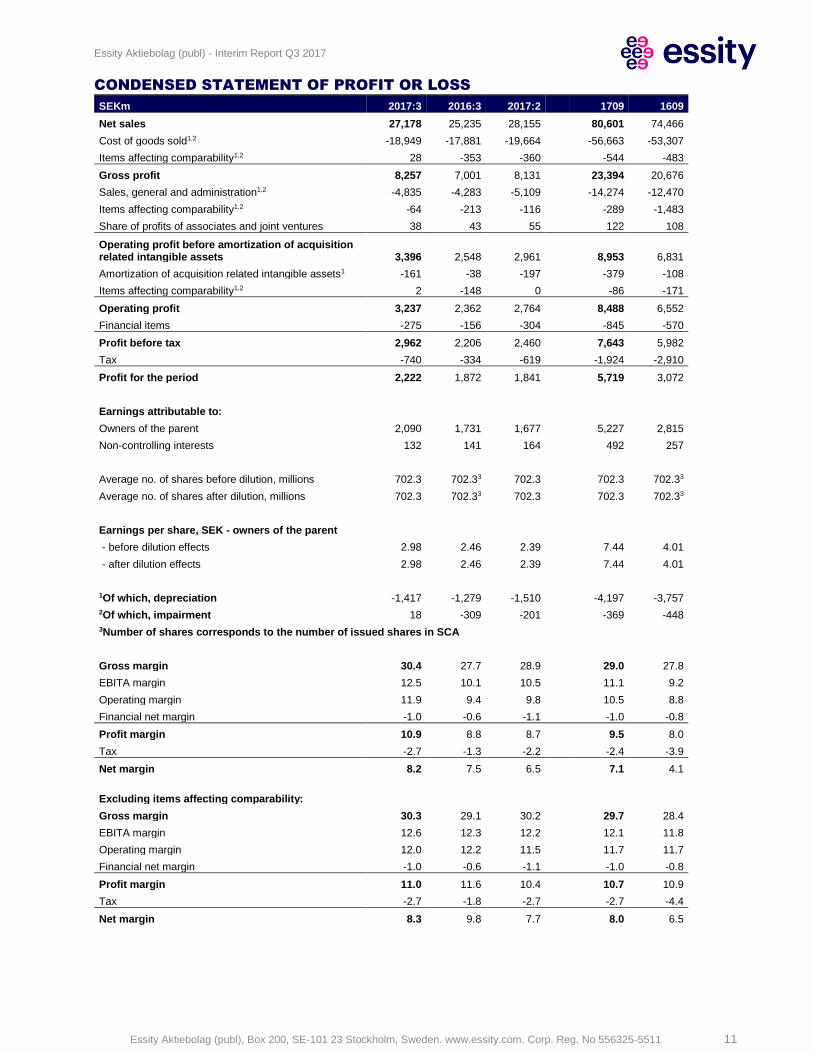
CONDENSED STATEMENT OF PROFIT OR LOSS
SEKm 2017:3 2016:3 2017:2 1709 1609
Net sales 27,178 25,235 28,155 80,601 74,466
Cost of goods sold1,2 -18,949 -17,881 -19,664 -56,663 -53,307
Items affecting comparability1,2 28 -353 -360 -544 -483
Gross profit 8,257 7,001 8,131 23,394 20,676
Sales, general and administration1,2 -4,835 -4,283 -5,109 -14,274 -12,470
Items affecting comparability1,2 -64 -213 -116 -289 -1,483
Share of profits of associates and joint ventures 38 43 55 122 108
Operating profit before amortization of acquisition related intangible assets 3,396 2,548 2,961 8,953 6,831
Amortization of acquisition related intangible assets1 -161 -38 -197 -379 -108
Items affecting comparability1,2 2 -148 0 -86 -171
Operating profit 3,237 2,362 2,764 8,488 6,552
Financial items -275 -156 -304 -845 -570
Profit before tax 2,962 2,206 2,460 7,643 5,982
Tax -740 -334 -619 -1,924 -2,910
Profit for the period 2,222 1,872 1,841 5,719 3,072
Earnings attributable to: Owners of the parent 2,090 1,731 1,677 5,227 2,815
Non-controlling interests 132 141 164 492 257
Average no. of shares before dilution, millions 702.3 702.33 702.3 702.3 702.33
Average no. of shares after dilution, millions 702.3 702.33 702.3 702.3 702.33
Earnings per share, SEK - owners of the parent - before dilution effects 2.98 2.46 2.39 7.44 4.01
- after dilution effects 2.98 2.46 2.39 7.44 4.01
1Of which, depreciation -1,417 -1,279 -1,510 -4,197 -3,757
2Of which, impairment 18 -309 -201 -369 -448
3Number of shares corresponds to the number of issued shares in SCA
Gross margin 30.4 27.7 28.9 29.0 27.8
EBITA margin 12.5 10.1 10.5 11.1 9.2
Operating margin 11.9 9.4 9.8 10.5 8.8
Financial net margin -1.0 -0.6 -1.1 -1.0 -0.8
Profit margin 10.9 8.8 8.7 9.5 8.0
Tax -2.7 -1.3 -2.2 -2.4 -3.9
Net margin 8.2 7.5 6.5 7.1 4.1
Excluding items affecting comparability: Gross margin 30.3 29.1 30.2 29.7 28.4
EBITA margin 12.6 12.3 12.2 12.1 11.8
Operating margin 12.0 12.2 11.5 11.7 11.7
Financial net margin -1.0 -0.6 -1.1 -1.0 -0.8
Profit margin 11.0 11.6 10.4 10.7 10.9
Tax -2.7 -1.8 -2.7 -2.7 -4.4
Net margin 8.3 9.8 7.7 8.0 6.5
Essity Aktiebolag (publ) - Interim Report Q3 2017
Essity Aktiebolag (publ), Box 200, SE-101 23 Stockholm, Sweden. www.essity.com. Corp. Reg. No 556325-5511 12
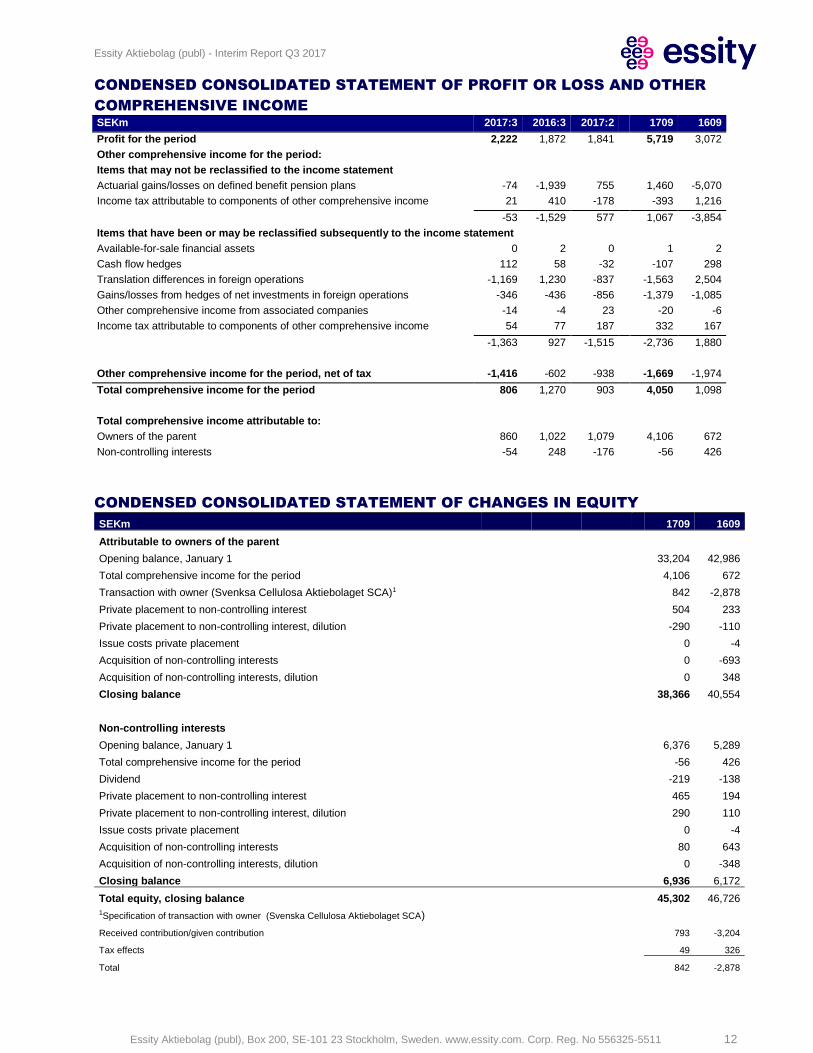
CONDENSED CONSOLIDATED STATEMENT OF PROFIT OR LOSS AND OTHER
COMPREHENSIVE INCOME SEKm 2017:3 2016:3 2017:2 1709 1609
Profit for the period 2,222 1,872 1,841 5,719 3,072
Other comprehensive income for the period:
Items that may not be reclassified to the income statement
Actuarial gains/losses on defined benefit pension plans -74 -1,939 755 1,460 -5,070
Income tax attributable to components of other comprehensive income 21 410 -178 -393 1,216
-53 -1,529 577 1,067 -3,854
Items that have been or may be reclassified subsequently to the income statement
Available-for-sale financial assets 0 2 0 1 2
Cash flow hedges 112 58 -32 -107 298
Translation differences in foreign operations -1,169 1,230 -837 -1,563 2,504
Gains/losses from hedges of net investments in foreign operations -346 -436 -856 -1,379 -1,085
Other comprehensive income from associated companies -14 -4 23 -20 -6
Income tax attributable to components of other comprehensive income 54 77 187 332 167
-1,363 927 -1,515 -2,736 1,880
Other comprehensive income for the period, net of tax -1,416 -602 -938 -1,669 -1,974
Total comprehensive income for the period 806 1,270 903 4,050 1,098
Total comprehensive income attributable to:
Owners of the parent 860 1,022 1,079 4,106 672
Non-controlling interests -54 248 -176 -56 426
CONDENSED CONSOLIDATED STATEMENT OF CHANGES IN EQUITY
SEKm 1709 1609
Attributable to owners of the parent Opening balance, January 1 33,204 42,986
Total comprehensive income for the period 4,106 672
Transaction with owner (Svenksa Cellulosa Aktiebolaget SCA)1 842 -2,878
Private placement to non-controlling interest 504 233
Private placement to non-controlling interest, dilution -290 -110
Issue costs private placement 0 -4
Acquisition of non-controlling interests 0 -693
Acquisition of non-controlling interests, dilution 0 348
Closing balance 38,366 40,554
Non-controlling interests Opening balance, January 1 6,376 5,289
Total comprehensive income for the period -56 426
Dividend -219 -138
Private placement to non-controlling interest 465 194
Private placement to non-controlling interest, dilution 290 110
Issue costs private placement 0 -4
Acquisition of non-controlling interests 80 643
Acquisition of non-controlling interests, dilution 0 -348
Closing balance 6,936 6,172
Total equity, closing balance 45,302 46,726
1Specification of transaction with owner (Svenska Cellulosa Aktiebolaget SCA) Received contribution/given contribution 793 -3,204
Tax effects 49 326
Total 842 -2,878
Essity Aktiebolag (publ) - Interim Report Q3 2017
Essity Aktiebolag (publ), Box 200, SE-101 23 Stockholm, Sweden. www.essity.com. Corp. Reg. No 556325-5511 13
CONSOLIDATED OPERATING CASH FLOW STATEMENT SEKm 1709 1609
Operating cash surplus 13,512 12,308
Change in working capital -1,150 254
Current capital expenditures, net -2,670 -2,386
Restructuring costs, etc. -857 -517
Operating cash flow 8,835 9,659
Financial items -845 -570
Income taxes paid -2,110 -2,913
Other 175 137
Cash flow from current operations 6,055 6,313
Acquisitions -25,932 -6,547
Strategic capital expenditures in non-current assets -1,383 -1,398
Divestments 25 165
Cash flow before dividend -21,235 -1,467
Private placement to non-controlling interest 27 420
Dividend to non-controllling interests -220 -138
Transactions with shareholders 838 -2,625
Net cash flow -20,590 -3,810
Net debt at the start of the period -35,173 -19,058
Net cash flow -20,590 -3,810
Remeasurement to equity 1,462 -5,069
Translation differences 1,189 -199
Net debt at the end of the period -53,112 -28,136
Debt/equity ratio 1.17 0.60
Debt payment capacity, % 24 41
Essity Aktiebolag (publ) - Interim Report Q3 2017
Essity Aktiebolag (publ), Box 200, SE-101 23 Stockholm, Sweden. www.essity.com. Corp. Reg. No 556325-5511 14
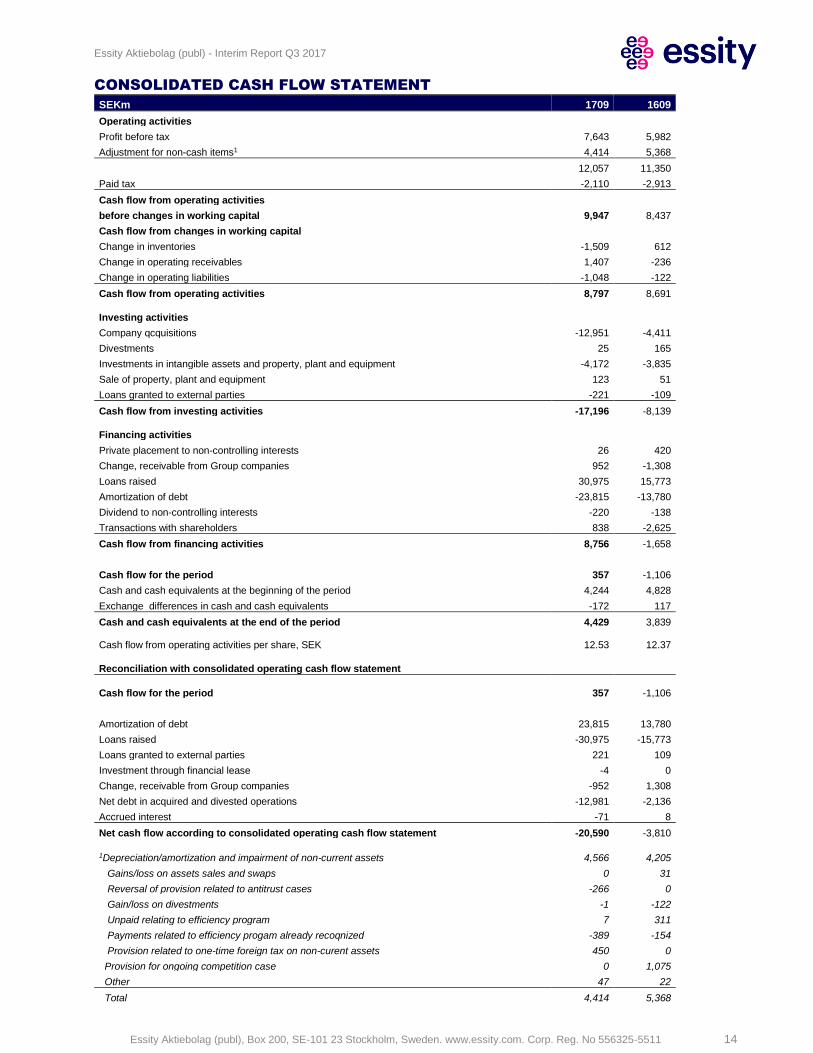
CONSOLIDATED CASH FLOW STATEMENT
SEKm 1709 1609
Operating activities
Profit before tax 7,643 5,982
Adjustment for non-cash items1 4,414 5,368
12,057 11,350
Paid tax -2,110 -2,913
Cash flow from operating activities
before changes in working capital 9,947 8,437
Cash flow from changes in working capital
Change in inventories -1,509 612
Change in operating receivables 1,407 -236
Change in operating liabilities -1,048 -122
Cash flow from operating activities 8,797 8,691
Investing activities
Company qcquisitions -12,951 -4,411
Divestments 25 165
Investments in intangible assets and property, plant and equipment -4,172 -3,835
Sale of property, plant and equipment 123 51
Loans granted to external parties -221 -109
Cash flow from investing activities -17,196 -8,139
Financing activities
Private placement to non-controlling interests 26 420
Change, receivable from Group companies 952 -1,308
Loans raised 30,975 15,773
Amortization of debt -23,815 -13,780
Dividend to non-controlling interests -220 -138
Transactions with shareholders 838 -2,625
Cash flow from financing activities 8,756 -1,658
Cash flow for the period 357 -1,106
Cash and cash equivalents at the beginning of the period 4,244 4,828
Exchange differences in cash and cash equivalents -172 117
Cash and cash equivalents at the end of the period 4,429 3,839
Cash flow from operating activities per share, SEK 12.53 12.37
Reconciliation with consolidated operating cash flow statement
Cash flow for the period 357 -1,106
Amortization of debt 23,815 13,780
Loans raised -30,975 -15,773
Loans granted to external parties 221 109
Investment through financial lease -4 0
Change, receivable from Group companies -952 1,308
Net debt in acquired and divested operations -12,981 -2,136
Accrued interest -71 8
Net cash flow according to consolidated operating cash flow statement -20,590 -3,810
1Depreciation/amortization and impairment of non-current assets 4,566 4,205
Gains/loss on assets sales and swaps 0 31
Reversal of provision related to antitrust cases -266 0
Gain/loss on divestments -1 -122
Unpaid relating to efficiency program 7 311
Payments related to efficiency progam already recoqnized -389 -154
Provision related to one-time foreign tax on non-curent assets 450 0
Provision for ongoing competition case 0 1,075
Other 47 22
Total 4,414 5,368
Essity Aktiebolag (publ) - Interim Report Q3 2017
Essity Aktiebolag (publ), Box 200, SE-101 23 Stockholm, Sweden. www.essity.com. Corp. Reg. No 556325-5511 15
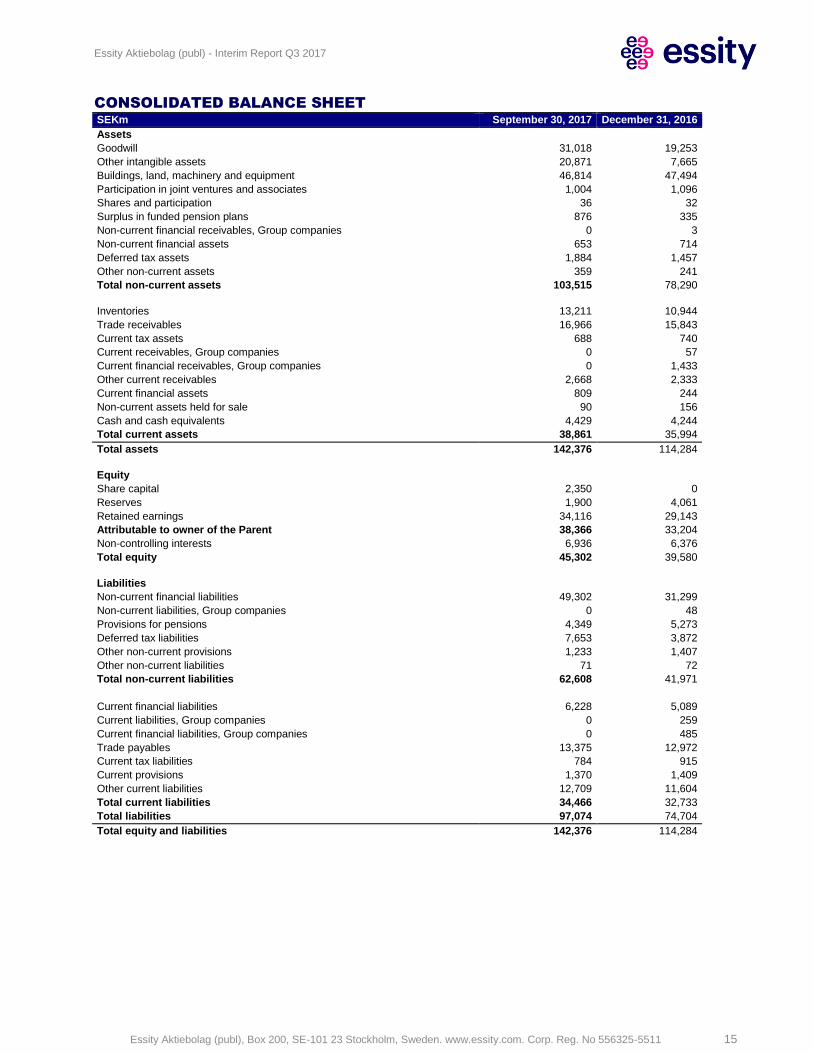
CONSOLIDATED BALANCE SHEET SEKm September 30, 2017 December 31, 2016
Assets
Goodwill 31,018 19,253
Other intangible assets 20,871 7,665
Buildings, land, machinery and equipment 46,814 47,494
Participation in joint ventures and associates 1,004 1,096
Shares and participation 36 32
Surplus in funded pension plans 876 335
Non-current financial receivables, Group companies 0 3
Non-current financial assets 653 714
Deferred tax assets 1,884 1,457
Other non-current assets 359 241
Total non-current assets 103,515 78,290
Inventories 13,211 10,944
Trade receivables 16,966 15,843
Current tax assets 688 740
Current receivables, Group companies 0 57
Current financial receivables, Group companies 0 1,433
Other current receivables 2,668 2,333
Current financial assets 809 244
Non-current assets held for sale 90 156
Cash and cash equivalents 4,429 4,244
Total current assets 38,861 35,994
Total assets 142,376 114,284
Equity
Share capital 2,350 0
Reserves 1,900 4,061
Retained earnings 34,116 29,143
Attributable to owner of the Parent 38,366 33,204
Non-controlling interests 6,936 6,376
Total equity 45,302 39,580
Liabilities
Non-current financial liabilities 49,302 31,299
Non-current liabilities, Group companies 0 48
Provisions for pensions 4,349 5,273
Deferred tax liabilities 7,653 3,872
Other non-current provisions 1,233 1,407
Other non-current liabilities 71 72
Total non-current liabilities 62,608 41,971
Current financial liabilities 6,228 5,089
Current liabilities, Group companies 0 259
Current financial liabilities, Group companies 0 485
Trade payables 13,375 12,972
Current tax liabilities 784 915
Current provisions 1,370 1,409
Other current liabilities 12,709 11,604
Total current liabilities 34,466 32,733
Total liabilities 97,074 74,704
Total equity and liabilities 142,376 114,284
Essity Aktiebolag (publ) - Interim Report Q3 2017
Essity Aktiebolag (publ), Box 200, SE-101 23 Stockholm, Sweden. www.essity.com. Corp. Reg. No 556325-5511 16
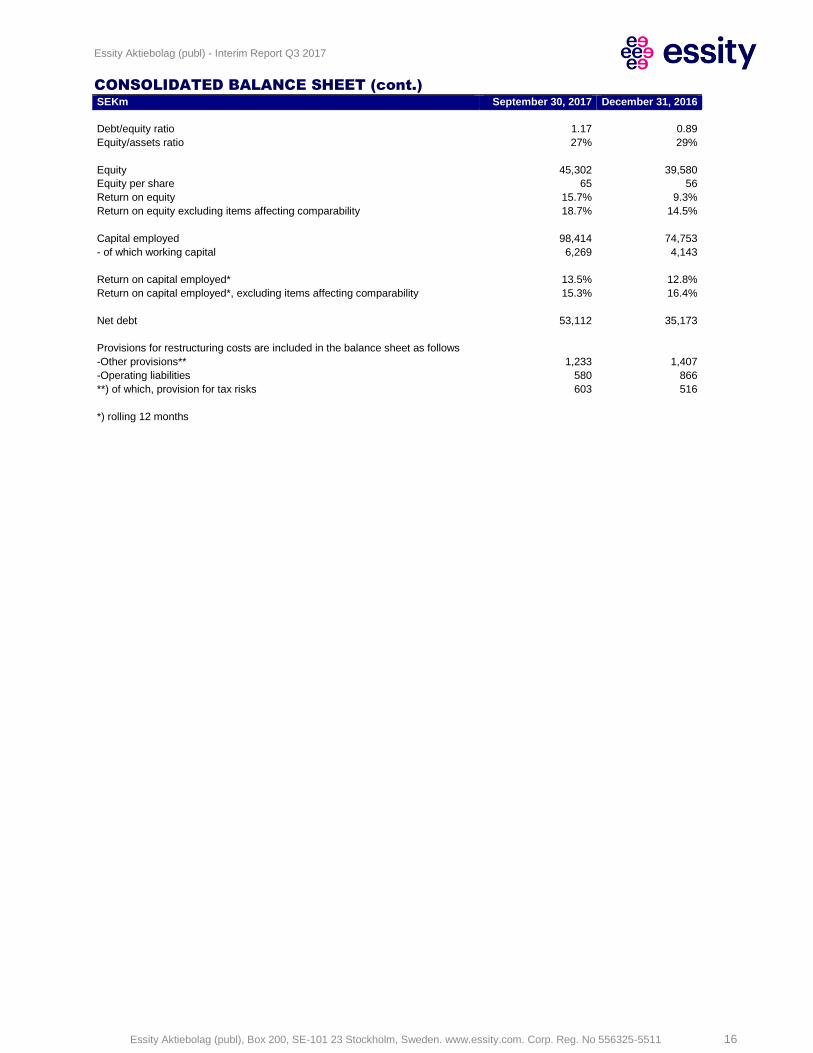
CONSOLIDATED BALANCE SHEET (cont.) SEKm September 30, 2017 December 31, 2016
Debt/equity ratio 1.17 0.89
Equity/assets ratio 27% 29%
Equity 45,302 39,580
Equity per share 65 56
Return on equity 15.7% 9.3%
Return on equity excluding items affecting comparability 18.7% 14.5%
Capital employed 98,414 74,753
- of which working capital 6,269 4,143
Return on capital employed* 13.5% 12.8%
Return on capital employed*, excluding items affecting comparability 15.3% 16.4%
Net debt 53,112 35,173
Provisions for restructuring costs are included in the balance sheet as follows
-Other provisions** 1,233 1,407
-Operating liabilities 580 866
**) of which, provision for tax risks 603 516
*) rolling 12 months
Essity Aktiebolag (publ) - Interim Report Q3 2017
Essity Aktiebolag (publ), Box 200, SE-101 23 Stockholm, Sweden. www.essity.com. Corp. Reg. No 556325-5511 17
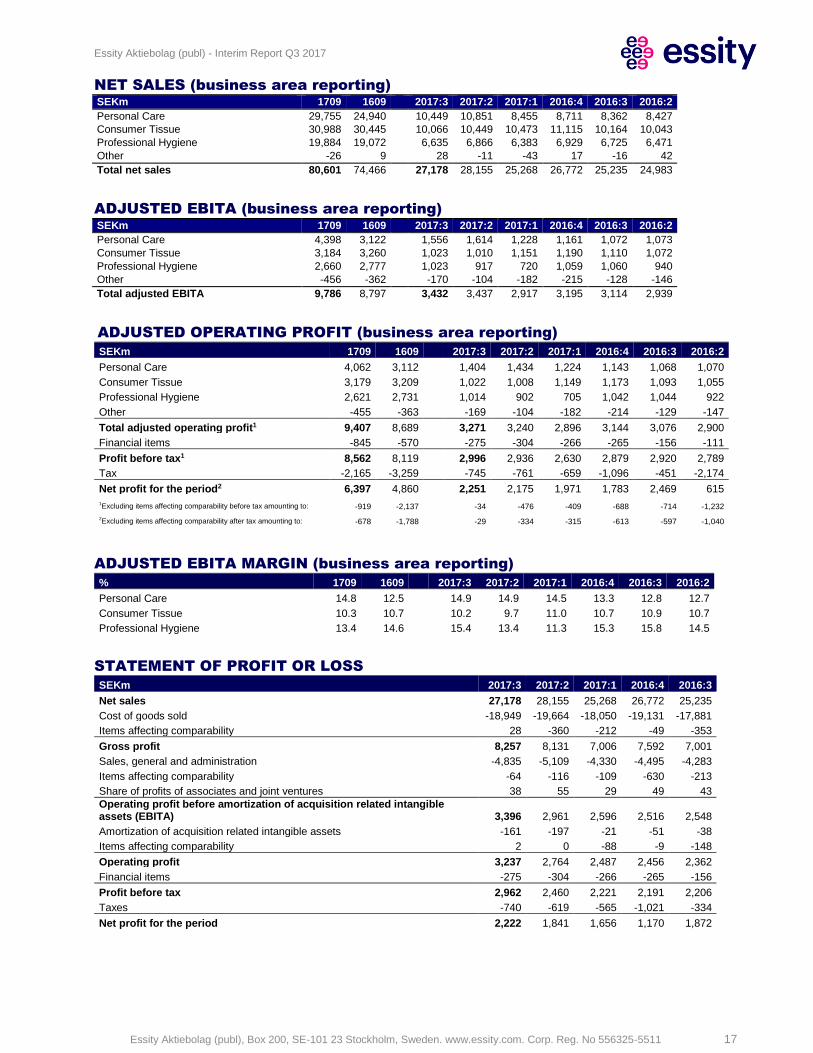
NET SALES (business area reporting) SEKm 1709 1609 2017:3 2017:2 2017:1 2016:4 2016:3 2016:2
Personal Care 29,755 24,940 10,449 10,851 8,455 8,711 8,362 8,427
Consumer Tissue 30,988 30,445 10,066 10,449 10,473 11,115 10,164 10,043
Professional Hygiene 19,884 19,072 6,635 6,866 6,383 6,929 6,725 6,471
Other -26 9 28 -11 -43 17 -16 42
Total net sales 80,601 74,466 27,178 28,155 25,268 26,772 25,235 24,983
ADJUSTED EBITA (business area reporting) SEKm 1709 1609 2017:3 2017:2 2017:1 2016:4 2016:3 2016:2
Personal Care 4,398 3,122 1,556 1,614 1,228 1,161 1,072 1,073
Consumer Tissue 3,184 3,260 1,023 1,010 1,151 1,190 1,110 1,072
Professional Hygiene 2,660 2,777 1,023 917 720 1,059 1,060 940
Other -456 -362 -170 -104 -182 -215 -128 -146
Total adjusted EBITA 9,786 8,797 3,432 3,437 2,917 3,195 3,114 2,939
ADJUSTED OPERATING PROFIT (business area reporting) SEKm 1709 1609 2017:3 2017:2 2017:1 2016:4 2016:3 2016:2
Personal Care 4,062 3,112 1,404 1,434 1,224 1,143 1,068 1,070
Consumer Tissue 3,179 3,209 1,022 1,008 1,149 1,173 1,093 1,055
Professional Hygiene 2,621 2,731 1,014 902 705 1,042 1,044 922
Other -455 -363 -169 -104 -182 -214 -129 -147
Total adjusted operating profit1 9,407 8,689 3,271 3,240 2,896 3,144 3,076 2,900
Financial items -845 -570 -275 -304 -266 -265 -156 -111
Profit before tax1 8,562 8,119 2,996 2,936 2,630 2,879 2,920 2,789
Tax -2,165 -3,259 -745 -761 -659 -1,096 -451 -2,174
Net profit for the period2 6,397 4,860 2,251 2,175 1,971 1,783 2,469 615
1Excluding items affecting comparability before tax amounting to: -919 -2,137
-34 -476 -409 -688 -714 -1,232
2Excluding items affecting comparability after tax amounting to: -678 -1,788
-29 -334 -315 -613 -597 -1,040
ADJUSTED EBITA MARGIN (business area reporting) % 1709 1609 2017:3 2017:2 2017:1 2016:4 2016:3 2016:2
Personal Care 14.8 12.5 14.9 14.9 14.5 13.3 12.8 12.7
Consumer Tissue 10.3 10.7 10.2 9.7 11.0 10.7 10.9 10.7
Professional Hygiene 13.4 14.6 15.4 13.4 11.3 15.3 15.8 14.5
STATEMENT OF PROFIT OR LOSS SEKm 2017:3 2017:2 2017:1 2016:4 2016:3
Net sales 27,178 28,155 25,268 26,772 25,235
Cost of goods sold -18,949 -19,664 -18,050 -19,131 -17,881
Items affecting comparability 28 -360 -212 -49 -353
Gross profit 8,257 8,131 7,006 7,592 7,001
Sales, general and administration -4,835 -5,109 -4,330 -4,495 -4,283
Items affecting comparability -64 -116 -109 -630 -213
Share of profits of associates and joint ventures 38 55 29 49 43
Operating profit before amortization of acquisition related intangible assets (EBITA) 3,396 2,961 2,596 2,516 2,548
Amortization of acquisition related intangible assets -161 -197 -21 -51 -38
Items affecting comparability 2 0 -88 -9 -148
Operating profit 3,237 2,764 2,487 2,456 2,362
Financial items -275 -304 -266 -265 -156
Profit before tax 2,962 2,460 2,221 2,191 2,206
Taxes -740 -619 -565 -1,021 -334
Net profit for the period 2,222 1,841 1,656 1,170 1,872
Essity Aktiebolag (publ) - Interim Report Q3 2017
Essity Aktiebolag (publ), Box 200, SE-101 23 Stockholm, Sweden. www.essity.com. Corp. Reg. No 556325-5511 18
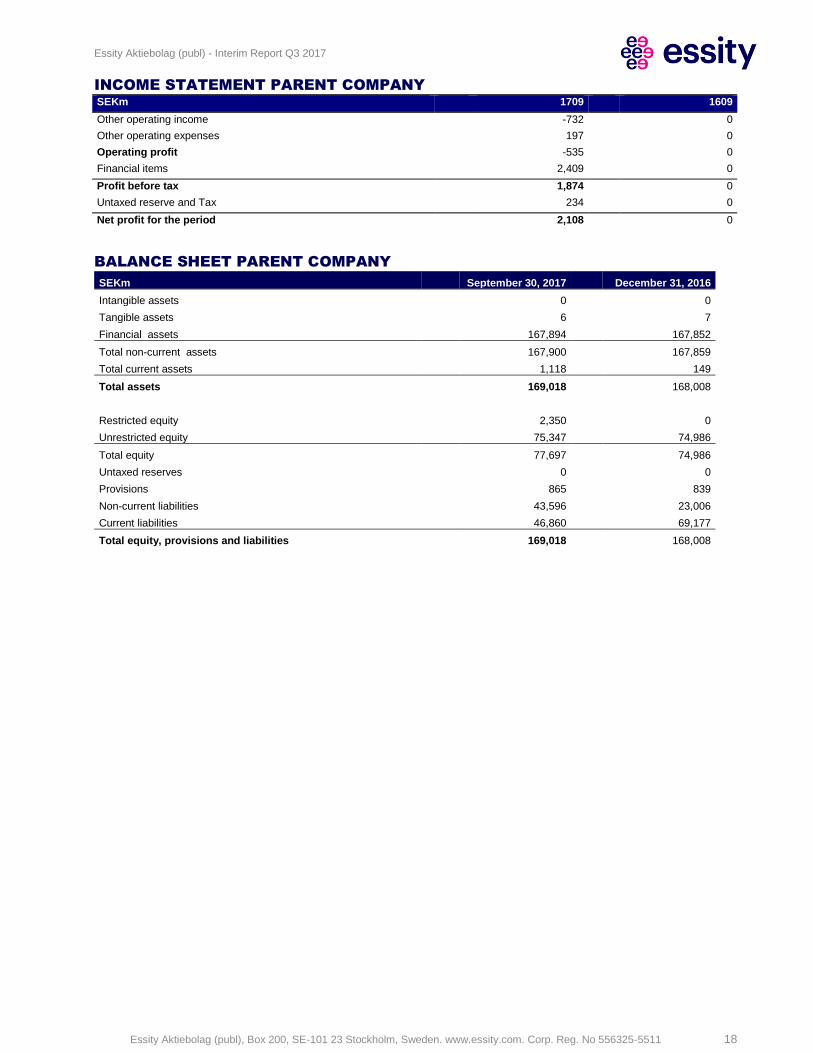
INCOME STATEMENT PARENT COMPANY SEKm 1709 1609
Other operating income -732 0
Other operating expenses 197 0
Operating profit -535 0
Financial items 2,409 0
Profit before tax 1,874 0
Untaxed reserve and Tax 234 0
Net profit for the period 2,108 0
BALANCE SHEET PARENT COMPANY
SEKm September 30, 2017 December 31, 2016
Intangible assets 0 0
Tangible assets 6 7
Financial assets 167,894 167,852
Total non-current assets 167,900 167,859
Total current assets 1,118 149
Total assets 169,018 168,008
Restricted equity 2,350 0
Unrestricted equity 75,347 74,986
Total equity 77,697 74,986
Untaxed reserves 0 0
Provisions 865 839
Non-current liabilities 43,596 23,006
Current liabilities 46,860 69,177
Total equity, provisions and liabilities 169,018 168,008
Essity Aktiebolag (publ) - Interim Report Q3 2017
Essity Aktiebolag (publ), Box 200, SE-101 23 Stockholm, Sweden. www.essity.com. Corp. Reg. No 556325-5511 19
NOTES
1 ACCOUNTING PRINCIPLES
This interim report has been prepared in accordance with IAS 34 and recommendation RFR 1 of the Swedish Financial Reporting Board (RFR), and with regards to the Parent Company, RFR 2. Effective January 1, 2017, Essity applies the following new or amended International Financial Reporting Standards (IFRS):
• Amendments to IAS 12: Recognition of Deferred Tax Assets for Unrealized Losses
• Amendments to IAS 7: Disclosure Initiative These amendments are not judged to have any material impact on the Group’s or Parent Company’s result of operations or financial position. In other respects, the accounting principles and calculation methods applied correspond to those described in the 2016 Annual Report for SCA Hygiene AB. At SCA’s Annual General Meeting on April 5, 2017, it was decided to distribute the hygiene business. Accordingly, a review has been conducted in accordance with IFRS 8 Operating Segments. SCA Hygiene AB decided to divide operations into three segments, with Tissue being split into Consumer Tissue and Professional Hygiene. In addition, Personal Care will continue to form a separate segment and will also include, as of the second quarter 2017, the acquisition BSN medical, Medical Solutions, which is in line with how the new organization will be developed and managed in the future. Comparative periods have been restated in the corresponding manner. SCA Hygiene AB has also decided to continue to present a function-based income statement, but increase the number of lines in the income statement by reporting amortization for acquisition-related intangible assets on a separate line, thereby making it easier to compare results with other companies irrespective of whether business activities are based on acquisitions or organic growth. In addition, the company has decided to introduce EBITA as a subtotal in the consolidated income statement, refer to Note 5 for further information. Effects of new accounting policies IFRS 15 Revenue from Contracts with Customers The standard regulates revenue recognition and disclosure requirements relating to commercial agreements (contracts) in which the delivery of goods/services is divided up into separate identifiable performance obligations that are reported independently. The standard will come into effect on January 1, 2018. A project has been carried out that has examined the following areas: sales of services, variable and fixed discounts, inspection of agreements and when control has been transferred to the customer. In summary, the conclusion was drawn that the new standard will not have any material impact on the Essity Group’s revenue recognition. Due to the non-material effects of the new standard, previous periods will not be restated. During the fourth quarter, the project will continue preparations for the expanded disclosure requirements. IFRS 9 Financial Instruments This is the new standard for financial instruments that will replace IAS 19. The standard will come into effect on January 1, 2018. A project has been carried out focusing on the following areas: classification and documentation of financial liabilities and assets, adaptation of documentation relating to hedge accounting to the new regulations and calculation of effects in connection with the transition to a new model for recognizing anticipated credit losses (expected loss model). In summary, the conclusion was drawn that the new standard will not have any material impact on the Essity Group’s reporting. Due to the insignificant effects of the new standard, previous periods will not be restated. During the fourth quarter, the project will complete the preparations for the changes that will come into effect next year. IFRS 16 Leasing The new standard will be applied as of 1 January 2019 on condition that it is approved by the EU. Essity has commenced preparations for transition to the new standard on January 1, 2019, and intends to implement system support in order to comply with the new requirements. The initial assessment is that the new standard will impact Essity insofar as all rental contracts for premises, vehicles and other large leasing objects will be recognized in the balance sheet.
2 RISKS AND UNCERTAINTIES
Essity’s risk exposure and risk management are described on pages 25-31 of the 2016 SCA Hygiene AB Annual Report. No significant changes have taken place that have affected the reported risks. Risks in conjunction with company acquisitions are analyzed in the due diligence processes that Essity carries out prior to all acquisitions. In cases where acquisitions have been carried out that may affect the assessment of Essity’s risk exposure, these are described under the heading “Other events” in the interim reports. Processes for risk management Essity’s Board determines the Group’s strategic direction based on recommendations from the Executive Management Team. Responsibility for the long-term, overall management of strategic risks corresponds to the company’s delegation structure, from
Essity Aktiebolag (publ) - Interim Report Q3 2017
Essity Aktiebolag (publ), Box 200, SE-101 23 Stockholm, Sweden. www.essity.com. Corp. Reg. No 556325-5511 20
the Board to the CEO and from the CEO to the business unit presidents. This means that most operational risks are managed by Essity’s business units at the local level, but that they are coordinated when considered necessary. The tools used in this coordination consist primarily of the business units’ regular reporting and the annual strategy process, where risks and risk management are a part of the process. Essity’s financial risk management is centralized, as is the Group’s internal bank for the Group companies’ financial transactions and management of the Group’s energy risks. Financial risks are managed in accordance with the Group’s finance policy, which is adopted by Essity’s Board and which – together with Essity’s energy risk policy – makes up a framework for risk management. Risks are aggregated and monitored on a regular basis to ensure compliance with these guidelines. Essity has also centralized other risk management. Essity has a staff function for internal audit, which monitors compliance in the organization with the Group’s policies.
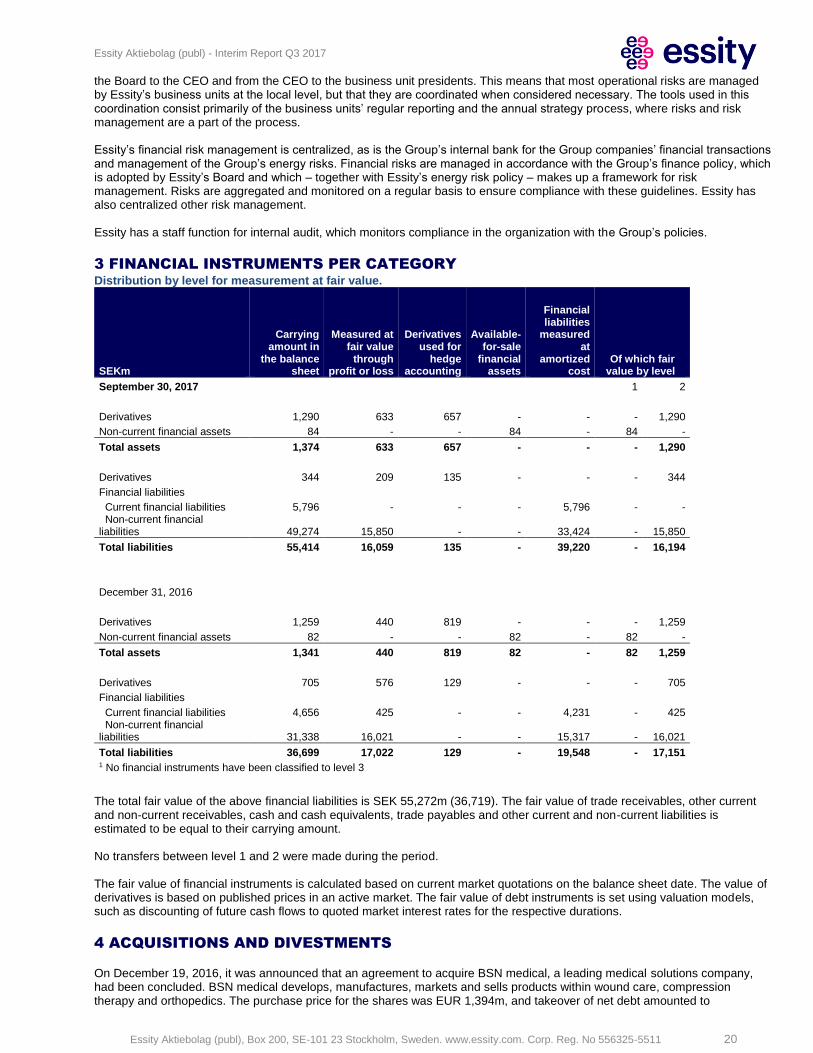
3 FINANCIAL INSTRUMENTS PER CATEGORY
Distribution by level for measurement at fair value.
SEKm
Carrying amount in
the balance sheet
Measured at fair value
through profit or loss
Derivatives used for
hedge accounting
Available-for-sale
financial assets
Financial liabilities
measured at
amortized cost
Of which fair value by level1
September 30, 2017 1 2
Derivatives 1,290 633 657 - - - 1,290
Non-current financial assets 84 - - 84 - 84 -
Total assets 1,374 633 657 - - - 1,290
Derivatives 344 209 135 - - - 344
Financial liabilities Current financial liabilities 5,796 - - - 5,796 - - Non-current financial liabilities 49,274 15,850 - - 33,424 - 15,850
Total liabilities 55,414 16,059 135 - 39,220 - 16,194
December 31, 2016
Derivatives 1,259 440 819 - - - 1,259
Non-current financial assets 82 - - 82 - 82 -
Total assets 1,341 440 819 82 - 82 1,259
Derivatives 705 576 129 - - - 705
Financial liabilities Current financial liabilities 4,656 425 - - 4,231 - 425 Non-current financial liabilities 31,338 16,021 - - 15,317 - 16,021
Total liabilities 36,699 17,022 129 - 19,548 - 17,151 1 No financial instruments have been classified to level 3
The total fair value of the above financial liabilities is SEK 55,272m (36,719). The fair value of trade receivables, other current and non-current receivables, cash and cash equivalents, trade payables and other current and non-current liabilities is estimated to be equal to their carrying amount. No transfers between level 1 and 2 were made during the period. The fair value of financial instruments is calculated based on current market quotations on the balance sheet date. The value of derivatives is based on published prices in an active market. The fair value of debt instruments is set using valuation models, such as discounting of future cash flows to quoted market interest rates for the respective durations.
4 ACQUISITIONS AND DIVESTMENTS On December 19, 2016, it was announced that an agreement to acquire BSN medical, a leading medical solutions company, had been concluded. BSN medical develops, manufactures, markets and sells products within wound care, compression therapy and orthopedics. The purchase price for the shares was EUR 1,394m, and takeover of net debt amounted to
Essity Aktiebolag (publ) - Interim Report Q3 2017
Essity Aktiebolag (publ), Box 200, SE-101 23 Stockholm, Sweden. www.essity.com. Corp. Reg. No 556325-5511 21
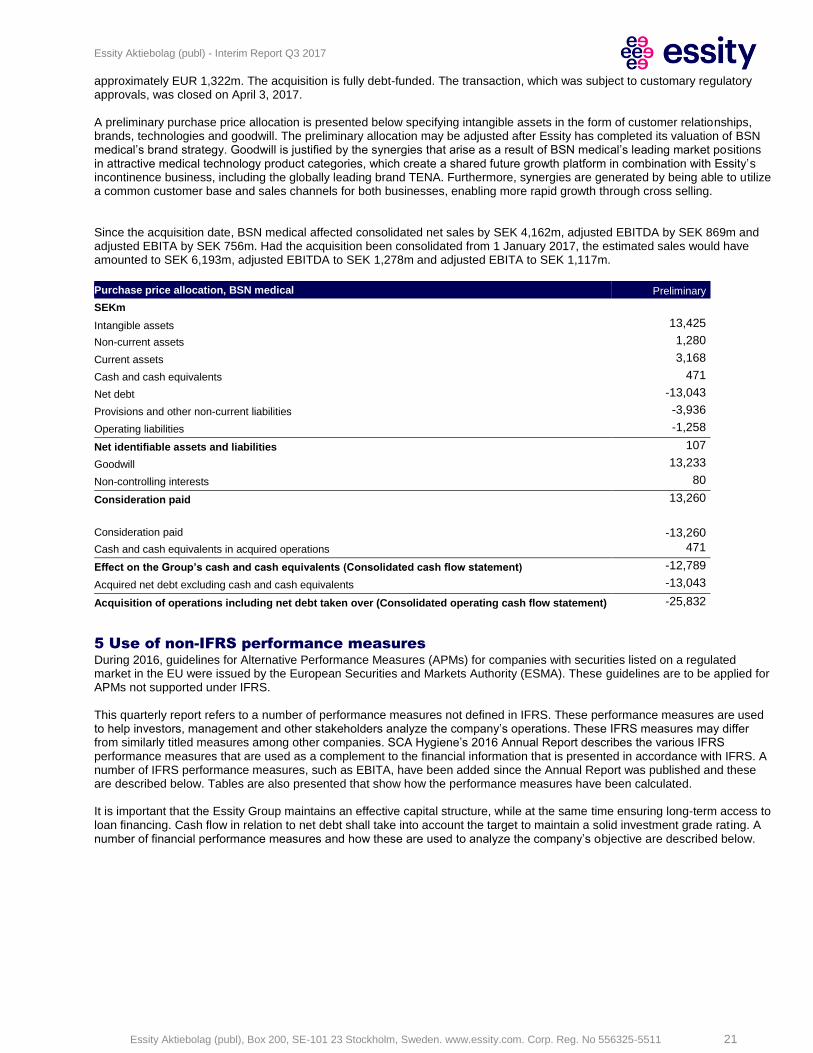
approximately EUR 1,322m. The acquisition is fully debt-funded. The transaction, which was subject to customary regulatory approvals, was closed on April 3, 2017. A preliminary purchase price allocation is presented below specifying intangible assets in the form of customer relationships, brands, technologies and goodwill. The preliminary allocation may be adjusted after Essity has completed its valuation of BSN medical’s brand strategy. Goodwill is justified by the synergies that arise as a result of BSN medical’s leading market positions in attractive medical technology product categories, which create a shared future growth platform in combination with Essity’s incontinence business, including the globally leading brand TENA. Furthermore, synergies are generated by being able to utilize a common customer base and sales channels for both businesses, enabling more rapid growth through cross selling. Since the acquisition date, BSN medical affected consolidated net sales by SEK 4,162m, adjusted EBITDA by SEK 869m and adjusted EBITA by SEK 756m. Had the acquisition been consolidated from 1 January 2017, the estimated sales would have amounted to SEK 6,193m, adjusted EBITDA to SEK 1,278m and adjusted EBITA to SEK 1,117m.
Purchase price allocation, BSN medical Preliminary
SEKm
Intangible assets 13,425
Non-current assets 1,280
Current assets 3,168
Cash and cash equivalents 471
Net debt -13,043
Provisions and other non-current liabilities -3,936
Operating liabilities -1,258
Net identifiable assets and liabilities 107
Goodwill 13,233
Non-controlling interests 80
Consideration paid 13,260
Consideration paid -13,260
Cash and cash equivalents in acquired operations 471
Effect on the Group’s cash and cash equivalents (Consolidated cash flow statement) -12,789
Acquired net debt excluding cash and cash equivalents -13,043
Acquisition of operations including net debt taken over (Consolidated operating cash flow statement) -25,832
5 Use of non-IFRS performance measures
During 2016, guidelines for Alternative Performance Measures (APMs) for companies with securities listed on a regulated market in the EU were issued by the European Securities and Markets Authority (ESMA). These guidelines are to be applied for APMs not supported under IFRS. This quarterly report refers to a number of performance measures not defined in IFRS. These performance measures are used to help investors, management and other stakeholders analyze the company’s operations. These IFRS measures may differ from similarly titled measures among other companies. SCA Hygiene’s 2016 Annual Report describes the various IFRS performance measures that are used as a complement to the financial information that is presented in accordance with IFRS. A number of IFRS performance measures, such as EBITA, have been added since the Annual Report was published and these are described below. Tables are also presented that show how the performance measures have been calculated. It is important that the Essity Group maintains an effective capital structure, while at the same time ensuring long-term access to loan financing. Cash flow in relation to net debt shall take into account the target to maintain a solid investment grade rating. A number of financial performance measures and how these are used to analyze the company’s objective are described below.
Essity Aktiebolag (publ) - Interim Report Q3 2017
Essity Aktiebolag (publ), Box 200, SE-101 23 Stockholm, Sweden. www.essity.com. Corp. Reg. No 556325-5511 22
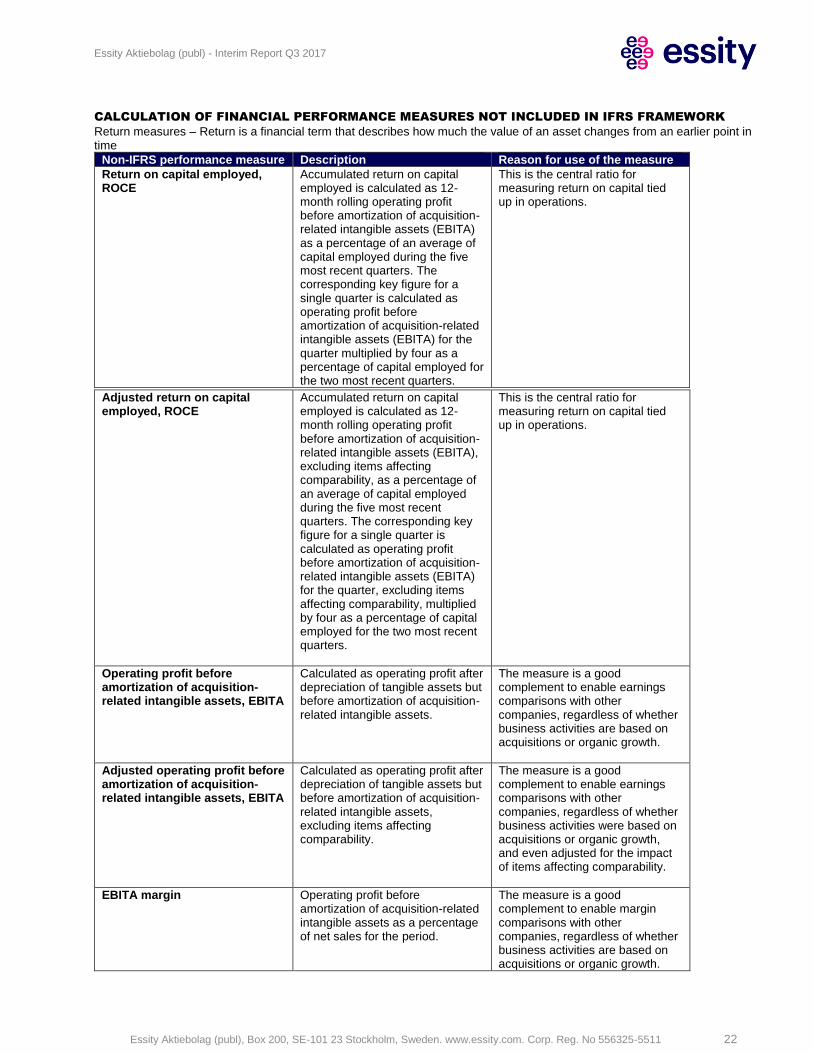
CALCULATION OF FINANCIAL PERFORMANCE MEASURES NOT INCLUDED IN IFRS FRAMEWORK
Return measures – Return is a financial term that describes how much the value of an asset changes from an earlier point in time
Non-IFRS performance measure Description Reason for use of the measure
Return on capital employed, ROCE
Accumulated return on capital employed is calculated as 12-month rolling operating profit before amortization of acquisition-related intangible assets (EBITA) as a percentage of an average of capital employed during the five most recent quarters. The corresponding key figure for a single quarter is calculated as operating profit before amortization of acquisition-related intangible assets (EBITA) for the quarter multiplied by four as a percentage of capital employed for the two most recent quarters.
This is the central ratio for measuring return on capital tied up in operations.
Adjusted return on capital employed, ROCE
Accumulated return on capital employed is calculated as 12-month rolling operating profit before amortization of acquisition-related intangible assets (EBITA), excluding items affecting comparability, as a percentage of an average of capital employed during the five most recent quarters. The corresponding key figure for a single quarter is calculated as operating profit before amortization of acquisition-related intangible assets (EBITA) for the quarter, excluding items affecting comparability, multiplied by four as a percentage of capital employed for the two most recent quarters.
This is the central ratio for measuring return on capital tied up in operations.
Operating profit before amortization of acquisition-related intangible assets, EBITA
Calculated as operating profit after depreciation of tangible assets but before amortization of acquisition-related intangible assets.
The measure is a good complement to enable earnings comparisons with other companies, regardless of whether business activities are based on acquisitions or organic growth.
Adjusted operating profit before amortization of acquisition-related intangible assets, EBITA
Calculated as operating profit after depreciation of tangible assets but before amortization of acquisition-related intangible assets, excluding items affecting comparability.
The measure is a good complement to enable earnings comparisons with other companies, regardless of whether business activities were based on acquisitions or organic growth, and even adjusted for the impact of items affecting comparability.
EBITA margin Operating profit before amortization of acquisition-related intangible assets as a percentage of net sales for the period.
The measure is a good complement to enable margin comparisons with other companies, regardless of whether business activities are based on acquisitions or organic growth.
Essity Aktiebolag (publ) - Interim Report Q3 2017
Essity Aktiebolag (publ), Box 200, SE-101 23 Stockholm, Sweden. www.essity.com. Corp. Reg. No 556325-5511 23
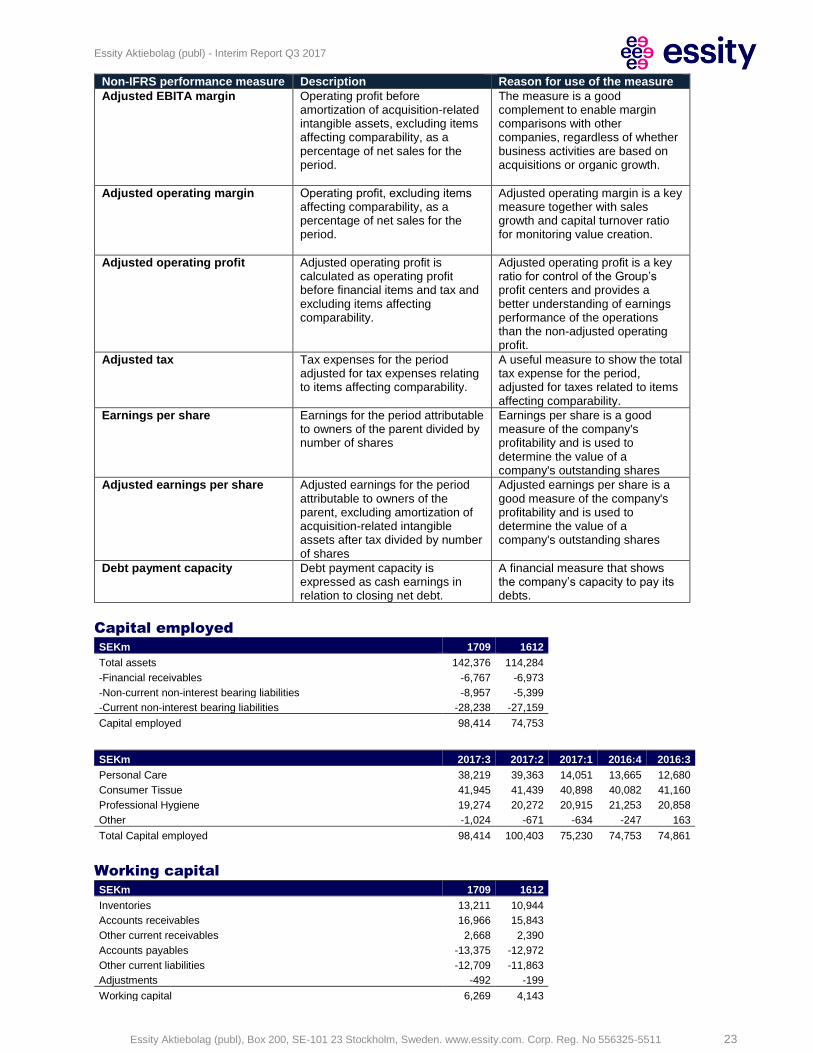
Non-IFRS performance measure Description Reason for use of the measure
Adjusted EBITA margin Operating profit before amortization of acquisition-related intangible assets, excluding items affecting comparability, as a percentage of net sales for the period.
The measure is a good complement to enable margin comparisons with other companies, regardless of whether business activities are based on acquisitions or organic growth.
Adjusted operating margin Operating profit, excluding items affecting comparability, as a percentage of net sales for the period.
Adjusted operating margin is a key measure together with sales growth and capital turnover ratio for monitoring value creation.
Adjusted operating profit Adjusted operating profit is calculated as operating profit before financial items and tax and excluding items affecting comparability.
Adjusted operating profit is a key ratio for control of the Group’s profit centers and provides a better understanding of earnings performance of the operations than the non-adjusted operating profit.
Adjusted tax Tax expenses for the period adjusted for tax expenses relating to items affecting comparability.
A useful measure to show the total tax expense for the period, adjusted for taxes related to items affecting comparability.
Earnings per share Earnings for the period attributable to owners of the parent divided by number of shares
Earnings per share is a good measure of the company's profitability and is used to determine the value of a company's outstanding shares
Adjusted earnings per share Adjusted earnings for the period attributable to owners of the parent, excluding amortization of acquisition-related intangible assets after tax divided by number of shares
Adjusted earnings per share is a good measure of the company's profitability and is used to determine the value of a company's outstanding shares
Debt payment capacity Debt payment capacity is expressed as cash earnings in relation to closing net debt.
A financial measure that shows the company’s capacity to pay its debts.
Capital employed SEKm 1709 1612
Total assets 142,376 114,284
-Financial receivables -6,767 -6,973
-Non-current non-interest bearing liabilities -8,957 -5,399
-Current non-interest bearing liabilities -28,238 -27,159
Capital employed 98,414 74,753
SEKm 2017:3 2017:2 2017:1 2016:4 2016:3
Personal Care 38,219 39,363 14,051 13,665 12,680
Consumer Tissue 41,945 41,439 40,898 40,082 41,160
Professional Hygiene 19,274 20,272 20,915 21,253 20,858
Other -1,024 -671 -634 -247 163
Total Capital employed 98,414 100,403 75,230 74,753 74,861
Working capital SEKm 1709 1612
Inventories 13,211 10,944
Accounts receivables 16,966 15,843
Other current receivables 2,668 2,390
Accounts payables -13,375 -12,972
Other current liabilities -12,709 -11,863
Adjustments -492 -199
Working capital 6,269 4,143
Essity Aktiebolag (publ) - Interim Report Q3 2017
Essity Aktiebolag (publ), Box 200, SE-101 23 Stockholm, Sweden. www.essity.com. Corp. Reg. No 556325-5511 24
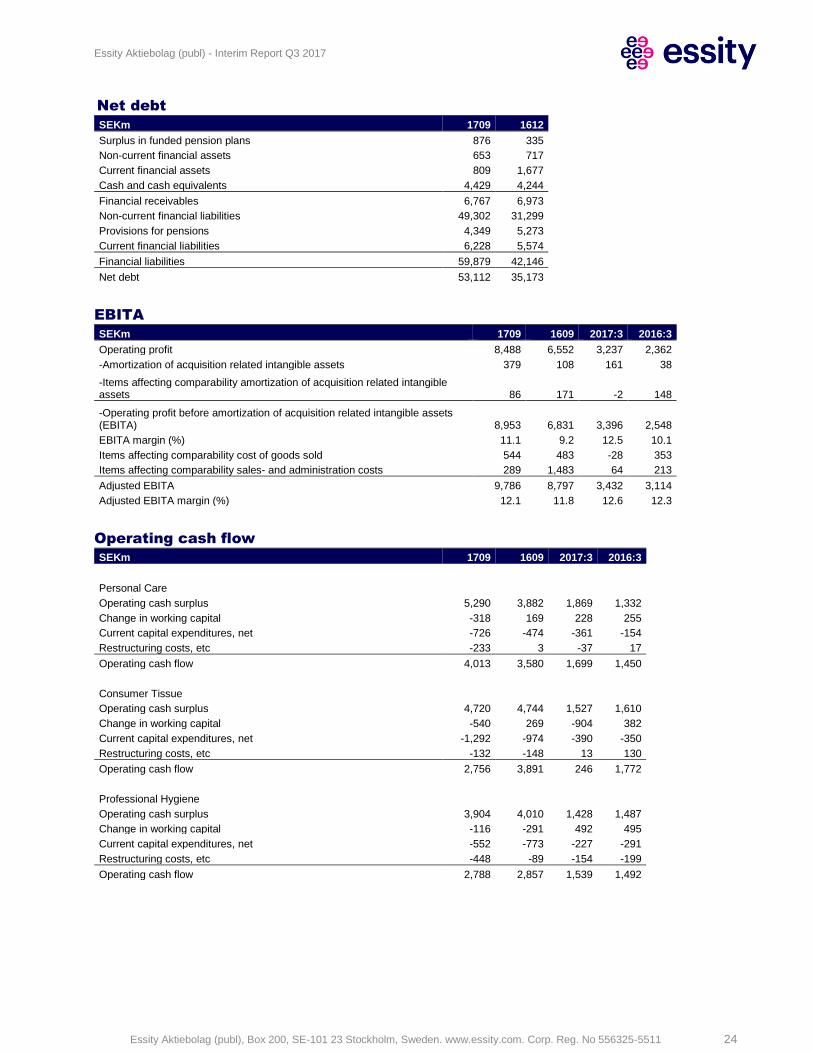
Net debt SEKm 1709 1612
Surplus in funded pension plans 876 335
Non-current financial assets 653 717
Current financial assets 809 1,677
Cash and cash equivalents 4,429 4,244
Financial receivables 6,767 6,973
Non-current financial liabilities 49,302 31,299
Provisions for pensions 4,349 5,273
Current financial liabilities 6,228 5,574
Financial liabilities 59,879 42,146
Net debt 53,112 35,173
EBITA
SEKm 1709 1609 2017:3 2016:3
Operating profit 8,488 6,552 3,237 2,362
-Amortization of acquisition related intangible assets 379 108 161 38
-Items affecting comparability amortization of acquisition related intangible assets 86 171 -2 148
-Operating profit before amortization of acquisition related intangible assets (EBITA) 8,953 6,831 3,396 2,548
EBITA margin (%) 11.1 9.2 12.5 10.1
Items affecting comparability cost of goods sold 544 483 -28 353
Items affecting comparability sales- and administration costs 289 1,483 64 213
Adjusted EBITA 9,786 8,797 3,432 3,114
Adjusted EBITA margin (%) 12.1 11.8 12.6 12.3
Operating cash flow SEKm 1709 1609 2017:3 2016:3
Personal Care Operating cash surplus 5,290 3,882 1,869 1,332
Change in working capital -318 169 228 255
Current capital expenditures, net -726 -474 -361 -154
Restructuring costs, etc -233 3 -37 17
Operating cash flow 4,013 3,580 1,699 1,450
Consumer Tissue Operating cash surplus 4,720 4,744 1,527 1,610
Change in working capital -540 269 -904 382
Current capital expenditures, net -1,292 -974 -390 -350
Restructuring costs, etc -132 -148 13 130
Operating cash flow 2,756 3,891 246 1,772
Professional Hygiene Operating cash surplus 3,904 4,010 1,428 1,487
Change in working capital -116 -291 492 495
Current capital expenditures, net -552 -773 -227 -291
Restructuring costs, etc -448 -89 -154 -199
Operating cash flow 2,788 2,857 1,539 1,492
Essity Aktiebolag (publ) - Interim Report Q3 2017
Essity Aktiebolag (publ), Box 200, SE-101 23 Stockholm, Sweden. www.essity.com. Corp. Reg. No 556325-5511 25
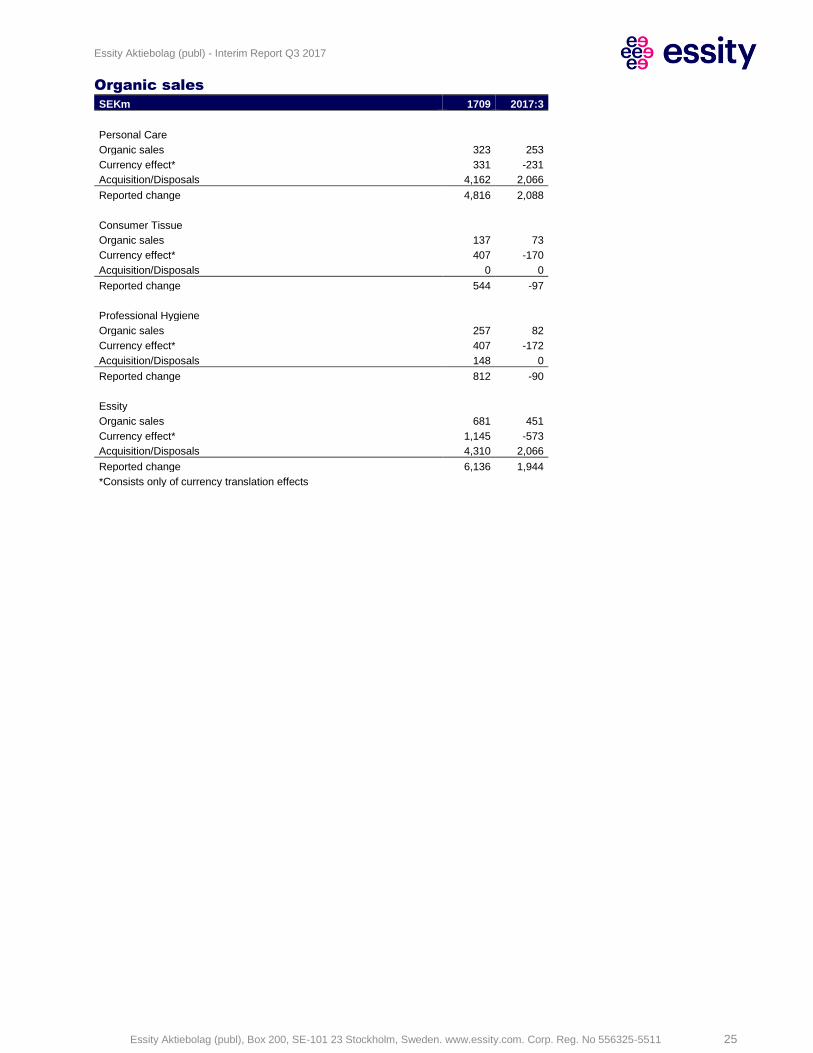
Organic sales
SEKm 1709 2017:3
Personal Care Organic sales 323 253
Currency effect* 331 -231
Acquisition/Disposals 4,162 2,066
Reported change 4,816 2,088
Consumer Tissue Organic sales 137 73
Currency effect* 407 -170
Acquisition/Disposals 0 0
Reported change 544 -97
Professional Hygiene Organic sales 257 82
Currency effect* 407 -172
Acquisition/Disposals 148 0
Reported change 812 -90
Essity Organic sales 681 451
Currency effect* 1,145 -573
Acquisition/Disposals 4,310 2,066
Reported change 6,136 1,944
*Consists only of currency translation effects