Embed Size (px)
Citation preview
ESSnet Use of Administrative and Accounts Data in Business Statistics Work Package 2:
a: Checklist to assist Member States when investigating the usefulness of administrative data
b: Checklist for the quality of administrative data inputs
1
ESSnet
Use of Administrative and Accounts Data
in Business Statistics
Deliverable 2.2 – SGA 2011
Reference Document Section 2
ESSnet Use of Administrative and Accounts Data in Business Statistics Work Package 2:
a: Checklist to assist Member States when investigating the usefulness of administrative data
b: Checklist for the quality of administrative data inputs
2
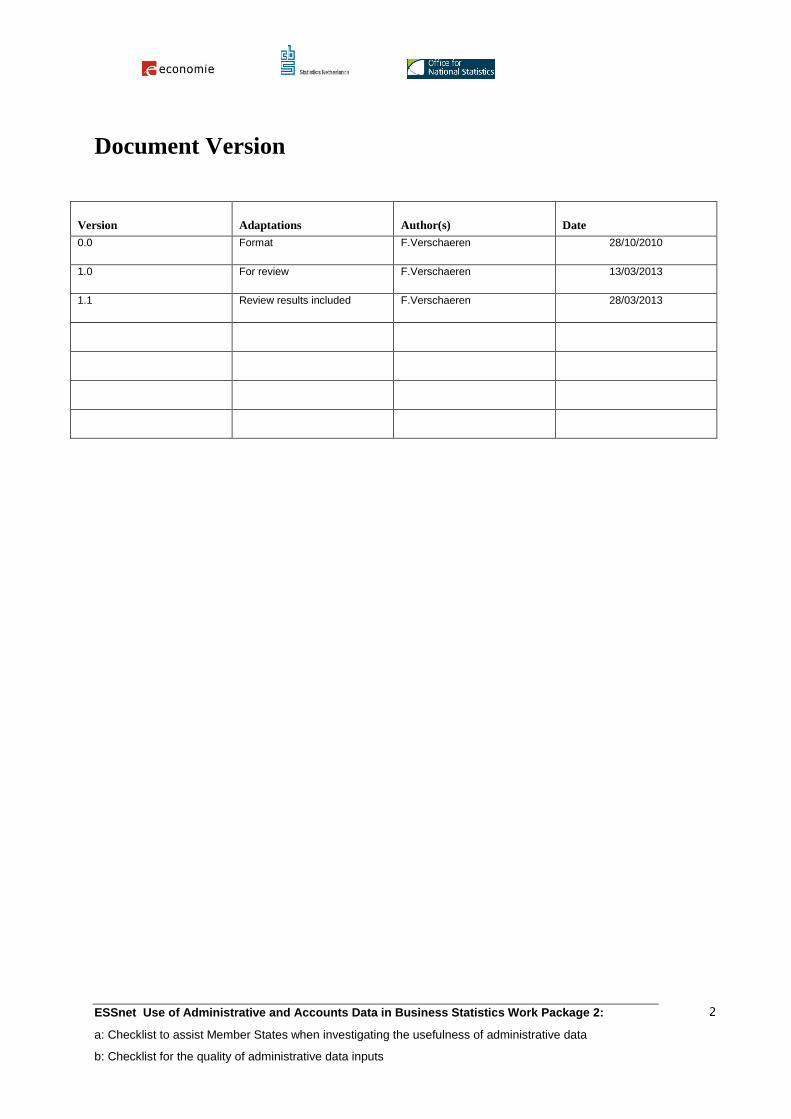
Document Version
Version Adaptations Author(s) Date
0.0 Format F.Verschaeren 28/10/2010
1.0 For review F.Verschaeren 13/03/2013
1.1 Review results included F.Verschaeren 28/03/2013
ESSnet Use of Administrative and Accounts Data in Business Statistics Work Package 2:
a: Checklist to assist Member States when investigating the usefulness of administrative data
b: Checklist for the quality of administrative data inputs
3
Contents
2. Investigating the Potential Use of New Sources
2.1. Checking whether a New Data Source is Useful
2.2. Contacting the Administrative Data Holder
2.3. Keeping a Repository of Information on Administrative Data Sources

ESSnet Use of Administrative and Accounts Data in Business Statistics Work Package 2:
a: Checklist to assist Member States when investigating the usefulness of administrative data
b: Checklist for the quality of administrative data inputs
4
2. Investigating the Potential Use of New Sources
ESSnet Use of Administrative and Accounts Data in Business Statistics Work Package 2:
a: Checklist to assist Member States when investigating the usefulness of administrative data
b: Checklist for the quality of administrative data inputs
5
2.1 Checking whether a New Data Source is Useful
National Statistical Institutes (NSI’s) need data for the production of statistics. Apart from data
obtained through surveys, NSI’s are increasingly using data collected and maintained by other,
non-statistical, organizations. Administrative data (i.e. registers) is an example of such a data
source1 . It is produced as a result of administrative processes of organizations but it is -very
often- also an interesting data source for NSI’s. During the last decade, more and more NSI’s
have realized this2. An important trigger to use administrative data for statistics is the reduction
of the costs of data collection and the administrative burden on persons and businesses.
To enable an NSI to use administrative sources, relevant sources need to be available in the
home country of the NSI. To enable the use of administrative data sources on a regular basis
several preconditions have to be met as well2. These are: 1) legal foundation for the use of
administrative sources, 2) public understanding and approval of the benefits of using
administrative sources for statistical purposes, 3) the availability of an unified identification
system across the different sources used, 4) comprehensive and reliable systems in public
administrations and 5) cooperation among the administrative authorities.
When the prerequisites described above are met the statistical usability of administrative sources
becomes an important issue. The usability is essentially determined by the quality of: i) the
contact and stability of the delivery of the source, ii) the data gathering process and the metadata
definitions used by the data source holder and iii) the data in the source. For new data sources,
sources that have never been used by the NSI, evaluation of the first two quality components is
not very well standardized3.
Because the data source holder defines the units and variables, takes care of data collection, and
processes the data, an NSI may be surprised by the quality of the data in the source when it is
used for the first time1. Before any NSI decides to use administrative data for business statistics,
some preparatory work has to be done. The NSI has to examine a number of issues such as: i)
which variables are available and how are these defined, ii) which businesses are covered and
which are missing, iii) if and how the data is checked and edited by the data source holder, iv)
whether there are discrepancies between statistical, legal and administrative units, and v) the
timeliness of the delivery.
1 Wallgren, A., Wallgren, B. (2007). Register-based Statistics: Administrative Data for Statistical Purposes. John
Wiley & Sons, Chichester, UK 2 Unece (2007). Register-based statistics in the Nordic countries – Review of best practices with focus on population
and social statistics. United Nations Publication, Geneva, Switzerland. 3 Daas, P.J.H., Ossen, S.J.L., Tennekes, M. (2010) Determination of administrative data quality: recent results and
new developments. Paper for the European Conference on Quality in Official Statistics 2010, Helsinki, Finland.
ESSnet Use of Administrative and Accounts Data in Business Statistics Work Package 2:
a: Checklist to assist Member States when investigating the usefulness of administrative data
b: Checklist for the quality of administrative data inputs
6
Different users can have different requirements regarding coverage, timeliness, precision or even
variable definitions. For that reason it is not always desirable or even possible to have one
standard check of the data source that answers all possible questions of potential users. By
dividing the evaluation in two parts: one quick evaluation of the elements that are vital to any
user and a second evaluation that is more closely related to specific user needs, the NSI can:
- avoid to waste time on inspecting data sets that are not suitable for use
- divide the checking in documented and re-usable blocks, promoting the sharing of knowledge
making it easier for every consequent potential user of the data to draw on the work that has
already been done.
To make this possible, two checklists have been developed. The first, a pre-evaluation checklist
offers a sort of gate-keeping function. Using the data in the NSI can only be considered if the
outcome of the checking procedure is positive. A second, usage-specific checklist caters to the
needs of users who want to create a specific output. They go through their own instance of the
procedure.
2.1.1 The pre-evaluation checklist
Purpose of the checklist
The checklist has been developed to enable NSI’s to quickly evaluate the essential metadata
quality components of an administrative data source in a standardized way. The term metadata
quality is used in this paper to identify all quality components of an administrative source that
are relevant for statistical use; these are all quality components minus those identified for the
quality of the data. As such, it includes components such as those related to delivery and
conceptual metadata4. The checklist developed is intended to i) evaluate the metadata quality of
new data sources, the pre-evaluation use, and to ii) evaluate the metadata quality of sources
already used, the re-evaluation purpose. For convenience the checklist is referred to as the pre-
evaluation checklist.
Because metadata quality is a very broad field5 a selection of essential metadata topics has been
made that needed to be included in the checklist. The issues on which the checklist specifically
focuses are areas that, when problems occur, will seriously affect the (potential) statistical
usability of the source. If a problem is found in one or more of those areas, the NSI should
seriously consider not to (or no longer) use the data source for the production of statistics. The
key issues identified for the metadata of administrative sources are:
4 Daas, P.J.H., Ossen, S.J.L. (2011) Metadata Quality Evaluation of Secondary Data Sources. International Journal
for Quality Research, 5 (2), 57-66. 5 Daas, P.J.H., Van Nederpelt, P.W.M. (2010) Application of the object oriented quality management model to
secondary data sources. Discussion paper 10012, Statistics Netherlands, The Hague/Heerlen, The Netherlands.
ESSnet Use of Administrative and Accounts Data in Business Statistics Work Package 2:
a: Checklist to assist Member States when investigating the usefulness of administrative data
b: Checklist for the quality of administrative data inputs
7
1) Descriptive and contact information of the source,
2) Content and conceptual metadata information for units and variables in the source,
including information on the time period covered,
3) Delivery and costs related information, including legal aspects.
Composition of the checklist
Based on previous work of Statistics Netherlands3 a checklist was drawn up with the aim of pre-
evaluating an administrative data sources for statistical purposes in a quick and standardized
way. The first version of the checklist was reviewed by several methodologists of the Statistics
Netherlands questionnaire lab and by the WP2-members of the ESSnet on Admin Data.
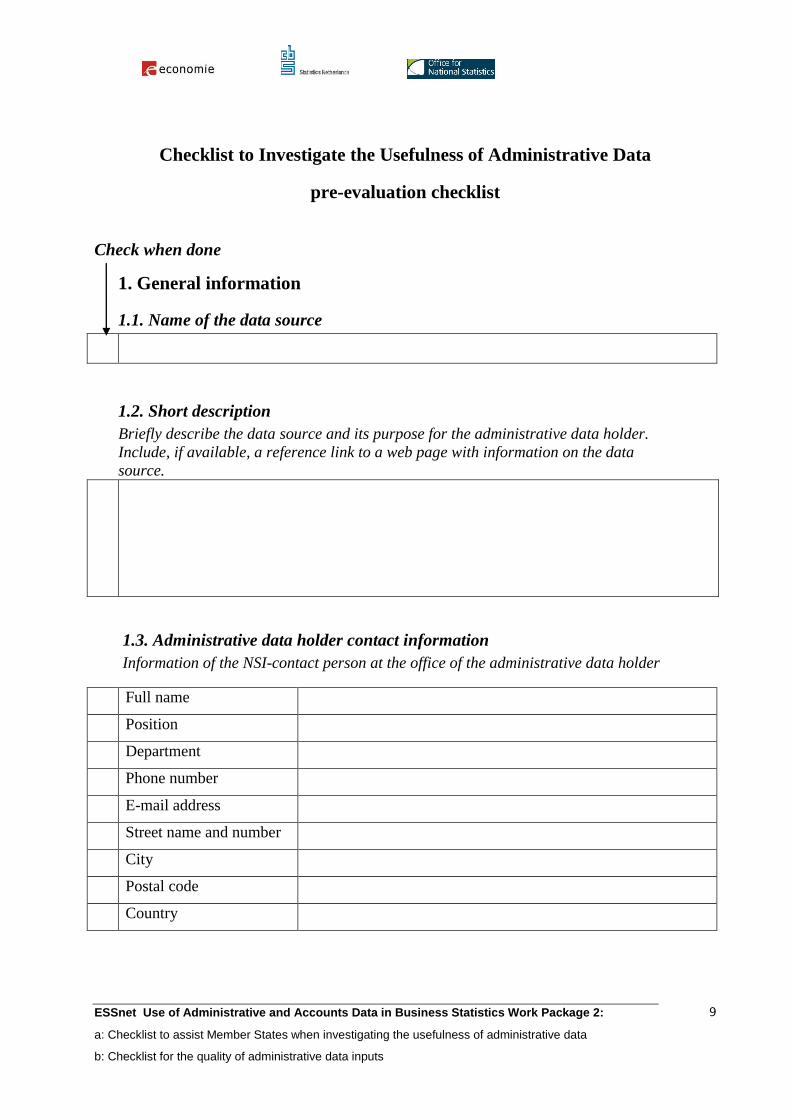
The checklist created guides the user through a limited number of questions. First general
information, like the name of the data source and the administrative data holder including contact
information, needs to be provided. After that, questions are asked about the data content of the
source. A short description of the most important units, variables, and events should be given,
together with information on unique keys and time references. At this stage, the findings in the
first two sections of the checklist are evaluated. When the outcome of the general and content
part of the checklist is negative, the evaluation must be halted: there is no need to go further at
that moment. Missing information should be collected before continuing. Otherwise, the third
and last section needs to be filled in. This section contains questions about delivery related
information. Here, a comparison is made between the needs of the NSI and the delivery options
of the data holder. Costs and legal aspects are also included in this part.
The majority of the questions in the checklist are answered by selecting an option in a limited set
of predefined answers; this is done by checking a box. For questions were this is not possible, a
short answer has to be written down. The answers given determine the outcome of the potential
usefulness of a data source for specific key metadata quality components. To enable users to add
remarks, additional space is included in the checklist.
ESSnet Use of Administrative and Accounts Data in Business Statistics Work Package 2:
a: Checklist to assist Member States when investigating the usefulness of administrative data
b: Checklist for the quality of administrative data inputs
8
Checklist to Investigate the Usefulness of Administrative Data
Pre-evaluation checklist
ESSnet Use of Administrative and Accounts Data in Business Statistics Work Package 2:
a: Checklist to assist Member States when investigating the usefulness of administrative data
b: Checklist for the quality of administrative data inputs
9
Checklist to Investigate the Usefulness of Administrative Data
pre-evaluation checklist
Check when done
1. General information
1.1. Name of the data source
1.2. Short description
Briefly describe the data source and its purpose for the administrative data holder.
Include, if available, a reference link to a web page with information on the data
source.
1.3. Administrative data holder contact information
Information of the NSI-contact person at the office of the administrative data holder
Full name
Position
Department
Phone number
E-mail address
Street name and number
City
Postal code
Country
ESSnet Use of Administrative and Accounts Data in Business Statistics Work Package 2:
a: Checklist to assist Member States when investigating the usefulness of administrative data
b: Checklist for the quality of administrative data inputs
10
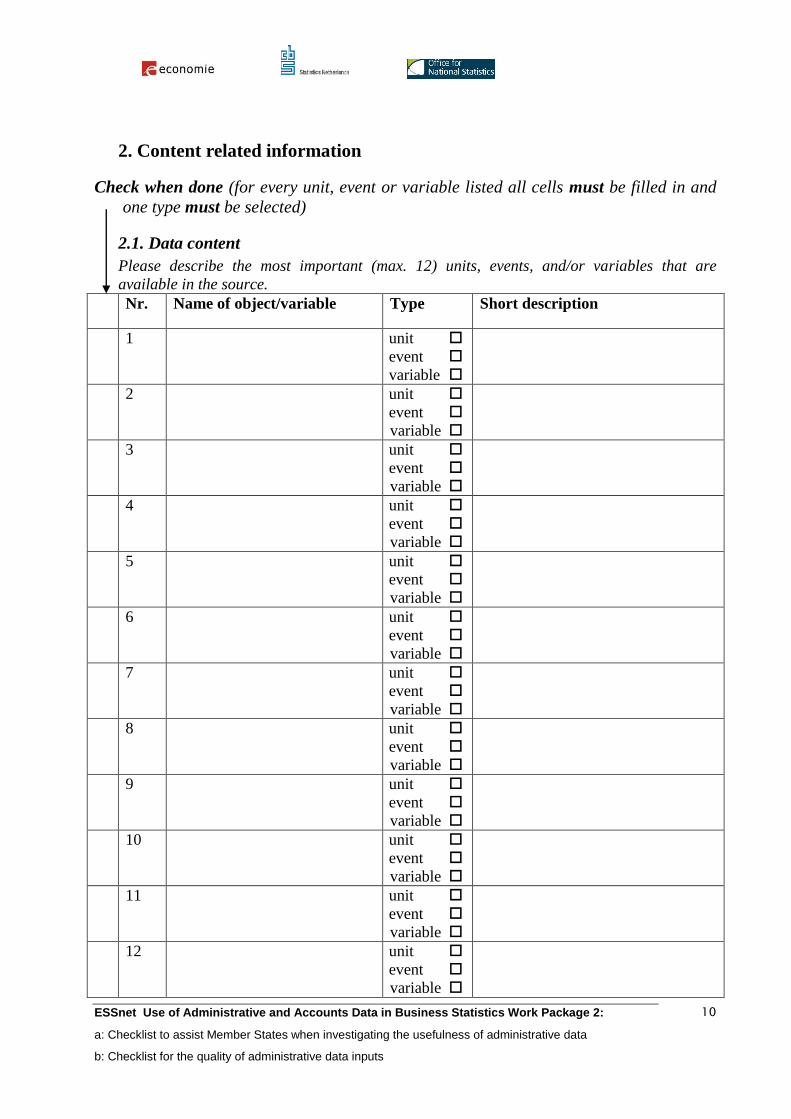
2. Content related information
Check when done (for every unit, event or variable listed all cells must be filled in and
one type must be selected)
2.1. Data content
Please describe the most important (max. 12) units, events, and/or variables that are
available in the source.
Nr. Name of object/variable Type Short description
1 unit
event
variable
2 unit
event
variable
3 unit
event
variable
4 unit
event
variable
5 unit
event
variable
6 unit
event
variable
7 unit
event
variable
8 unit
event
variable
9 unit
event
variable
10 unit
event
variable
11 unit
event
variable
12 unit
event
variable
ESSnet Use of Administrative and Accounts Data in Business Statistics Work Package 2:
a: Checklist to assist Member States when investigating the usefulness of administrative data
b: Checklist for the quality of administrative data inputs
11
Check when done (for every identification variable listed all cells must be filled in)
2.2. Identification variable
Which variable uniquely identifies the units or events in the source? If a combination of
variables is used list them all below.
Nr. Name of variable Short description
1
2
3
4
2.3. Time indication
a) To which period or point in time does the data in the source refer? and
b) Is the period/point in time clearly described by the administrative data holder?
a) Description of the period/point in time used b) Time description clarity score
Clear
Unclear/ Ambiguous
Unknown
Write additional remarks here:
2.4 Scoring of content part
Nr. Name of variable Circle correct
answer
1 Is section 1 completely filled in? YES NO
2 Are all cells in section 2.1 and 2.2 - in which a unit, event or variable
is listed- completely filled in? YES NO
3 Is section 2.3 is completely filled in and scored? YES NO
4 Is the clarity score in section 2.3b ‘Clear’ ? YES NO
- When the answer to all four questions is YES -> CONTINUE with the next section
- In all other cases -> STOP the evaluation and collect additional information for the
sections for which the answer is NO
ESSnet Use of Administrative and Accounts Data in Business Statistics Work Package 2:
a: Checklist to assist Member States when investigating the usefulness of administrative data
b: Checklist for the quality of administrative data inputs
12
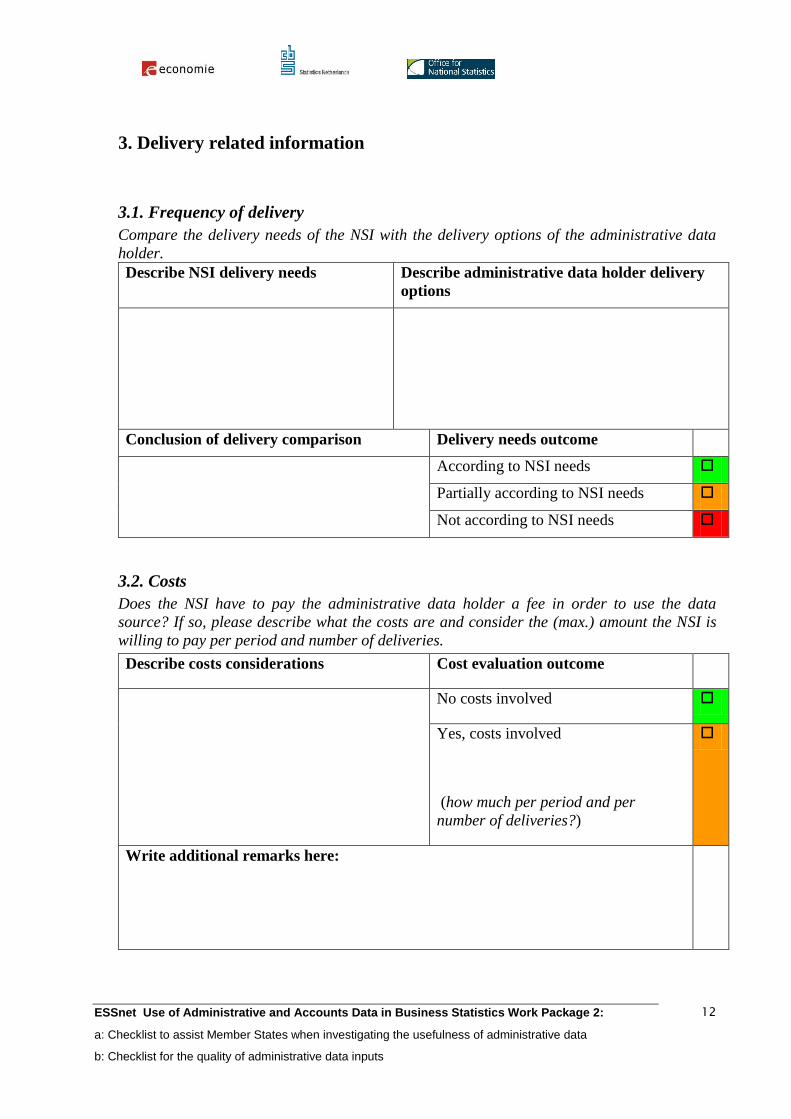
3. Delivery related information
3.1. Frequency of delivery
Compare the delivery needs of the NSI with the delivery options of the administrative data
holder.
Describe NSI delivery needs Describe administrative data holder delivery
options
Conclusion of delivery comparison Delivery needs outcome
According to NSI needs
Partially according to NSI needs
Not according to NSI needs
3.2. Costs
Does the NSI have to pay the administrative data holder a fee in order to use the data
source? If so, please describe what the costs are and consider the (max.) amount the NSI is
willing to pay per period and number of deliveries.
Describe costs considerations Cost evaluation outcome
No costs involved
Yes, costs involved
(how much per period and per
number of deliveries?)
Write additional remarks here:
ESSnet Use of Administrative and Accounts Data in Business Statistics Work Package 2:
a: Checklist to assist Member States when investigating the usefulness of administrative data
b: Checklist for the quality of administrative data inputs
13
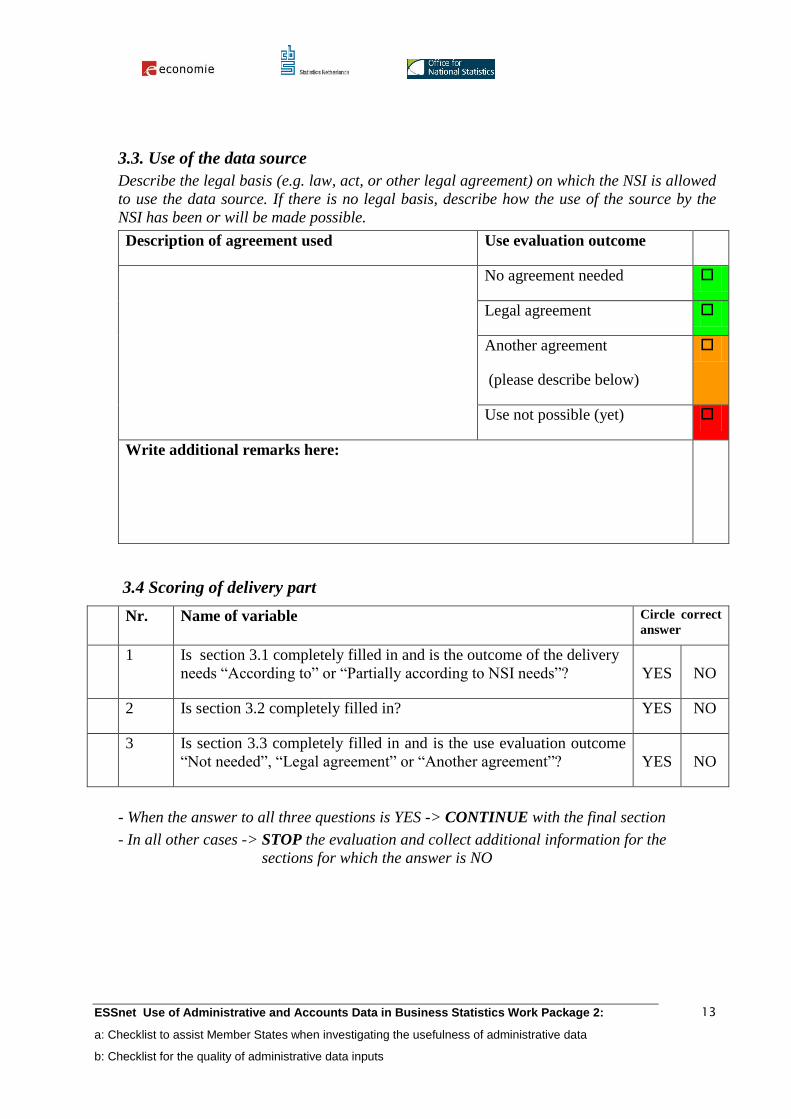
3.3. Use of the data source
Describe the legal basis (e.g. law, act, or other legal agreement) on which the NSI is allowed
to use the data source. If there is no legal basis, describe how the use of the source by the
NSI has been or will be made possible.
Description of agreement used Use evaluation outcome
No agreement needed
Legal agreement
Another agreement
(please describe below)
Use not possible (yet)
Write additional remarks here:
3.4 Scoring of delivery part
Nr. Name of variable Circle correct
answer
1 Is section 3.1 completely filled in and is the outcome of the delivery
needs “According to” or “Partially according to NSI needs”? YES NO
2 Is section 3.2 completely filled in? YES NO
3 Is section 3.3 completely filled in and is the use evaluation outcome
“Not needed”, “Legal agreement” or “Another agreement”? YES NO
- When the answer to all three questions is YES -> CONTINUE with the final section
- In all other cases -> STOP the evaluation and collect additional information for the
sections for which the answer is NO
ESSnet Use of Administrative and Accounts Data in Business Statistics Work Package 2:
a: Checklist to assist Member States when investigating the usefulness of administrative data
b: Checklist for the quality of administrative data inputs
14
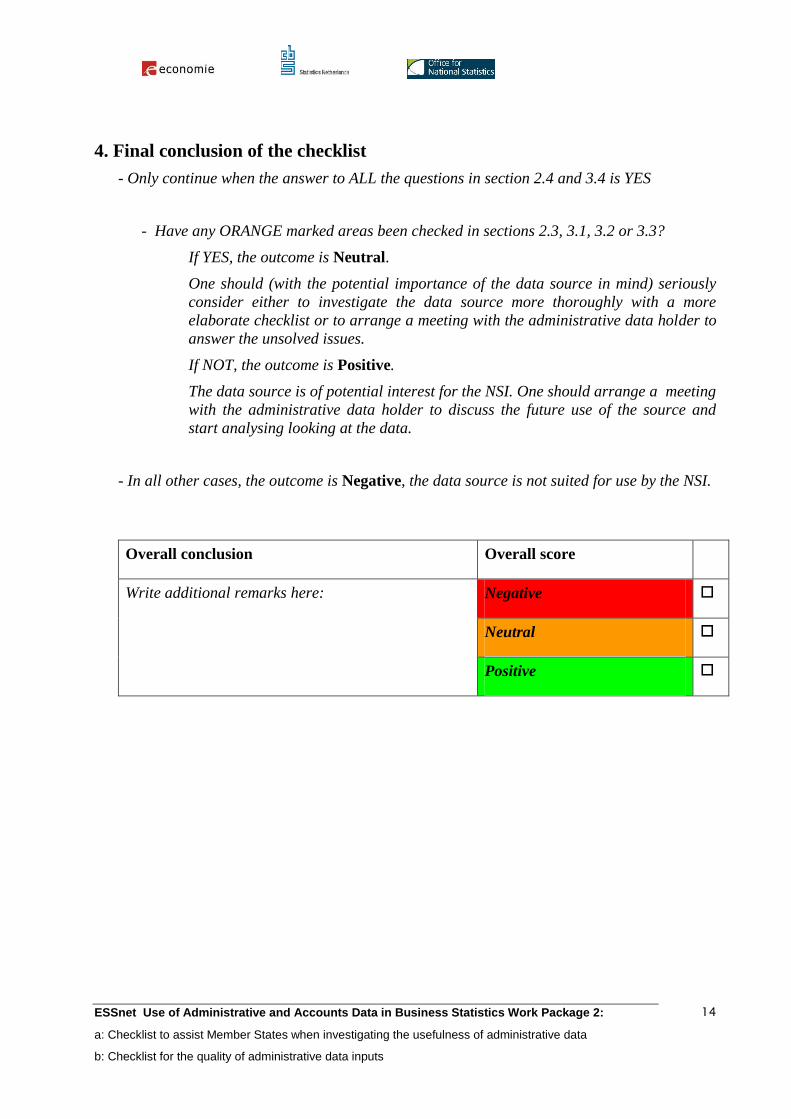
4. Final conclusion of the checklist
- Only continue when the answer to ALL the questions in section 2.4 and 3.4 is YES
- Have any ORANGE marked areas been checked in sections 2.3, 3.1, 3.2 or 3.3?
If YES, the outcome is Neutral.
One should (with the potential importance of the data source in mind) seriously
consider either to investigate the data source more thoroughly with a more
elaborate checklist or to arrange a meeting with the administrative data holder to
answer the unsolved issues.
If NOT, the outcome is Positive.
The data source is of potential interest for the NSI. One should arrange a meeting
with the administrative data holder to discuss the future use of the source and
start analysing looking at the data.
- In all other cases, the outcome is Negative, the data source is not suited for use by the NSI.
Overall conclusion Overall score
Write additional remarks here: Negative
Neutral
Positive
ESSnet Use of Administrative and Accounts Data in Business Statistics Work Package 2:
a: Checklist to assist Member States when investigating the usefulness of administrative data
b: Checklist for the quality of administrative data inputs
15
2.1.2 The Usage-specific checklist
The information obtained when using the pre-evaluation checklist helps to determine whether the
administrative data source can be used at all, by drawing the attention to aspects that are vital for
any user.
Different users can all have their specific requirements on what should be measured, in what
form and how soon it should be available, and how accurate the information needs to be.
In other words, a second set of checks is needed to assess the usability of the data for production
of a specific statistical output.
The focus is on detecting issues regarding coverage, expected bias and variance in the data and
assessing whether they can be addressed without introducing unreasonable costs (complexity) or
risk (dependencies), and how the administrative data can be used (methodological option).
Different methodological options can be necessary for special types of outputs, and even within
one specific output, different solutions may be needed for certain strata and variables. In many
cases there is no “one size fits all” solution, the choice between options should relate to the
desired outcomes for the user of the data.
Steps in the Usage-specific checklist procedure
The checklist should guide potential users of the administrative data source through the process
of a first time evaluation of “when, where, how and why the set of administrative data under
study can be used within a statistical output”. The process can be divided in three main
components or phases, as will be demonstrated in the New Zealand example.
In this working document, the three components are not taken over “as such” from the example,
but the basic idea is linked with both the work from this ESSnet on aspects of metadata quality
(pre-evaluation checklist) and literature on data quality methodologies6
The usage-specific checklist consists of three main components or steps:
- Requirements: criteria to which the results should conform.
- Assessment: measurement of fitness for use, extend of conformity with the expectations.
- Evaluation: starting from the outcome of the assessment, routing to decisions or further
actions.
6 Eg overview in C.Batini, M. Scannapieco; Data Quality: Concepts, Methodologies and Techniques; 2006;
Springer, Berlin
ESSnet Use of Administrative and Accounts Data in Business Statistics Work Package 2:
a: Checklist to assist Member States when investigating the usefulness of administrative data
b: Checklist for the quality of administrative data inputs
16
New Zealand example
A number of desired outcomes of the use of administrative data have been defined by Stewart,
Costa, Page and Chen7 during an investigation into developing sub-annual business
establishment collections based on Goods and Services Tax (GST) administrative data.
In their view a clear picture can be given of when, where, how and why administrative data can
and should be used within a statistical output. In their assessment model they reply consecutively
to three questions:
- Why should the data be used in a particular way (desired outcomes)
- What data should be used (fitness for use)
- How the data should be used (appropriate method)
Fitness for use is checked in an assessment phase:
- Does the reporting structure fit the requirements at the unit level?
- Do the administrative variables align to the conceptual and definitional requirements of
the desired output?
- Does the required information arrive in time?
The results are evaluated against six criteria (desired outcomes), taking into account that not all
of them are of equal importance and potential trade-offs between outcomes would need to be
considered.
The criteria are:
1 Minimise complexity / cost
The level of complexity associated with each approach needs to be considered. A higher level of
complexity will likely result in greater resources and a higher production cost.
2 Minimise respondent burden
The impact on the level of respondent burden (or compliance cost) needs to be examined. A key
aim is to minimise this as much as possible.
3 Maximise measurable quality
7 Stewart,J. Costa, V, Page, M, Chen, C, (2012). "Maximising the Use of Administrative Data in Sub-Annual
Business Collections" Proceedings of the Third International Conference of Establishment Surveys, June 2012,
Montréal.
ESSnet Use of Administrative and Accounts Data in Business Statistics Work Package 2:
a: Checklist to assist Member States when investigating the usefulness of administrative data
b: Checklist for the quality of administrative data inputs
17
The examination of options for using administrative data must maintain the need for suitable
quality measures. For instance, traditional survey errors (e.g. sample errors) may become less
relevant, while the importance of the errors associated with any models used for manipulating
the administrative data will increase. Nevertheless, it is necessary to accept that it will be
difficult to have measures that encompass all aspects of quality, some error will be difficult to
quantify such as a 'non-modelling' error analogous to 'non-sample' error.
4 Maximise flexibility
Administrative data can have the potential to deliver sub-domain estimates at lower levels of
detail for the likes of ad-hoc research, and customized data requests. This is generally not
possible for sample surveys. The flexibility of each option to enable the ad-hoc production of
specific sub domain estimates should be noted.
5 Maximise scalability
Scalability refers to the ability of an option to be used in the development of new 'green-field'
collections. For example, in business surveys this could include the development of collections
for industries in the economy which are not covered by existing collections.
6 Maximise unit record availability
There is an increasing need for micro-data which will underpin future statistical analysis. This
supports research and policy's impact evaluation, where the emphasis is on micro-data analysis
and the integration of data from different sources. Micro data also makes it easier to meet a range
of emerging needs.
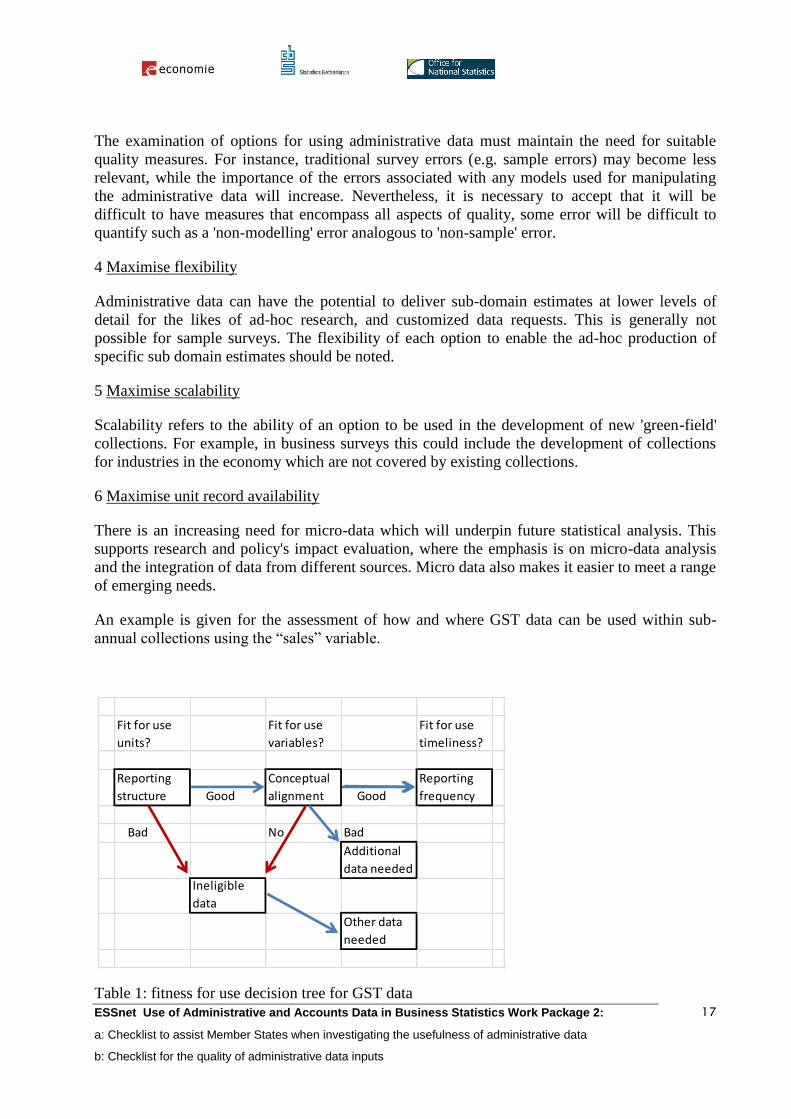
An example is given for the assessment of how and where GST data can be used within sub-
annual collections using the “sales” variable.
Fit for use
units?
Fit for use
variables?
Fit for use
timeliness?
Reporting
structure Good
Conceptual
alignment Good
Reporting
frequency
Bad No Bad
Additional
data needed
Ineligible
data
Other data
needed
Table 1: fitness for use decision tree for GST data
ESSnet Use of Administrative and Accounts Data in Business Statistics Work Package 2:
a: Checklist to assist Member States when investigating the usefulness of administrative data
b: Checklist for the quality of administrative data inputs
18
In the example two reporting structure issues affect the fitness for use of GST data for some of
the units involved. GST data are collected for the legal unit, and those legal units that do not
correspond to a statistical unit with activity in a single industry may not be fit for use without
some transformation. The quality of the data for these units is lower. Potentially there is an
increased need for an alternative (eg a survey). The second issue is that a group of legal units
linked by ownership is allowed to provide data in a total which is collected against one unit
whilst other units in the group record zero values.
To determine the conceptual alignment, the definition of the GST variable is compared against
definitions from the user. Then the quality of the definition is evaluated by comparison with the
values of existing surveys. The relationship is examined by comparing sets of data based on a
pool of common units.
Data must be available in time to be used. GST data is reported on several frequencies depending
on turnover size. Assessment of the data showed that 85% to 95% of data by value is available
within the publication timeframes.
A general conclusion from the assessment model is – not surprisingly – that whenever possible it
is better to use the data directly or with a transformation applied: these two options have the
potential to meet all the desired outcomes.
The option to combine sources (eg with survey data) and the option to use other sources will still
be useful in many situations. The main drawback of these other options is the lack of usefulness
(flexibility, scalability etc) that arises from not having a 'census like' data pool available.
The strength of the model is that it brings together important elements for making a decision and
defines a logical order in the activities to be undertaken during the assessment of the
administrative data.
Coverage is not explicitly mentioned in the model. Some of the best known sources of under- or
overcoverage in administrative data are:
- Exemptions from reporting for specific categories of respondents. This can be on the
basis of a threshold under which no reporting is required or on the basis of particular
administrative arrangements for certain types of respondents.
- Lack of deregistration in administrative data sets.
To illustrate the possible consequences of coverage issues, one could think of a situation where
the smallest enterprises are not covered. This is a frame/coverage error with in theory a low risk
for variance and a high risk for bias. If the user wants to have an early indication of changes in
the economy, and small enterprises play a different role in those changes (eg new industries
seem to be characterized by a high rate of product innovation, carried out mostly by small
enterprises) it might be problematic to assume that the behaviour of the missing elements reflects
that of the elements in the data set.

ESSnet Use of Administrative and Accounts Data in Business Statistics Work Package 2:
a: Checklist to assist Member States when investigating the usefulness of administrative data
b: Checklist for the quality of administrative data inputs
19
If on the other hand the user wants to estimate for example industry totals, where the
contribution of the smallest enterprises is negligible, there is less need for additional information.
In this second case, the low complexity and low compliance cost criteria will more easily be met
in selecting a methodology option.
ESSnet Use of Administrative and Accounts Data in Business Statistics Work Package 2:
a: Checklist to assist Member States when investigating the usefulness of administrative data
b: Checklist for the quality of administrative data inputs
20
Step 1: Requirements
To verify that the data from the administrative source are of sufficient quality to meet the
expectations of the user, eventually after some modifications or in combination with other
sources, it is imperative to have a clear description of the requirements in terms of output:
- What is needed: definitions of the statistical concepts that are to be measured.
- When: the required timing of the output in terms of timeliness, periodicity and
punctuality. Is an appropriate part of the data available at the time when it is needed?
Quality, defined as fitness for use can only be measured as conformance to these output
requirements. Even so it will be difficult to single out and quantify the most important quality
aspects.
In the GST example accuracy at the unit level is investigated by looking at the reporting
structure: is the reporting unit equivalent to the statistical unit and if not, what are the
consequences? Are transformations possible? Timeliness is calculated from historical data sets.
The other five criteria (scalability, flexibility,…) mentioned before can be seen as boundary
conditions that play an important role in finding the best solution during the evaluation phase.
Requirements are the basis for the whole checking procedure: they determine the boundaries of
what is acceptable and help to put order in possibly conflicting demands. In practice the question
to answer will be: “How can we get accurate, reliable statistical information within given
boundaries on time, resources (budget, complexity), burden…for this object of study”.
Depending on the relative importance given to requirements, it is theoretically also possible to
formulate different questions, e.g. how to allocate fixed resources over two or more statistical
outputs, or even how to minimize respondent burden while staying within the boundaries of
acceptable quality as defined within the requirements.
Step 2: Assessment
During the data assessment phase the raw input data from the administrative source are
confronted with the requirements for the statistical output. Evaluating the conformity of the input
data means checking the data for issues.
A prerequisite to finding issues in administrative data is having a view on possible sources of
error. It is likely that the errors that normally emerge in surveys will also occur in administrative
data, the process of collecting information for administrative purposes is in many ways similar to
surveying.
Holding these similarities in mind, it is important to pay attention to the fact that administrative
registration is a process that is external to the statistical office:
ESSnet Use of Administrative and Accounts Data in Business Statistics Work Package 2:
a: Checklist to assist Member States when investigating the usefulness of administrative data
b: Checklist for the quality of administrative data inputs
21
- Administrations collect data for their own needs, so the concepts used and the target
population addressed are not tailored to the NSI’s needs.
- As data are collected for administrative purposes, a change in policy can suddenly disrupt
or change the registration.
- Administrative reporting can in many cases relate to individual rights or obligations (e.g.
taxation) whereas individual survey responses are protected by privacy regulations, and
have no individual effect. Editing of individually reported values by the administration is
often limited.
- Administrations tend to focus on variables that are directly relevant for their
administrative function. It can happen that some of the less relevant variables are
collected once and are never updated again.
- The administration’s updating and processing procedures are not always transparent to
the statistical office. Special procedures may have to be followed by the respondent
before values that are wrong (or no longer valid) can be changed.
- In some countries it is not possible for a statistical office to re-contact respondents about
improbable values in their administrative datasets.
- Because of the previous element, it is clear that standard methods for checking/correcting
data, as used with survey data, not always apply. Corrections of the data cannot always
be verified, so there is no clean “reference” dataset to benchmark automatic editing
methods against.
- Administrative datasets are usually very large: they have problems associated with them
beyond what is traditionally considered by statisticians. Many statistical methods require
some type of exhaustive search and as the number of records and variables increase, the
computation time needed becomes exceedingly large. Checking datasets containing
millions of records can require the use of data mining techniques.
Statistical offices monitor their incoming survey data and have a collection of procedures in
place to guarantee and improve the quality of these data. Examples of these are the pre-testing of
questionnaires, training of interviewers or other persons involved in data collection, reviewing
response data for unexpected results and unusual patterns, and conducting evaluation studies.
Equivalent methods for administrative data are not readily available. It is here that a checklist
can help in drawing the attention to the most relevant issues and provide assistance in moving
from an ad hoc inspection to a more systematic way of looking at the data.
It is important to assess the quality of administrative data as they can be a source of variance and
bias
In the assessment phase of the checklist, we cover systematically the main sources of error in
administrative data.
ESSnet Use of Administrative and Accounts Data in Business Statistics Work Package 2:
a: Checklist to assist Member States when investigating the usefulness of administrative data
b: Checklist for the quality of administrative data inputs
22
Groves et al.8 describes these sources of error (components of total survey error) based on the
life cycle of a survey.
The most relevant sources of error within the scope of this ESSnet are:
1 Measurement errors:
1.a The validity of the administrative concept (specification error):
If the concept implied in the administrative registration differs from the concept that should have
been measured for the statistical output, the wrong construct is measured, possibly leading to
invalid inferences. As long as the concept is close to observational behaviour, validity should be
relatively easy to verify. In principle, there is no difference between the problems encountered in
scientific and in administrative surveys.
1.b Measurement errors:
Measurement is more concrete than a concept: it is a way to collect information about the
concept. The critical task for measurement is to design questions that perfectly measure the
concepts. The distinction between “validity of the administrative concept” and “measurement
errors” is easier to make in a scientific context where concept are the building blocks of theory
than for an administration that measures as prescribed in an administrative regulation.
An illustration of this is the abstract concept of SMEs, with connotations of independent
entrepreneurs leading their relatively small enterprise.
Administrations can base their definition on thresholds for the number of employees and either
turnover or balance sheet total, not spending much attention to ownership or control relations.
For a more “scientific” approach, the distinction should be made between a more or less
autonomous enterprise and a small but fully dependent subsidiary in a large enterprise group. In
other words, the administrative concept will be operationally defined, as a list of verifiable
criteria. Units meeting the criteria are “in”, others are “out”. The scientific approach starts from
defining concept (entrepreneurship, autonomy,..) and their interrelations, and then starts
operationalizing: defining the concept so as to make it clearly measurable
The validity of the administrative concept must always be seen as the degree of conformity of
the administrative concept to the definition in the requirements for the statistical output. The
measurement error on the other hand includes errors arising from respondents and various factors
related to the reporting process like ambiguous questions and confusing instructions for
respondents.
Bert Bakker9 also classifies delays in recording administrative events under measurement errors:
8 Groves, R.M., F.J. Fowler jr., M.P. Couper, J.M. Lepkowski, E. Singer, & R. Tourangeau, (2004), Survey
Methodology (New York: Wiley Interscience
ESSnet Use of Administrative and Accounts Data in Business Statistics Work Package 2:
a: Checklist to assist Member States when investigating the usefulness of administrative data
b: Checklist for the quality of administrative data inputs
23
“One measurement error is unique to administrative surveys. When using registers for the
production of statistics, one of the errors that must be taken into account is the so-called
administrative delay. This delay is caused by events being recorded some time after they actually
occur, and it is an important source of error. Of course, if a survey collects information on past
events, this is also a sort of delay, but the information on the past is always available at the time
the outcomes are published. Registers that contain administrative delay are used at a moment in
time that not all the events have yet been recorded.”
These delays are defined within the ESSnet as timeliness of administrative data and important
enough to deserve a separate treatment.
1.c Processing errors
In our context of assessing the administrative data, processing errors relate to errors arising from
the processing of the data by the administrative data holder, including the preparation for
transmission of the data to the statistical office. This process is usually beyond the control of the
statistical office, checking for processing errors requires specific techniques known as data
profiling.
More generally, processing errors also relate to the transformations made on data values to move
from the administrative concept to the statistical concept that is needed for the output. This is not
really part of the assessment, but should be taken into consideration when methodological
options for using the administrative data are listed.
2. Representation errors
2.a Coverage errors
The target population defined in the requirements phase may not be fully covered by the entities
in the administrative records (under-coverage) For example in cases where Value Added Tax
data are used, some categories of respondents will not be covered by the administrative data
because of exemptions (medical care, insurances, betting,…). Over-coverage is also possible,
caused by delays in registration and for example by transactions related to units that are no
longer active.
2. b Linking errors
Other representation errors are related to linking the units in the administrative dataset to the
units in the statistical register. It is clear that whenever the administrative data set has to be
combined with any other data it is imperative that the units in the set can be identified. And in all
cases the stability of the identifier is important for determining the usefulness of the data. A
typical example are the problems that can arise when different sources each covering a subset of
the population, have to be combined (eg with data from regional administrations). This can result
in duplications.
9 Bakker,B.F.M., Linder, F., van Roon, D. (2008). Could that be true? Methodological issues when deriving
educational attainment from different administrative datasources and surveys. IAOS Conference on Reshaping
Official Statistics. Shanghai, October 2008.
ESSnet Use of Administrative and Accounts Data in Business Statistics Work Package 2:
a: Checklist to assist Member States when investigating the usefulness of administrative data
b: Checklist for the quality of administrative data inputs
24
2. c Correction errors
Linking information that is not consistent over different sources requires actions to resolve the
inconsistencies, which can be an additional source of errors. This is out of scope for the
checklist.
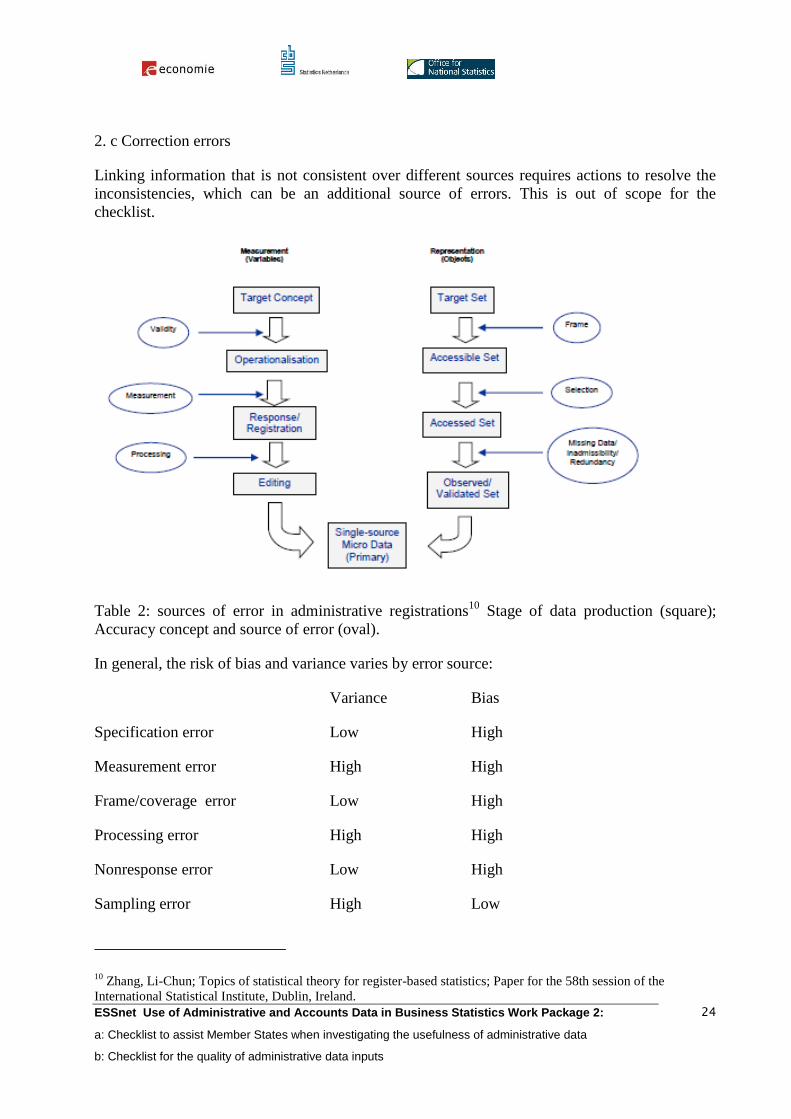
Table 2: sources of error in administrative registrations10
Stage of data production (square);
Accuracy concept and source of error (oval).
In general, the risk of bias and variance varies by error source:
Variance Bias
Specification error Low High
Measurement error High High
Frame/coverage error Low High
Processing error High High
Nonresponse error Low High
Sampling error High Low
10 Zhang, Li-Chun; Topics of statistical theory for register-based statistics; Paper for the 58th session of the
International Statistical Institute, Dublin, Ireland.

ESSnet Use of Administrative and Accounts Data in Business Statistics Work Package 2:
a: Checklist to assist Member States when investigating the usefulness of administrative data
b: Checklist for the quality of administrative data inputs
25
Sampling error is normally irrelevant for administrative data as they are most of the time
supposed to cover each unit subjected to the administrative regulation. Other error sources are
not always under direct control.
ESSnet Use of Administrative and Accounts Data in Business Statistics Work Package 2:
a: Checklist to assist Member States when investigating the usefulness of administrative data
b: Checklist for the quality of administrative data inputs
26
Assessment in practice
The assessment phase of the checking procedure should be understood as a one-time
measurement of the extend of conformity of the data with the expectations. It is clear that the
data received from the administrative data holder will contain at least some imprecisions. It is
therefore necessary to make a profile of the data in order to confirm that the data are fit for use or
to detect and possibly explain the main issues that need to be resolved in order to be able to use
the data in the future.
In the assessment phase both data and metadata are analyzed to give insight (and if possible
metrics) on data quality and to have a first look at the possibilities for enhancing data quality in
further data transformation and cleaning steps. It aims at understanding data challenges from the
beginning, so that late surprises are avoided. The information gathered in this phase should allow
to decide if and how the data can be used (evaluation).
One of the advantages of using a checklist is that it also allows (to a certain extend) to
standardize the way that knowledge about the source, the administrative process and the data is
maintained within the statistical office. Different or new potential users of the administrative
data source will not have to go through the whole checking procedure from scratch, but can re-
use what already exists, and add their own contribution.
In practice assessment comes down to looking for potential sources of error and attributing a
measure of importance to each type of error found. Different techniques can be used, and each of
them is geared towards specific types of error.
The structure of the checklist is based on three broad principles:
a) A clear distinction should be made between definitional causes of non-conformance with the
requirements and intrinsic data quality issues. A data source can measure something very
precisely, thus with intrinsically very good data quality, but still measure something different
than what is needed for this statistical output. Both causes should be looked into during the
assessment.
b) It is also important to make a distinction between process capability and process stability.
Process capability is the ability of the process to meet specifications. It tells us how good the
individual data sets are. Process Stability refers to the consistency of the process with respect to
important process characteristics like e.g. the average number of empty cells or the variation in
this indicator. If the process behaves consistently over time, then we say that the process is stable
or in control. If the process is not in statistical control then capability has no meaning. Although
the real use of statistical process control (SPC) methods only becomes useful when monitoring
the incoming data (part 3.2 of this document) it should be clear that it makes no sense to analyse
one dataset in a very detailed way if the quality of the data is not consistent over time. The
administrative data holder will usually have knowledge of important fluctuations/changes in the
ESSnet Use of Administrative and Accounts Data in Business Statistics Work Package 2:
a: Checklist to assist Member States when investigating the usefulness of administrative data
b: Checklist for the quality of administrative data inputs
27
main characteristics of the data, and comparing a number of descriptive statistics on different
data sets can give a good indication of what to expect.
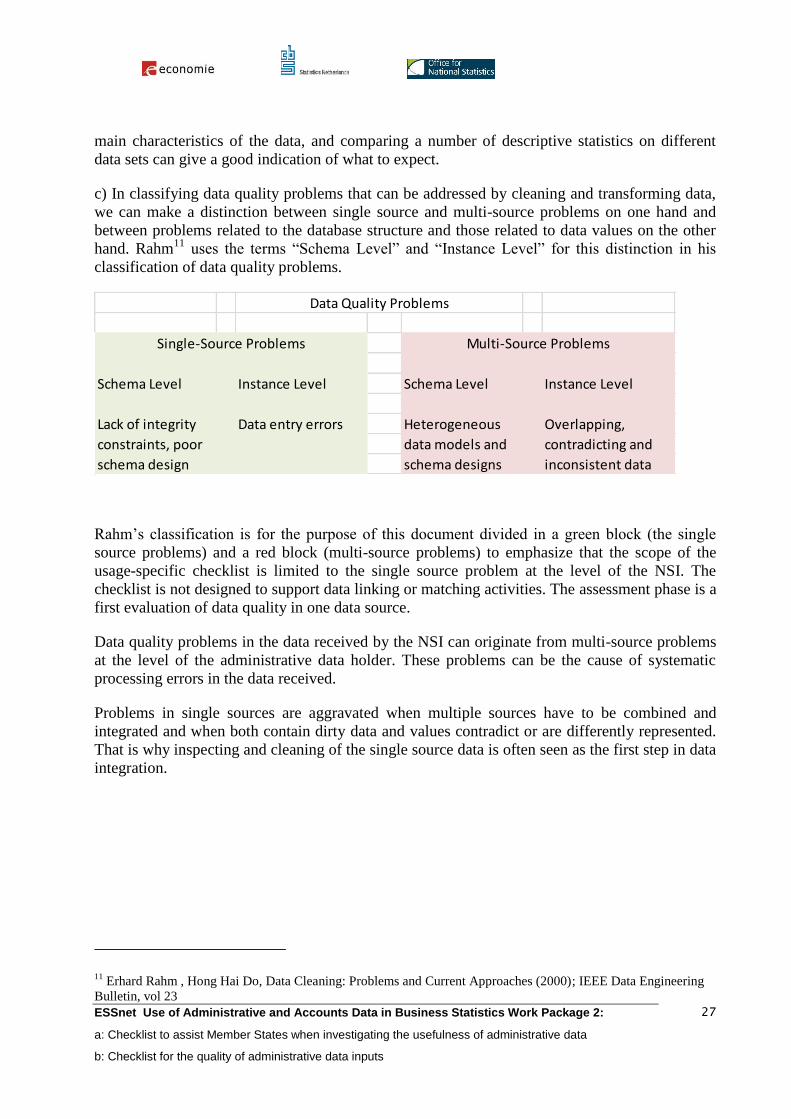
c) In classifying data quality problems that can be addressed by cleaning and transforming data,
we can make a distinction between single source and multi-source problems on one hand and
between problems related to the database structure and those related to data values on the other
hand. Rahm11
uses the terms “Schema Level” and “Instance Level” for this distinction in his
classification of data quality problems.
Schema Level Instance Level Schema Level Instance Level
Lack of integrity Data entry errors Heterogeneous Overlapping,
constraints, poor data models and contradicting and
schema design schema designs inconsistent data
Single-Source Problems Multi-Source Problems
Data Quality Problems
Rahm’s classification is for the purpose of this document divided in a green block (the single
source problems) and a red block (multi-source problems) to emphasize that the scope of the
usage-specific checklist is limited to the single source problem at the level of the NSI. The
checklist is not designed to support data linking or matching activities. The assessment phase is a
first evaluation of data quality in one data source.
Data quality problems in the data received by the NSI can originate from multi-source problems
at the level of the administrative data holder. These problems can be the cause of systematic
processing errors in the data received.
Problems in single sources are aggravated when multiple sources have to be combined and
integrated and when both contain dirty data and values contradict or are differently represented.
That is why inspecting and cleaning of the single source data is often seen as the first step in data
integration.
11 Erhard Rahm , Hong Hai Do, Data Cleaning: Problems and Current Approaches (2000); IEEE Data Engineering
Bulletin, vol 23
ESSnet Use of Administrative and Accounts Data in Business Statistics Work Package 2:
a: Checklist to assist Member States when investigating the usefulness of administrative data
b: Checklist for the quality of administrative data inputs
28
Assessment techniques
1) compare definitions
Sources of error: mainly specification errors due to differences in variable definition, but also
frame errors due to mismatches in target population and differences in the delineation of units.
Measurement errors: comparing time frames for the administrative procedure with those needed
for producing the statistical output give a first indication. Information on thresholds for reporting
and on the optional character of certain variables also point in the direction of measurement
errors.
The most obvious step in checking the usability of the administrative source is to put side by side
the definitions of variables given by the administrative data holder and the output variable
definitions gathered in the requirements phase. Logically this should be the first thing to do.
The first source of information on the administrative variables is the administrative data holder
himself, but in many cases there are also other possible sources, and it could be helpful to get
documentation from different origins and store it for further reference. When comparing
definitions, it might become apparent that more detailed information on aspect of the output
requirements are needed. In that case, complete the requirements information first.
Variable descriptions from the administrative source can sometimes be rather technical, e.g.
composed of references to other variables. Usually the data are collected in response to an
administrative decision or regulation, sometimes accompanied by explanatory notes. These texts
can sometimes give a more comprehensive view on what is exactly included and what is not
included in the variable.
Example: the Danish Tax authorities
In Denmark an Act on an income register was adopted in 2007, and subsequently data for the
new register were to be reported for payments with effect from 1 January 2008. The Act is
administered by the Danish tax authorities. From the date of when the Act came into effect, all
public and private employers as well as public authorities paying out money to citizens at least
once every month must report detailed information on the size and the type of payment. Until
2008, the same information were, roughly speaking, to be reported to the tax authorities, but only
once annually for the purpose of the yearly tax assessment. The new possibilities with respect to
the Act on eIncome in relation to the yearly tax assessments of earlier years to the tax authorities
were, in particular:
- Reporting must take place at least once every month, and the period covered by the
payment must appear from the data reports.
- In the case of payment of wages and salaries, the number of hours worked for which
wages and salaries are paid out must be reported.
ESSnet Use of Administrative and Accounts Data in Business Statistics Work Package 2:
a: Checklist to assist Member States when investigating the usefulness of administrative data
b: Checklist for the quality of administrative data inputs
29
- In the case of payment of wages and salaries, the workplace to which the employee is
linked must be stated.
While the new administrative source with its more than 100 variables would clearly open up new
possibilities for statistical output in the field of business statistics, at least some more analysis is
required to determine what is exactly measured and what is not. As the primary function is the
taxation of income, part of the total employment and income in Denmark stays under the radar:
- Income from self-employment and as assisting spouse
- Income/payments from abroad
- Income from shares and capital income
- Pension payments not administered by employers
For some statistical outputs these “shortcomings” are not relevant at all, as they are not required
for the output variables, for other outputs it might be necessary to find complementary
information from other sources, and for some outputs a more detailed description of the exact
composition of certain variables will be required.
Coverage is closely related to the definition of the administrative concept, as the concept is
usually defined in operational terms (by how it is measured): these criteria describe what is “in”
and what is “out” or not covered. Some of the most common sources of over- or undercoverage
are:
- Thresholds in size or quantity: a good known example is the VAT threshold. If the
volume of turnover is below a defined limit, no VAT declaration is required. The actual
amount is different from country to country.
- Geographic criteria: different possibilities exist. When the administrative source holds
data that is subject to regional differences in legislation or administrative practices, the
chance exists that at least part of the variables do not cover the whole territory. Another
type of coverage problem relates to residence of reporter and activity, do the
administrative data comply with requirements from business statistics, e.g. are data that
relate to transit trade present and can they be identified?
- Reporting delay can be another source of under- or overcoverage. Are respondents
expected to register and deregister in time? In many cases there is little or no incentive to
deregister and inactive units accumulate in the administrative register. Inactive units are
sometimes kept for administrative purposes and show false signs of activity due to the
administrative handling of the units.
- Definitions of concept any other kind than previously cited that do not completely
overlap between administrative source and statistical output can result in missing
categories of units or in the presence of units that are not required for the field of interest.
Exemption of VAT for certain activities is an example where a number of defined
categories of units will not be present in the administrative files.
ESSnet Use of Administrative and Accounts Data in Business Statistics Work Package 2:
a: Checklist to assist Member States when investigating the usefulness of administrative data
b: Checklist for the quality of administrative data inputs
30
2) get expert opinion
Sources of error: as this step is meant to deepen and validate the comparison of the metadata in
the first step, the sources of error to be looked at are the same. On top of that, it becomes
possible to make a first evaluation of the stability of the administrative system. If there is a
serious risk for discontinuity of the data delivery, then the inquiry would already have stopped
during the pre-evaluation of the data source. The best way to get an idea of the relative
importance of fluctuations in timeliness (or response rate) is to ask people who are acquainted
with the administrative data collection process or with the data themselves.
The previous action, comparing definitions gives broad indications of possibilities for using the
data and drawbacks or problems to resolve, but not necessarily a good view on the order of
magnitude of differences or on possible solutions. Getting expert opinions serves more than one
purpose:
- Check findings from the comparison of definitions: feedback from subject matter
specialist helps to validate and refine the first conclusions.
- Contacting people who not only know the theory but are also acquainted with some of the
practical aspects of the administrative data collection is an opportunity to see how users
go about with the data and the procedures, and can highlight points of interest that need
to be investigated.
- Persons with day to day knowledge of the administrative data collection will be able to
point out major quality issues. “We know that changes in variable x are usually not
reported,..” or “second quarter data arrive later because..”
- If at a later point in time the decision is taken to start using variables from this source,
there will be a need to develop in-house expertise. Building up network of persons that
can be consulted starts here.
Staff handling the data in the administration are probably the best source of information if they
are willing to give assistance. Users of the data, possibly in the business community, academics
or users in other administrations can be very valuable too. Expert opinions can differ of course,
depending on the angle they look from. Taking VAT data as an example, experts could be
persons working at the tax office, but also accountants, tax consultants, lawyers, auditors. If later
on an advanced use is made of the data, the importance of having the possibility to consult
external experts will only grow.
ESSnet Use of Administrative and Accounts Data in Business Statistics Work Package 2:
a: Checklist to assist Member States when investigating the usefulness of administrative data
b: Checklist for the quality of administrative data inputs
31
3) Compare with other sources
Evaluating the contents of a data set without reference to any other data that relate at least
partially to the same field of interest, limits the scope of the actions largely to checking internal
consistency and consistency with the metadata provided by the admin data holder. For that
reason, it is important to look for related information in other data to get a more objective view.
The ideal situation is to make a comparison with data that is known to be of very good quality, as
this allows to make a trustworthy quantification of the bias and/or variance in the new data. Even
if the external information is not considered ideal, a comparison can provide new starting points
for a closer inspection, and reveal issues that would otherwise pass unnoticed.
Capture-recapture procedures:
Sources of error: allows to estimate the number of duplicates in the administrative data.
These methods involve two (or more) separately compiled but incomplete lists of the members
of a population. Comparing the presence of units in the lists gives an estimation of the population
total. The method can also be used to estimate the number of duplicates within a database.
Business statistics rely most of the time on business registers that are assumed to provide a
complete list of population units. In most situations preference will be given to the “gold
standard” method, which is also presented in this document. Examples of the use of capture-
recapture procedures can be found in social statistics (adjusting census data for coverage
errors12
). Only the Lincoln-Peterson estimator is described in this document. A more complete
review of methods can be found in Pollock (1991).
Situations where the procedure can be used: to evaluate data sets with the same type of
information compiled from different sources and merged, either by the administrative data
source or the statistical office. An example are regionally managed administrative data sets with
units listed in more than one region, either with the same or a different identification number.
When identification of duplicates is not straightforward, different blocking criteria can be used to
match records in the data set. Comparing the correct matches for the two criteria gives the input
for the estimation of the total number of duplicates.
Let N be the estimate of the total number of units in the population of interest, R denote the
number of units observed in both lists, S1 and S2 denote the number of units in the first and
second list.
Second List
First list Present Absent Total
Present R S1
Absent
Total S2 N
12 Wolter, K. M. (1986) Some Coverage Error Models for Census Data, Journal of the American Statistical
Association, vol 81, no. 394, pp. 337-346
ESSnet Use of Administrative and Accounts Data in Business Statistics Work Package 2:
a: Checklist to assist Member States when investigating the usefulness of administrative data
b: Checklist for the quality of administrative data inputs
32
The estimator N is called the Lincoln-Peterson estimator.
1
1
11ˆ 21
R
SS
To determine the reliability of the estimate it is necessary to compute the confidence interval
around the estimate. The fraction of the units in both lists (R/S2) can be used to calculate this
confidence interval.
If R/S2 is less than 0,10 it is advised to:
- Use Poisson confidence intervals if R<50
- Use the normal approximation to obtain confidence intervals if R>50
If R/S2 is more than 0,10 it is advised to use binominal confidence intervals
The estimator relies on three assumptions:
- The lists are independent
- The population of interest is homogeneous: each member of the population has an equal
chance of being captured for a given list
- There are no errors when matching records across lists
Relative gold standard:
Sources of error: allows to quantify different types of error depending on the characteristics of
the reference data. Typical sources are misclassification, incompleteness due to under-coverage
or non-response, over-coverage, bias due to processing errors or specification error.
A data source that is known to have higher data quality in a data domain is considered a relative
gold standard for data quality when compared to other sources that contain the same data
domain. The term relative gold standard is used for data quality to acknowledge that even with
an assumed higher level of data quality, the relative gold standard is also expected to contain
errors. The data from the business register are often considered as a gold standard, and in many
cases they are the best information available. In specific circumstances however, the data from
the administrative source can be of better quality than the information on the same data domain
ESSnet Use of Administrative and Accounts Data in Business Statistics Work Package 2:
a: Checklist to assist Member States when investigating the usefulness of administrative data
b: Checklist for the quality of administrative data inputs
33
present in the business register, this can be the case when the administrative source is used to
update the register (or could be used in this sense in the future). The “gold standard” principle is
used in the updating of the business register itself when different sources for the same variable
coexist: the value is taken from the best source available.
An example of using the gold standard method:
Statistics Belgium receives data on insolvency procedures directly from the courts. Some
decisions require publication in the official journal within a certain time frame. As there are legal
consequences to this publication, the risk of non-publication is close to zero. The number of
decisions found in the official journal was used as a gold standard for evaluating the
completeness and timeliness of the data that arrive directly from the courts. When an alternative
administrative source was evaluated, comparison of the two sources with the gold standard
showed what would happen if the original source was replaced.
Situations where the procedure can be used: when sources that are different from the source
under study contain information that can be considered as true or correct, the quality of the data
can be assessed. An example was given that allows to derive the number of missing cases from a
complete data set. It is also possible to use this method for data sources that cover only a part of
the target population but are very accurate for the value of one or more variables. Comparing the
values for corresponding units in the two sets allows to quantify the relative quality for these
variables within the larger set.
Visual inspection:
Sources of error: measurement errors (outliers and/or processing errors). Possibly also
undetected specification errors when known differences are not sufficient to explain the observed
ones.
Using graphical representation techniques for comparing new data with data from other sources
often requires some work to prepare the data first. The basic checks to determine if a direct
comparison is possible, can bring up the main questions that need to be answered during the next
stage in the assessment, the closer inspection of the data set itself. In reality this may be the start
of an iterative process of data cleaning and visual inspection.
The first thing to check is the linkability: are the units defined in the same way, do they have a
common identifier or can they be linked to one. Are there duplicates that need to be removed. An
example of differences at the unit level in VAT data are VAT-groups that do not correspond to
either enterprises or legal units.
The second point of attention is the basic comparability of the variables. Maybe some
transformations are needed. Examples are size classes that overlap, classifications that are
“modified” for administrative use, nominal variables that are not standardized,…
The problems that prevent comparing the data are normally detected in the beginning by looking
at the definitions. If not, actually trying to link two data sets will bring up the main issues, if any.
ESSnet Use of Administrative and Accounts Data in Business Statistics Work Package 2:
a: Checklist to assist Member States when investigating the usefulness of administrative data
b: Checklist for the quality of administrative data inputs
34
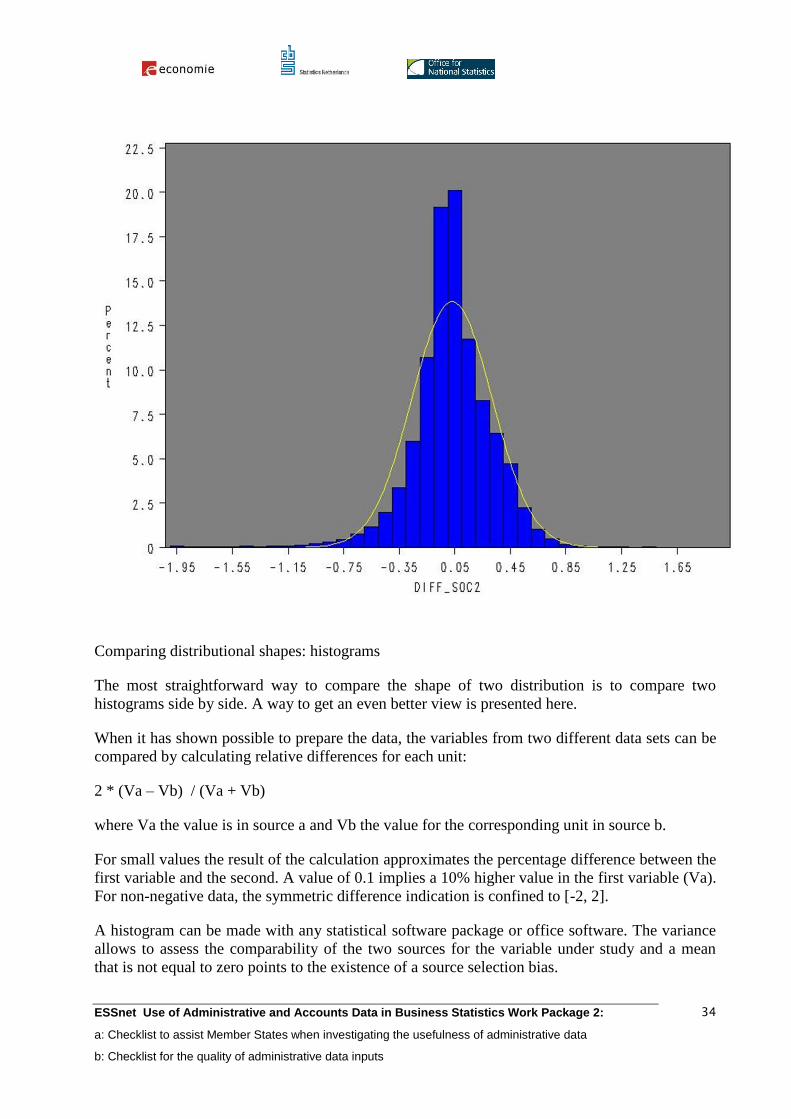
Comparing distributional shapes: histograms
The most straightforward way to compare the shape of two distribution is to compare two
histograms side by side. A way to get an even better view is presented here.
When it has shown possible to prepare the data, the variables from two different data sets can be
compared by calculating relative differences for each unit:
2 * (Va – Vb) / (Va + Vb)
where Va the value is in source a and Vb the value for the corresponding unit in source b.
For small values the result of the calculation approximates the percentage difference between the
first variable and the second. A value of 0.1 implies a 10% higher value in the first variable (Va).
For non-negative data, the symmetric difference indication is confined to [-2, 2].
A histogram can be made with any statistical software package or office software. The variance
allows to assess the comparability of the two sources for the variable under study and a mean
that is not equal to zero points to the existence of a source selection bias.
ESSnet Use of Administrative and Accounts Data in Business Statistics Work Package 2:
a: Checklist to assist Member States when investigating the usefulness of administrative data
b: Checklist for the quality of administrative data inputs
35
If the known differences in the definitions of the variables cannot explain the results shown on
the histogram, then this can point to missing information in the variable descriptions or to
undetected problems with the data set.
An example: this histogram shows that using either of the variables has no effect on bias (the
mean close to zero), but the comparability is low for individual cases (high variance). For
example, if a value of 100 is found in source a and 75 in source b, the outcome of the formula
would be approximately 0,28. We see a relatively important part of the surface of the histogram
outside the 0,28 range, both in positive and negative direction.
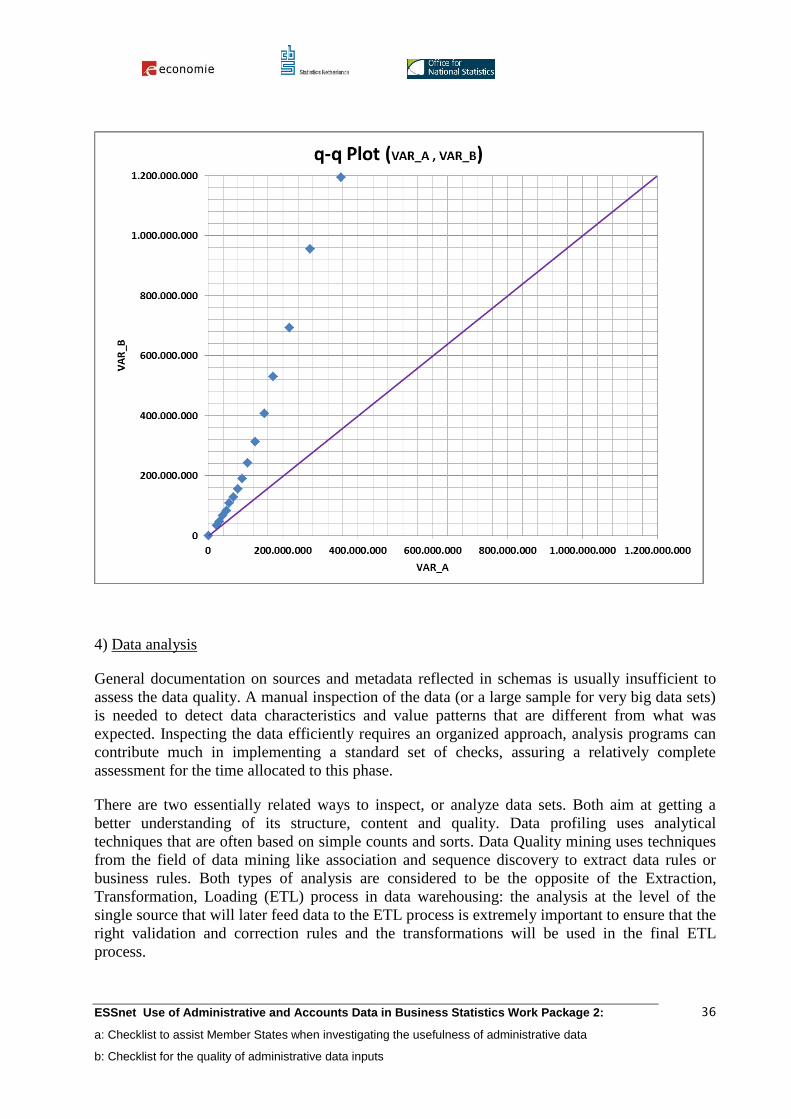
Comparing distributional shapes: Q-Q Plots
An alternative to the histogram is to make a single plot based on the quantile functions for the
two distributions. The quantile functions are linearly related when the two distributions have the
same shape. Usually a reference line is also plotted (45-degree when scales are equal).
One of the advantages of Q-Q plots is that they work well with very large data sets. Algorithms
exist that quickly compute approximate values while using limited memory.
Q-Q plots are a powerful graphical method, because they provide a clear view of how properties
such as skewness, location and scale differ, making it possible to get a better understanding of
the differences. The interpretation requires some practicing.
- the plot follows the reference line: the two distributions are equal
- the plot follows a line (different from the reference line), a linear transformation of one of
the variables can make the distributions equal
- the trend of the plot is steeper than the reference line, the distribution on the vertical axis
is more dispersed than the other
- the trend of the plot is flatter than the reference line, the distribution on the horizontal
axis is more dispersed than the other
- most but not all points on a line: outliers in the data
- a curved pattern points to differences in skewness
- the plot follows a staircase pattern: values may have been rounded
ESSnet Use of Administrative and Accounts Data in Business Statistics Work Package 2:
a: Checklist to assist Member States when investigating the usefulness of administrative data
b: Checklist for the quality of administrative data inputs
36
4) Data analysis
General documentation on sources and metadata reflected in schemas is usually insufficient to
assess the data quality. A manual inspection of the data (or a large sample for very big data sets)
is needed to detect data characteristics and value patterns that are different from what was
expected. Inspecting the data efficiently requires an organized approach, analysis programs can
contribute much in implementing a standard set of checks, assuring a relatively complete
assessment for the time allocated to this phase.
There are two essentially related ways to inspect, or analyze data sets. Both aim at getting a
better understanding of its structure, content and quality. Data profiling uses analytical
techniques that are often based on simple counts and sorts. Data Quality mining uses techniques
from the field of data mining like association and sequence discovery to extract data rules or
business rules. Both types of analysis are considered to be the opposite of the Extraction,
Transformation, Loading (ETL) process in data warehousing: the analysis at the level of the
single source that will later feed data to the ETL process is extremely important to ensure that the
right validation and correction rules and the transformations will be used in the final ETL
process.
ESSnet Use of Administrative and Accounts Data in Business Statistics Work Package 2:
a: Checklist to assist Member States when investigating the usefulness of administrative data
b: Checklist for the quality of administrative data inputs
37
Different data sources and formats have different kind of problems associated with them. Some
are bound to disappear in the future (e.g. mainframe based COBOL programs having no
metadata) while other are evolving over time (unstructured data, XML standards). This reference
document limits itself to the inspection of flat files or data in relational form. Data sets in other
formats are usually transposed to a tabular format before they are used in the statistical process.
With the tabular format in mind, columns and variables are used as synonyms in this document,
as are rows, cases and tuples.
Before the actual data analysis can start, all the available technical metadata of the source data
should be at hand. If not already available from the first phase in the assessment (compare
definitions) further inquiries have to be made. Possible sources are existing metadata
repositories, data dictionaries, program documentation or even user manuals/procedures. This
documentation should be available during the analysis and be kept for later use (together with the
findings from the analysis).
The range of techniques that can be used for data profiling and data quality mining is more
extensive than what is proposed for the checklist. At this stage a quick one time evaluation of
measurable quality aspects is to be made in order to capture the relevant problems with the data.
Other configurations of checks will probably be needed to handle the reception and pre-
processing of the incoming data and to regularly monitor the quality of the incoming data sets.
The relatively complex nature of data mining techniques makes them less suitable for a first
assessment of the usability of the data.
Data profiling:
- is a method of collecting statistics and information about that data. Such statistics help to
identify the use and data quality of metadata.
- clarifies the structure, relationship, content and derivation rules of data, which aid in the
understanding of anomalies within metadata.
- uses different kinds of descriptive statistics including mean, minimum, maximum, percentile,
frequency and other aggregates such as count and sum. The additional metadata information
obtained during profiling is data type, length, discrete values,…
There is a logical order in the types of checks, from very simple analysis of the values in a table,
over analysis of the table structure to the detection of data rules.
The first step in the analysis is to determine whether the whole data set or only a part of it is to
be investigated for further use. In the cases where the content of the data delivery was discussed
with the administrative data holder, a filtering of variables or data can probably be skipped. In
other cases the elimination of unnecessary variables or types of cases can greatly reduce the
effort needed. If the size of the file is too large, one or more samples can be used.
ESSnet Use of Administrative and Accounts Data in Business Statistics Work Package 2:
a: Checklist to assist Member States when investigating the usefulness of administrative data
b: Checklist for the quality of administrative data inputs
38
Most of the checks can be easily coded in SQL, others are more difficult to write. Open Source
or proprietary data profiling applications can be used to set up the checking environment.
There has been a lot of work done on data quality metrics and supporting frameworks .
Producing solid, meaningful indicators for data quality remains difficult. Completeness for
instance, will in most cases be an approximation because the denominator unknown at the time
of measurement. Any measure of accuracy takes only the detected flaws in account. Existing
metrics have the disadvantage that they are context independent: what is good quality depends
on the requirements of the user. Conventional definitions provide no guidance towards practical
improvements of the data. The metrics presented here are based on Pipino and Wang .
Assessing data quality is an ongoing effort where experience suggests that a “one size fits all” set
of metrics is not the best solution. Simple ratios are a good starting point, measuring the ratio of
desired outcomes to total outcomes, or since most people start from counting the “defects”, the
ratio can be reformulated to 1 minus undesirable outcomes divided by total outcomes. As an
alternative, it is also possible to use inverse indicators, where zero is the ideal outcome and one
the worst possible. The use of inverse indicators is recommended when reporting on the quality
of the statistical output, which is covered by work package 6 (WP6) of the ESSnet, where this
topic is treated in detail.
As an illustration of the possible ways of using ratios, WP6 indicator “undercoverage”, which is
calculated after all checking and cleaning of the administrative data has been done, is put side to
side with the “check for completeness” which is part of the first data analysis, and is explained in
the next paragraphs on value analysis checks.
The undercoverage indicator is calculated as the number of relevant units in the reference
population but not in the admin data divided by the number of relevant units in the reference
population, multiplied by 100. The indicator can be expressed in the number of units or as a
weighted indicator (the share of the values represented by these units). E.g. 12% of the units in
the reference population are not in this admin data set, representing 3% of the total value for this
variable. This is a sensible way of describing static characteristics of an output, the end result.
Calculation requires the comparison to a relative gold standard (in most cases the business
register) after special cases have been dealt with (e.g. outliers, unit conversion) and is typically
retroactive to allow for dealing with information that arrives after the data has been used: units
leaving and entering the reference population, late administrative declarations.
The Check for completeness is part of a dynamic process, where progress towards the best
possible result is a guiding principle. For most people it is more intuitive to use a ratio that starts
at zero in the worst possible case to go to one (or 100%) is the best possible case. During the first
assessment of data from a new administrative source it can be used as a crude measure to check
if the data are in line with what was expected. In a later stage the measurement can be refined to
become part of the monitoring system. The check is fundamentally different from the
undercoverage indicator in that it measures the units that are part of both the reference
population and the admin data’s target population. The data are collected with the aim of getting
as closely as possible to 100%. Different conclusions can be made on the basis of these figures,
e.g. “the data set available two months after the reference date contains 40% of the units that are
expected to be part of both the reference population and the admin data, while 98% are available
twenty-four months after the reference date”. The first data analysis is there to provide a rough
ESSnet Use of Administrative and Accounts Data in Business Statistics Work Package 2:
a: Checklist to assist Member States when investigating the usefulness of administrative data
b: Checklist for the quality of administrative data inputs
39
measure, showing the presence or absence of major problems, like the systematic omission of
relevant subpopulations or the existence of outliers that have a serious impact on aggregates.
Reference data from a relative gold standard can be used to set target values for the number of
units and for the main characteristics of the data, but the restrictions for the accuracy of the
denominator are less severe. Using inverse indicators remains possible, in that case it is better to
change the name of the check into missingness: 60% of the units are missing in the T+2 version,
while 2% are missing in the T+24 version. It is recommended to work towards higher
percentages and to inverse the indicators where needed for reporting when the (pre)processing of
the data has finished.
Value analysis checks:
Sources of error: allows to quantify characteristics of the data set that indicate accuracy-issues
and to identify suspect values.
- Check for empty columns and columns with a high ratio of null (or empty) values.
Sometimes a column does not store what it is supposed to store. This is a simple count of
the number of rows, the number of nulls and for text columns the number of blanks. This
is a very basic check, but can be useful to reduce unnecessary testing. High percentages
of null or empty values may indicate a processing error at the source, or that the column
is not used in practice. This test can be run on whole tables or sets of tables in one step.
Ratio: For each column, 1 minus the number of null values to the total number of rows in
the table. This is a very crude measure because it does not take into account that values in
other fields can determine whether null values are to be considered defects or not.
- Check for completeness. If the number of records in the previous check is not indicative
of overtly missing data, then run basic statistics (sum, median,..) for the main variables,
or combine both checks for efficiency. Compare these results with those expected on the
basis of the collected documentation and the results from other sources. Results are based
on a subjective assessment, the use of boxplots is recommended when comparing with
data from other sources as they give a direct impression of the main characteristics.
- Check whether the format of the data in the data set conforms to the format in the
technical metadata. Ratio: For each column, 1 minus the number of values that do not
comply with the documented data type to the total number of rows in the table. If
necessary adapt the metadata and recalculate the ratio.
- Check the length distribution of values in a column where appropriate. This is useful in
columns where one or more typical lengths are expected. An example of a variable with a
standard format is that of car license numbers, where impossible lengths are easily
detected. Ratio: For chosen columns, 1 minus the number of values that do not comply
with the documented format to the total number of rows in the table.
- Match data with the list of accepted codes or values, either classifications (e.g. NACE
code) or values defined in the metadata that came with the data. Values that are not on
the control list can be data entry errors, or inconsistencies in value representation due to
ESSnet Use of Administrative and Accounts Data in Business Statistics Work Package 2:
a: Checklist to assist Member States when investigating the usefulness of administrative data
b: Checklist for the quality of administrative data inputs
40
different spelling or changes over time (eliminated from the metadata but still in the data,
or new codes not yet in the metadata). The check may also show deviations from official
classifications. Control values that are not present in the data set require special attention:
possibly some subsets of existing cases were not captured for data transfer at the level of
the source. It is best to note this for later follow-up. Ratio: For chosen columns, 1 minus
the number of values that do not comply with the control list to the total number of rows
in the table.
- Check for special values. Special values are either incoherent representations of an object
or values that are not expected to appear in the data, given the restrictions in the metadata
or just common sense. As this is very domain dependent, it is impossible to give a
complete list of possible checks. A distinction can be made between data rules where
values have to be consistent with technical metadata and conform to a number of logical
requirements (e.g. subtotals add up to total, end day is not before start day..) and business
rules (e.g. businesses active in sector A fill out form B, section 2). The information
gathered in the previous phases is not always sufficient, it is better to have a closer look
at the actual data:
o Look for spikes and dips in the distribution. Values that are more frequent than
expected can point to censoring (all values under- or above certain thresholds get
the threshold value ore some predetermined value). Count distinct values for
discrete variables if there is no predetermined list of accepted values, and look for
synonyms, misspellings, indications of missing data (9999,..), and so-called
spurious integrity (more or less dummy values with no relation to reality, like
“qwerty” or “12345”. While it is easy to write a query in SQL to display an
ordered list of distinct values with their frequency, the time needed to run these
queries can be problematic.
o Find values out of a predetermined range. This range can come from the metadata
or from domain expertise, but also the basic statistics produced in the
completeness check can be used by showing the results in a boxplot to get an
indication of which values can be considered to be outliers. Ratio: For chosen
columns, 1 minus the number of values outside the range to the total number of
rows in the table.
Structure analysis checks:
Sources of error: allows to quantify characteristics of the data set that indicate processing-errors
and to identify suspect cases.
The data received from the administrative data holder can be in different forms. It can be one
table, a set of tables. It can be a “photograph” of the situation on a certain date or a list of
transactions over a period. In the large majority of cases, there is a treatment of past and present
data at the level of the administration that is not directly visible to the NSI.
ESSnet Use of Administrative and Accounts Data in Business Statistics Work Package 2:
a: Checklist to assist Member States when investigating the usefulness of administrative data
b: Checklist for the quality of administrative data inputs
41
Some testing will have to be done to find out the structure of the tables that arrive at the NSI.
Typical issues that could be found are the result from inappropriate linking of data or
undocumented relationships between variables in the data set.
- Check uniqueness of primary keys. Multiple rows with the same primary key are easily
detected and an obvious sign of problems with the data (duplicates). It may however be
possible to find more than one candidate primary key. Apart from an id-code there can be
a logical key, for example a combination of name and address that ought to be unique for
each row. Testing these natural keys may bring up issues. A typical example is the
situation where id numbers are assigned by regional offices. Units of interest moving
from one region to another and get a new id number before they are deregistered in their
previous region. Ratio: For each unique key, 1 minus the number of values that do not
conform to the unique key requirements to the total number of rows in the table.
- Check functional dependencies: the extent to which the values in one column (the
dependent column) depend on the values in another column or set of columns. An
example that could be found in tax files is the relation between zip code of the reporting
unit and the id number of the tax office. If, according to the metadata, respondents always
have to report to their local tax office, the dependency strength should be 100%: for
every distinct zip code (dependent value) there should be one distinct tax office. (e.g. out
of 200 units in zip code 1210 there are 199 with office code A and 1 with code B, the
dependency is 99,5%). For efficiency reasons, the number of combinations of columns to
check should be kept low. Good knowledge of the administrative processes is helpful in
selecting the right checks. When tests show inconsistencies, the non-conforming rows
should be looked at to get an idea of what happened: in the tax office example the
differences could be caused by encoding errors, or could also be related to a different
timing in the updating of address information. Sometimes previously undocumented
metadata can be found (e.g. specific cases treated by one specialised office).
- Check relationships. Quantify the relationship between either keys in related tables or
variables in the same table. The results should give the relative size and exact counts of
three possible outcomes for referential relationships: joins, orphans, and childless objects.
If there is a table with an employer id and another table with both local unit id and
employer id, all records with matching employer id are counted as joins, the records in
the local unit table with no matching employer id in the employer table are counted as
orphans, and the records in the employer table with no match in the local unit table are
counted as childless objects. Ratio: for each foreign key, the number of rows that are
childless to the total number of rows in the table.
- A special case of functional dependencies / relationships is that of redundancy of data
within or between tables. If in the example on the previous paragraph the location of the
employer would have been present in both tables, then the column in the local unit table
was redundant.
ESSnet Use of Administrative and Accounts Data in Business Statistics Work Package 2:
a: Checklist to assist Member States when investigating the usefulness of administrative data
b: Checklist for the quality of administrative data inputs
42
Data Quality Mining:
Sources of error: indicates patterns in the data that are not necessarily known, making it possible
to detect accuracy-issues, either systematic misreporting, processing errors or suspect values.
Data mining helps discover specific data patterns in large data sets. This is the focus of so-called
descriptive data mining models including clustering, summarization, association discovery and
sequence discovery. Integrity constraints for functional dependencies or specific “business rules”
can be derived, which can then be used to complete missing values, correct illegal values and
identify duplicate records. For example, an association rule with high confidence can hint to data
quality problems in records violating this rule. A confidence of 99% for rule “Variable A <
Variable B / Variable C” indicates that 1% of the records do not comply and may require closer
examination.
Checking for special values or for functional dependencies during value analysis can be
considered as the most simple form of analyzing data with the purpose of discovering patterns,
The “mining approach” differs from the value analysis approach in that value analysis starts
from given rules (metadata, domain knowledge) or intuitive patterns (e.g. outlier = quartile
distance * 4) while the mining approach is based on methods for discovering non intuitive
patterns in a systematic way.
As noted before, the data profiling checks are probably sufficient. Data mining techniques
provide more advanced ways of detecting/isolating special cases, but come at an additional cost
(time). The information gathered during the assessment phase will serve as a good starting point
for further investigations.
A technique that fits in this category, is checking the conformity of data to Benford’s Law. It is a
simple technique and a good example of a very nonintuitive pattern. The law pertains to the first
digits of a collection of numbers, like stock market prices, number of inhabitants of cities,..
Against most people’s intuition, the “1” digit leads approximately 30% of the time, going down
gradually with “9” occurring less than 5% of the time. The check is in line with the philosophy
of data mining: searching large volumes of data for patterns without any reference to theories of
the data generating process.
The distribution of first digits can be calculated with the following formula:
P(d) = log10 [ (1 + d ) / d ]
The use of the formula is illustrated with a diagram where the distribution of the first digit for a
sample of 42.000 turnover figures filed by businesses to the tax office. The graph shows that
VAT data follow Benford’s Law closely. (a threshold exists: enterprises with a turnover less than
€5.580 can get exempted).
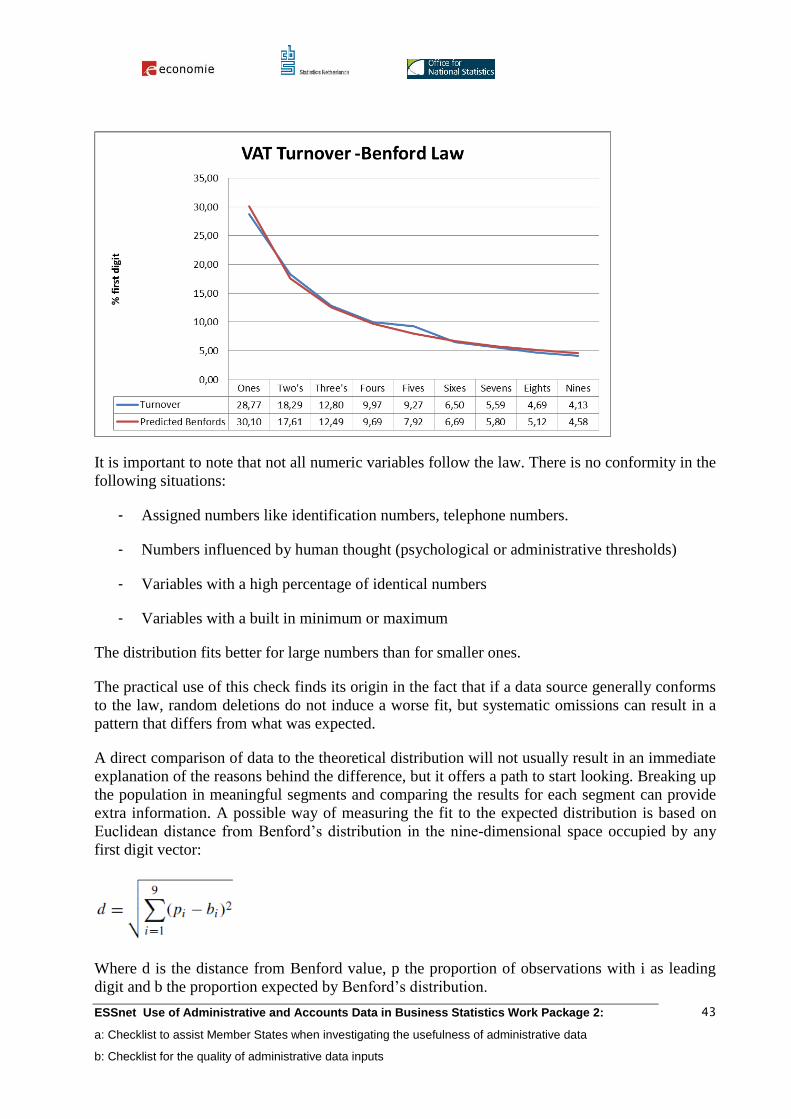
ESSnet Use of Administrative and Accounts Data in Business Statistics Work Package 2:
a: Checklist to assist Member States when investigating the usefulness of administrative data
b: Checklist for the quality of administrative data inputs
43
It is important to note that not all numeric variables follow the law. There is no conformity in the
following situations:
- Assigned numbers like identification numbers, telephone numbers.
- Numbers influenced by human thought (psychological or administrative thresholds)
- Variables with a high percentage of identical numbers
- Variables with a built in minimum or maximum
The distribution fits better for large numbers than for smaller ones.
The practical use of this check finds its origin in the fact that if a data source generally conforms
to the law, random deletions do not induce a worse fit, but systematic omissions can result in a
pattern that differs from what was expected.
A direct comparison of data to the theoretical distribution will not usually result in an immediate
explanation of the reasons behind the difference, but it offers a path to start looking. Breaking up
the population in meaningful segments and comparing the results for each segment can provide
extra information. A possible way of measuring the fit to the expected distribution is based on
Euclidean distance from Benford’s distribution in the nine-dimensional space occupied by any
first digit vector:
Where d is the distance from Benford value, p the proportion of observations with i as leading
digit and b the proportion expected by Benford’s distribution.
ESSnet Use of Administrative and Accounts Data in Business Statistics Work Package 2:
a: Checklist to assist Member States when investigating the usefulness of administrative data
b: Checklist for the quality of administrative data inputs
44
Possible outcomes of the check are mostly the detection of thresholds and the use of default
values in the administrative data.
Step 3: Evaluation
When characteristics of the administrative data and requirements for output match, a direct use
of the administrative data becomes possible. In many cases the match will not be complete. The
options for a less than complete match, depend partially on whether one wants to replace existing
surveying or if the evaluation is made with the intention of creating a new output.
In the first situation, a partial replacement offers a direct advantage, reduction of survey burden
at the cost of a higher complexity and extra dependency on external sources. In the second
situation, starting a survey, even partially, cold be seen as more problematic in member states
where the reduction of response burden is high on the agenda.
Whatever the outcome of the evaluation, it is always recommended:
- to do a regular follow up on the selected- and on related administrative sources: the creation of
new administrative data collections or plans to change them in the future could present new
opportunities or threats. If the underlying administrative definitions and procedures change, then
this may invalidate the outcome of the evaluation.
The information gathered during the assessment should allow to decide if and how the data can
be used to produce statistical output. Possible outcomes are:
a) The administrative data are unfit for the intended use
This could be due to data provision related aspects (timeliness, punctuality, dependency risk) or
content related aspects (variable definitions, units, accuracy)
In the context of an NSI, this leaves the choice apparently to either continue (or start) surveying,
or to have no output. It is recommended:
- to share this information with contact persons from the administrative source. In some cases an
oversight of the main reasons why the data cannot be used for statistics will underpin the need
for improvements in the future. It is also an opportunity to receive feedback from the
administrative data holder on the validity of the decisions made, and to get confirmation that no
alternatives were forgotten.
- that when the obstacles for using the administrative data are manageable, a list is made of the
improvements needed to make the data fit for use, and of the actions needed to induce the
change. These actions could be for instance a change in the legal base, modification of a form or
changes in the administrative data collection workflow.
ESSnet Use of Administrative and Accounts Data in Business Statistics Work Package 2:
a: Checklist to assist Member States when investigating the usefulness of administrative data
b: Checklist for the quality of administrative data inputs
45
- to check if some of the variables can be used in a survey as auxiliary information for the
calculation of weights, calibration,..
When the administrative data have shown to be unfit for the intended use, two methodological
options remain.
Indirect use: when the administrative data are used as auxiliary information in the production
of statistical output. For example the information on the entering and leaving of units in the
target population is not always available in time from the administrative source that provides the
actual measurements, but might be already available from another administrative source. This
second source allows to improve the production indirectly. Indirect use differs from transformed
in that it is not the main factor in a transformation. Administrative data are also used for other
purposes within a statistical office, they are used to maintain the business register and in this way
also to provide sampling frames, maintain contact information needed for data collection, etc.
This could also be seen as indirect use from the checklist viewpoint
Use other sources: it is better to discover that the data will not deliver acceptable results before
any real output is produced. Compared to a failed production of statistics, considerable savings
might have been made. Comparing the requirements for the statistical output with the data in the
administrative source can lead to a better understanding of the concepts to be measured, which in
turn can be helpful to find betters sources or to avoid measurement errors in a survey by
formulating unambiguous questions.
b) The administrative data can be used to some extent, but cannot entirely replace the use of
other sources (i.e. surveying)
In this case a mixture of different solutions may be possible and/or required. In theory the
administrative data holder might agree to make changes to the administrative procedures, this is
more of a long term option without guaranteed success. The recommendations made for unfit
data, i.e. sharing the results with the data holder and listing possible actions for improvement or
workarounds, remain viable. More immediate options are to combine the administrative data
collection with surveying that part of the target population that is not covered by the
administrative data, to reduce the number of questions asked in a survey and replace them with
administrative variables, or a combination of the above.
When the administrative data are partially fit for the intended use, 2 methodological options
remain.
Partial unmodified use: when the administrative source only covers a subset of the target
population, or when specific administrative rules apply for certain subpopulations. Also quality
considerations can play a role (accuracy within acceptable limits for e.g. the smallest units, but
not for the large ones)
Partial transformed use: a transformation is applied that enables to estimate values for a subset
of the target population.
ESSnet Use of Administrative and Accounts Data in Business Statistics Work Package 2:
a: Checklist to assist Member States when investigating the usefulness of administrative data
b: Checklist for the quality of administrative data inputs
46
c) The administrative data can be used to some extent, but cannot directly replace all values.
Some modelling to estimate values is required.
This situation leads to the following option:
Complete transformed use: when differences arising from the use of other definitions for the
administrative variable can be overcome by modelling its relationship to other information that is
available. An example of transformed use is the estimation of “hours worked” that cannot be
found directly from administrative records, from existing variables like days paid, holiday pay,
number of public holidays, etc… When respondents have different reporting frequencies, e.g.
quarterly and monthly there might be a possibility to estimate monthly figures for the target
population.
d) The administrative data are completely fit for the intended use. The values in the
administrative records can be used immediately without modification.
This situation leads to the following option:
Complete unmodified use: the data becomes the measurement for the units in the target
population.
There is no magic formula that allows to make a straightforward connection between the
outcome of an assessment and the choice for one or more of the methodological options. Using
the checklist allows to rule out inappropriate choices and mainly helps to detect possible sources
of bias. The checking procedure is the basis for an informed decision on the efforts to be made
and the expected quality of the results that come with them.
NSIs are regularly confronted with similar problems, but the options chosen depend on the
institutional context and choices made in the past (the production of a statistical output is part of
a larger whole of related statistics). This can be illustrated by highlighting a few typical problems
and how they affect statistical production in different settings.
The New Zealand case was presented to introduce the usage-specific checking of admin data,
and in the example two reporting structure issues affected the fitness for use of GST data for
some of the units involved. VAT and GST are comparable types of admin data, and in fact the
problems encountered with GST data are similar to the problems that multiple NSIs have
detected with VAT data.
- GST data are collected for the legal unit, and those legal units that do not correspond to a
statistical unit with activity in a single industry may not be fit for use without some
transformation. (unit mismatch)
- The second issue is that a group of legal units linked by ownership is allowed to provide
data in a total which is collected against one unit whilst other units in the group record
zero values. (special reporting group)

ESSnet Use of Administrative and Accounts Data in Business Statistics Work Package 2:
a: Checklist to assist Member States when investigating the usefulness of administrative data
b: Checklist for the quality of administrative data inputs
47
Statistics Norway and Statistics Denmark both draw the attention to the special reporting group
issue in their “VAT-Statistics” published metadata13
. Norway redistributes the turnover to the
lowest level, the establishments, using information from the Central Register of Establishments
and Enterprises. Denmark holds a yearly survey among the largest approximately 260 joint
registration units to calculate standard distribution percentages. The total for each joint
registration unit is distributed over the legal units.
Statistics Netherlands14
describes the problem of unit types in economic statistics and proposes
methods for handling incompleteness of a variable at the level of statistical units due to
incoherencies in unit types and in variable definitions of source compared to target data. In their
cited paper, they deal with the estimation of turnover levels and growth rates, based on VAT
declarations and survey data. Turnover is estimated for the target population which consists of
the statistical unit enterprise. In the Netherlands, like in Germany and a number of other
countries, tax units may be related to more than one enterprise. Tax- and statistical units are both
composed of legal units, but their composition may be different.
The methodological option chosen by Statistics Netherlands is to survey all topX enterprises (a
selection of large and complex enterprises). Estimation methods were developed to cope with
non response in the topX survey and for non-topX enterprises that have no one-on-one relation
with a tax unit.
According to the cited publication, the German Statistical Office uses a linear regression model
where logtransformed turnover per enterprise is estimated from NACE code, from number of
employees and number of local units. The resulting estimated turnover is summed up to the
estimated total of a group of enterprises. The result is adjusted to the observed VAT turnover at
enterprise group level.
This selection of four different solutions to the same problem shows that a good knowledge of
the weaknesses and strengths of the available admin data does not necessarily lead to one single
best outcome. Checklists can’t replace methodologists, they are helpful to bring together the
elements for a decision and to show possible options. Exchange of views on good practices will
in time lead to a broader consensus on what are the most appropriate actions in a number of
situations.
In the New Zealand case, timeliness was good enough for the intended use, publication of sub-
annual business establishment collections Assessment of the data showed that 85% to 95% of
data by value is available within the publication timeframes. The timeliness issue of intra-annual
statistics making use of admin data is treated by work package 4 (WP4) of this ESSnet.
(estimates for turnover growth rates based on theVAT register and estimates for employment
growth rates based on social security registers)
WP4 lists a decision tree for selecting the best methodological option based on the availability of
admin data within the required timeframe. This work fits in the evaluation part of the checklist
13 http://www.ssb.no/vis/efuoi_en/about.html and
http://www.dst.dk/en/Statistik/dokumentation/Declarations/purchases-and-sales-by-firms---vat-statistics--.aspx 14
Handling incompleteness after linkage to a population frame : incoherence in unit types, variables and periods;A
van Delden, K van Bemmel;Discussion paper 201208; Statistics Netherlands

ESSnet Use of Administrative and Accounts Data in Business Statistics Work Package 2:
a: Checklist to assist Member States when investigating the usefulness of administrative data
b: Checklist for the quality of administrative data inputs
48
procedure as recommendations are made to select different options on the basis of measured
characteristics of the administrative data and requirements for statistical output.
ESSnet Use of Administrative and Accounts Data in Business Statistics Work Package 2:
a: Checklist to assist Member States when investigating the usefulness of administrative data
b: Checklist for the quality of administrative data inputs
49
Checklist to Investigate the Usefulness of Administrative Data
Usage-specific checklist (USC)
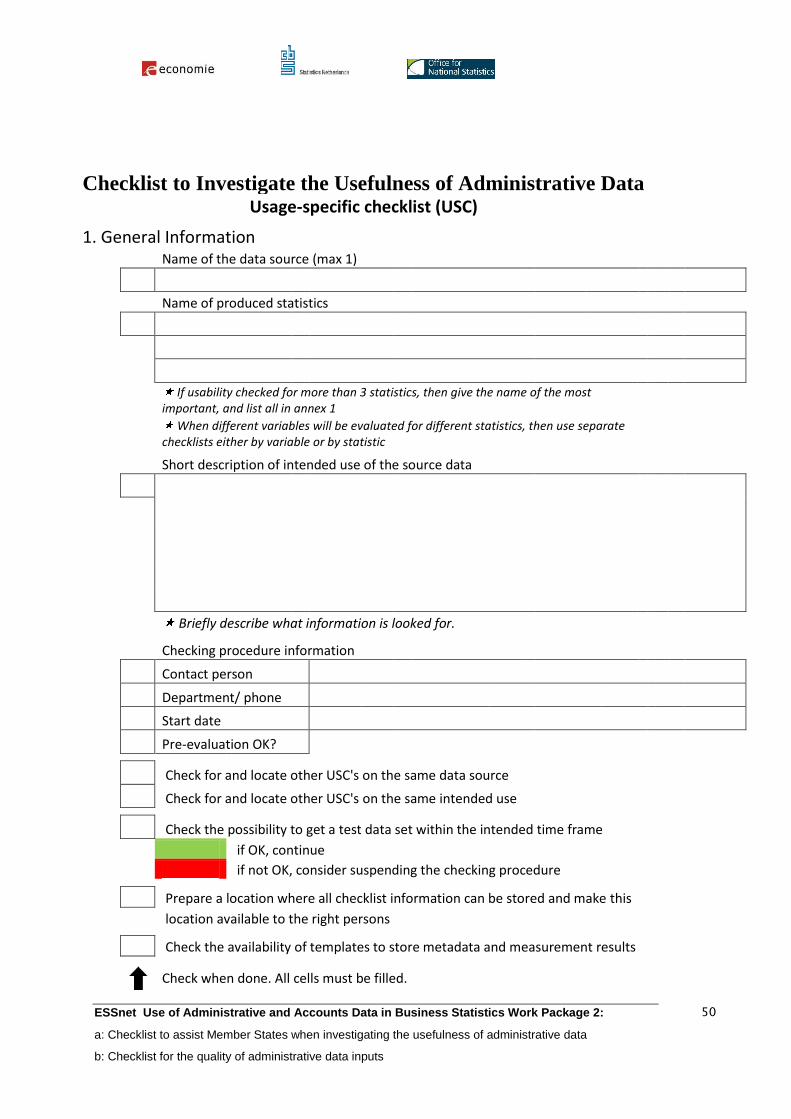
ESSnet Use of Administrative and Accounts Data in Business Statistics Work Package 2:
a: Checklist to assist Member States when investigating the usefulness of administrative data
b: Checklist for the quality of administrative data inputs
50
Checklist to Investigate the Usefulness of Administrative Data Usage-specific checklist (USC)
1. General Information
Name of the data source (max 1)
Name of produced statistics
If usability checked for more than 3 statistics, then give the name of the most important, and list all in annex 1
When different variables will be evaluated for different statistics, then use separate checklists either by variable or by statistic
Short description of intended use of the source data
Briefly describe what information is looked for.
Checking procedure information
Contact person
Department/ phone
Start date
Pre-evaluation OK?
Check for and locate other USC's on the same data source
Check for and locate other USC's on the same intended use
Check the possibility to get a test data set within the intended time frame
if OK, continue
if not OK, consider suspending the checking procedure
Prepare a location where all checklist information can be stored and make this
location available to the right persons
Check the availability of templates to store metadata and measurement results
Check when done. All cells must be filled.
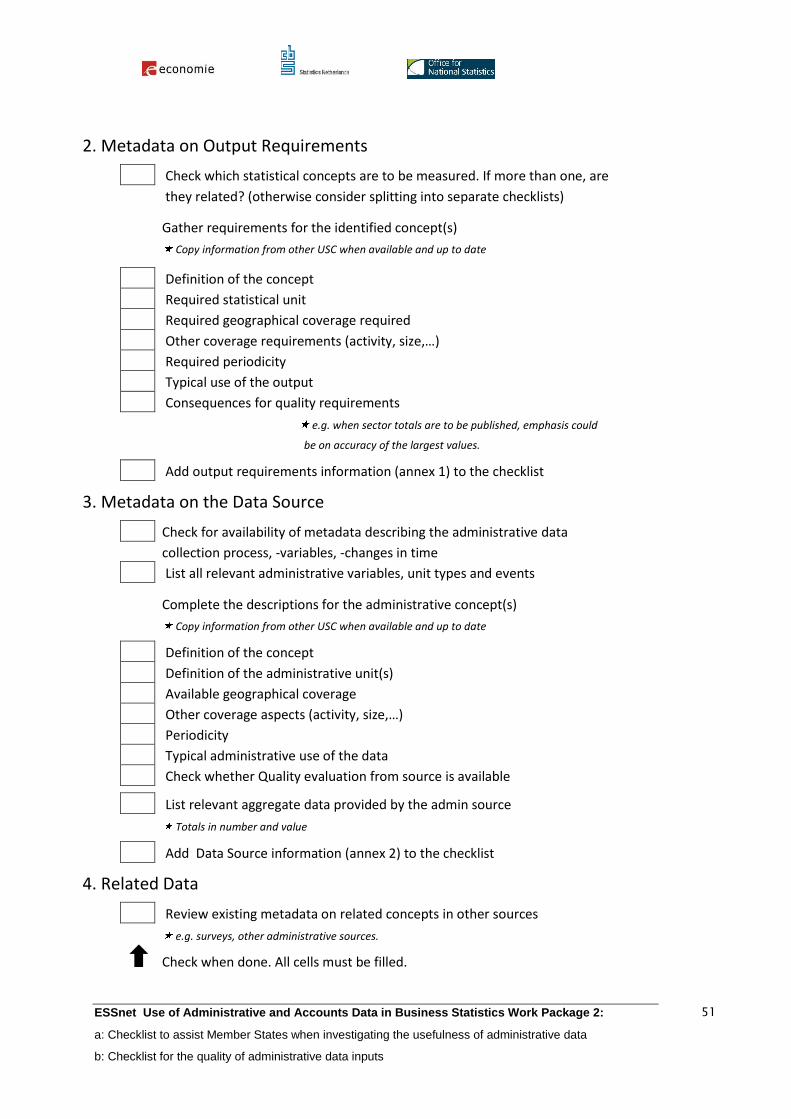
ESSnet Use of Administrative and Accounts Data in Business Statistics Work Package 2:
a: Checklist to assist Member States when investigating the usefulness of administrative data
b: Checklist for the quality of administrative data inputs
51
2. Metadata on Output Requirements
Check which statistical concepts are to be measured. If more than one, are
they related? (otherwise consider splitting into separate checklists)
Gather requirements for the identified concept(s)
Copy information from other USC when available and up to date
Definition of the concept
Required statistical unit
Required geographical coverage required
Other coverage requirements (activity, size,…)
Required periodicity
Typical use of the output
Consequences for quality requirements
e.g. when sector totals are to be published, emphasis could
be on accuracy of the largest values.
Add output requirements information (annex 1) to the checklist
3. Metadata on the Data Source
Check for availability of metadata describing the administrative data
collection process, -variables, -changes in time
List all relevant administrative variables, unit types and events
Complete the descriptions for the administrative concept(s)
Copy information from other USC when available and up to date
Definition of the concept
Definition of the administrative unit(s)
Available geographical coverage
Other coverage aspects (activity, size,…)
Periodicity
Typical administrative use of the data
Check whether Quality evaluation from source is available
List relevant aggregate data provided by the admin source
Totals in number and value
Add Data Source information (annex 2) to the checklist
4. Related Data
Review existing metadata on related concepts in other sources
e.g. surveys, other administrative sources.
Check when done. All cells must be filled.
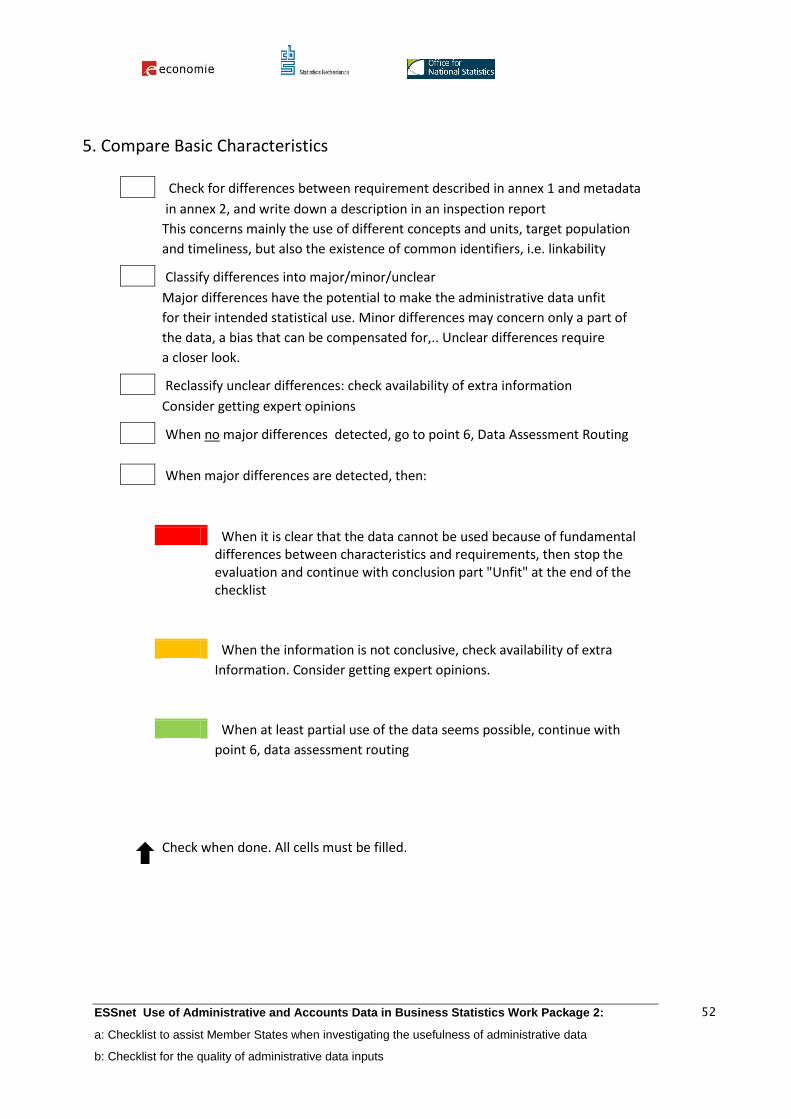
ESSnet Use of Administrative and Accounts Data in Business Statistics Work Package 2:
a: Checklist to assist Member States when investigating the usefulness of administrative data
b: Checklist for the quality of administrative data inputs
52
5. Compare Basic Characteristics
Check for differences between requirement described in annex 1 and metadata
in annex 2, and write down a description in an inspection report
This concerns mainly the use of different concepts and units, target population
and timeliness, but also the existence of common identifiers, i.e. linkability
Classify differences into major/minor/unclear
Major differences have the potential to make the administrative data unfit
for their intended statistical use. Minor differences may concern only a part of
the data, a bias that can be compensated for,.. Unclear differences require
a closer look.
Reclassify unclear differences: check availability of extra information
Consider getting expert opinions
When no major differences detected, go to point 6, Data Assessment Routing
When major differences are detected, then:
When it is clear that the data cannot be used because of fundamental
differences between characteristics and requirements, then stop the evaluation and continue with conclusion part "Unfit" at the end of the checklist
When the information is not conclusive, check availability of extra
Information. Consider getting expert opinions.
When at least partial use of the data seems possible, continue with
point 6, data assessment routing
Check when done. All cells must be filled.
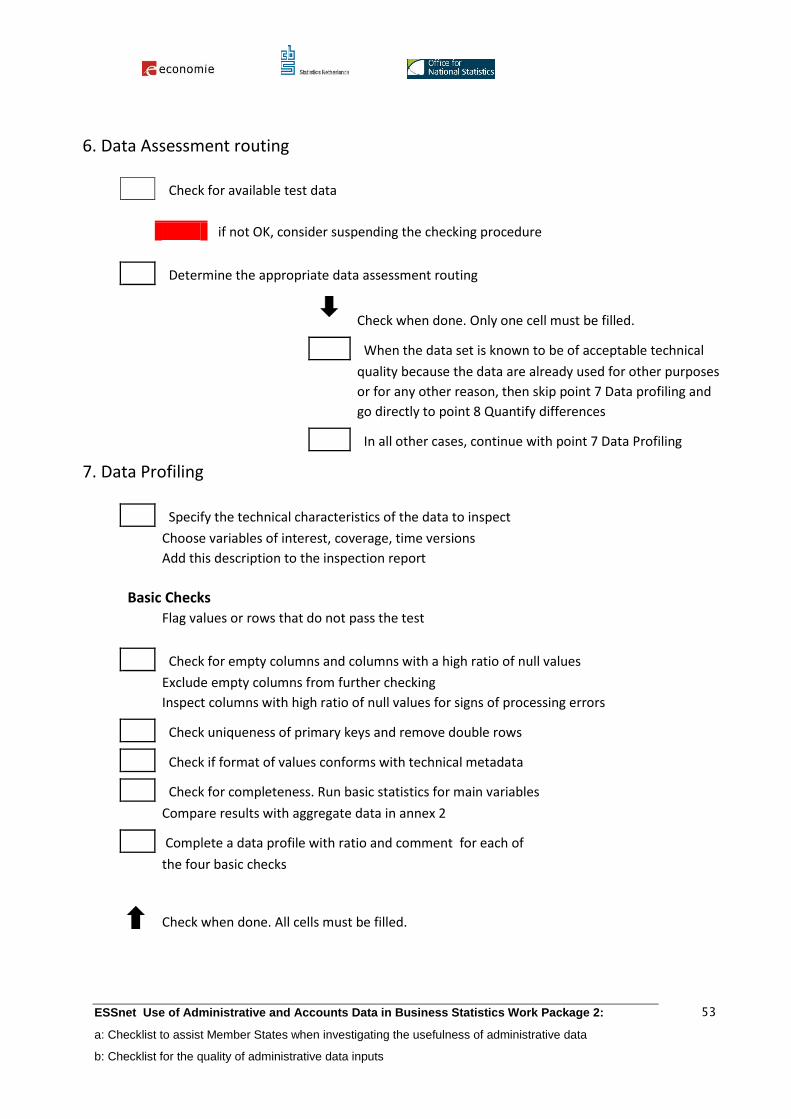
ESSnet Use of Administrative and Accounts Data in Business Statistics Work Package 2:
a: Checklist to assist Member States when investigating the usefulness of administrative data
b: Checklist for the quality of administrative data inputs
53
6. Data Assessment routing
Check for available test data
if not OK, consider suspending the checking procedure
Determine the appropriate data assessment routing
Check when done. Only one cell must be filled.
When the data set is known to be of acceptable technical
quality because the data are already used for other purposes
or for any other reason, then skip point 7 Data profiling and
go directly to point 8 Quantify differences
In all other cases, continue with point 7 Data Profiling
7. Data Profiling
Specify the technical characteristics of the data to inspect
Choose variables of interest, coverage, time versions
Add this description to the inspection report
Basic Checks
Flag values or rows that do not pass the test
Check for empty columns and columns with a high ratio of null values
Exclude empty columns from further checking
Inspect columns with high ratio of null values for signs of processing errors
Check uniqueness of primary keys and remove double rows
Check if format of values conforms with technical metadata
Check for completeness. Run basic statistics for main variables
Compare results with aggregate data in annex 2
Complete a data profile with ratio and comment for each of
the four basic checks
Check when done. All cells must be filled.
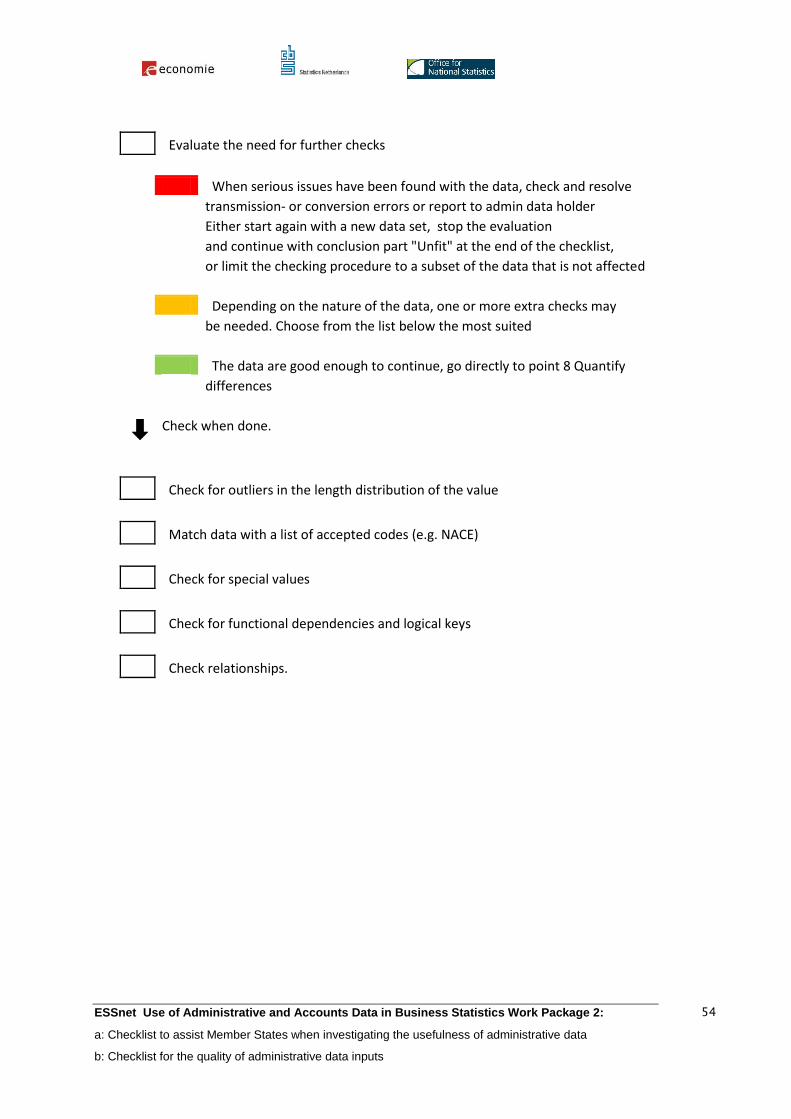
ESSnet Use of Administrative and Accounts Data in Business Statistics Work Package 2:
a: Checklist to assist Member States when investigating the usefulness of administrative data
b: Checklist for the quality of administrative data inputs
54
Evaluate the need for further checks
When serious issues have been found with the data, check and resolve
transmission- or conversion errors or report to admin data holder
Either start again with a new data set, stop the evaluation
and continue with conclusion part "Unfit" at the end of the checklist,
or limit the checking procedure to a subset of the data that is not affected
Depending on the nature of the data, one or more extra checks may
be needed. Choose from the list below the most suited
The data are good enough to continue, go directly to point 8 Quantify
differences
Check when done.
Check for outliers in the length distribution of the value
Match data with a list of accepted codes (e.g. NACE)
Check for special values
Check for functional dependencies and logical keys
Check relationships.
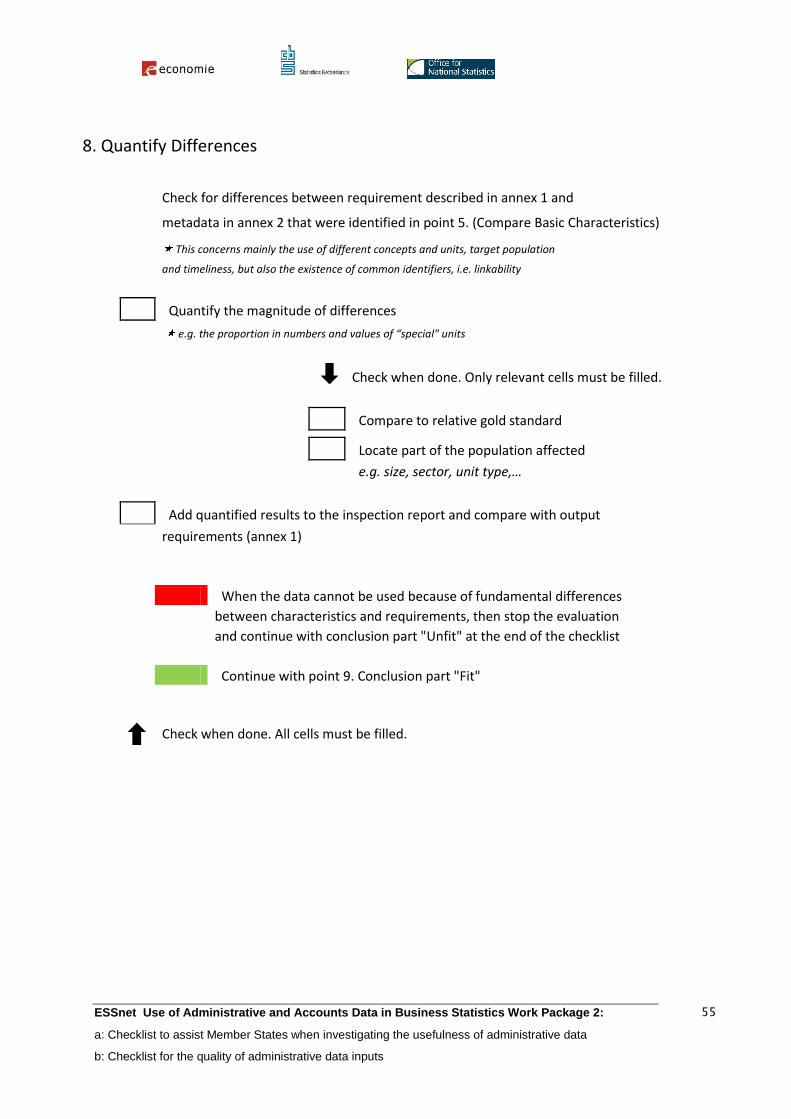
ESSnet Use of Administrative and Accounts Data in Business Statistics Work Package 2:
a: Checklist to assist Member States when investigating the usefulness of administrative data
b: Checklist for the quality of administrative data inputs
55
8. Quantify Differences
Check for differences between requirement described in annex 1 and
metadata in annex 2 that were identified in point 5. (Compare Basic Characteristics)
This concerns mainly the use of different concepts and units, target population
and timeliness, but also the existence of common identifiers, i.e. linkability
Quantify the magnitude of differences
e.g. the proportion in numbers and values of “special" units
Check when done. Only relevant cells must be filled.
Compare to relative gold standard
Locate part of the population affected
e.g. size, sector, unit type,…
Add quantified results to the inspection report and compare with output
requirements (annex 1)
When the data cannot be used because of fundamental differences
between characteristics and requirements, then stop the evaluation
and continue with conclusion part "Unfit" at the end of the checklist
Continue with point 9. Conclusion part "Fit"
Check when done. All cells must be filled.
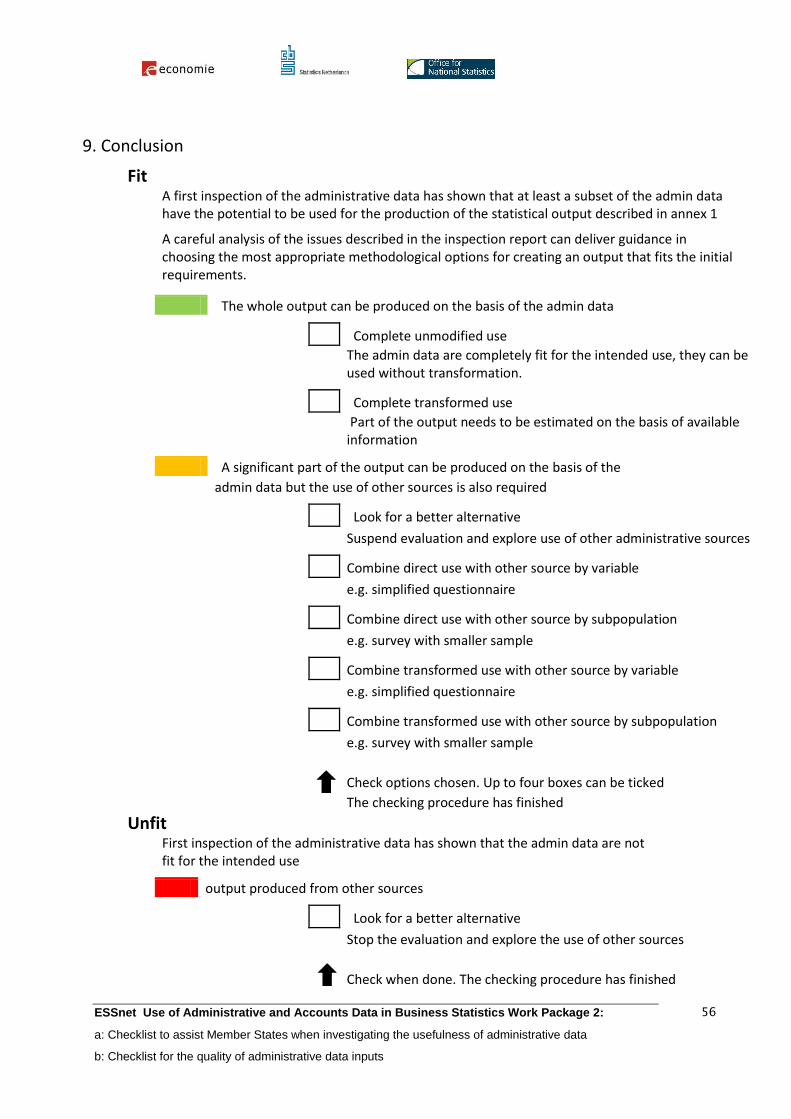
ESSnet Use of Administrative and Accounts Data in Business Statistics Work Package 2:
a: Checklist to assist Member States when investigating the usefulness of administrative data
b: Checklist for the quality of administrative data inputs
56
9. Conclusion
Fit
A first inspection of the administrative data has shown that at least a subset of the admin data have the potential to be used for the production of the statistical output described in annex 1
A careful analysis of the issues described in the inspection report can deliver guidance in choosing the most appropriate methodological options for creating an output that fits the initial requirements.
The whole output can be produced on the basis of the admin data
Complete unmodified use
The admin data are completely fit for the intended use, they can be used without transformation.
Complete transformed use
Part of the output needs to be estimated on the basis of available information
A significant part of the output can be produced on the basis of the
admin data but the use of other sources is also required
Look for a better alternative
Suspend evaluation and explore use of other administrative sources
Combine direct use with other source by variable
e.g. simplified questionnaire
Combine direct use with other source by subpopulation
e.g. survey with smaller sample
Combine transformed use with other source by variable
e.g. simplified questionnaire
Combine transformed use with other source by subpopulation
e.g. survey with smaller sample
Check options chosen. Up to four boxes can be ticked
The checking procedure has finished
Unfit
First inspection of the administrative data has shown that the admin data are not fit for the intended use
output produced from other sources
Look for a better alternative
Stop the evaluation and explore the use of other sources
Check when done. The checking procedure has finished
ESSnet Use of Administrative and Accounts Data in Business Statistics Work Package 2:
a: Checklist to assist Member States when investigating the usefulness of administrative data
b: Checklist for the quality of administrative data inputs
57
10. Archiving
Date of finalising:
After completion of the checking procedure, the checklist should be stored for later consultation
together with the annexes:
Annex 1 contains the metadata on output requirements at the time of the check. When a metadata
repository is kept at the level of the NSI, the information in this annex and in the repository
should be coherent. In the case of an already existing or previously planned statistical output, the
metadata will normally be the source of the information in this annex. If not, use the annex to
feed into the metadata repository.
Annex 2 contains the metadata on the data source. . When a metadata repository is kept at the
level of the NSI, the information in this annex and in the repository should be kept coherent.
The inspection report contains a list of differences between input specifications and output
requirements, with their respective description and rating. For every check executed in the data
assessment, a quantified result is noted and a comment is added.
ESSnet Use of Administrative and Accounts Data in Business Statistics Work Package 2:
a: Checklist to assist Member States when investigating the usefulness of administrative data
b: Checklist for the quality of administrative data inputs
58
2.2 Contacting the Administrative Data Holder
In the classical “one data collection for one survey” situation (the so-called stovepipe model) it
was not unusual that more than one version of the same administrative data arrived at the
statistical office. Different subject statisticians with different contacts within the administration
organised their own data streams, often not knowing about each other. As this is recognised not
to be an ideal situation, the trend is towards better organised procedures. How these contacts are
regulated at national level and organised the level of the NSI differs from country to country.
Legislation provides a key foundation for the use of administrative data sources for statistical
purposes. The European Statistical Act15
grants access to administrative data sources to the
extent that these data are necessary for the development, production and dissemination of
European statistics. In Finland, the Statistics Act obliges state authorities to provide Statistics
Finland with such data in their possession that are necessary for the production of statistics, and
gives Statistics Finland the right to access unit level administrative data with identification data
and to link them for statistical purposes. The cooperation with admin data holders is formally
organised within the coordination system of the Finnish official statistics: each register authority
(admin data holder) has a contact person appointed whose job it is to maintain open channels of
communication with that authority, to monitor developments within the field concerned, and to
work towards maintaining or improving the statistical applicability of register data. As his or
hers counterpart, each register authority has nominated a statistics contact person. In addition,
Statistics Finland arranges annual meetings on the Directors General level with register
authorities to discuss key issues and monitor progress in cooperation. Finnish authorities
responsible of keeping basic registers also have a joint task force, the Register Pool. This group
has the objective of promoting information exchange and cooperation among register authorities
with a view to improving register usability and consistency, developing the contents, quality and
accessibility of basic registers, facilitating the creation of effective information markets, and
increasing cooperation among basic registers16
.
In other countries, individual agreements with data providers are the formal basis for
cooperation, and the day to day practical problems encountered bring up the need for a closer
less formal but well organised cooperation. Since 1996 Istat has had the right by law to access to
all public administrative data and registers and has the theoretical right to influence the process
of modification of administrative information collected by public institutions. The National
Social Security Institute (INPS) is one of the most important public agencies participating in the
Italian National Statistical System. In 2000 a specific “service level agreement” for data flows
needed for Short Term Statistics was set up (the Oros project). INPS data flows have always
been accurate and on time not only because of those formal agreements but also because of the
development and maintenance of a strong informal cooperation between provider and Istat
officers practically involved in the flow. To succeed in preventing any unexpected kind of
15 Regulation (EC) No 223/2009 on European statistics
16 Use of Register and Administrative Data Sources for Statistical Purposes, Best Practices of Statistics Finland,
Helsinki ; 2004
ESSnet Use of Administrative and Accounts Data in Business Statistics Work Package 2:
a: Checklist to assist Member States when investigating the usefulness of administrative data
b: Checklist for the quality of administrative data inputs
59
problem in advance, delays in delivery or quality problem (technological, administrative) a very
intensive cooperation with suppliers was necessary at all levels.
In general terms, experience shows the importance of embedding contacts with the
administrative data holder within a governance structure (under the umbrella of the national
coordination of official statistics) and the importance of building a good working relationship.
Regular contacts between designated experts can be vital in preventing quality problems. The
statistical institute has to invest in building up these contacts because the administrative data
holders themselves have not so much to gain from cooperating. After all, they have their proper
interests to attend to and receive not very much in return (NSIs give no feedback on individual
cases)
From the point of view of the NSI, there is very much to gain:
The process of administrative registration is very similar to that of survey collection, except that
it is external to the NSI. Errors that appear in surveys, can (and do) appear in the registration of
administrative data. More information on these sources of error can be found in 1.4 Quality of
Secondary Data Sources. To be able to correctly interpret these data, the NSI should have
detailed knowledge of the whole collection process.
Even more important is the lack of control on the whole process, which makes the NSI
vulnerable to changes that impact their statistical production. Changes in administrative data
seem to fall under two broad categories: changes in legislation or the interpretation of legislation
or changes in the way the original data are collected, stored or transmitted.
A Finnish example17
of changes in legislation is the introduction of Reversed VAT in the
construction industry on 1 April 2011. Before introduction of the new system, subcontractors
paid the VAT and the main contractor could deduct it from the company’s taxes. In the reversed
system, the main contractor pays the VAT. The introduction of the reversed VAT system caused
changes to the monthly VAT data used as the source data in the compilation of both monthly
indices of turnover and output for construction. There were comparability problems that arose
from the change in the taxation practice and Statistics Finland had to solve the problems to
secure quality in the statistics production. The changes in the VAT data required some
methodological and technical revisions to the handling the VAT data. Due to the changes in the
VAT data, the formation rule for turnover had to be re-specified so that the new variables would
be as comparable as possible with the old variables used in the compiling of turnover indices.
Furthermore, the transmission of the VAT data and the production system had to be changed so
that they would meet the needs of the new data. The implementation of the reversed VAT system
introduced three new variables to the VAT data and the contents of old variables changed.
17 P. Paavilainen ; Efficient use of administrative data in the production of economic statistics in Finland ; Statistics
Finland, Business trends
ESSnet Use of Administrative and Accounts Data in Business Statistics Work Package 2:
a: Checklist to assist Member States when investigating the usefulness of administrative data
b: Checklist for the quality of administrative data inputs
60
In Italy, the adequate exploitation of the huge quantity of administrative data from the National
Social Security Institute entailed coping with very frequent changes in the basic metadata which
have an impact on the correct translation rules of admin data into the target variables. Those
continuous changes depend on the fact that in Italy a large part of labour market, occupational
and industrial policies take the form of rebates in social contributions - for example measures to
stimulate the employment of specific target groups of the labour force can rely on the
differentiation of social security contribution rates - and enterprises have to use the Social
Security declaration to take advantage of them. This implies that the process of retrieval of
statistical target variables is heavily affected because continuously new small components
(administrative micro codes) of labour cost have to be included, while other data have to be
excluded because they are not relevant for statistical purposes. A prerequisite to the correct
inclusion of changes in the calculation of the target variables is the availability of complete and
clear input metadata. Istat could succeed in identifying correctly and systematically all those
changes and then modifying the relative software/code to retrieve/calculate/aggregate/ the target
variables only by implementing and continuously updating an in-house ad hoc metadata database
collecting laws, regulations and other technical aspects concerning social security
contributions.18
An example of changes in the way the original data are collected, stored or transmitted is that of
Istat suddenly being confronted with a complete change in the collection of social security data.
In January 2010 the old “DM10” form was cancelled and unified with another monthly
individual wage declaration (Emens) in a new electronic declaration called Uniemens, containing
a huge and interesting quantity of information on each single worker. The data refer to
individuals and are organized in a completely different way compared to the DM10. This change
has really put at risk, at least temporarily, the release of the quarterly indicators as there was not
enough time to redesign the whole process of production but at the same time it represented a
new challenge which in perspective could really improve the quantity and quality of short-term
and structural statistics.
These examples illustrate that contacting the administrative data holder is usually not a one off
event. Having regular exchanges of information is important to get indications of planned
changes. Administrative data change over time, and the NSI needs to be aware of these changes
in time to be able to adapt the mapping of the administrative concepts and data to the statistical
ones. A legislative framework is beneficial for getting cooperation from the data provider, but as
seen in the “DM10” case in Italy not always sufficient.
18 F.Rapiti,F.Ceccato,C.Congia,S Pacini,D.Tuzi ;What have we learned in almost 10-years experience in dealing
with administrative data for short term employment and wages indicators? ESSNet Admin Data Workshop ;March
2010
ESSnet Use of Administrative and Accounts Data in Business Statistics Work Package 2:
a: Checklist to assist Member States when investigating the usefulness of administrative data
b: Checklist for the quality of administrative data inputs
61
2.3 Keeping an Inventory of Administrative Data Sources
The definitions of the target variables needed for statistical output usually do not coincide with
the definitions of variables available in the administrative data. A good knowledge of the
variable definitions is needed to combine or transform the input variables into output variables.
Having accurate and complete metadata is essential for producing the right output.
Metadata can be defined as “data that define and describe other data” whereas statistical
metadata are “data about statistical data, and comprise data and other documentation that
describe objects in a formalised way” (both definitions come from the 2009 edition of the SDMX
Metadata Common Vocabulary).
Metadata from administrative sources is not always complete. The information that comes with
the datasets can be just a technical description of the variables without the background
information that is needed to decide what has to be done. In social security data for instance, a
large number of variables on different types of contributions may have to be combined in the
right way: some have to be included, others excluded, and the mix of variables changes
whenever policies change. A prerequisite to the correct inclusion of changes in the calculation
of the target variables is the availability of complete and clear input metadata. In the Italian case,
Istat18
could only succeed in identifying correctly and systematically all those changes and then
modifying the relative software/code to retrieve/calculate/aggregate/ the target variables by
implementing and continuously updating an in-house ad hoc metadata database collecting laws,
regulations and other technical aspects concerning social security contribution.
Metadata have two basic functions. The first is to uniquely and formally define the content and
links between objects and processes in the statistical information system. The second is to
determine all related technical parameters. NSIs have a need to make metadata available for
different users, and develop a Statistical Metadata System (SMS): “A data processing system
that uses, stores and produces statistical metadata”. The term system refers to the people,
processes and technology involved in managing statistical metadata.
Administrative data often hold information that is useful for more than one statistical output. The
social security data in our example can be used not only to compile direct indicators for short-
term statistics, but also to compile variables for structural surveys, as input to the business
register, as input in National Accounts estimation processes, and as auxiliary information for
checks at micro level in wage and labour costs surveys (LCS,SES). Therefore, the complete,
checked and up to date input metadata should preferably be available to all potential users.
Integration of all documentation on the administrative procedures and legislation in a Statistical
Metadata System is the ideal solution.
More information on the role of an SMS in statistical production is available from the ESSnet on
micro data linking and data warehousing in statistical production. It is to be expected that NSIs
have evolved differently in their building up of an SMS, and for the purpose of this ESSnet, the
existence of a SMS that can store this type of information is not the main point. Most important
of all is that the right kind of information is retrieved at the right time, in an organised way, and

ESSnet Use of Administrative and Accounts Data in Business Statistics Work Package 2:
a: Checklist to assist Member States when investigating the usefulness of administrative data
b: Checklist for the quality of administrative data inputs
62
presented in a common format that makes it possible for other potential users to find the
elements they need. The checklists provide the procedure to get all this done. The results are the
necessary input for a metadata system, and if that is not readily available, the Italian example can
be followed: the ad-hoc metadata database containing all the collected information.
The pre-evaluation checklist contains all the information on the list itself. The usage-specific
checklist contains general information, stipulates what actions have been undertaken and gives
the outcome or methodological option chosen. Three annexes describe requirements for output
variables, characteristics of the administrative data, issues found and an inspection report with
quantitative results. The requirements for output variables could be retrieved from a metadata
system. All other elements could be stored electronically and could be linked to (or integrated in)
a statistical metadata system.
Whether kept separately or integrated into a metadata system, the defined procedures with their
templates for storing information allow sharing and re-using of obtained knowledge.
By using the checklists, new sources are added to the repository, and administrative sources get
better and better documented. A small example of building up a repository is added. To test the
usability of the draft version of the checklist, a total of five administrative data sources were
evaluated in Belgium and the Netherlands.
The administrative data sources studied in Belgium were: the National Register of Natural
Persons (Registre National des Personnes Physique; NRPP) and a collection of 14 administrative
data sources that jointly provide a complete overview of all Belgian Tourist Establishments
(BTE).
The NRPP contains an overview of the population (citizens) of the Belgian territory. Each person
living in Belgium -Belgian or foreigner- has a record with a unique identification number in the
National Register.
In Belgium several data sources exist that, when combined, provide an overview of all tourist
establishments; examples of the latter are hotels, hostels, and campsites. For each region in
which one of the official Belgian languages is spoken (i.e. Dutch/Flemish, French and German)
for the various types of establishments discerned (such as hotels, hostels, camping sites, and
holiday homes) registers are maintained. By combining the 14 administration sources used a
(nearly) complete overview is obtained. In the remainder of this paper these combined data
sources are referred to as the BTE.
In the Netherlands the following administrative sources were studied: the Insurance Policy
record Administration (IPA), Value Added Tax (VAT) register, and the Intra-Community
Performances (ICP) data source.
The IPA is maintained by the Institute for Employee Benefit Schemes; a self governing body that
works under authority of the Ministry of Social Affairs and Employment. In the IPA, all Dutch
employers, (ex) employees, businesses and their labour relations are registered. The employee
population is that of all insured employees in the Netherlands. Each employee is assigned to a
business. The IPA is considered one of the largest administrations in the Netherlands; millions of
entries are processed every month. The total number of records is about 20 million. Data
ESSnet Use of Administrative and Accounts Data in Business Statistics Work Package 2:
a: Checklist to assist Member States when investigating the usefulness of administrative data
b: Checklist for the quality of administrative data inputs
63
collection started in 2006 and suffered some start-up problems in the beginning. The IPA is
becoming a very important administrative source as it is used by an increasing number of
statistics in the Netherlands.
The VAT-register is collected and maintained by the Dutch Tax Administration. In the
Netherlands every taxable business must pay VAT on turnover. VAT is levied at each stage in
the chain of production and on the distribution of goods and services based on the 6th European
VAT Directive. The tax base is the total amount charged for the transaction excluding VAT, with
certain exceptions. The VAT paid by businesses on expenses or investments (the input tax) may
be deducted from the VAT charged (the output tax). If the balance is positive, tax must be paid
to the Tax Administration; if it is negative, a refund is given. The VAT-register is delivered by
the Dutch Tax Administration to Statistics Netherlands and is an important data source for the
Short Term Statistics (Vlag et al., 2010).
The ICP data source is maintained by the Dutch Tax and Customs Administration were it is used
to check the trade between companies in different EU-countries; i.e. intra-community trade. The
information stored in this data source focuses on: the company and country to/from which goods
are exported/imported, the company that exports/imports goods, the turnover value of the goods
and the VAT involved19
.
Results and discussion
Application
Five administrative data sources were evaluated by means of the checklist. Our primary interest
in this study was to determine the usefulness of the checklist; the evaluation results for the data
sources obtained were considered of less interest. In each case the checklist was filled out by an
NSI-user of the data source.
Apart from the filled in checklist, the feedback and documentation provided by the NSI-users
were collected. All the information provided was used to improve the checklist.
Scores obtained
Although the evaluation results obtained for the data sources were not the main reason for
evaluation, the results are shown in table 1. In this table the results for each data source are
shown for the three sections discerned in the checklist; the general, content, and delivery section.
All findings support the use of the data sources by the NSI. This is not unexpected as all of the
sources evaluated are already used.
19 Omtzigt, D., Burger, J. (2010) Quality and usability of the new ICP data source (in Dutch: Kwaliteit en
bruikbaarheid van de nieuwe administratieve databron ICP). Internal report, Statistics Netherlands, DMH-2010-12-
01-JBUR.
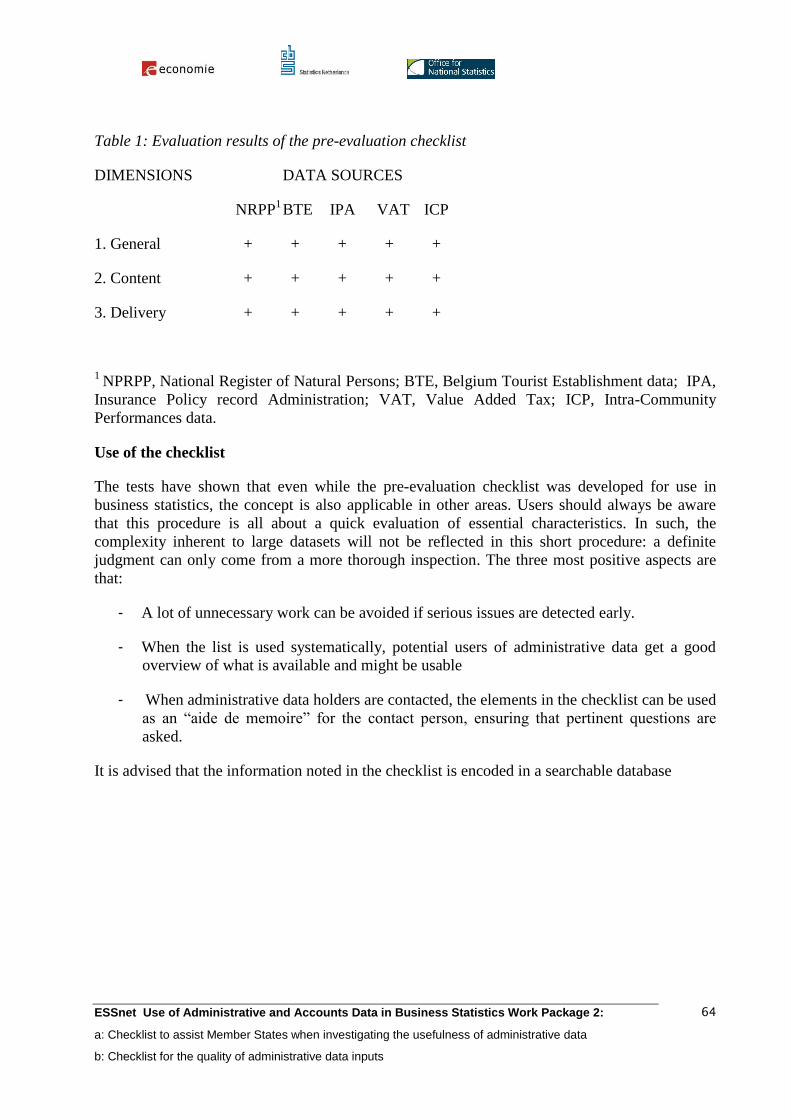
ESSnet Use of Administrative and Accounts Data in Business Statistics Work Package 2:
a: Checklist to assist Member States when investigating the usefulness of administrative data
b: Checklist for the quality of administrative data inputs
64
Table 1: Evaluation results of the pre-evaluation checklist
DIMENSIONS DATA SOURCES
NRPP1 BTE IPA VAT ICP
1. General + + + + +
2. Content + + + + +
3. Delivery + + + + +
1 NPRPP, National Register of Natural Persons; BTE, Belgium Tourist Establishment data; IPA,
Insurance Policy record Administration; VAT, Value Added Tax; ICP, Intra-Community
Performances data.
Use of the checklist
The tests have shown that even while the pre-evaluation checklist was developed for use in
business statistics, the concept is also applicable in other areas. Users should always be aware
that this procedure is all about a quick evaluation of essential characteristics. In such, the
complexity inherent to large datasets will not be reflected in this short procedure: a definite
judgment can only come from a more thorough inspection. The three most positive aspects are
that:
- A lot of unnecessary work can be avoided if serious issues are detected early.
- When the list is used systematically, potential users of administrative data get a good
overview of what is available and might be usable
- When administrative data holders are contacted, the elements in the checklist can be used
as an “aide de memoire” for the contact person, ensuring that pertinent questions are
asked.
It is advised that the information noted in the checklist is encoded in a searchable database