Embed Size (px)
Citation preview

1
ESTABLISHING A TROUT FISHERY IN MILL CREEK
A PROJECT OF THE ANN ARBOR CHAPTER OF MICHIGAN TROUT UNLIMITED
A REPORT PREPARED BY THE MILL CREEK FISHERY DEVELOPMENT COMMITTEE:
THOMAS EDSALL1, CARLOS FETTEROLF WILLIAM PHILLIPS AND GARY SLAUTER
MARCH 27, 2011
1 Corresponding author.

2
Background Trout Unlimited’s primary mission is to conserve, protect, and restore North America’s coldwater fishes and their watersheds. The by-laws of the Ann Arbor Chapter of Trout Unlimited (AATU) name the middle reach of the Huron River and its watershed, which includes Mill Creek in Washtenaw County, as the chapter’s home stream area, thus encouraging the chapter to engage in stream improvement activities, demonstrations, and educational efforts there, as these efforts will directly or indirectly benefit Trout Unlimited’s primary mission. This document presents an overview of a summer water temperatures in Mill Creek as these might affect the potential of the creek to support trout and a trout fishery. The document describes studies performed in 2009 and 2010. More detailed documentation of the project is available on the website, AATU.org.
Figure 1. The Mill Creek System
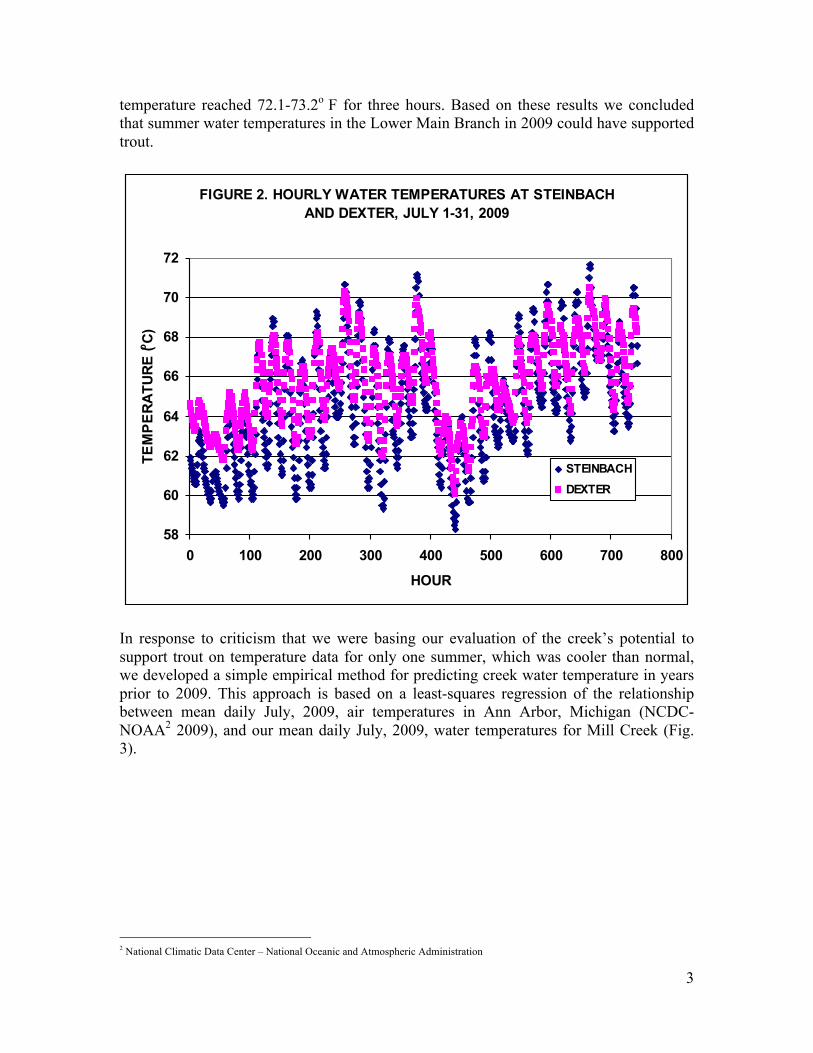
The 2009 Study We deployed Onset Computer Corporation (Bourne, MA) Pendant UA-002-08 temperature recorders in mid-June of 2009 in the Lower Main Branch of Mill Creek, in Dexter’s Warrior Park, and at Shield, Marshall, and Steinbach roads (Fig. 1). The recorders collected water temperature hourly at these sites until mid-September. Study results show that July water temperatures differed little between Steinbach Road and Warrior Park (Fig. 2) and met the temperature criteria used by the Michigan Department of Natural Resources and Environment (MDNRE) (as reported by Latimore, 2007), for a coldwater stream (July maximum water temperature not >75o F), and for trout stocking (July maximum temperature <72o F), except at Marshall Road on July 28 when the water
3
temperature reached 72.1-73.2o F for three hours. Based on these results we concluded that summer water temperatures in the Lower Main Branch in 2009 could have supported trout.
FIGURE 2. HOURLY WATER TEMPERATURES AT STEINBACH AND DEXTER, JULY 1-31, 2009
58
60
62
64
66
68
70
72
0 100 200 300 400 500 600 700 800
HOUR
TEM
PERA
TURE
(o C)
STEINBACHDEXTER
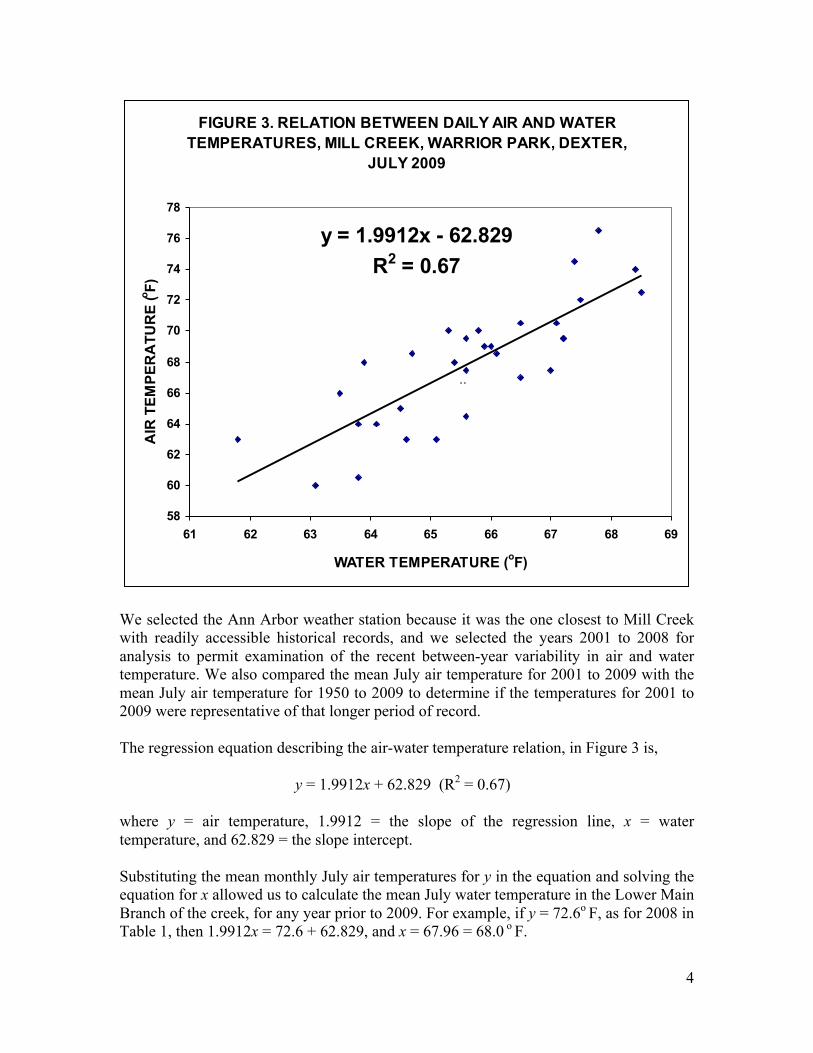
In response to criticism that we were basing our evaluation of the creek’s potential to support trout on temperature data for only one summer, which was cooler than normal, we developed a simple empirical method for predicting creek water temperature in years prior to 2009. This approach is based on a least-squares regression of the relationship between mean daily July, 2009, air temperatures in Ann Arbor, Michigan (NCDC-NOAA2 2009), and our mean daily July, 2009, water temperatures for Mill Creek (Fig. 3).
2 National Climatic Data Center – National Oceanic and Atmospheric Administration
4
FIGURE 3. RELATION BETWEEN DAILY AIR AND WATER TEMPERATURES, MILL CREEK, WARRIOR PARK, DEXTER,
JULY 2009
y = 1.9912x - 62.829R2 = 0.67
58
60
62
64
66
68
70
72
74
76
78
61 62 63 64 65 66 67 68 69
WATER TEMPERATURE (oF)
AIR
TEM
PER
ATU
RE
(o F)
..
We selected the Ann Arbor weather station because it was the one closest to Mill Creek with readily accessible historical records, and we selected the years 2001 to 2008 for analysis to permit examination of the recent between-year variability in air and water temperature. We also compared the mean July air temperature for 2001 to 2009 with the mean July air temperature for 1950 to 2009 to determine if the temperatures for 2001 to 2009 were representative of that longer period of record. The regression equation describing the air-water temperature relation, in Figure 3 is, y = 1.9912x + 62.829 (R2 = 0.67) where y = air temperature, 1.9912 = the slope of the regression line, x = water temperature, and 62.829 = the slope intercept. Substituting the mean monthly July air temperatures for y in the equation and solving the equation for x allowed us to calculate the mean July water temperature in the Lower Main Branch of the creek, for any year prior to 2009. For example, if y = 72.6o F, as for 2008 in Table 1, then 1.9912x = 72.6 + 62.829, and x = 67.96 = 68.0 o F.
5
TABLE 1. MEAN JULY ANN ARBOR AIR AND MILL CREEK WATER TEMPERATURES, AND STREAM TEMPERATURE HABITAT CLASS, 2001-2009. YEAR AIR WATER CLASS 2009 67.8 65.6 CT 2008 72.6 68 WT 2007 71 67.2 WT 2006 74.8 69.1 WT 2005 74.4 68.9 WT 2004 71.2 67.3 WT 2003 71.8 67.6 WT 2002 76.2 69.8 WT 2001 73 68.2 WT CT = COLD-TRANSITIONAL = 65.3-67.1o F WT = WARM-TRANSITIONAL = 67.1-69.8o F W = WARMWATER = >69.8o F
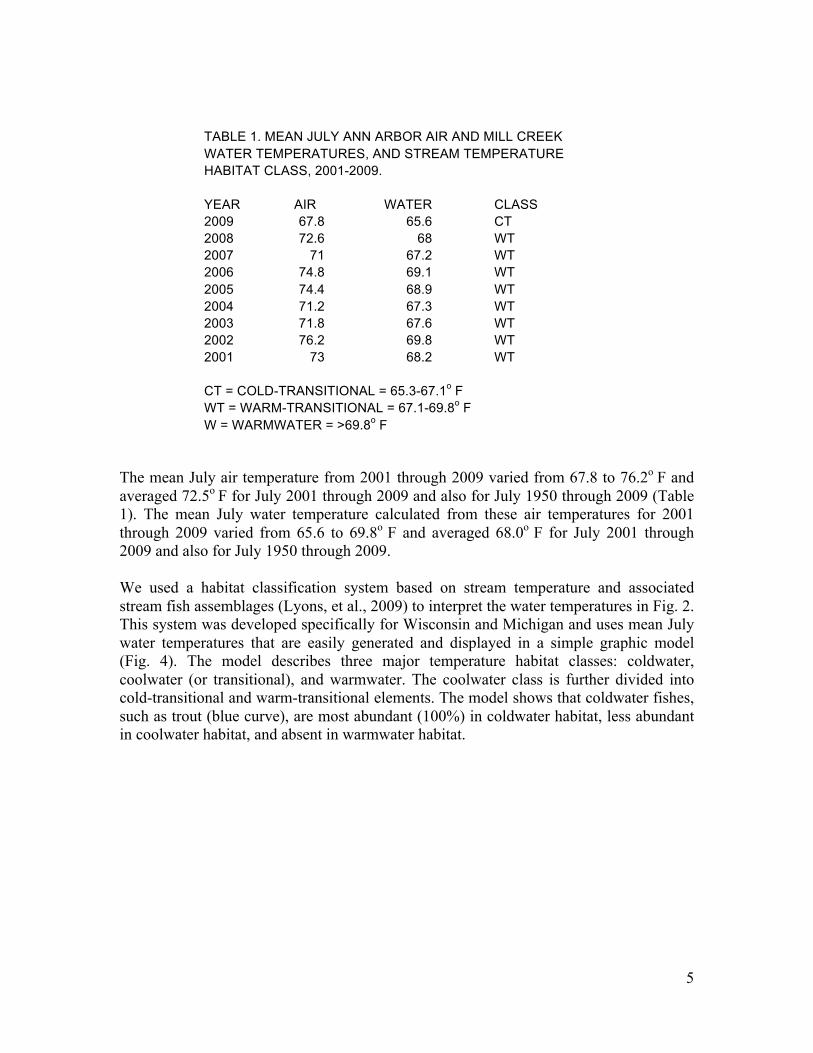
The mean July air temperature from 2001 through 2009 varied from 67.8 to 76.2o F and averaged 72.5o F for July 2001 through 2009 and also for July 1950 through 2009 (Table 1). The mean July water temperature calculated from these air temperatures for 2001 through 2009 varied from 65.6 to 69.8o F and averaged 68.0o F for July 2001 through 2009 and also for July 1950 through 2009. We used a habitat classification system based on stream temperature and associated stream fish assemblages (Lyons, et al., 2009) to interpret the water temperatures in Fig. 2. This system was developed specifically for Wisconsin and Michigan and uses mean July water temperatures that are easily generated and displayed in a simple graphic model (Fig. 4). The model describes three major temperature habitat classes: coldwater, coolwater (or transitional), and warmwater. The coolwater class is further divided into cold-transitional and warm-transitional elements. The model shows that coldwater fishes, such as trout (blue curve), are most abundant (100%) in coldwater habitat, less abundant in coolwater habitat, and absent in warmwater habitat.
6
FIGURE 4. STREAM TEMPERATURE HABITAT MODEL (AFTER: LYONS ET AL. 2009). COLDWATER = <63.5oF; COOLWATER OR TRANSITIONAL= CT
+ WT; CT = COLD-TRANSITIONAL = 63.5- 67.1oF; WT = WARM-TRANSITIONAL = 67.1- 69.8oF; WARMWATER = >69.8oF.
0
10
20
30
40
50
60
70
80
90
100
60 61 62 63 64 65 66 67 68 69 70 71 72 73 74 75
WATER TEMPERATURE (oF)
FISH
AB
UN
DA
NC
E (%
)
CT WTCOLD WARM
COOL
.
Superimposing the water temperatures in Table 1 on the blue curve in Fig. 4 indicates that the Lower Main Branch of the creek would have been classified as cold-transitional habitat in 2009 and as warm-transitional habitat in 2001 through 2008. It also shows that trout abundance there could have been about 84% of maximum in 2009; about 45-56% in 2003, 2004, and 2007; about 37-40% in 2001 and 2008; about 22% in 2005; about 12% in 2006; and in 2002, trout probably would not have survived unless thermal refugia were available. From 2001 to 2009 and also from 1950 to 2009 the potential abundance of stocked trout in Mill Creek could have averaged about 40% of maximum. If maximum abundance of trout in Michigan streams is about 100 fish per 100 meters of stream length, as is suggested by data presented in Wehrly et al. (2007), then the abundance scale in Fig. 4 can also be read as numbers of trout per 100 meters of stream. Thus, the mean potential abundance of stocked trout in Mill Creek for the period of record would have been about 40 per 100 meters of stream, which falls near the upper end of the range of stocked trout abundance in Michigan streams, 4 to 50 per 100 meters (Wehrly et al. 2007). The 2010 Study In 2010, we deployed temperature recorders in the Lower Main Branch of Mill Creek at Dexter; in the East Branch at Jerusalem Road; in the Middle Reach of the Main Branch at
7
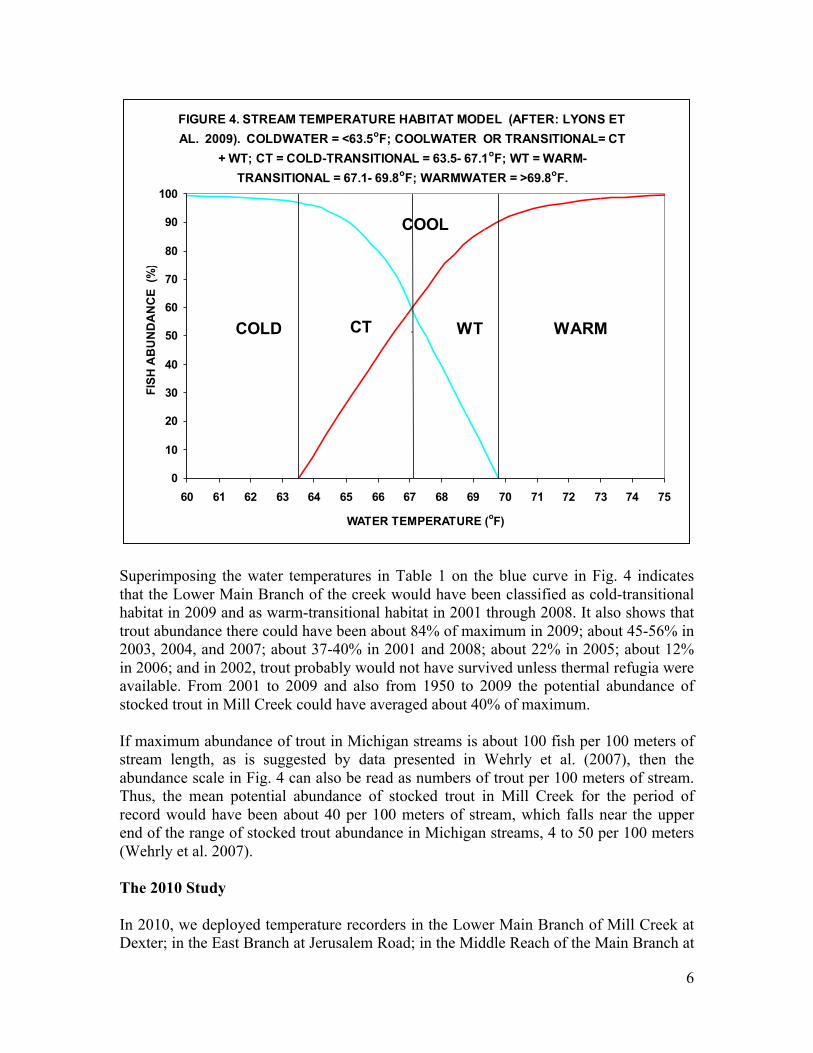
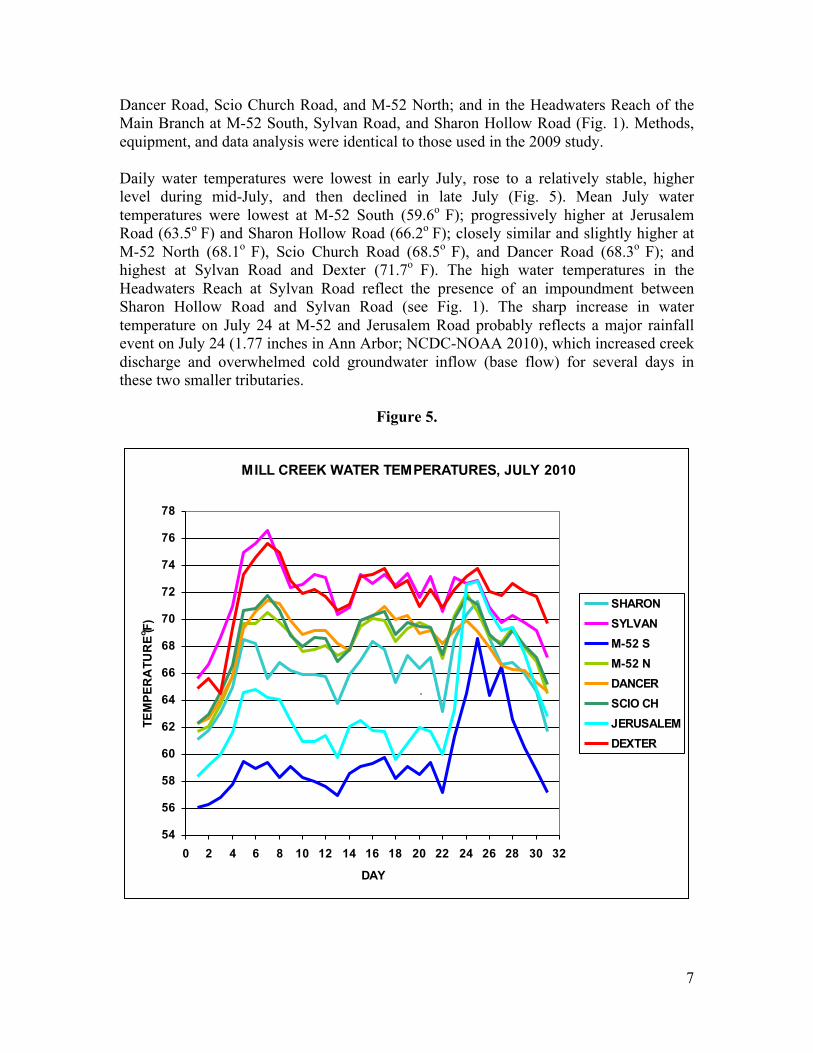
Dancer Road, Scio Church Road, and M-52 North; and in the Headwaters Reach of the Main Branch at M-52 South, Sylvan Road, and Sharon Hollow Road (Fig. 1). Methods, equipment, and data analysis were identical to those used in the 2009 study. Daily water temperatures were lowest in early July, rose to a relatively stable, higher level during mid-July, and then declined in late July (Fig. 5). Mean July water temperatures were lowest at M-52 South (59.6o F); progressively higher at Jerusalem Road (63.5o F) and Sharon Hollow Road (66.2o F); closely similar and slightly higher at M-52 North (68.1o F), Scio Church Road (68.5o F), and Dancer Road (68.3o F); and highest at Sylvan Road and Dexter (71.7o F). The high water temperatures in the Headwaters Reach at Sylvan Road reflect the presence of an impoundment between Sharon Hollow Road and Sylvan Road (see Fig. 1). The sharp increase in water temperature on July 24 at M-52 and Jerusalem Road probably reflects a major rainfall event on July 24 (1.77 inches in Ann Arbor; NCDC-NOAA 2010), which increased creek discharge and overwhelmed cold groundwater inflow (base flow) for several days in these two smaller tributaries.
Figure 5.
MILL CREEK WATER TEMPERATURES, JULY 2010
54
56
58
60
62
64
66
68
70
72
74
76
78
0 2 4 6 8 10 12 14 16 18 20 22 24 26 28 30 32
DAY
TEM
PER
ATU
RE
(o F)
SHARONSYLVANM-52 SM-52 NDANCERSCIO CHJERUSALEMDEXTER
.
8
If we superimpose the mean July 2010 water temperatures on Fig. 4, they show trout abundance at M-52 South could have reached 100% of capacity recorded for Michigan streams, 92% at Jerusalem Road, 77% at Sharon Hollow Road, 37% at M-52 North, 27% at Scio Church Road, 31% at Dancer Road, and 0% at Sylvan Road and Dexter. Although Sylvan and Dexter fell into the warmwater habitat class in 2010, it should be recognized that the July 2010 air temperatures were unusually high and within 2.3o F of the 130-year record high of 77.5o F reached in 1995. Thus in more normal years, all of the sites studied including both Dexter and Sylvan could be expected to have lower water temperatures and to support trout. To better show the longer term potential of the Middle Reach of the creek’s Main Branch to support trout we developed a least-squares regression of the relation between mean daily July, 2010, air temperatures in Ann Arbor, Michigan (NCDC-NOAA 2010) and the pooled mean daily July, 2010, water temperatures for M-52 North, Scio Church, and Dancer roads. We pooled the water temperature data for those three sites because they were closely similar (Fig. 5). The three sites are represented by the equation, y = 1.7132x + -41.669 (R2 = 0.72) Using the 2001 to 2010 mean July air temperatures, solving the equation for the corresponding mean July water temperatures, and superimposing those values on Fig 4 indicates that the Middle Reach of the creek would have been classified as cold-transitional in 2001 through 2004, and 2007 through 2009; and warm-transitional in 2005, 2006, and 2010. These plots also show that trout abundance could have ranged from about 67% to 97% of maximum in 2001 through 2004 and 2007 through 2009 and about 33% to 43% in 2005, 2006, and 2010. If the maximum abundance of trout in Michigan streams is about 100 fish per 100 meters of stream length, as suggested by the data in Wehrly et al. (2007), then Fig. 5 indicates the mean potential abundance of stocked trout in the Middle Reach of Mill Creek from 2001 to 2010 would have been about 68 per 100 meters of stream. Conclusion From the foregoing analysis it is reasonable to conclude that if streams in Michigan that carry 4 to 50 stocked trout per 100 meters of stream support fisheries that are attractive enough to be managed for trout, then Mill Creek should also warrant stocking and management as a trout fishery. This conclusion is further supported by an earlier report (Seelbach and Wiley, 1996) recommending the stocking of brown trout in the creek’s Main Branch and by the MDNRE’s electro-shocking survey data for the creek, which show the fish community biomass now present in the creek’s Main Branch between Lima Center Road and Shield Road is strongly dominated by non-game, cold-transitional fishes (Edsall, 2010) that typically generate little or no interest among recreational anglers.
9
References Edsall, T. A. 2010. Analysis of MDNRE July 23, 2008 electro-fishing survey data for Mill Creek. A memorandum submitted to AATU by the Mill Creek Fishery Development Committee, February 5, 2010; 3 pages Latimore, J.A. 2007. Stream quality assessment of Mill Creek, Washtenaw County, Michigan, a tributary of the Huron River 2004-2006. Results of the monitoring component of Mill Creek Blitz Project, MDEQ Section 319 Grant #2004-0169. Huron River Watershed Council, June 2007. Ann Arbor. Lyons, J.L., T. Zorn, J. Stewart, P. Seelbach, K. Wehrly, and L. Wang. 2009. Defining and characterizing coolwater streams and their fish assemblages in Michigan and Wisconsin USA. North American Journal of Fisheries Management 29:1130-1151. NCDC-NOAA. 2009. NCDC.NOAA.gov website for The University of Michigan weather station, Ann Arbor, July, 2009. NCDC-NOAA. 2010. NCDC.NOAA.gov website for The University of Michigan weather station, Ann Arbor, July, 2010. Seelbach, P.W., and M.J. Wiley. 1996. An assessment for the potential ecological rehabilitation and restoration in Mill Creek. Unpublished report to the Huron River watershed Council, November 17, 1996. Ann Arbor, Michigan. Wehrly, K.E., L. Wang , and M. Mitro. 2007. Field-based estimates of thermal tolerance limits for trout: incorporating exposure time and temperature fluctuation. Transactions of the American Fisheries Society 136:365-374.