Embed Size (px)
Citation preview

1
Council of Professional Associations on Federal Statistics
November 1998 Conference
Establishment Nonresponse: Revisiting the Issues and
Looking to the Future
2
Acknowledgments
The Interagency Group on Establishment Nonresponse (IGEN) was sponsored by the Bureau of Labor Statistics. The IGEN team members involved in writing this paper were: IGEN Sponsor Clyde Tucker Bureau of Labor Statistics IGEN Co-Chairs Leda Kydoniefs Bureau of Labor Statistics Jaki Stanley McCarthy USDA, National Agricultural Statistics Service
Members Jay Casselberry DOE, Energy Information Administration David M. Friedman Bureau of Labor Statistics Steven Kaufman National Center for Education Statistics Douglas G. Kleweno National Agricultural Statistics Service Ruey-Pyng Lu Energy Information Administration Jean C. Mah Bureau of Labor Statistics Chris Manning Bureau of Labor Statistics Nash J. Monsour U.S. Bureau of the Census Chester H. Ponikowski Bureau of Labor Statistics Carl Ramirez U.S. General Accounting Office Robert Sabatelli Bureau of Labor Statistics Iris Shimizu National Center for Health Statistics Douglas Skuta Bureau of Labor Statistics David Slack Bureau of Labor Statistics Albert Tou Bureau of Labor Statistics Diane K. Willimack U.S. Bureau of the Census
3
1.0 Introduction
Federal statistical agencies have continuously, throughout their history, sought to improve
the quality of their statistical products. This has been accomplished using a variety of mechanisms
such as internal monitoring of survey processes, external review boards, interagency committees,
and various legislative mandates. Repeated interagency committees and the volume of literature
available on survey nonresponse speak to the importance of the subject for all statistical agencies.
Most recently, the Federal Committee on Statistical Methodology (FCSM) organized a
subcommittee with a charge to better understand unit nonresponse in surveys. Its findings and
recommendations were published in a set of three papers in 1994 providing for: an overview of
survey nonresponse (Shettle, Guenther, Kaspryzk and Gonzalez, 1994), establishment survey
nonresponse (Osmint, McMahon and Martin, 1994) and household survey nonresponse (Johnson,
Botman and Basiotis, 1994). In 1998, the Interagency Group on Establishment Nonresponse
(IGEN) was formed and it too was charged with examining nonresponse, but just to return to the
issue of nonresponse in establishment surveys. The group began by revisiting a lot of the same
ground as the FCSM subcommittee, updating and adding to that presented in the three FCSM papers
and sharing best practices. IGEN's more important mandate, however, will move the group beyond
that accomplished by the FCSM subcommittee. IGEN will, in the coming months, choose some
area(s) of research on establishment nonresponse within which to collaborate. This paper represents
the beginning phase of the interagency collaboration.
An establishment can be considered an economic unit which conducts business or performs
a service or industrial operations. For the purposes of this paper, an establishment survey is one
which collects information from or about establishments or economic units composed of
establishments. The units may be, for example, individual establishments, companies, multiple
establishments corresponding to one Employer Identification Number, hospitals, schools,
institutions, farms, physical structures, or government agencies. Most Federal establishment
surveys are periodic, although one-time surveys are also conducted. Members of IGEN were chosen
to represent their respective agencies (although all Federal agencies are not represented by the
group). The ultimate goals of the group are to identify and conduct research on establishment
nonresponse that will mutually benefit the agencies represented by the group members.
This paper is the result of the first part of the group’s mandate: to review current practices
with regard to nonresponse and identify potential future research directions. The paper is also
4
intended to serve as a vehicle to promote unique or innovative practices that reduce or adjust for
nonresponse. Our hope is that this group will have the support of its member agencies to implement
recommendations and to pursue joint research projects in the near future. Finally, similar to the
FCSM, the IGEN has decided to focus primarily on unit nonresponse and not on item nonresponse.
Therefore, this paper will address situations in which a selected establishment provides no survey
data (unit nonresponse), not when overall cooperation is granted but particular data items are
omitted (item nonresponse).
The paper is organized into 9 sections as follows: (1) general introduction, (2) literature
review, (3) brief overview of the kind of establishment data collected by the IGEN member
agencies, (4) how establishment response rates are calculated, (5) current trends in nonresponse
rates - a section that presents response rates of select establishment surveys, (6) methods and
activities to reduce nonresponse, (7) statistical adjustments for nonresponse, (8) special research
studies that have been conducted by Federal agencies in establishment nonresponse, and finally,
(9) future projects IGEN proposes are in need of further research and concluding remarks.
2.0 Literature Review
Survey methods research and survey data quality evaluations have routinely examined the
causes and effects of survey nonresponse. Theoretical treatments of unit nonresponse appear in
standard textbooks on sampling such as Cochran (1977) and Kish (1965). Survey nonresponse rates
have been monitored over time by Steeh (1981), Johnson, Botman, and Basiotis (1994), and Smith
(1995). Discussions of social psychological correlates of nonresponse appear in Goyder (1987),
Groves (1989), and Groves and Couper (1998). A variety of mathematical statistical methods have
been developed to adjust survey data for nonresponse (Holt and Elliot, 1991; Little and Rubin,
1987). The three volume series, Incomplete Data in Sample Surveys (Madow, Nisselson and Olkin,
1983), contains a thorough examination of survey nonresponse, describing the implications of
nonresponse for survey estimates, measurement and reporting of nonresponse rates, data collection
methods for nonresponse reduction, nonresponse adjustment methods, along with a variety of
survey case studies.
However, most of the published literature on survey nonresponse has been devoted to
household or demographic surveys, and not to surveys of establishments. Many widely used
reference books on survey methods focus their discussions of nonresponse exclusively on household
5
surveys. See for example, Telephone Survey Methodology (Groves, et. al., 1988), Survey Errors
and Survey Costs (Groves, 1989), Panel Surveys (Kasprzyk, Duncan, Kalton and Singh, 1989),
Nonsampling Errors in Surveys (Lessler and Kalsbeek, 1992), Survey Research Methods (Fowler,
1993), and Nonresponse in Household Interview Surveys (Groves and Couper, 1998). Groves
(1989) refers only to household survey nonresponse, stating that unit nonresponse arises in the three
following ways: “1) inability to contact the sample household or person, 2) inability of the sample
person to provide responses to the survey, and 3) refusals to the interview request.” The IGEN
firmly believe that there are critical differences between households and establishments that affect
nonresponse.
Although published research on response and nonresponse in establishment surveys is
relatively sparse, there is an indication that this is an area for concern. In an international survey of
statistical agencies (Christianson and Tortora, 1995), about half reported declines in establishment
survey response rates for the previous 10 years. Steady or increasing response rates were attributed
to increased effort and resources devoted to nonresponse follow-up, automation, improved pre-
notification, reductions in the amount of data collected, and other changes to data collection
procedures. This experience appears to be shared by many Federal establishment surveys. Trends
in establishment survey response rates are discussed in Section 5.0 of this paper.
Typically, published literature to date has discussed establishment nonresponse in the
context of the differences between establishment and household surveys (Paxson, Dillman and
Tarnai, 1995; Osmint, McMahon and Martin, 1994; Tomaskovic-Devey, Leiter and Thompson,
1994; Edwards and Cantor, 1991). Hidiroglou, Drew, and Gray (1993) offer a “conceptual
framework for the definition of response and nonresponse that is suitable for both business and
social surveys.” They provide an extensive list of terms and definitions to support response and
nonresponse measurement, along with descriptions of both business and social survey procedures to
reduce nonresponse. Although they do not explicitly compare and contrast business and household
surveys, the authors do recognize several characteristics unique to businesses that impact
nonresponse in establishment surveys.
Tomaskovic-Devey, et. al. (1994), also challenge the approach of placing establishment
survey methods in a household survey context. In a study of North Carolina businesses, they found
that several characteristics of businesses not relevant in household surveys affected survey
participation. For example, some types of establishments were more likely than others to respond
6
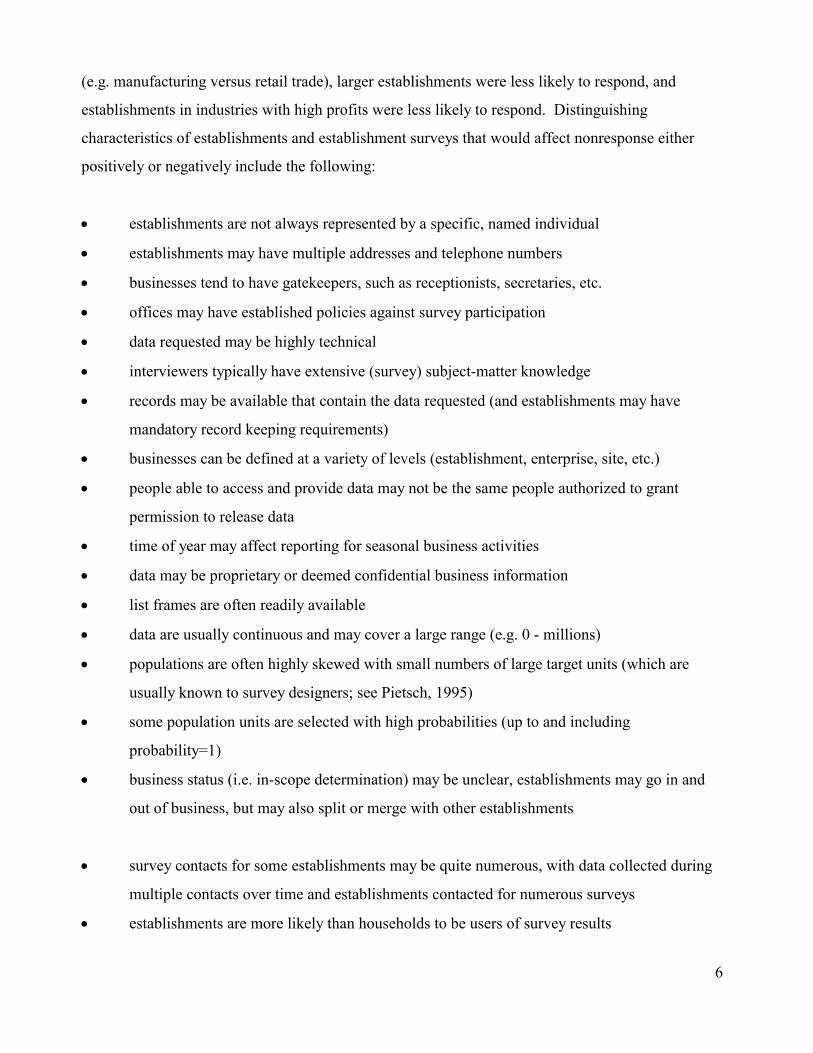
(e.g. manufacturing versus retail trade), larger establishments were less likely to respond, and
establishments in industries with high profits were less likely to respond. Distinguishing
characteristics of establishments and establishment surveys that would affect nonresponse either
positively or negatively include the following:
• establishments are not always represented by a specific, named individual
• establishments may have multiple addresses and telephone numbers
• businesses tend to have gatekeepers, such as receptionists, secretaries, etc.
• offices may have established policies against survey participation
• data requested may be highly technical
• interviewers typically have extensive (survey) subject-matter knowledge
• records may be available that contain the data requested (and establishments may have
mandatory record keeping requirements)
• businesses can be defined at a variety of levels (establishment, enterprise, site, etc.)
• people able to access and provide data may not be the same people authorized to grant
permission to release data
• time of year may affect reporting for seasonal business activities
• data may be proprietary or deemed confidential business information
• list frames are often readily available
• data are usually continuous and may cover a large range (e.g. 0 - millions)
• populations are often highly skewed with small numbers of large target units (which are
usually known to survey designers; see Pietsch, 1995)
• some population units are selected with high probabilities (up to and including
probability=1)
• business status (i.e. in-scope determination) may be unclear, establishments may go in and
out of business, but may also split or merge with other establishments
• survey contacts for some establishments may be quite numerous, with data collected during
multiple contacts over time and establishments contacted for numerous surveys
• establishments are more likely than households to be users of survey results
7
• mandatory reporting is not uncommon and fines may be imposed for non-reporting
One body of literature on establishment survey nonresponse tests the application or
adaptation of household survey methods to establishment surveys. Jobber (1986) looked at surveys
that included industrial populations and found mixed results for pre-survey notifications, monetary
and non-monetary incentives, degree of personalization of survey mailings and other factors.
However, many of these surveys did not collect establishment level data; instead they asked
establishment employees for personal opinions and information. James and Bolstein (1992)
successfully used monetary incentives to increase response rates in collecting employee health
insurance information among small construction subcontractors. However, they failed to recognize
the uniqueness of their target population and did not discuss their results with respect to
characteristics particular to establishments.
Walker, Kirchmann, and Conant (1987) used a number of elements from Dillman’s Total
Design Method (Dillman, 1978) to increase response to an establishment mail survey. They
suggested that this increased response, but their research did not include a control group for
statistical comparison. Paxson, Dillman and Tarnai (1995) found that mandatory reporting and
telephone follow-ups in establishment surveys did produce high response rates (although the studies
they cite also did not contain control groups for comparison).
Alternatively, another body of literature examines the use of data collection methods that
would not be feasible, for surveys of the general public, to help increase response. Werking and
Clayton (1995) discuss the use of automated data collection methods in the Current Employment
Statistics survey, including use of facsimile machines, electronic data interchange, touch tone data
entry and others. Many of these techniques require that respondents have (or have access to) office
machines (such as FAX, or personal computer). Data are primarily quantitative in nature and
respondents must be in the survey on repeated occasions with sufficient frequency to warrant the
initial training required to provide data in these nontraditional ways.
In addition to changes in data collection procedures, alternative statistical methods have
been researched. Changes in the sample design have been explored to help increase business survey
response. Permanent random numbers and rotational designs (see for example, Ohlsson, 1995;
Srinath and Carpenter, 1995) have been used to minimize the amount of overlap in establishment
survey samples and resulting respondent burden over time. Survey data imputation and the

8
particular problems unique to business survey data were discussed by Kovar and Whitridge (1995).
Statistical methods for compensating for nonresponse are discussed in Section 7.0 of this paper.
It is also noteworthy that literature from disciplines other than survey methodology have
addressed establishment survey nonresponse. For example, the articles by Tomaskovic-Devey, et al.
(1994), Jobber (1986), and Walker, et. al. (1987) are found in journals related to organizational
behavior, not traditional survey research literature sources.
Within the Federal statistical system, a variety of special studies have been undertaken to
enhance data collection methods for establishment surveys or to identify procedures that improve or
maintain response. Additionally, research proceeds on nonresponse adjustments designed to
improve the quality of survey estimates. Selected special studies conducted by Federal statistical
agencies are described in Section 8.0 of this paper.
3.0 Establishment Survey Data Collected by IGEN Agencies
Establishment surveys conducted or sponsored by Federal statistical agencies cover all
aspects of the U. S. economy. Some surveys provide general statistical information that measure an
aspect of the nation's economy while others provide specialized information on important topics
such as health, education, energy, and research. To provide an overview of the diversity of Federal
establishment surveys, brief descriptions of types of some establishment surveys sponsored by the
government statistical agencies represented by IGEN members follow.
The Census Bureau is the Federal Government's main collector and provider of data about
the people and economy of the United States. It conducts over 100 different establishment surveys
and censuses that measure most sectors of the nation's economy, with the exception of agriculture.
These surveys collect a wealth of general statistics such as sales, shipments, inventories, value of
construction, payroll, and employment. The Census Bureau also conducts about 30 establishment
surveys sponsored by other government agencies which collect specialized establishment data from
manufacturers, educational institutions, hospitals, prisons, and other establishments.
The Bureau of Labor Statistics (BLS) is the principal fact-finding agency for the Federal
Government in the broad field of labor economics and statistics. BLS conducts a wide variety of
establishment surveys to produce statistics on employment, unemployment, compensation,
employee benefits, job safety, and prices for producers, consumers, and U.S. imports and exports.
Data are collected from the full spectrum of establishments including manufacturers, retailers,

9
services, state employment agencies, and U.S. importers and exporters of goods and services. With
the exception of the Occupational Safety and Health Survey, all establishment surveys conducted by
BLS are voluntary. Survey frequency varies from monthly to annual collection.
The Department of Agriculture's National Agricultural Statistics Service (NASS) mission
is to provide meaningful, accurate, and objective statistical information and services for the United
States, its agriculture, and its rural communities. NASS conducts annually over 100 national
surveys and numerous state level surveys, primarily of farmers, ranchers and other agribusinesses.
Surveys vary in frequency from weekly to annual collection. In addition, special studies are
conducted under cooperative funding arrangements with other government organizations and with
State Departments of Agriculture and Land-Grant universities. NASS also conducts the Census of
Agriculture every five years. Surveys about crops, livestock, prices, economics, labor, chemical-
usage and other agricultural activities result in over 350 reports published annually by NASS's
Agricultural Statistics Board. Almost all surveys are voluntary.
The Energy Information Administration (EIA) is a quasi-independent agency of the
Department of Energy. EIA's scope includes all energy types (petroleum, natural gas, coal,
electricity, nuclear, renewables), energy stages (production, conversion, distribution, supply,
consumption, price), and impacts (technical, economic, environmental). EIA systematically collects
data directly from approximately 120,000 respondents through 83 scientifically designed surveys
and also collects data indirectly from other sources. The majority of its establishment surveys are
mandatory self-administered mail surveys of companies involved in the energy industry. EIA's
surveys tend to be censuses, rather than sample surveys.
The National Center for Health Statistics (NCHS) is an agency in the Center for Disease
Control and Prevention. The NCHS mission is to measure the health of the nation. NCHS conducts
both household and establishment surveys. With regard to establishment surveys, NCHS collects
data from health care providers (for example, physicians, hospitals) about the use of their health care
services. Data are collected on sample visits for care at the provider and include patient
demographics (age, sex, ethnicity, race), payment sources, medical tests, patient symptoms,
diagnoses, procedures, drugs prescribed, visit disposition, and lengths of hospital stays. Some
establishment surveys are ongoing and involve continuous, daily collection; others involve periodic
collection on alternate years. All NCHS surveys are voluntary.
The National Center for Education Statistics (NCES) collects and analyzes data related to
10
education in the United States and other nations. It collects data on elementary and secondary
education, addressing such issues as student reading proficiency, origin and background of new
teachers, and the number of students who attend postsecondary institutions. For postsecondary
education, NCES measures how professors spend their time, how long it takes to finish college, and
who receives financial aid. NCES also collects statistics on education and society, library science
and resources, lifelong learning and society's needs, vocational education, and international
education statistics. All NCES surveys are voluntary, and frequency of collection varies from one to
every five years depending on the survey.
The General Accounting Office (GAO) is the research arm of Congress. In the course of
its program evaluation and auditing work, it conducts sample surveys of establishments and other
organizations in many public and private industries on a variety of subjects. The products of GAO's
research are generally analytical reports and not official statistics or microdata. The majority of
these surveys are cross-sectional and not repeated, and use self-administered mail questionnaires for
samples ranging from a few hundred to several thousand. GAO does not have mandatory reporting
authority for any of its surveys.
Appendix 1 includes more detailed information on many of the surveys used as examples in
this paper. A brief description of each survey and information about the survey procedures and
target establishments are presented.
4.0 Calculation of Response Rates
Response rate is the most commonly used measure denoting nonresponse problems.
Response rates are frequently used as one measure of survey quality and are routinely calculated and
tracked by Federal statistical agencies. They are used to evaluate the quality of estimates and to see
which sample groups should be targeted for efforts to increase response rates. On occasion, the
11
aTore
To
= rate response Weighted
rates are also used to evaluate the effectiveness of new sampling modifications or data collection
procedures. A number of survey response rates are also published to provide data users with an
indication of data quality.
To meet survey evaluation needs, different response rates are produced. Final response rates
over all the sample are commonly produced. Some surveys produce rates for multiple components
designated by separate questionnaires and/or, in a multi-stage survey, by sampling stages. Response
rates may also be produced for sub-samples defined by sampling strata; by frame variables such as
establishment type and/or size, geographic state and/or region, and types of locale; by classification
groups defined for establishments or products; by varying data collection strategies; or by field
offices. Some surveys with longer collection periods calculate their rates multiple times during
collection, for example, before and after major follow-up mailings or in panel surveys at each
deadline for publishing preliminary and revised estimates.
The focus in this paper is on unit nonresponse in establishment surveys where unit
nonresponse refers to a complete failure to obtain information for a sample unit. However, a
respondent who fails to provide sufficient or key information may also be treated as a unit
nonresponse.
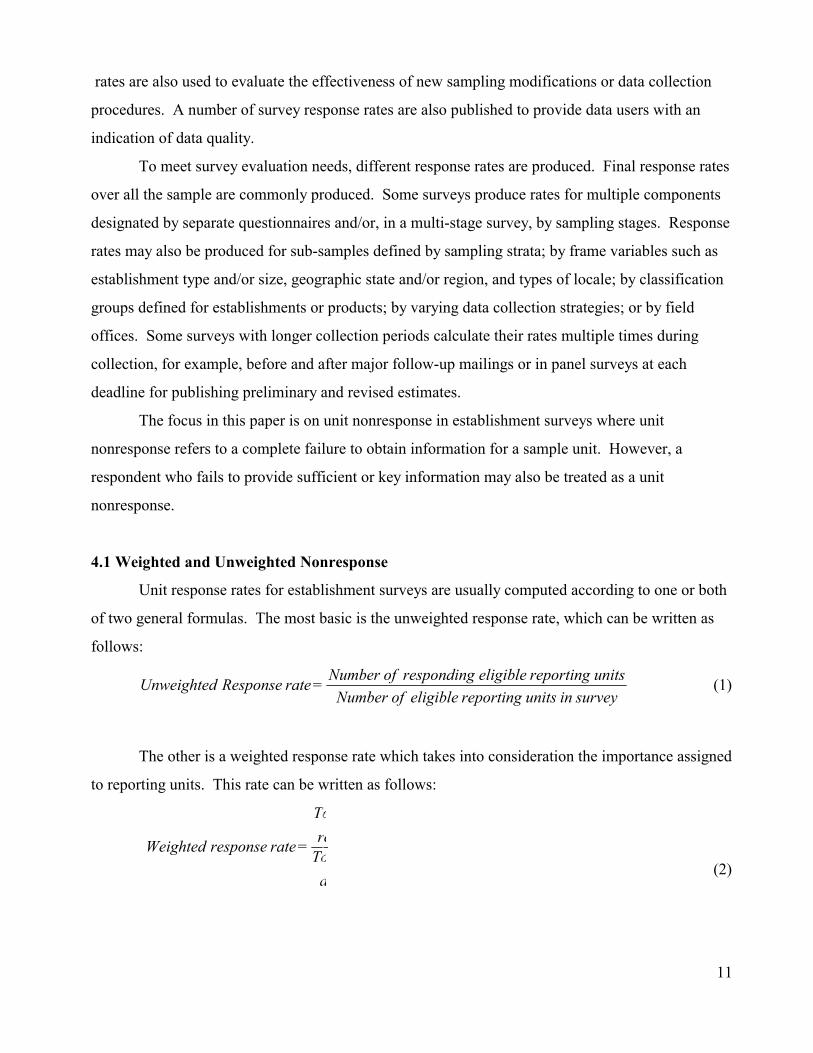
4.1 Weighted and Unweighted Nonresponse
Unit response rates for establishment surveys are usually computed according to one or both
of two general formulas. The most basic is the unweighted response rate, which can be written as
follows:
surveyin units reporting eligible of Numberunits reporting eligible responding of Number = rate Response Unweighted (1)
The other is a weighted response rate which takes into consideration the importance assigned
to reporting units. This rate can be written as follows:
(2)
12
The unweighted response rate is used to indicate the proportion of eligible units which
cooperate in the survey while the weighted rate is generally used to indicate the proportion of some
estimated population total which is contributed by respondents. In cases where a small number of
large establishments may account for a major proportion of the population total, the weighted
response rate is probably a better indicator of the quality of the estimate.
A third type of unit response rate may be calculated for multi-stage surveys where sampling
occurs within sampled establishments. If R1 is the unit response rate for establishments (first
reporting stage) and if R2 is the unit response rate among units sampled within establishments
(second reporting stage), then
Overall response rate = R xR 21 (3)
where R1 and R2 are calculated according to (1) or (2) separately for the two reporting stages.
The three types of calculations for response rates may be illustrated with the 1994 Schools
and Staffing Survey (SASS) which was conducted by the National Center for Education Statistics.
Response rates are produced for each questionnaire in SASS. The unweighted rates as defined in (1)
are calculated by using the ratio X/Y where X is the number of schools which returned a completed
questionnaire and Y is the number of sample schools which were confirmed to be still existing
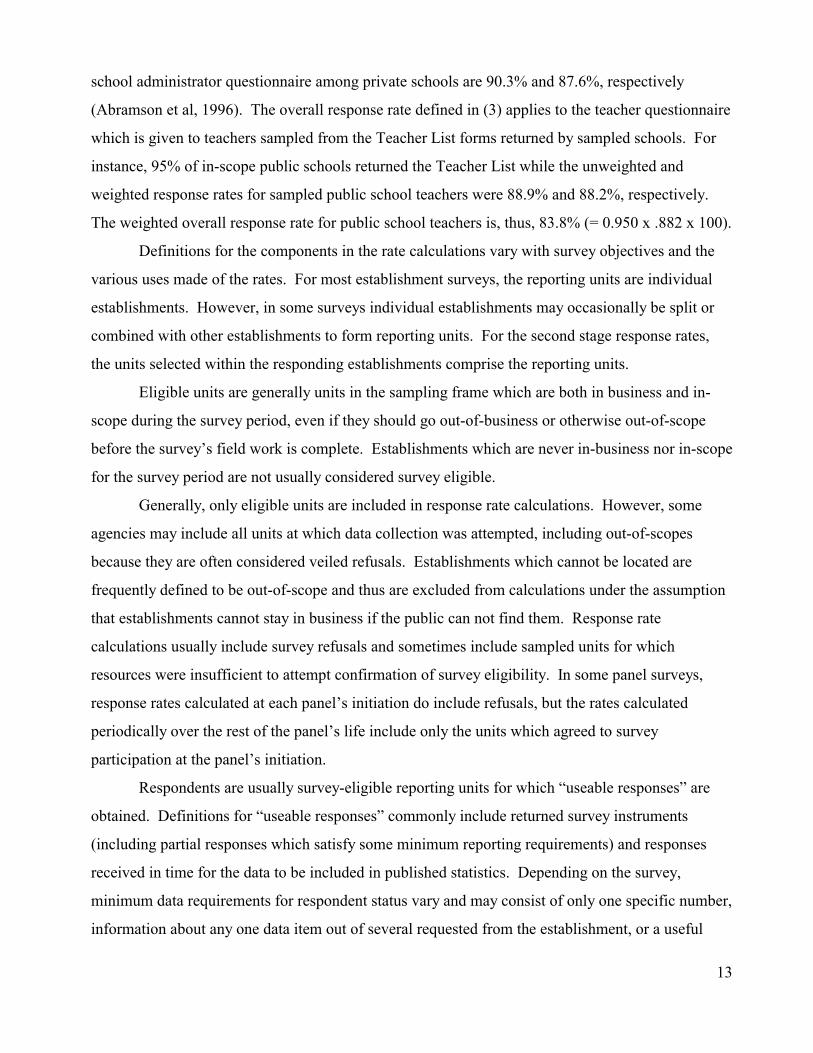
during field work. The weighted response rates corresponding to (2) are calculated by the formula
W
)W
i
i
response) (i,ii
(q
∑
∑ δ
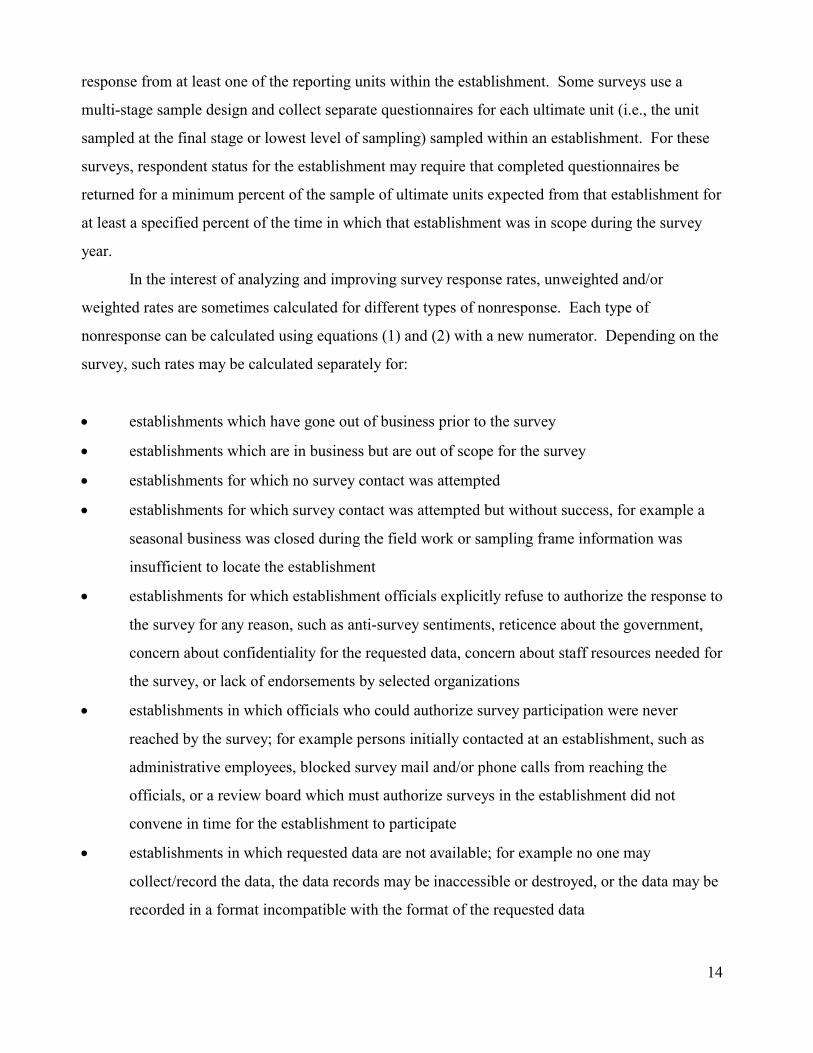
where W i is the inverse of the selection probability for the ith in-scope school and the following is
an indicator function for response.
1 if the ith school returned form q, and
0 otherwise
For example, the unweighted and weighted response rates for the
⎪⎪⎩
⎪⎪⎨
⎧
= )(q response) (i,δ
13
school administrator questionnaire among private schools are 90.3% and 87.6%, respectively
(Abramson et al, 1996). The overall response rate defined in (3) applies to the teacher questionnaire
which is given to teachers sampled from the Teacher List forms returned by sampled schools. For
instance, 95% of in-scope public schools returned the Teacher List while the unweighted and
weighted response rates for sampled public school teachers were 88.9% and 88.2%, respectively.
The weighted overall response rate for public school teachers is, thus, 83.8% (= 0.950 x .882 x 100).
Definitions for the components in the rate calculations vary with survey objectives and the
various uses made of the rates. For most establishment surveys, the reporting units are individual
establishments. However, in some surveys individual establishments may occasionally be split or
combined with other establishments to form reporting units. For the second stage response rates,
the units selected within the responding establishments comprise the reporting units.
Eligible units are generally units in the sampling frame which are both in business and in-
scope during the survey period, even if they should go out-of-business or otherwise out-of-scope
before the survey’s field work is complete. Establishments which are never in-business nor in-scope
for the survey period are not usually considered survey eligible.
Generally, only eligible units are included in response rate calculations. However, some
agencies may include all units at which data collection was attempted, including out-of-scopes
because they are often considered veiled refusals. Establishments which cannot be located are
frequently defined to be out-of-scope and thus are excluded from calculations under the assumption
that establishments cannot stay in business if the public can not find them. Response rate
calculations usually include survey refusals and sometimes include sampled units for which
resources were insufficient to attempt confirmation of survey eligibility. In some panel surveys,
response rates calculated at each panel’s initiation do include refusals, but the rates calculated
periodically over the rest of the panel’s life include only the units which agreed to survey
participation at the panel’s initiation.
Respondents are usually survey-eligible reporting units for which “useable responses” are
obtained. Definitions for “useable responses” commonly include returned survey instruments
(including partial responses which satisfy some minimum reporting requirements) and responses
received in time for the data to be included in published statistics. Depending on the survey,
minimum data requirements for respondent status vary and may consist of only one specific number,
information about any one data item out of several requested from the establishment, or a useful
14
response from at least one of the reporting units within the establishment. Some surveys use a
multi-stage sample design and collect separate questionnaires for each ultimate unit (i.e., the unit
sampled at the final stage or lowest level of sampling) sampled within an establishment. For these
surveys, respondent status for the establishment may require that completed questionnaires be
returned for a minimum percent of the sample of ultimate units expected from that establishment for
at least a specified percent of the time in which that establishment was in scope during the survey
year.
In the interest of analyzing and improving survey response rates, unweighted and/or
weighted rates are sometimes calculated for different types of nonresponse. Each type of
nonresponse can be calculated using equations (1) and (2) with a new numerator. Depending on the
survey, such rates may be calculated separately for:
• establishments which have gone out of business prior to the survey
• establishments which are in business but are out of scope for the survey
• establishments for which no survey contact was attempted
• establishments for which survey contact was attempted but without success, for example a
seasonal business was closed during the field work or sampling frame information was
insufficient to locate the establishment
• establishments for which establishment officials explicitly refuse to authorize the response to
the survey for any reason, such as anti-survey sentiments, reticence about the government,
concern about confidentiality for the requested data, concern about staff resources needed for
the survey, or lack of endorsements by selected organizations
• establishments in which officials who could authorize survey participation were never
reached by the survey; for example persons initially contacted at an establishment, such as
administrative employees, blocked survey mail and/or phone calls from reaching the
officials, or a review board which must authorize surveys in the establishment did not
convene in time for the establishment to participate
• establishments in which requested data are not available; for example no one may
collect/record the data, the data records may be inaccessible or destroyed, or the data may be
recorded in a format incompatible with the format of the requested data
15
• establishments which agree to participate but do not deliver the requested data, for example
the person with data is not available or breaks appointments with survey staff or the survey
forms are lost in the mail or delayed beyond survey deadlines.
These and other types of nonresponse may be tracked separately, because strategies to reduce them
are likely to be quite different.
5.0 Trends in Nonresponse Rates
Conventional wisdom in the survey research profession holds that nonresponse rates are
increasing. For personal and household surveys, this hypothesis has been largely upheld, and there
is some evidence that this phenomenon may be due to increasing refusal rates, even as noncontact
rates hold steady or decline (Groves, 1989; Steeh, 1981; Smith, 1995). There is less evidence of a
clear trend in the establishment survey discipline however.
Christianson & Tortora (1995), in a survey of 21 international statistical agencies asked
informants to categorize each organization's surveys and censuses as either increasing, unchanged,
or decreasing in response rate over the 10 years ending in 1993. A total of 104 surveys were
categorized and the authors concluded that the plurality of studies maintained unchanged rates,
while a smaller and roughly balanced number reported increasing and decreasing trends.
Osmint et al. (1994) and Gonzales, et al. (1995) reported response rates for annual surveys
conducted from 1984 - 1990 by the Federal government. A composite rate, represented by the
average annual response rates from nine surveys, revealed a "slightly decreasing but fairly stable"
trend when weighted response rates were used, while a composite of unweighted response rates
"was slightly increasing." Taken individually, only one survey of nine showed a marked trend
(decreasing). The data did "not support a hypothesized decrease in response rates for establishment
surveys during the period studied; neither did it suggest improvement."
5.1 Recent Nonresponse Trends - Data and Measures
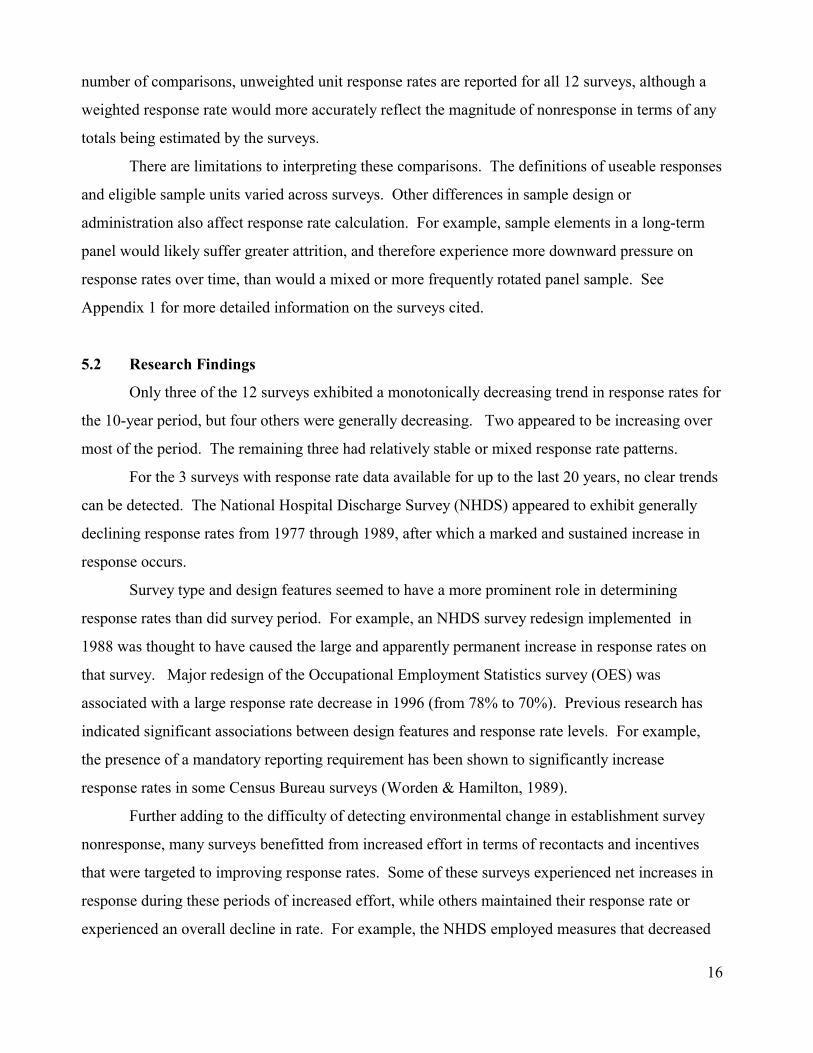
For this paper, response rate trend data from 12 Federal government surveys conducted for at
least three periods within the last 10 years (1987-1997) were collected. The surveys were selected
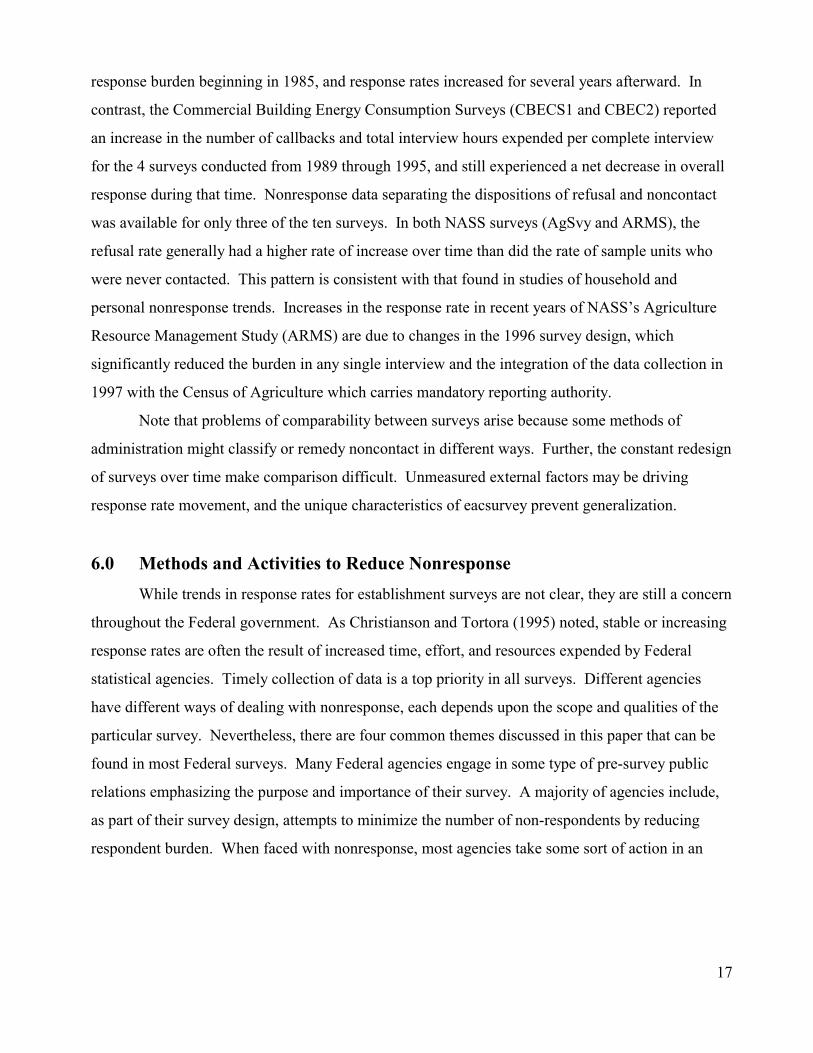
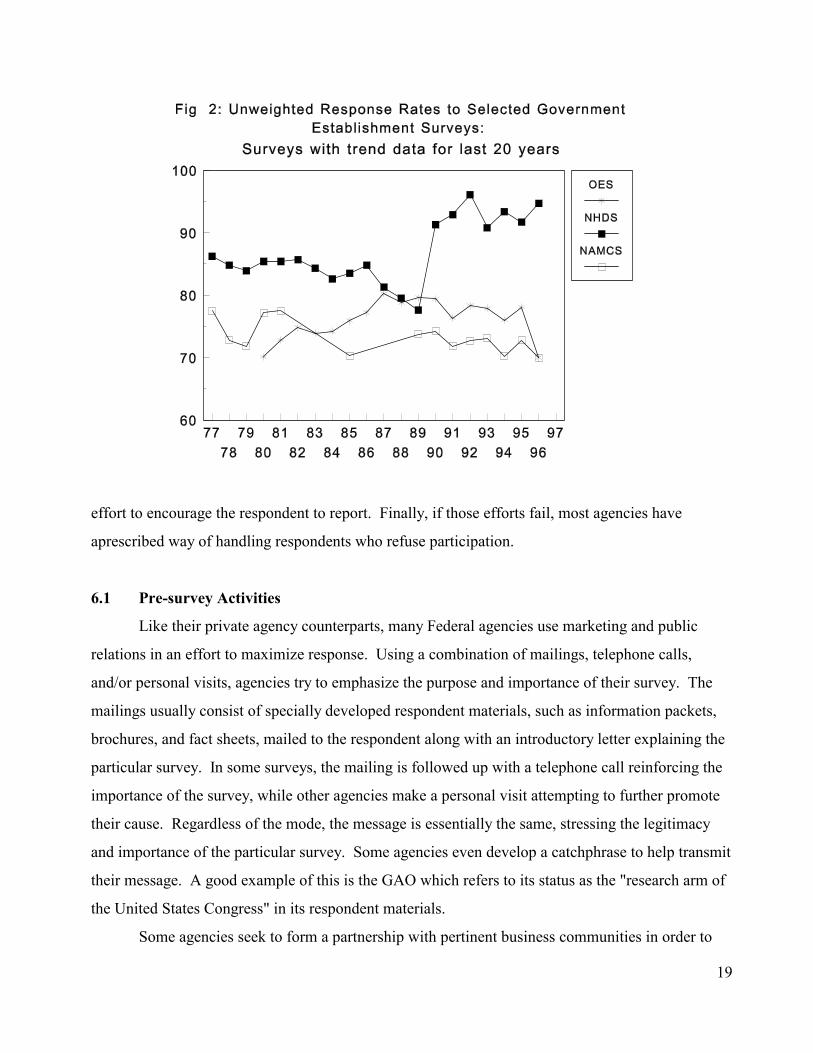
from the agencies represented by IGEN members. Three of these surveys also reported response
rates for almost all of the last 20 years (1977-1997). (See Figure 1, page 18) To enable the greatest
16
number of comparisons, unweighted unit response rates are reported for all 12 surveys, although a
weighted response rate would more accurately reflect the magnitude of nonresponse in terms of any
totals being estimated by the surveys.
There are limitations to interpreting these comparisons. The definitions of useable responses
and eligible sample units varied across surveys. Other differences in sample design or
administration also affect response rate calculation. For example, sample elements in a long-term
panel would likely suffer greater attrition, and therefore experience more downward pressure on
response rates over time, than would a mixed or more frequently rotated panel sample. See
Appendix 1 for more detailed information on the surveys cited.
5.2 Research Findings
Only three of the 12 surveys exhibited a monotonically decreasing trend in response rates for
the 10-year period, but four others were generally decreasing. Two appeared to be increasing over
most of the period. The remaining three had relatively stable or mixed response rate patterns.
For the 3 surveys with response rate data available for up to the last 20 years, no clear trends
can be detected. The National Hospital Discharge Survey (NHDS) appeared to exhibit generally
declining response rates from 1977 through 1989, after which a marked and sustained increase in
response occurs.
Survey type and design features seemed to have a more prominent role in determining
response rates than did survey period. For example, an NHDS survey redesign implemented in
1988 was thought to have caused the large and apparently permanent increase in response rates on
that survey. Major redesign of the Occupational Employment Statistics survey (OES) was
associated with a large response rate decrease in 1996 (from 78% to 70%). Previous research has
indicated significant associations between design features and response rate levels. For example,
the presence of a mandatory reporting requirement has been shown to significantly increase
response rates in some Census Bureau surveys (Worden & Hamilton, 1989).
Further adding to the difficulty of detecting environmental change in establishment survey
nonresponse, many surveys benefitted from increased effort in terms of recontacts and incentives
that were targeted to improving response rates. Some of these surveys experienced net increases in
response during these periods of increased effort, while others maintained their response rate or
experienced an overall decline in rate. For example, the NHDS employed measures that decreased
17
response burden beginning in 1985, and response rates increased for several years afterward. In
contrast, the Commercial Building Energy Consumption Surveys (CBECS1 and CBEC2) reported
an increase in the number of callbacks and total interview hours expended per complete interview
for the 4 surveys conducted from 1989 through 1995, and still experienced a net decrease in overall
response during that time. Nonresponse data separating the dispositions of refusal and noncontact
was available for only three of the ten surveys. In both NASS surveys (AgSvy and ARMS), the
refusal rate generally had a higher rate of increase over time than did the rate of sample units who
were never contacted. This pattern is consistent with that found in studies of household and
personal nonresponse trends. Increases in the response rate in recent years of NASS’s Agriculture
Resource Management Study (ARMS) are due to changes in the 1996 survey design, which
significantly reduced the burden in any single interview and the integration of the data collection in
1997 with the Census of Agriculture which carries mandatory reporting authority.
Note that problems of comparability between surveys arise because some methods of
administration might classify or remedy noncontact in different ways. Further, the constant redesign
of surveys over time make comparison difficult. Unmeasured external factors may be driving
response rate movement, and the unique characteristics of eacsurvey prevent generalization.
6.0 Methods and Activities to Reduce Nonresponse
While trends in response rates for establishment surveys are not clear, they are still a concern
throughout the Federal government. As Christianson and Tortora (1995) noted, stable or increasing
response rates are often the result of increased time, effort, and resources expended by Federal
statistical agencies. Timely collection of data is a top priority in all surveys. Different agencies
have different ways of dealing with nonresponse, each depends upon the scope and qualities of the
particular survey. Nevertheless, there are four common themes discussed in this paper that can be
found in most Federal surveys. Many Federal agencies engage in some type of pre-survey public
relations emphasizing the purpose and importance of their survey. A majority of agencies include,
as part of their survey design, attempts to minimize the number of non-respondents by reducing
respondent burden. When faced with nonresponse, most agencies take some sort of action in an
18
19
effort to encourage the respondent to report. Finally, if those efforts fail, most agencies have
aprescribed way of handling respondents who refuse participation.
6.1 Pre-survey Activities
Like their private agency counterparts, many Federal agencies use marketing and public
relations in an effort to maximize response. Using a combination of mailings, telephone calls,
and/or personal visits, agencies try to emphasize the purpose and importance of their survey. The
mailings usually consist of specially developed respondent materials, such as information packets,
brochures, and fact sheets, mailed to the respondent along with an introductory letter explaining the
particular survey. In some surveys, the mailing is followed up with a telephone call reinforcing the
importance of the survey, while other agencies make a personal visit attempting to further promote
their cause. Regardless of the mode, the message is essentially the same, stressing the legitimacy
and importance of the particular survey. Some agencies even develop a catchphrase to help transmit
their message. A good example of this is the GAO which refers to its status as the "research arm of
the United States Congress" in its respondent materials.
Some agencies seek to form a partnership with pertinent business communities in order to
20
promote their survey. Agencies seek the endorsement of industry organizations and associations,
such as Chambers of Commerce, in order to further legitimize their survey, or lobby related
industries to assist in reducing respondent burden. For example, the ES-202, a program of the BLS,
lobbies the payroll processing industry to include programming in their software that facilitates the
calculation and submission of payroll data items requested from ES-202 respondents. Some publish
articles about their survey in industry newsletters, while others participate in pertinent industry
conferences and seminars, promoting awareness of their survey.
When applicable, the agencies also emphasize their assurance of confidentiality for
respondents that is protected by law. For example, the National Health Care Survey (NHCS) is
backed by a Congressional mandate (Section 308[d] of Public Health Service Act, [42USC242m])
which prohibits disclosure of respondents' identities, and NHCS stresses this in its respondent
materials. Legal responsibility for maintaining respondent confidentiality is emphasized by many
Federal agencies. When requesting sensitive data items, the assurance of confidentiality addresses
one of the main concerns of the respondent, increasing the likelihood of gaining their cooperation.
6.2 Reducing Respondent Burden Through Survey Design
Reducing respondent burden is always a goal of survey agencies, because respondents are
less likely to participate if they perceive the burden to be too great. Therefore, most Federal
agencies have built components into their overall survey design that attempt to reduce respondent
burden, thereby minimizing nonresponse. These components include a flexible sample design, a
clear and easy to use questionnaire design, and the availability of different reporting modes or
special reporting arrangements.
The actual sample design can affect the level of nonresponse in a survey. Some on-going
surveys, such as the National Hospital Ambulatory Care Survey (NHAMCS) of NCHS, implement a
rotational sample design, in which respondents are asked to participate usually for a short, fixed
amount of time, thus reducing overall survey response burden. Others, such as the School and
Staffing Survey (SASS), a survey of the National Center for Education Statistics (NCES), may even
control the sample overlap between rotations, intentionally minimizing the overlap. That way the
chance that a respondent is asked to participate twice or more in consecutive time periods is
minimized, further reducing burden. Others, such as the Agricultural Resource Management Study
(ARMS) of the National Agricultural Statistics Service (NASS), use a Perry-Burt Sampling
Procedure, which uses fixed random numbers in selecting samples to minimize the number of
21
contacts with a given establishment from other NASS competing surveys during the year. Samples
may also be designed to collect more data from individually selected sample units so as to reduce
the total number of establishment contacts that need to be made for the survey. This is routinely
done in the Price Program surveys of BLS.
The designation of the primary sampling unit can also reduce respondent burden. If several
establishments from one company are in a particular survey, it may be easier for the business to give
a company-wide report rather than a breakdown by location. Therefore, to make reporting easier,
agencies will designate the company instead of a certain location as the primary sampling unit.
Questionnaire design can also be a factor in minimizing nonresponse. Cognitive research
has proven quite beneficial to the development of survey questionnaires, so much so that some
agencies, like the Census Bureau, the BLS, and NCHS, have established cognitive labs to research
questionnaire and other survey procedural issues. Many Federal agencies have begun to take
advantage of this body of knowledge and more user-friendly questionnaires are being developed
resulting in decreases in respondent burden. For example, after determining that their
questionnaires were difficult to use, NCES employed cognitive research to design a questionnaire
using more colors and layouts that more closely followed natural eye movement. The result was a
questionnaire tailored to the respondent, with more logical skip patterns, that was easier to
complete.
Industry-specific questionnaires are used by many agencies, with a customized set of
instructions for each industry, reducing the length and redundancy of the interview. Some surveys
use short forms for small, single establishments so as not to overwhelm them. In addition, many
agencies pre-print survey questionnaires with respondent information and previously reported data,
which reduces the number of items the respondent needs to complete and lets them compare
previous data to current data. Note there are pros and cons to this practice of including previous
cycle data with requests for later data. The presence of previous data could help some respondents
and reduce response time, yet it may encourage other respondents to passively state "no change" in
response to subsequent collection efforts.
Traditionally, most Federal surveys have been conducted by mail or personal interview and
the mode of data collection may, in fact, impact response rate. Low initial response by mail is often
followed with telephone or personal interview contacts to increase response. While many agencies
still use these methods as their primary collection mode, others are taking advantage of emerging
22
technology to develop alternative reporting modes in an effort to make reporting easier on the
respondent. Over the past 10-15 years, automated collection methods such as computer-assisted
interviewing (conducted either by interviewers or self-administered), touchtone data entry, voice
recognition, FAX, electronic data interchange, and the Internet have emerged as alternative ways of
reporting. These alternative ways of responding are generally feasible for surveys which do not
involve a lot of data collection. Many respondents find these electronic reporting methods more
convenient than traditional methods and quite easy to use. Also, most Federal agencies cooperate
with establishments who require special reporting arrangements, facilitating what needs the
respondent has in order to gain their participation. The more options respondents have to report, the
more likely they will be to actually do so.
Agencies also work together when possible to reduce respondent burden by combining with
other surveys to reduce multiple reporting. For example, the Current Employment Statistics (CES)
program and the ES-202 program, both BLS surveys, allow large companies to send the data for two
different surveys to one data collection location rather than separate state agencies who would
normally collect the data. Similarly, the Census Bureau has combined two surveys (Company
Organization Survey and Annual Survey of Manufacturing) so as to avoid duplicate reporting for
multi-location companies with manufacturing activities.
Most Federal agencies consider their respondents to be their customers. In an effort to offer
the highest level of customer service possible, some agencies provide a forum to answer questions
and help respondents complete their survey. This is accomplished in many cases by offering a toll
free phone number or help desk that respondents can call when they have questions or problems.
6.3 Nonresponse Prompting
For those respondents who have initially agreed to participate but later become
nonrespondents almost every Federal agency uses some sort of reminder or nonresponse prompt, in
an effort to elicit a response. These prompts are transmitted in a variety of ways, such as by letter or
postcard, a remailing of the questionnaire, personal visit, telephone, FAX, and e-mail. While the
mode may vary, the message is basically the same, carefully worded to encourage the respondent to
report.
The mode of the nonresponse prompt is important, and depends on factors such as the survey
scope, establishment size, the respondent's ability to receive the prompt, and overall prompt cost.
23
The most effective prompts (personal visit, telephone call) are usually the most expensive. Larger
establishments that are more important to the survey are more likely to receive the most effective
prompts. However, agencies must consider the cost and develop a nonresponse prompting plan
based on their available resources, scope, and the impact of nonrespondents on the quality of the
estimate.
Timing is also critical in nonresponse prompting. Most surveys have a fixed cutoff date for
receipt of data, and as this deadline approaches, agencies must decide when to send the prompt. If it
is sent too soon, the prompt may not serve as an effective reminder. If it is sent too late, data may
not be received by the survey deadline. Some agencies have addressed this by developing a
nonresponse prompting model. For example, the Current Employment Statistics program of the
BLS has developed a nonresponse prompting model based on several factors such as size of
establishment, number of collection days available, data reporting method, and previous reporting
history. The model allows BLS to target nonresponse, sending reminders when respondents are
projected to have their monthly report ready (Rosen, Clayton and Rubino, 1991). This results in a
staggered transmission of nonresponse prompts, reducing the proportion of the sample that requires
follow-up and lowering collection costs.
6.4 Handling Refusals
In spite of how much effort agencies put into preventing nonresponse, refusals are inevitable.
However, most agencies have established a process for avoiding refusals. Interviewers are
specially trained to handle these cases, and usually have a standard set of responses to answer
common reasons given for refusing. When a respondent initially refuses, interviewers are generally
instructed to listen to the respondent with a sympathetic ear and address the specific reason given.
The interviewer may also try to seek out a higher-level company official if they cannot gain
cooperation from the initial contact. Some interviewers may resort to less customary approaches for
evasive respondents, such as "walking into" an establishment without a prior appointment, or calling
outside standard office hours in the hopes of circumventing voice mail or other screening measures.
If the initial interviewer is ultimately unable to gain the respondent's participation, a second, more
experienced interviewer usually follows up with another call or personal visit, attempting to convert
the refusal. These follow up efforts to gain participation from respondents who have explicitly
refused to cooperate are termed refusal conversion. Most agencies attach great importance to the
24
refusal conversion attempt, because it is usually the last chance to gain the respondent's cooperation.
Some surveys, like the quarterly Agricultural Survey conducted by NASS and the International
Price Program of the BLS, develop respondent profiles from comments and other information
collected during previous contacts with the establishment, which helps the second interviewer in the
refusal conversion process. Similar to the initial interviewer, the more accomplished second
interviewer comes prepared with a set of standard responses that are flexible and responsive to
refusal reasons, and will seek out a higher level company official if they think it will help them gain
cooperation. Some agencies will bargain with some respondents, offering special arrangements
such as limiting the frequency and detail of requested data in exchange for their participation (this is
most likely with large establishments whose cooperation is vital to the survey estimate.)
Addressing nonresponse in mail surveys requires a somewhat different approach. In a mail
survey, the sampled establishment has no face-to-face contact with the agency during which to
directly refuse to participate. Thus, in a mail survey a nonresponse could be due to an actual refusal,
a bad address (no contact), or perhaps the envelope with the survey instrument is lost somewhere
within the intended establishment. Agencies with mail surveys typically pursue nonresponding
establishments using a variety of nonresponse prompts (see section 6.3 above). One such prompt is
to contact the respondent via the telephone. With this type of prompt, the responding establishment
could, in fact overtly refuse to participate. Typically, after a predetermined number of prompts or
set passage of time, the nonresponding units will then be coded as nonresponse, refusal, noncontact,
out of business etc., depending upon preset survey procedures.
6.5 Special Measures to Reduce Nonresponse
There are a few special measures taken to reduce nonresponse that, while not practiced by
most agencies, deserve mentioning. The National Hospital Discharge Survey, a survey of the
NCHS, actually reimburses hospitals for staff time per completed sample record used to complete
survey work. All NCHS surveys offer to provide a sworn Census field representative to select and
abstract the data if the respondent chooses in order to reduce respondent burden. The Census of
Manufacturers, a survey collected by the Census Bureau, contacts establishments one full year in
advance of the data collection period. Census sends samples of questionnaire content in advance of
the collection period in order to allow time for the respondent to prepare any needed materials to
complete the survey.
25
7.0 Adjustments for Nonresponse
Even when statistical agencies design surveys to increase response, take steps to motivate
response, and employ refusal conversion efforts, there are still inevitably non respondents. At that
point agencies will attempt to reduce the biasing effects of nonresponse in establishment surveys by
employing post-survey adjustment techniques. These post-survey adjustment techniques can be
categorized into two groups: weighting and non-weighting adjustment techniques. Weighting
adjustment, post-stratification, and raking are weighting adjustment techniques. These techniques
increase the weights of respondents so that they represent the nonrespondents. Imputation is a non-
weighting adjustment technique. This non-weighting technique derives or imputes a missing value
for non-respondents from other respondent records.
The essential difference among the techniques is in the auxiliary establishment information
used. Weighting adjustment techniques are often used when the only available information on
nonrespondents is that on the sampling frame. When more than the sampling frame information is
available on sample units then a non-weighting technique is usually used. The technique used by a
given survey organization may also depend on how easy a particular technique is to implement
given their particular survey processing system. Some recurring surveys may use more than one
technique to adjust for nonresponse. For example, the BLS Employment Cost Index uses weighting
adjustment for refusals that occur during initial contact and regression imputation for refusals that
occur in subsequent contacts. During initiation of the establishment, only auxiliary information
such as SIC, size of the establishment and geographic location is available. During subsequent
contacts, more information is known about that establishment, so imputation which can use this
additional information will provide a more adequate adjustment for nonresponse. A brief
description of each adjustment technique is provided below.
26
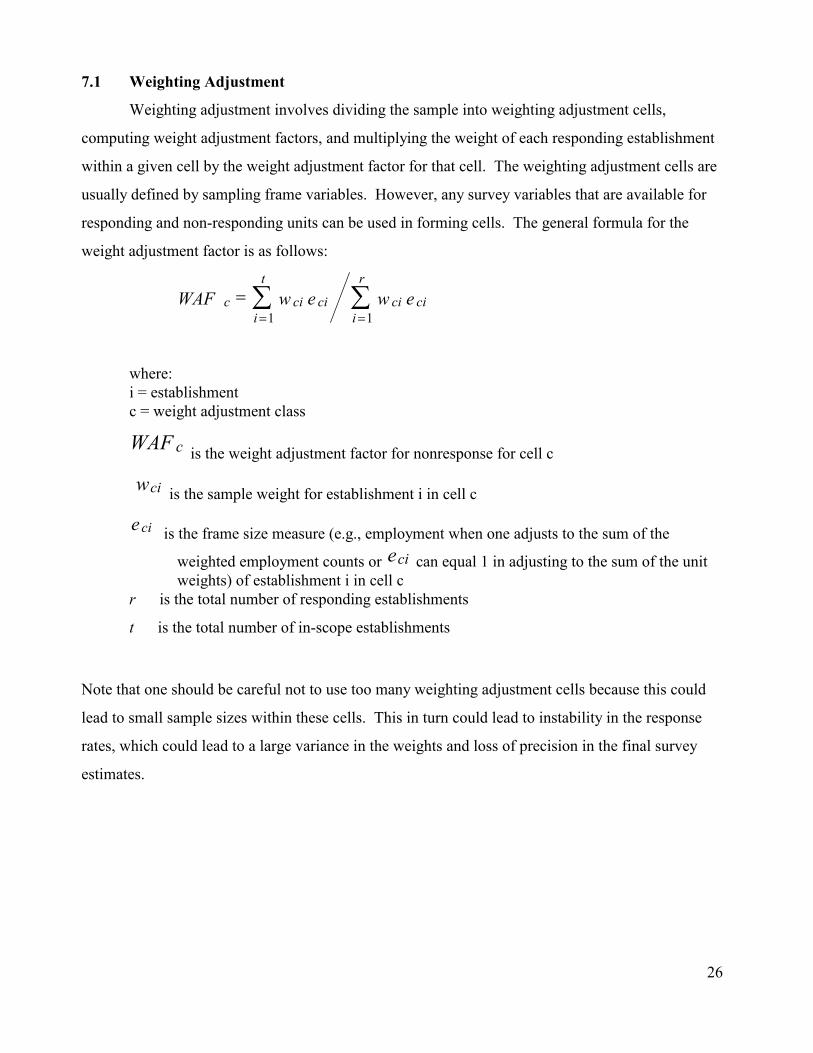
7.1 Weighting Adjustment
Weighting adjustment involves dividing the sample into weighting adjustment cells,
computing weight adjustment factors, and multiplying the weight of each responding establishment
within a given cell by the weight adjustment factor for that cell. The weighting adjustment cells are
usually defined by sampling frame variables. However, any survey variables that are available for
responding and non-responding units can be used in forming cells. The general formula for the
weight adjustment factor is as follows:
∑∑==
=r
icici
t
icicic ewewWAF
11
where: i = establishment c = weight adjustment class
WAF c is the weight adjustment factor for nonresponse for cell c
wci is the sample weight for establishment i in cell c
eci is the frame size measure (e.g., employment when one adjusts to the sum of the
weighted employment counts or eci can equal 1 in adjusting to the sum of the unit weights) of establishment i in cell c
r is the total number of responding establishments
t is the total number of in-scope establishments
Note that one should be careful not to use too many weighting adjustment cells because this could
lead to small sample sizes within these cells. This in turn could lead to instability in the response
rates, which could lead to a large variance in the weights and loss of precision in the final survey
estimates.
27
7.2 Post-stratification
The post-stratification adjustment attempts to reduce not only the bias created by
nonresponse but also errors due to inadequate coverage. The post-stratification adjustment involves
dividing the sample into post-stratification adjustment cells, computing post-stratification
adjustment factors, and multiplying the weight of each responding establishment within a cell by the
post-stratification adjustment factor for that cell. The technique requires knowledge of the
population values of auxiliary variables for the survey’s reference period. The post-stratification
adjustment cells are defined by survey auxiliary variables. The adjustment factor is computed
within each cell by dividing the population totals of the auxiliary variables by the sum of weighted
counts of responding establishments for that auxiliary variable.
Note that post-stratification is an estimation technique that can be employed to account for
nonresponse or a nonresponse adjustment can be made first using a weighting adjustment technique
and then post-stratification can still be used for estimation purposes. The two techniques are usually
employed when the nonresponse adjustment cells are different from the post-stratification cells.
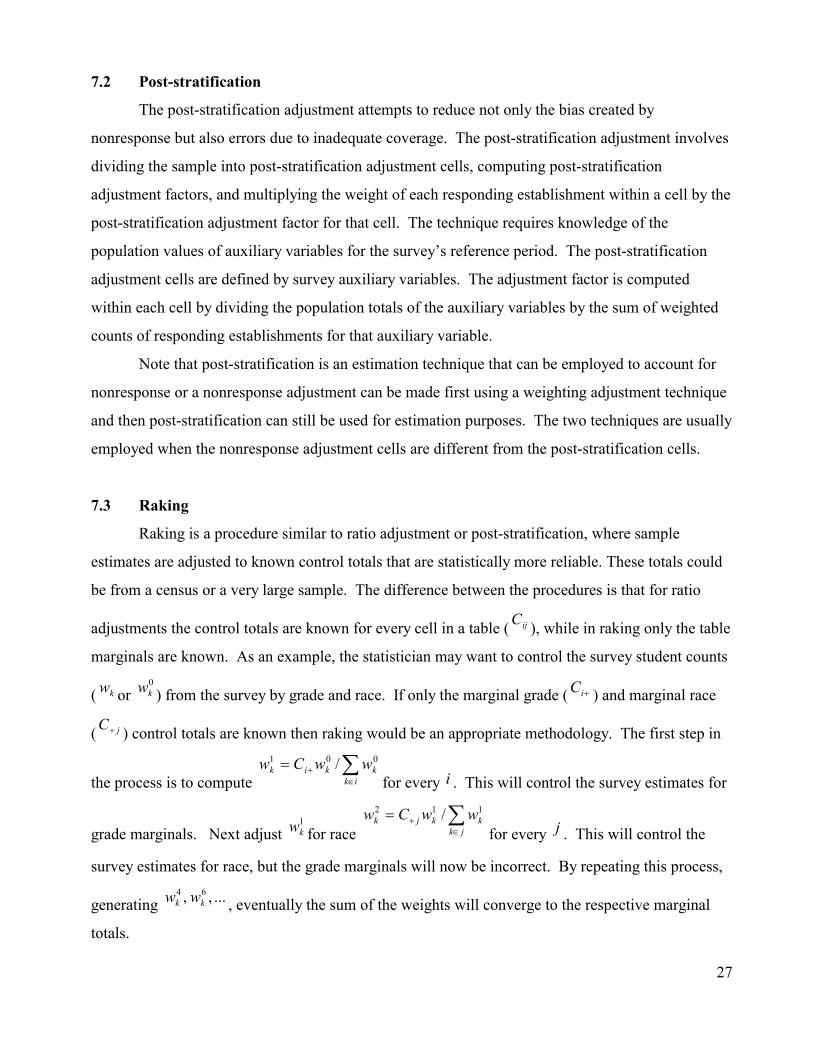
7.3 Raking
Raking is a procedure similar to ratio adjustment or post-stratification, where sample
estimates are adjusted to known control totals that are statistically more reliable. These totals could
be from a census or a very large sample. The difference between the procedures is that for ratio
adjustments the control totals are known for every cell in a table ( ijC ), while in raking only the table
marginals are known. As an example, the statistician may want to control the survey student counts
( kw or 0kw ) from the survey by grade and race. If only the marginal grade ( +iC ) and marginal race
( jC+ ) control totals are known then raking would be an appropriate methodology. The first step in
the process is to compute ∑∈
+=ik
kkik wwCw 001 /for every i . This will control the survey estimates for
grade marginals. Next adjust 1kw for race
∑∈
+=jk
kkjk wwCw 112 /for every j . This will control the
survey estimates for race, but the grade marginals will now be incorrect. By repeating this process,
generating ... , , 64kk ww , eventually the sum of the weights will converge to the respective marginal
totals.
28
Note that raking is also an estimation technique that can be employed to account for
nonresponse or a nonresponse adjustment can be made first using a weighting adjustment technique
and then raking can still be used for estimation purposes. Both techniques are usually employed
when the nonresponse adjustment cells are different from the raking cells.
7.4 Imputation
Imputation is the substitution of estimated values for missing or inconsistent data items or
fields on a survey unit’s record. This technique may be used for entire sample units who do not
respond or for individual items on an existing response. The substituted values are intended to
create values that do not fail edits. Common imputation procedures include multiple imputation,
cell mean imputation, random overall hot-deck imputation, random within cell hot-deck imputation,
sequential hot-deck imputation, hierarchical hot-deck imputation, nearest neighbor hot-deck
imputation, regression imputation, and deductive imputation. Discussion of all these techniques is
beyond the scope of this paper, though we include an overview of some techniques to provide the
reader with an overview of the procedures involved in imputation.
One way to impute is by directly substituting information from another source, e.g.,
substituting missing data on a survey with similar data available from an administrative source.
Other imputation methods utilize models in various ways to impute values for missing data. A
simple example of an imputation model is to divide the sample into imputation cells of like cases,
similar to the weighting class cells described above, and then to use a ratio model to impute for
missing data. For example, if the data item x was missing for the unit j in imputation cell c it could
be imputed by the following model:
ywxw y = x cici
r
1i=cici
r
1i=cjcj ∑∑ /
where y is a data item known for all units in the survey whether they respond or not and the other
items are defined as for the weighting adjustment factor described above. The same caution about
the size of the weighting factor cells applies to the imputation cells. In the above example, the ratio
model used assumes that in each imputation cell c, x is linearly dependent on y, with zero intercept,
and that the variance of the model error is proportional to y. These assumptions often hold
29
approximately, making this model frequently used in survey imputation.
In the example above, the simple ratio model is used. However, other more complicated
models, such as regression models can also be used. This will be most appropriate with the
availability of other regressor variables.
It should be noted when imputation is used, there is a risk that data users may compute
sampling errors from the completed data set as if all the data had been collected from respondents,
thus attributing greater precision to the survey estimates than is warranted (see Kalton and
Kaspryzk, 1982, 1986). This is due to the fact that most of the variance estimation software
currently available does not properly reflect imputation in the variances.
8.0 Special Research Studies in Establishment Nonresponse
The techniques for handling missing data and reducing nonresponse discussed above are
routinely used by Federal statistical agencies. However, a number of research studies have also
been undertaken by agencies conducting establishment surveys. These studies illustrate unique
approaches to understanding and handling establishment survey nonresponse. Details of these
studies are not provided here, but may be obtained from the agency contacts cited. The overview of
research presented within this section is not intended to serve as proof that particular techniques are
effective, or as general conclusions about establishment survey nonresponse. Instead, they are
included here to provide an indication of the type of unpublished research that is currently being
done within Federal statistical agencies, and as inspiration for future research efforts. Summaries of
selected studies follow by sponsoring agency.
8.1 Research Conducted by the Bureau of Labor Statistics (BLS)
Summary of Internal Inquiries by the Producer Price Index Surveys(PPI)1
Unweighted response rates at initiation were calculated for establishments in the Mining and
Manufacturing sector collected for the PPI to determine characteristics related to nonresponse. The
combined unweighted response rate for the group of industries within the Mining and
Manufacturing sector was found to be 84.1%. Unweighted response rates for the same group
1 Internal analyses, BLS. Contact: David Slack, (202) 606-6903
30
broken down by regional office (8 regional offices across the country) varied from 91.8% to 80.4%.
Further, establishments with sampled employment above the median value of the Mining and
Manufacturing sector had a slightly higher response rate than units with sampled employment below
the median value (85.2% vs. 83.1% respectively). Finally, the response rate (86.0%) for
establishments sampled with a probability = 1 -- the so-called certainty units, was compared to that
of establishments sampled with probability <1 (83.2%).
Mode Effects of Nonresponse Follow-up in an Establishment Setting2
After a second follow-up attempt in the 1993 Survey of Users of Employment and
Unemployment Statistics, remaining nonrespondents were randomly assigned to receive either a
certified mail follow-up or a telephone follow-up. (Telephone follow-up personnel were intensively
trained.) Conversion rates for certified mail were slightly (but not significantly) higher than for
telephone follow-ups. Data quality did not significantly differ across follow-up modes. Certified
mail was more expensive than telephone prompting follow-ups.
The Effects of Advance Letters and Reminder/Thank You Letters on Reducing Nonresponse in an
Establishment Survey: An Experimental Study3.
2Chun, Y., Devens, R., Mickkelson, G., and Yule, J. (1993), "Mode Effects of Nonresponse Follow-up in an
Establishment Setting." Proceedings of the section on Survey Research Methods, American Statistical Association, pp. 1042-1047.
3Chun, Y. and Robertson, K. (1995), “The Effects of Advance Letters and Reminder/Thank You Letters on Reducing Nonresponse in an Establishment Survey: An Experimental Study.” Proceedings of the Section on Survey Research Methods, American Statistical Association, pp. 1151-1156. Contact: Young Chun, (202) 606-6359
A field experiment in the Hours at Work Survey was conducted to investigate advance
letters and reminder/thank you letters as nonresponse-reducing techniques for an establishment mail
survey. Respondents that received both an advance and reminder letter had response rates that were
significantly higher than the response rates for respondents that received neither. Response rates for
respondents receiving only an advance letter or only a reminder were higher than the rates for
respondents that received neither, but not significantly higher.
31
Reducing Nonresponse in Business Surveys4
A follow-up study on the Hours at Work Survey found that advance and reminder/thank you
letters significantly reduced the amount of nonresponse and increased the information rate (i.e., the
ratio of establishments for which the agency has some type of information compared to the total
number of establishments included in the survey). The results assume that early contacts lead to
identification of ineligibles, refusals, and wrong addresses. This information in turn proved
valuable for efficiently allocating resources in order to focus on establishments still eligible to
respond. Results were also reviewed with respect to industry (manufacturing/nonmanufacturing)
and size (estimated number of employees). Larger manufacturing establishments experienced a
higher nonresponse reduction effect because of early contacts than did small establishments.
Nonresponse Follow-up in Establishment Surveys: A Split-half Experiment5
Nonrespondents to the Hours at Work Survey, after an initial and two follow-up mailings,
were randomly selected and subjected to two types of telephone follow-up. One-half were asked to
provide an estimate of hours paid and hours worked; the other half required additional telephone
interviewer effort to identify an appropriate respondent, ask that respondent to complete the
questionnaire with actual establishment data and return the questionnaire by FAX to BLS. The final
response rate for the group asked to provide estimates of hours information was significantly higher
than that for the group asked to return the questionnaire with actual hours data.
Current Employment Statistics (CES) Touchtone Data Entry (TDE)6
4Chun, Y. and Robertson, K. (1996), “Reducing Nonresponse in Business Surveys.” Proceedings of the Section on
Survey Research Methods, American Statistical Association, pp. 980-985. Contact: Young Chun, (202) 606-6359.
5Chun, Y. and Robertson, K. (1997), " Nonresponse Follow-up in Establishment Surveys: A Split-half Experiment." Proceedings of the Section on Survey Research Methods, American Statistical Association. Contact: Young Chun, (202) 606-6359
6 Rosen, R., Clayton, R., and Rubino Jr., T. (1991), “Controlling Nonresponse in an Establishment Survey.”

32
Proceedings of the Section on Survey Research Methods, American Statistical Association, pp. 587-592; also Clayton, Richard L., Rosen, Richard J., and Rubino Jr., Thomas B. (1993), “Nonresponse Prompting Behavior in a Monthly Establishment Survey.” Proceedings of the Section on Survey Research Methods, American Statistical Association, pp. 850-854.
33
A study focused on factors relevant to the TDE portion of the CES. The intent was to
develop and utilize a model to determine when to provide nonresponse reminder calls to
respondents in the TDE portion of the CES and analyze attrition rates for respondents reporting by
TDE. The study results indicate that improvements in the nonresponse prompting (NRP) process
can be made by considering the factors affecting nonresponse and utilizing information about the
NRP methods to improve the process. Also, response rates for active TDE units do not decline over
time and attrition is reduced compared to reporting by mail.
8.2 Research Conducted by the Bureau of the Census (Census)
Evaluation of the Redesigned Questionnaire for the Children in Custody Census7
For the Questionnaire Redesign for the Children in Custody Survey, Census conducted the
Children in Custody Questionnaire Redesign Project for the Office of Juvenile Justice and
Delinquency Prevention (OJJDP) from 1994 to 1997. In the final phase of the three-phase project,
Census conducted a split-panel test to compare the old and new questionnaires based on a survey of
480 sample facilities. The newer questionnaire was better designed to facilitate response. It asked
for a roster of residents and their demographic characteristics. The old questionnaire asked for total
counts of residents by demographic categories. The results of the split-panel test showed that the
new questionnaire for the Children in Custody Census was more successful in eliciting responses
from juvenile facilities with single reporters (81.0% unit response for the new questionnaire versus
63.2% for the old questionnaire). It was concluded that small and private facilities would probably
benefit most from the OJJDP's assistance in the future to improve their unit nonresponse rates
further.
Study of Imputation Methods in the Sample Survey of Law Enforcement Agencies8
7 Ellis, Y. and Schwede, L. (1997), "Evaluation of the Redesigned Questionnaire for the Children in Custody Census."
Proceedings of the Section on Survey Research Methods, American Statistical Association. Agency Contact: Yukiko Ellis, (301) 457-4869
8Dorinski, S. (1998), "Imputation Methods in the Sample Survey of Law Enforcement Agencies." Will be published in the Proceedings of the Section on Survey Research Methods. Contact: Suzanne Dorinski, (301) 457-3394
34
The Sample Survey of Law Enforcement Agencies (formerly known as Law Enforcement
Management and Administrative Statistics) is sponsored by the Bureau of Justice Statistics and
conducted by Census. The purpose of the survey is to produce national estimates of public law
enforcement agencies on such topics as personnel, expenditures, salaries, operations, equipment,
special programs, and drug enforcement activities. Previous versions of the survey (1993, 1990)
have used a hot deck approach to impute for item nonresponse and a weighting adjustment to
account for unit nonresponse. The 1997 survey used a variety of methods: historical imputation,
mean value imputation and ratio imputation. For both unit and item nonresponse, data were
available for some items from previous surveys. When possible, the historic data was carried
forward and adjusted for trends in the imputation class. When historic data were not available,
either mean value imputation or ratio imputation was used. This study applied the 1997 methods to
the 1993 data set to determine the impact of the changes in imputation and weighting methodology.
Among other results, the study recommended not replacing weighting adjustment by imputation for
1997 unit nonrespondents because of the following reasons: wording on some questions changed
from survey to survey, coding of some answers also changed, and many unit nonrespondents were
smaller agencies not in the previous surveys.
Nonresponse Study of the 1989 Survey of Pollution Abatement Costs and Expenditures (PACE)9
9Tulp, Jr., D., Hoy, C., Kusch, G., and Cole, S. (1991), "Nonresponse Under Mandatory vs. Voluntary Reporting in the
1989 Survey of Pollution Abatement Costs and Expenditures (PACE)." Proceeding of the Section on Survey Research Methods, American Statistical Association pp. 272-277. Contact: Dan Tulp, (301) 457-4831
The primary goal of this study was to test for significant differences in response rates
between mandatory and voluntary reporting. The PACE panel was newly drawn for 1989. The
study was designed to compare not only overall mandatory and voluntary response rates, but also the
effects of prior conditioning by comparing response rates for establishments with previous exposure
to the survey (old establishments) and response rates for surveys with no previous exposure (new
establishments). Plants of large certainty companies were excluded from the study because of the
assumption that they were less likely to report data if given voluntary status. It should be noted the
loss of data for large establishments might have affected the quality of PACE estimates. Results
obtained from this study indicated that mandatory reporting was more effective in obtaining higher
35
response rates than voluntary reporting. Significant differences were found for the three levels of
comparison: overall (82.5% vs. 61.5%), new establishments (81.2% vs. 56.4%), and old
establishments (85.4% vs. 74.1%). The latter result seemed to show that prior conditioning, at least
initially, positively affected response rates for voluntary reporting, but it still did not raise response
to the level of mandatory reporting. It was also found that timeliness of response improved under
mandatory reporting. Further, regardless of plant size, mandatory reporting yielded higher response
rates than voluntary reporting. Finally, an analysis was made to determine what the effect on the
survey estimates would have been had the PACE survey been conducted entirely on a voluntary
basis. This analysis showed that for the operating cost of PACE, a slight understatement would
have resulted. A more significant understatement was demonstrated for expenditures estimates, but
this was more a consequence of how expenditures were imputed for delinquent establishments.
Final Summary for the 1990 Survey of Pollution Abatement Costs and Expenditures (PACE)
Mandatory/Voluntary Study10
This study was a follow-up to the 1989 PACE mandatory versus voluntary study (see
previous study). The first study showed that under identical follow-up procedures, mandatory
reporting yielded significantly higher response than did voluntary reporting. The main goal of the
1990 study was to test various prompting and follow-up methods to see if voluntary response rates
could be improved, and whether any of these treatments would lessen the differences observed in
the 1989 study. Five voluntary subpanels of establishments were selected with each subpanel
receiving a different treatment method. The five treatments were: (1) pre-mail telephone calls,
(2) post-mail telephone calls, (3) intensive telephone follow-up at the 90 day due date and 120 day
follow-up date, (4) normal PACE follow-up, and (5) certified mail follow-up.
The mandatory panel received only the normal PACE follow-up (treatment 4). Results
obtained from this study indicated that voluntary response rates achieved by each of these treatments
fell below the mandatory panel’s rate. Some of the treatments seemed to have a positive effect on
improving voluntary response, especially certified mail follow-up; but the mandatory response rate,
with no special efforts to improve response, was higher in all cases. One additional follow-up result
was found when the 1991 PACE survey was done and that was related to the effect on response
10Tulp, D. (1992), "Final Summary of Results for the 1990 Survey of Pollution Abatement Costs and Expenditures
(PACE) Mandatory/Voluntary Study." Internal Working Paper, Census Bureau. Contact: Dan Tulp, (301) 457-4831
36
rates when the establishments in the voluntary panels were returned to a mandatory status. These
results showed significant improvements in the response rates, with increases ranging from 12
percentage points to 27 percentage points.
8.3 Research Conducted by the National Agricultural Statistics Service (NASS)
1994 Farm Costs and Returns Survey (FCRS)11
A split sample experiment was conducted nationwide on the FCRS testing the use of a
videotaped message to motivate survey participation among farm operators. (The FCRS became
Phase III of the Agricultural Resource Management Study when the NASS economic and
environmental survey programs were redesigned in 1996.) An 8-minute videotape, which was
enclosed with the pre-survey notification letter, explained the purpose of the survey, how it would
be conducted, and the importance of participation. The content of the video was motivated by
theories of survey participation and compliance principles enumerated by Groves, Cialdini, and
Couper (1992). Response rates in the experimental half-samples were compared to evaluate the
motivational effect of the video.
The unweighted response rate in the group receiving the video was more than 4 percentage
points higher than the response rate in the control group that did not receive the video. Refusal rates
were reduced by 3.8 percentage points. Like the 1992 FCRS incentive experiment, a statistically
significant difference of 2.8 percentage points was found in survey eligibility rates, resulting in
detection of more non-farms among sample units that received the video.
1992 Farm Costs and Returns Survey (FCRS)12
11Willimack, D. and Rutz, J. (1995), “Use of a Videotaped Message for Pre-Survey Notification: An Experiment in
Survey Promotion.” Poster session presented at the 50th Annual Conference of the American Association for Public Opinion Research. Contacts: Diane K. Willimack, (301) 457-3538, and Jack Rutz (202), 720-3607
12Willimack, D. (1993), “Selected Results of the Incentive Experiment on the 1992 Farm Costs and Returns Survey.” Proceedings of the International Conference on Establishment Surveys, American Statistical Association, pp. 490-495. Contact: Diane K. Willimack, (301) 457-3538.
37
A split ballot experiment was conducted on FCRS in four States to test the effects of a
prepaid nonmonetary incentive on response rates and related variables. The incentive item was a
pocket portfolio with a solar-powered calculator. Results of the incentive experiment showed a
statistically significant improvement in response rates of 5.4 percentage points due to the incentive.
The incentive appeared to be the most effective among the smallest farms, those with less than
$20,000 in expected sales usually encountered in the area frame (17 percentage point increase in
response rates), as well as the farms in the largest sales class with expected sales greater than
$500,000 (12 percentage point increase). The success of the token incentive in these sales classes
was attributed to social exchange factors -- sign of appreciation and symbol of trust -- since the
smallest and the largest farm operations are subjected to repeated contact on a number of NASS
surveys. In addition, the incentive appeared to have enhanced identification of non-eligible sample
units (non-farms) over the no incentive group, reducing a potential nonsampling error.
Reasons for Nonresponse on the 1990 and 1991 Farm Costs and Returns Survey13
The reasons given for refusing to participate in the Farm Costs and Returns Survey and
reasons for other noninterviews were collected and classified in 1990 and 1991. Overall, the
primary reason given for refusing was that the respondent was too busy and did not want to take the
time to respond (24.6%). While some reasons were more frequently mentioned in all states, other
reasons for refusing varied by state. This information is intended for use in helping to target future
refusal avoidance and conversion strategies. Reasons for noninterviews indicated that operations
were contacted, but that operators were not available during the survey data collection period.
Characterization of Nonrespondents14
NASS is currently doing an extensive study of response patterns in one state. Response for
individual agricultural operations is being tracked over time and over several of the agency's
ongoing surveys. Characteristics of respondents such as size, type of operation, location, the
amount of money they receive from Federal programs, demographic characteristics of the operator,
and the type and frequency of surveys they are selected for will be examined to see if they differ for
respondents and non-respondents. Reasons for nonresponse provided by sampled operations will
13NASS Research Reports, Number SRB-91-11 and SRB-92-10, Contact: Terry O'Connor,
USDA/NASS, (202)720-7216
14Contact: Jaki Stanley McCarthy, USDA/NASS, 703-235-5213.
38
also be tracked over time.
On an ongoing basis, NASS is also asking both respondents and nonrespondents in that state
whether they are familiar with NASS and the work that they do, as well as a number of opinion
questions about the agency, the data that are generated from the surveys, and the perceived value of
the survey data. These questions are intended to serve as a measure of the effectiveness of agency's
promotion and publicity activities. They will also help target specific materials for nonrespondents.
8.4 Research Conducted at the National Center for Education Statistics (NCES)
Errors in the 1991 Survey of Recent College Graduates15
A study was undertaken to estimate the errors due to nonresponse, random measurement
error, and systematic errors due to interviewers in the 1991 Survey of Recent College Graduates.
The first stage sampling units for this study were colleges and universities who supplied the lists of
graduates and their addresses. The second stage involved a sampling of graduates. Nonresponse
was, in large part, due to inadequate or missing lists, and missing or incorrect data on the lists
supplied. With respect to nonresponse, the report characterizes response rates for a number of
subpopulations, but in addition, attempts to quantify the nonresponse bias, using various models.
These biases are computed for a number of subpopulations. These biases are computed before and
after nonresponse adjustments, measuring the reduction in bias due to nonresponse adjustments.
Results show that adjustments may substantially reduce nonresponse bias in the estimates. The
nonresponse bias does not appear to be a dominant source of error after the adjustment, although it
is clearly still important. Particular problems were noted for the race/ethnicity estimates. Data users
should be generally encouraged by these findings. Many of the specific variables estimated by users
will be correlated with variables used in the nonresponse adjustments and poststratification
adjustments. In this situation, one should expect relatively small nonresponse bias.
School and Staffing Survey Pretest Methodology Analysis16
15The report can be downloaded from the NCES Internet site www.ed.gov/NCES/ by going to the publication section
and selecting publication number 95-640. Contact: Peter Stowe, (202) 219-2099.
16U.S. Department of Education, National Center for Education Statistics, "Schools and Staffing Pretest Methodology Analysis", Publication CS 89-115.
39
The “School and Staffing Survey Pretest Methodology Analysis” analyzes a controlled
experiment, testing questions such as: (1) Is it better to pay or not pay a coordinator? (2) Is it better
to remind the coordinator to follow up nonrespondents with a mail or telephone prompt? and
(3) Are there differences by public and private schools and are there differences by questionnaire?
The study was done in 1987 and presents a logistic regression analysis on mail return rates. The
study showed that: 1) paying the coordinator did not significantly affect the mail return rates,
2) school coordinators should be reminded about nonrespondents by telephone prompt, and
3) getting responses from private schools is far more difficult than public schools.
Analysis of Total Nonresponse Error in the 1993-94 Schools and Staffing Survey17
The NCES report “An analysis of Total Nonresponse Error in 1993-94 Schools and Staffing
Survey” provides response rates for a large number of characteristics and reports rates by whether
teacher response rates are conditioned on the reporting status of the teacher’s schools. The report
also includes a logistic regression developed to determine the most important explanatory variables.
Variance Estimation of Imputed Data18
The NCES draft working paper “Variance Estimation of Imputed Data” includes the finding
that when the response rates are low the downward bias can be very large. A variable with 20%
nonresponse bias can have a 20% underestimate of the variance. Since nonresponse adjustments
can be viewed as imputations, this implies surveys with high nonresponse rates can have large
variance under-estimation, unless the adjustments are replicated in the variance estimation.
9.0 Future Projects and Concluding Remarks
The Interagency Group on Establishment Nonresponse (IGEN) was charged with the task of
examining establishment nonresponse, reviewing current practices (at least as conducted within our
respective Federal agencies) and identifying potential future directions for research. This newly
formed group of 15-20 behavioral scientists, statisticians, and economists, began their collaborative
pursuit by writing this COPAFS paper. It was gratifying to observe that working together, sharing
17This report is on the NCES Internet site www.ed.gov/NCES/ by going to the publication section and selecting
publication number 98-243. Contact: Kerry Gruber, (202) 219-1461.
18This report will be an NCES working paper. Contact: Steve Kaufman, (202) 219-1337
40
experiences, ideas, and the writing of the paper came easily to a group of individuals, most of whom
had never met before we began working together in early 1998, who were of different disciplines,
and from different Federal agencies.
This paper is the first step in what is hoped to be an ongoing collaboration for research and
information sharing. IGEN is currently working to outline specific future research projects of
interest to all agencies represented on the group. We now outline some areas of common concern
with respect to nonresponse and commit to pursue some specific project(s) within one or more of
these areas in the near future. Collaborative research (and publication) of ways to measure,
characterize and/or reduce establishment nonresponse was, after all, IGEN's most important charge.
It should be noted that research agendas for establishment surveys have been produced as a result
of other activities or groups including the 1997 Second Advanced Seminar on Cognitive Aspects of
Survey Methodology (CASMII), (see Martin and Tucker, 1999). The sub-group addressing
establishment techniques that participated in CASMII, built their research questions under four
broad areas: A) motivation, interest and willingness of establishments to participate, B) the
cognitive process of encoding and retrieving information from establishment records, C) the impact
of expert interviewers and D) the effect of having the authorizing official and respondent supplying
the data be 2 different people. Additionally, the National Science Foundation (NSF, 1977) has
provided opportunities for research into establishment survey methods, including nonresponse
issues, through the methodology, measurement, and statistics program, as part of NSF's "human
capital initiative."
This final section of our paper outlines eight broad areas that we, the members of IGEN, feel
are in need of further research or clarification whether by IGEN and our sponsoring agencies or
others. Ultimately, the field of establishment nonresponse cannot help but benefit from such
activity. The IGEN encourages others involved with establishment surveys and who have ideas for
other types of research to contact any of its members and share those ideas.
9.1 The Correlates of Nonresponse
This type of research has been pursued rather extensively for household nonrespondents, but
is lacking for establishment nonrespondents. We began this paper with a list of important
characteristics of establishments that might affect nonresponse. However, which of these are
important and how they are related to nonresponse has never been rigorously examined.
41
An establishment nonresponse could mean the "establishment" has a policy of nonresponse,
or the individual within a particular establishment is refusing to cooperate. Who are the
nonrespondents, and do they differ by geographic location, establishment size, industry
(NAICS/SIC), or other characteristics; does the specific data request, survey or sponsoring agency
play a role in nonresponse? How should hard and soft core refusals be defined? Do they have
different characteristics? Why are some establishments hard core refusals? Is a nonresponse
dependent on time of day, or day of the week the establishment is contacted, or time of year? What
is the correlation between data availability and time of request? What reasons do people give for
not responding? Can knowledge of these reasons be used to increase response? What do
establishments consider response burden?
9.2 Management of Establishments In Recurring Samples
How is it best to collect data from those establishments that seem to be in multiple survey
samples within and across agencies.? What type of establishment surveys are expected to have the
same contact within sampled establishments? What is the best method to collect the data? Who
should be contacted? What is the best way to retain establishment cooperation?
9.3 Initiation of New Respondents and Retention of "Old" Respondents
What do we know about the best practices in obtaining cooperation from new respondents
and maintaining these respondents in long term surveys? What is the effect on the response rate
when survey requests are addressed generically instead of targeted to a specific person or office
within an establishment?
9.4 Effectiveness of Nonresponse Follow-up
Are there significant differences for establishment surveys on the effectiveness of the various
nonresponse prompts often used by Federal agencies such as: mail, phone, email, FAX, or changing
the mode of the nonresponse prompt from that used during the initial collection attempt?
9.5 The Effect of Different Collection Modes on Nonresponse
As a companion to 9.4 above, this research focuses on "doing the job perfectly" in the first
place so nonresponse is as low as possible. What alternative data collection technologies may
42
increase response? What impact do interviewers have on establishment response and are there
particular characteristics of interviewers that impact response in establishment surveys? Are these
variables or characteristics different from those operating in household surveys?
9.6 Authority versus Capability to Respond
When will the person who can grant permission to respond (authority) within an
establishment be someone other than the person with access to the data (capability to respond)?
What characteristics of establishments predict this? What different strategies are needed to obtain
cooperation from these different people? What techniques of persuasion work best for voluntary
establishment surveys? What aspect of nonresponse arises from the need to receive responses from
multiple informants on the same survey?
9.7 Uses of Persuasion
How does sponsorship and outside endorsement of a survey affect nonresponse? What is the
best way to get information from a survey organization to a sample establishment? Does feedback
during a panel design survey enhance cooperation of establishments? What types of incentives
(either monetary of non-monetary) will be most effective for use by establishment surveys?
9.8 Investigating the Potential Biasing Effect of Nonresponse on Establishment Surveys
How does attrition produce nonrepresentative samples? What methods might ameliorate
this problem?
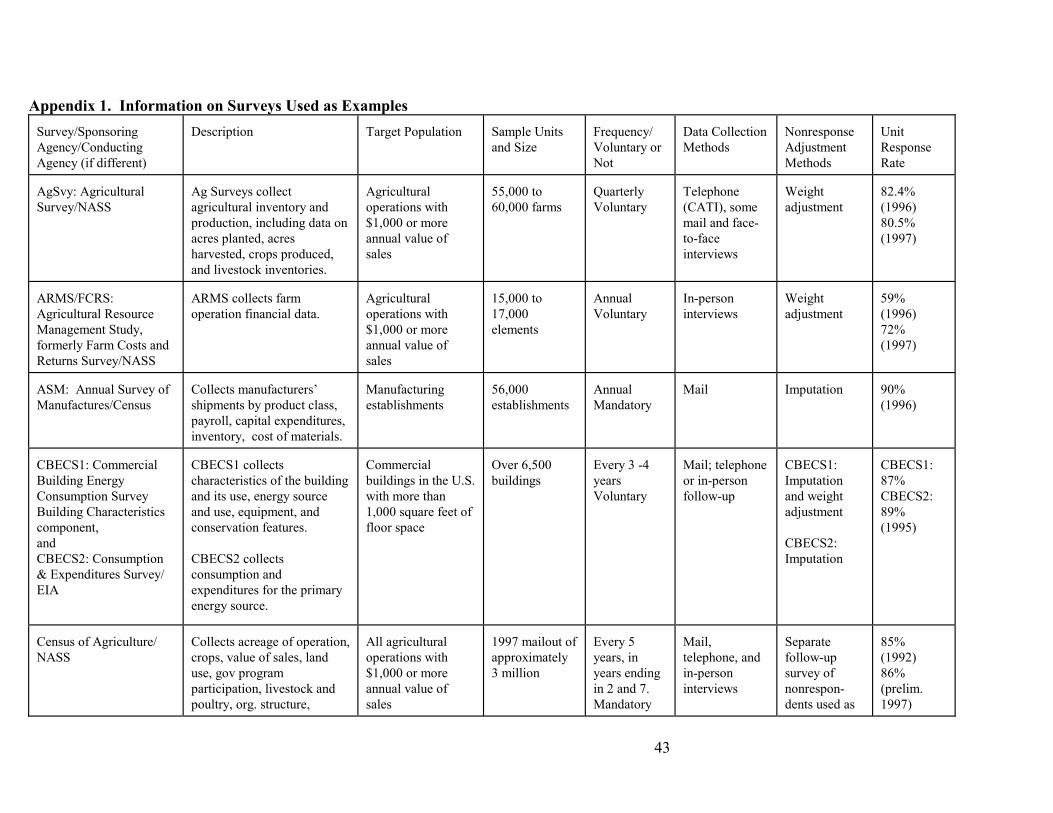
43
Appendix 1. Information on Surveys Used as Examples Survey/Sponsoring Agency/Conducting Agency (if different)
Description
Target Population
Sample Units and Size
Frequency/ Voluntary or Not
Data Collection Methods
Nonresponse Adjustment Methods
Unit Response Rate
AgSvy: Agricultural Survey/NASS
Ag Surveys collect agricultural inventory and production, including data on acres planted, acres harvested, crops produced, and livestock inventories.
Agricultural operations with $1,000 or more annual value of sales
55,000 to 60,000 farms
Quarterly Voluntary
Telephone (CATI), some mail and face-to-face interviews
Weight adjustment
82.4% (1996) 80.5% (1997)
ARMS/FCRS: Agricultural Resource Management Study, formerly Farm Costs and Returns Survey/NASS
ARMS collects farm operation financial data.
Agricultural operations with $1,000 or more annual value of sales
15,000 to 17,000 elements
Annual Voluntary
In-person interviews
Weight adjustment
59% (1996) 72% (1997)
ASM: Annual Survey of Manufactures/Census
Collects manufacturers’ shipments by product class, payroll, capital expenditures, inventory, cost of materials.
Manufacturing establishments
56,000 establishments
Annual Mandatory
Imputation
90% (1996)
CBECS1: Commercial Building Energy Consumption Survey Building Characteristics component, and CBECS2: Consumption & Expenditures Survey/ EIA
CBECS1 collects characteristics of the building and its use, energy source and use, equipment, and conservation features. CBECS2 collects consumption and expenditures for the primary energy source.
Commercial buildings in the U.S. with more than 1,000 square feet of floor space
Over 6,500 buildings
Every 3 -4 years Voluntary
Mail; telephone or in-person follow-up
CBECS1: Imputation and weight adjustment CBECS2: Imputation
CBECS1: 87% CBECS2: 89% (1995)
Census of Agriculture/ NASS
Collects acreage of operation, crops, value of sales, land use, gov program participation, livestock and poultry, org. structure,
All agricultural operations with $1,000 or more annual value of sales
1997 mailout of approximately 3 million
Every 5 years, in years ending in 2 and 7. Mandatory
Mail, telephone, and in-person interviews
Separate follow-up survey of nonrespon-dents used as
85% (1992) 86% (prelim. 1997)
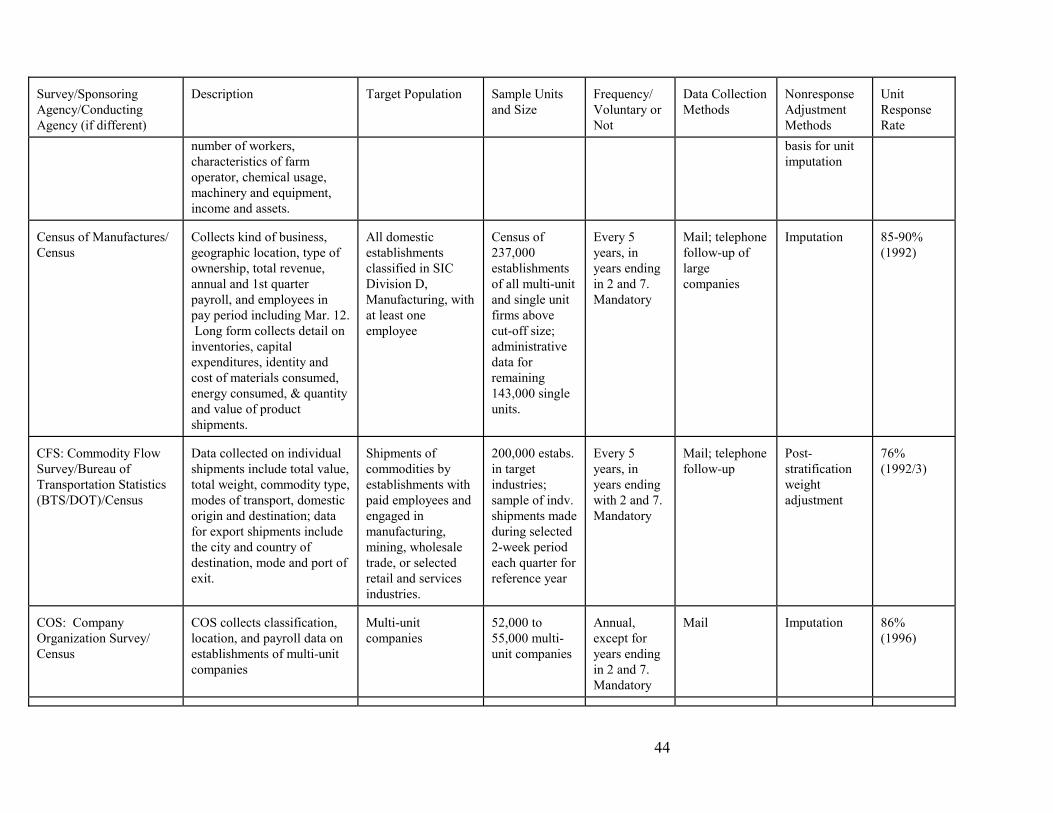
44
Survey/Sponsoring Agency/Conducting Agency (if different)
Description
Target Population
Sample Units and Size
Frequency/ Voluntary or Not
Data Collection Methods
Nonresponse Adjustment Methods
Unit Response Rate
number of workers, characteristics of farm operator, chemical usage, machinery and equipment, income and assets.
basis for unit imputation
Census of Manufactures/ Census
Collects kind of business, geographic location, type of ownership, total revenue, annual and 1st quarter payroll, and employees in pay period including Mar. 12. Long form collects detail on inventories, capital expenditures, identity and cost of materials consumed, energy consumed, & quantity and value of product shipments.
All domestic establishments classified in SIC Division D, Manufacturing, with at least one employee
Census of 237,000 establishments of all multi-unit and single unit firms above cut-off size; administrative data for remaining 143,000 single units.
Every 5 years, in years ending in 2 and 7. Mandatory
Mail; telephone follow-up of large companies
Imputation
85-90% (1992)
CFS: Commodity Flow Survey/Bureau of Transportation Statistics (BTS/DOT)/Census
Data collected on individual shipments include total value, total weight, commodity type, modes of transport, domestic origin and destination; data for export shipments include the city and country of destination, mode and port of exit.
Shipments of commodities by establishments with paid employees and engaged in manufacturing, mining, wholesale trade, or selected retail and services industries.
200,000 estabs. in target industries; sample of indv. shipments made during selected 2-week period each quarter for reference year
Every 5 years, in years ending with 2 and 7. Mandatory
Mail; telephone follow-up
Post-stratification weight adjustment
76% (1992/3)
COS: Company Organization Survey/ Census
COS collects classification, location, and payroll data on establishments of multi-unit companies
Multi-unit companies
52,000 to 55,000 multi-unit companies
Annual, except for years ending in 2 and 7. Mandatory
Imputation
86% (1996)
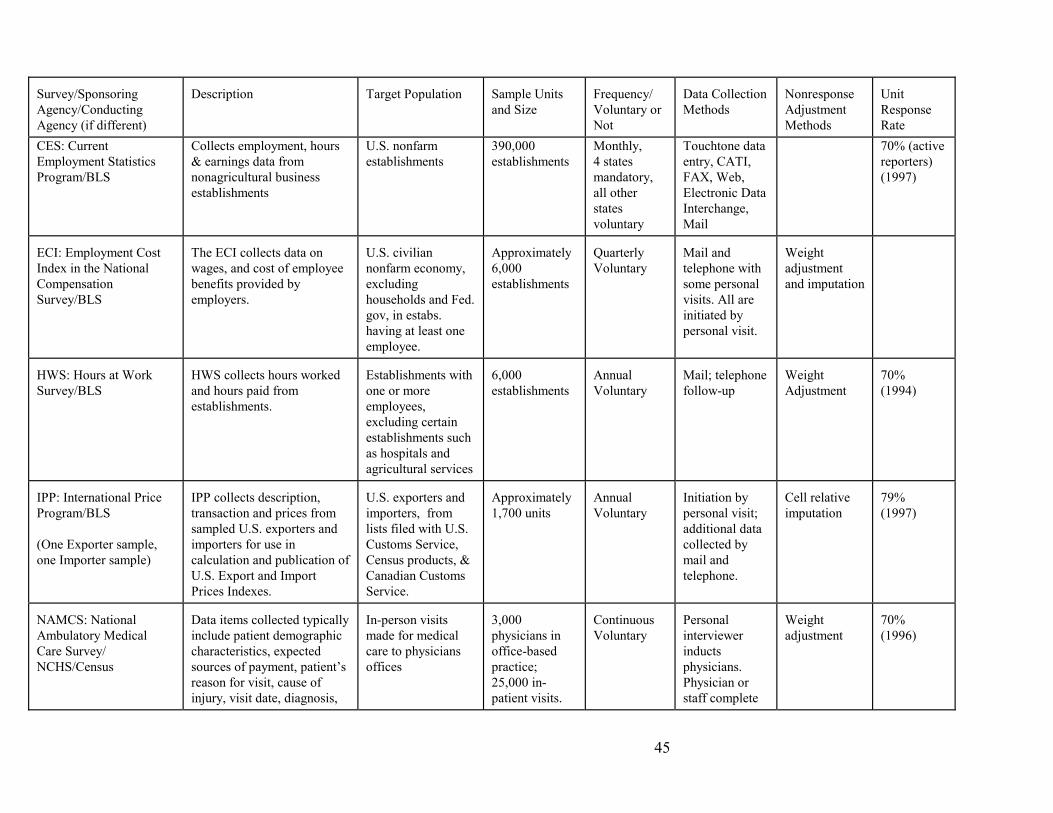
45
Survey/Sponsoring Agency/Conducting Agency (if different)
Description
Target Population
Sample Units and Size
Frequency/ Voluntary or Not
Data Collection Methods
Nonresponse Adjustment Methods
Unit Response Rate
CES: Current Employment Statistics Program/BLS
Collects employment, hours & earnings data from nonagricultural business establishments
U.S. nonfarm establishments
390,000 establishments
Monthly, 4 states mandatory, all other states voluntary
Touchtone data entry, CATI, FAX, Web, Electronic Data Interchange, Mail
70% (active reporters) (1997)
ECI: Employment Cost Index in the National Compensation Survey/BLS
The ECI collects data on wages, and cost of employee benefits provided by employers.
U.S. civilian nonfarm economy, excluding households and Fed. gov, in estabs. having at least one employee.
Approximately 6,000 establishments
Quarterly Voluntary
Mail and telephone with some personal visits. All are initiated by personal visit.
Weight adjustment and imputation
HWS: Hours at Work Survey/BLS
HWS collects hours worked and hours paid from establishments.
Establishments with one or more employees, excluding certain establishments such as hospitals and agricultural services
6,000 establishments
Annual Voluntary
Mail; telephone follow-up
Weight Adjustment
70% (1994)
IPP: International Price Program/BLS (One Exporter sample, one Importer sample)
IPP collects description, transaction and prices from sampled U.S. exporters and importers for use in calculation and publication of U.S. Export and Import Prices Indexes.
U.S. exporters and importers, from lists filed with U.S. Customs Service, Census products, & Canadian Customs Service.
Approximately 1,700 units
Annual Voluntary
Initiation by personal visit; additional data collected by mail and telephone.
Cell relative imputation
79% (1997)
NAMCS: National Ambulatory Medical Care Survey/ NCHS/Census
Data items collected typically include patient demographic characteristics, expected sources of payment, patient’s reason for visit, cause of injury, visit date, diagnosis,
In-person visits made for medical care to physicians offices
3,000 physicians in office-based practice; 25,000 in-patient visits.
Continuous Voluntary
Personal interviewer inducts physicians. Physician or staff complete
Weight adjustment
70% (1996)
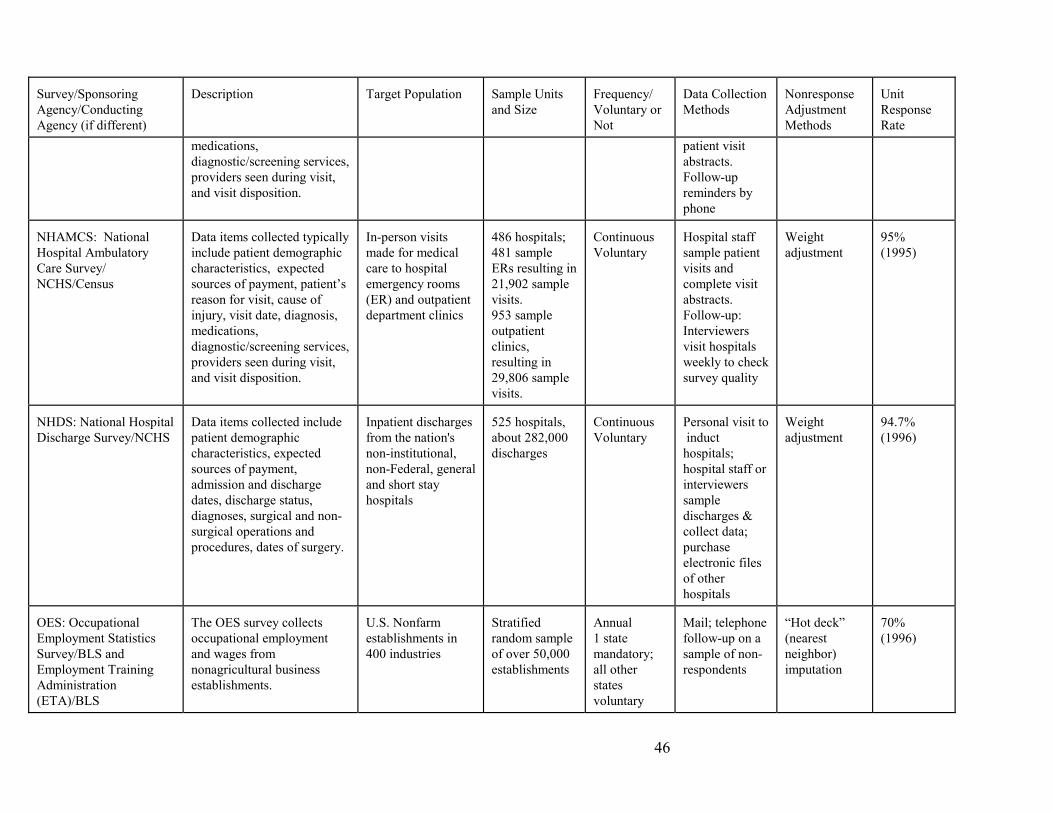
46
Survey/Sponsoring Agency/Conducting Agency (if different)
Description
Target Population
Sample Units and Size
Frequency/ Voluntary or Not
Data Collection Methods
Nonresponse Adjustment Methods
Unit Response Rate
medications, diagnostic/screening services, providers seen during visit, and visit disposition.
patient visit abstracts. Follow-up reminders by phone
NHAMCS: National Hospital Ambulatory Care Survey/ NCHS/Census
Data items collected typically include patient demographic characteristics, expected sources of payment, patient’s reason for visit, cause of injury, visit date, diagnosis, medications, diagnostic/screening services, providers seen during visit, and visit disposition.
In-person visits made for medical care to hospital emergency rooms (ER) and outpatient department clinics
486 hospitals; 481 sample ERs resulting in 21,902 sample visits. 953 sample outpatient clinics, resulting in 29,806 sample visits.
Continuous Voluntary
Hospital staff sample patient visits and complete visit abstracts. Follow-up: Interviewers visit hospitals weekly to check survey quality
Weight adjustment
95% (1995)
NHDS: National Hospital Discharge Survey/NCHS
Data items collected include patient demographic characteristics, expected sources of payment, admission and discharge dates, discharge status, diagnoses, surgical and non-surgical operations and procedures, dates of surgery.
Inpatient discharges from the nation's non-institutional, non-Federal, general and short stay hospitals
525 hospitals, about 282,000 discharges
Continuous Voluntary
Personal visit to induct hospitals; hospital staff or interviewers sample discharges & collect data; purchase electronic files of other hospitals
Weight adjustment
94.7% (1996)
OES: Occupational Employment Statistics Survey/BLS and Employment Training Administration (ETA)/BLS
The OES survey collects occupational employment and wages from nonagricultural business establishments.
U.S. Nonfarm establishments in 400 industries
Stratified random sample of over 50,000 establishments
Annual 1 state mandatory; all other states voluntary
Mail; telephone follow-up on a sample of non-respondents
“Hot deck” (nearest neighbor) imputation
70% (1996)
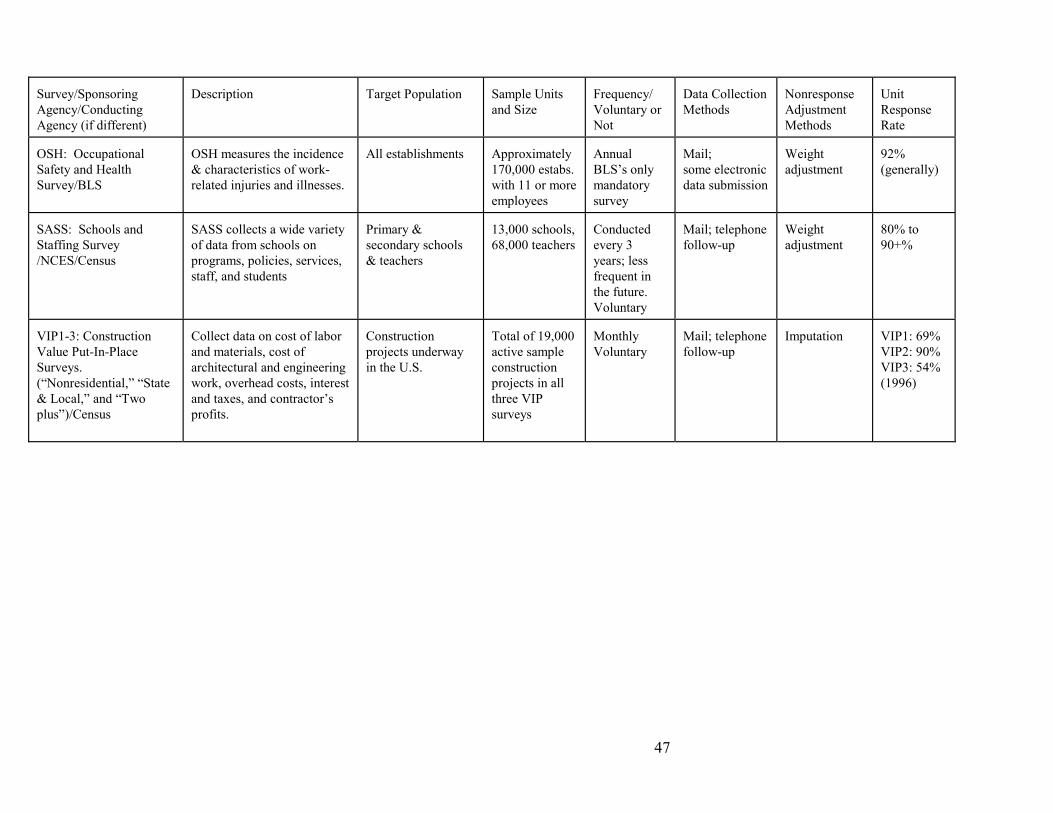
47
Survey/Sponsoring Agency/Conducting Agency (if different)
Description
Target Population
Sample Units and Size
Frequency/ Voluntary or Not
Data Collection Methods
Nonresponse Adjustment Methods
Unit Response Rate
OSH: Occupational Safety and Health Survey/BLS
OSH measures the incidence & characteristics of work-related injuries and illnesses.
All establishments
Approximately 170,000 estabs. with 11 or more employees
Annual BLS’s only mandatory survey
Mail; some electronic data submission
Weight adjustment
92% (generally)
SASS: Schools and Staffing Survey /NCES/Census
SASS collects a wide variety of data from schools on programs, policies, services, staff, and students
Primary & secondary schools & teachers
13,000 schools, 68,000 teachers
Conducted every 3 years; less frequent in the future. Voluntary
Mail; telephone follow-up
Weight adjustment
80% to 90+%
VIP1-3: Construction Value Put-In-Place Surveys. (“Nonresidential,” “State & Local,” and “Two plus”)/Census
Collect data on cost of labor and materials, cost of architectural and engineering work, overhead costs, interest and taxes, and contractor’s profits.
Construction projects underway in the U.S.
Total of 19,000 active sample construction projects in all three VIP surveys
Monthly Voluntary
Mail; telephone follow-up
Imputation
VIP1: 69% VIP2: 90% VIP3: 54% (1996)

48
Bibliography Abramson, R., Cole, C., Fundelier, S., Jackson, B., and Parmer, R (1996), "1993-94 Schools and
Staffing Survey: Sampling Design & Estimation." NCES Technical Methodology Report #96-089.
Christianson, A. and Tortora, R. D. (1995), “Issues in surveying businesses: An international
survey,” Chapter 14 in Business Survey Methods, edited by Cox, B. G., Binder, D. A., Chinnappa, B. N., Christianson, A., Colledge, M. J. and Kott, P. S. New York: John Wiley and Sons.
Cochran, W. G. (1977), Sampling Techniques, 3rd edition. New York: John Wiley and Sons. Dillman, D. A. (1978), Mail and Telephone Surveys: The Total Design Method. New York: John
Wiley and Sons. Edwards, W. S. and Cantor, D. (1991), “Toward a response model in establishment surveys,”
Chapter 12 in Measurement Errors in Surveys, edited by Biemer, P. B., Groves, R. M., Lyberg, L. E., Mathiowetz, N. A., and Sudman, S. New York: John Wiley and Sons.
Fowler, F. J. (1993), Survey Research Methods, 2nd edition, Applied Social Research Methods
Series, Volume 1. Newbury Park, CA: Sage Publications. Gonzalez, M., and Kasprzyk, D. (1995), "Exploring Nonresponse in U.S. Federal Surveys," in
Seminar on New Directions in Statistical Methodology, Working Paper 23 of the Federal Committee on Statistical Methodology, Washington, DC: OMB.
Goyder, J. (1987), The Silent Minority: Nonrespondents in Sample Surveys. Boulder, CO:
Westview Press. Groves, R. M. (1989), Survey Errors and Survey Costs. New York: John Wiley and Sons. Groves, R. M. and Couper, M. P. (1998), Nonresponse in Household Interview Surveys. New York:
John Wiley and Sons. Groves, R. M., Biemer, P. P., Lyberg, L. E., Massey, J. T., Nicholls II, W. L., and Waksberg, J.
(1988), Telephone Survey Methodology. New York: John Wiley and Sons. Hidiroglou, M. A., Drew, J. D., and Gray, G. B. (1993), “A framework for measuring and reducing
nonresponse in surveys.” Survey Methodology 19(1):81-94. Holt, D. and Elliot, D. (1991), “Methods of weighting for unit nonresponse.” Survey Methodology,
7(2):130-156.

49
James, J. M. and Bolstein, R. (1992), “Large monetary incentives and their effect on mail survey response rates.” Public Opinion Quarterly 56:442-453.
Jobber, D. (1986), “Improving response rates in industrial mail surveys.” Industrial Marketing
Management 15:183-195. Johnson, A. E., Botman, S. L. and Basiotis, P. (1994), “Nonresponse in Federal demographic
surveys: 1981-1991.” Proceedings of the Section on Survey Research Methods, Vol. II, American Statistical Association, Alexandria, VA, pp. 983-988.
Kalton, G., and Kasprzyk, D. (1986), "The Treatment of Missing Survey Data." Survey
Methodology, 12(1): 1-16. Kalton, G., and Kasprzyk, D. (1982). Imputing for Missing Survey Responses. Proceedings of the
Section on Survey Research Methods, American statistical Association, 22-31. Kasprzyk, D., Duncan, G., Kalton, G., and Singh, M. P., editors (1989), Panel Surveys. New York:
John Wiley and Sons. Kish, L. (1965), Survey Sampling. New York: John Wiley and Sons. Kovar, J. G. and Whitridge, P. J. (1995), “Imputation of business survey data,” Chapter 22 in
Business Survey Methods, edited by Cox, B. G., Binder, D. A., Chinnappa, B. N., Christianson, A., Colledge, M. J. and Kott, P. S. New York: John Wiley and Sons.
Lessler, J. T. and Kalsbeek, W. D. (1992), Nonsampling Errors in Surveys. New York: John Wiley
and Sons. Little, R. and Rubin, D. B. (1987), Statistical Analysis with Missing Data. New York: John Wiley
and Sons. Madow, W. G., Nisselson, H. and Olkin, I., editors (1983), Incomplete Data in Sample Surveys,
Volumes 1-3. New York: Academic Press. Martin, E., & Tucker, C. (1999), "Toward a Research Agenda: Future Development and
Applications of Cognitive Sciences to Surveys". In, M. Sirken, D. Hermann, S. Schechter, N. Schwartz, J. Tanur, & R. Tourangeau (Eds.), Cognition and Survey Research. New York: Wiley. In press.
National Science Foundation (1977), "Methodological Advances and the Human Capital Initiative,"
workshop report, July 1996. Arlington, VA: NSF. Ohlsson, E. (1995), “Coordination of samples using permanent random numbers,” Chapter 9 in
Business Survey Methods, edited by Cox, B. G., Binder, D. A., Chinnappa, B. N., Christianson, A., Colledge, M. J. and Kott, P. S. New York: John Wiley and Sons.

50
Osmint, J. B., McMahon, P. B. and Martin, A. W. (1994), “Response in Federally sponsored
establishment surveys.” Proceedings of the Section on Survey Research Methods, Vol. II, American Statistical Association, Alexandria, VA, pp. 977-982.
Paxson, M. C., Dillman, D. A. and Tarnai, J. (1995), “Improving response to business mail
surveys,” Chapter 17 in Business Survey Methods, edited by Cox, B. G., Binder, D. A., Chinnappa, B. N., Christianson, A., Colledge, M. J. and Kott, P. S. New York: John Wiley and Sons..
Pietsch, L. (1995), “Profiling large business to define frame units,” Chapter 6 in Business Survey
Methods, edited by Cox, B. G., Binder, D. A., Chinnappa, B. N., Christianson, A., Colledge, M. J. and Kott, P. S. New York: John Wiley and Sons.
Rosen, R.J., Clayton, R.L. and Rubino, T.B. (1991). “Controlling Nonresponse in an Establishment
Survey”, Proceedings of the Section on Survey Research Methods, American Statistical Association, Alexandria, VA, pp 587-591.
Shettle, C. F., Guenther, P.M., Kaspryzk, D and Gonzalez, M.E. (1994). “Investigating
Nonresponse in Federal Surveys” Proceedings of the Section on Survey Research Methods, Vol. II, American Statistical Association, Alexandria, VA, pp 972-976.
Smith, T. W. (1995), “Trends in nonresponse rates.” International Journal of Public Opinion
Research, 7:157-169. Srinath, K. P. and Carpenter, R. M. (1995), “Sampling methods for repeated business surveys,”
Chapter 10 in Business Survey Methods, edited by Cox, B. G., Binder, D. A., Chinnappa, B. N., Christianson, A., Colledge, M. J. and Kott, P. S. New York: John Wiley and Sons.
Steeh, C. G. (1981), “Trends in nonresponse rates, 1952-1979.” Public Opinion Quarterly,
45:40-57. Tomaskovic-Devey, D., Leiter, J. and Thompson, S. (1994), “Organizational survey response.”
Administrative Science Quarterly 39:439-457. Walker, B. J., Kirchmann, W. and Conant, J. S. (1987), “A method to improve response to
industrial mail surveys.” Industrial Marketing Management 16: 305-314. Werking, G. S. and Clayton R. L. (1995), “Automated telephone methods for business surveys,”
Chapter 18 in Business Survey Methods, edited by Cox, B. G., Binder, D. A., Chinnappa, B. N., Christianson, A., Colledge, M. J. and Kott, P. S. New York: John Wiley and Sons.
Worden, Gaylord and Howard H. Hamilton (1989) "The Use of Mandatory Reporting Authority to
Improve the Quality of Statistics." Working Papers of Industrial and Construction Statistics. Washington, DC: Bureau of the Census.