Embed Size (px)
Citation preview
ESTABLISHMENT OF NEW FITTED GEOID MODEL IN UNIVERSITI TEKNOLOGI
MALAYSIA
M. K. Ismail 1, A. H. M. Din 1,2,3,*, M. N. Uti 1, A. H. Omar 1
1 Geomatics Innovation Research Group (GIRG), 2 Geoscience and Digital Earth Centre (INSTEG), Faculty of Built Environment
and Surveying, Universiti Teknologi Malaysia, 81310 Johor Bahru, Johor, Malaysia. -* [email protected] 3 Associate Fellow, Institute of Oceanography and Environment (INOS), Universiti Malaysia Terengganu, Kuala Terengganu,
Terengganu, Malaysia
KEY WORDS: MyGEOID, gravimetric geoid, fitted geoid
ABSTRACT:
The purpose of this study is to produce fitted geoid for Universiti Teknologi Malaysia (UTM), Johor Bahru by using precise
levelling and 3D GNSS control network technique. This study focuses on the theory, computation method and analysis of fitted
geoid around Universiti Teknologi Malaysia. The computation of accuracy fitted geoid model is based on the GNSS levelling and
Precise Levelling. The achieved accuracy of UTM Fitted Geoid Model is at 8mm. In conclusion, this research can contribute to
Universiti Teknologi Malaysia by providing good UTM fitted geoid model that can give better accuracy for various purposes of work
related to surveying and mapping.
1. INTRODUCTION
1.1 Research Backgrounds
For decades, one of the main studies in Science of Geodesy is
precise geoid determination (Nordin, 2009). Jabatan Ukur dan
Pemetaan Malaysia (DSMM), also known as the Department of
Survey and Mapping Malaysia (DSMM) has implemented a
project to map the geoid with the main objective to produce
high precise geoid in order to determine the geoid height across
the country in 2002. The geoid can be broadly defined as an
equipotential surface of Earth’s gravity field that closely
approximates with mean sea level (MSL) neglecting long term
effect of sea surface topography (Singh et al., 2007). Geoid
determination includes collecting the gravity data over a wide
area. In order to collect gravity data, DSMM has conducted an
Airborne Gravity and Geoid Mapping Project across East and
West Malaysia (Jamil, 2011).
Research institutes and agencies responsible for geodetic
positioning have spent millions of dollars to precisely determine
the local and regional geoid using GNSS. Also, terrestrial
gravity data, satellite altimeter data, global geoid models and
digital terrain model were used in the calculation of the geoid
model Malaysia. Furthermore, GNSS levelling has managed to
simulate the vertical datum bias and further correspondence
issued geoid (geoid fitted) with the vertical datum that is based
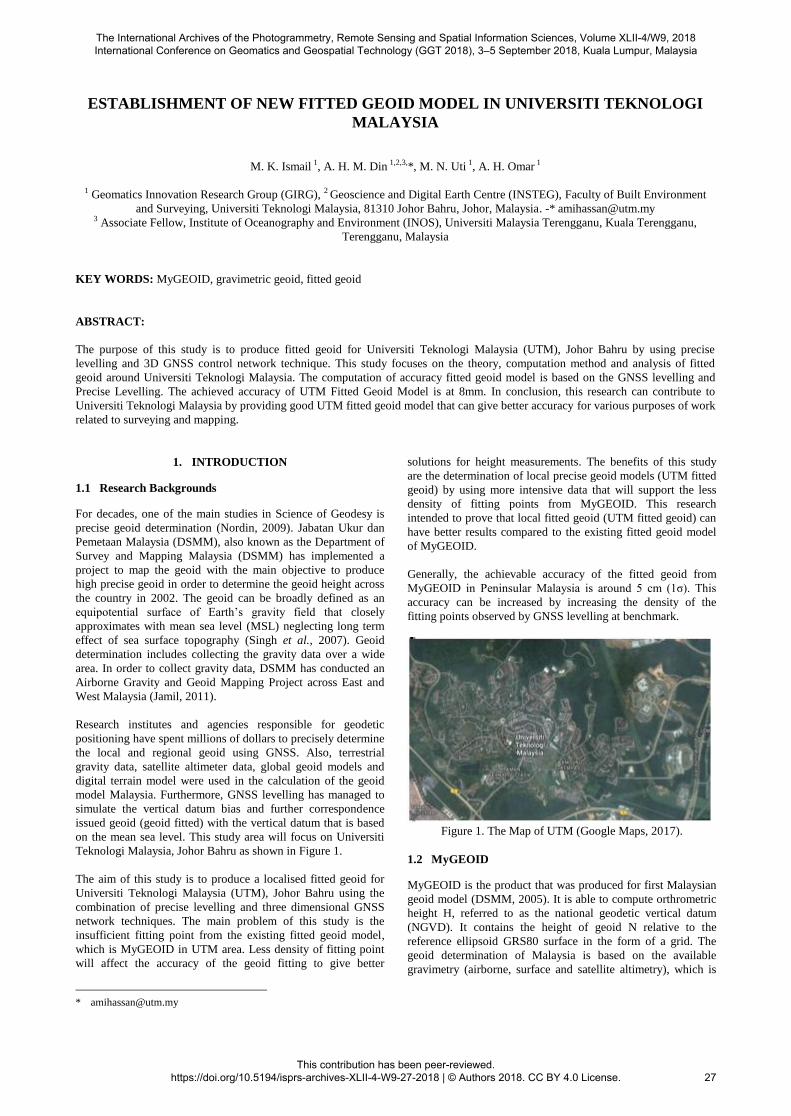
on the mean sea level. This study area will focus on Universiti
Teknologi Malaysia, Johor Bahru as shown in Figure 1.
The aim of this study is to produce a localised fitted geoid for
Universiti Teknologi Malaysia (UTM), Johor Bahru using the
combination of precise levelling and three dimensional GNSS
network techniques. The main problem of this study is the
insufficient fitting point from the existing fitted geoid model,
which is MyGEOID in UTM area. Less density of fitting point
will affect the accuracy of the geoid fitting to give better
solutions for height measurements. The benefits of this study
are the determination of local precise geoid models (UTM fitted
geoid) by using more intensive data that will support the less
density of fitting points from MyGEOID. This research
intended to prove that local fitted geoid (UTM fitted geoid) can
have better results compared to the existing fitted geoid model
of MyGEOID.
Generally, the achievable accuracy of the fitted geoid from
MyGEOID in Peninsular Malaysia is around 5 cm (1σ). This
accuracy can be increased by increasing the density of the
fitting points observed by GNSS levelling at benchmark.
Figure 1. The Map of UTM (Google Maps, 2017).
1.2 MyGEOID
MyGEOID is the product that was produced for first Malaysian
geoid model (DSMM, 2005). It is able to compute orthrometric
height H, referred to as the national geodetic vertical datum
(NGVD). It contains the height of geoid N relative to the
reference ellipsoid GRS80 surface in the form of a grid. The
geoid determination of Malaysia is based on the available
gravimetry (airborne, surface and satellite altimetry), which is
The International Archives of the Photogrammetry, Remote Sensing and Spatial Information Sciences, Volume XLII-4/W9, 2018 International Conference on Geomatics and Geospatial Technology (GGT 2018), 3–5 September 2018, Kuala Lumpur, Malaysia
This contribution has been peer-reviewed. https://doi.org/10.5194/isprs-archives-XLII-4-W9-27-2018 | © Authors 2018. CC BY 4.0 License.
27

continued downward to the surface of the topography, after
removal of a spherical harmonic reference field expansion
(DSMM, 2008). In addition, it consists of two geoid models,
which are WMGEOID04 for Peninsular Malaysia and
EMGEOID05 for Sabah and Sarawak as illustrated in Figure 2
and 3, respectively. The achievable accuracy with MyGEOID is
around 5 cm (1σ) and 10 cm (1σ) for Peninsular Malaysia and
Sabah and Sarawak, respectively. However, claimed accuracy of
DSMM of MyGEOID is only representative of an entire general
region without concerning how it represents a small area
(DSMM, 2005).
Figure 2. Peninsular Malaysia Fitted Geoid 2004
(WMGEOID04), (DSMM, 2005)
Figure 3. Sabah and Sarawak Fitted Geoid 2005
(EMGEOID05), (DSMM, 2005)
1.3 Precise levelling
Precise Levelling is a precise form of differential levelling,
where differential levelling is defined as the operation of
determining differences in elevation of points some distance
apart of established benchmarks (BM), which use highly
accurate and a more rigorous observing procedure than general
engineering levelling (Mui, 2006). From this method, 1D
control network can establish a UTM fitted geoid model around
UTM area. Process by using precise levelling method run for
the measurement of elevation is considered the most accurate
method to produce the best quality results in fitted geoid
levelling. According to (DSMM, 2009), the reading of precise
level is acceptable if the observation misclosure is lower than
the allowable misclosure where,
Allowable misclosure
= 0.003 (m) * √K (1)
K is the levelling distance in km
Observation misclosure
= Observed height – initial/known (2)
1.4 GNSS Levelling 3D Network
Department of Survey and Mapping Malaysia (DSMM) has
established GNSS infrastructure in Malaysia as a reference
control stations for cadastral and mapping purposes. With the
increasing potential of Global Navigation Satellite System
(GNSS) satellites and its calculation techniques, determination
of height using GNSS has been widely used to replace the
geometric levelling. By using GNSS levelling technique,
knowing the geoidal height N, the orthometric height H can be
calculated from ellipsoidal height h. Deriving orthometric
height using this technique with certain level of accuracy could
replace conventional spirit levelling and therefore make the
levelling procedures cheaper and faster (Abu, 2005). The
interpolated geoidal heights are the prerequisite for deriving
orthometric or normal heights from GNSS heights without
levelling (Ihde, 2009). From GNSS observation, we can
establish the 3D control network around UTM.
The aim of this paper is to establish new fitted geoid model in
UTM in order to increase the reliability of fitted geoid model
from MyGEOID. It is also aimed to determine how good the
new fitted geoid model represents small region, especially in
UTM, by using precise levelling and 3D control network
technique using GNSS observation and Gravimetric geoid data.
2. DATA AND METHODS
A general overview of the process for this study is shown in
Figure 4. The process is mainly divided into four main steps: (1)
research area identification; (2) data acquisition; (3) data
processing; (4) data verification. The list of software used in
this study are STAR*NET for precise levelling processing and
adjustment, Trimble Business Centre (TBC) for GNSS data
processing and Golden Surfer Software for data interpolation,
fitting and plotting.
Figure 4. General overview of the process
2.1 Establishment of the Mean Sea Level (MSL) Height
Using Precise Levelling
19 benchmarks were established covering UTM area (2km x
2km). The MSL heights were transferred from standard
benchmark J4352 in UTM, located at Faculty Alam Bina
(FAB), to all 19 benchmarks. Verification of benchmark is
carried out to ensure the accuracy of the benchmark.
Establishing benchmark requires good distribution position of
benchmark since the benchmark will later be used for GNSS
observation. The known value for standard benchmark J4352
FAB in UTM is shown in Table 1.
The International Archives of the Photogrammetry, Remote Sensing and Spatial Information Sciences, Volume XLII-4/W9, 2018 International Conference on Geomatics and Geospatial Technology (GGT 2018), 3–5 September 2018, Kuala Lumpur, Malaysia
This contribution has been peer-reviewed. https://doi.org/10.5194/isprs-archives-XLII-4-W9-27-2018 | © Authors 2018. CC BY 4.0 License.
28

No Name Hmsl (m)
1 J4352 FAB 24.3813
Table 1. Benchmark known value
The precise levelling planning network contains 21 levelling
routes, 3 levelling loops and 1 network as shown in Figure 5.
Figure 5. Precise levelling planning
2.2 GNSS levelling using 3D Control Network
A GNSS network consists of 19 point that have been observed
on established benchmark using five TOPCON GR5 dual
frequency receivers. There are several important factors that
need to be considered in designing 3D control network:
•Design good network geometry
•Acquire control within project area
•Incorporate independent baselines
Static GNSS observation (1 hour) method is applied for all
observations located at UTM. The GNSS data is processed by
using network processing in TBC software. Only independent
baselines were processed between 19 stations. The 3D control
networks for GNSS levelling are connected with 3 Malaysian
Real Time Kinematic Network (MyRTKnet) stations, which are
JHJY, KUKP and SPGR. Baselines were processed between P1,
P2, P3, KTR, FKA, FKN05, PKU, DESA BAKTI, SMPG 3,
SPS, G11, NC, SEK AGAMA, FKE, KTC, P19, KRP, FGHT
and FAB. The observed baselines are shown in Figure 6, while
holding 3 CORS, which are JHJY, KUKP and SPGR, as fixed
in latitude, longitude and ellipsoidal height. Then, adjusted
coordinates (latitude, longitude and ellipsoidal height) were
generated for each target point.
Figure 6. 3D control network for GNSS levelling.
2.3 Gravimetric Geoid Retrieval from MyGEOID
Gravimetric geoid is one of the MyGEOID’s products that can
be retrieved from DSMM. MyGEOID provides data with size 1’
by 1’ (1.8km x 1.8km) covering Malaysia. In this case, in order
to obtain the gravimetric geoid data at the established temporary
benchmark, Golden Surfer software is used to extract the data.
There are several interpolation methods to transform point data
and each of them can have different results, however, it is
important to determine which one give better solution in terms
of accuracy (Anonym, 1999). Thus, in Golden Surfer process,
Kringing method is used because it fits the data better (Erol and
Celik, 2004).
2.4 Vertical Datum Bias (VDB) computation at the selected
points
VDB can be derived from Equation 1:
VDB = hGNSS - HMSL - Ngravimetric (3)
where,
VDB = vertical datum bias
HGNSS = ellipsoidal height from GNSS
HMSL = mean sea level height
Ngravimetric = gravimetric geoid height
In selecting reference points, keeping the homogeneous
distribution of reference points set were considered. Ten points
are selected. These points will later be used to perform the
fitting process.
2.5 Fitting Process using Gravimetric Geoid Surface to
MSL Surface
In order to determine the UTM Fitted Geoid model for local
area, gravimetric surface must be shifted to MSL surface using
this Equation:
Fitted geoid surface = gravimetric geoid + VDB
Latitude, longitude, fitted geoid value of selected reference
points is later used in Golden Surfer software to form a fitted
geoid model.
3. RESULTS AND ANALYSIS
3.1 Establishment of MSL height using precise levelling
The MSL height from precise level for every benchmark point
is shown in Table 2. Meanwhile, the accuracy validation for
precise levelling data for loop A, B, C and network are shown
in Table 3.
Point HMSL (Precise Level) (m)
FAB 24.0735
J4352 FAB* 24.3813
FGHT 31.2047
G11 34.1924
FKA 32.8176
FKN05 45.6844
P19 17.5326
FKE 21.5504
The International Archives of the Photogrammetry, Remote Sensing and Spatial Information Sciences, Volume XLII-4/W9, 2018 International Conference on Geomatics and Geospatial Technology (GGT 2018), 3–5 September 2018, Kuala Lumpur, Malaysia
This contribution has been peer-reviewed. https://doi.org/10.5194/isprs-archives-XLII-4-W9-27-2018 | © Authors 2018. CC BY 4.0 License.
29

KTC 10.1496
SK. AGAMA 12.3042
KRP 25.3805
P3 21.6278
DESA BAKTI 40.2542
PKU 17.3573
P2 30.2430
KTR 28.8775
P1 24.0867
NC 14.6368
SPS 22.0038
SMPG 3 23.3116
Table 2. MSL heights from precise level for every benchmark
point
From Table 2, the value of HMSL from each point are obtained
by using the precise levelling method starting from the standard
benchmark of J4352. Thus, three survey loops are proposed in
order to cover the area.
Error Factor Lower/Upper Bounds
Loop A 0.451 (0.933/1.067)
Loop B 0.147 (0.933/1.066)
Loop C 0.149 (0.941/1.059)
Network 0.254 (0.947/1.053)
Table 3. Error factor for 3 loops and a network from precise
levelling
3.2 GNSS levelling using 3D Control Network
To achieve precise coordinate for points on BM’s, GNSS
observations were made and the products are in geographical
coordinates and ellipsoidal heights. This 3D control network is
used mainly for horizontal control but also from this GNSS
observation, the by-product, which is the ellipsoidal height, is
essential for GNSS levelling purpose or in other words, height
modernization.
The accurate geographical coordinates for 19 BM were obtained
by processing the GNSS data in TBC software whilst observed
by Topcon GR5 receivers. 3 MyRTKnet Stations have been
used as reference point, which is JHJY, KUKP and SPGR. The
results indicate the accurate position of BM points that used
static mode observation. The coordinates and ellipsoidal heights
for each BM are shown in Table 4. Table 5 tabulates the
standard deviations of latitude, longitude and ellipsoidal height
using one sigma.
Point Latitude
(N) Longitude (E)
Ellipsoidal
Height (m)
D. BAKTI 1.553818442 103.628932039 48.0975
FAB 1.559434797 103.633504150 31.9451
FGHT 1.560203256 103.635142094 39.0865
FKA 1.562772872 103.633530664 40.6949
FKE 1.557442469 103.642396089 29.4773
FKN05 1.564777667 103.638422289 53.5814
G11 1.558222575 103.637042869 42.0802
KRP 1.558617947 103.630726553 35.2246
KTC 1.553098078 103.644327039 18.0662
KTR 1.564582675 103.627622161 36.8121
NC 1.553961694 103.638291981 22.532
P1 1.565662417 103.631393794 32.3133
P19 1.559813533 103.641271614 25.4622
P2 1.561725797 103.629889503 38.0959
P3 1.557757317 103.629434800 29.4751
PKU 1.558412686 103.627543425 25.2043
SK. AGAMA 1.555557900 103.639359678 20.2124
SMPG 3 1.551658406 103.632488739 31.1815
SPS 1.555096933 103.634615622 29.8804
Table 4. Coordinates and ellipsoidal height for each BM
Point Latitude σ
(mm)
Longitude
σ (mm)
Ellipsoidal
Height σ
(mm)
D. BAKTI 2.5 3.0 3.9
FAB 2.0 2.3 3.2
FGHT 2.2 2.6 3.9
FKA 2.2 2.7 3.9
FKE 2.9 3.5 5.0
FKN05 2.2 2.7 3.7
G11 2.1 2.6 3.6
KRP 2.1 2.6 3.5
KTC 1.9 2.4 3.1
KTR 2.8 3.6 5.0
NC 2.0 2.3 3.2
P1 2.6 3.2 4.7
P19 2.9 3.4 5.2
P2 2.4 2.9 4.1
P3 2.5 2.9 4.3
PKU 2.9 3.3 4.8
SK. AGAMA 2.0 2.4 3.2
SMPG 3 1.8 2.2 3.0
SPS 2.2 2.7 3.5
Table 5. Standard deviations of latitude, longitude and
ellipsoidal height for one sigma
3.3 Gravimetric geoid from MyGEOID
Gravimetric geoid, obtained from Airborne Gravity and Geoid
Determination carried out by DSMM, is a geoid of undisturbed
characteristic. The gravimetric geoid data is one of the
MyGEOID products. The value was then interpolated or
modelled by using Golden Surfer software. Figure 7 shows the
model or geoid contour map generated by Golden Surfer
software for Gravimetric Geoid data. Only small difference of
geoid undulation can be observed from the map.
Figure 7. Gravimetric Geoid of MyGeoid in UTM area.
The International Archives of the Photogrammetry, Remote Sensing and Spatial Information Sciences, Volume XLII-4/W9, 2018 International Conference on Geomatics and Geospatial Technology (GGT 2018), 3–5 September 2018, Kuala Lumpur, Malaysia
This contribution has been peer-reviewed. https://doi.org/10.5194/isprs-archives-XLII-4-W9-27-2018 | © Authors 2018. CC BY 4.0 License.
30

From Table 6, we can see that the values of gravimetric geoid or
NGravimetric for UTM area are around 6m with only difference at
decimal points. The points also were extracted by using Golden
Surfer software. We can conclude that height separation of
ellipsoid and geoid in this area is around 6m and the values are
positive indicating that the level surface of ellipsoid is below
the equipotential surface.
Point N Gravimetric (m)
D. BAKTI 6.464388305
FAB 6.483959362
FGHT 6.491219557
FKA 6.482943422
FKE 6.526103495
FKN05 6.504363441
G11 6.500747451
KRP 6.471396452
KTC 6.536908602
KTR 6.455682096
NC 6.508167736
P1 6.472228308
P19 6.519628862
P2 6.466778449
P3 6.465623309
PKU 6.456661689
SK. AGAMA 6.512616053
SMPG 3 6.481734234
SPS 6.490562775
Table 6. The gravimetric geoid value interpolated of extracted
from MyGEOID model
3.4 Computation of Vertical Datum Bias
The vertical datum bias (VDB) can be represented by the
difference or separation between the Mean Sea Level and Geoid
(gravimetric) level surface. For the computation of VDB, the
general formula is shown in Equation 1. Ten points were chosen
for the fitting process and become the fitting point so
computations for vertical datum bias only for the selected points
as shown in Table 7. The range of the vertical datum bias at
UTM, also known as Sea Surface Topography, is approximately
1m. The results indicated that the separation of MSL and Geoid
level surface is around 1m difference. It is generally known that
geoid is said to coincide with the MSL surface, yet the
difference is significant.
Point Vertical Datum Bias (m)
DESA BAKTI 1.378921695
FAB 1.387680638
FGHT 1.390620443
FKA 1.394336578
FKE 1.400766505
KTR 1.478877904
NC 1.387022264
P2 1.386111551
P3 1.381656691
SPS 1.386047225
Table 7. Vertical Datum Bias at selected points
3.5 Fitting process
To realize the height modernisation system concept, a fitting
process has been conducted. Fitting is the process of shifting the
geoid of gravimetric surface to MSL surface by eliminating the
SST or VDB culminating in a continuous level surface called
fitted geoid. The UTM Fitted Geoid model is the product of
height modernisation system and modelled by Golden Surfer
software. Prior to fitting, a total of ten selected points (VDB
points) are used along with their respective accurate position.
After applying the VDB to the gravimetric geoid height, ten
fitting points are produced. Fitted geoid surface can be
calculated by using Equation 2 as shown below:
Nfitted = Ngravimetric + VDB (4)
where,
Nfitted = fitted geiod height
Ngravimetric = gravimetric geoid height
VDB = vertical datum bias
Based on Table 8, the values of Geoid height are between the
ranges of approximation of 8 m. These are only for the points of
fitting and by putting aside temporarily the other ten points for
further use, these points are used to produce the model of UTM
fitted Geoid contour map. The differences are only in sub-meter
level throughout the area in UTM.
The model of final product of height modernisation is depicted
in Figure 8. The main objective of having UTM Fitted Geoid
model has been realised. The geoid separation or undulation is
ranged between 7.8m to 8.0m from the map. This map is
produced from the same prior software which is Golden Surfer.
Point Latitude (N) Longitude
(E)
N Fitted
(m)
D.BAKTI 1.553818442 103.628932 7.84331
FAB 1.559434797 103.6335042 7.87164
FGHT 1.560203256 103.6351421 7.88184
FKA 1.562772872 103.6335307 7.87728
FKE 1.557442469 103.6423961 7.92687
KTR 1.564582675 103.6276222 7.93456
NC 1.553961694 103.638292 7.89519
P2 1.561725797 103.6298895 7.85289
P3 1.557757317 103.6294348 7.84728
SPS 1.555096933 103.6346156 7.87661
Table 8. Value of N fitted and positions at selected fitting points
Figure 8. Contour map of UTM Fitted Geoid
3.6 Analysing the accuracy of UTM Fitted Geoid
To analyse the external accuracy of the UTM fitted geoid, a set
of external data or the other ten points that are not fitted are
used for assessment. To realise this assessment, the seven points
The International Archives of the Photogrammetry, Remote Sensing and Spatial Information Sciences, Volume XLII-4/W9, 2018 International Conference on Geomatics and Geospatial Technology (GGT 2018), 3–5 September 2018, Kuala Lumpur, Malaysia
This contribution has been peer-reviewed. https://doi.org/10.5194/isprs-archives-XLII-4-W9-27-2018 | © Authors 2018. CC BY 4.0 License.
31

of non-fitted are extracted and interpolated from the UTM geoid
model. The value of Nfitted is represented by Table 9.
Point Latitude (N) Longitude
(E)
N
Fitted(m)
PKU 1.558412686 103.6275434 7.85591
SMPG 3 1.551658406 103.6324887 7.86221
G11 1.558222575 103.6370429 7.89270
SK.AGAMA 1.5555579 103.6393597 7.90414
FKN05 1.564777667 103.6384223 7.90964
KTC 1.553098078 103.644327 7.91616
P19 1.559813533 103.6412716 7.91849
Table 9. Value of positions and Nfitted for external accuracy
points.
Referring to Table 9, the value of Nfitted for other unfitted points
extracted from the UTM Geoid Model shows the value of
approximately 8 m with difference not exceeding a meter level.
Then, the assessment continues by deriving a geoid called
geometric geoid. For the external accuracy points, a set of
geometric geoid points were computed by applying Equation 3.
Ngeometric = hGNSS – HMSL (5)
where,
Ngeometric = geometric geoid height
hGNSS = ellipsoidal height from GNSS
HMSL = mean sea level height
After applying the aforementioned formula, a set of geometric
geoid height, or Ngeometric, is derived as shown in Table 10. The
main function of Ngeometric is to evaluate and verify the external
accuracy of the fitted geoid in UTM. In other words, Ngeometric is
for verifying geoid.
Point Latitude (N) Longitude
(E)
N
Geometric
(m)
PKU 1.558412686 103.6275434 7.84697
SMPG 3 1.551658406 103.6324887 7.86993
G11 1.558222575 103.6370429 7.88785
SK.AGAMA 1.5555579 103.6393597 7.90817
FKN05 1.564777667 103.6384223 7.89701
KTC 1.553098078 103.644327 7.91662
P19 1.559813533 103.6412716 7.92958
Table 10. The positions and value of Ngeometric for external
accuracy points.
f
Figure 9. Contour map of Geometrics geoid model.
These values of Ngeometric from Table 10 are later compared to
the Nfitted at the same points from Table 9. The differences are
called external accuracy, which depict the accuracy of the UTM
Geoid Model. Equation 4 as shown below is applied to get the
difference:
External Accuracy (x) = Nfitted – Ngeometric (6)
where,
Nfitted = fitted geoid height interpolated from UTM Geoid
Ngeometric = geometric geoid height
From Table 11, the difference of Nfitted and Ngeometric can be said
to be less than around 1 cm accuracy difference. This difference
should later be presented in Root Mean Square Error (RMSE)
value. The biggest difference comes from FKN05, which give
the value of 12 mm, and the smallest difference is KTC, which
is only 0.4 mm. The RMSE actually depicts the overall accuracy
of the project. According to Table 11, the accuracy of the UTM
fitted geoid is at 8mm.
Table 11. RMSE value from the comparison of Mean Sea Level
from UTM Nfitted (HGNSS) with Mean Sea Level from precise
levelling (HMSL)
3.7 Mean Sea Level (MSL) comparison between MyGEOID
and precise levelling
Based on the calculation of RMSE between the HGNSS and HMSL
in Table 11, the error is about 8mm, which is smaller than the
RMSE value from the comparison of Mean Sea Level from
MyGEOID and precise levelling, which is about 8cm as shown
in Table 12. This result has proved that the level computation
from localised UTM fitted geoid is much better compared with
the MyGEOID.
Point
Mean sea
level height
(HGPS) by
using
MyGEOID
Nfitted (m)
Mean sea
level height
(HMSL)
precise
level (m)
Difference
(m)
PKU 17.4418 17.3573 0.084
SMPG 3 23.3949 23.3116 0.083
G11 34.2754 34.1924 0.083
SK.AGAMA 12.3961 12.3042 0.092
FKN05 45.7735 45.6844 0.089
KTC 10.2261 10.1496 0.077
Point Mean sea
level height
(HGNSS) by
using UTM
Nfitted (m)
Mean sea
level height
(HMSL)
precise
level (m)
Difference
(m)
PKU 17.3484 17.3573 0.009
SMPG 3 23.3193 23.3116 0.008
G11 34.1875 34.1924 0.005
SK.AGAMA 12.3083 12.3042 0.004
FKN05 45.6718 45.6844 0.013
KTC 10.1500 10.1496 0.0004
P19 17.5437 17.5326 0.011
RMSE (m) 0.008
The International Archives of the Photogrammetry, Remote Sensing and Spatial Information Sciences, Volume XLII-4/W9, 2018 International Conference on Geomatics and Geospatial Technology (GGT 2018), 3–5 September 2018, Kuala Lumpur, Malaysia
This contribution has been peer-reviewed. https://doi.org/10.5194/isprs-archives-XLII-4-W9-27-2018 | © Authors 2018. CC BY 4.0 License.
32

P19 17.6392 17.5326 0.107
RMSE (m) 0.088
Table 12. RMSE value from the comparison of Mean Sea Level
from MyGEOID Nfitted (HGPS) with Mean Sea Level from
precise levelling (HMSL)
4. CONCLUSION
The establishment of UTM fitted geoid has been achieved
successfully with RMSE value for external accuracy of 8mm.
The results and analysis prove that height modernisation of
GNSS levelling and Fitted Geoid is a very efficient means of
height system. This is alternative for conventional tedious
levelling even though the accuracy of GNSS levelling itself is
relatively lower than the precise level. GNSS levelling can be
applied to engineering survey works and other projects that take
only centimetre level of accuracy into account.
ACKNOWLEDGEMENTS
The authors would like to thank to Department of Surveying
and Mapping Malaysia (DSMM) for providing the MyGEOID
Data. We are grateful to the Ministry of Education (MOE)
Malaysia and Universiti Teknologi Malaysia for funding this
research under Research University Grant (VOT number:
Q.J130000.2527.19H26).
REFERENCES
Abu, S., 2005. Malaysia precise geoid (MyGEOID). Retrieved
Sept 2005, from http://mycoordinates.org/malaysia-precise-
geoid-mygeoid/all/1/.
Anonym, 1999. Golden Software, Surfer 8, User Guide:
Contouring and 3D surface mapping for scientist and engineers,
Colorado, USA
Erol, B., Çelik, R. N., 2004. Modelling Local GNSS/Levelling
Geoid with the Assesstment of Inverse Distance Weighting and
Geostatistical Kriging Methods. Technical Report, Istanbul
Technical University-Civil Engineering Faculty, Istanbul,
Turkey
Ihde, J., 1995. Geoid Determination by GNSS and Levelling.
International Association of Geodesy Symposia Gravity and
Geoid, 519-528.doi:10.1007/978-3-642-79721-7_55.
Department of Surveying and Mapping Malaysia (DSMM),
2008. Final Report on Height Modernisation System of Klang
Valley. Lembah Klang, Selangor (Unpublished)
Department of Surveying and Mapping Malaysia (DSMM),
2005. Garis Panduan Penggunaan Model Geoid Malaysia
(MyGEOID). Pekeliling Ketua Pengarah Ukur Dan Pemetaan
Bil. 10, Kuala Lumur, Malaysia.
Department of Surveying and Mapping Malaysia (DSMM),
2009. Pekeliling Ketua Pengarah Ukur dan Pemetaan Bil. 6.
Kuala Lumpur, Malaysia.
Jamil, H., 2011. GNSS Heighting and Its Potential Use in
Malaysia. In GNSS Processing and Anallysis. Maarakehm
Morocco: FIG Working Week 2011.
Mui, A., 2006. Deformation Monitoring Technique and
Relationship between Vertical Control and Precision of
Accuracy. School of Surveying and Spatial Information
Systems, University of New South Wales, Australia.
Nordin, S., 2009. Height Modernization Using Fitted Geoid
Models and MyRTKnet (master’s thesis). Universiti Teknologi
Malaysia, Johor, Malaysia.
Singh, S. K., Nagarajan, B. B. & Garg, P. K. (2007). Retrieved
Feb 2007, from http://mycoordinates.org/determination-of-
local-gravimetric-geoid/all/1/.
Revised August 2018
The International Archives of the Photogrammetry, Remote Sensing and Spatial Information Sciences, Volume XLII-4/W9, 2018 International Conference on Geomatics and Geospatial Technology (GGT 2018), 3–5 September 2018, Kuala Lumpur, Malaysia
This contribution has been peer-reviewed. https://doi.org/10.5194/isprs-archives-XLII-4-W9-27-2018 | © Authors 2018. CC BY 4.0 License.
33