Embed Size (px)
Citation preview
8/15/2019 Estimacion Espectral Con Prony
http://slidepdf.com/reader/full/estimacion-espectral-con-prony 1/4
Spectral Estimation of
Distorted Signals
Using
Prony M ethod
Tadeusz
Lobos
Jacek Rezmer
Ah rfracf
M u d e r n
Frequency
power
converters
generate
a widc
spectrum
o f
harmonic
components.
L a r p
converter systems can
also
generale
non-
characteristic harmonics and
jnterharrnonics
Standard
tools
oC
harmonic analysis based on the
Fourier
transform
assume
that
o n l j harmonics
are
present
a nd
the periodicity intervals
are fixed,
while
periodicity
intervals in the
presence o f interharmonics are
variable
and very long. n the case
of
frequency
converters
the
periods
o f the
main
component
ar e unknown
The
Prony
method
as
applied
for
signal analysis in power
frequency
converter
was tested in
the
paper. The method does not
show
the
disadvantages
o f
the tradit ional tools and algow
cxact estimation the
frequencies
of
all or
dominant
companents,
cvcn
w he n
the periodicity intervals a re
unknown. To
investigate the
appmprjatencss
of
the
method several
experiments
were performed.
For
comparison
similar experiments were
repeated using
the
FlT. The comparison proved the
superiority
of the
Prony
method.
The
quality
of voItage
waveforms i s
nowadays
a n
issue-
of
the
ubnost
importance
for power
utilities,
electric energy
consumers
and also for
the
manufactures of
electric and eiectronic
equipment.
The
liberalization of
European
energy market will
strengthen
the
competition
and 1s
expected to drive
down the
energy prices.
This
is
reason
for
the
requirements
concerning
the power
quality.
The
voltage waveform
is expected to be a
pure
sinusoldal
with
a
given
frequency
and amplitude. Modem
frequency
power converters generate a
wide spectmn
of harmonic
components
witch
deteriorate the
quality
of
the
delivered energy
increase the energy losses
as
well as
decrease
the rel iab~li ty
of a power
system. In
some
cases,
large converters
systems generate
not only
characteristic
harmonics
typical for
the
ideal
converter
operatjon, but also considerable amount of
non-
charactenstic harmonics and interharmonics
which
may
strongly deteriorate the quality of the power
supply voltage
[I].
In terharmon~cs
re
defined
as
non-
integer
harmonics
of
the main
fundamental under
consideratjon. The
estlmation of
the components is
very
important
for
control
and
protection
tasks. The
design
of
harmonics
filters relies on
the measurement
of
distorlions
in both current and voltage waveforms.
There are m a n y
different approaches
for
measuring
harmonics,
l ike FFT,
application
of
adaptive filters,
artificial
neural networks, SVD,
higher-order
spectra
uthors arc wlth
the Institute of
Rlcctr~ca l Engineering
Fundamentals Wrnclaw
U n ~ v e r r i t y f Tcchnolog
50 370 mclaw
Poland, c-mall:
[email protected] wrm pI
etc
[2 3 4 5].
Most
of
them operate adequately only in
the
narrow range
of frcquencres and
a t moderate
noise
levels.
The linear
methods of system spectrum
estlmation
( R l a c h a n - T u k e y ) ,
based
on the
Fourier
transform, suffer from the major problem of
resolution.
Because of some invalid assum ptions (zero
d a ~
r repetitive data
outside the
d u r a t ~ o n o f
observation)
made
in these methods,
the est~rnated
spectrum
can be
a smeared v rsion
of the true
spectrum
[6, 71.
These methods
usually
assume that
only harmonics
are
present and
the
periodicity intervals
are
fixed
while periodicity
intervals
in the presence
of
l n t e r h m o n i c s
are variable and very long [ I ]
It
is
very important to devclop better tools
of parameter
estimation of signal frequency campon en .
In
the
case
of
power
frequency
converter
the
periodicity
intervals
are
unknown.
Identification
of
some
power converter faults
can
be a
difficult task,
especially
in
under-load- conditions. Different
faults
cause specific additional distortions of voltage and
current waveforms. Detection o f add~ t ional requency
components
can be used
for
fault
identification.
In this
paper
the frequencies of slgnal components
are
estimated
usmg the
Prony model.
Prony
method
is
a technique
for modelling
sampled data
as
a linear
combmation of exponentials. Al~hough t is not a
spectral
estimation
technique, Prony
method
has a
close
relationship to
the least squares linear
prediction
algorithms
used for
AR and
RMPL
parameter
estimation. Prony method
seeks to fit a deterministic
exponential model to
the data
in contrast
to
AR and
ARMA methods that seek
to
f i t a random
modcl
2 t he
second-order
data statistics.
TI.
PRONY METHOD
Prony
method is a technique for extracting sinusold
or exponential
signals from time serles
data,
by
solving a
set of
linear
equations.
Assuming
the
N
complex
data
samples
w l l
...
x [ ~ ]
the
investigated
function
can be
approximated
by
M
exponential
functions:
k l
where
=
1 2
... V
Tp
ampling
period
L- amplitude
n
damping
factor,
ok ngular velocity
vn
~ni t ia l hase .
8/15/2019 Estimacion Espectral Con Prony
http://slidepdf.com/reader/full/estimacion-espectral-con-prony 2/4
The discrete-time function
may be
concisely
Theright-hand sulnmation
in (10)
may
be
recognize
expressed in the fo rm as polynorn~aldefined by
81,
evaluated a1 e a c h
of
ils
mots
zk yielding the zero result-
t=l
where hk
= A,e''& , z = e
P i
pp
The estimation problem bases on the rn~nimizationo f
the squared
error
over
the
data
values:
where E [n]= x[n] n]=
x h ]
hi z-
( 4 )
k l
This turns
out to
be a difficult nonlinear problem. It
can be solved using the Prony method that
utilizes
linear equation solutions.
If
as many
data
samples
are
used
s
there
re
exponential parameters
then
an exact
exponential fit
to the data may bemade.
Consider the M-exponent discrete-time function:
The
M equations of
5 ) may be expressed
in matrix
from as:
The
matrix
equation represents
a
set of linear
equations
that can
be
solved
for the unknown vector of
amplitudes.
Prony
proposed
to define
the
polynomial
that
has
the zt exponents as
its roots:
The
polynomial m y be represented as the
sum:
Shifiing
the index o n 5 ) from
n
t
n m
muEtiplying
by
the
parameter ~ [ m ]ield:
The 9) can be modified into:
m=O
The equatron can be solved for
the polynvm~al
coef ic ients .
In the second
step
the roots
of
the
polynomial
defined
b y (8) can be calculated. The
damping factors and sinusoidal frequenc~esmay hc
determined
from the
roots z k
For pract~cal ituations, the number of data points
N
usually
exceeds
the
minimum
number
needed
to fit a
model
of
exponentials,
i.e.
> 2 M . In the
overdetermined data
case
the linear equatlon (
I )
must be
modified
to:
m=O
The estimation problem
bases
o n
the
minimization of
the
total
squared
error:
n= M l
When
estimating
the parameters
of
the srgnaI
components,
in the
case
of heavy distorted waveforms,
we identify apart horn some sinusoidal components,
a lso
some
components with
relativ
great damping
factors.
In
reality
they do not
exist
but a re caused by
noise and computation errors. T o
eliminate
the
components we
divide the estimated amplltudcs by
damping factors and choose the components 1~1th he
biggest results of the division.
The
investigations
have been carried out
using
also
the modified Prony algorithm [ I, which maximises
the
likelihood
of
the
fitting
problem. For different
numbers
of
the
estimated
exponential components M
5.
.AJZ
changed by step o 5)
the
square error of the
approximation was cdculated,
s
optrmal was chosen
the
number whrch ssures the minimal error. From
the
calculated
components the components
with the
snlallest relation AJa has been neglected.
III.
INDUSTRIAL
FREQUENCY CONVERTER
8)
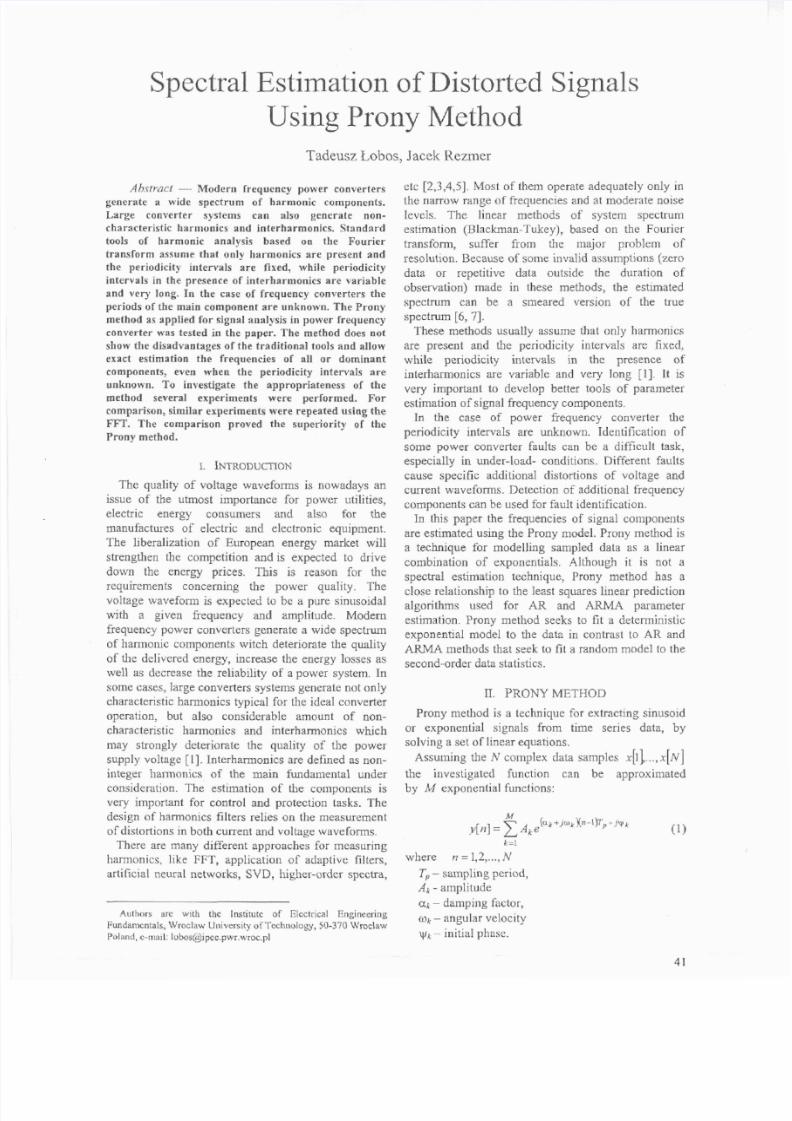
The
investigated
dnve
represents a typical
configuration of industrial drives,
consisting
ofa
three-phase synchronous
motor and
a power
converter,
composed
of
a
single-phase
half-
a d
controlled bridge
rectifier
and a
voltage
source
converter
[Fig. 1) 1
01.
9)
Thecurrents waveforms
at the
converter input
(I-input), at the
converter
ot~tput I-output)as well as
in
the
interm ediate circuit (1-internled), during normal
conditions
and
under
faul t conditions (capacitor or
switch failure)
were
investigated
usmg
the
Prony and
FFT methods. The main frequency of the wavrfo rm at
I D )
t h c
converter in p u t
was
50 Hz and at the
converter
oulput 40
Hz.
Figs
2, 3 and 4 show t he current
waveforms
n the
in~e rm edia te ircuit (I-interned). Under fault
free
nor-
8/15/2019 Estimacion Espectral Con Prony
http://slidepdf.com/reader/full/estimacion-espectral-con-prony 3/4
Fig.
1 Industrial convenerdrive
0 0.005 0.01 0.015
0.02
0.025
Time
is
-1 i _ L
0.01 0 02
0.03
0.04 0.05
Time Is3
b
lr
1.5
. . . .
:
- - - - - -
.
N
t
0 500
1000 1500
Frequency
[Hz]
1000 2000 3 4000
Frequency [Hz]
1.5
Frequency [Hz] Frequency [Hz]
C
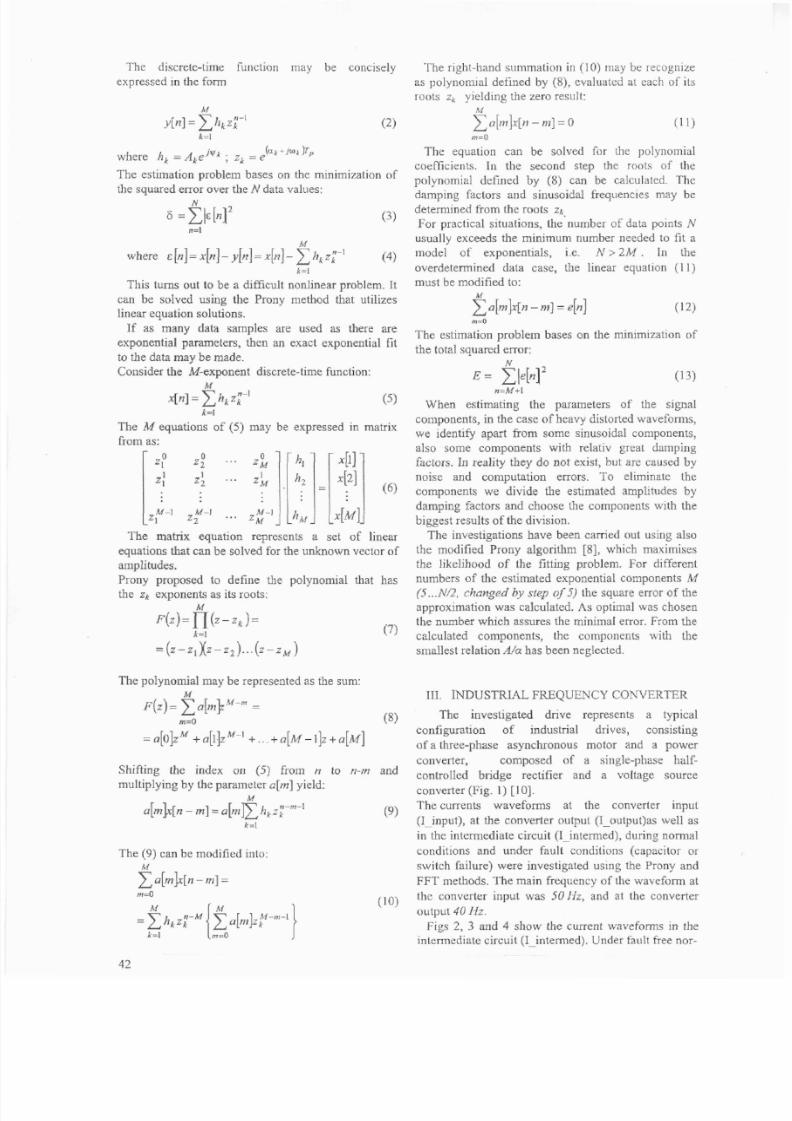
Fig. 2. Cumnt n
thc
~ntcrmed~atc
lrcu~tI-~nterrned),
undcr
Fig 3. Current
~
hc intcrmcdiatc circuit I-~ntcrmcd), fter
normal
conditions
a),
investiption results: Prony
N=250,
capacltar
failure a). investigation r sults
Frony N=250,
M=12O @);
FFT
N=250 c),
f,=10 kHz
M=105 b), FFT N=250
c),
fp=5kHz
ma1 conditions
Fig. 2),
apart from dc
component,
the following frequencies
have been detected,
when
applying
the
sampling window equal t 25 rns.,:
ca
240
720
970
1460
1700
2400 31
Hz
Capacitor
or
swi t ch fai lure changes significantly
the
current wavefornl in
the intermediate circuit
Figs.
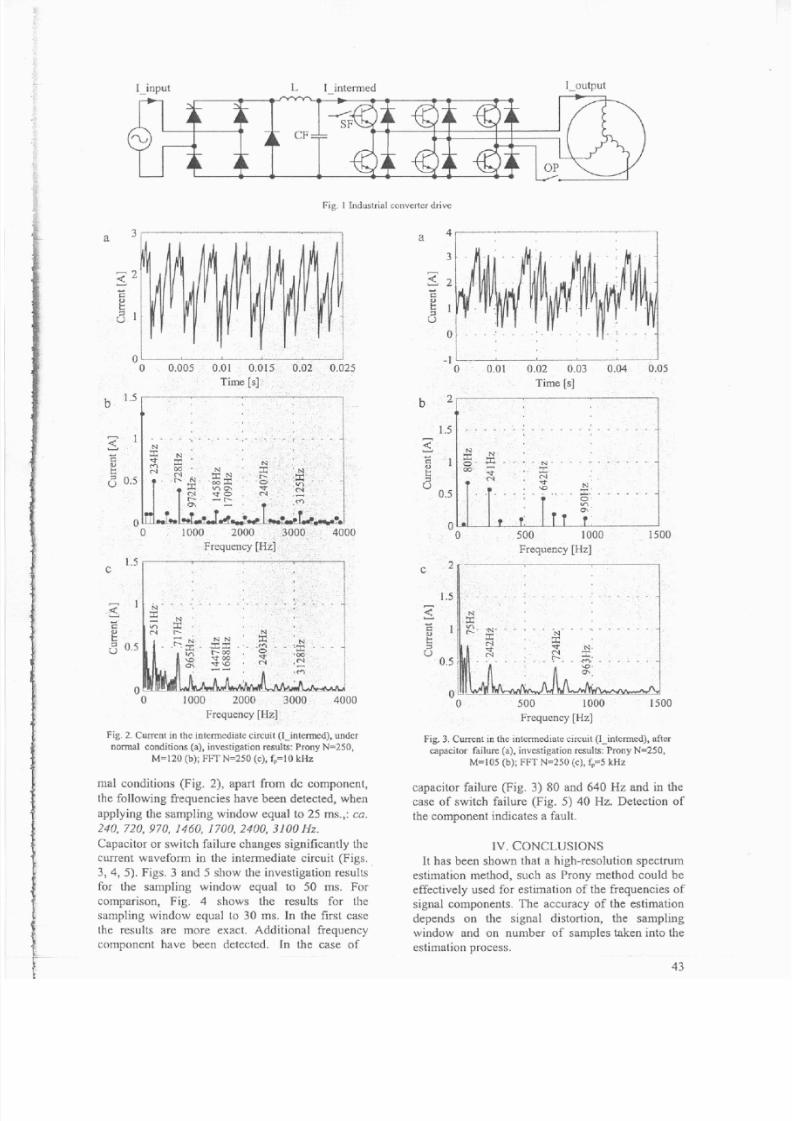
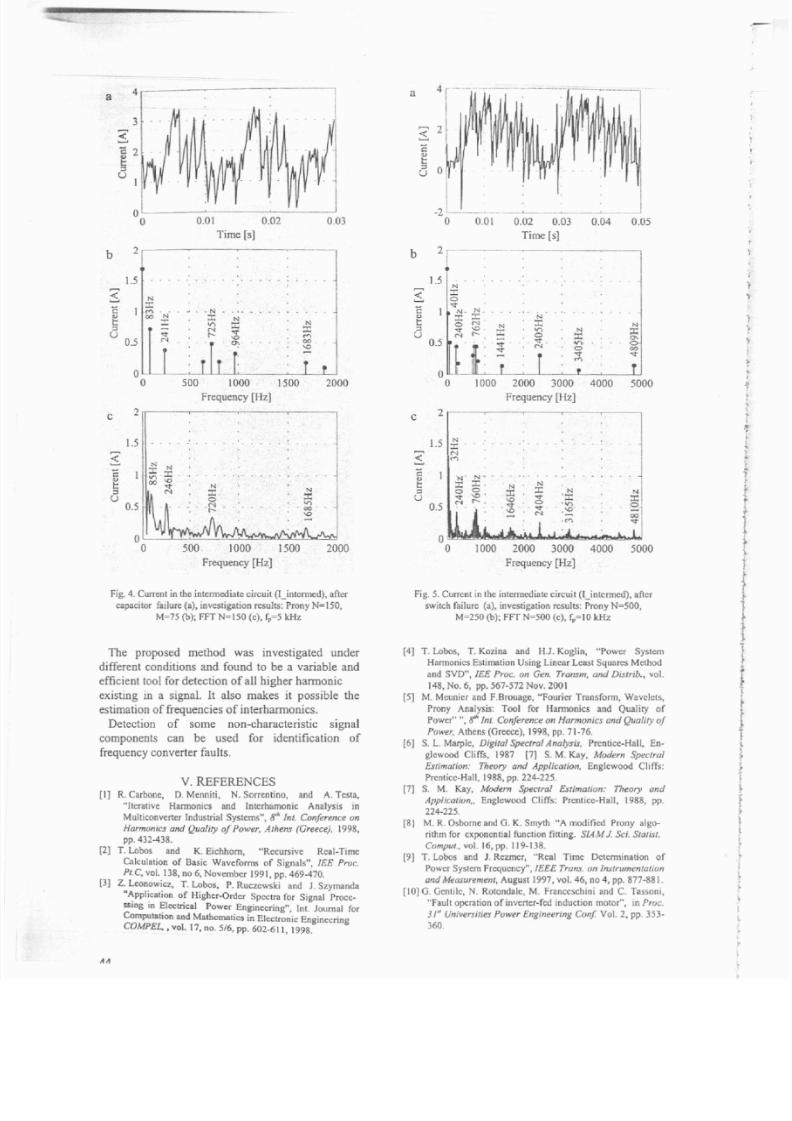
3, 4, 5). Figs. 3 and 5 show the investigation results
for
[he sampling
window equaI to
50
ms. For
comparison, Fig. 4 shows the results for the
sampling
window
equal
to
30 ms.
In
the first case
the
results
a r c more exact. Additional
f requency
compunent
havc
been
detccled.
In
thc
case
of
capacitor failure Fig.
3) 80
and
640 Hz
and in the
case
of switch
failure
Fig. 5 40 Hz.
Detection
of
the
component indicates a fault.
1Y O N CL U SIO N S
It has been shown
that a
high-resolution spectrum
e s t~ m a t ionmethod, such as Prony method could
be
effectively
used for
estimation
of the frequencies of
signal
components.
The accuracy of the estimation
depends on the slgnal distortion, the sampling
window
and
on number of samples taken into the
es t i~nat ion
rocess.
8/15/2019 Estimacion Espectral Con Prony
http://slidepdf.com/reader/full/estimacion-espectral-con-prony 4/4
ol-
0.01 0.02 0.03
Time [s]
b
7
. .
--
I
Frequency [Hz]
500
1000 1500 2000
Frequency
[Hz]
F i g 4 . C w e n t in
the
lntcrmediate circuit (I-intcrmed),
ftcr
capacitor fa~lurc
a),
~nvcstigation
csults:Prony N=150
M=?5
@);
FFT N =
150 (c) ,
f,=5
kHz
The
proposed method
was
investigated under
different
conditions nd found
to
be a
variable
and
efficient b o l for
detection
of all higher
harmonlc
existing
in
a
slgnal. It also makes it possible the
estimation of frequencies of i n t e r h m o n i c s .
Detection
of
some
non-characteristic signal
components
can be
used
for identification
of
frequency converter f a d
s.
V.
REFERENCES
[ I ] R
Carbone, D.
Menniti,
N.
Sorrcntino, and A .
Tcsta,
"Itcmtrvc Hm o nl cs and Intcrhanwn~c Analysts in
Mult~convcncr
ndustrial
Systems , qhIn .
Conjerence
on
Harmontcs
and Qwalrp of
Power, Afhens (Greece),
t998,
pp. 4 3 2 4 3 8 .
[2] T. o h s and K. Eichhom,
"Rccurslvc Real-T mc
Calculailon of
Basic Waveforms of Signals", I b
Proc
Pf.C,vol. 138 no 6
Novembcr 1991,
pp. 469-470.
[31
Z.
n o w ~ c z ,T. Lobos, P.Ruczcwskl and 1.
Siymanda
Application of Highcr.Odcr Spectra for
S~gnal
Procc-
s i n g In Elcckical Power
Enginccting ,
Int
Journal
for
Computation
and
M a t h m a t i c s
In Elcctronlc Englnccring
COMPEL. vol 17 na
516 pp.
602-61 i 1998.
Time
s]
r . . .. -..- -----
Frequency
[Hz]
21
---
----
Frequency [Hz]
Fig 5 .
Current
In thc intermediate circuit
[I-intcmcd),
aftcr
switch failure
[a)$
investigation rcsuIts: Prony
N=5OO,
M=250
(b);
F R
=500.
c),
f =10 kHz
[4] f
oboq
T.
Korina and
H.J .
Koglin,
"Powcr System
Harrnonlcs Estrmation
Using
Linear Least
Squares
Mclhod
and
SVD , IEE
Pmc on
Gem
Transrn and Drstrib. vol.
48. NO. , pp. 567-572 ov.
00
(51 M
Meunier and
F Brouage,
"Fourier
Transform Wavelcts,
Prony
Analysis:
Too1
for Harmonics and Quality of
Power''
",
@ I n i
Conference
on Hurmonics
and
Qualrry luj
Power Athcns (Greocc),
1998, pp. 71-76,
[ 6 ] S L
Marplc,
D i g i t o l Sp c ruIAno y s~~ ,
r~nbcc-Hall,
En-
glcwood
Cliffs. 19Rf [7]
S
M .
K a y
odern
Spectral
EsrimaIion:
T h w y
and Applicarron. Englcwood
Cliffs:
Prcnticc-Hall,
1988,
pp
224-225
[ I ]
S
M.
Kay,
Modern Specrral Esrimarion: Theory
and
Rpplrcotrrm..
Englcwood Cliffs: Prcntrce-Hall,
1988,
pp
224-22s.
[ 8 )
M
R Osborne and C Srnyth A
md~ t i c dPmny
a l p
rrthm for cxponcntia1 function
f ting.
SIAMJ. 5ci. Stu~isr.
C o m p u r ,
vol 16, pp
1
19-13R
191 T.Lobs and J . R c m r ,
Rcal Timc
Dctcrmination of
Pawcr System
Frcqucncy",
IEEE r u n~ n In~trurnenfation
andMensuramenr August 1997, vol. 46 no 4, pp. 877-88
1
[ l o ]
C Gcntrlc
N. Rotondalc,
M .
Franccschini and
C.
Tassonr,
Fault
opctation
of ~nvcner-fcd
nduct~onmotor", In
Pmc.
31 WnrversrtresPower
Engin~ermngConf Vol . 2
pp.
353-
360.