Embed Size (px)
Citation preview

Estimate of Revenues and Cost
For a Proposed LCCD Conservation Forest
7/29/15
Prepared for: Lake County Conservation District
Prepared by:
Mason, Bruce and Girard, Inc.
and
BDL Forestry

MB&G and BDL Forestry
Table of Contents I. Background ........................................................................................................................................... 1
II. Study Objectives ................................................................................................................................... 1
III. Methods & Assumptions ....................................................................................................................... 1
IV. The subject property ............................................................................................................................. 2
A. Estimate of sustainable harvest levels .............................................................................................. 7
1. Review of FIA data ........................................................................................................................ 7
2. DNRC harvest levels ...................................................................................................................... 8
B. Timber values .................................................................................................................................... 9
1. Stumpage ...................................................................................................................................... 9
2. Forest improvement funds ......................................................................................................... 13
C. Management costs .......................................................................................................................... 13
1. Fire protection costs ................................................................................................................... 14
2. Roads ........................................................................................................................................... 14
3. Reforestation .............................................................................................................................. 14
4. Threatened & Endangered Species (T&E species) ...................................................................... 14
V. Results ................................................................................................................................................. 16
VI. Summary ............................................................................................................................................. 18
Figures
Figure 1: USFS lands in the study area .......................................................................................................... 4
Figure 2: Productivity Class by owner, Lake County, MT. ............................................................................. 5
Figure 3: Diameter distribution of timber volume, by owner, Lake County, MT. ........................................ 6
Figure 4: Volume of timber sold and harvested from state forest trust lands managed by the DNRC, and
the calculated sustained yield level from those same lands. ....................................................................... 9
Figure 5: Harvest, revenues and costs for state forest trust lands managed by the DNRC. ....................... 10
Figure 6: Annual average stumpage prices, program expenses and net revenue for state forest trust
lands managed by the DNRC. ...................................................................................................................... 11
Figure 7: Stumpage bid prices for state forest trust timber sold by DNRC. ............................................... 12

MB&G and BDL Forestry
Tables
Table 1: Acres available for a LCCD Conservation Forest ............................................................................ 3
Table 2: Inventory by owner ......................................................................................................................... 6
Table 3: Mortality, Lake County Montana, 2004-2013 annual average ....................................................... 7
Table 4: Net growth after mortality, Lake County Montana, 2004-2013 annual average ........................... 7
Table 5: Productivity, Lake County Montana ................................................................................................ 8
Table 6: Projected conservation forest cash flows under nine scenarios .................................................. 17

1 MB&G and BDL Forestry
I. BACKGROUND
The Lake County Conservation District (LCCD) is
investigating the feasibility of establishing a
temporary Conservation Forest on about 60,000
acres of the Flathead National Forest in Lake
County, Montana.1 Under this proposal, the
LCCD would ask Montana Department of
Natural Resources and Conservation (DNRC) to
manage in trust the Conservation Forest for
commercial timber harvest on a sustainable
basis for 100 years. LCCD would receive the
harvest revenues less DNRC’s management
costs, fire protection costs and other
reasonable management costs. DNRC would
use the same level of environmental review on
the transferred lands as it does on the state
forest trust lands.
LCCD has asked Mason, Bruce and Girard, Inc.
(MB&G), a natural resource consulting firm, to
estimate harvest levels, management costs and
net revenues that could reasonably be expected
from the proposed Conservation Forest. BDL
Forestry, a forest consulting firm in Missoula,
Montana, assisted with the study.
1 See http://swanforestinitiative.org/
II. STUDY OBJECTIVES
This study provides LCCD with information to
evaluate whether the proposed Conservation
Forest could be an economically viable
proposition. To that end, this study:
Estimates sustainable harvest volumes
from the Conservation Forest under
several scenarios about availability
(60,000 acres, 50,000 acres, 40,000
acres, etc.)
Estimates likely stumpage receipts
associated for each harvest scenario
Estimates likely management costs
associated with each harvest scenario
III. METHODS &
ASSUMPTIONS
Mark Rasmussen of MB&G, and Brian Long of
BDL Forestry, met with Jim Simpson of LCCD in
May 2015 to tour the proposed LCCD
Conservation Forest, gather data, and meet
with DNRC and USFS staff.
Our objective was to compare the proposed
Conservation Forest and the state forest trust
lands managed by the DNRC.
Interviews with the USFS District Ranger and
the DNRC Unit Manager provided insights about
management opportunities and challenges, as
well as some idea about management costs and
revenues. We also had discussions with DNRC’s
economist and two of DNRC’s fire staff. We
subsequently gathered publically available data
from the USFS and DNRC and made use of it in
this report.
We did not ask DNRC what it would charge to
manage a LCCD Conservation Forest, nor did we

2 MB&G and BDL Forestry
determine whether DNRC would be interested
in such a project. We did not investigate the
legal or political feasibility of the LCCD proposal.
Finally, with the exception of assuming
limitations on managing lands focused on
habitat for grizzly bear, we did not suggest
specific management strategies.
Below, we first describe the subject
timberlands, providing summary statistics as
well as our own observations. Then we
describe our estimates of a sustainable harvest
volume and the associated revenues and
management costs.
The purpose of this paper is to estimate future
revenues and costs of a LCCD Conservation
Forest. The feasibility test is not a land
management plan. We make broad
assumptions about management activities,
described below. We take a conservative
stance on most assumptions:
DNRC would manage the LCCD
Conservation Forest timber sale
program under the same laws and
regulations that guide DNRC
management of state forest trust lands.
Environmental documentation would
be based on DNRC’s current standards
established by MEPA (Montana
Environmental Protection Act) rather
than NEPA (National Environmental
Protection Act) used by the USFS.
The LCCD Conservation Forest would
pay fire protection costs like private
forest landowners in Montana, and
receive the same benefits and
protections that they receive.
Under the LCCD proposal, the LCCC
would receive the net revenues
(stumpage less DNRC management
costs) associated with managing timber
in the LCCD Conservation Forest. The
USFS would retain the responsibilities
and costs for managing recreation and
other uses.
IV. THE SUBJECT
PROPERTY
We visited the subject property as well as the
DNRC Swan Unit property. We made
observations about timber stocking, forest
cover type, past and current management,
growth, management feasibility, access, etc.
We did not collect field measurements for this
project. Instead we rely on data provided by
the USDA Forest Service Forest Inventory
Analysis (FIA) system. As part of the FIA
program, the USFS has established a grid of
permanent plots and visits them on a ten year
basis to describe timber stand conditions, and
measure growth, mortality and harvest.
Statistics derived from these plots are
summarized by county and by owner, and can
be obtained from the FIA website.2 We rely on
the FIA data summaries to describe the subject
property and to estimate sustainable harvest
levels.
The LCCD has not formally identified boundaries
of the land that forms the basis of its proposal.
The FIA reports 173,520 acres of USFS
timberland in the Swan Valley of Lake County,
Montana.3 About 13,400 acres are part of the
Mission Mountains Wilderness Area, and
another 27,700 acres are in the Swan Front
2 http://www.fia.fs.fed.us/
3 USFS acres west of Flathead Lake were not considered
for the LCCD conservation forest.

3 MB&G and BDL Forestry
Special Area – these acres are not part of the
proposed LCCD Conservation Forest. Acres not
suitable for timber management (about 6,800
acres), and lands designated as grizzly bear core
(about 43,700 acres) have also been removed
from consideration. As discussed below, some
acres in the grizzly bear core buffer can be
managed, and for this analysis we assume 50%
of the suitable acres in the grizzly bear core are
unavailable for management (about 11,900
acres) as are the acres not suitable for timber
management in the grizzly bear core buffer
(about 7,700 acres).
Table 1 shows that after making all of these
reductions, the LCCD Conservation Forest could
potentially be as large as 62,137 acres.
Figure 1 shows a generalized map of the
proposed area. Note that the LCCD has not yet
mapped the proposed Conservation Forest.
This map and the accounting of acres shown in
Table 1 are only for the purpose of this
feasibility study. Ultimately, we show scenarios
based on 60,000 acres, 50,000 acres and 40,000
acres.
Table 1: Acres available for a LCCD Conservation Forest
Acres
USFS Acres in the Swan Valley 173,520
Designated Wilderness - removed (13,415)
Swan Front Special Area - removed (27,740)
USFS Not Suitable for Timber Management - removed (6,854)
GZB Core - removed (43,715)
GZB Core Buffer Not Suitable for Timber Management - removed (7,717)
GZB Core Buffer Suitable for Timber Management - 50% removed (11,941)
Potentical LCCD conservation forest - suitable acres 62,137

4 MB&G and BDL Forestry
Figure 1: USFS lands in the study area

5 MB&G and BDL Forestry
For this analysis we relied primarily on data about the subject property that is publically available from the USFS Forest Inventory Analysis website. The finest resolution available from the FIA is by ownership group and by county. The tables and graphs that follow, therefore summarize the entire acreage of USFS land in Lake County. While a finer resolution is not possible, we believe that the proposed LCCD Conservation Forest is generally more productive than the average timberland acre in Lake County – it is the lower elevation areas of the productive Swan Valley.
In this section, we show
the FIA statistics for state
(DNRC) and private land
in Lake County. We
believe that this will help
reviewers better
understand the subject
property. Note that the
2013 FIA data show
forestland acreages prior
to the recent USFS
purchase of land from
The Nature Conservancy.
Based on the 2013 FIA
data the ownership
figures are: USFS -
165,144 acres; State - 47,334 acres; Private -
335,273 acres.4 While the 2013 FIA data do not
quite line up with current ownership, we
believe it is still instructive in terms of
understanding productivity and forest
conditions.
4 MT FWP manages about 1700 acres, the rest is DNRC.
The FIA statistics do not break out the two properties, and in this paper we refer to the entirety as DNRC or State.
Figure 2 summarizes timberland acreage in Lake
County by productivity class by owner.5 The
figure shows that the majority of both the USFS
and the DNRC lands are in the 50-84 cubic feet
per acre per year class. Note that this is the
potential productivity based on fully stocked
stands at culmination of mean annual
increment. It may not necessarily reflect
current growth.
5 Tribal timberland is included in the “private” ownership
category. We estimate that Tribal timberland accounts for about 85% of the private category. In the 2013 FIA statistics, furthermore, Private includes The Nature Conservancy land that has now been purchased by the USFS.
Figure 2: Productivity Class by owner, Lake County, MT.
-
20,000
40,000
60,000
80,000
100,000
120,000
140,000
160,000
180,000
120-164 85-119 50-84 20-49 0-19
Acr
es
Cubic Feet per Acre per Year
Productivity Class Distribution by Owner
USFS
State
Private

6 MB&G and BDL Forestry
Figure 3 shows the distribution of volume by
DBH class.6 The DBH class reported here is the
quadratic mean diameter of the stand. Note
that the USFS timberland has a bimodal
distribution whereas the DNRC lands are
heavier to larger timber.
Table 27 shows total inventory by owner and
suggest that the USFS lands carry less stocking
than the State lands. We suspect, however, the
average is influenced by low stocking on the
reserved acres (Wilderness and special use
areas).
6 DBH – Diameter at breast height
7 MMcf – million cubic feet; MMbf – million board
feet; Mbf/acre – thousand board feet per acre
Figure 3: Diameter distribution of timber volume, by owner, Lake County, MT.
0
10,000,000
20,000,000
30,000,000
40,000,000
50,000,000
60,000,000
70,000,000
80,000,000
90,000,000
100,000,000
5.0-6.9" 7.0-8.9" 9-10.9" 11-12.9" 13-14.9" 15-16.9" 17-18.9" 19-20.9" 21-28.9" 29+"
Cu
bic
Fee
t
DBH Class
Cubic Foot Volume by DBH Class
USFS
DNRC
Private
Table 2: Inventory by owner
MMcf MMbf Mbf/acre
USFS 395 1,580 9.6
State 154 617 13.0
Private 546 2,187 6.5
Total 1,096 4,384 8.0
7 MB&G and BDL Forestry
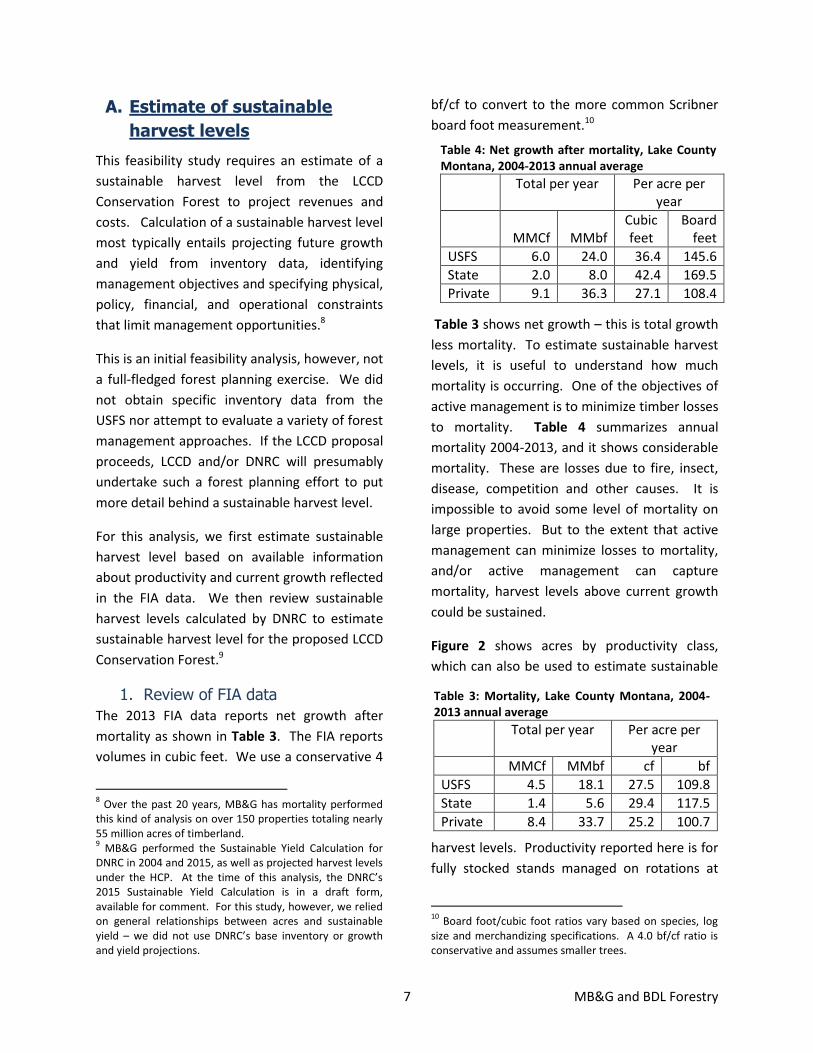
A. Estimate of sustainable
harvest levels
This feasibility study requires an estimate of a
sustainable harvest level from the LCCD
Conservation Forest to project revenues and
costs. Calculation of a sustainable harvest level
most typically entails projecting future growth
and yield from inventory data, identifying
management objectives and specifying physical,
policy, financial, and operational constraints
that limit management opportunities.8
This is an initial feasibility analysis, however, not
a full-fledged forest planning exercise. We did
not obtain specific inventory data from the
USFS nor attempt to evaluate a variety of forest
management approaches. If the LCCD proposal
proceeds, LCCD and/or DNRC will presumably
undertake such a forest planning effort to put
more detail behind a sustainable harvest level.
For this analysis, we first estimate sustainable
harvest level based on available information
about productivity and current growth reflected
in the FIA data. We then review sustainable
harvest levels calculated by DNRC to estimate
sustainable harvest level for the proposed LCCD
Conservation Forest.9
1. Review of FIA data
The 2013 FIA data reports net growth after
mortality as shown in Table 3. The FIA reports
volumes in cubic feet. We use a conservative 4
8 Over the past 20 years, MB&G has mortality performed
this kind of analysis on over 150 properties totaling nearly 55 million acres of timberland. 9 MB&G performed the Sustainable Yield Calculation for
DNRC in 2004 and 2015, as well as projected harvest levels under the HCP. At the time of this analysis, the DNRC’s 2015 Sustainable Yield Calculation is in a draft form, available for comment. For this study, however, we relied on general relationships between acres and sustainable yield – we did not use DNRC’s base inventory or growth and yield projections.
bf/cf to convert to the more common Scribner
board foot measurement.10
Table 3 shows net growth – this is total growth
less mortality. To estimate sustainable harvest
levels, it is useful to understand how much
mortality is occurring. One of the objectives of
active management is to minimize timber losses
to mortality. Table 4 summarizes annual
mortality 2004-2013, and it shows considerable
mortality. These are losses due to fire, insect,
disease, competition and other causes. It is
impossible to avoid some level of mortality on
large properties. But to the extent that active
management can minimize losses to mortality,
and/or active management can capture
mortality, harvest levels above current growth
could be sustained.
Figure 2 shows acres by productivity class,
which can also be used to estimate sustainable
harvest levels. Productivity reported here is for
fully stocked stands managed on rotations at
10
Board foot/cubic foot ratios vary based on species, log size and merchandizing specifications. A 4.0 bf/cf ratio is conservative and assumes smaller trees.
Table 4: Net growth after mortality, Lake County Montana, 2004-2013 annual average
Total per year Per acre per year
MMCf
MMbf
Cubic feet
Board feet
USFS 6.0 24.0 36.4 145.6
State 2.0 8.0 42.4 169.5
Private 9.1 36.3 27.1 108.4
Table 3: Mortality, Lake County Montana, 2004-2013 annual average
Total per year Per acre per year
MMCf MMbf cf bf
USFS 4.5 18.1 27.5 109.8
State 1.4 5.6 29.4 117.5
Private 8.4 33.7 25.2 100.7

8 MB&G and BDL Forestry
culmination of mean annual increment.11 In
practice, the productivity shown here is more
aspirational than operational, and for a variety
of reasons, it might be difficult to achieve these
levels. Even so, it is instructive to note that the
productivity shown in Table 5 is close to the
sum of net growth (Table 3) plus mortality
(Table 4).
2. DNRC harvest levels
The FIA statistics – growth, mortality,
productivity – are all biological measures. By its
very nature, a sustainable harvest level must be
grounded in biologic growth. But a sustainable
harvest projection must also account for the
political, economic, and legal environment as
well. Planned harvest levels will be less than
the biologic potential when land is managed for
uses that limit or preclude timber management.
Furthermore, actual harvest may be less than
planned harvest if timber sales encounter
opposition, or there is not sufficient budget to
offer the planned level of harvest.
As the LCCD proposes to have the subject
property managed by DNRC under laws and
regulations applicable to state forest trust
lands, it is instructive to look at DNRC harvest
levels as an indicator for what might be
expected from the subject property.
11
Culmination of mean annual increment is the age at which growth rates begin to slow. Sustainable harvest levels are maximized when a forest is regulated with rotations at culmination of mean annual increment.
For this discussion, we introduce the concept of
harvest per gross acre. Gross acres are all of
the acres in a planning unit including all of the
acres that will be managed for timber
production, plus the acres unsuitable for timber
production (rocky areas, wetlands, etc.), plus all
of the acres unavailable for timber production
(roads, etc.), plus all of the acres where timber
harvest might be precluded due to policy
constraints (riparian areas, eagle nest sites,
etc.), plus all of the acres where timber harvest
might be limited due to policy constraints (old
growth areas, lynx management areas, etc.).
Dividing the total planned harvest by gross
acres yields an estimate of harvest levels that
can be achieved after accounting for all of the
reductions experienced by the DNRC.
By law, DNRC is required every ten years to
calculate a sustainable harvest level reflecting
available data, forest management objectives
and the forest management rules under which
DNRC operates. From the 2004 DNRC
calculation, long term harvest from the 288,101
gross acres in the Northwest Land Office was
projected to average 33.0 MMbf/year over the
planning horizon, or about 115 bf/gross
acre/year. On the Swan unit, harvest was
projected to average 6.5 MMbf/year from
38,282 gross acres or about 170 bf/gross
acre/year. These figures reflect both the
inherent productivity of the land, as well as all
of the limitations and restrictions incorporated
into the DNRC management plan.
The draft of the 2015 Sustainable Yield
Calculation is now out for public review. It is
based on more recent and comprehensive
inventory data, and uses a different growth
model than the 2004 calculation. The draft
shows long term harvest from the Northwest
Land office averages 140 bf/gross acre/year
Table 5: Productivity, Lake County Montana
Total per year Per acre per year
MMCf MMbf Cf bf
USFS 9.4 37.7 64.1 256.5
State 2.6 2.9 68.5 274.0
Private 20.7 20.7 62.9 251.6

9 MB&G and BDL Forestry
from 294,068 gross acres. On the Swan unit,
harvest averages about 164 bf/gross acre/year
from about 52,085 acres. These figures reflect
both acreage deductions for streams, roads,
deferred acres and non-forest inclusions as well
as management restrictions including green
tree retention, grizzly bear management and
lynx management.
Table 5 shows that biological productivity of the
USFS land in Lake County is similar to the DNRC
land. Given that the LCCD Conservation Forest
would be managed by DNRC under state forest
management regulations, we assume that the
sustainable harvest per gross acre from the
DNRC lands would be a good estimate of the
sustainable harvest per gross acres from the
LCCD Conservation Forest.
We therefore assume that the LCCD
Conservation Forest could sustain a harvest
level of 150 bf/gross acre/year. In Table 6, we
apply this factor to the land base to estimate
sustainable harvest levels from different sized
land bases.
B. Timber values
1. Stumpage
DNRC usually sells timber with a two or three
year timber sale contract. Purchasers pay for
the right to cut standing timber, and are
required to perform project work (road
construction, road maintenance, etc.) as part of
the timber sale contract. As a result, stumpage
prices reflect that value of the logs delivered to
the mill less the logging, haul and project costs
borne by the purchaser.
Figure 4: Volume of timber sold and harvested from state forest trust lands managed by the DNRC, and the calculated sustained yield level from those same lands.

10 MB&G and BDL Forestry
The DNRC sells a relatively constant amount of
timber volume from year to year. Given a
multi-year stumpage sale contract, however,
purchasers have some flexibility to decide when
to harvest, and harvest volumes may vary from
year to year. Figure 4 compares sold volumes,
harvest volumes and sustainable yield volumes
from FY 2008 to 2014. The sustained yield
volume increased over time as DNRC acquired
acres from The Nature Conservancy. Sold
volumes are relatively constant and differ from
sustained yield levels – the DNRC’s target –
primarily from sales that were offered, but did
not sell. Annual changes in harvest volumes
reflect purchasers’ decisions about when to cut
the DNRC volume in their portfolios – harvest
was low in 2009 during the worst part of the
recession, and peaked during this period in
2013 when product markets were stronger.
Since harvest levels vary from year to year, and
because stumpage values vary from sale to sale
and year to year, annual harvest receipts may
vary considerably from year to year, as shown
in Figure 5. As a result, predicting annual cash
flows is difficult at best. For this analysis,
therefore, we project generalized cash flows
and report them as estimates of annual
averages. Without major modifications to the
DNRC timber sale program, however, the LCCD
should expect annual revenues to vary from
year to year.
Figure 5: Harvest, revenues and costs for state forest trust lands managed by the DNRC.
-
10,000
20,000
30,000
40,000
50,000
60,000
70,000
-
2,000,000
4,000,000
6,000,000
8,000,000
10,000,000
12,000,000
14,000,000
16,000,000
18,000,000
19
82
19
83
19
84
19
85
19
86
19
87
19
88
19
89
19
90
19
91
19
92
19
93
19
94
19
95
19
96
19
97
19
98
19
99
20
00
20
01
20
02
20
03
20
04
20
05
20
06
20
07
20
08
20
09
20
10
20
11
20
12
20
13
20
14
Mb
f H
arve
ste
d
20
13
$
MT DNRC Harvest, Revenues and Program Expenses
Mbf Harvested
Stumpage value (no FI)
Program Expenses

11 MB&G and BDL Forestry
Figure 6 shows revenues on a per Mbf basis (all
costs and revenues have been converted to
2013$). These are statewide averages for
timber harvested. Stumpage prices peaked in
1994. This was in response to the listing of the
Northern Spotted Owl under the Endangered
Species Act. The 1990 listing resulted in severe
reductions in USFS timber sales on the West
Coast, and when the economy recovered from a
small recession, West Coast lumber producers
for the first time were unable to respond with
increased supply. As a result, lumber prices
rose sharply, and log and stumpage prices
followed suit. Prices softened as markets
adjusted to the reductions in West Coast
production. Since then, DNRC average harvest
prices have bounced around between
$200/Mbf and $300/Mbf in 2013$. Figure 6
shows that like most other timber producing
regions, Montana harvest prices began to slide
in 2008 as the economy slipped into the Great
Recession. Average harvest prices approached
$100/Mbf in 2012, but have been gaining
strength since then as the economy improves.
To estimate future cash flows we need to project future stumpage prices. Figure 5 indicates that any projection must be viewed as some kind of long term average and that actual harvest prices (and volumes) will vary considerably from year to year.
Figure 6: Annual average stumpage prices, program expenses and net revenue for state forest trust lands managed by the DNRC.
0
100
200
300
400
500
600
19
82
19
83
19
84
19
85
19
86
19
87
19
88
19
89
19
90
19
91
19
92
19
93
19
94
19
95
19
96
19
97
19
98
19
99
20
00
20
01
20
02
20
03
20
04
20
05
20
06
20
07
20
08
20
09
20
10
20
11
20
12
20
13
20
14
$2
01
3/M
bf
Total DNRC Stumpage Revenues and Program Expenses
Net Revenue
Stumpage (not FI)
Program Expenses

12 MB&G and BDL Forestry
In Figure 7 we deconstruct the DNRC averages
to understand differences across geographic
areas. Lake County lies in DNRC’s Northwest
Land Office (NWLO). According to the Swan
Unit Manager, there are five or six mills within a
reasonable haul distance from the Swan Valley
and Swan Unit sales typically get five or six bids.
Figure 7 shows that the NWLO bid prices are
typically higher than the rest of the state. But
since the NWLO accounts for about two thirds
of the volume, the NWLO average is only about
$10/Mbf over the state average. For this
analysis, we estimate that the LCCD
Conservation Forest timber will sell, on average,
for $250/Mbf. Bids for NWLO timber have
averaged just over $200/Mbf during the last
two years. Our rationale is consistent with
recent timberland appraisals and briefly
summarized as follows:
We expect stumpage prices will
increase as housing markets improve –
US housing starts were at 0.928 million
and 1.001 million in 2013 and 2014
respectively, and over the long term,
housing is expected to average about
1.5 million starts.
Canadian lumber producers,
furthermore, have timber supply
problems due to a long running bark
beetle infestation – timber reductions
are expected to be on the same
magnitude as the reductions due to the
listing of the Spotted Owl.
Finally, Chinese demand for lumber and
logs has put pressure on US timberlands
and is expected to do so into the future.
Given the difficulties in projecting future
stumpage values, we bracket our estimate with
Figure 7: Stumpage bid prices for state forest trust timber sold by DNRC.
0
50
100
150
200
250
300
350
2008 2009 2010 2011 2012 2013 2014
$/M
bf
no
min
al
FY
Stumpage Bid Prices by Land Office
NWLO
SWLO
CLO
Eastern LOs
DNRC Average

13 MB&G and BDL Forestry
two additional estimates to test the sensitivity
of our conclusions to changes in market prices.
Our high price scenario is for $300/Mbf and our
low price scenario is for $200/Mbf. This range
generally correlates with the period after the
1994 price spike and before the Great
Recession.
2. Forest improvement funds
In addition to the stumpage bid price, DNRC
timber purchasers pay a forest improvement
fund. These funds are used to cover the cost of
reforestation and timber stand improvement.
Over the last five years FIP collections in the
NWLO have averaged about $30/Mbf. Over
time, FIP collections and FIP expenditures
should be equal, and we include both a
$30/Mbf cost and revenue.
C. Management costs
Figure 5 shows that in real dollars, DNRC
management costs have been remarkably
constant from 2001-2013, averaging about $4.5
million annually.
For this feasibility analysis, we need an estimate
of what DNRC would charge the LCCD for
managing the subject property. We have not
asked DNRC how it might consider such an
arrangement, and we are unaware if LCCD has
done so.
A land management contract could take one of
many forms. MB&G manages about 150,000
acres in about 15 different properties, and our
management agreements vary considerably
from one client to the next. On some
properties, we have a per acre charge to cover
certain fixed costs and then a per Mbf cost to
cover the cost of preparing, selling and
administering timber sales. On other properties
we have a time and materials arrangement to
cover both fixed and variable costs. We are
aware that some land managers simply charge a
percentage of the gross revenue. Still other
land managers partner with the landowner,
sharing some of the profits and taking some risk
of a loss. There are many models.
DNRC management cost data available to us are
limited. We do not have budgets by Land Office
or by Unit, nor do we have budgets by land
management function. Our interview with the
Swan Unit Forester, however, did provide some
useful insight – about 50% of the Unit’s costs
are for MEPA analysis supporting timber sales.
For this analysis, therefore, we represent a
DNRC management fee as a per Mbf fee, rather
than a per acre fee. This approach has the
advantage of showing differences across
scenarios as harvest volumes change.
From 2001-2013 DNRC harvests averaged 47.6
MMbf and DNRC management costs averaged
$4.51 million, giving an average of about
$95/Mbf. For the purpose of this analysis, we
believe it is prudent to add $10/Mbf to account
for rising costs, differences in an LCCD/DNRC
management agreement, additional costs that
DNRC might incur for managing federal land,
etc. That leaves a total cost of $105/Mbf. We
view this as a conservative estimate.

14 MB&G and BDL Forestry
1. Fire protection costs
Based on instructions from LCCD, we assume
here that the subject property would face the
same fire protection costs as any landowner.
Under current Montana state law (MCA 76-13-
201), private owners of land classified as forest
land within a wildland fire protection district
annually pay a $50 fee plus 30 cents for each
additional acre in excess of 20 acres.
2. Roads
Based on our observations, it appears that
major road systems are in place, and that future
roads would be in line with DNRC NWLO historic
practices. Road construction and maintenance
to support timber harvest are paid for by the
timber purchaser, and historic stumpage prices
therefore reflect these historic costs. No
adjustments are needed.
3. Reforestation
DNRC practices reforestation with natural
regeneration, supplemented by planting as
needed. We assume here that reforestation
costs would be adequately covered by the FIP
cost collections.
4. Threatened & Endangered
Species (T&E species)
The subject property encompasses habitat for
some species listed under the federal
Endangered Species Act (ESA). The ESA requires
federal agencies to participate in efforts to
recover threatened and endangered species,
while state and private landowners are required
only to avoid take of individuals. The ESA
makes provision for state or private landowners
to enter into a Habitat Conservation Plan (HCP)
that improves habitat conditions, and in
exchange the government authorizes an
incidental take permit which protects the
landowner from prosecution of a take that
occurs while operating under the plan. Below
we discuss how we incorporated T&E species
management into the calculations.
The USFWS is the lead agency in T&E species
management and would have to approve using
the DNRC HCP approach to managing grizzly
bear and lynx in the LCCD Conservation Forest.
The analysis for the DNRC’s HCP did not include
the proposed LCCD Conservation Forest, and it
is doubtful that the USFWS would approve
tiering to the DNRC HCP and extend the habitat
management methods and standards agreed to
for the DNRC to the LCCD Conservation Forests.
Without such an agreement, we assume that
the T&E species covered by the DNRC’s HCP
(grizzly bear, lynx, bull trout, and westslope
cutthroat trout) would have to be managed
using the same methodologies and standards as
are currently being used by the USFS. Other
T&E species habitat occurring within the
Conservation Forest would also be managed
using USFS methodologies and standards. We
assume those methodologies and standards
would not differ greatly than those applied by
DNRC’s Swan Unit.
Assumptions by species:
Canada Lynx and Grizzly Bear:
A significant portion of the Conservation
Forest has been classified as critical lynx
habitat by the USFWS. It is likely the

15 MB&G and BDL Forestry
growth and amount of timber harvested
within critical lynx habitat will be less on a
per acre per year basis than the amounts
that can be achieved by DNRC on the Swan
River Unit due to greater limitations on
precommercial thinning (PCT) in lynx
habitat and the requirement to have 70%
of lynx habitat in a suitable condition.
Forest management investments would be
somewhat lower due to a reduction in the
number of acres receiving PCT compared
to the amount of PCT that would be
conducted by DNRC.
The requirement to maintain at least 68%
of each grizzly bear subunit in grizzly bear
core habitat could have substantial
impacts on potential harvest levels. About
23,000 acres of USFS land in Lake County is
identified as grizzly bear core and it is
unlikely that much of the suitable
timberland acres in core can be harvested
– to do so would require replacement core
acres be found elsewhere within the
grizzly bear subunit that meet the road
density requirements. Within the core
area, roads must be closed and there can
be no administrative activities (including
PCT and planting). We have removed 43,
715 acres of grizzly bear core from
consideration as part of the LCCD
Conservation Forest.
There is a half-mile wide buffer around the
grizzly bear core area where harvest is
allowed, but roads must remain closed.
Stands within the buffer below an existing
road could potentially be logged using
cable systems. Stands within the buffer
above an existing road inside or outside of
the buffer could be logged using tractor
skidding. For this analysis, we assume that
50% suitable acres within the buffer could
be logged. We therefore removed 7,717
of unsuitable land within the buffers and
11,941 of suitable land within the buffers
from our calculation of the LCCD
Conservation Forest.
Outside of grizzly bear core and buffer areas, no more than 19% of a grizzly bear subunit can have more than 1 mile/square mile of open road and no more than 19% of a grizzly bear subunit can have more than 2 mile/square mile of total road density. These limits are more restrictive than those facing DNRC and could pose logistical problems in accessing timber. We have, however, made no further reductions in our baseline sustainable yield calculations to meet these requirements. The scenarios with fewer acres found in Table 6 can be used to estimate the impact of additional acreage withdrawals.
Keeping the road density within the
specified limits could increase costs –
roads can be “reclaimed” to meet the
limits by bringing the first 100 yards of a
road back to contour. Road density
requirements, furthermore, could result in
longer skidding distances. The additional
costs will result in lower bid prices. The
magnitude of the reduction will vary from
sale to sale and a comprehensive analysis
is beyond the scope of this report. We
adjust the stumpage price downward by
$10/Mbf to account for this impact and
believe that to be a generous allowance.
Bull Trout and Westslope Cutthroat Trout:
To protect T&E fish species, the USFS
follows INFISH standards. Limited timber
management is allowed within 300’ on
either side of fish bearing streams, and
150’ of non-fish bearing streams. These
standards would impact a higher
proportion of the suitable timberland in

16 MB&G and BDL Forestry
the Conservation Forest than the
proportion of manageable forest land
being impacted by riparian zones in the
Swan Unit. We make no additional
reduction in our acreage calculations, but
direct the reader to examine scenarios in
Table 6 with fewer acres to estimate the
cost of wider buffers.
INFISH has restrictive sediment standards
and requires bridges and roads be built to
standards to accommodate a 100 year
flood. This will increase bridge building
and road building costs compared to the
Swan Unit by an unknown amount.
V. RESULTS
Table 6 shows the estimated annual cash flows
under nine different scenarios which differ in
terms of:
The land base available for harvest. After
removing the wilderness areas, special
areas, and grizzly bear core and buffer
areas, we estimate that there remains
about 60,000 acres of USFS land in the
eastern portion of Lake County. These
should be considered “gross acres” as we
have not made reductions for roads,
riparian areas, non-timber inclusions, etc.
To provide some idea about how sensitive
the projections are to the size of the LCCD
Conservation Forest, we also show
calculations for 50,000 and 40,000 acres.
The stumpage price for timber harvested.
Figure 6 shows that between 1999-2010,
stumpage prices fluctuated between
$200/Mbf and $300/Mbf in real terms. We
use the midpoint of $250/Mbf as the base
case and make calculations with $200/Mbf
and $300/Mbf to show the relative impact
of changes in stumpage prices.
Looking across the scenarios in Table 6 shows:
1. There are positive net revenues in all
scenarios. Annual net revenue range
from about $0.5 million to $1.6 million.
2. DNRC management costs are less than
stumpage revenues in all cases.
Management costs are about 40-60% of
stumpage values, which is within the
expected range.
3. Price has a larger impact than acreage.
Any increase or decrease on stumpage
prices falls directly to the bottom line.
The LCCD should anticipate some
volatility in stumpage prices and
anticipate fluctuations in annual
income.

17 MB&G and BDL Forestry
Table 6: Projected conservation forest cash flows under nine scenarios
LCCD Analysis of Potential Cash Flow
Draft 7/25/15
Data Element Source
Part 1: Estimated Harvest Levels Scenario 1 Scenario 2 Scenario 3 Scenario 4 Scenario 5 Scenario 6 Scenario 7 Scenario 8 Scenario 9
Gross Acres 60,000 50,000 40,000 60,000 50,000 40,000 60,000 50,000 40,000
Sustainable harvest (bf/gross ac/yr) DNRC 2004 and 2015 SYC 150 150 150 150 150 150 150 150 150
Estimate of sustainable harvest (Mbf/yr) Calc 9,000 7,500 6,000 9,000 7,500 6,000 9,000 7,500 6,000
Part 2: Unit Costs and Revenues
Stumpage value ($/Mbf) Projections 250.00$ 250.00$ 250.00$ 200.00$ 200.00$ 200.00$ 300.00$ 300.00$ 300.00$
Road reclamation cost Estimate 10.00$ 10.00$ 10.00$ 10.00$ 10.00$ 10.00$ 10.00$ 10.00$ 10.00$
FI Fees collected ($/Mbf) 2008-2014 average 30.00$ 30.00$ 30.00$ 30.00$ 30.00$ 30.00$ 30.00$ 30.00$ 30.00$
Mangement Cost ($/Mbf) 2008-2013 average + $10/Mbf 105.00$ 105.00$ 105.00$ 105.00$ 105.00$ 105.00$ 105.00$ 105.00$ 105.00$
Forest investment ($/acre harvested) Assumption 30.00$ 30.00$ 30.00$ 30.00$ 30.00$ 30.00$ 30.00$ 30.00$ 30.00$
Fire protectioncosts ($Acre) 2015 Rate 0.30$ 0.30$ 0.30$ 0.30$ 0.30$ 0.30$ 0.30$ 0.30$ 0.30$
Part 3: Summary of annual cash flows
Stumpage revenue ($) 2,160,000$ 1,800,000$ 1,440,000$ 1,710,000$ 1,425,000$ 1,140,000$ 2,610,000$ 2,175,000$ 1,740,000$
FI Fees Collected ($) 270,000$ 225,000$ 180,000$ 270,000$ 225,000$ 180,000$ 270,000$ 225,000$ 180,000$
Land management costs (945,000)$ (787,500)$ (630,000)$ (945,000)$ (787,500)$ (630,000)$ (945,000)$ (787,500)$ (630,000)$
Forest investment (270,000)$ (225,000)$ (180,000)$ (270,000)$ (225,000)$ (180,000)$ (270,000)$ (225,000)$ (180,000)$
Fire protection costs (18,050)$ (15,050)$ (12,050)$ (18,050)$ (15,050)$ (12,050)$ (18,050)$ (15,050)$ (12,050)$
Net Revenue 1,196,950$ 997,450$ 797,950$ 746,950$ 622,450$ 497,950$ 1,646,950$ 1,372,450$ 1,097,950$
Average Gross Revenue per gross acre 36.00$ 36.00$ 36.00$ 28.50$ 28.50$ 28.50$ 43.50$ 43.50$ 43.50$
DNRC Mgmt costs per gross acre (15.75)$ (15.75)$ (15.75)$ (15.75)$ (15.75)$ (15.75)$ (15.75)$ (15.75)$ (15.75)$
Average Net Revenue pergross acre 19.95$ 19.95$ 19.95$ 12.45$ 12.45$ 12.45$ 27.45$ 27.45$ 27.45$
Mgmt costs as % of stumpage 51% 51% 51% 62% 62% 62% 43% 43% 43%
Net revenue as % of gross revenue 55% 55% 55% 44% 44% 44% 63% 63% 63%
Stumpage prices at $250/Mbf Stumpage prices at $200/Mbf Stumpage prices at $300/Mbf

18 MB&G and BDL Forestry
VI. SUMMARY
In this study we estimate that a LCCD
Conservation Forest could be formed from
about 60,000 to 65,000 of relatively
unencumbered land managed by the US Forest
Service within the portion of the Swan Valley
that lies within Lake County, Montana. If the
LCCD Conservation Forest were managed by the
Montana Department of Natural Resources and
Conservation under rules, procedures and
regulations that govern that agency’s
management of state forest trust lands, the
LCCD Conservation Forest could generate about
$1 million annually for the LCCD.
We also evaluated expected costs and revenues
for scenarios based on different assumptions
about the acres that could be available for a
LCCD Conservation Forest, and different timber
price scenarios. All scenarios showed a positive
net revenue.

19 MB&G and BDL Forestry
Terms and Abbreviations
Bf – board foot volume. A measure of log volume.
Cf – cubic foot volume. A measure of log volume
DBH – Diameter at Breast Height
DNRC – Montana Department of Natural Resources and Conservation
ESA – the federal Endangered Species Act
FIA – The US Department of Agriculture Forest Inventory and Analysis program
FIP – Forest Improvement Program funds collected by DNRC
Gross acres – all acres in an area, regardless of their suitability and availability for timber management
HCP – Habitat Conservation Plan
LCCD – Lake County Conservation District
MEPA – Montana Environmental Policy Act
Mbf – Thousand board feet.
MMbf – Million board feet
Mcf – Thousand cubic feet
MMcf – Million cubic feet
NEPA – National Environmental Policy Act
NWLO – DNRC’s Northwest Land Office
PCT – Precommercial thinning
T&E – Species that are listed as Threatened or Endangered under the Endangered Species Act
USDA – United States Department of Agriculture
USFS – United States Forest Service