Embed Size (px)
Citation preview

ESTIMATES OF DEMAND RELATIONSHIPS FOR FIGS AND FIGS PRODUCTS IN TURKEY
A THESIS SUBMITTED TO THE GRADUATE SCHOOL OF SOCIAL SCIENCES
OF MIDDLE EAST TECHNICAL UNIVERSITY
BY
ALPER ERİTEN
IN PARTIAL FULFILLMENT OF THE REQUIREMENTS FOR
THE DEGREE OF MASTER OF SCIENCE IN
ECONOMICS
NOVEMBER 2005

Approval of the Graduate School of Social Sciences
Prof. Dr. Sencer AYATA
Director
I certify that this thesis satisfies all the requirements as a thesis for the degree of Master of Science.
Prof. Dr. Haluk ERLAT Head of Department
This is to certify that we have read this thesis and that in our opinion it is fully adequate, in scope and quality, as a thesis for the degree of Master of Science.
Assoc. Prof. Dr. Nadir ÖCAL Supervisor
Examining Committee Members
Prof. Dr. Erol ÇAKMAK (METU, ECON)
Assoc. Prof. Dr. Nadir ÖCAL (METU, ECON)
Assoc. Prof. Dr. Yılmaz AKDİ (ANKARA UNI. STAT)

iii
I hereby declare that all information in this document has been obtained and presented in accordance with academic rules and ethical conduct. I also declare that, as required by these rules and conduct, I have fully cited and referenced all material and results that are not original to this work. Name, Last name: Alper ERİTEN Signature :

iv
ABSTRACT
ESTIMATES OF DEMAND RELATIONSHIPS FOR
FIGS AND FIGS PRODUCTS IN TURKEY
Eriten, Alper
M.S., Department of Economics
Supervisor: Assoc. Prof. Dr. Nadir Öcal
November 2005, 57 pages
This dissertation measures the extent of relationship between production, processing
and marketing channels of fig products in Turkey for the period 1971-2003. We first
provide a detailed analysis of world and Turkish fig products market. We then
estimate the own price and cross price elasticities of fig products in Turkey by using
simultaneous systems. The results imply that the demand facing Turkish dried fig
processors is inelastic. Moreover also the producer-level dried fig price elasticity has
inelastic structure. The study also finds evidence of a complementary structure
between fig products apart from fresh fig.
Keywords: Dried Fig, Elasticity, Raw Product, Processed Product
v
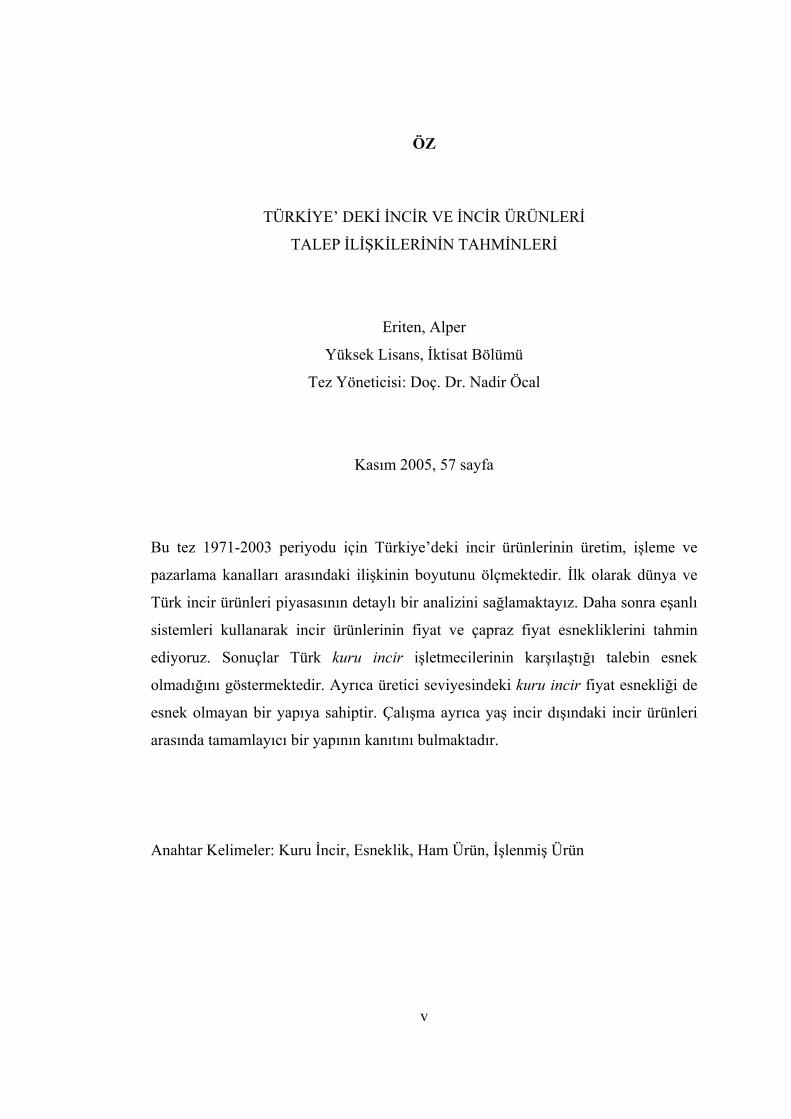
ÖZ
TÜRKİYE’ DEKİ İNCİR VE İNCİR ÜRÜNLERİ
TALEP İLİŞKİLERİNİN TAHMİNLERİ
Eriten, Alper
Yüksek Lisans, İktisat Bölümü
Tez Yöneticisi: Doç. Dr. Nadir Öcal
Kasım 2005, 57 sayfa
Bu tez 1971-2003 periyodu için Türkiye’deki incir ürünlerinin üretim, işleme ve
pazarlama kanalları arasındaki ilişkinin boyutunu ölçmektedir. İlk olarak dünya ve
Türk incir ürünleri piyasasının detaylı bir analizini sağlamaktayız. Daha sonra eşanlı
sistemleri kullanarak incir ürünlerinin fiyat ve çapraz fiyat esnekliklerini tahmin
ediyoruz. Sonuçlar Türk kuru incir işletmecilerinin karşılaştığı talebin esnek
olmadığını göstermektedir. Ayrıca üretici seviyesindeki kuru incir fiyat esnekliği de
esnek olmayan bir yapıya sahiptir. Çalışma ayrıca yaş incir dışındaki incir ürünleri
arasında tamamlayıcı bir yapının kanıtını bulmaktadır.
Anahtar Kelimeler: Kuru İncir, Esneklik, Ham Ürün, İşlenmiş Ürün

vi
To My Father

vii
ACKNOWLEDGMENTS
The author wishes to express his deepest gratitude to his supervisor Assoc. Prof. Dr.
Nadir Öcal for his guidance, criticism, trust, advice, encouragements and insight
throughout the research.
The author would also like to thank Prof. Dr. Erol Çakmak for his suggestions and
guidance.
The assistance of Mr. Kaya Mehmet, Mr. Atakul Celal, Mr. Saraç Mehmet Ali and
Mr. Eriten Ümit in understanding of Turkish fig products market are gratefully
acknowledged.
The author also wishes to express his deepest gratitude to his friends Raif Can, Erbay
Dökmeci and Assistant Expert Meltem Altınay for their worthy encouragement.

viii
TABLE OF CONTENTS
PLAGIARISM…………………………………………………………………….. iii
ABSTRACT………………………………………………………………………...iv
ÖZ……………………………………………………………………………………v
DEDICATION………………………………………………………………………vi
ACKNOWLEDGMENTS……………………………………………………….....vii
TABLE OF CONTENTS……………………………………………………….viii-ix
LIST OF TABLES…………………………………………………………………...x
LIST OF FIGURES…………………………………………………………………xi
CHAPTER
1. INTRODUCTION…………………………………………………………….1
2. BACKGROUND INFORMATION…………………………………………..3
2.1 World Production………………………………………………………3
2.2 World Trade…………………………………………………………....5
2.2.1 Export………………………………………………………..6
2.2.2 Import……………………………………………………….10
2.3 Dried Fig Exports of Turkey………………………………………….12
3. STRUCTURE OF DEMAND………………………………………………..19
3.1 Processed Product Block (Model A)………………………………….20
3.2 Raw Product Block (Model B)……………………………………….23
4. DATA………………………………………………………………………..27
5. EMPIRICAL SPECIFICATIONS…………………………………………...29
5.1 Processed Product Block Specifications (Model A)………………….29
5.2 Raw Product Block Specifications (Model B)………………………..34
6. ESTIMATION METHOD AND RESULTS………………………………...36
6.1 Processed Product Block Estimates…………………………………..37
6.2 Raw Product Block Estimates………………………………………...41
7. ELASTICITY EVALUATIONS…………………………………………….43

ix
8.CONCLUSIONS AND COMMENTS……………………………………….46
REFERENCES……………………………………………………………………..49
APPENDICES
A. Processing Costs of Firms Located in Izmir-Aydin Region..........................50
B. Taris’s Share in Dried Fig Export of Turkey……………………………….51
C. Deflated Export Quantities of Fig Products of Turkey……………………..52
D. Deflated Export Prices of Fig Products of Turkey………………………….53
E. Deflated Processing Costs of Fig Products…………………………………54
F. Deflated Raw Product Prices of Fig Products………………………………55
G. Deflated Raw Product Quantities of Fig Products………………………….56
H. Elasticity Calculations………………………………………………………57

x
LIST OF TABLES
TABLES
Table 2.1.1 Fig Production...........................................................................................4
Table 2.1.2 Dried Fig Production...............................................................................5
Table 2.2.1.1 Fresh Fig Exports...................................................................................6
Table 2.2.1.2 World Dried Fig Exports.......................................................................7
Table 2.2.1.3 Values of World Dried Fig Exports......................................................8
Table 2.3.1 Turkish Dried Fig Exports According to the Process Types.............13-14
Table 3.2.1 Definition of Variables in the Model………………………….........25-26
Table 5.1.1 Equations of Aegean Demand Model.....................................................33
Table 5.2.1 Equations of Aegean Demand Model.....................................................35
Table 6.1.1 Results of Model A.................................................................................40
Table 6.2.1 Results of Model B.................................................................................42
Table 7.1 Elasticities..................................................................................................44
Table A.1……………………………………………………………………………50
Table B.1……………………………………………………………………………51
Table C.1……………………………………………………………………………52
Table D.1……………………………………………………………………………53
Table E.1……………………………………………………………………………54
Table F.1……………………………………………………………………………55
Table G.1……………………………………………………………………………56

xi
LIST OF FIGURES
FIGURES
Figure 2.2.1.1 Average Dried Fig Exports after 1980..……………………………...7
Figure 2.2.1.2 Average Unit Dried Fig Export Prices after 1980….………………...9
Figure 2.2.2.1 Average Dried Fig Imports after 1980………………….…………..10
Figure 2.2.2.2 Average Dried Fig Import Values after 1980………….……………11
Figure 2.2.2.3 Average Unit Dried Fig Import Prices after 1980…………….…….12
Figure 2.3.1 Destinations of Turkish Dried Fig Export between the Seasons 1989/90
and 2000/01…………………………………………………………………………15
Figure 2.3.2 Destinations of Turkish Fig Puree Export between the Seasons 1989/90
and 2000/01…………………………………………………………………………16
Figure 2.3.3 Destinations of Turkish Bruised Fig Export between the Seasons
1989/90 and 2000/01………………………………………………………………..17
Figure 2.3.4 Destinations of Turkish Minced Fig Export between the Seasons
1989/90 and 2000/01………………………………………………………………..17

1
CHAPTER 1
INTRODUCTION
In spite of the fact that many radical alterations have emerged on world labor
market, agricultural sector has been the basic source of employment for many of the
world’s population. This is reflected not only in agrarian cultures but also in recently
developed countries which were once regarded as developing countries. Agriculture
sector constituted the first step of development as it helped to eliminate the foreign
exchange constraint of developing countries. During post World War II period,
Turkey took part in reconstruction of Europe as an agricultural supplier. Particularly
during Menderes’s government this role was very important for Turkey as the
economy heavily depended on export capability of agriculture sector. The share of
agriculture sector in gross national product was very high, 51.3 percent in 1948
(Kruger, A.O. 1974). Although this share has decreased substantially since then and
the importance of agriculture sector in foreign trade has been outweighed by other
sectors1, in some agricultural products Turkey leads in the world markets. For
instance regarding fig products, especially dried fig, more than half of the world
export is channeled from Turkey (FAO Stats.).
As far as weather preconditions, biological structure, labor intensive production
process and marketing structure are concerned; the dried fig market constitutes a
complex structure in Turkey. Many questions may arise from this complex structure.
Firstly, ‘What is the composition of fig production and trade in the world and where
is Turkey’s place in this market?’ Secondly ‘What kinds of fig products are traded in
Turkey and what is the extent of their demand relationships?’ Lastly, ‘What is the
level of responsiveness for fig products of Turkish processors and producers?’
These 3 related questions have complex methodological implications. The best way
is to examine the relationships between production, processing and marketing
channels of fig products in Turkey.
1 Industrial products dominate Turkish exports. According to SIS, the share of agriculture in 2004’s GDP is 12.9 %.

2
It is the central contention of this study that producer – processor analysis
provides an important framework for addressing these crucial questions. In
developing this argument, we follow French, Eryilmaz and Blackman (1991). They
investigated demand relationships for apricot and apricot products by using
seemingly unrelated regressions model. Besides they formed two-product blocks
(processed-raw) model which is ‘block recursive in that the endogenous quantities
allocated to each processing use, determined in the Raw Product Block, enter as
predetermined pack variables in the Processed Product Block’ (French, Eryilmaz
and Blackman, 1991). In this study similar modeling approach is carried out to
analyze the demand relationships for fig and fig products in Turkey. It is important
to note that this is the first study on these issues and we therefore believe that our
results will shed some light on the several issues. Firstly we present a detailed
analysis of fig and fig products market in Turkey. Secondly the study identifies the
Turkey’s main competitors in the world fig market and their possible effects on
demand for Turkish fig products. Finally and most importantly we are able to
measure the sensitiveness of the demand for fig and fig products to price changes by
both estimating the own and cross-price elasticities.
The plan of the study is as follows. Firstly, in Chapter 2, we give brief
information about world production and trade of fig and fig products by mainly
focusing on Turkish market. In Chapter 3, we form two simultaneous systems
regarding the Aegean demand model in Turkey. In Chapter 4, we outline the
structure of data used in this study. This is followed in Chapter 5 by specified
version of the Aegean demand model given in Chapter 3. In Chapters 6 and 7, the
estimation results and elasticity evaluations are presented respectively. Lastly the
study concludes by drawing conclusions for structure of producer-processor
relationship.

3
CHAPTER 2
BACKGROUND INFORMATION
2.1) World Production
Fig is a sub-tropical climate plant and it can grow in all wild temperate climates.
Specifically the annual average temperature rate must be about 18°C - 20°C.
Moreover average temperature rates higher than 30°C are necessary especially in
harvest seasons. Furthermore the temperature rates lower than –9°C may cause
permanent damages on the fig tree as it has soft wood structure. Consequently the
best climatic condition for fig production is mild winters, hot and dry summers.
Precipitation rates have also importance in fig production. The annual optimum
average precipitation rate for a fig tree is equal to 625 millimeters with the lower
bound of 550 millimeters. However, it is important that, there must be no
precipitation during harvest season. In addition to this, during drying process2 in
harvest season, any relative humidity rate above 50% may be harmful for production
(Kabasakal, 1990).
Fig is one of the characteristic fruits of Mediterranean basin and is produced
mainly in Mediterranean countries, North Africa, Syria, Iran, the Caucasus and
Crimea. In 1888 the Smyrna fig3 was exported from Turkey to California and from
California to South America, South Africa and Australia. Finally these areas have
become fig producer regions but now few of them have managed to create trade
connections.
Main fig producer countries are listed in Table 2.1.1. According to the last 24
years’ data published in the annual Statistics of Food and Agriculture Organization
(FAO), Turkey, Egypt, Greece, Iran, Spain, Syria and the United States of America
can be regarded as main fig producer countries in the world. Every year more than
1 million tons of figs are produced in the world. Turkey is the most important fig 2Figs are dried naturally in gardens under the sunlight.
3 A special fig tree.

4
producer country in the world with an average production of more than 280
thousand tons. On the other hand with its crucial acceleration after 1980s, Egypt and
with its stable potential, Greece can be regarded as the other main fig producer
countries.
Table 2.1.1: Fig Production (tons)
Years World Egypt Greece Iran Spain Syria Turkey USA
1980/84 954,773 11,699 110,457 29,324 47,052 49,002 279,000 34,7141985/89 1,033,367 25,800 107,825 56,110 51,197 41,051 338,800 43,2451990/94 1,086,101 129,988 93,040 76,037 58,426 41,174 282,600 47,1681995/99 1,131,089 216,011 81,817 73,465 60,057 45,557 272,600 46,2382000/03 1,051,453 178,494 80,000 75,348 61,296 42,723 251,250 45,435average: 1,051,353 109,644 95,237 61,503 55,369 43,951 286,250 43,274Source: FAO Stats.
There are lots of varieties of fig produced in Turkey. For instance; the Tarak, the
black and white Orak, Mor fig, Akça and Sarilop are major fresh fig varieties in
Turkey.4 From these fresh fig varieties, unfortunately only the sarilop has important
economic potential as it is suitable for drying process. During the drying process of
the sarilop, its water contents fall from 75% to 30-50% (Ağaoğlu, Y.S. 1993). Due
to this uncertain relation between production quantities of fresh and dried figs and
presence of lots of varieties of fresh fig, it is difficult to find an easy way so as to
relate and compare the production data. Due to these difficulties, data from Aegean
Exporters’ Associations will be examined for dried fig production. From Table
2.1.2, we see that Turkey supplies more than half of the world dried fig production
between 1971 and 1990. However, countries like Egypt, Iran and Syrian Arab
Republic which are regarded as main fig producer countries are now out of the list
and they are going to be examined in the following sections. On the other hand,
Greece and the United States of America seem to be main important competitors
(especially the former) for Turkey in the world dried fig markets as far as production
4 The names of fresh fig varieties are given in Turkish.
5
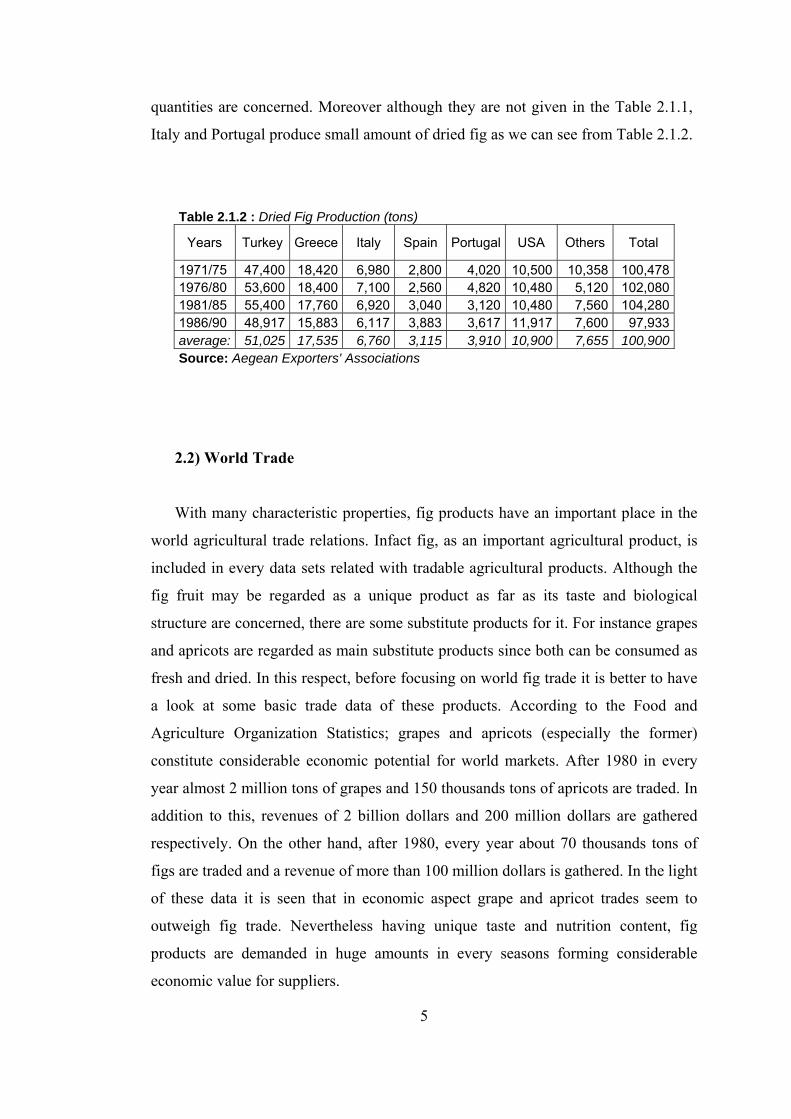
quantities are concerned. Moreover although they are not given in the Table 2.1.1,
Italy and Portugal produce small amount of dried fig as we can see from Table 2.1.2.
Table 2.1.2 : Dried Fig Production (tons)
Years Turkey Greece Italy Spain Portugal USA Others Total
1971/75 47,400 18,420 6,980 2,800 4,020 10,500 10,358 100,4781976/80 53,600 18,400 7,100 2,560 4,820 10,480 5,120 102,0801981/85 55,400 17,760 6,920 3,040 3,120 10,480 7,560 104,2801986/90 48,917 15,883 6,117 3,883 3,617 11,917 7,600 97,933average: 51,025 17,535 6,760 3,115 3,910 10,900 7,655 100,900Source: Aegean Exporters' Associations
2.2) World Trade
With many characteristic properties, fig products have an important place in the
world agricultural trade relations. Infact fig, as an important agricultural product, is
included in every data sets related with tradable agricultural products. Although the
fig fruit may be regarded as a unique product as far as its taste and biological
structure are concerned, there are some substitute products for it. For instance grapes
and apricots are regarded as main substitute products since both can be consumed as
fresh and dried. In this respect, before focusing on world fig trade it is better to have
a look at some basic trade data of these products. According to the Food and
Agriculture Organization Statistics; grapes and apricots (especially the former)
constitute considerable economic potential for world markets. After 1980 in every
year almost 2 million tons of grapes and 150 thousands tons of apricots are traded. In
addition to this, revenues of 2 billion dollars and 200 million dollars are gathered
respectively. On the other hand, after 1980, every year about 70 thousands tons of
figs are traded and a revenue of more than 100 million dollars is gathered. In the light
of these data it is seen that in economic aspect grape and apricot trades seem to
outweigh fig trade. Nevertheless having unique taste and nutrition content, fig
products are demanded in huge amounts in every seasons forming considerable
economic value for suppliers.

6
2.2.1) Export
As it is mentioned in previous sections, the fig fruit is consumed as fresh and
dried. Hence it may be more practical to examine trade patterns of fresh and dried fig
products separately. Tables 2.2.1.1 and 2.2.1.2 show world total fresh and dried figs
export respectively. From Table 2.2.1.1 we observe that international fresh fig trade
does not constitute a considerable economic potential in the world markets. The main
reasons behind this may be highly perishable character of fresh fig and lack of
technological infrastructure in storage and transportation processes.5 However with
rapid improvement in technological infrastructure and outward-looking trade
policies, international fresh fig trade has accelerated since the second half of 1980s.
In 2003, almost 24,000 tons of fresh figs are exported and about 40 million dollars of
export revenue is channeled into the supplier countries. Turkey and Italy turn out to
be the main fresh fig exporter countries between 1980 and 2003.
Table 2.2.1.1 : Fresh Fig Exports - Quantity=Q (tons) - Value=V ($1000) World Greece Italy Spain Turkey Years
Q V Q V Q V Q V Q V 1980/84 3,217 2,392 17 40 441 509 8 6 1,554 7281985/89 5,200 5,420 194 548 869 1,082 70 89 2,411 1,5951990/94 9,422 13,290 145 486 1,563 2,217 318 615 4,006 4,3221995/99 14,154 21,548 124 400 1,975 2,695 1,245 2,151 5,296 6,1502000/03 18,440 26,269 149 416 1,479 1,957 1,897 3,207 5,490 5,996average: 9,739 13,264 125 376 1,257 1,681 658 1,130 3,679 3,665Source: FAO Stats.
In addition, as far as last ten years’ data are concerned, Spain has increased its
export share in international fresh fig trade. On the other hand Greece has maintained
its stable trade potential between 1980 and 2003. Although the volume of
international trade of fresh fig seems to increase, it still has relatively small share in
5 Especially during early 1980s.

7
world agricultural trade. Because of that, unlike dried fig, this product is not given a
duty code even in some of fresh fig exporter countries.
Table 2.2.1.2 : World Dried Fig Exports (tons)
Years World Greece Iran Portugal Spain Syria Turkey USA
1961/69 51,383 11,560 25 5,542 391 319 28,418 9101970/79 46,799 9,790 80 2,683 301 927 29,378 1,1461980/89 53,614 8,215 24 641 457 2,374 37,970 1,1301990/99 59,585 6,216 3,443 183 2,101 3,996 34,010 3,1582000/02 70,852 4,261 8,604 175 3,512 2,327 39,134 2,507average: 54,166 8,548 1,464 2,035 1,015 1,972 33,018 1,668
avr.after 80s: 62,185 5,765 4,634 181 2,426 3,611 35,193 3,008Source: FAO Stats.
4,634 7%
2,426 4%
3,611 6%
35,193 57%
3,008 5%
7,549 12% 5,765 9%
Greece Iran Spain Syria Turkey USA others
o
Figure 2.2.1.1: Average Dried Fig Exports After 1980 (tons - %)
Tables 2.2.1.2 and 2.2.1.3 present world dried fig exports in tons and value of
this export in United States Dollar respectively. According to these tables, it is clear
that international dried fig trade outweighs international fresh fig trade. Between the
years 1961 and 2002, 54,166 tons of dried figs are exported on average and revenue
of more than 55 million dollars is channeled into supplier countries. With the

8
exception of first two decades these numbers overshoot 60,000 tons and 100 million
dollars respectively.
Table 2.2.1.3: Values of World Dried Fig Exports ($1000)
Years World Greece Iran Portugal Spain Syria Turkey USA
1961/69 12,478 2,348 5 834 78 57 6,361 5681970/79 30,712 6,416 29 969 239 252 19,707 1,2221980/89 52,485 8,378 31 542 354 2,525 35,773 1,7831990/99 105,963 12,248 2,505 267 2,612 4,488 65,699 7,2612000/02 112,634 7,860 6,401 361 3,339 2,041 68,269 7,275average: 55,757 7,503 1,069 628 1,018 1,888 35,091 3,086
avr.after 80s: 107,502 11,235 3,404 288 2,780 3,923 66,292 7,264Source: FAO Stats.
As a main dried fig producer country, Turkey supplies more than half of the
world dried fig exports. As a result, between the years 1960 and 2002, Turkey’s
average export revenue is about 35 million dollars. As another main dried fig
producer country, Greece exports 8,548 tons of dried figs and earns about 7.5 million
dollars on average. Furthermore Portugal, Syrian Arab Republic, the United States of
America, Iran Islamic Republic and Spain can be regarded as other dried fig exporter
countries. Incidentally as far as the period of post–1980 is concerned the countries
such as Iran Islamic Republic and Syrian Arab Republic seem to catch up with
Greece in quantity classification. Besides the United States of America is the third
country in value classification. On the other hand Portugal seems to lose its high pre-
1980 export levels. Whereas, quantity and value data of Spain seem to be more than
doubled during the period of post-1980. Accordingly, as we can observe from Figure
2.2.1.1, between 1980 and 2002 Turkey, Greece, Iran Islamic Republic, Syrian Arab
Republic, The United States of America and Spain maintain 57 , 9 , 7 , 6 , 5 and 4
percent of world dried fig trade respectively. Besides, 12 percent of this trade is
shared by other countries. It is worth to note that in both pre and post 1980 periods
Turkey turns out to be the leader country in the world dried fig markets.

9
0,00
0,50
1,00
1,50
2,00
2,50
3,00
( $ )
World Greece Iran Italy Portugal Spain Syria Turkey USA OTHERS
countries
Figure 2.2.1.2: Average Unit Dried Fig Export Prices After 1980
In analyzing international trade potential of an agricultural product, not only
quantity and value of transactions, but unit prices also play major role in shedding
light on marketing capability of supplier countries and product qualities. Due to the
neo-liberal policies of post-1980, all countries have reformed their access to world
markets. Hence, especially for tradable agricultural products, unit prices began to
reflect the quality differences of traded product.6 When we look at average unit dried
fig export prices presented in Figure 2.2.1.2, we can easily see that some countries
such as Turkey and Greece, Italy and Portugal, Iran Islamic Republic and Syrian
Arab Republic form pair countries as far as their unit export prices are concerned.
This is, however, not surprising because each pair countries has the same
geographical and climatic conditions. Infact in international markets Greek and
Turkish dried figs are regarded as main substitutes so as are Iran and Syrian dried
figs.
From Figure 2.2.1.2, it is seen that the United States of America, Portugal and
Italy have the highest prices in post-1980 period. Besides two main dried fig supplier
countries, Turkey and Greece, earn less than two dollars per unit kilogram. Whereas
6 Dried fig products show many quality differences. See Chapter 2.3.

10
with their relatively poor quality Iran Islamic Republic and Syrian Arab Republic
earn about one dollar per unit kilogram.
2.2.2) Import
Although the number of producers of an agricultural product may not be
numerous, it is usual that the number of markets it can be exported are not that
limited. For instance, in contrast to supply side almost every country in the world
markets demand dried fig from producer countries. The import data of main
demanders after 1980 are given in Figures 2.2.2.1 and 2.2.2.2. Before analyzing
these figures it is worth to note that France, Germany and Italy are the most
important dried fig demander countries. In addition to these countries the United
Kingdom, the United States of America, Austria and Switzerland have considerable
demands for dried fig (see FAO Stats. for the data of the period 1960-80).
7,226
9,015
5,577
22,957
2,326 2,204
5,748
2,858
China, Hong Kong France GermanyItaly Switzerland UKUSA others
Figure 2.2.2.1: Average Dried Fig Imports After 1980 (tons)
When we focus on post-1980 period, we observe that dried fig demand of
Germany promotes and reaches more than 9 thousands tons with an expenditure of
more than 16 million dollars. Meanwhile quantity of import demand of countries
such as the United States of America, Italy and especially China-Hong Kong SAR

11
shows upward trend in the post-1980 period. Although imports of the United
Kingdom and France weaken in quantity term, the expenditures of these countries
increase after 1980 due to rise in unit import prices.
5,23815,699
16,704
11,3805,622
39,495
7,8544,802
China, Hong Kong France GermanyItaly Switzerland UKUSA others
Figure 2.2.2.2: Average Dried Fig Import Values After 1980 ($1000)
As far as unit import prices are concerned, during 1960 and 2002 China-Hong
Kong SAR, Canada, Israel and Switzerland have the highest unit price levels
respectively. All other countries, except Austria, pay about 1 dollar per 1 kilogram
for imported dried fig. However, Austria with 0.6736 dollar turns out to be the only
country which pays less than 1 dollar per kilogram (FAO Stats.).
Regarding post-1980 period, there is a considerable increase in the levels of unit
dried fig import prices. For instance; with a unit price of more than 3 dollars, China-
Hong Kong SAR imports the most expensive and probably the best dried figs in the
world. Besides Switzerland, Israel and Canada pay 2.54, 2.36 and 2.31 dollars per
kilogram so as to import high quality dried figs (See Figure 2.2.2.3, Israel and
Canada are excluded from Figure 2.2.2.3 due to their small shares in import.).

12
0,00
1,00
2,00
3,00
4,00
World China, HK France Germany Italy Sw itz. UK USA
countries
($)
Figure 2.2.2.3: Average Unit Dried Fig Import Prices After 1980
In the light of all these details about international dried fig trade, we can conclude
that in the post-1980 period Turkey, Greece, Iran Islamic Republic, Syrian Arab
Republic, the United States of America and Spain are main dried fig supplier
countries in the world markets. However from these countries the United States of
America and Spain also import considerable amounts of dried fig in every year. In
addition to these 2 countries Germany, France, Italy, China-Hong Kong SAR, the
United Kingdom and Switzerland are regarded as main dried fig importer countries
in the world markets.
2.3) Dried Fig Exports of Turkey
As it is mentioned in the previous sections, Turkey is the key country in both
production and international trade of fig products. To enable country comparisons for
economic importance of fig products, we use annual data of Food and Agriculture
Organization Statistics. However during the examination of agricultural products of
an individual country, usually the problem of choosing either calendar or crop year
arises. However, as far as some agricultural products like dried fruits are concerned
the importance of choosing crop year outweighs calendar year. For instance, in
countries like Turkey and Greece, crop season of dried fig begins in the second half
of August and ends towards the late September. Meanwhile the exportation period of
dried fig begins in the late September (or early October) and lasts till the end of
13
second quarter of the following year. Therefore, focusing on annual data instead of
crop year data may weaken the validity of studies on demand relations. According to
French, Eryilmaz and Blackman (1991), ignoring crop-calendar year problem results
in a slight distortion of the marketing year dried apricot consumption values.
Consequently, in the light of this fact, crop years data will be used in the examination
of foreign demand relationships of Turkish dried fig.
Presence of fresh and dried consumption of the fig products generally indicates
existence of only main two kinds of fig. Whereas, as it is mentioned in the previous
sections fresh fig has lots of varieties and so does dried fig. Dried figs can be
categorized under five categories namely, ‘dried fig, fig puree, bruised fig, minced
fig and crack fig’. Table 2.3.1 shows that all these dried fig varieties apart from crack
fig are traded between Turkey and her customers. It is important to explain all these
dried fig varieties and their differences from each other. To begin with, in a narrow
sense ‘dried fig’indicates the products which are not applied any mechanical process.
In other words what you see in a fig garden is what you eat. In addition, ‘dried fig’ is
classified according to units per one kilogram and for instance the ones less than 40
figs per kilogram are called ‘filtered fig’7.
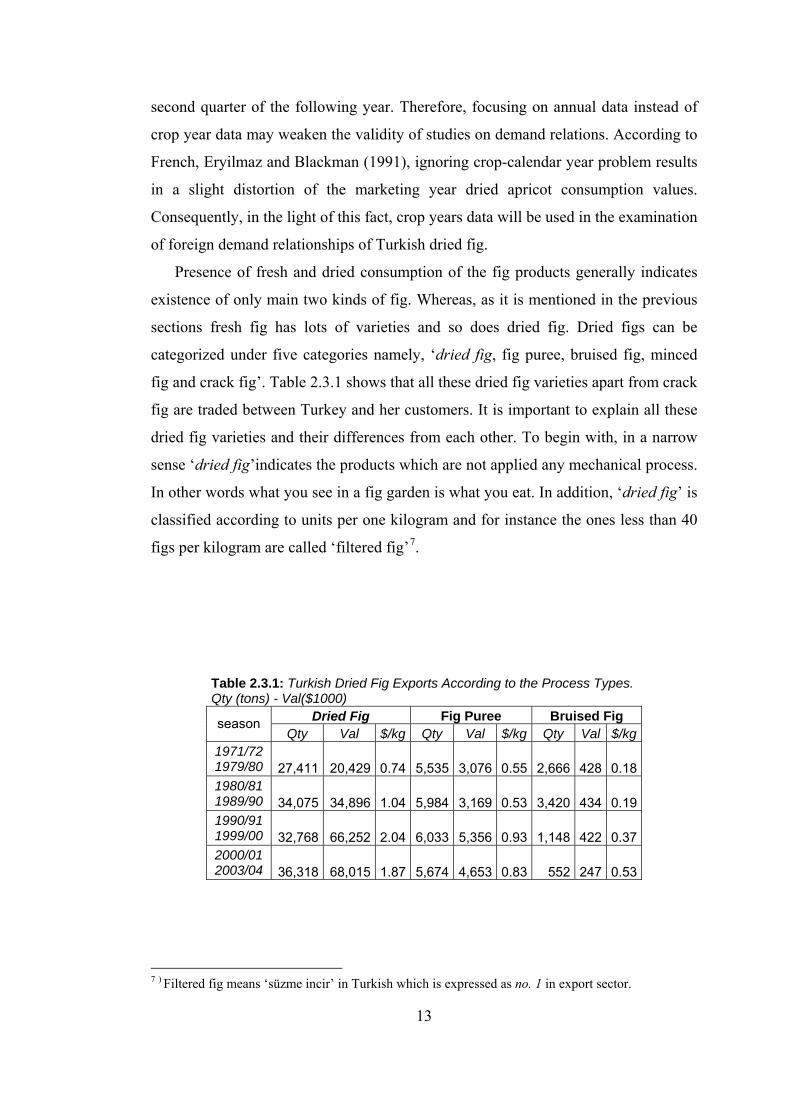
Table 2.3.1: Turkish Dried Fig Exports According to the Process Types. Qty (tons) - Val($1000)
Dried Fig Fig Puree Bruised Fig season Qty Val $/kg Qty Val $/kg Qty Val $/kg
1971/72 1979/80 27,411 20,429 0.74 5,535 3,076 0.55 2,666 428 0.18 1980/81 1989/90 34,075 34,896 1.04 5,984 3,169 0.53 3,420 434 0.19 1990/91 1999/00 32,768 66,252 2.04 6,033 5,356 0.93 1,148 422 0.37 2000/01 2003/04 36,318 68,015 1.87 5,674 4,653 0.83 552 247 0.53
7 ) Filtered fig means ‘süzme incir’ in Turkish which is expressed as no. 1 in export sector.

14
Table 2.3.1 (continue)
Minced Fig Total season Qty Val $/kg Qty Val $/kg
1971/72 1979/80 0 0 0 35,612 23,933 0.67 1980/81 1989/90 304 333 1.10 43,509 38,532 0.90 1990/91 1999/00 977 1,205 1.24 40,927 73,236 1.80 2000/01 2003/04 1,317 1,402 1.07 43,861 74,317 1.70
Source: Aegean Exporters’ Associations
Secondly, the term ‘fig puree’ indicates the products which lost its dried fig
feature during production process. Namely any dried fig which are torn by shovel or
shifter are regarded as fig puree after application of certain machinery processes.
This kind of dried fig is utilized in making wafer and marmalade. Thirdly, the
concept of ‘bruised fig’ indicates the products which have no fig taste and fig honey
in its fruit. Hence, this kind of dried fig has no direct consumption channel but it is
utilized especially in alcohol industry. Lastly, thanks to the technological
developments in the processing technology especially during post 1980 period,
‘dried fig’ which are more than 100 units per kilogram began to be channeled into
world markets, in different structure. After processing, this kind of dried fig is
‘minced’ and utilized in packed products such as cornflakes, chocolate and sugar
products.
In the light of these details about the varieties of dried fig, we can examine the
data from Aegean Exporters’ Associations in the Table 2.3.1. The original data of
pre-1980 period are given in Turkish Lira. In addition to this, the last season’s data
cover only exports before April 2004. To present the data of pre-1980 period in
dollar terms the levels of the exchange rate of the corresponding time period are
used. We can easily see from Table 2.3.1 that ‘dried fig’ turns out to be the most
important variety of Turkish fig products export. On the other hand, other 3 varieties
of dried fig seem to constitute relatively small part of Turkish dried fig export. As far
as seasonal aggregates are concerned, the highest levels in quantity and value terms

15
are observed in the 1982/1983 and 2002/2003 seasons respectively. Besides with unit
price level of 2.14 dollars, the season of 1992/1993 is the only period in which unit
price overshoots 2 dollars. As far as the individual varieties of dried fig are
concerned, the highest levels in quantity and value of ‘dried fig’ exports are observed
in the 1999/2000 and 2002/2003 seasons respectively. In addition, in the season of
1992/1993, unit price of 2.5 dollars constitutes almost ten times of price of
1971/1972 season. Secondly, the quantity of ‘fig puree’ export averages to the levels
of more than 5,000 tons with unit price of less than 1 dollar. Especially during two
successive seasons between 1993 and 1995, the fig puree export reaches almost
10,000 tons which is its highest level. Thirdly, in spite of its smallest economic
potential, the ‘bruised fig’ export peaks in the season 1982/1983 with 17,224 tons
and revenue of 1,334 thousands dollar. Lastly, during its infancy, the ‘minced fig’
export is becoming more attractive in the world markets and it forms export revenue
of more than 1 dollar per kilogram.
18%
18%
5%
6%14%3%
6%
30%
Germany France England SpainItaly Sweden Switzerland Others
Figure 2.3.1: Destinations of Turkish Dried Fig Exports Between the Seasons 1989/90 and 2000/01

16
12%
3%
7%
17%
15%
38%
4% 4%
Germany Denmark France EnglandIreland USA Canada others
Figure 2.3.2: Destinations of Turkish Fig Puree Exports Between the Seasons 1989/90 and 2000/01
After the examination of the composition of Turkish dried fig exports, we can
focus on the destination points of these exports. The details are given in the Figures
2.3.1, 2.3.2, 2.3.3, and 2.3.4, covering the data between the seasons 1989/90 and
2000/01. As seen from these figures, Germany, France, England, Italy, the United
States of America, Austria, Sweden and Switzerland turn out to be the most
important countries as the demander of Turkish dried fig products. For instance in
the season 2000/01 these countries import 9,083 , 6,880 , 2,079 , 5,070 , 5,116 ,
1,003 , 1,058 and 1,857 kilograms of dried figs products respectively.

17
7% 3%
15%
2%
54%
11%
8%
Germany Belgium France USAAustria Switzerland others
Figure 2.3.3: Destinations of Turkish Bruised Fig Export Between the Seasons 1989/90 and 2000/01
66%6%
4%
9%
4%
11%
Germany Italy USAAustria Switzerland others
Figure 2.3.4: Destinations of Turkish Minced Fig Export Between the Seasons 1989/90 and 2000/01
Moreover countries such as Denmark, Spain, Netherlands, Portugal and Israel are
rising stars of Turkish dried fig market and they can be classified according to
process types of their imports. To begin with ‘dried fig’ exports, Germany and
France turn out to be main two demanders with shares of 18% and with more than

18
5.8 million kilograms imports. After these two countries, with 14% share Italy comes
third and imports more than 4.6 million kilograms. Besides Spain, Switzerland,
England and Sweden are other important destinations of Turkish ‘dried fig’ exports
(see Figure 2.3.1). Secondly as far as ‘fig puree’ exports of Turkey are concerned,
the United States of America with 38 % share turns out to be the most important
customer. On the other hand England, Ireland and Germany are regarded as the other
destinations of Turkish fig puree exports (see Figure 2.3.2). Thirdly, with regard to
‘bruised fig’ exports of Turkey, Austria has more than half of the market with
imports of 640,413 kilograms. In addition to Austria, France and Switzerland are
regarded as the other main importers of Turkish bruised fig (see Figure 2.3.3).
Finally Figure 2.3.4 shows that, Germany leads in the market with share of 2/3 of
Turkish ‘minced fig’ exports and the other countries such as Austria, the United
States of America, Italy and Switzerland seem to play the role of competitive fringe
in this market (Aegean Exporters’ Associations).
In the light of the figures presented above, we can conclude that European Union
countries constitute important share in exports of Turkish dried fig products.
Countries such as Germany, France and Italy turn out to be major Turkish dried figs
importer countries. These countries do not implement any trade barriers against
Turkish fig products and every season large amounts of fig products are imported
from Turkey. Moreover Turkish dried figs processors benefit from social security
payments and transaction payments exemptions in the light of their value added tax
payments of package and equipment expenditures. However until recently they have
been subjected to export fund payments (100$ per one ton of big size dried fig export
and 60$ per one ton of small size dried fig export) under the condition of repayment
in 15 months from the date of export. Beginning from the season 2005-2006 Turkish
dried figs processors are not subjected to this kind of transaction.

19
CHAPTER 3
STRUCTURE OF DEMAND
In Turkey the region of Aegean is regarded as the center of international fig
trade. In other words West Anatolian littoral is the only dried fig exporter region of
Turkey and from this center more than half of the total world trade is supplied in
every year. Besides this region supplies 80 % of Turkish fig production in every
season and contains more than 80 % of fig trees in Turkey (SIS, Agricultural
Structure, 1997). In Aegean Region, particularly the Aydin and Izmir provinces turn
out to be the most important areas as far as international dried fig trade is concerned.
Correspondingly these two provinces are the leaders in Turkey with regard to
economic potential of fig production. For instance, according to State Institute’s
Statistics, in 1997, Aydin and Izmir provinces supplied 58 % and 15 % of total figs
production in Turkey respectively. In Izmir, Tire district and its plateaus are the most
important dried fig producer areas. In Aydın province the districts of Germencik,
Incirliova, and Nazilli are regarded as the most important dried fig producer areas.
Consequently, following analysis rests only on the structure of Aegean fig industry
especially by focusing on Aydin and Izmir provinces.
The Aegean demand model constitutes the following types of relationships:
a) derived demand functions facing processors of dried fig, fig puree, bruised and
minced fig.
b) functions of market allocation of processed product supply.
c) function of domestic consumption.
d) derived demand function facing Aegean fresh-fig producers.
e) producer-level pricing equations for dried fig products utilized for processing
which signal structure of producer-processors bargaining.
The first three equations and corresponding relationships can be defined as the
Processed Product Block. On the other hand the last two equations and
corresponding relationships can be defined as the Raw Product Block.
20
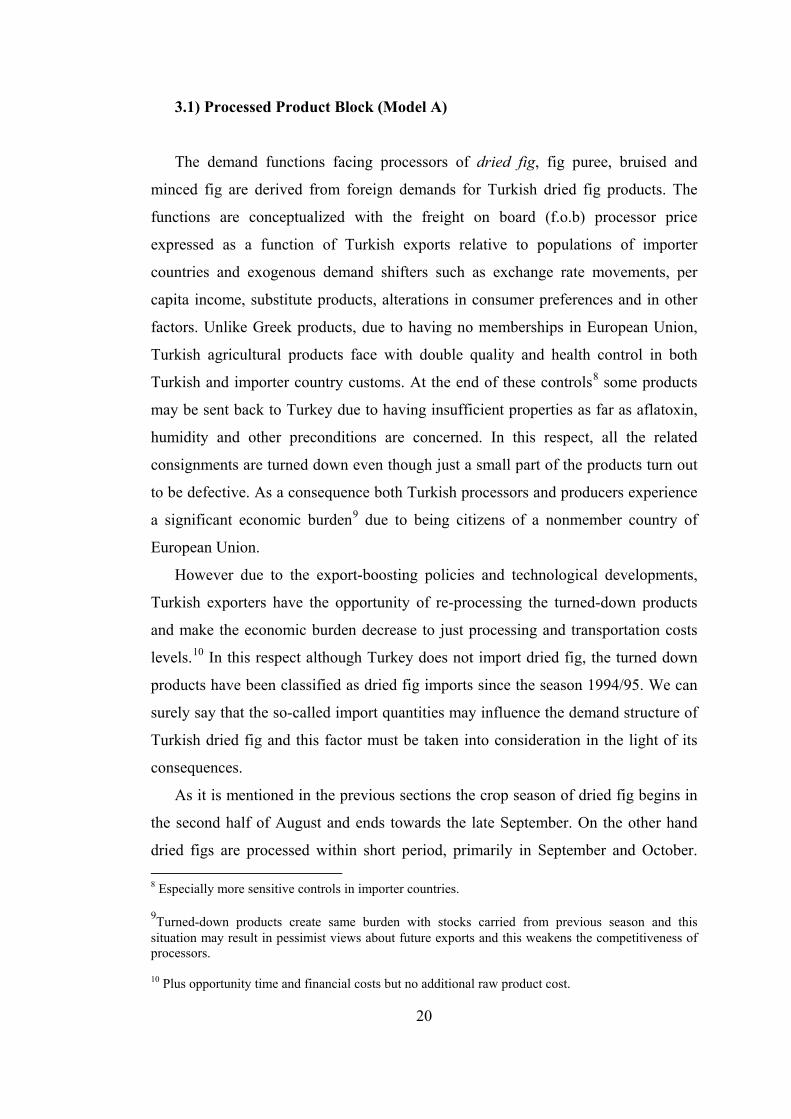
3.1) Processed Product Block (Model A)
The demand functions facing processors of dried fig, fig puree, bruised and
minced fig are derived from foreign demands for Turkish dried fig products. The
functions are conceptualized with the freight on board (f.o.b) processor price
expressed as a function of Turkish exports relative to populations of importer
countries and exogenous demand shifters such as exchange rate movements, per
capita income, substitute products, alterations in consumer preferences and in other
factors. Unlike Greek products, due to having no memberships in European Union,
Turkish agricultural products face with double quality and health control in both
Turkish and importer country customs. At the end of these controls8 some products
may be sent back to Turkey due to having insufficient properties as far as aflatoxin,
humidity and other preconditions are concerned. In this respect, all the related
consignments are turned down even though just a small part of the products turn out
to be defective. As a consequence both Turkish processors and producers experience
a significant economic burden9 due to being citizens of a nonmember country of
European Union.
However due to the export-boosting policies and technological developments,
Turkish exporters have the opportunity of re-processing the turned-down products
and make the economic burden decrease to just processing and transportation costs
levels.10 In this respect although Turkey does not import dried fig, the turned down
products have been classified as dried fig imports since the season 1994/95. We can
surely say that the so-called import quantities may influence the demand structure of
Turkish dried fig and this factor must be taken into consideration in the light of its
consequences.
As it is mentioned in the previous sections the crop season of dried fig begins in
the second half of August and ends towards the late September. On the other hand
dried figs are processed within short period, primarily in September and October. 8 Especially more sensitive controls in importer countries. 9Turned-down products create same burden with stocks carried from previous season and this situation may result in pessimist views about future exports and this weakens the competitiveness of processors. 10 Plus opportunity time and financial costs but no additional raw product cost.
21
Meanwhile the exportation period runs from late September to the second quarter of
next year. When there is a insufficient demand, unlike fresh fig, non-perishable
feature of dried fig allows producers to store it and sell in the next season. However
the carried-over products11 lose considerable economic value and can be utilized
only as fig puree, bruised or minced fig in next marketing year. Hence the processors
usually do not choose the option of carrying some of the seasonal supply to the next
season. In the light of this situation we assume that the processing does not result in a
burdensome carry-out at the end of the marketing season. The model also regards the
processors as the ones who are primarily concerned with marketing their products in
order to achieve prices that will cover processing and raw material costs and make a
positive return over their investment. Moreover processors carefully examine
alterations in current market conditions as reflected by supply-oriented allocations
between dried fig products relative to the seasonal supply. This allocation
relationship mainly happens to be in ‘dried fig’ market.12 Unfortunately separate
export data of each dried fig varieties are not available and only allocation
relationships of 4 main types of dried fig products will be examined instead. These
allocation relationships involve domestic consumption and f.o.b processor price as
endogenous variables, unit processing and raw product costs, total supply and
population (market size) as primary shifters.
On the other hand domestic processor prices turn out to be the most important
variable with respect to domestic consumption. In addition to this, the amount of
foreign demand influences domestic consumption levels as the domestic market size
is not capable of absorbing total supply. In other words, the surplus over exportation
is channeled into domestic market and dynamics of domestic demand structure are
based on this reciprocity.
In this simultaneous system, choosing suitable normalized variable for each
equation turn out to be one of the most important steps in modeling. In the study of
French, Eryilmaz and Blackman about apricot demand relationships, demand was
normalized on price and allocation relationships were normalized on quantity.
11 Especially the carried over dried fig. 12 Dried fig market contains lots of varieties such as 40 units, 60 units and 80 units of dried fig per kilogram.

22
Likewise, so as to relate domestic consumption with foreign demand, the model for
dried fig normalizes the demand functions on price with allocation relationships
normalized on movement.
Model A:
( 1 ) PDF = f(DDFN, DFPN, DBFN, DMFN; ED) (dried fig)
( 2 ) PFP = f(DDFN, DFPN, DBFN, DMFN; EP) (fig puree) f.o.b. demand
( 3 ) PBF = f(DDFN, DFPN, DBFN, DMFN; EB) (bruised fig) facing
processors
( 4 ) PMF = f(DDFN, DFPN, DBFN, DMFN; EM) ( minced fig)
**** **** ****
( 5 ) DDFN = f(PDF, DDDFN; CPD, PGD, TSN)
( 6 ) DFPN = f(PFP, DDDFN; CPP, PGP, TSN) market allocation
( 7 ) DBFN = f(PBF, DDDFN; CPB, PGB, TSN)
( 8 ) DMFN = f(PMF, DDDFN; CPM, PGM, TSN)
**** **** ****
( 9 ) DDDFN = f(PDDF, TSN) domestic consumption
**** **** ****
(10) TSN = DDFN + DFPN + DBFN + DMFN + DDDFN + M
(Definitions of variables are presented in Table 3.2.1)

23
3.2) Raw Product Block (Model B)
As it is mentioned in the previous sections, unlike world grape and fresh apricot
trade, world fresh fig trade does not constitute high values. However thanks to
presence of sufficient foreign and domestic demand, Turkish fig producers can find
an opportunity to sell small part of their products just before the drying process. The
presence of this opportunity creates an adequate financial source for producers
during harvest season and transfers work hours from drying process to relatively less
hard pressed period. Under this circumstance a probable producer-processor
bargaining structure cannot be formed in fresh fig market and producers are faced by
a competitive demand function derived from consumer and market intermediary
demands.
On the other hand, as far as dried fig market is concerned there is an exact producer-
processor bargaining structure that does not allow making a perfect competition
definition of producer-level demand functions for dried fig products. This producer-
processor bargaining structure is primarily affected by the following factors:
• price elasticity of processed product demand
• imports (turned-down products)
• bargaining tactics
• substitute markets
• financial strength of processors
• liquidity constraints of producers
• existence of cooperatives
• level of support purchases or subsidies of cooperatives
• level of fresh product sales
• weather conditions
Under the existence of this kind of producer-processor bargaining structure, the
definition of producer-level demand functions gains a different dimension. In this
respect;

24
French showed that even if a farm-level demand function is not defined, consistent price predictions of the raw product price may be obtained as a function of the quantity of raw product purchased and other variables that reflect grower and processor expectations of processed product demand and profitability and, hence, influence the outcomes of the bargaining process. (French, Eryilmaz, and Blackman, 1991 p.349)
In the light of this implementation, producer-level demand functions and
allocation identity can be defined as follows.
Model B:
( 1 ) PGF = f(QGFFN; EF)
( 2 ) PGD = f(QGDFN; VDF)
( 3 ) PGP = f(QGFPN; VFP) producer prices
( 4 ) PGB = f(QGBFN; VBF)
( 5 ) PGM = f(QGMFN; VMF)
( 6 ) QGN = QGFFN + QGDFN + QGFPN + QGBFN + QGMFN allocation
identity

25
Table 3.2.1: Definition of Variables in the Model Variables Definition
PDF Dried fig marketing-year unit f.o.b. processor price (deflated)
PFP Fig Puree Marketing-year unit f.o.b. processor price (deflated) PBF Bruised fig Marketing-year unit f.o.b. processor price (deflated) PMF Minced fig Marketing-year unit f.o.b. processor price (deflated)
DDFN
Turkey marketing-year dried fig exports expressed relative to Turkey or importer countries population (N)
DFPN Turkey marketing-year fig puree exports expressed relative to Turkey or importer countries population (N)
DBFN Turkey marketing-year bruised fig exports expressed relative to Turkey or importer countries population (N)
DMFN Turkey marketing-year minced fig exports expressed relative to Turkey or importer countries population (N)
DDDFN Turkey marketing year domestic consumption relative to Turkish population
ED Vector of dried fig demand shifters EP Vector of fig puree demand shifters EB Vector of bruised fig demand shifters EM Vector of minced fig demand shifters EF Vector of fresh fig demand shifters TSN Total Dried Figs Supply relative to Turkey population CPD Dried fig unit processing costs (deflated) CPP Fig puree unit processing costs (deflated) CPB Bruised fig unit processing costs (deflated) CPM Minced Fig unit processing costs (deflated) PGF Fresh Fig raw product prices (deflated) PGD Dried Fig raw product prices (deflated) PGP Fig Puree raw product prices (deflated) PGB Bruised Fig raw product prices (deflated) PGM Minced Fig raw product prices (deflated) PDDF Domestic dried fig price RPDL Previous year values of PDF/CPD RPMPL Previous year values of PPM/CPMP RPBFL Previous year values of PBF/CPB
PPM Minced fig-Fig Puree Marketing-year unit f.o.b. processor price (deflated)
CPMP Minced Fig-Fig Puree unit processing costs (deflated)
PGMP Minced Fig-Fig Puree raw product prices (deflated)
DMPN
Turkey marketing-year minced fig-fig puree exports expressed relative to importer countries population (N)
∆DDFNL Change in previous year values of dried fig per capita processed product movement
∆DMPNL Change in previous year values of minced fig-fig puree per capita processed product movement

26
Table 3.2.1 (continue) ∆DBFNL Change in previous year values of bruised fig per
capita processed product movement QGFFN Fresh Fig raw product quantity relative to Turkey population
QGDFN Dried fig raw product quantity relative to Turkey population
QGFPN Fig puree raw product quantity relative to Turkey population QGBFN Bruised fig raw product quantity relative to Turkey population QGMFN Minced fig raw product quantity relative to Turkey population
QGMPN Minced fig-Fig puree raw product quantity relative to Turkey population
V
Vectors of variables that reflect both producer and processor expectations of demand and profitability of processed products
QGN Total raw product quantity relative to Turkey population
‘ N ’ indicates Turkey or importer country per capita value (x 1000) in Processed Product Block. ‘ N ’ indicates Turkey per capita value (x 1000) in Raw Product Block.

27
CHAPTER 4
DATA
In this model we first calculate the f.o.b processor prices using the data declared
by Aegean Exporters’ Associations. Due to presence of more than 10 types of packed
dried fig13, using the price data of a proto-type product may not give consistent
results.14 Therefore taking average value of exports seems to be more practical way
of calculation of the f.o.b. processor prices. On the other hand unlike dried fig, other
dried fig products do not have lots of varieties. However so as to apply the same
method, the prices of these products are also calculated by taking average value of
exports. Secondly there does not exist any data set including processing costs of
dried fig products. Although in some years f.o.b. processing costs data are declared
by Aegean Exporters’ Associations, those data sets do not cover our entire estimation
period. To get over this problem, corresponding data sets are collected from local
processor firms located in Izmir – Aydin region (see Appendix A). Lastly although
Taris declares its raw product prices in every year, due to its relatively small share
(see Appendix B), in total exports and presence of unregistered economy, those
prices may differ considerably from valid market prices. Likewise, the corresponding
data sets are collected from local processor firms as far as raw product prices are
concerned. Although firm-level data formation may result in deficiencies, this kind
of tacit knowledge15 enable us solve the data problem (see Appendices for deflated
data values).
All the processor and raw product prices and all costs data are deflated by
Consumer Price Index. As far as quantity variables are concerned, the corresponding
13 The main packed dried fig varieties are layer, lokum, pulled, lerida, garland, protoben, makaroni, baglama, cikolata and naturel. 14In the study of French, Eryilmaz and Blackman, for instance, the price per case of 24 No. 21/2 cans is chosen to represent the price of canned apricots. 15 For more information about tacit knowledge especially for technology sectors see Alfred Kleinknecht and Jan ter Wengel, The Myth of Economic Globalization, Cambridge Journal of Economics, 1998, 22, 637-647.

28
data are given per 1.000 population. During implementation of these calculations,
firstly the processor prices are deflated by weighted average of Consumer Price
Indexes of importer countries16. Secondly processing costs and raw product prices
are deflated by Consumer Price Index of Turkey. Lastly export quantities are deflated
by weighted average importer countries’ population and domestic quantities are
deflated by population of Turkey as market sizes. However population and price
index data for calendar years are assigned to crop years which may result in some
distortions. Due to the presence of deep unregistered economy, domestic
consumption levels are determined in the light of levels of total dried fig production,
total exports and imports (turned-down products). In addition to this, domestic price
levels are calculated by subtracting indirect taxes and costs of additional quality
processes17 from export prices.
In this model all these calculations are implemented for data sets covering the period
1971/72 and 2003/04.
16 See Figures 2.3.1, 2.3.2, 2.3.3 and 2.3.4 for importer countries. 17 Due to insufficient domestic controls aflatoxin separation process has not been implemented in Turkey. This may result in saved cost of labor and raw product costs.

29
CHAPTER 5
EMPIRICAL SPECIFICATIONS
To perform the estimation process we have to modify our model in the light of
data limitations. Besides during this modification the vector of variables E and V
must be identified as they explain alterations in product foreign demand quantity and
in outcomes of producer-processor bargaining structure respectively.
5.1) Processed Product Block Specifications (Model A)
As it is already mentioned, due to improvements in technology, Turkish dried fig
sector has been producing ‘minced fig’ since late 1980s. In this respect, f.o.b.
processor price data for minced fig are not available for pre-1990 period. However in
the light of the f.o.b. processor prices of dried fig products, the prices of fig puree
and minced fig turn out to constitute similar levels. Moreover as far as utilization and
production processes are concerned both of these dried fig products show similar
forms. Consequently the separate minced fig demand equation (4) is eliminated from
the model and minced fig and fig puree equations are aggregated into a single
minced-puree component, DMPN.
DMPN = DMFN + DFPN; PPM = (DMFN/DMPN)*PMF + (DFPN/DMPN)*PFP
As we have already mentioned in previous sections, estimating demand functions
for products like dried fig contains many difficulties. Not only prices, supply
quantities, per-capita income levels or prices of substitute products affect demand
structure of this kind of agricultural product, but also exchange rate movements,
level of diversification of utilization forms, alterations in consumption habits of
consumers or even foreign trade policy options may have great influence on the
demand relations. In this respect so as to take this exclusive factor into consideration
while measuring demand relations of dried fig products, we would better have a look
at the study of French, Eryılmaz, and Blackman, 1991, for apricot products:
30
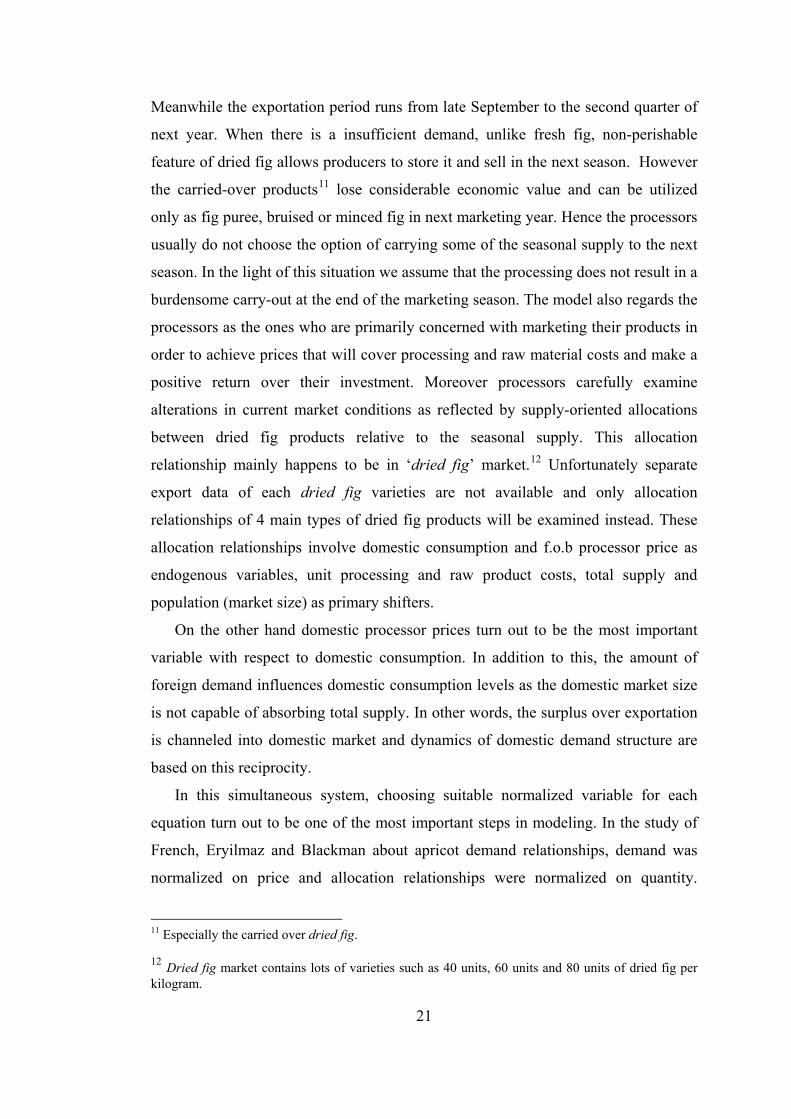
To account for the possible effects of changes in the unmeasurable or difficult to measure demand shift variables, we introduced a piece-wise linear-quadratic trend variable of the form a1T + a2TC + a3(TC)2 , where T= Year (57,58,…,88) , TC= D(T-73) , and D is zero prior to 1973, one in 1973 and after. This permits the trends indicated in the Eryılmaz study to change at about the time of the Arab Oil Embargo and double-digit inflation in 1973/74 and at roughly the start of the marketing order program for advertising and promotion and the beginning of increasing levels of demand for dried apricots. An increase in dried apricot demand is suggested by the simultaneous increases in total U.S. per-capita consumption and deflated prices (see tables 1-3). The quadratic form of TC allows the trend slope to change as time moves forward. Alternative models with the dummy shifter D set at one in 1972 and 1974 (thus changing the starting value of TC) yielded estimates with larger variances.
In the light of this application in the study of French, Eryılmaz and Blackman, we
might have introduced the same piecewise linear-quadratic trend variable form in our
model. However as it is mentioned above, this trend variable form rests on a global
structural change in all world markets following Oil Crises of 1973. This event not
only accelerated primary product prices in parallel to higher world inflation but also
resulted in the collapse of the post-war system of international regulation, generated
large trade deficits (and large scale borrowing) for developing countries dependent
upon oil imports (Weeks, 1996). These devastating outcomes both weakened the
efficiency of inward-looking policies and sowed the seeds of post-1980 neo-liberal
policies. In addition to such an important occurrence, 1973 witnessed the start of
marketing order program for advertising and promotion acceleration in dried apricot
demand in the USA. In the light of all these factors using trend dummy variables
with the one measuring its alterations during post-1973 period may give consistent
results. However our data set used for dried fig estimation covers the period 1971-
2003 and only in the beginning of this period we did witness such an important event
like oil crisis. So we do not need to use trend dummy variables in our model.
Moreover usage of such variables seems to have lost its effectiveness in today’s
econometric analysis. As a result we introduce a general trend variable and also its
quadratic form (but not quadratic form of trend-dummy) so as to eliminate
immeasurable demand shift variables18.
18 Instead of vector of demand shifter (V...) we use variables T, C and T2.

31
Besides, instead of using trend-dummy we introduce an intercept dummy variable, so
as to measure outcomes of post-1980 policies, of the form C=0 prior to 1983 and
C=1 in 1983 and after.
The period between January 1980 and November 1983 is regarded as
‘stabilization and structural adjustment phase under taken by the government formed
under the auspices of the military regime’ (Öniş, 1991). Although the economic
characteristic of this period did not disappear until 1985, (Boratav, 1998), the period
after November 1983 ‘represented the attempts of a newly elected civilian
government to resume the stabilization effects of the previous three years’ (Öniş,
1986 pp.9). In addition to this period (1980-83), the period 1977-79 witnessed
balance of payments crisis with limits on growth process, stabilization packages in
conjunction with the IMF, and political instability. Finally in September 1980, the
democratic regime was collapsed and replaced by the military rule. In summary,
these two successive periods can be regarded as a transition from inward-looking
policies of 1960s and 70s into neo-liberal policies of post-1980 Özal decade. From
this transition period, the year 1983 is chosen as threshold19 for our model since
infrastructure of post-1980 reforms had been installed then and a new era for Turkish
economy had begun.
To sum up, the demand functions facing processors are expressed as the
following linear approximations:
(1*) PDF = B10 + B11DDFN + B12DMPN + B13DBFN + B14T + B15C + B16 T2 + u1
(2*) PPM = B20 + B21DDFN + B22DMPN + B23DBFN + B24T + B25C + B26T2 + u2
(3*) PBF = B30 + B31DDFN + B32DMPN + B33DBFN + B34T + B35C + B36T2 + u3
Where 1* = 1; 2* = 2 + 4; 3* = 3
19 But not a material threshold to affect slope term.

32
As far as market allocation side of apricot model is concerned; French, Eryılmaz,
and Blackman, 1991, were able to form a long run equilibrium relationship
measuring movements and carried over quantities in present and successive season
respectively. While imposing such a relationship they expressed price and cost
variables as year-to-year differences.
Similar to their approach, we are going to apply the same form to our model.
However, before this formulation we have to identify a crucial difference between
USA’s apricot and Turkish dried fig models. In the former model mainly the
domestic market was examined and the foreign channel entered just in supply side.
Hence all the effects of outside consumption were neglected and related quantity
deflation terms were applied only in the light of USA’s data20. On the other hand as
far as Turkish dried fig model is concerned the foreign markets constitute the main
branch of consumption. Hence especially in f.o.b. demand side all the necessary
deflation processes are performed in the light of foreign markets’ data. In this
respect; different from USA’s apricot model, in Turkish dried fig model a second
consumption channel is introduced as ‘domestic consumption’21. Hence in market
allocation side, so as to form a triple relationship between foreign quantity demand,
domestic supply and domestic consumption the deflation process is applied in the
light of Turkish data. Besides price variables are eliminated from market allocation
equations and final forms are represented as follows:
(4*) DDFN = B40 + B41.DDDFN + B42.∆CPD + B43.∆PGD + B44.TSN + u4
(5*) DMPN = B50 + B51.DDDFN + B52.∆CPMP + B53.∆PGMP + B54.TSN + u5
(6*) DBFN = B60 + B61.DDDFN + B62.∆CPB + B63.∆PGB + B64.TSN + u6
Where 4* = 5 , 5* = 6 + 8 , 6* = 7
20 Price and population data. 21 Export is surplus over domestic consumption.

33
In the domestic consumption equation (9) in model A, due to having no data
about domestic prices, PDDF indicates export prices. Although export and domestic
prices may differ substantially during marketing season, these prices do fluctuate in
the same band especially during first shipment periods due to presence of perfect
competition. As a result, due to lack of data, domestic price variable is replaced by
export price variable.
(7*) DDDFN = B70 + B71.PDDF + B72.TSN + u7
(8*) TSN = DDFN + DMPN + DBFN + DDDFN + M
Where 7* = 9 8* =10
The processed block simultaneous equation system consists of eight equations
where PDF, PPM, PBF, DDFN, DMPN, DBFN, TSN, and DDDFN are endogenous
and PDDF, ∆CPD, ∆PGD, ∆CPMP, ∆PGMP, ∆CPB, ∆PGB, M, T, C, T2 are
exogenous variables. These variables and their expected signs are presented in Table
5.1.1.
Table 5.1.1: Equations of Aegean Demand Model
Equations Endogenous variables Exogenous variables
Expected signs of
coefficients Model A
1* PDF DDFN,DMPN,DBFN,T,C,T2 -,-,-,+,?,? 2* PPM DDFN,DMPN,DBFN,T,C,T2 -,-,-,+,?,? 3* PBF DDFN,DMPN,DBFN,T,C,T2 -,-,-,+,?,? 4* DDFN DDDFN ,∆CPD,∆PGD,TSN -,-,-,+ 5* DMPN DDDFN ,∆CPMP,∆PGMP,TSN -,-,-,+ 6* DBFN DDDFN ,∆CPB,∆PGB,TSN -,-,-,+ 7* DDDFN PDDF,TSN -,+ 8* TSN DDFN,DMPN,DBFN,DDDFN,M

34
5.2) Raw Product Block Specifications (Model B)
Due to the same data structure as in Processed Product Block, the fig puree and
minced fig quantities are expressed as a single variable, QGMPN = QGFPN +
QGMFN . As a result the separate producer level minced fig demand equation (5) is
eliminated from the model B, and fig puree and minced fig equations are aggregated
into a single minced-puree component. (3) + (5) = 3*
As far as fresh fig market is concerned, the same form as in Processed Product
Block is included so as to enable accounting for demand shifts. So equation 1
becomes;
(1*) PGF = A10 + A11 QGFFN + A12 T + A13 T2 + A14 D + u1
Where D is 0 prior to 1985, 1 in 1985 and after. This dummy shifter D set at 1 in
1985 is included into the model so as to measure outcomes of technological
developments of 1980s and alternative years apart from 1985 resulted in estimates
with higher variances. Moreover 1985 is the date when the effects of policy change
in 1983 began to be reflected in producers’ side.
In the previous sections many factors, which affect producer-processor
bargaining structure, were presented. In the light of outcomes of these factors apart
from quantity purchased for processing, change in lagged processed product per
capita movement, and the previous-period price relative to processing costs22 turn
out to be main variables in producer-processor bargaining structure. As a result,
(2*) PGD = A20 + A21 QGDFN + A22 RPDL + A23 ∆DDFNL + A24 D + u2
Where D is 0 prior to 1985, 1 in 1985 and after when the outcomes of early 1980s’
policies began to affect producer market.
(3*) PGMP = A30 + A31 QGMPN + A32 RPMPL + A33 ∆DMPNL + A34 D + u3
22 RPDL, RPMPL and RPBFL are indicators of processor profitability. Hence RP.. and ∆D.. will be used instead of V.. which is vector of variables that reflect both producer and processor expectations of demand and profitability of processed products.
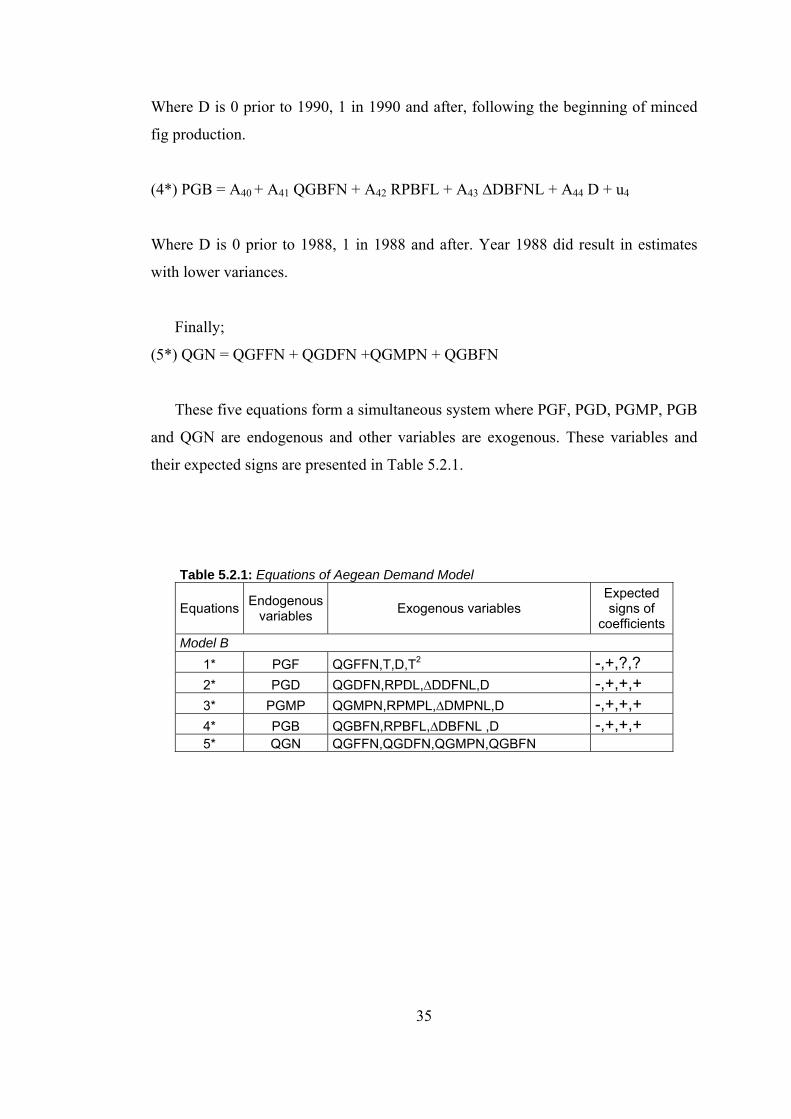
35
Where D is 0 prior to 1990, 1 in 1990 and after, following the beginning of minced
fig production.
(4*) PGB = A40 + A41 QGBFN + A42 RPBFL + A43 ∆DBFNL + A44 D + u4
Where D is 0 prior to 1988, 1 in 1988 and after. Year 1988 did result in estimates
with lower variances.
Finally;
(5*) QGN = QGFFN + QGDFN +QGMPN + QGBFN
These five equations form a simultaneous system where PGF, PGD, PGMP, PGB
and QGN are endogenous and other variables are exogenous. These variables and
their expected signs are presented in Table 5.2.1.
Table 5.2.1: Equations of Aegean Demand Model
Equations Endogenous variables Exogenous variables
Expected signs of
coefficients Model B
1* PGF QGFFN,T,D,T2 -,+,?,? 2* PGD QGDFN,RPDL,∆DDFNL,D -,+,+,+ 3* PGMP QGMPN,RPMPL,∆DMPNL,D -,+,+,+ 4* PGB QGBFN,RPBFL,∆DBFNL ,D -,+,+,+ 5* QGN QGFFN,QGDFN,QGMPN,QGBFN
36
CHAPTER 6
ESTIMATION METHOD AND RESULTS
As we can see from Tables 5.1.1 and 5.1.2, in our simultaneous system, Model A
and Model B consist of eight and five equations respectively. The main characteristic
property of the system is that the endogenous variables which are determined in
Model B join into the Model A as exogenous variables. In this respect, our Aegean
Demand Model can be estimated by using some special methods. The method of
two-stage least squares (2-SLS) is the most common method used for estimating
simultaneous-equations models. In addition to this, Full-Information and Limited-
Information Maximum Likelihood Methods can also be used for estimating
simultaneous equations (Greene, 2003).
As the estimates of parameters may be sensitive to estimation methods and model
specifications, using more than one method in estimation of equation systems helps
us to obtain comparable results (French, Eryilmaz and Blackman, 1991). Besides so
as to reach the most efficient results, the complete simultaneous solution of equations
is needed. However in Aegean Demand Model due to alterations in deflation
process23, respecification of equations24 and structural deficiencies separate
individual systems are formed like those in apricot model. ‘…In view of these
results, the processed product demand functions were respecified with the cross-
product terms deleted. With this specification, the canned-frozen and dried apricot
equations form separate simultaneous systems’ (French, Eryilmaz and Blackman,
1991, pp.353). Likewise in addition to the structural factors given in Chapter 5.1,
deletion of variables which are key elements of simultaneous structure result in
formation of separate individual systems in both Model A and Model B. For instance
in Processed Product Block (Model A) equation 3* cannot be explained by variables
23 In first three equations of Model A, quantity and price values are deflated according to importers’ countries data. On the other hand in other equations Turkish data are used. Hence in estimation results Nt is used instead of N where necessary. See Chapter 5.1.
24 For instance, price variables are dropped from equations 4,5,6 in Model A. Cross product term, DMPN, is dropped from equation 1 and 3 in Model A.....

37
DDFN (Turkey marketing year dried fig exports expressed relative to importer
countries populations) and DMPN (Turkey marketing-year fig puree-minced fig
exports expressed relative to importer countries populations). As given in Chapter
2.1, ‘sarilop’ is the only fresh fig variety which is eligible for dried figs production.
However in Raw Product Block (Model B) separate ‘sarilop’ export values are not
available and total fresh fig export values are used for equation 1*. As a result the
quantity relationship between fig products which is represented by equation 5* in
Model B gains a separate structure. In the light of these specifications, data limitation
problems and other structural factors in both Model A and Model B, all equations are
estimated individually by using Ordinary Least Squares estimation method. As given
in previous chapters the data set used for this estimation covers the period 1971-
2003. However one observation is lost in equations 4*, 5* and 6* of Model A and in
equations 2*, 3*, and 4* of Model B due to change and lagged variables respectively.
Although this factor aggravates our small sample size problem, we successfully
applied Ordinary Least Squares technique to estimate our models and estimation
results are presented and evaluated in the following chapters.
6.1) Processed Product Block Estimates
In equations (1*) and (3*) the cross coefficient DMPN is near 0 and not
statistically significant. Moreover even in equation (2*) DMPN is near 0 and not
statistically significant. On the other hand in equation (3*) the cross coefficient
DDFN is near 0 and statistically insignificant. In the light of these results, the
processed product demand functions are respecified with both the cross-product
terms deleted from equation (3*) and the cross-product term, DMPN, deleted from
equation (1*) and finally from equation (2*). The following estimates are obtained,
(1*) PDF = 3.9723 - 4.3887(DDFN) - 2.0157(DBFN) + 0.213(T) - 1.5399(C) - 0.00454(T2)
t-value (9.21) (-5.73) (-4.18) (6.80) (-6.72) (-6.19)
σ (0.431) (0.765) (0.482) (0.031) (0.228) (0.0007)
SSR=2.0818 R2=0.79431 DW= 2.0360

38
(2*) PPM = 2.0734 - 2.1711(DDFN) - 1.2975(DBFN) + 0.0881(T) - 0.79134(C) - 0.00175(T2)
t-value (5.49) (-3.24) (-3.07) (3.21) (-3.95) (-2.73)
σ (0.377) (0.669) (0.421) (0.027) (0.2) (0.0006)
SSR=1.5935 R2= 0.57685 DW=1.9065
(3*) PBF = 0.47025 - 0.67098(DBFN) + 0.00228(T) - 0.2345(C) + 0.00022(T2)
t-value (6.29) (-3.43) (0.17) (-2.52) (0.74)
σ (0.074) (0.195) (0.012) (0.093) (0.00029)
SSR=0. 36232 R2=0.47241 DW=1.8116
As far as the results of the ‘dried fig’ component are concerned, we observe that
all coefficients are large enough relative to their standard errors and are of expected
signs including the cross-product term25. With regard to trend variables, T and T2, we
observe an upward trend but in decreasing rate with a significant effect of policy
shift of 1983. Regarding puree-minced component, both DDFN and DBFN variables
turn out to be better predictor of puree-minced price. Similar to equation (1*), in
equation (2*) trend variables indicate an upward trend but in a decreasing rate with a
considerable effect of post-1980 policy shift. In equation (3*) all coefficients are
large enough relative to their standard errors apart from trend variables which
indicate no alteration in the level of demand during whole period. Similar to previous
equations, the 1983’s policy shift maintains its effect also in bruised fig component.
(4*) DDFNt = 0.16882 - 0.50382(DDDFNt) - 0.0108(∆CPD) - 0.0311(∆PGD) + 0.55371(TSNt)
t-value (3.49) (-4.04) (-0.13) (-0.70) (8.13)
σ (0.048) (0.124) (0.081) (0.044) (0.068)
SSR=0.062745 R2=0.76419 DW=1.816
25The results can be compared with expected signs of coefficients given in the Tables 5.1.1 and 5.2.1.

39
(5*) DMPNt=0,04018 -0.093305(DDDFNt) -0.04495(∆CPMP) + 0.2227(∆PGMP) + 0.10157(TSNt)
t-value (1.44) (-1.291) (-1.43) (1.82) (2.57)
σ (0.027) (0.072) (0.031) (0.122) (0.039)
SSR=0.020698 R2=0.32112 DW=1.1787
(6*) DBFNt = -0.22918 - 0.45065(DDDFNt) - 0.46356(∆CPB) - 0.0024(∆PGB) + 0.3767(TSNt)
t-value (-5.44) (-4.15) (-2.21) (-0.01) (6.29)
σ (0.042) (0.108) (0.208) (0.139) (0.598)
SSR=0.044919 R2=0.63705 DW=2.4070
(7*) DDDFNt = -0.38423 + 0.071953(PDDF) + 0.4425(TSNt)
t-value (-6.45) (3.90) (9.62)
σ (0.595) (0.018) (0.045)
SSR=0.1031 R2=0.78628 DW=2.33
As far as the ‘dried fig’ market allocation equation (4*) is concerned we observe
that more than half of the total supply has been channeled into foreign ‘dried fig’
market under constant domestic consumption, raw product and cost prices (ceteris
paribus). Note that both price and cost change coefficients are insignificant in spite
of their expected signs. This could be due to the small sample size. Regarding puree-
minced market allocation equation (5*), it is found that apart from total supply
variable the coefficients of all other variables are not different from 0 and the
estimation results have very low explanatory power with autocorrelation problem. As
far as the results of bruised fig market allocation equation (6*) are concerned all the
coefficients apart from raw product price change coefficient turn out to be large
enough relative to their standard errors and are of expected signs. Finally results of
domestic consumption equation (7*) imply that all of the coefficients, except price
coefficient, are of expected signs and are statistically significant. Besides with
constant prices, more than 44% of total supply is channeled into domestic markets.
The results are also presented in the Table 6.1.1.
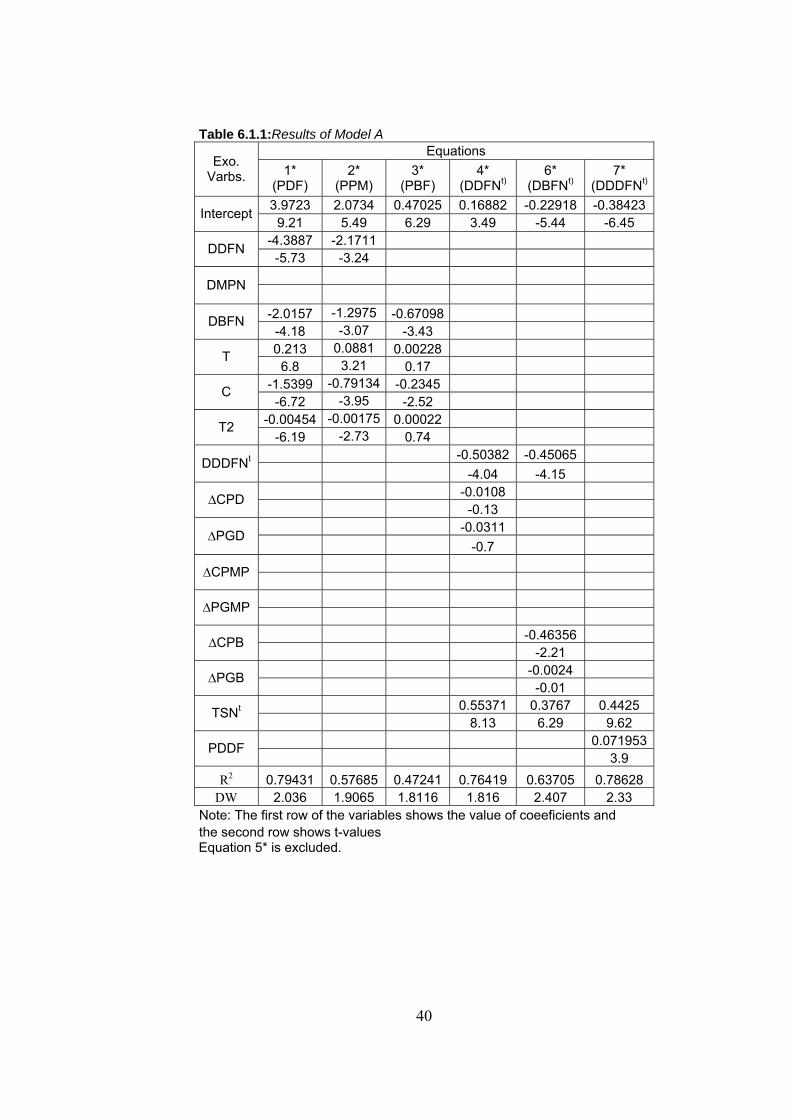
40
Table 6.1.1:Results of Model A Equations
Exo. Varbs. 1*
(PDF) 2*
(PPM) 3*
(PBF) 4*
(DDFNt) 6*
(DBFNt) 7*
(DDDFNt) 3.9723 2.0734 0.47025 0.16882 -0.22918 -0.38423 Intercept
9.21 5.49 6.29 3.49 -5.44 -6.45 -4.3887 -2.1711 DDFN
-5.73 -3.24 DMPN
-2.0157 -1.2975 -0.67098 DBFN -4.18 -3.07 -3.43 0.213 0.0881 0.00228 T
6.8 3.21 0.17 -1.5399 -0.79134 -0.2345 C
-6.72 -3.95 -2.52 -0.00454 -0.00175 0.00022 T2
-6.19 -2.73 0.74 -0.50382 -0.45065 DDDFNt -4.04 -4.15 -0.0108 ∆CPD -0.13 -0.0311 ∆PGD -0.7 ∆CPMP ∆PGMP -0.46356 ∆CPB -2.21 -0.0024 ∆PGB -0.01 0.55371 0.3767 0.4425 TSNt 8.13 6.29 9.62 0.071953 PDDF 3.9
R2 0.79431 0.57685 0.47241 0.76419 0.63705 0.78628 DW 2.036 1.9065 1.8116 1.816 2.407 2.33
Note: The first row of the variables shows the value of coeeficients and the second row shows t-values
Equation 5* is excluded.

41
6.2) Raw Product Block Estimates
The estimation results are given in the Table 6.2.1. When we look at coefficient
of determination values, it is clear that all equations leave some amount of price
variation unexplained. More specifically, firstly, the results of fresh fig equation’s
(1*) estimates indicate that the quantity and the trend variable coefficients are not of
theoretically expected signs. Besides fresh fig equation has the lowest coefficient of
determination value of the Block which shows that the regressors do not explain the
regressand very well. This could be due to the weaker structure of fresh fig market
compared to dried fig market and due to the factors given in the previous section.
(1*) PGF = 0.41009 + 6.0838 (QGFFN) – 0.029787 (T) + 0.0004163 (T2) + 0.171(D)
t-value (8.33) (1.87) (-3.63) (2.44) (3.19)
σ (0.049) (3.25) (0.008) (0.0001) (0.053)
SSR=0.15419 R2 = 0.38172 DW = 1.4896
Secondly, as far as dried fig equation is concerned, all coefficients apart from D
are large enough relative to their standard errors and are of the theoretically expected
signs.
(2*) PGD = 2.3202 – 2.9197 (QGDFN) + 0.1456 (RPDL) + 2.0874 (∆DDFNL) + 0.289 ( D)
t-value (4.22) (-5.28) (2.93) (3.28) (1.51)
σ (0.549) (0.552) (0.049) (0.635) (0.19)
SSR=1.8431 R2 = 0.71975 DW = 1.2344
Thirdly, in equation (3*) only the ‘RPMPL’ and ‘D’ coefficients are large
relative to their standard errors and are of the theoretically expected signs.
(3*) PGMP = 0.066 + 0.114 (QGMPN) + 0.023 (RPMPL) – 0.0899 (∆DMPNL) + 0.966 (D)
t-value (1.39) (0.35) (2.14) (-0.29) (5.21)
σ (0.047) (0.325) (0.01) (0.308) (0.018)
SSR=0.54809 R2 = 0.53247 DW = 1.8258

42
(4*) PGB = 0.134 – 0.342 (QGBFN) + 0.0034 (RPBFL) + 0.163 (∆DBFNL) + 0.0754 (D)
t-value (3.15) (-1.72) (0.26) (0.99) (3.26)
σ (0.042) (0.197) (0.0132) (0.163) (0.0231)
SSR=0.066379 R2 = 0.56284 DW = 1.5685
Lastly, regarding bruised fig equation, although all coefficients are of
theoretically expected signs; apart from D, they are not statistically significant due to
small sample problem.
Table 6.2.1: Results of Model B Equations
Exo. Varbs. 1*
(PGF) 2*
(PGD) 3*
(PGMP) 4* (PGB)
0.41009 2.3202 0.066 0.134 Intercept 8.33 4.22 1.39 3.15
6.0838 QGFFN 1.87
-2.9197 QGDFN -5.28 0.114 QGMPN 0.35 -0.342 QGBFN -1.72 -0.02979 T
-3.63 0.171 0.289 0.966 0.0754 D
3.19 1.51 5.21 3.26 0.000416 T2
2.44 0.1456 RPDL 2.93 0.023 RPMPL 2.14 0.0034 RPBFL 0.26 2.0874 ∆DDFNL 3.28 -0.0899 ∆DMPNL -0.29 0.163 ∆DBFNL 0.99
R2 0.38172 0.71975 0.53247 0.56284 DW 1.4896 1.2344 1.8258 1.5685
Note: The first row of the variables shows the value of coefficients and the second row shows t-values.

43
CHAPTER 7
ELASTICITY EVALUATIONS
Although we are unable to obtain simultaneous solution of our equation system,
it is possible to find elasticity values for our individual equations. Among these
equations, foreign demand equations facing Turkish processors turn out to be the
most important equations as marketing capability of Turkish dried fig products
depends mainly on foreign selling opportunities. In this respect Table 7.1 presents
price elasticities for both year 2000 and mean values of prices and quantities for
demand equations of dried fig products. When we analyze the elasticity values
computed at mean and year 2000 values26, we see that although elasticities differ in
magnitude, their structure does not show any change from being inelastic to elastic
and vice versa. As far as the elasticities corresponding to Processed Product Block
(Model A) are concerned, the inelastic values (in absolute term) computed at year
2000 values turn out to be lower than the ones computed at the mean values. On the
other hand, the elastic values (in absolute term) computed at year 2000 values turn
out to be higher than the values computed at the mean values. As to the Raw Product
Block (Model B), unlike Model A, inelastic value computed at year 2000 values
becomes more inelastic when computed at the mean values. The elastic value
computed at year 2000 values turn out to be less elastic when computed at the mean
values.
In the light of the results presented in the Table 7.1 it is seen that at year 2000
and mean values the own-price elasticity of dried fig is equal to -0.5942 and -0.835
respectively. In other words, foreign import demand elasticity of Turkish dried fig
shows an inelastic structure. Due to having no findings of an early study about dried
fig elasticity evaluations unfortunately we are unable to evaluate the validity of our
results objectively. However since Turkey is regarded as the most important dried
figs supplier country in the world, inelastic foreign demand structure is not an
unexpected result. Actually our findings considerably support this reality. On the 26 In computation of elasticity aggregates price and quantity values are used.

44
other hand, in producer level, the own-price elasticity of dried fig computed at year
2000 and mean values is equal to -0.6183 and -0.4427 respectively. These results
indicate that the inelastic structure of processed product demand is also reflected in
raw product demand. In Chapter 3.2 we have already mentioned that level of price
elasticity of processed product affects producer-processor bargaining structure.
Finally this relationship also emerged in evaluation of elasticity aggregates. Similar
to own-price elasticity values, the cross price elasticity of dried fig with respect to
puree-minced fig price computed at year 2000 and mean values is equal to -0.5084
and -0.8025 respectively. These results indicate that even puree-minced fig
component which may be the most probable substitute for dried fig has
complementary structure and variations in price of puree-minced fig cannot affect
dried fig quantity demand in considerable magnitudes.
Table 7.1: Elasticities e
processed 2000
prices mean
DDFN - PDF -0.5942 -0.835DBFN - PBF -13.6239 -6.6445DBFN - PDF -23.5095 -12.2699DDFN - PPM -0.5084 -0.8025DBFN - PPM -15.6494 -9.0579raw QGDFN - PGD -0.6183 -0.4427QGBFN - PGB -30.581 -8.4889
As opposed to dried fig, the own-price elasticity of bruised fig27 computed at
year 2000 and mean values is equal to -13.6239 and -6.6445 respectively. At
producer-level these values are equal to -30.581 and -8.4889 at year 2000 and mean
values. Since bruised fig has not a direct consumption channel and it is usually
utilized in alcohol industry, foreign demanders are very sensitive to price variations.
Like in two blocks of dried fig market, in two blocks of bruised fig market the
27 This also means foriegn import demand elasticity of bruised fig.

45
demand structure of one side is also highly reflected in other side and producers
experience more elastic demand. The cross-price elasticity of bruised fig with respect
to dried fig price at year 2000 and mean values is equal to -23.5095 and -12.2699
respectively. Besides the cross-price elasticity of bruised fig with respect to puree-
minced price computed at year 2000 and mean values is equal to -15.6494 and -
9.0579. The higher effect of dried fig price on bruised fig demand may be attributed
to reference price structure of dried fig in price adjustments of fig products. In fig
products market, dried fig price is formed first and later other product prices adjust
according to dried fig price. As the results of cross-price elasticities of our model
support this reality, the price adjustments of fig products happen in the same
direction. To sum up, all these findings support the presence of complementary
structure in fig products market.

46
CHAPTER 8
CONCLUSIONS AND COMMENTS
In this dissertation we analyzed the extent of relationship between production,
processing and marketing structures of fig products in Turkey. At first sight,
although this study seems to consist of basic information peculiar to Turkey, the
findings may be very beneficial also for all interest groups outside Turkey. This is
due to the fact that Turkey is the leader country in world fig products market and any
fundamental peculiar to Turkey is also valid for world market. It is therefore that in
Chapter 2 we focused on world production and trade patterns in detail with putting
more emphasis on Turkey since it has the largest export share in the world market. In
the following chapter, Turkish fig products market is divided into two simultaneous
system as Processed Product Block (Model A) and Raw Product Block (Model B).
Later the structure of data used in the study is outlined and in the light of data
limitations and structural deficiencies, specifications are redefined in Chapters 4 and
5 respectively. Finally by using Ordinary Least Squares estimation method an
econometric analysis is applied to compute elasticity values of fig products in
Chapter 6. The data set used in this econometric analysis covers the period 1971-
2003. In the light of the estimation results given in Chapter 6, we conclude that most
of the coefficients are statistically significant and the coefficient signs are consistent
with both theoretical and practical expectations. It should be noted that as far as
coefficient of determination values of equations are concerned, one may conclude
that estimation results of Aegean Demand Model leaves some amount of price and
quantity variation unexplained. However those low coefficient of determination
values may be attributed to small sample size problem and specification errors in the
model.
Regarding elasticity values computed at both year 2000 and mean quantities and
prices we can conclude that the demand facing Aegean dried fig processors is
inelastic. Similarly, at producer-level, the demand facing Aegean dried fig producers
is also inelastic. On the other hand the price response of bruised fig demand equation

47
shows highly elastic structure so does producer-level demand equation. Besides cross
price elasticity of bruised fig demand equation indicates presence of complementary
and elastic structure in both dried fig – bruised fig and minced-puree – bruised fig
products. Regarding the cross price elasticity in dried fig equation we again observe
a complementary but this time inelastic structure in dried fig – minced-puree
products.
This study provides a detailed examination of export channel of Turkish dried fig
products and raw dried fig product channel. This study also finds evidence of
insufficiency of Aegean Demand Model in fully explaining domestic consumption,
fresh fig and other raw dried fig products. This finding cannot be regarded as fully
surprising and is attributed to following factors. Firstly, a considerable part of
Turkish economy is defined as unregistered. This directly results in distortions of
domestic final and raw products prices. Even in registered part of the economy, due
to having large scale indirect tax structure in Turkey, the registered price and
quantity values are distorted. Hence data problem emerges and this creates
unexplained price and quantity variations in econometric analysis. Secondly, in
addition to registered-unregistered structures of foreign and domestic markets,
insufficient controls of farm and non-farm production and processing activities in
domestic market creates a second diversion between these two markets. In case of
data problem, using of foreign values as an indicator in domestic market evaluations,
under the assumption of perfect competition structure, may necessitate new
calculations the extent of which are not certain. As a result creating new data at farm
and processor level may cause subjective calculations and results. Thirdly, as
explained in previous sections, fig tree and its fruit are very sensitive biological
plants. Any unexpected weather conditions may result in quality deterioration which
later creates alteration in demand relationships of fig products. Hence this
econometric analysis may not be capable of describing these kinds of sensitive
factors. Lastly, in addition to these basic factors, unexplained price and quantity
variations can also be resulted from any activities such as alterations in views of
political authority on agriculture sector, alterations in consumer habits, technological
improvements in the sector and level of optimism or pessimism of processors and
producers.
48
Although Aegean Demand Model contains unexplained parts and structural
deficiencies, nearly all basic information about the demand structure for Turkish fig
products are given in this study. Considering the fact that this study is the first on fig
market of Turkey we believe that the detailed analysis of fig market presented here
and computed elasticities may be useful for all interest groups. It is important to note
that firm level voluntary export quotas (so as to prevent new entrance to the export
market) have been imposed on Turkish dried fig processors showing presence of
policy shifts in this market. Moreover, Turkey started the accession negotiations with
European Union. Fig products market is one of the important sectors in which
Turkey may have an impact on accession negotiations in agriculture. Our findings
provide useful information that can be helpful in these negotiations and in forming of
new policies.

49
REFERENCES
1) Aegean Exporters’ Associations, Various Documents, Department of Dried Fruits, Izmir
2) Ağaoğlu, Y.S. (1993) [Horticulture Sub Sector Review], Department of
Horticulture Faculty of Agriculture, University of Ankara, 4 3) Ben C. French, Ali Eryilmaz, and Kathryn Blackman (1991) Estimates of
Demand Relationships for Apricots and Apricot Products, Western Journal of Agricultural Economics, Western Agricultural Economics Association, 16(2): 345-359
4) Boratav, K. (1998), Türkiye İktisat Tarihi 1908-1985.Altıncı Basım. İstanbul:
Gerçek Yayınevi 5) FAO Stat: <http://apps.fao.org/page/collection?subset=agriculture> 21.
November. 2004 6) Greene, W.H. (2003), Econometric Analysis, 5th edn, NJ: Prentice Hall 7) Kabasakal, A. (1990) İncir Yetiştiriciliği, Tarımsal Araştırmaları Destekleme ve
Geliştirme Vakfı, Yalova 8) Krueger, A. O. (1974) The Turkish Economy and its Growth: an Overview,
Chapter 1, in A.O. Krueger, Foreign Trade Regimes & Economis Development Turkey, NABER, Columbia University Press, New York, pp.3-26
9) Öniş, Z. (1986) Stabilization and Growth in a Semi-Industrial Economy: An
Evaluation of the Recent Turkish Experiment, 1977-1984. Metu Studies in Development. Special Issue Vol. 12, No. 1-2
10) Öniş, Z. (1991) Political Economy of Turkey in the 1980s. The State and
Economic Interest Groups: The Post – 1980 Turkish Experience. pp 27-40 11) State Institute of Statistics, Republic of Turkey (1997) Agricultural Structure,
Ankara: State Institute of Statistics 12) Weeks, J. (1995) Did the Dog Bark? The NEM and the Manufacturing Sector.
Mimeo. Center for development Studies School of Oriental and African Studies, London.

50
APPENDICES
APPENDIX A
PROCESSING COSTS of FIRMS LOCATED in IZMIR-AYDIN REGION
Table A.1 F.O.B. Costs of Dried Fig (lerida 10kg box) in 1992/93
season
Cost Items Cost Levels (TL/kg)
Commission 75 Local transportation (labor) 50 Medication 15 Labor (in processing) 1,800 Water 20 Electricity 25 Painting 25 Fuel oil 30 Box 300 Box nailing 60 Strand 55 Nail 25 Paper 70 Transportation of labors 150 Renting 100 Transportation to harbor 25 Loading in Harbor 25 Duty commission 20 Bill of lading 10 Union registration 15 Laboratory costs 30 Agriculture controls 20 Finance of V.A.T. for 3 months 30 Mail costs 50 Stationary 50 Travel costs 30 Salaries of employees 140 Interest costs for 2 months (5%) 1,100 Bank commission (5%) 60 Depreciation 50 Insurance 10 Others 670 Total: 5,135 TL/ kg
Source: Aegean Exporters’ Associations

51
APPENDIX B
TARIS’s SHARE in DRIED FIG EXPORT of TURKEY
Table B.1
Season Taris Export/Total Export (%)
Taris Export Value/Total Export Value (%)
1993/94 5.12 4.78 1994/95 5.08 4.78 1995/96 5.53 5.4 1996/97 3.69 3.99 1997/98 3.21 4.03 1998/99 4.35 4.99

52
APPENDIX C
DEFLATED EXPORT QUANTITIES of FIG PRODUCTS of TURKEY
Table C.1 season DDFN DMPN DBFN
1971/72 0.5362 0.0403 0.13901972/73 0.5754 0.0646 0.21391973/74 0.4911 0.0513 0.07641974/75 0.5303 0.0369 0.06851975/76 0.4503 0.0301 0.08811976/77 0.5118 0.0623 0.12341977/78 0.4477 0.0468 0.07441978/79 0.5884 0.0614 0.14101979/80 0.5974 0.0438 0.06481980/81 0.5361 0.0503 0.07311981/82 0.6911 0.0462 0.05481982/83 0.6040 0.0489 0.69181983/84 0.5904 0.0515 0.17961984/85 0.6685 0.0456 0.04861985/86 0.6955 0.0416 0.08621986/87 0.6993 0.0515 0.06931987/88 0.6057 0.0509 0.06261988/89 0.6823 0.0482 0.05591989/90 0.5431 0.0554 0.04421990/91 0.5255 0.0443 0.05761991/92 0.5401 0.0699 0.05451992/93 0.4412 0.0584 0.03391993/94 0.5286 0.0810 0.03461994/95 0.6000 0.0864 0.04301995/96 0.6198 0.0585 0.04331996/97 0.6187 0.0429 0.05251997/98 0.5844 0.0426 0.04721998/99 0.6457 0.0413 0.03161999/00 0.6747 0.0511 0.03212000/01 0.6474 0.0654 0.03522001/02 0.5903 0.0601 0.02032002/03 0.6360 0.0708 0.01722003/04 0.6185 0.0286 0.0074

53
APPENDIX D
DEFLATED EXPORT PRICES of FIG PRODUCTS of TURKEY
Table D.1 season PDF PPM PBF
1971/72 1.2263 0.4459 0.22671972/73 1.4025 0.7283 0.29121973/74 2.4121 1.3596 0.55341974/75 2.7820 1.3600 0.56231975/76 2.6330 1.2182 0.42751976/77 2.7075 1.4292 0.40531977/78 2.6822 1.5373 0.40701978/79 2.7082 1.4176 0.29051979/80 3.3979 1.8938 0.73591980/81 2.9976 1.0988 0.40641981/82 2.0873 0.8618 0.32251982/83 1.8562 0.6781 0.12431983/84 1.3763 0.5431 0.11411984/85 1.5435 0.6571 0.39691985/86 1.4363 0.6496 0.26821986/87 1.3628 0.6141 0.21261987/88 1.6494 0.7853 0.33481988/89 1.7652 0.7238 0.28601989/90 2.2105 1.1322 0.30011990/91 2.7615 1.3247 0.39931991/92 2.7314 1.2532 0.39071992/93 3.0235 1.3010 0.37231993/94 2.3350 1.1320 0.37111994/95 2.0890 0.4780 0.39051995/96 2.3220 1.2228 0.47721996/97 2.2008 1.2094 0.46671997/98 1.9510 0.9604 0.32291998/99 2.0733 1.1411 0.46021999/00 1.8057 0.9580 0.38572000/01 1.6884 0.7146 0.32162001/02 1.7354 0.8385 0.31672002/03 2.0381 0.9836 0.67232003/04 1.7858 0.9987 0.7499

54
APPENDIX E
DEFLATED PROCESSING COSTS of FIG PRODUCTS
Table E.1 season CPD CPMP CPB
1971/72 0.2657 0.2689 0.10471972/73 0.2380 0.2600 0.15171973/74 0.4399 0.3410 0.23861974/75 0.4561 0.4775 0.21971975/76 0.3800 0.4532 0.16461976/77 0.3923 0.4503 0.15161977/78 0.4902 0.5748 0.13731978/79 0.4283 0.5232 0.10771979/80 0.4588 0.4848 0.14121980/81 0.4898 0.5142 0.14261981/82 0.4697 0.4776 0.11981982/83 0.5098 0.4919 0.07201983/84 0.5192 0.5012 0.06321984/85 0.5923 0.6494 0.14331985/86 0.4831 0.6381 0.14491986/87 0.5009 0.5951 0.16741987/88 0.5313 0.5978 0.18181988/89 0.6284 0.6680 0.20291989/90 0.6192 0.7163 0.18421990/91 0.6404 0.7446 0.15411991/92 0.6914 0.7928 0.16451992/93 0.8386 0.8911 0.15021993/94 0.6487 0.7380 0.15061994/95 0.8426 0.2967 0.22951995/96 0.7374 0.8752 0.22051996/97 0.6739 0.8340 0.20251997/98 0.6895 0.7457 0.16691998/99 0.6465 0.7255 0.16991999/00 0.6149 0.6568 0.16152000/01 0.5746 0.5179 0.13002001/02 0.9076 0.9435 0.21392002/03 0.6913 0.7156 0.20352003/04 0.4311 0.4779 0.1339

55
APPENDIX F
DEFLATED RAW PRODUCT PRICES of FIG PRODUCTS
Table F.1 season PGD PGMP PGB PGF
1971/72 0.2065 0.0984 0.0715 0.5366 1972/73 0.2550 0.0964 0.0806 0.4074 1973/74 0.3405 0.1190 0.0768 0.1491 1974/75 0.4371 0.1330 0.1257 0.3327 1975/76 0.5734 0.1546 0.1526 0.2860 1976/77 1.0339 0.2256 0.1460 0.2522 1977/78 1.1489 0.2003 0.1398 0.2140 1978/79 1.0431 0.1652 0.0948 0.1881 1979/80 0.9733 0.1990 0.1735 0.1166 1980/81 0.6135 0.1589 0.1617 0.1426 1981/82 0.6255 0.1454 0.1198 0.1492 1982/83 0.5318 0.0962 0.0628 0.1770 1983/84 0.5245 0.0929 0.0612 0.2370 1984/85 0.4521 0.0955 0.1238 0.2602 1985/86 0.3971 0.0668 0.0757 0.2046 1986/87 0.3933 0.0769 0.0810 0.2818 1987/88 0.6786 0.1224 0.1273 0.2829 1988/89 0.8034 0.1219 0.1502 0.2896 1989/90 0.8740 0.1212 0.1259 0.2674 1990/91 1.0126 0.1556 0.1865 0.2892 1991/92 1.4818 0.2346 0.2040 0.3443 1992/93 1.5964 0.2010 0.1975 0.2876 1993/94 1.5132 0.1982 0.1980 0.3215 1994/95 1.7927 0.1366 0.1944 0.3521 1995/96 1.8554 0.2962 0.3309 0.3435 1996/97 1.6382 0.2891 0.2976 0.3493 1997/98 1.4642 0.1885 0.1595 0.4046 1998/99 1.2153 0.2059 0.2365 0.3094 1999/00 1.1722 0.2026 0.1745 0.2665 2000/01 1.0555 0.1478 0.1566 0.2416 2001/02 1.2181 0.2360 0.2198 0.3682 2002/03 1.3879 0.2879 0.3238 0.2159 2003/04 0.7394 0.1842 0.2178 0.2254
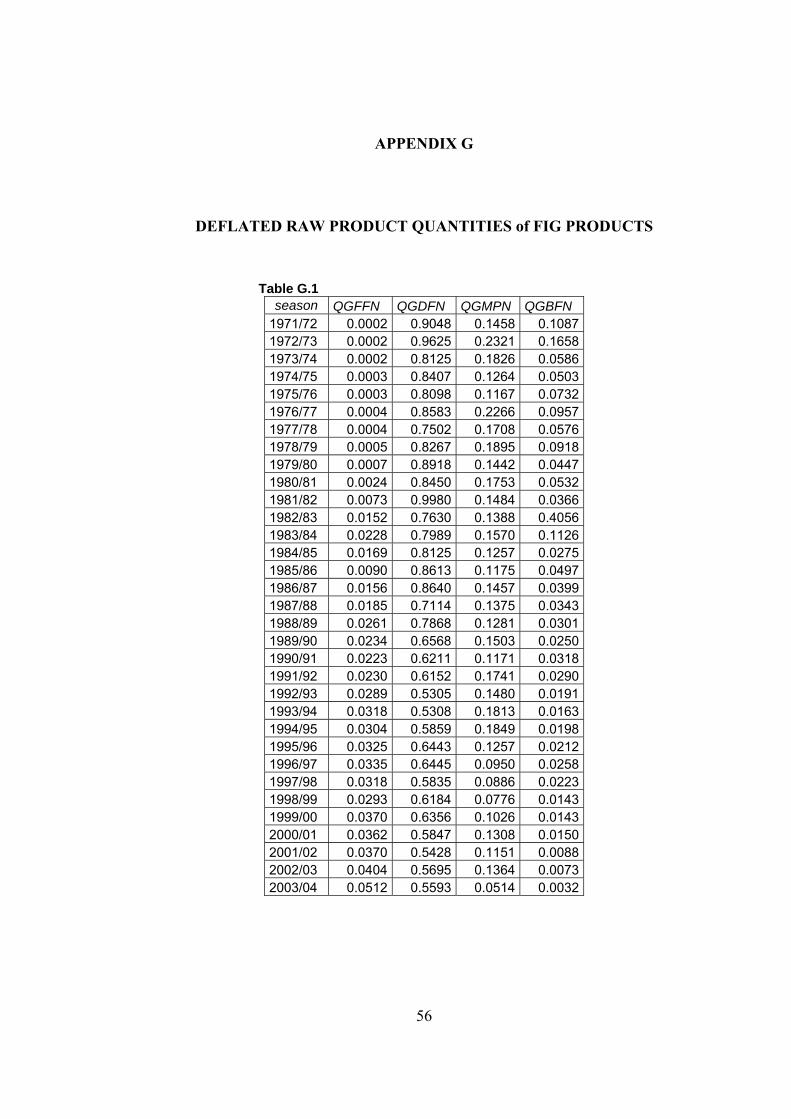
56
APPENDIX G
DEFLATED RAW PRODUCT QUANTITIES of FIG PRODUCTS
Table G.1 season QGFFN QGDFN QGMPN QGBFN
1971/72 0.0002 0.9048 0.1458 0.1087 1972/73 0.0002 0.9625 0.2321 0.1658 1973/74 0.0002 0.8125 0.1826 0.0586 1974/75 0.0003 0.8407 0.1264 0.0503 1975/76 0.0003 0.8098 0.1167 0.0732 1976/77 0.0004 0.8583 0.2266 0.0957 1977/78 0.0004 0.7502 0.1708 0.0576 1978/79 0.0005 0.8267 0.1895 0.0918 1979/80 0.0007 0.8918 0.1442 0.0447 1980/81 0.0024 0.8450 0.1753 0.0532 1981/82 0.0073 0.9980 0.1484 0.0366 1982/83 0.0152 0.7630 0.1388 0.4056 1983/84 0.0228 0.7989 0.1570 0.1126 1984/85 0.0169 0.8125 0.1257 0.0275 1985/86 0.0090 0.8613 0.1175 0.0497 1986/87 0.0156 0.8640 0.1457 0.0399 1987/88 0.0185 0.7114 0.1375 0.0343 1988/89 0.0261 0.7868 0.1281 0.0301 1989/90 0.0234 0.6568 0.1503 0.0250 1990/91 0.0223 0.6211 0.1171 0.0318 1991/92 0.0230 0.6152 0.1741 0.0290 1992/93 0.0289 0.5305 0.1480 0.0191 1993/94 0.0318 0.5308 0.1813 0.0163 1994/95 0.0304 0.5859 0.1849 0.0198 1995/96 0.0325 0.6443 0.1257 0.0212 1996/97 0.0335 0.6445 0.0950 0.0258 1997/98 0.0318 0.5835 0.0886 0.0223 1998/99 0.0293 0.6184 0.0776 0.0143 1999/00 0.0370 0.6356 0.1026 0.0143 2000/01 0.0362 0.5847 0.1308 0.0150 2001/02 0.0370 0.5428 0.1151 0.0088 2002/03 0.0404 0.5695 0.1364 0.0073 2003/04 0.0512 0.5593 0.0514 0.0032
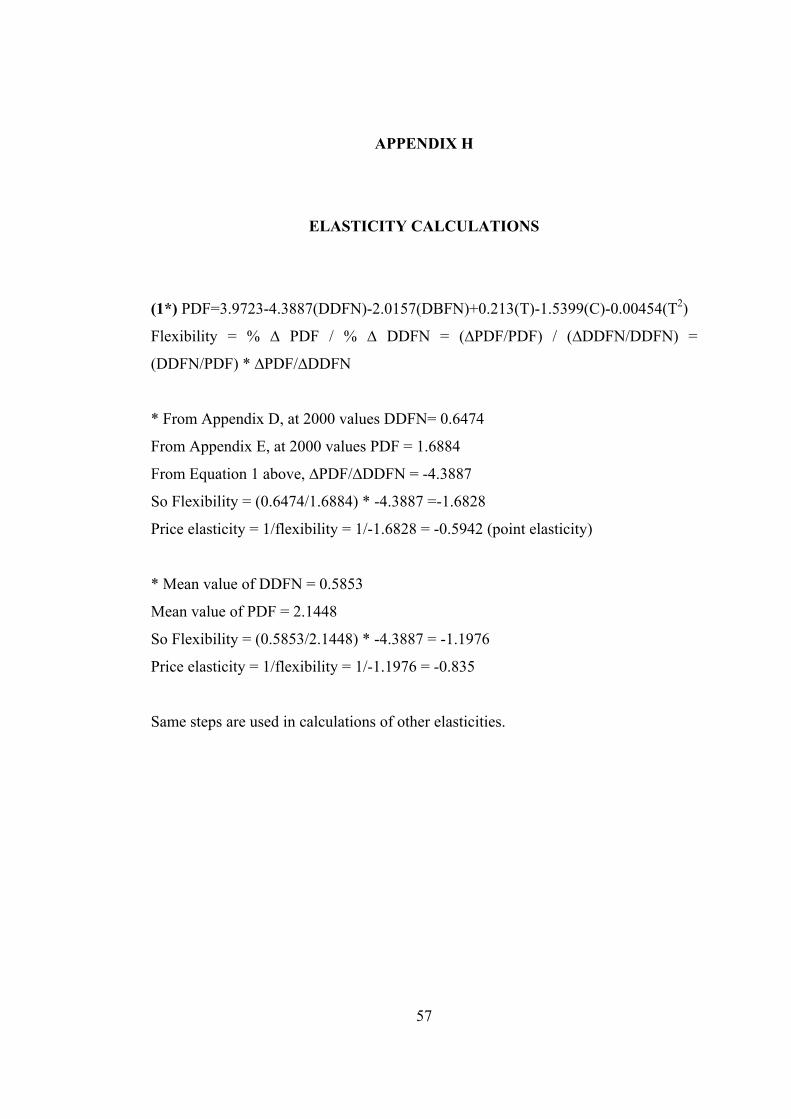
57
APPENDIX H
ELASTICITY CALCULATIONS
(1*) PDF=3.9723-4.3887(DDFN)-2.0157(DBFN)+0.213(T)-1.5399(C)-0.00454(T2)
Flexibility = % ∆ PDF / % ∆ DDFN = (∆PDF/PDF) / (∆DDFN/DDFN) =
(DDFN/PDF) * ∆PDF/∆DDFN
* From Appendix D, at 2000 values DDFN= 0.6474
From Appendix E, at 2000 values PDF = 1.6884
From Equation 1 above, ∆PDF/∆DDFN = -4.3887
So Flexibility = (0.6474/1.6884) * -4.3887 =-1.6828
Price elasticity = 1/flexibility = 1/-1.6828 = -0.5942 (point elasticity)
* Mean value of DDFN = 0.5853
Mean value of PDF = 2.1448
So Flexibility = (0.5853/2.1448) * -4.3887 = -1.1976
Price elasticity = 1/flexibility = 1/-1.1976 = -0.835
Same steps are used in calculations of other elasticities.