Embed Size (px)
Citation preview
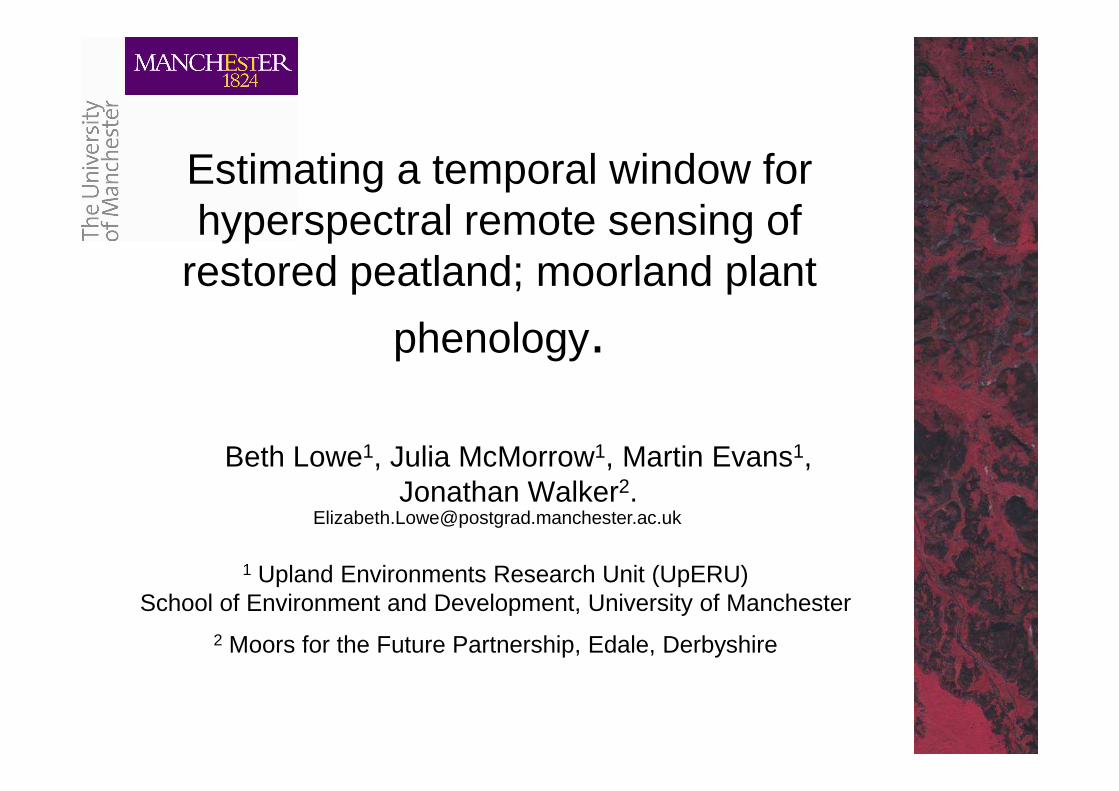
Estimating a temporal window for hyperspectral remote sensing of
restored peatland; moorland plant
phenology.
Beth Lowe1, Julia McMorrow1, Martin Evans1, Jonathan Walker2.
1 Upland Environments Research Unit (UpERU)School of Environment and Development, University of Manchester
2 Moors for the Future Partnership, Edale, Derbyshire

Structure
• Context of the study
• Background – Uplands, restoration, study site
• Single species monitoring • Single species monitoring
• Summary

Context.• Study fits into wider PhD Project.
• To determine the extent to which high spatial resolution hyperspectral images can provide landscape scale information on habitat condition of restored peatland:
– Species composition and floristic – Species composition and floristic trajectory of the re-establishing native species of blanket bog
– Identify areas needing further treatment
• To make recommendations for operational monitoring; especially time of year for RS flight.

Peatland restoration
Location Degradation
Restoration
=Moorland

Monitoring
Bare PeatNurse grasses
MonitoringBlanket bog in good condition

Methodology• Plant phenology recorded using field spectro-
radiometry and digital photography at pure plots
Mosses
• 15 single species x 2 plots.• Biconical method, stable stand, 3 directions.
Sedges and grasses
Dwarf shrubs

60
80
100
Ref
lect
ance
Initial Results: Inter species
Cellulose absorbance feature
REP
Plant Senescence reflectance
0
20
40
350 550 750 950 1150 1350 1550 1750 1950 2150 2350
Wavelength
Ref
lect
ance
Example of September data. All collected on 11/09/09.Average reflectance for each species.
featurereflectance index
Mosses
690
695
700
705
710
715
720
May June July August Sept Sept April May June August
144 174 185 219 253 262 472 507 536 593
Julian day
RE
P
Campylopum
Hypnum
Polytrichum
Sphagnum
Dwarf Shrubs Average Monthly REP
700
705
710
715
720
RE
P
Bilberry
Crowberry
Heather
Dwarf shrubs
700
705
710
715
720
RE
P Bilberry
Crow berry
Heather
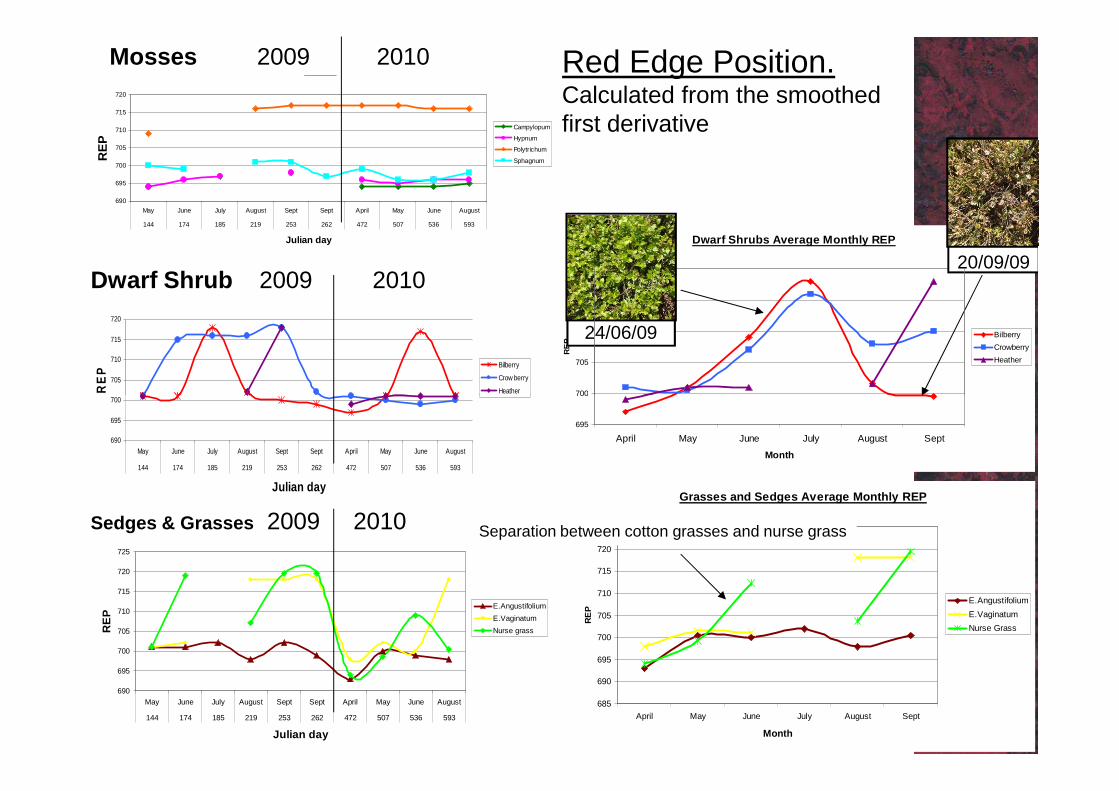
Red Edge Position.Calculated from the smoothed first derivative
24/06/09
20/09/09
Mosses 2009 2010
Dwarf Shrub 2009 2010
Sedges and Grasses
690
695
700
705
710
715
720
725
May June July August Sept Sept April May June August
144 174 185 219 253 262 472 507 536 593
Julian day
RE
P
E.Angustifolium
E.Vaginatum
Nurse grass
695
700
April May June July August Sept
Month
690
695
700
May June July August Sept Sept April May June August
144 174 185 219 253 262 472 507 536 593
Julian dayGrasses and Sedges Average Monthly REP
685
690
695
700
705
710
715
720
725
April May June July August Sept
Month
RE
PE.Angustifolium
E.Vaginatum
Nurse Grass
Separation between cotton grasses and nurse grassSedges & Grasses 2009 2010

Cellulose absorption index average of 2 years
CAI=0.5(R2.0+R2.2)-R2.1(Nagler et al 2000)
Depth of Cellulose absorbance feature becomes more evident during
senescence, increasing the CAI. Dwarf Shrubs Average Monthly CAI
0.6
0.8
1.0
1.2
Heather
Mosses Average Monthly CAI
-0.5
0.0
0.5
1.0
1.5
2.0
2.5
3.0
3.5
4.0
4.5
April May June July August Sept
Month
CA
I
Hypnum
Polytrichum
Sphagnum
Campylopum
Mosses more responsive. Stay higher into June before drop.Maintain their moisture for
-0.2
0.0
0.2
0.4
0.6
April May June July August Sept
Month
CA
I Heather
Bilberry
Crowberry
Grasses and Sedges Average Monthly CAI
0.0
0.5
1.0
1.5
2.0
2.5
3.0
3.5
April May June July August Sept
Month
CA
I E.Vaginatum
E.Angustifolium
Nurse Grass
Drop through season as plants water content increases. Shows importance of senescent proportion of the canopy.
Maintain their moisture for longer than the leaf canopies

Dwarf Shrubs
0.10
0.15
0.20
0.25
PR
SI Heather
Bilberry
Crowberry
Mosses
0.00
0.05
0.10
0.15
0.20
0.25
0.30
May June July August Sept Sept April May June August
144 174 185 219 253 262 472 507 536 593
Date
PR
SI
Sphagnum
Polytrichum
Hypnum
Campylopum
PSRI – plant senescing reflectance index
(R678-R500)/R750(Merzlyak et al 1999)
Pigment changes during senescense.
Ratio of Carotenoids to Chlorophyll increases during preferential degradation of Chlorophyll causing an increase in PSRI.
Inverse relationship to sedges and shrubs.
Similar pattern to CAI, steady reduction in summer months in
0.00
0.05
May June July August Sept Sept April May June August
144 174 185 219 253 262 472 507 536 593
Date
Grass and Sedges
0.0
0.1
0.1
0.2
0.2
0.3
0.3
0.4
0.4
0.5
May June July August Sept Sept April May June August
144 174 185 219 253 262 472 507 536 593
Date
PS
RI E.Vaginatum
E.Angustifolium
Nurse Grass
Sedges and Grasses Average Monthly PRSI
0.0
0.1
0.1
0.2
0.2
0.3
0.3
0.4
0.4
0.5
April May June July August Sept
Month
PS
RI E.Vaginatum
E.Angustifolium
Nurse Grass
reduction in summer months in grasses and shrubs.
Greater response in 2010. Pattern still strong when averaged. Restoration ages.

Variation within each index
SD of REP
4.0
6.0
8.0
10.0
12.0
14.0
May June July August Sept Sept April May June August
144 174 185 219 253 262 472 507 536 593
Date
SD
of R
ep
rep
SD of CAI
0.64
0.84
1.04
1.24
1.44
SD
of C
ai
cai
When is the maximum amount of variation within the indicies? Across all
SD of REP 2009 2010
SD of CAI 2009 2010
SD of PRSI
0.06
0.07
0.08
0.09
0.10
0.11
0.12
0.13
May June July August Sept Sept April May June August
144 174 185 219 253 262 472 507 536 593
Date
SD
of P
RS
I
psri
0.04
0.24
0.44
0.64
May June July August Sept Sept April May June August
144 174 185 219 253 262 472 507 536 593
Date
SD
of C
ai
indicies? Across all species.
Which time of year is best?
SD of PSRI 2009 2010

Conclusions
• Complex set of data.• Patterns that are emerging are suggesting that
the end of June would be the best month to monitor.
- REP distinguish between Nurse grasses and sedgessedges
- CAI shows separation in Mosses- PRSI widest spread before all pigments are
masked- SD highest within each index in June• Further Statistical tests could be used to gain
greater insight.• Interannual variation adds an extra element to
equation – mimics natural variation in restoration.

Acknowledgements• Natural England and NERC for CASE award NE/H001859/1
• NERC Field Spectroscopy Facility (FSF), Newcastle and Salford Universities’ for loan of ASD and calibration targets under loan 548.1207.
• NERC Airborne Research Survey Facility (ARSF)
• Moors for the Future for access to data and assistance with fieldwork
• Natural England, National Trust High Peak Estate and tenants for permission to conduct fieldwork.
Nagler, P.L. Daughtry, C.S.T., and Goward, S.N. (2000). Plant litter and soil reflectance. Remote Sensing of the Environment. 71: 207-215.Merzlyak, M.N., Gitelson, A.A., Chivkunova, O.B., and Rakitin, Y.U. (1999). Non-destructive optical detection of pigment changesduring leaf senescence and fruit ripening. Physiologia Plantarum. 106:135-141.


![Power-Efficient Resource Allocation in C-RANs with SINR ...time slot [9] within a given temporal window. For each request, the temporal window is defined by the 2-tuple (t0 r; ),](https://img.pdfslide.net/doc/110x75/5ea3eb87e53e53222c626101/power-eficient-resource-allocation-in-c-rans-with-sinr-time-slot-9-within.jpg)