Embed Size (px)
Citation preview
Estimating Average Total Cost of Open Pit Coal Mines inAustralia
S Shafiee1, M Nehring2 and E Topal3
ABSTRACT
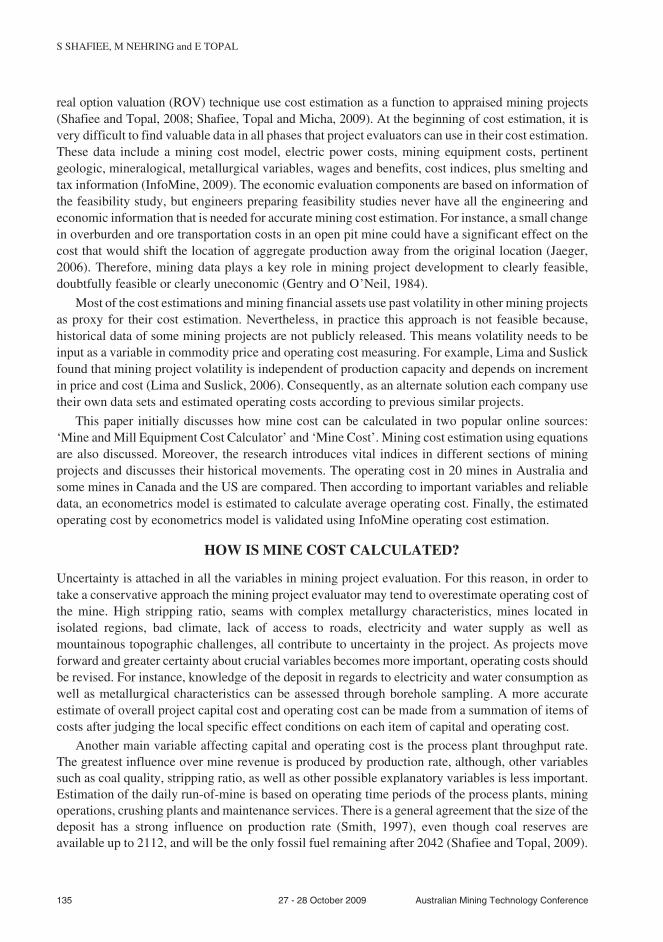
In preliminary feasibility studies mining project evaluators seek to estimate capital andoperating costs of a proposed mining venture before mine layout design and generalplant design. Mine planners often need to provide guidance on probable minefeasibility with insufficient cost information. There are two main methods forpreliminary cost estimation. The first one relates to a few available sources thatcalculate the required cost information. The Mine and Mill Equipment Cost Calculatoris an online exhaustive software tool which compiles capital and operating cost datafor mining and milling purposes. Mine Cost is another online source which providesmine cost spreadsheets and operating cost information based on verifiable engineeringand production data. The main shortcoming of these online sources is that they do notprovide any detail about the methods for estimating mining cost and simply calculatetotal cost for a specific mine. The second one, which is more recognisable in industry,derives preliminary cost estimates by computing average total costs (ATC) of existingmining projects and operations. Since each mine has unique specifications, costinformation should be estimated individually. This study focuses on establishing arange of ATCs according to previous mining projects and indices.
This study endeavours to estimate an index and econometrics model for Australiancoal mines to guide mining project evaluation to find the ATC in open pit coal mines. Inother words, this paper reviews about 20 Australian open pit existing coal minesoperated by different companies and categorises them by size of mine and deposit, coalquality parameters and production rate. It then, computers the ATC according to theseexisting open pit coal mines. After that, the ATC is expanded for the next 30 years byspecific mining and milling indices. The study introduces an econometrics model toestimate mining and milling cost index via the Marshal and Swift equipment cost indexfor the future. Finally, this research provides an appropriate ATC for mine life whichcould be useful for preliminary feasibility studies of mining projects to find out generalsite conditions, mining methods, and milling processes.
INTRODUCTION
In mining project evaluation and decision making, the prediction of future volatility is a key inputparameter. Capital and operating cost estimation on any proposed mining project is essential to evaluatea mining project for the whole of its mining life. Nowadays new project evaluation methods such as the
Australian Mining Technology Conference 27 - 28 October 2009 134
1. Postgraduate Student School of Engineering, CRC Mining, The University of Queensland, St Lucia Qld 4072.Email: [email protected]
2. Postgraduate Student School of Engineering, CRC Mining, The University of Queensland, St Lucia Qld 4072.Email: [email protected]
3. Associate Professor/Head of Mining Engineering Department, Western Australia School of Mines, Curtin University ofTechnology. Email: [email protected]
real option valuation (ROV) technique use cost estimation as a function to appraised mining projects(Shafiee and Topal, 2008; Shafiee, Topal and Micha, 2009). At the beginning of cost estimation, it isvery difficult to find valuable data in all phases that project evaluators can use in their cost estimation.These data include a mining cost model, electric power costs, mining equipment costs, pertinentgeologic, mineralogical, metallurgical variables, wages and benefits, cost indices, plus smelting andtax information (InfoMine, 2009). The economic evaluation components are based on information ofthe feasibility study, but engineers preparing feasibility studies never have all the engineering andeconomic information that is needed for accurate mining cost estimation. For instance, a small changein overburden and ore transportation costs in an open pit mine could have a significant effect on thecost that would shift the location of aggregate production away from the original location (Jaeger,2006). Therefore, mining data plays a key role in mining project development to clearly feasible,doubtfully feasible or clearly uneconomic (Gentry and O’Neil, 1984).
Most of the cost estimations and mining financial assets use past volatility in other mining projectsas proxy for their cost estimation. Nevertheless, in practice this approach is not feasible because,historical data of some mining projects are not publicly released. This means volatility needs to beinput as a variable in commodity price and operating cost measuring. For example, Lima and Suslickfound that mining project volatility is independent of production capacity and depends on incrementin price and cost (Lima and Suslick, 2006). Consequently, as an alternate solution each company usetheir own data sets and estimated operating costs according to previous similar projects.
This paper initially discusses how mine cost can be calculated in two popular online sources:‘Mine and Mill Equipment Cost Calculator’ and ‘Mine Cost’. Mining cost estimation using equationsare also discussed. Moreover, the research introduces vital indices in different sections of miningprojects and discusses their historical movements. The operating cost in 20 mines in Australia andsome mines in Canada and the US are compared. Then according to important variables and reliabledata, an econometrics model is estimated to calculate average operating cost. Finally, the estimatedoperating cost by econometrics model is validated using InfoMine operating cost estimation.
HOW IS MINE COST CALCULATED?
Uncertainty is attached in all the variables in mining project evaluation. For this reason, in order totake a conservative approach the mining project evaluator may tend to overestimate operating cost ofthe mine. High stripping ratio, seams with complex metallurgy characteristics, mines located inisolated regions, bad climate, lack of access to roads, electricity and water supply as well asmountainous topographic challenges, all contribute to uncertainty in the project. As projects moveforward and greater certainty about crucial variables becomes more important, operating costs shouldbe revised. For instance, knowledge of the deposit in regards to electricity and water consumption aswell as metallurgical characteristics can be assessed through borehole sampling. A more accurateestimate of overall project capital cost and operating cost can be made from a summation of items ofcosts after judging the local specific effect conditions on each item of capital and operating cost.
Another main variable affecting capital and operating cost is the process plant throughput rate.The greatest influence over mine revenue is produced by production rate, although, other variablessuch as coal quality, stripping ratio, as well as other possible explanatory variables is less important.Estimation of the daily run-of-mine is based on operating time periods of the process plants, miningoperations, crushing plants and maintenance services. There is a general agreement that the size of thedeposit has a strong influence on production rate (Smith, 1997), even though coal reserves areavailable up to 2112, and will be the only fossil fuel remaining after 2042 (Shafiee and Topal, 2009).
135 27 - 28 October 2009 Australian Mining Technology Conference
S SHAFIEE, M NEHRING and E TOPAL
This means that the ratio of coal production to coal reserve is very low in comparison to othernon-renewable resources.
There are two main methods for preliminary cost estimation. The first one is an online softwarecalled ‘Mine and Mill Equipment Cost Calculator’ that calculate all equipment cost in feasibility. Thissoftware provides a comprehensive reliable data for equipment cost in detail. All data is based onInfoMine US’s complete equipment cost database, along with the mechanism to extract and adjust thedata for specific projects. InfoMine US is dedicated to providing the cost data and advice miningprojects need to make informed mining decisions. This software draws on its extensive background inmine planning, cost estimation, and project evaluation to understand mining projects’ cost data(InfoMine, 2009). The second one is ‘Mine Cost’, which is an online source that provides mine costspreadsheets and operating cost information based on verifiable engineering and production data.This site is a source of mine cost spreadsheet models and operating cost information based onverifiable engineering, production data and peer reviewed by mining industry analysts. It presentssome spreadsheet model containing detailed production and mine economics data, in many cases backto 1991 as well as projections for future years up to 2012. All models have cost curves showing theoperation’s comparative cost ranking against all other mines in the industry (Mine Cost, 2009).Consequently, these two available methods estimate mining cost based on their own data bases, thenprovide an overview for future mining. The main shortcoming of these two methods is that they do notprovide any details about the methods for estimating mining cost and simply calculate total cost for aspecific mine. Since each mine has unique specifications, then cost information should be estimatedindividually. This study focuses on establishing a range of ATCs according to previous miningprojects and available indices.
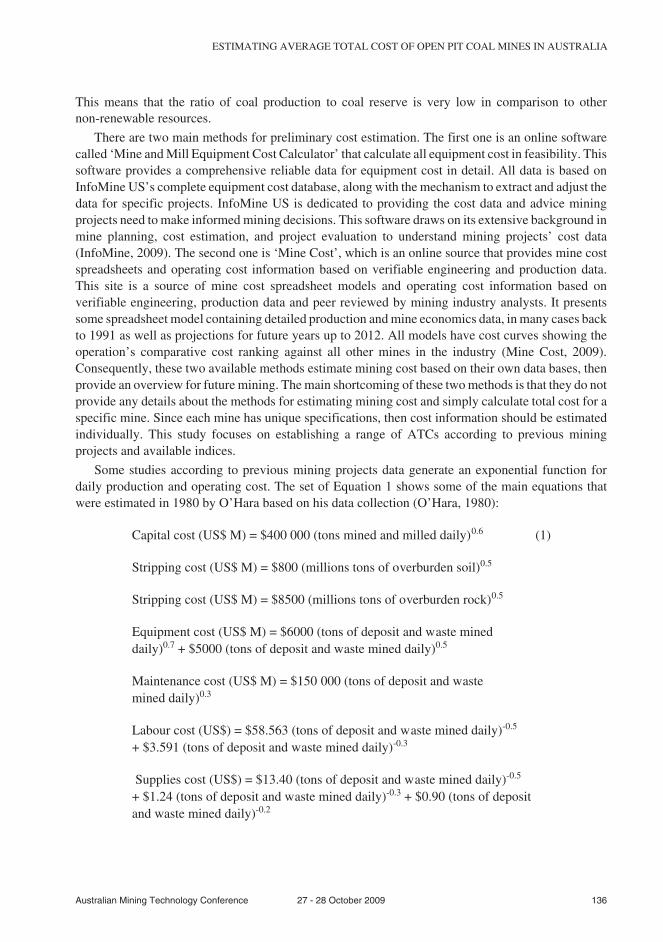
Some studies according to previous mining projects data generate an exponential function fordaily production and operating cost. The set of Equation 1 shows some of the main equations thatwere estimated in 1980 by O’Hara based on his data collection (O’Hara, 1980):
Capital cost (US$ M) = $400 000 (tons mined and milled daily)0.6 (1)
Stripping cost (US$ M) = $800 (millions tons of overburden soil)0.5
Stripping cost (US$ M) = $8500 (millions tons of overburden rock)0.5
Equipment cost (US$ M) = $6000 (tons of deposit and waste mineddaily)0.7 + $5000 (tons of deposit and waste mined daily)0.5
Maintenance cost (US$ M) = $150 000 (tons of deposit and wastemined daily)0.3
Labour cost (US$) = $58.563 (tons of deposit and waste mined daily)-0.5
+ $3.591 (tons of deposit and waste mined daily)-0.3
Supplies cost (US$) = $13.40 (tons of deposit and waste mined daily)-0.5
+ $1.24 (tons of deposit and waste mined daily)-0.3 + $0.90 (tons of depositand waste mined daily)-0.2
Australian Mining Technology Conference 27 - 28 October 2009 136
ESTIMATING AVERAGE TOTAL COST OF OPEN PIT COAL MINES IN AUSTRALIA
The main shortcoming of O’Hara’s estimation relates to the expansion of Equation 1 over themining project life; however, these equations are still one of the best approaches in cost estimationliterature. This paper estimates cost function according to some of O’Hara’s variables.
COST INDICES FOR MINING PROJECTS
Cost indices in the mining industry provide a general overview and a mechanism for adjustingoutdated cost information. One of the advantages of cost indices is that they show the effect ofinflation on mining costs. Figures 1 to 4 illustrate a variety of crucial indices for specific miningscenarios as computed by InfoMine in 2009 (CostMine, 2009). These indices are measured based ongeneral inflation in the US economy. InfoMine claims those indices serve as a comparison to theinflation experienced by the mining industry. This section will discuss the fluctuations in cost indicesfrom 1965 to 2008.
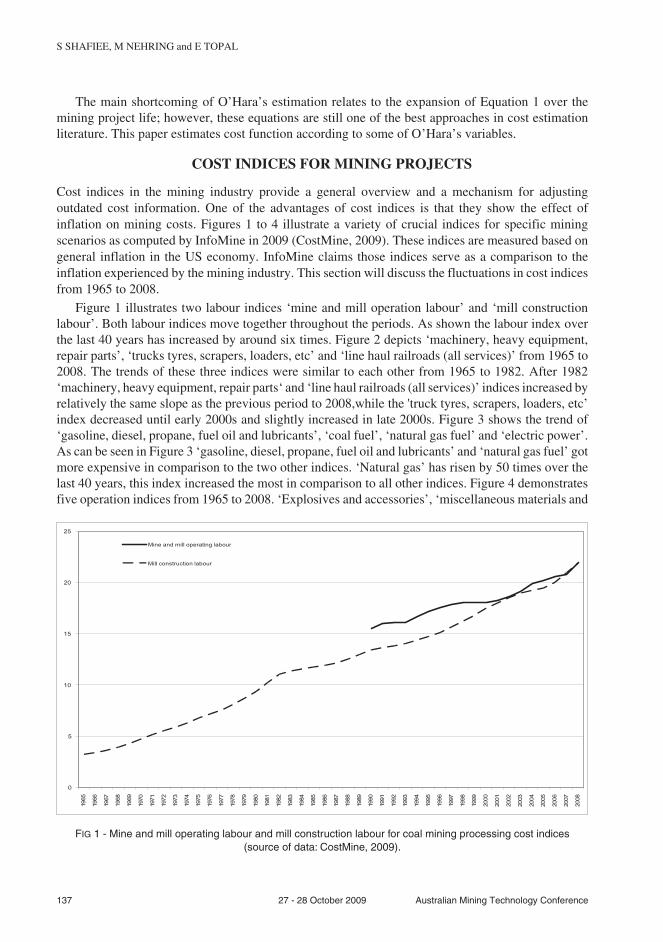
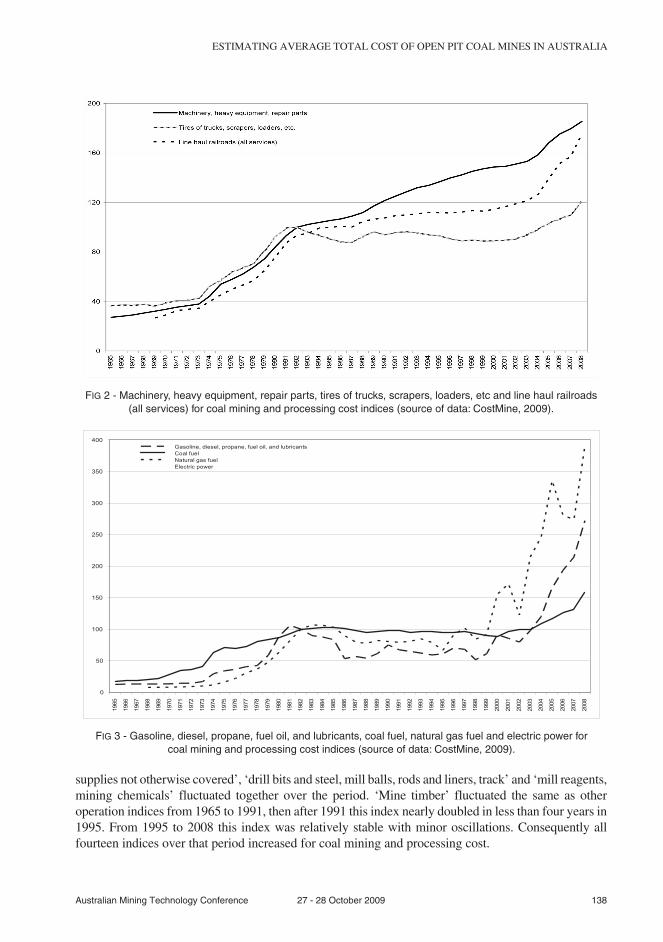
Figure 1 illustrates two labour indices ‘mine and mill operation labour’ and ‘mill constructionlabour’. Both labour indices move together throughout the periods. As shown the labour index overthe last 40 years has increased by around six times. Figure 2 depicts ‘machinery, heavy equipment,repair parts’, ‘trucks tyres, scrapers, loaders, etc’ and ‘line haul railroads (all services)’ from 1965 to2008. The trends of these three indices were similar to each other from 1965 to 1982. After 1982‘machinery, heavy equipment, repair parts‘ and ‘line haul railroads (all services)’ indices increased byrelatively the same slope as the previous period to 2008,while the 'truck tyres, scrapers, loaders, etc’index decreased until early 2000s and slightly increased in late 2000s. Figure 3 shows the trend of‘gasoline, diesel, propane, fuel oil and lubricants’, ‘coal fuel’, ‘natural gas fuel’ and ‘electric power’.As can be seen in Figure 3 ‘gasoline, diesel, propane, fuel oil and lubricants’ and ‘natural gas fuel’ gotmore expensive in comparison to the two other indices. ‘Natural gas’ has risen by 50 times over thelast 40 years, this index increased the most in comparison to all other indices. Figure 4 demonstratesfive operation indices from 1965 to 2008. ‘Explosives and accessories’, ‘miscellaneous materials and
137 27 - 28 October 2009 Australian Mining Technology Conference
S SHAFIEE, M NEHRING and E TOPAL
0
5
10
15
20
25
1965
1966
1967
1968
1969
1970
1971
1972
1973
1974
1975
1976
1977
1978
1979
1980
1981
1982
1983
1984
1985
1986
1987
1988
1989
1990
1991
1992
1993
1994
1995
1996
1997
1998
1999
2000
2001
2002
2003
2004
2005
2006
2007
2008
Mine and mill operating labour
Mill construction labour
FIG 1 - Mine and mill operating labour and mill construction labour for coal mining processing cost indices(source of data: CostMine, 2009).
supplies not otherwise covered’, ‘drill bits and steel, mill balls, rods and liners, track’ and ‘mill reagents,mining chemicals’ fluctuated together over the period. ‘Mine timber’ fluctuated the same as otheroperation indices from 1965 to 1991, then after 1991 this index nearly doubled in less than four years in1995. From 1995 to 2008 this index was relatively stable with minor oscillations. Consequently allfourteen indices over that period increased for coal mining and processing cost.
Australian Mining Technology Conference 27 - 28 October 2009 138
ESTIMATING AVERAGE TOTAL COST OF OPEN PIT COAL MINES IN AUSTRALIA
FIG 2 - Machinery, heavy equipment, repair parts, tires of trucks, scrapers, loaders, etc and line haul railroads(all services) for coal mining and processing cost indices (source of data: CostMine, 2009).
0
50
100
150
200
250
300
350
400
1965
1966
1967
1968
1969
1970
1971
1972
1973
1974
1975
1976
1977
1978
1979
1980
1981
1982
1983
1984
1985
1986
1987
1988
1989
1990
1991
1992
1993
1994
1995
1996
1997
1998
1999
2000
2001
2002
2003
2004
2005
2006
2007
2008
Gasoline, diesel, propane, fuel oil, and lubricants
Coal fuel
Natural gas fuel
Electric power
FIG 3 - Gasoline, diesel, propane, fuel oil, and lubricants, coal fuel, natural gas fuel and electric power forcoal mining and processing cost indices (source of data: CostMine, 2009).
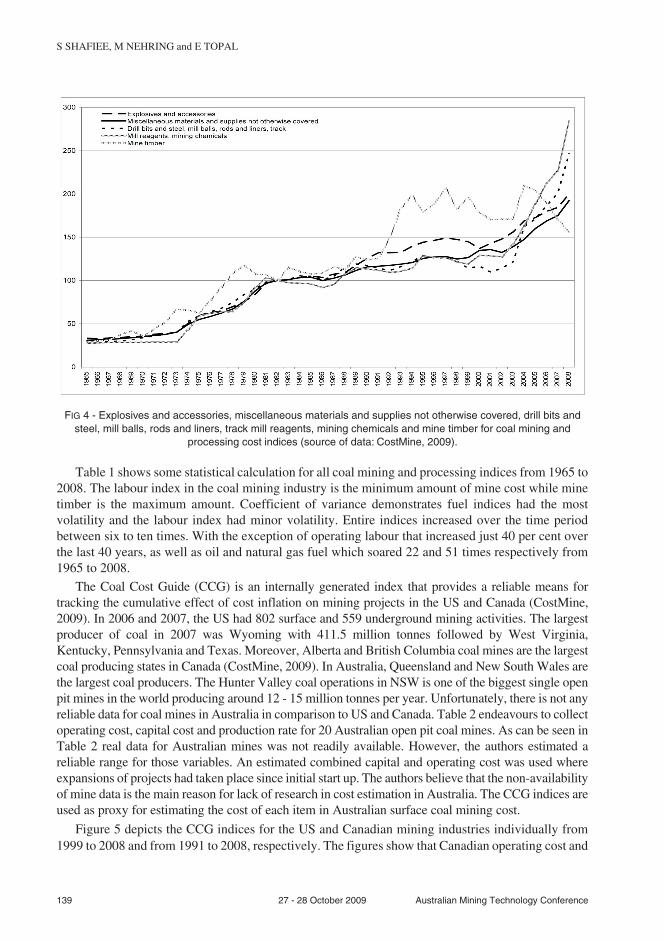
Table 1 shows some statistical calculation for all coal mining and processing indices from 1965 to2008. The labour index in the coal mining industry is the minimum amount of mine cost while minetimber is the maximum amount. Coefficient of variance demonstrates fuel indices had the mostvolatility and the labour index had minor volatility. Entire indices increased over the time periodbetween six to ten times. With the exception of operating labour that increased just 40 per cent overthe last 40 years, as well as oil and natural gas fuel which soared 22 and 51 times respectively from1965 to 2008.
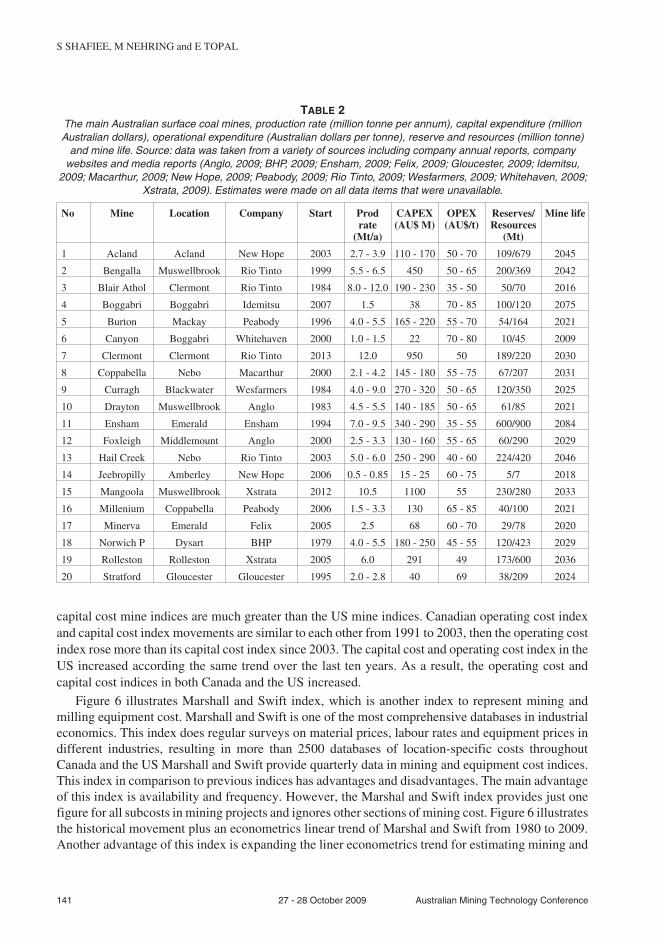
The Coal Cost Guide (CCG) is an internally generated index that provides a reliable means fortracking the cumulative effect of cost inflation on mining projects in the US and Canada (CostMine,2009). In 2006 and 2007, the US had 802 surface and 559 underground mining activities. The largestproducer of coal in 2007 was Wyoming with 411.5 million tonnes followed by West Virginia,Kentucky, Pennsylvania and Texas. Moreover, Alberta and British Columbia coal mines are the largestcoal producing states in Canada (CostMine, 2009). In Australia, Queensland and New South Wales arethe largest coal producers. The Hunter Valley coal operations in NSW is one of the biggest single openpit mines in the world producing around 12 - 15 million tonnes per year. Unfortunately, there is not anyreliable data for coal mines in Australia in comparison to US and Canada. Table 2 endeavours to collectoperating cost, capital cost and production rate for 20 Australian open pit coal mines. As can be seen inTable 2 real data for Australian mines was not readily available. However, the authors estimated areliable range for those variables. An estimated combined capital and operating cost was used whereexpansions of projects had taken place since initial start up. The authors believe that the non-availabilityof mine data is the main reason for lack of research in cost estimation in Australia. The CCG indices areused as proxy for estimating the cost of each item in Australian surface coal mining cost.
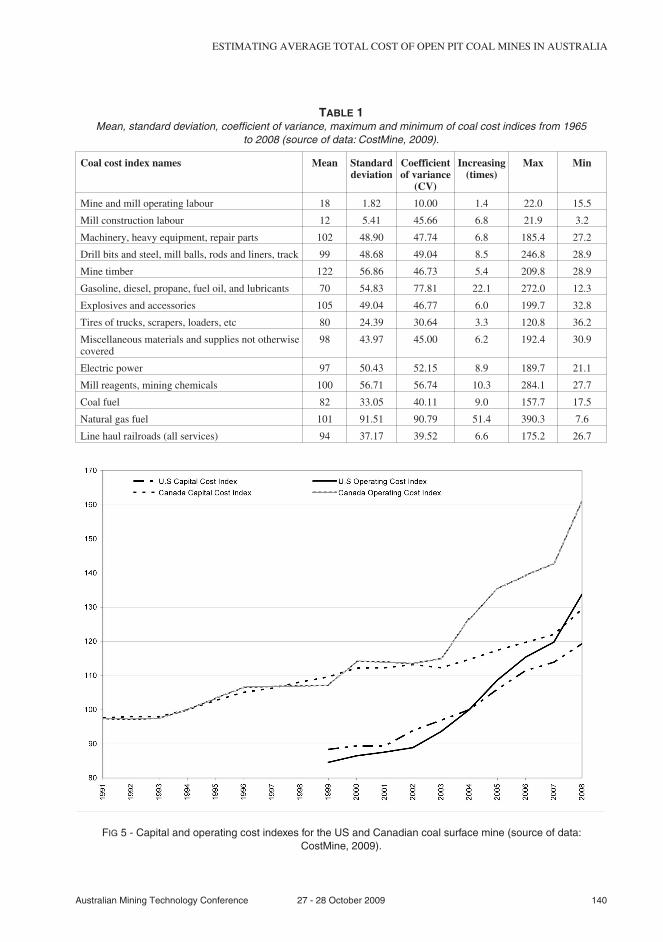
Figure 5 depicts the CCG indices for the US and Canadian mining industries individually from1999 to 2008 and from 1991 to 2008, respectively. The figures show that Canadian operating cost and
139 27 - 28 October 2009 Australian Mining Technology Conference
S SHAFIEE, M NEHRING and E TOPAL
FIG 4 - Explosives and accessories, miscellaneous materials and supplies not otherwise covered, drill bits andsteel, mill balls, rods and liners, track mill reagents, mining chemicals and mine timber for coal mining and
processing cost indices (source of data: CostMine, 2009).
Australian Mining Technology Conference 27 - 28 October 2009 140
ESTIMATING AVERAGE TOTAL COST OF OPEN PIT COAL MINES IN AUSTRALIA
FIG 5 - Capital and operating cost indexes for the US and Canadian coal surface mine (source of data:CostMine, 2009).
Coal cost index names Mean Standarddeviation
Coefficientof variance
(CV)
Increasing(times)
Max Min
Mine and mill operating labour 18 1.82 10.00 1.4 22.0 15.5
Mill construction labour 12 5.41 45.66 6.8 21.9 3.2
Machinery, heavy equipment, repair parts 102 48.90 47.74 6.8 185.4 27.2
Drill bits and steel, mill balls, rods and liners, track 99 48.68 49.04 8.5 246.8 28.9
Mine timber 122 56.86 46.73 5.4 209.8 28.9
Gasoline, diesel, propane, fuel oil, and lubricants 70 54.83 77.81 22.1 272.0 12.3
Explosives and accessories 105 49.04 46.77 6.0 199.7 32.8
Tires of trucks, scrapers, loaders, etc 80 24.39 30.64 3.3 120.8 36.2
Miscellaneous materials and supplies not otherwisecovered
98 43.97 45.00 6.2 192.4 30.9
Electric power 97 50.43 52.15 8.9 189.7 21.1
Mill reagents, mining chemicals 100 56.71 56.74 10.3 284.1 27.7
Coal fuel 82 33.05 40.11 9.0 157.7 17.5
Natural gas fuel 101 91.51 90.79 51.4 390.3 7.6
Line haul railroads (all services) 94 37.17 39.52 6.6 175.2 26.7
TABLE 1Mean, standard deviation, coefficient of variance, maximum and minimum of coal cost indices from 1965
to 2008 (source of data: CostMine, 2009).
capital cost mine indices are much greater than the US mine indices. Canadian operating cost indexand capital cost index movements are similar to each other from 1991 to 2003, then the operating costindex rose more than its capital cost index since 2003. The capital cost and operating cost index in theUS increased according the same trend over the last ten years. As a result, the operating cost andcapital cost indices in both Canada and the US increased.
Figure 6 illustrates Marshall and Swift index, which is another index to represent mining andmilling equipment cost. Marshall and Swift is one of the most comprehensive databases in industrialeconomics. This index does regular surveys on material prices, labour rates and equipment prices indifferent industries, resulting in more than 2500 databases of location-specific costs throughoutCanada and the US Marshall and Swift provide quarterly data in mining and equipment cost indices.This index in comparison to previous indices has advantages and disadvantages. The main advantageof this index is availability and frequency. However, the Marshal and Swift index provides just onefigure for all subcosts in mining projects and ignores other sections of mining cost. Figure 6 illustratesthe historical movement plus an econometrics linear trend of Marshal and Swift from 1980 to 2009.Another advantage of this index is expanding the liner econometrics trend for estimating mining and
141 27 - 28 October 2009 Australian Mining Technology Conference
S SHAFIEE, M NEHRING and E TOPAL
No Mine Location Company Start Prodrate
(Mt/a)
CAPEX(AU$ M)
OPEX(AU$/t)
Reserves/Resources
(Mt)
Mine life
1 Acland Acland New Hope 2003 2.7 - 3.9 110 - 170 50 - 70 109/679 2045
2 Bengalla Muswellbrook Rio Tinto 1999 5.5 - 6.5 450 50 - 65 200/369 2042
3 Blair Athol Clermont Rio Tinto 1984 8.0 - 12.0 190 - 230 35 - 50 50/70 2016
4 Boggabri Boggabri Idemitsu 2007 1.5 38 70 - 85 100/120 2075
5 Burton Mackay Peabody 1996 4.0 - 5.5 165 - 220 55 - 70 54/164 2021
6 Canyon Boggabri Whitehaven 2000 1.0 - 1.5 22 70 - 80 10/45 2009
7 Clermont Clermont Rio Tinto 2013 12.0 950 50 189/220 2030
8 Coppabella Nebo Macarthur 2000 2.1 - 4.2 145 - 180 55 - 75 67/207 2031
9 Curragh Blackwater Wesfarmers 1984 4.0 - 9.0 270 - 320 50 - 65 120/350 2025
10 Drayton Muswellbrook Anglo 1983 4.5 - 5.5 140 - 185 50 - 65 61/85 2021
11 Ensham Emerald Ensham 1994 7.0 - 9.5 340 - 290 35 - 55 600/900 2084
12 Foxleigh Middlemount Anglo 2000 2.5 - 3.3 130 - 160 55 - 65 60/290 2029
13 Hail Creek Nebo Rio Tinto 2003 5.0 - 6.0 250 - 290 40 - 60 224/420 2046
14 Jeebropilly Amberley New Hope 2006 0.5 - 0.85 15 - 25 60 - 75 5/7 2018
15 Mangoola Muswellbrook Xstrata 2012 10.5 1100 55 230/280 2033
16 Millenium Coppabella Peabody 2006 1.5 - 3.3 130 65 - 85 40/100 2021
17 Minerva Emerald Felix 2005 2.5 68 60 - 70 29/78 2020
18 Norwich P Dysart BHP 1979 4.0 - 5.5 180 - 250 45 - 55 120/423 2029
19 Rolleston Rolleston Xstrata 2005 6.0 291 49 173/600 2036
20 Stratford Gloucester Gloucester 1995 2.0 - 2.8 40 69 38/209 2024
TABLE 2The main Australian surface coal mines, production rate (million tonne per annum), capital expenditure (millionAustralian dollars), operational expenditure (Australian dollars per tonne), reserve and resources (million tonne)
and mine life. Source: data was taken from a variety of sources including company annual reports, companywebsites and media reports (Anglo, 2009; BHP, 2009; Ensham, 2009; Felix, 2009; Gloucester, 2009; Idemitsu,
2009; Macarthur, 2009; New Hope, 2009; Peabody, 2009; Rio Tinto, 2009; Wesfarmers, 2009; Whitehaven, 2009;Xstrata, 2009). Estimates were made on all data items that were unavailable.
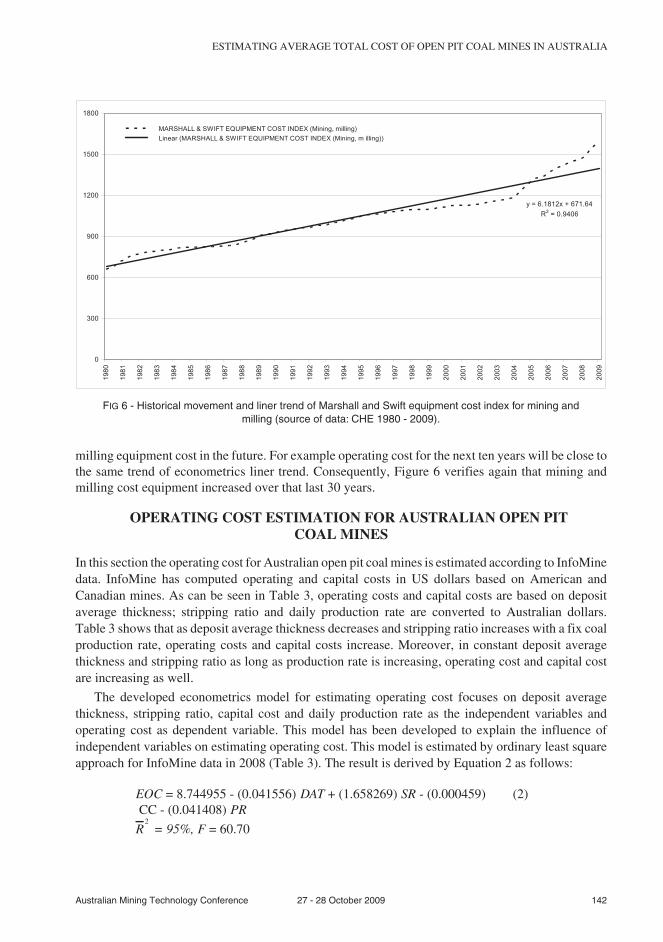
milling equipment cost in the future. For example operating cost for the next ten years will be close tothe same trend of econometrics liner trend. Consequently, Figure 6 verifies again that mining andmilling cost equipment increased over that last 30 years.
OPERATING COST ESTIMATION FOR AUSTRALIAN OPEN PITCOAL MINES
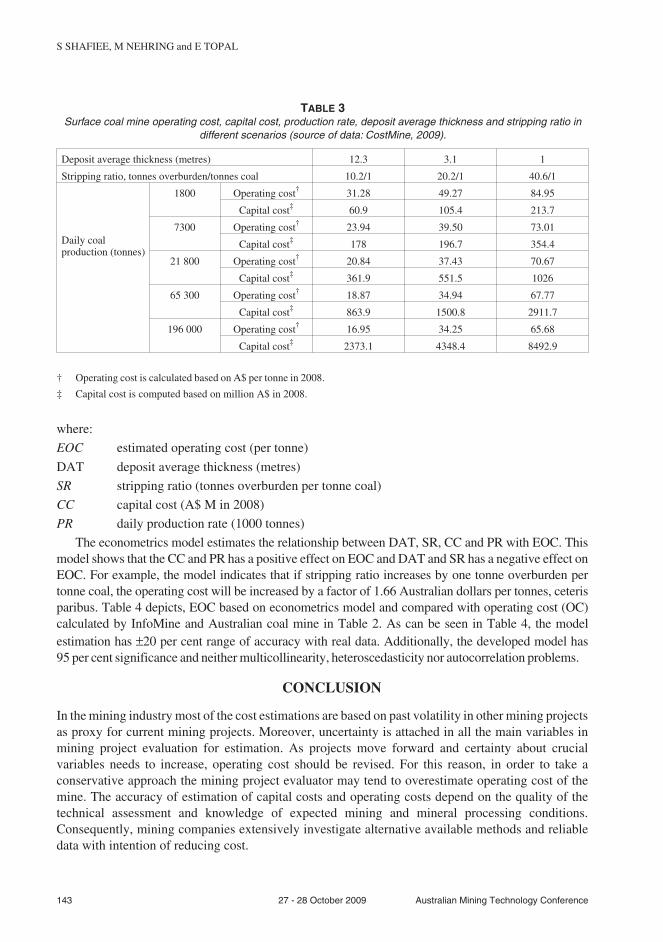
In this section the operating cost for Australian open pit coal mines is estimated according to InfoMinedata. InfoMine has computed operating and capital costs in US dollars based on American andCanadian mines. As can be seen in Table 3, operating costs and capital costs are based on depositaverage thickness; stripping ratio and daily production rate are converted to Australian dollars.Table 3 shows that as deposit average thickness decreases and stripping ratio increases with a fix coalproduction rate, operating costs and capital costs increase. Moreover, in constant deposit averagethickness and stripping ratio as long as production rate is increasing, operating cost and capital costare increasing as well.
The developed econometrics model for estimating operating cost focuses on deposit averagethickness, stripping ratio, capital cost and daily production rate as the independent variables andoperating cost as dependent variable. This model has been developed to explain the influence ofindependent variables on estimating operating cost. This model is estimated by ordinary least squareapproach for InfoMine data in 2008 (Table 3). The result is derived by Equation 2 as follows:
EOC = 8.744955 - (0.041556) DAT + (1.658269) SR - (0.000459) (2)CC - (0.041408) PR
R2
= 95%, F = 60.70
Australian Mining Technology Conference 27 - 28 October 2009 142
ESTIMATING AVERAGE TOTAL COST OF OPEN PIT COAL MINES IN AUSTRALIA
y = 6.1812x + 671.64
R2
= 0.9406
0
300
600
900
1200
1500
1800
198
0
198
1
198
2
198
3
198
4
198
5
198
6
198
7
198
8
198
9
199
0
199
1
199
2
199
3
199
4
199
5
199
6
199
7
199
8
199
9
200
0
200
1
200
2
200
3
200
4
200
5
200
6
200
7
200
8
200
9
MARSHALL & SWIFT EQUIPMENT COST INDEX (Mining, milling)
Linear (MARSHALL & SWIFT EQUIPMENT COST INDEX (Mining, m illing))
FIG 6 - Historical movement and liner trend of Marshall and Swift equipment cost index for mining andmilling (source of data: CHE 1980 - 2009).
where:
EOC estimated operating cost (per tonne)
DAT deposit average thickness (metres)
SR stripping ratio (tonnes overburden per tonne coal)
CC capital cost (A$ M in 2008)
PR daily production rate (1000 tonnes)
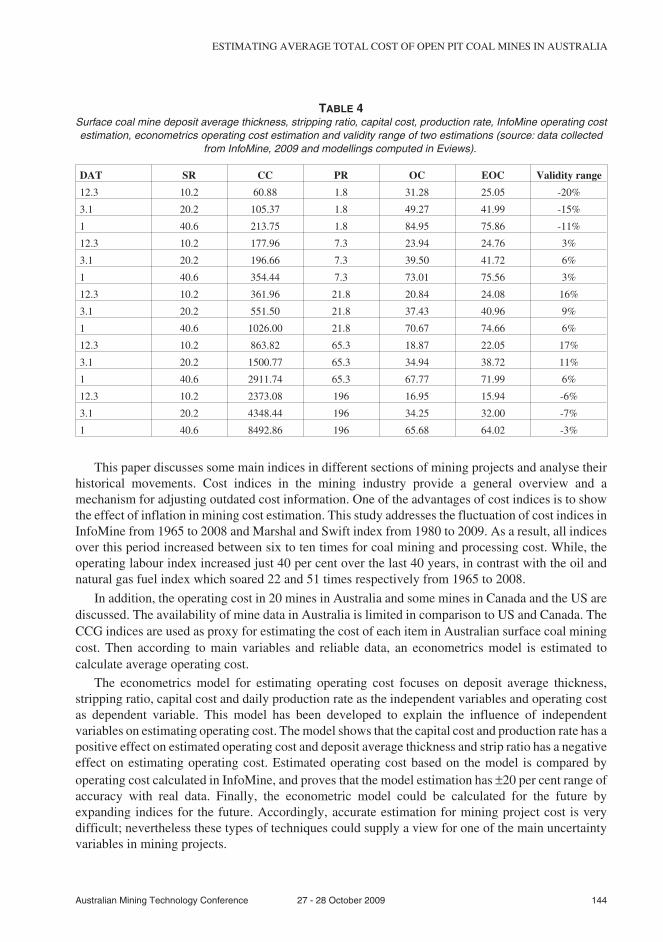
The econometrics model estimates the relationship between DAT, SR, CC and PR with EOC. Thismodel shows that the CC and PR has a positive effect on EOC and DAT and SR has a negative effect onEOC. For example, the model indicates that if stripping ratio increases by one tonne overburden pertonne coal, the operating cost will be increased by a factor of 1.66 Australian dollars per tonnes, ceterisparibus. Table 4 depicts, EOC based on econometrics model and compared with operating cost (OC)calculated by InfoMine and Australian coal mine in Table 2. As can be seen in Table 4, the modelestimation has ±20 per cent range of accuracy with real data. Additionally, the developed model has95 per cent significance and neither multicollinearity, heteroscedasticity nor autocorrelation problems.
CONCLUSION
In the mining industry most of the cost estimations are based on past volatility in other mining projectsas proxy for current mining projects. Moreover, uncertainty is attached in all the main variables inmining project evaluation for estimation. As projects move forward and certainty about crucialvariables needs to increase, operating cost should be revised. For this reason, in order to take aconservative approach the mining project evaluator may tend to overestimate operating cost of themine. The accuracy of estimation of capital costs and operating costs depend on the quality of thetechnical assessment and knowledge of expected mining and mineral processing conditions.Consequently, mining companies extensively investigate alternative available methods and reliabledata with intention of reducing cost.
143 27 - 28 October 2009 Australian Mining Technology Conference
S SHAFIEE, M NEHRING and E TOPAL
Deposit average thickness (metres) 12.3 3.1 1
Stripping ratio, tonnes overburden/tonnes coal 10.2/1 20.2/1 40.6/1
Daily coalproduction (tonnes)
1800 Operating cost† 31.28 49.27 84.95
Capital cost‡ 60.9 105.4 213.7
7300 Operating cost† 23.94 39.50 73.01
Capital cost‡ 178 196.7 354.4
21 800 Operating cost† 20.84 37.43 70.67
Capital cost‡ 361.9 551.5 1026
65 300 Operating cost† 18.87 34.94 67.77
Capital cost‡ 863.9 1500.8 2911.7
196 000 Operating cost† 16.95 34.25 65.68
Capital cost‡ 2373.1 4348.4 8492.9
† Operating cost is calculated based on A$ per tonne in 2008.
‡ Capital cost is computed based on million A$ in 2008.
TABLE 3Surface coal mine operating cost, capital cost, production rate, deposit average thickness and stripping ratio in
different scenarios (source of data: CostMine, 2009).
This paper discusses some main indices in different sections of mining projects and analyse theirhistorical movements. Cost indices in the mining industry provide a general overview and amechanism for adjusting outdated cost information. One of the advantages of cost indices is to showthe effect of inflation in mining cost estimation. This study addresses the fluctuation of cost indices inInfoMine from 1965 to 2008 and Marshal and Swift index from 1980 to 2009. As a result, all indicesover this period increased between six to ten times for coal mining and processing cost. While, theoperating labour index increased just 40 per cent over the last 40 years, in contrast with the oil andnatural gas fuel index which soared 22 and 51 times respectively from 1965 to 2008.
In addition, the operating cost in 20 mines in Australia and some mines in Canada and the US arediscussed. The availability of mine data in Australia is limited in comparison to US and Canada. TheCCG indices are used as proxy for estimating the cost of each item in Australian surface coal miningcost. Then according to main variables and reliable data, an econometrics model is estimated tocalculate average operating cost.
The econometrics model for estimating operating cost focuses on deposit average thickness,stripping ratio, capital cost and daily production rate as the independent variables and operating costas dependent variable. This model has been developed to explain the influence of independentvariables on estimating operating cost. The model shows that the capital cost and production rate has apositive effect on estimated operating cost and deposit average thickness and strip ratio has a negativeeffect on estimating operating cost. Estimated operating cost based on the model is compared byoperating cost calculated in InfoMine, and proves that the model estimation has ±20 per cent range ofaccuracy with real data. Finally, the econometric model could be calculated for the future byexpanding indices for the future. Accordingly, accurate estimation for mining project cost is verydifficult; nevertheless these types of techniques could supply a view for one of the main uncertaintyvariables in mining projects.
Australian Mining Technology Conference 27 - 28 October 2009 144
ESTIMATING AVERAGE TOTAL COST OF OPEN PIT COAL MINES IN AUSTRALIA
DAT SR CC PR OC EOC Validity range
12.3 10.2 60.88 1.8 31.28 25.05 -20%
3.1 20.2 105.37 1.8 49.27 41.99 -15%
1 40.6 213.75 1.8 84.95 75.86 -11%
12.3 10.2 177.96 7.3 23.94 24.76 3%
3.1 20.2 196.66 7.3 39.50 41.72 6%
1 40.6 354.44 7.3 73.01 75.56 3%
12.3 10.2 361.96 21.8 20.84 24.08 16%
3.1 20.2 551.50 21.8 37.43 40.96 9%
1 40.6 1026.00 21.8 70.67 74.66 6%
12.3 10.2 863.82 65.3 18.87 22.05 17%
3.1 20.2 1500.77 65.3 34.94 38.72 11%
1 40.6 2911.74 65.3 67.77 71.99 6%
12.3 10.2 2373.08 196 16.95 15.94 -6%
3.1 20.2 4348.44 196 34.25 32.00 -7%
1 40.6 8492.86 196 65.68 64.02 -3%
TABLE 4Surface coal mine deposit average thickness, stripping ratio, capital cost, production rate, InfoMine operating costestimation, econometrics operating cost estimation and validity range of two estimations (source: data collected
from InfoMine, 2009 and modellings computed in Eviews).
REFERENCES
Anglo, 2009. Anglo coal in Australia [online]. Available from: <http://www.anglocoal.com.au/>.
BHP, 2009. BHP Billiton [online]. Available from: <http://www.bhp.com.au>.
Chemical Engineering (CHE), 1980 - 2009. Economic indicators [online], Chemical Engineering. Availablefrom: <http://www.che.com>.
CostMine, 2009. Coal cost guide: A subscription cost data service, Spokane Valley, WA, InfoMine USA Inc.
Ensham, 2009. Ensham [online]. Available from: <http://www.ensham.com.au/>.
Felix Resources Ltd, 2009. Felix Resources Ltd [online]. Available from: <http://www.felixresources.com.au/>.
Gentry, D W and O’Neil, T J, 1984. Mine Investment Analysis (Society of Mining Engineers of AmericanInstitute of Mining, Metallurgical and Petroleum Engineers Inc: New York).
Gloucester, 2009. Gloucester Coal [online]. Available from: <http://www.gloucestercoal.com.au/>.
Idemitsu, 2009. Idemitsu [online]. Available from: <http://www.idemitsu.com/>.
InfoMine, 2009. Cost mine [online], Mining Intelligence and Technology. Available from: <http://www.infomine.com>.
Jaeger, W K, 2006. The hidden costs of relocating sand and gravel mines, Resources Policy, 31(3):146-164.
Lima, G A C and Suslick, S B, 2006. Estimating the volatility of mining projects considering price and operatingcost uncertainties, Resources Policy, 31(2):86-94.
Macarthur, 2009. McArthur Coal Limited [online]. Available from: <http://www.macarthurcoal.com.au/>.
Mine Cost, 2009. World mine cost data exchange [online]. Available from: <http://minecost.com/>.
New Hope, 2009. New Hope Corporation Limited [online]. Available from: <http://www.newhopecoal.com.au>.
O’Hara, T A, 1980. Quick guide to the evaluation of orebodies, CIM Bulletin, February, pp 87-89.
Peabody, 2009. Peabody Energy [online]. Available from: <http://www.peabodyenergy.com.au/>.
Rio Tinto. 2009. Biodiversity action plans [online]. Available from: <http://www.riotintocoalaustralia.com.au/>.
Shafiee, S and Topal, E, 2008. Applied real option valuation (ROV) in a conceptual mining project, inProceedings Australian Mining Technology Conference (CRC Mining: Brisbane).
Shafiee, S and Topal, E, 2009. When will fossil fuel reserves be diminished?, Energy Policy, 37(1):181-189.
Shafiee, S, Topal, E and Micha, N, 2009. Adjusted real option valuation to maximise mining project value a casestudy using century mine, in Proceedings Project Evaluation 2009, pp 125-134 (The Australasian Instituteof Mining and Metallurgy: Melbourne).
Smith, L D, 1997. A critical examination of the methods and factors affecting the selection of an optimumproduction rate, CIM Bulletin, February, pp 48-54.
Wesfarmers, 2009. Wesfarmers [online]. Available from: <http://www.wesfarmers.com.au/>.
Whitehaven, 2009. Whitehaven Coal Limited [online]. Available from: <http://www.whitehaven.net.au/>.
Xstrata, 2009. Xstrata [online]. Available from: <http://www.xstrata.com/>.
145 27 - 28 October 2009 Australian Mining Technology Conference
S SHAFIEE, M NEHRING and E TOPAL