Embed Size (px)
Citation preview
Biogeosciences, 6, 349–360, 2009www.biogeosciences.net/6/349/2009/© Author(s) 2009. This work is distributed underthe Creative Commons Attribution 3.0 License.
Biogeosciences
Estimating carbon emissions from African wildfires
V. Lehsten1, K. Tansey2, H. Balzter2, K. Thonicke3, A. Spessa4, U. Weber5, B. Smith1, and A. Arneth1
1Dept. of Physical Geography and Ecosystems Analysis (INES), Geobiosphere Science Centre, Lund University, Sweden2Centre for Environmental Research, Department of Geography, University of Leicester, UK3Potsdam Institute for Climate Impact Research (PIK) e.V., Potsdam, Germany4Walker Institute for Climate System Research, Department of Meteorology, University of Reading, UK5Max-Planck-Institute for Biogeochemistry, Jena, Germany
Received: 18 June 2008 – Published in Biogeosciences Discuss.: 8 August 2008Revised: 28 January 2009 – Accepted: 28 January 2009 – Published: 6 March 2009
Abstract. We developed a technique for studying seasonaland interannual variation in pyrogenic carbon emissions fromAfrica using a modelling approach that scales burned area es-timates from L3JRC, a map recently generated from remotesensing of burn scars instead of active fires. Carbon fluxeswere calculated by the novel fire model SPITFIRE embed-ded within the dynamic vegetation model framework LPJ-GUESS, using daily climate input.
For the time period from 2001 to 2005 an average area of195.5±24×104 km2 was burned annually, releasing an aver-age of 723±70 Tg C to the atmosphere; these estimates forthe biomass burned are within the range of previously pub-lished estimates. Despite the fact that the majority of wild-fires are ignited by humans, strong relationships between cli-matic conditions (particularly precipitation), net primary pro-ductivity and overall biomass burnt emerged. Our investiga-tion of the relationships between burnt area and carbon emis-sions and their potential drivers available litter and precipi-tation revealed uni-modal responses to annual precipitation,with a maximum around 1000 mm for burned area and emis-sions, or 1200 mm for litter availability. Similar responsepatterns identified in savannahs worldwide point to precipi-tation as a chief determinant for short-term variation in fireregime. A considerable variability that cannot be explainedby fire-precipitation relationships alone indicates the exis-tence of additional factors that must be taken into account.
Correspondence to:V. Lehsten([email protected])
1 Introduction
Fourteen percent of the global population live in Africa,but contribute only 3% to the total anthropogenic fossilfuel emissions (Williams et al., 2007). However, the roleof African ecosystems for the terrestrial carbon cycle andfire emissions is substantial: 20% of the global net pri-mary production (NPP) and 37% of carbon emissions bybiomass burning have been attributed to the African conti-nent (Williams et al., 2007), the latter being mostly releasedby savannah fires with ignition patterns dominated by hu-man land-management. The vast majority of all savannahfires globally occur on the African continent (Williams et al.,2007).
For a natural system in steady-state, carbon dioxide re-leased by fire will be re-assimilated by photosynthesis overthe ensuing period of re-growth and will not therefore con-tribute to variation in the global atmospheric CO2 concen-tration on longer time scales. A different picture emerges,however, when fire is used for the conversion of forests intoagricultural land. In this case, much of the carbon combustedfrom forest woody biomass remains airborne when the burntland is subsequently used for the cultivation of crops on shortrotation cycles. Vegetation wildfires generate a considerableamount of climatically active greenhouse gas and particleemissions on the African continent (Scholes et al., 1996b)but estimates of the seasonal and annual emission patternsare associated with large uncertainties.
The major determinants of the pyrogenic carbon releasefrom wildfires at regional to continental scales are the to-tal available plant material for burning (including litter),the burning conditions that determine the combustion com-
Published by Copernicus Publications on behalf of the European Geosciences Union.

350 V. Lehsten et al.: African wildfire carbon emissions
pleteness, and the annual area burned. Several Africa-wideburned area maps have been produced, e.g. GLOBSCAR(Simon et al., 2004), GBA2000 (Tansey et al., 2004), andthe product of Barbosa et al. (1999). However, because ofthe lack of temporal continuity of these products, burnedarea estimates required for national greenhouse gas invento-ries are often based on active fires (dubbed “hotspots”) de-tected using satellite-bound thermal sensors (Giglio et al.,2006; Smith et al., 2007) which are available in near realtime. Using active fire detections as a proxy for area burntin the computation of greenhouse gas emissions has severaldrawbacks. The detection is limited by cloud cover obscur-ing the view, as well as by temporal gaps between satelliteoverpasses. Tansey et al. (2008a) showed that 60% of burnscars in a degraded peat swamp forest, comprising patchesof intact forest in a matrix of secondary vegetation heavilyimpacted by fire and excessive drainage went undetected bythe MODIS thermal anomaly (hotspot) product. In a simi-lar study, Smith et al. (2007) arrived at a hotspot probabilitydetection rate of only 13% for agricultural fields in South-western Australia. The successful detection of an active firedepends on a favourable combination of cloud and smokefree conditions, fire intensity and flame front size prevailingat the exact time that the satellite passes overhead.
An alternative way to map burned areas is to use spec-tral reflectance data from satellites to detect the presence ofburn scars (Tansey et al., 2008b). Because burn scars aremuch more persistent than the fires that cause them, the avail-able time period for their detection is longer, avoiding manyof the above-mentioned problems with active fire detection(Kasischke et al., 2003).
To estimate fire-induced greenhouse gas emissions fromthe extent of burned area requires knowledge of the totalamount and type of biomass burnt and of trace-gas specificemission factors. In the approach presented here, we sim-ulate fire CO2 emissions using a modelling system integrat-ing a detailed mechanistic fire model SPITFIRE (Thonicke etal., 2008) within the dynamic vegetation model LPJ-GUESS(Smith et al., 2001; Sitch et al., 2003), while prescribingburned area based on the global burned area database L3JRC(Tansey et al., 2008b), derived by satellite-based fire scar de-tection and with a temporal resolution of one day. To ourknowledge, the only comparable work which similarly com-bines satellite-derived fire data with biogeochemical mod-elling is the GFED data base by van der Werf et al. (2006).The latter is based on burned area estimates from active firedata with the biogeochemistry model CASA providing pyro-genic emission fluxes based on meteorological data, satellite-sensed vegetation greenness (Normalised Difference Vege-tation Index, NDVI) and prescribed vegetation (vegetationcontinuous fields1). Our approach is unique because we usea recent burned area product for Africa in combination witha detailed mechanistic vegetation model that accounts for
1 http://glcf.umiacs.umd.edu/data/vcf/
landscape-scale heterogeneity and vertical structure of veg-etation, which are important factors determining the burningcharacteristics as well as fuel loads. The input data to themodel are observed, gridded meteorological and soil data.For the period 2001 to 2006, we investigate the seasonalityand inter-annual variation in fire activity and emissions fromvegetation fires over the African continent and discuss theirrelationships to climatic conditions and vegetation produc-tivity.
2 Materials and methods
2.1 Burned area – L3JRC
The L3JRC burnt area product (Tansey et al., 2008b) coversthe period 2001–2006 and is based on SPOT VEGETATIONS1 reflectance data, available on a global, daily, basis. Obser-vations of the ground were restricted to satellite view zenithangles of less than 50.5 degrees and areas of snow, smoke,cloud, cloud shadow and a sun shadow were masked. Theburned area algorithm in L3JRC makes use of a temporalindex in the 0.83µm (near infrared, NIR) channel that hasthe advantage of being highly sensitive to the photosyntheticactivity of vegetation (see Tansey et al., 2008b for further in-formation). Post-processing of the data serves to utilize thelatest land cover information to remove some overdetectionsbelieved mainly to be due to the multi-annual detection ofleaf-off conditions in temperate regions and lake melt at highnorthern latitudes. The L3JRC product has been evaluatedusing 72 Landsat Thematic Mapper (TM) scenes, 14 fromthe African continent. A comparison between the burnt areadetected by L3JRC and that detected by Landsat TM wasmade between two specified dates. The correlation betweenburned areas over a standardized equal area grid was com-puted to derive correlation gradients, intercept values andstandard deviations around a best fit line.
The burnt area estimates were corrected for the calcu-lated underestimation of burnt area introduced by the low-resolution observations and also the standard deviation ob-served around the best-fit line when compared to a number ofLandsat TM images. The following assumptions were made:In both hemispheres, approximately 60% of the burning ac-tivity occurs in vegetation that is described in the GlobalLand Cover (GLC) 2000 product as being broadleaved or de-ciduous tree or shrub cover of various degrees of openness inreasonably equal portions. The remainder of the burnt areais spread across five other land cover types. From an ear-lier validation exercise (Tansey et al., 2008b), we know thatfor tree and shrub cover classes the underestimation of burntarea is approximately 48% and 35%, respectively. Hence,assuming that on average 60% of the total area burnt is un-derestimated by 42% we can derive a more accurate estimateof the true scale of burning. Furthermore, we corrected forthe standard deviation (2 s.d.) that we observe in these two
Biogeosciences, 6, 349–360, 2009 www.biogeosciences.net/6/349/2009/

V. Lehsten et al.: African wildfire carbon emissions 351
land cover types which are both close to 8%. No correctionwas applied to other land cover types, which make up 40%of the remaining vegetation cover that is burnt. The observedunderestimation of over 40% (Tansey et al., 2008b) informsus that the true scale of burning across Africa is greater thanwe can easily measure using 1 km resolution satellite sensors.
2.2 LPJ-GUESS-SPITFIRE
To simulate potential vegetation we used the dynamic vegeta-tion modelling framework LPJ-GUESS incorporating the firemodel SPITFIRE (Thonicke et al., 2008) as an integral com-ponent. LPJ-GUESS, which is described in detail in Smithet al. (2001), simulates potential vegetation as a mixture ofplant functional types (PFTs) defined by growth form, phe-nology, life-history characteristics and bioclimatic limits forestablishment and survival. Biogeochemical processes re-lated to assimilation and respiration are similar to a moregeneralized, global model, LPJ-DGVM (Sitch et al., 2003);the version used in this study includes improved representa-tions of ecosystem hydrological cycling as documented byGerten et al. (2004). The model framework is applied in“cohort”-mode that represents the vegetation of a given mod-eled area or gridcell by a number of patches in differentstages of recovery or succession following disturbance, andwithin each patch by cohorts that differ in age and currentgrowth characteristics (Smith et al., 2001). Establishment,mortality and competition among neighboring individuals forlight and soil resources are taken into account explicitly. Toaccount for the heterogeneity resulting from population pro-cesses, which are modeled stochastically, the vegetation cov-erage of a grid-cell is taken as the average among the repli-cated patches (Smith et al., 2001). The model is driven byatmospheric CO2 concentration, temperature, precipitation,radiation, and soil physical properties. For this study, burnedarea as detected by L3JRC was also prescribed. The burnedarea map of L3JRC has an original grid spacing of 1 km andwas converted to daily burned fractions per 1 degree grid cell,the latter corresponding to the spatial resolution of the cli-mate input data (see Model experimental setup below). Themodel runs on a daily time step.
Fuel combustion in SPITFIRE depends on the amount offuel, the relative proportions of fuels in different size classes(leaves and twigs, small branches, large branches and trunks)and the moisture content of fuels, and follows Peterson andRyan (1986). The calculation of the latter is based on theNesterov index (Nesterov, 1949) which accumulates on eachconsecutive day with precipitation below 3 mm and is resetto zero (representing saturating litter moisture) after a 3 mmprecipitation event. Following previously used approxima-tions (Venevsky et al., 2002; Thonicke et al., 2008), we setthe dew point temperature which is required to calculate theNesterov Index to the daily minimum temperature minus 4 K(Running et al., 1987). Since the burned area was prescribedfrom a burned area product rather than fire hot spots, the ex-
act timing of the fire was unknown; it could have occurredany time between last non-detection and first detection ofthe burn scar which may be separated by a lag of severaldays. This opens the possibility that burn scars detected forthe first time on rainy days might reset the Nesterov Index inthe SPITFIRE calculations leading to an underestimation offire risk. To avoid this problem, we calculated scorch heightand fuel combustion from the maximum Nesterov Index ofthe week preceding the detection of the burn scar.
Fire intensity in SPITFIRE is explicitly simulated as theproduct of the calorific content of the fuel, the amount offuel consumed and the rate of spread of the fire front (basedon Byram, 1959; Rothermel, 1972; Wilson, 1982; Pyne etal., 1996). It depends on climatic conditions as well as onthe type and amount of available fuel produced by the veg-etation (Thonicke et al., 2008). Above-ground wood littersimulated in LPJ-GUESS-SPITFIRE was separated into dif-ferent size classes (leaves and twigs, small branches, largebranches and trunks) as constant ratios from the total woodlitter mass (comprising mass fractions of 0.045, 0.075, 0.21and 0.67, respectively; Thonicke et al., 2008). The classesare distinguished in the rate at which the moisture contentequilibrates to prevailing atmospheric moisture, which de-pends on the surface-area-to-volume ratio of different sizedfuel (Pyne et al., 1996). For instance, tree and grass leaflitter has a large surface-area-to-volume ratio, thus equili-brating relatively quickly to changing prevailing atmosphericmoisture conditions and supporting intense fires of short du-ration. Due to their rapid drying response to higher temper-atures and/or lower relative humidity, fine fuels are gener-ally totally consumed by most fires and fine fuel fires spreadvery quickly. By contrast, the fuel classes representing deadstem wood respond less rapidly to changes in ambient mois-ture conditions because they have a smaller surface-area-to-volume ratio. While coarse litter does not normally affect therate of spread of fires, when conditions are sufficiently dry,such as during the late dry season or during droughts, coarserfractions become increasingly available for combustion and,as a result, play an increasing role in determining the fire in-tensity and rate of spread.
Carbon pools are updated annually, in the standard imple-mentation of LPJ-GUESS (Smith et al., 2001). In the case oflitter production, however, this would be too coarse to cap-ture the seasonality of the fire regime. Litter carbon poolswere therefore updated daily, with raingreen trees sheddingtheir leaves when the ratio of soil water supply to plant de-mand (ω; Sitch et al., 2003) fell below 0.35 for more than30 consecutive days. For grasses, a threshold of 7 days wasused. Shed leaves were immediately added to the litter pool.The litter decomposition was separated between wood andleaf litter with turnover times at 10◦C of 2.85 years for leaflitter and 20 years for wood litter (turnover times declinewith temperature following a modified Arrhenius relation-ship; Sitch et al., 2003).
www.biogeosciences.net/6/349/2009/ Biogeosciences, 6, 349–360, 2009

352 V. Lehsten et al.: African wildfire carbon emissions
All calculations in the SPITFIRE module were based onthe daily litter pools as simulated by LPJ-GUESS. Car-bon emissions from fires were calculated by multiplying theburned area with the amount of available litter encompassedby it, with the overall combustion depending on the litter typeand environmental conditions as described above.
Hanan et al. (2008) identified size dependent mortality asone of the key factors for correctly modelling the effects ofwildfires on savannah vegetation. In SPITFIRE, the effectof fires on tree survival depends on the degree of crown andcambial damage (Thonicke et al., 2008). The proportion ofthe crown affected by fire depends on crown architecture, theheight of the tree in relation to the scorch height of the fire,and the resistance to crown scorching, which differs amongPFTs. Scorch height is a non-linear function of fire inten-sity and is likewise PFT-specific. Cambial damage dependson the residence time of the fire and bark thickness, whichis a function of tree diameter and is also PFT-specific (Thon-icke et al., 2008). This captures the generally observed fire-induced mortality dynamics whereby small trees (i.e. youngage cohorts) are more likely to be affected by crown scorch-ing and cambial damage than older and taller trees. Duringthe course of a simulation, this size dependent mortality af-fects the ratio of trees to grass, the age distribution of trees,feeding back on fuel production and fire intensity.
In order to improve the representation of savannah veg-etation dynamics in LPJ-GUESS, a minimum available soilmoisture level for tree establishment was introduced, follow-ing Miller et al. (2008). By increasing the ratio between stemdiameter and tree height for tropical broad-leafed rain-greentrees (values based on measurements ofAcacia senegalinDemokeya, Sudan, Bashir Awad El Tahir, unpublished) amore realistic tree density was achieved. Fire-related PFTparameters, like susceptibility to crown scorching or cam-bial damage and fuel bulk density, were generally set as inThonicke et al. (2008). For tropical broadleaf rain-greentrees, however, the mortality in response to complete crownscorching was increased from 5% to 87% corresponding tothe average stem mortality found for deciduous trees after anintense fire by Williams et al. (1998). Furthermore, the mor-tality caused by cambial damage was reduced to zero sinceit is known that these trees suffer very low fire related mor-tality as long as their crown is not scorched (Hanan et al.,2008). We are not aware of measurements of fuel bulk den-sities of litter generated by tropical raingreen trees and there-fore adopted the value for the tropical broad leafed evergreentrees from Thonicke et al. (2008), which is based on Williamset al. (1998).
2.3 Model experiment setup
LPJ-GUESS-SPITFIRE was applied on a 1×1 degree gridacross Africa. 100 patches of 1000 m2 each were simulatedfor each gridcell, to account for stochastic processes (seeSect. 2.2). The scale at which fires normally occur is larger
than the scale of a single simulated patch, and the fractionalarea burned each year, as detected by L3JRC, can be assumedto be equal to the probability with which any particular patchburns. By simulating multiple patches at each grid cell andsubsequently averaging, we ensure not only that the conceptof “area burned” within SPITFIRE closely corresponds to theburned area detected by L3JRC but also that effects on veg-etation structure, like tree age and spacing are representedrealistically (see Fig. 1).
The climate data set covered the period from 1979 to 2006,hereinafter referred to as the “target period”. Temperatureand global radiation were obtained from NCEP re-analysis IIdata (Kalnay, 1996) and averaged to daily values. Precipita-tion was derived by adjusting NCEP re-analysis II data withCRU data (CRU-TS2.1, Mitchell and Jones 2005, extendingto 2002 and augmented with data for the year 2003 derivedusing the same techniques) and TRMM data (Kummerow etal., 1998), in order to correct the known bias in the NCEPprecipitation data for this area. The adjustments were car-ried out as follows. For the TRMM period (1998–2006), amonthly correction factor between NCEP re-analysis II dataand TRMM data was applied. For the period prior to TRMM(1979–1997) precipitation was corrected based on the prod-uct of a monthly correction factor between CRU data withNCEP re-analysis II data, and a monthly mean correction fac-tor between TRMM data and CRU data (1998–2003). Thisdecreased overall precipitation by 15%. The simulationsstarted with a spin up of 1000 years to achieve vegetationstructure and soil carbon pools in approximate steady statewith climate at the beginning of the target period. Duringthe spin up, the model was driven by the 28-year climatetime series for the target period, cycled repeatedly, while theCO2 level was kept constant at the 1982 level of 341.13 ppm,which is the level stipulated in the CarboAfrica Model Inter-comparison protocol (Weber et al., 2008). Following the spinup, CO2 concentrations were set to the observed level for thecorresponding calendar year according to measurements atMauna Loa2. From the target period simulation, output datafrom the six-year period 2001–2006 were extracted for fur-ther analysis.
2.4 Analysis of the relationships between precipitation,burned area, litter and emissions
Since the fire season is shifted by six months between North-ern (NHA) and Southern Hemisphere Africa (SHA), we re-lated burned area, emissions and litter to the precipitationwhich occurred in the 365 days before the average fire sea-son peaking date for the region (NHA: 15 March; SHA: 15September).
For each grid cell, the arithmetic mean of the precipita-tion, and the model output variables leaf litter, emissions andburned area were calculated over the six-year period 2001–
2Data fromwww.esrl.noaa.gov/gmd/ccgg/trends/.
Biogeosciences, 6, 349–360, 2009 www.biogeosciences.net/6/349/2009/

V. Lehsten et al.: African wildfire carbon emissions 353
To account for stochastic processes, several patches are simulated for each grid cell
50% burned area detected by L3JRC
If one patch burns 100% and the other does not burn, the trees in the unburned patch have no increase in light and space availability
If 50% of both patches burn, surviving trees have more light and space available
Burning of simulated cells in LPJ-GUESS-SPITFIRE
There is no spatial heterogeneity within a patch
Figure 1. The representation of burning a fraction of a grid cell in LPJ-GUESS-
SPITFIRE using an example 50% burned area detected by L3JRC.
Fig. 1. The representation of burning a fraction of a grid cell in LPJ-GUESS-SPITFIRE using an example 50% burned area detected byL3JRC.
2006. A scatter plot was generated and a generalized lin-ear model (GLM) was fitted between the independent andthe response variable, applying a logit transformation to theresponse data and assuming binomial error structures. Thelogit transformation requires the dependent variable to bebounded between 0 and 1 (Dobson, 2002), which is the casefor ratios like the burned area. In the case of leaf area andemissions, which are not ratios, the values were transformedto proportions of an arbitrary maximum value by dividing by10 kg for leaf litter and 1 kg for emissions (see Fig. 6). The(logit) transformation of the response variableV is:
logit(V )=loge(V/(1−V )). (1)
Values ofV which were equal to 0 were set to 0.00001. TheGLMs contained a linear and a quadratic term of the predic-tor variable. The coefficient of determination (r2) was calcu-lated by back-transforming the modelled values
V =1/(1+elogit(V )
)(2)
for the data which were used to estimate the GLM, and re-gressing them on the observed values. Parameters for theGLMs were derived according to Dobson (2002). FittingGLMs to the data (i) allows the general trend as well as theshape of the relationship to be examined, which would oth-erwise be difficult given the limited number of data points inthe scatter plot, and (ii) allows a coefficient of determination(r2) to be computed, showing the strength of the relationship.
Figure 2. Frequency and spatial extent of burned area covering the seven year period 1
April 2000-31 March 2007 in sub-Saharan Africa according to the satellite-based burnt
area map L3JRC. Fig. 2. Frequency and spatial extent of burned area covering theseven year period 1 April 2000–31 March 2007 in sub-SaharanAfrica according to the satellite-based burnt area map L3JRC.
3 Results
3.1 Burned area – L3JRC
The frequency and spatial extent of L3JRC burnt area withinthe sub-Sahara region of Africa is shown in Fig. 2, cover-ing seven fire years between 1 April 2000 and 31 March2007. Two main regions of burning activity can be identifiedwhere fires occur on an almost annual basis. The first is aregion in Sudan, Chad and Ethiopia, the second covers partsof D.R. Congo, Angola, Tanzania and Mozambique. The po-tential vegetation simulated by LPJ-GUESS-SPITFIRE forthese areas mainly consists of drought-deciduous forests andwoodlands (not shown, Lehsten et al., 2009). The produc-tivity in these areas is strongly related to precipitation: anincrease in precipitation results in a replacement of the decid-uous vegetation by evergreen forest according to the model(not shown, Lehsten et al., 2009). Large parts of these ar-eas are used for agriculture and grazing resulting in a highpotential for ignition by humans.
Estimates of burnt area, productivity and pyrogenic carbonrelease are given for the area north and south of the equatorin Table 1, separated into the six years covered by L3JRC,and are compared to a number of previously published suchestimates.
3.2 Fire seasonality and pyrogenic carbon emissions
The fire season of the Northern Hemisphere peaks in March,with very low fire activities from June to January, while inthe southern part of the continent the peak lies in Octoberwith the main activity from August to January (see Fig. 3).
The calculated total amount of biomass burned forthe entire continent was 723±70 Tg C a−1 over the period
www.biogeosciences.net/6/349/2009/ Biogeosciences, 6, 349–360, 2009
354 V. Lehsten et al.: African wildfire carbon emissions
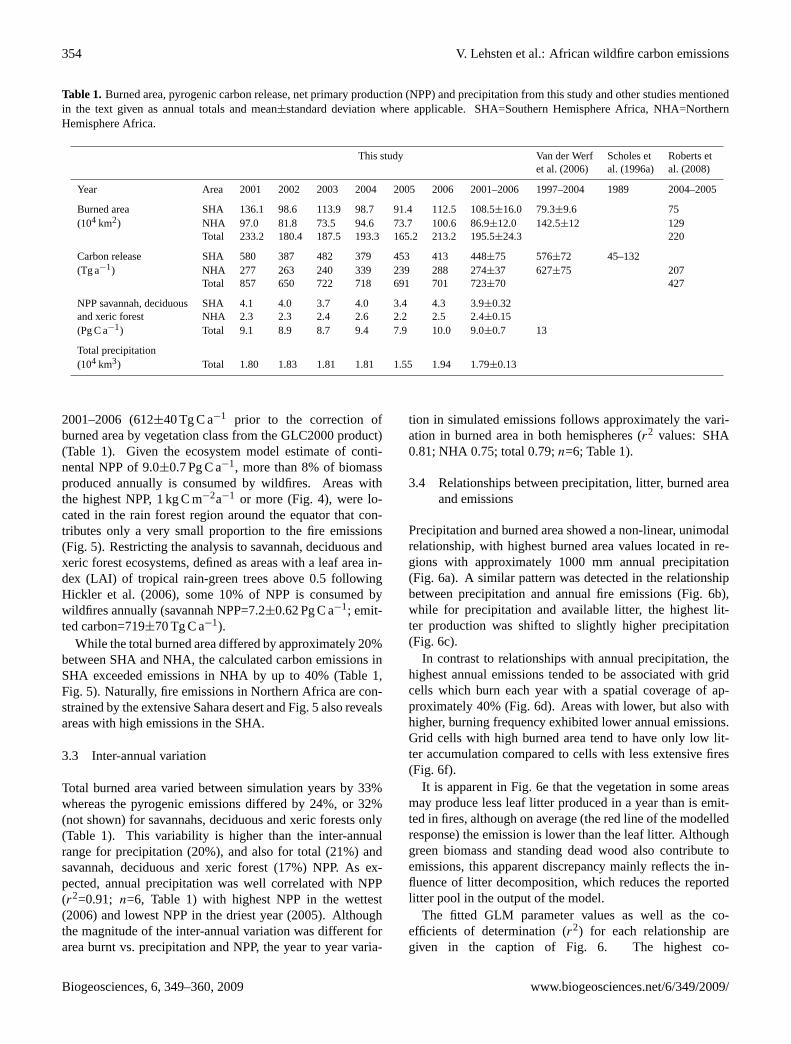
Table 1. Burned area, pyrogenic carbon release, net primary production (NPP) and precipitation from this study and other studies mentionedin the text given as annual totals and mean±standard deviation where applicable. SHA=Southern Hemisphere Africa, NHA=NorthernHemisphere Africa.
This study Van der Werf Scholes et Roberts etet al. (2006) al. (1996a) al. (2008)
Year Area 2001 2002 2003 2004 2005 2006 2001–2006 1997–2004 1989 2004–2005
Burned area SHA 136.1 98.6 113.9 98.7 91.4 112.5 108.5±16.0 79.3±9.6 75(104 km2) NHA 97.0 81.8 73.5 94.6 73.7 100.6 86.9±12.0 142.5±12 129
Total 233.2 180.4 187.5 193.3 165.2 213.2 195.5±24.3 220
Carbon release SHA 580 387 482 379 453 413 448±75 576±72 45–132(Tg a−1) NHA 277 263 240 339 239 288 274±37 627±75 207
Total 857 650 722 718 691 701 723±70 427
NPP savannah, deciduous SHA 4.1 4.0 3.7 4.0 3.4 4.3 3.9±0.32and xeric forest NHA 2.3 2.3 2.4 2.6 2.2 2.5 2.4±0.15(Pg C a−1) Total 9.1 8.9 8.7 9.4 7.9 10.0 9.0±0.7 13
Total precipitation(104 km3) Total 1.80 1.83 1.81 1.81 1.55 1.94 1.79±0.13
2001–2006 (612±40 Tg C a−1 prior to the correction ofburned area by vegetation class from the GLC2000 product)(Table 1). Given the ecosystem model estimate of conti-nental NPP of 9.0±0.7 Pg C a−1, more than 8% of biomassproduced annually is consumed by wildfires. Areas withthe highest NPP, 1 kg C m−2a−1 or more (Fig. 4), were lo-cated in the rain forest region around the equator that con-tributes only a very small proportion to the fire emissions(Fig. 5). Restricting the analysis to savannah, deciduous andxeric forest ecosystems, defined as areas with a leaf area in-dex (LAI) of tropical rain-green trees above 0.5 followingHickler et al. (2006), some 10% of NPP is consumed bywildfires annually (savannah NPP=7.2±0.62 Pg C a−1; emit-ted carbon=719±70 Tg C a−1).
While the total burned area differed by approximately 20%between SHA and NHA, the calculated carbon emissions inSHA exceeded emissions in NHA by up to 40% (Table 1,Fig. 5). Naturally, fire emissions in Northern Africa are con-strained by the extensive Sahara desert and Fig. 5 also revealsareas with high emissions in the SHA.
3.3 Inter-annual variation
Total burned area varied between simulation years by 33%whereas the pyrogenic emissions differed by 24%, or 32%(not shown) for savannahs, deciduous and xeric forests only(Table 1). This variability is higher than the inter-annualrange for precipitation (20%), and also for total (21%) andsavannah, deciduous and xeric forest (17%) NPP. As ex-pected, annual precipitation was well correlated with NPP(r2=0.91; n=6, Table 1) with highest NPP in the wettest(2006) and lowest NPP in the driest year (2005). Althoughthe magnitude of the inter-annual variation was different forarea burnt vs. precipitation and NPP, the year to year varia-
tion in simulated emissions follows approximately the vari-ation in burned area in both hemispheres (r2 values: SHA0.81; NHA 0.75; total 0.79;n=6; Table 1).
3.4 Relationships between precipitation, litter, burned areaand emissions
Precipitation and burned area showed a non-linear, unimodalrelationship, with highest burned area values located in re-gions with approximately 1000 mm annual precipitation(Fig. 6a). A similar pattern was detected in the relationshipbetween precipitation and annual fire emissions (Fig. 6b),while for precipitation and available litter, the highest lit-ter production was shifted to slightly higher precipitation(Fig. 6c).
In contrast to relationships with annual precipitation, thehighest annual emissions tended to be associated with gridcells which burn each year with a spatial coverage of ap-proximately 40% (Fig. 6d). Areas with lower, but also withhigher, burning frequency exhibited lower annual emissions.Grid cells with high burned area tend to have only low lit-ter accumulation compared to cells with less extensive fires(Fig. 6f).
It is apparent in Fig. 6e that the vegetation in some areasmay produce less leaf litter produced in a year than is emit-ted in fires, although on average (the red line of the modelledresponse) the emission is lower than the leaf litter. Althoughgreen biomass and standing dead wood also contribute toemissions, this apparent discrepancy mainly reflects the in-fluence of litter decomposition, which reduces the reportedlitter pool in the output of the model.
The fitted GLM parameter values as well as the co-efficients of determination (r2) for each relationship aregiven in the caption of Fig. 6. The highest co-
Biogeosciences, 6, 349–360, 2009 www.biogeosciences.net/6/349/2009/

V. Lehsten et al.: African wildfire carbon emissions 355
J F M A M J J A S O N D0
10
20
30
40
Month
Mon
thly
bur
ned
area
[1
04 km
2 ]
Northern Hemisphere Africa
Southern Hemisphere Africa
Fig. 3. Seasonality of burned area for Northern and Southern Hemi-sphere Africa as estimated by L3JRC (mean values for 2001–2006).The total amount of burned area in the southern part of the continentexceeds the burnt area in the northern part by ca. 20%.
efficient of determination was found between burnedarea and emissions (r2=0.66) followed by precipitationand litter (r2=0.63). A combined GLM in whichburned area and litter are used as predictors for annualemissions results inr2=0.75 (logit (E)=−6.5+14.7×BA−15.7×BA2+156×Lit/10-2314×(Lit/10)2) (not plotted).While the coefficient of determination expresses how closelythe data points follow the estimated function, P-values ofGLMs indicate the difference of each fitted parameter fromzero. For each panel in Fig. 6, P-values were found tobe below 10−10 thus indicating the appropriateness of us-ing the GLM for our analysis. Still, the values ofr2 showthat a considerable proportion of variation remains, that can-not be explained by climate and ecosystem response alonebut may require more sophisticated models incorporatingsocio-economic data, such as on land use, human popula-tions and so on (Archibald et al., 2009). Moreover, when in-terpreting the coefficients of determination, potential cross-correlations should be considered. For instance, litter pro-duction is shown to depend on precipitation (Fig. 6c) whilethe emissions are also related to precipitation (Fig. 6b), hencethe coefficient of determination between litter and emission(Fig. 6e) may be cross-correlated, which has to be taken intoaccount when applying more than one of these relationships,for example as components of a predictive model.
Generating similar GLMs with classes other than leaf litteror with total litter resulted in lowerr2 (data not shown), indi-cating that leaf litter had the strongest influence on emissionsin the simulations.
4 Discussion
We used a remote sensing product to prescribe burnt area ina detailed vegetation model incorporating a mechanistic firemodel and used it to investigate climate-vegetation interac-tions, particularly in terms of NPP and litter production, onfire carbon emissions in Africa. The annual estimates ob-tained for pyrogenic emissions are well within the range of300 to 1800 Tg C a−1 for Africa as a whole (Williams et al.,
kg/m2
Figure 4. Average annual net primary production (NPP) in kg C m-2 a-1 for the period
2001 to 2006 simulated by LPJ-GUESS-SPITFIRE.
Fig. 4. Average annual net primary production (NPP) inkg C m−2 a−1 for the period 2001 to 2006 simulated by LPJ-GUESS-SPITFIRE.
Figure 5. Average pyrogenic annual C emissions by wildfires in kg C m-2 for the period
2001 to 2006 simulated by LPJ-GUESS-SPITFIRE with burnt area prescribed from
L3JRC.
Fig. 5. Average pyrogenic annual C emissions by wildfires inkg C m−2 a−1 for the period 2001 to 2006 simulated by LPJ-GUESS-SPITFIRE with burnt area prescribed from L3JRC.
2007), and 174 to 1200 Tg C a−1 for SHA (Korontzi, 2005)suggested by other recent studies. Pyrogenic emissions arehigher than the fossil fuel emissions from the African con-tinent which were estimated to be on average 260 Tg C a−1
between 2000 and 2005 by Canadell et al. (2008).The vast majority of fires both for SHA and NHA were
simulated to occur in the savannah biome. The total conti-nental fire variability was (as expected) considerably smallerthan the variability of both burned area and pyrogenic emis-sions of the savannah biome alone. This is an indication of alarge dilution effect exerted by rainforest areas where only avery small proportion of the burned area for the whole conti-nent was detected.
www.biogeosciences.net/6/349/2009/ Biogeosciences, 6, 349–360, 2009

356 V. Lehsten et al.: African wildfire carbon emissions
e) logit (E)=-0.00511+0.189 • Lit/10 - 3.58 • (Lit/10)2 (r2=0.37).
d) logit (E)=-0.0051+0.018 • BA-0.024 • BA2 (r2=0.66)
c) logit (Lit/10)=-0.0068+4.92 • 10-6 • Prec-1.92•10-9 • Prec2 (r2=0.63)
b) logit (E)=-0.00347+0.145 • Prec - 3.55 • Prec2 (r2=0.51)
a) logit (BA)=-0.0065+1.02 • 10-5 • Prec-5.27 • 10-9 • Prec2 (r2=0.51)
Red curves are fitted GLMs with the following parameters:
Figure 6. The relationship between precipitation (prec), burned area (BA; expressed as
fraction of a gridcell burnt), leaf litter (Lit) and emissions (E). Emission and burned
area are scaled by dividing by 1kg C and 10 kg C respectively for the estimation of the
GLMs. All values are mean values for a 1-degree grid cell for 2000-2006. Coefficients
of determination are given for each relationship, P-values for each parameter are below
10-10 in all cases (see Section 3.4 for further explanation).
(b)
(c)
(d)
(e)
(f)
(a)
Fig. 6. The relationship between precipitation (prec), burned area (BA; expressed as fraction of a gridcell burnt), leaf litter (Lit) and emissions(E). Emission and burned area are scaled by dividing by 1 kg C and 10 kg C respectively for the estimation of the GLMs. All values are meanvalues for a 1-degree grid cell for 2000–2006. Coefficients of determination are given for each relationship, P-values for each parameter arebelow 10−10 in all cases (see Sect. 3.4 for further explanation). Red curves are fitted GLMs with the following parameters:
(a) logit (BA)=−0.0065+1.02·10−5·Prec−5.27·10−9
·Prec2 (r2=0.51)
(b) logit (E)=−0.00347+0.145·Prec−3.55·Prec2 (r2=0.51)
(c) logit (Lit/10)=−0.0068+4.92·10−6·Prec−1.92·10−9
·Prec2(r2=0.63)
(d) logit (E)=−0.0051+0.018·BA−0.024·BA2(r2=0.66)
(e) logit (E)=−0.00511+0.189·Lit/10−3.58·(Lit/10)2(r2=0.37).
In the comprehensive study of global biomass burning byvan der Werf et al. (2006), the estimated pyrogenic emis-sions from SHA of 576±72 Tg C a−1 were calculated fora burned area of 79.3±9.6×10⁴ km2. These values are inthe same range as an earlier estimate (van der Werf et al.,2003) based on the same biogeochemical model, but fora single year only and with different driving data. ForNHA, 627±75 Tg C a−1 were emitted from a burned areaof 142.5±12.3×10⁴ km2; excluding the Mediterranean re-gions. In a study by Scholes et al. (1996a), burned areaand biomass estimates from remotely sensed NDVI and hotspot data were combined with a functional vegetation typeclassification with respect to the fire regime. Fuel load inthis approach was estimated from mean annual precipita-
tion and vegetation. Their estimate of biomass burned forSHA, 45–132 C a−1 (90–264 Tg dry matter a−1) in the year1989, is much lower than our estimate of between 379 and580 Tg C a−1 for the six-year period 2001–2006. While ourestimates of the pyrogenic emissions and burnt area are com-parable to the results from van der Werf et al. (2003, 2006)for SHA, they differ substantially for the northern part of thecontinent. Aside from differences in the calculated produc-tivity (see below) this discrepancy might be explained by theproportionally larger burned area in NHA compared to SHAinferred by van der Werf (2006). L3JRC depicts a signifi-cantly lower burnt area in NHA than SHA even though theMediterranean areas are included. Since L3JRC is based onthe detection of burn scars, which remain visible for longer
Biogeosciences, 6, 349–360, 2009 www.biogeosciences.net/6/349/2009/

V. Lehsten et al.: African wildfire carbon emissions 357
than an active fire, it should provide more accurate informa-tion than a hot spots product (Giglio et al., 2006; van derWerf et al., 2006). In some regions, burn scars are likely tobe underestimated, but we applied corrections (Tansey et al.,2008b) to compensate for this.
Our approach estimates wildfire emissions based on ob-served climate and inferred fuel loads. An alternative ap-proach is to use remotely-sensed fire radiative energy asa proxy for combustion completeness. In a recent study,Roberts et al. (2008) derived the annual African pyrogeniccarbon emission to be above 427 Tg C (855 Tg dry mass) be-tween February 2004 and January 2005. The authors con-sider this value to be an underestimate because in their anal-ysis the majority of African fires are detected only once inconsecutive 15 min imaging slots, suggesting a high num-ber of undetected fires. Allowing for some underestimation,the Roberts et al. study provides some tentative support forour estimate of 718 Tg C for 2004 based on an independentmethod.
Interannual variability of fire-related carbon emissions(1985–1991) was reported in Barbosa et al. (1999) for South-ern Hemisphere Africa, using images from the AVHRR sen-sor with a 5 km resolution combined with a map of themain vegetation classes. These classes were used to assignbiomass density, combustion efficiency and emission factorsto each biome which were modified by weekly values ofNDVI, derived from the same remote sensing product. Theirvalue of 50% was larger than the 34% calculated in our study.The differences in methodology as well as in the in time peri-ods covered makes a direct comparison difficult. Overall, weconsider our estimates of burned biomass and its inter-annualvariability to be rather conservative owing to the use of pre-cipitation at relatively coarse resolution (2.5 degree grid fromNCEP, Kalaney 1996) which, combined with the assumptionof homogenous precipitation throughout each grid cell, maylead to an underestimation of fuel dryness.
Variation in NPP affects fuel load and thus the amount ofbiomass that can be combusted and sustain fire spread. Thetotal amount and distribution of NPP and the processes un-derlying its interannual variability in NPP constitute a ma-jor uncertainty in the estimation of African fire emissions.Using the CASA biogeochemical model constrained by re-motely sensed NDVI, van der Werf et al. (2006) estimatedan NPP of 13 Pg C a−1 for the whole of Africa, which is atthe upper end of published estimates, which range from 7 to13 Pg C a−1 (Williams et al., 2007). The lower NPP calcu-lated with LPJ-GUESS, 9.0 Pg C a−1 as an average over thesimulation period, is one of the reasons for the lower esti-mated continental emission of carbon in this study comparedto van der Werf et al. (2006), even though the L3JRC burnedarea is larger than the hotspot-based burned area dataset usedin the van der Werf study. On a burned area basis, vander Werf (2006) estimated emissions of 441 g C m−2 a−1 forNHA and 734 g C m−2 a−1 for SHA compared with our es-timates of 318 g C m−2 a−1 and 414 g C m−2 a−1 , respec-
tively. Differences in NPP calculation between CASA andLPJ-GUESS are likely the main reason for these differentestimates. Although both studies arrived at higher averagepyrogenic emissions for SHA, their regional totals still differby up to 70%.
The uni-modal relationship emerging between burned areaand precipitation for African savannahs is similar to the re-lationship between mean annual precipitation and the pro-portion of area burned for the wet-dry tropics of NorthernAustralia (Spessa et al., 2005). There, burned area peakedaround 1200 mm annual precipitation, and mean proportionof burned area at this maximum was somewhat higher (0.28)compared with 0.2 in our study. These observations indicatea strong similarity in the functional properties of savannahsin different parts of the world. The common denominatoris that precipitation is an important driver not only for NPPbut also for litter production and thereby fuel load (Fig. 6c,r2=0.63), as demonstrated also at the site level by Hely etal. (2007).
In our simulations, the relationship between leaf litter andemissions was relatively weak (Fig. 6e,r2=0.37). Althoughthis may seem counter-intuitive, two explanations can be of-fered: (i) wet regions also accumulate litter, but either do notburn as frequently as expected from their fuel load alone, orif they burn, their lower combustion efficiency results in lowemission rates per litter combusted; (ii) frequently burned ar-eas (Fig. 6f) tend to have low fuel loads, because a certainamount of time is needed for litter to accumulate. In ourmodelled results, emissions decline for burned areas that areproportionally larger than 0.4 (Fig. 6b). However, combin-ing burned area and available litter in a GLM resulted in ahigher coefficient of determination than using burned area asthe sole predictor of carbon emissions, indicating the impor-tance of both factors for emissions.
Emissions of wildfires have been successfully related tolarge scale phenomena such as the El Nino Southern Oscilla-tion (ENSO) and the Indian Ocean Dipol Oscillation (Rianoet al., 2007; Patra et al., 2005). Biomass burning has beenshown to strongly contribute to inferred CO2 flux anomaliesin tropical regions (Patra et al., 2005). In an analysis of an18-year time series of burned area data, Riano et al. (2007)found the Southern Oscillation Index to be a statistically sig-nificant predictor variable of African burned area with a timelag of 20 months. In our study, neither an extreme El Ninonor an extreme La Nina event occurred over the observationperiod i.e. the Oceanic Nino Index (ONI) was in the range of−1.7 and +1.5 (3 month running average) compared to thestrong El Nino event 1997 that resulted in maximum ONIvalues3 of 2.5. While the absence of a strong El Nino eventin the study period precludes us to add to the related bodyof literatures it may well serve as an indication that the an-nual variation in NPP as well as burnt area at least in some
3Data from http://www.cpc.ncep.noaa.gov/products/analysis/monitoring/ensostuff/ensoyears.shtml.
www.biogeosciences.net/6/349/2009/ Biogeosciences, 6, 349–360, 2009

358 V. Lehsten et al.: African wildfire carbon emissions
regions of the African continent might be larger compared tothe results presented here.
The vast majority of fires in Africa are ignited by humans(Saarnak, 2001) as part of grazing management and agricul-tural activities. SPITFIRE distinguishes anthropogenic andlightning ignition sources to calculate burnt area, but both arecomplex to parameterise and will be investigated in a sepa-rate study (Lehsten et al., unpublished). Using a global pa-rameterisation of ignitions by humans, Thonicke et al. (2008)calculate a burnt area of 117±14×104 km2 in NHA and198±18×104 km2 in SHA (mean value for 1997–2002±standard deviation), somewhat larger than L3JRC, but witha similarly greater burned area south of the equator. Whilenot part of the analysis here, adopting a suitable parameter-isation for human caused ignition patterns based on popula-tion distribution and life-style is an important task to reduceuncertainties in the modelling of African fires (Archibald etal., 2009).
The calculated emissions are influenced by errors in allparts of the simulation as well as errors propagating fromthe remote sensing and climate data. Since LPJ-GUESS andSPITFIRE interact very strongly in the simulation of dif-ferent processes and at different timescales, a rigorous er-ror propagation analysis would be challenging, and well be-yond the scope of the present study. However, we here at-tempt to highlight the main uncertainties in the modelling.The sensitivity of LPJ-GUESS and the closely-related globalmodel LPJ-DGVM to its many parameters was explored byZaehle et al. (2005) and Wramneby et al. (2008). Zaehle et al.showed that the modelled NPP responds strongly to the set-tings of parameters governing the quantum efficiency of pho-tosynthesis and the efficiency with incoming solar radiationis absorbed by leaves. Both parameters are rather uncertainand vary among species, biomes, climate zones and the sea-sons. Despite such uncertainty, the overall modelled carboncycle response to trends in climate or atmospheric CO2 con-centrations show robust features and agreement with obser-vations such as ecosystem carbon fluxes (Zaehle et al., 2005;Wramneby et al., 2008). For the simulation of global burnedbiomass with LPJ-SPITFIRE, Thonicke et al. (2008) foundthat uncertainties in fuel bulk density (FBD) and populationdensity affected the results most substantially. Populationdensity affects ignition but is irrelevant in our study as burntarea was prescribed. FBD directly influences fire spread aswell as overall combustion and hence vegetation mortality.For the global simulations, biomass burning using maximumpublished values for FBD differed by 57% from simulationsthat used the lowest published FBD values (Thonicke et al.,2008). We expect our simulation to be less sensitive to theuncertainty in FBD because our approach to prescribe burnedarea from a satellite product eliminates the influence of FBDon burned area. Nonetheless, the uncertainty in the L3JRCdatabase may be of the same order of magnitude even thougha correction by land cover class has been performed.
5 Outlook
Using a novel approach, our estimates of burnt area andbiomass for sub-Saharan Africa are within the range of previ-ous estimates. Using a dynamic vegetation model allowed usto characterise the strongly non-linear relationships amongprecipitation, NPP and litter production as the main driversof fire emissions, yielding some general patterns that mightbe representative for savannah ecosystems globally.
Projected climate change in Africa is expected to result ina decrease in continental NPP as declining precipitation insavannah areas stresses plants (Friedlingstein et al., 2008),counteracting the effects of CO2 fertilisation (Hickler et al.,2008). Our results confirm the dependence of burned areaand pyrogenic carbon emissions on precipitation, and wemay therefore expect the fire regime to be strongly influ-enced by reducing rainfall trends. Though wildfires per se donot generate a net CO2 flux to the atmosphere as long as thevegetation can sequester the carbon by subsequent growth,a change in precipitation as well as a change in fire regimecan change the carbon stocks in the biomass as well as inthe soil and thereby result in a net loss of CO2 to the atmo-sphere. Wildfires have been shown to depend crucially onsocio-economic drivers (Archibald et al., 2008). Studies de-veloping global change projections as well as past pattern ofAfrican fire emissions will need to develop methods to ac-count for human and natural (lightning) ignition patterns andto simulate ignition dynamically instead of using a prescribedburned area.
Acknowledgements.The work was supported by the Euro-pean Commission via the FP6 project CarboAfrica. We thankBashir Awad El Tahir for providing the vegetation parametersfor savannah trees. The L3JRC production team, J.-M. Gregoire,P. Defourny, R. Leigh, J.-F. Pekel, E. van Bogaert, E. Bartholome,J. M. C. Pereira, A. Barros and J. Silva are acknowledged.C. Prentice contributed to the development of the SPITFIRE model.P. Harmand’s help with statistical issues is acknowledged.
Edited by: J. Kesselmeier
References
Archibald, S., Roy, D. P., van Wilgen, B. W., and Scholes, R. J.:What limits fire?: An examination of drivers of burnt area inSouthern Africa, Glob. Change Biol., 15(3), 613–630, 2008.
Barbosa, P. M., Stroppiana, D., Gregoire, J. M., and Pereira,J. M. C.: An assessment of vegetation fire in Africa (1981–1991): Burned areas, burned biomass, and atmospheric emis-sions, Global Biogeochem. Cy., 13, 933–950, 1999.
Byram, G. M.: Combustion of forest fuels, in: Forest Fire: Controland Use, edited by: Davis, K., McGraw-Hill Book Company,New York, 61–89, 1959.
Canadell, J. G., Raupach, M. R., and Houghton, R. A.: Anthro-pogenic CO2 emissions in Africa, Biogeosciences Discuss., 5,4395–4411, 2008,http://www.biogeosciences-discuss.net/5/4395/2008/.
Biogeosciences, 6, 349–360, 2009 www.biogeosciences.net/6/349/2009/

V. Lehsten et al.: African wildfire carbon emissions 359
Dobson, A. J.: An introduction to generalized linear models, Chap-man & Hall/CRC texts in statistical science series, Chapman &Hall/CRC, Boca Raton, Chapter 2, 2002.
Friedlingstein, P., Cadule, P., Piao, S. L., Ciais, P., and Sitch, S.:The African contribution to the global climate-carbon cycle feed-back of the 21st century, Biogeosciences Discuss., 5, 4847–4866,2008,http://www.biogeosciences-discuss.net/5/4847/2008/.
Gerten, D., Schaphoff, S., Haberlandt, W., Lucht, W., and Sitch,S.: Terrestrial vegetation and water balance – hydrological eval-uation of a dynamic global vegetation model, J. Hydrol., 286,249–270, 2004.
Giglio, L., van der Werf, G. R., Randerson, J. T., Collatz, G. J., andKasibhatla, P.: Global estimation of burned area using MODISactive fire observations, Atmos. Chem. Phys., 6, 957–974, 2006,http://www.atmos-chem-phys.net/6/957/2006/.
Hanan, N. P., Sea, W. B., Dangelmayr, G., and Govender, N.: Dofires in savannas consume woody biomass? A comment on ap-proaches to modeling savanna dynamics, Am. Nat., 171, 851–856, 2008.
Haxeltine, A. and Prentice, I. C.: A general model for the light-useefficiency of primary production, Funct. Ecol., 551–561, 1996.
Hely, C., Caylor, K. K., Dowty, P., Alleaume, S., Swap, R. J.,Shugart, H. H., and Justice, C. O.: A temporally explicit produc-tion efficiency model for fuel load allocation in southern Africa,Ecosystems, 10, 1116–1132, 2007.
Hickler, T., Prentice, I. C., Smith, B., Sykes, M. T., and Zaehle,S.: Implementing plant hydraulic architecture within the LPJDynamic Global Vegetation Model, Global Ecol. Biogeogr., 15,567–577, 2006.
Hickler, T., Smith, B., Prentice, I. C., Mjofors, K., Miller, P., Ar-neth, A., and Sykes, M.: CO2 fertilization in temperate FACE ex-periments not representative of boreal and tropical forests, Glob.Change Biol., 14, 1–12, 2008.
Huntingford, C. and Monteith, J. L.: The behaviour of a mixed-layer model of the convective boundary layer coupled to a bigleaf model of surface energy partitioning, Bound.-Lay. Meteo-rol., 88, 87–101, 1998.
Kalnay, E., Kanamitsu, M., Kistler, R., Collins, W., Deaven, D.,Gandin, L., Iredell, M., Saha, S., White, G., Woollen, J., Zhu,Y., Chelliah, M., Ebisuzaki, W., Higgins, W., Janowiak, J., Mo,K. C., Ropelewski, C., Wang, J., Leetmaa, A., and Reynolds, R.:The NCEP/NCAR 40-year 30 reanalysis project, B. Am. Meteo-rol. Soc., 77, 437–470, 1996.
Kasischke, E. S., Hewson, J. H., Stocks, B., van der Werf, G.,and Randerson, J.: The use of ATSR active fire counts for es-timating relative patterns of biomass burning – a study fromthe boreal forest region, Geophys. Res. Lett., 30(4), 1969,doi:10.1029/2003GL017859, 2003.
Korontzi, S.: Seasonal patterns in biomass burning emissions fromsouthern African vegetation fires for the year 2000, Glob. ChangeBiol., 11, 1680–1700, 2005.
Kummerow, C., Barnes, W., Kozu, T., Shiue, J., and Simpson, J.:The Tropical Rainfall Measuring Mission (TRMM) sensor pack-age, J. Atmos. Ocean. Tech., 15, 809–817, 1998.
Lehsten, V., Arneth, A., Thonicke, K., Spessa, A., and Prentice,I.-C.: Tree-Grass coexistence in Savannahs: testing two mecha-nisms, Global Ecol. Biogeogr., in preparation, 2009.
Miller, P. A., Giesecke, T., Hickler, T., Bradshaw, R. H. W., Smith,B., Seppa, H., Valdes, P. J., and Sykes, M. T.: Exploring climatic
and biotic controls on Holocene vegetation change in Fennoscan-dia, J. Ecol., 96, 247–259, 2008.
Mitchell, T. D. and Jones, P. D.: An improved method of construct-ing a database of monthly climate observations and associatedhigh-resolution grids, Int. J. Climatol., 25, 693–712, 2005.
Nesterov, V. G.: Gorimost’ lesa i metody eio opredelenia., Gosles-bumaga, 75 pp., 1949.
Peterson, D. L. and Ryan, K. C.: Modeling Postfire Conifer Mor-tality for Long-range Planning, Environ. Manage., 10, 797–808,1986.
Patra, P. K., Ishizawa, M., Maksyutov, S., Nakazawa, T., andInoue, G.: Role of biomass burning and climate anomaliesfor land-atmosphere carbon fluxes based on inverse modelingof atmospheric CO2, Global Biogeochem. Cy., 19, GB3005,doi:10.1029/2004GB002258, 2005.
Pyne, S. J., Andrews, P. L., and Laven, R. D.: Introduction to wild-land fire, Wiley, New York, 769 pp., 1996.
Riano, D., Ruiz, J. A. M., Martinez, J. B., and Ustin, S. L.: Burnedarea forecasting using past burned area records and Southern Os-cillation Index for tropical Africa (1981–1999), Remote Sens.Environ., 107(4), 571–581, 2007.
Roberts, G., Wooster, M. J., and Lagoudakis, E.: Annual and diur-nal African biomass burning temporal dynamics, BiogeosciencesDiscuss., 5, 3623–3663, 2008,http://www.biogeosciences-discuss.net/5/3623/2008/.
Rothermel, R. C.: A Mathematical Model for Predicting FireSpread in Wildland Fuels, Ogden, Utah, 30 pp., 1972.
Running, S. W., Ramakrishna, R. N., and Hungerford, R. D.: Ex-trapolation of synoptic meteorological data in mountainous ter-rain and its use for simulating forest evapotranspiration and pho-tosynthesis, Can. J. Forest Res., 17, 472–483, 1987.
Saarnak, C. F.: A shift from natural to human-driven fire regime:implications for trace-gas emissions, Holocene, 11, 373–375,2001.
Sankaran, M., Ratnam, J., and Hanan, N. P.: Tree-grass coexistencein savannas revisited – insights from an examination of assump-tions and mechanisms invoked in existing models, Ecol. Lett., 7,480–490, 2004.
Scholes, R. J., Kendall, J., and Justice, C. O.: The quantity ofbiomass burned in southern Africa, J. Geophys. Res.-Atmos.,101, 23667–23676, 1996a.
Scholes, R. J., Ward, D. E., and Justice, C. O.: Emissions of tracegases and aerosol particles due to vegetation burning in south-ern hemisphere Africa, J. Geophys. Res.-Atmos., 101, 23677–23682, 1996b.
Simon, M., Plummer, S., Fierens, F., Hoelzemann, J. J., and Arino,O.: Burnt area detection at global scale using ATSR-2: TheGLOBSCAR products and their qualification, J. Geophys. Res.-Atmos., 109, D14S02, doi:10.1029/2003JD003622, 2004.
Sitch, S., Smith, B., Prentice, I. C., Arneth, A., Bondeau, A.,Cramer, W., Kaplan, J. O., Levis, S., Lucht, W., Sykes, M. T.,Thonicke, K., and Venevsky, S.: Evaluation of ecosystem dy-namics, plant geography and terrestrial carbon cycling in the LPJdynamic global vegetation model, Glob. Change Biol., 9, 161–185, 2003.
Smith, B., Prentice, I. C., and Sykes, M. T.: Representation ofvegetation dynamics in the modelling of terrestrial ecosystems:comparing two contrasting approaches within European climatespace, Global Ecol. Biogeogr., 10, 621–637, 2001.
www.biogeosciences.net/6/349/2009/ Biogeosciences, 6, 349–360, 2009

360 V. Lehsten et al.: African wildfire carbon emissions
Smith, R., Adams, M., Maier, S., Craig, R., Kristina, A., and Mal-ing, I.: Estimating the area of stubble burning from the numberof active fires detected by satellite, Remote Sens. Environ., 109,95–106, 2007.
Spessa, A., McBeth, B., and Prentice, C.: Relationships among firefrequency, rainfall and vegetation patterns in the wet-dry tropicsof northern Australia: an analysis based on NOAA-AVHRR data,Global Ecol. Biogeogr., 14, 439–454, 2005.
Tansey, K., Gregoire, J. M., Binaghi, E., Boschetti, L., Brivio, P.A., Ershov, D., Flasse, S., Fraser, R., Graetz, D., Maggi, M.,Peduzzi, P., Pereira, J., Silva, J., Sousa, A., and Stroppiana, D.:A global inventory of burned areas at 1 km resolution for the year2000 derived from SPOT VEGETATION data, Climatic Change,67, 345–377, 2004.
Tansey, K., Beston, J., Hoscilo, A., Page, S. E., and ParedesHernandez, C. U.: Relationship between MODIS fire hot spotcount and burned area in a degraded tropical peat swamp forest inCentral Kalimantan, Indonesia, J. Geophys. Res., 113, D23112,doi:10.1029/2008JD010717, 2008a.
Tansey, K., Gregoire, J. M., Defourny, P., Leigh, R., Pekel, J.F. O., van Bogaert, E., and Bartholome, E.: A new, global,multi-annual (2000–2007) burnt area product at 1 km resolution,Geophys. Res. Lett., 35, L01401, doi:10.1029/2007GL031567,2008b.
Thonicke, K., Spessa, A., Prentice, C., Harrison, S. P., andCarmona-Moreno, C.: The influence of vegetation, fire spreadand fire behaviour on global biomass burning and trace gas emis-sions, submitted, 2008.
van der Werf, G. R., Randerson, J. T., Collatz, G. J., and Giglio, L.:Carbon emissions from fires in tropical and subtropical ecosys-tems, Glob. Change Biol., 9, 547–562, 2003.
van der Werf, G. R., Randerson, J. T., Giglio, L., Collatz, G. J.,Kasibhatla, P. S., and Arellano Jr., A. F.: Interannual variabilityin global biomass burning emissions from 1997 to 2004, Atmos.Chem. Phys., 6, 3423–3441, 2006,http://www.atmos-chem-phys.net/6/3423/2006/.
Venevsky, S., Thonicke, K., Sitch, S., and Cramer, W.: Simulatingfire regimes in human-dominated ecosystems: Iberian Peninsulacase study, Glob. Change Biol., 8, 984–998, 2002.
Weber, U., Jung, M., Reichstein, M., Beer, C., Braakhekke, M.,Lehsten, V., Ghent, D., Kaduk, J., Viovy, N., Ciais, P., Gobron,N., and Rodenbeck, C.: The inter-annual variability of Africa’secosystem productivity: a multi-model analysis, BiogeosciencesDiscuss., 5, 4035–4069, 2008,http://www.biogeosciences-discuss.net/5/4035/2008/.
Williams, C. A., Hanan, N. P., Neff, J. C., Scholes, R. J., Berry,J. A., Denning, A. S., and Baker, D. F.: Africa and the globalcarbon cycle, Carbon Bal. Manag., 2(3), 13 pp., 2007.
Williams, R. J., Gill, A. M., and Moore, P. H. R.: Seasonal Changesin Fire Behaviour in a Tropical Savanna in Northern Australia,Int. J. Wildland Fire, 8, 227–239, 1998.
Wilson, R. A. J.: A re-examination of fire spread in free burningporous fuel beds, Intermountain Forest and Range ExperimentStation, Forest Service, US Dept. of Agriculture, Ogden, Utah,1982.
Wramneby, A., Smith, B., Zaehle, S., and Sykes, M. T.: Parameteruncertainties in the modelling of vegetation dynamics – Effectson tree community structure and ecosystem functioning in Euro-pean forest biomes, Ecol. Model., 216(3–4), 277–290, 2008.
Zaehle, S., Sitch S., Smith, B., and Hatterman, F.: Effectsof parameter uncertainties on the modeling of terrestrial bio-sphere dynamics, Global Biogeochem. Cy., 19(3), GB3020,doi:10.1029/2004GB002395 2005.
Biogeosciences, 6, 349–360, 2009 www.biogeosciences.net/6/349/2009/