Embed Size (px)
Citation preview
Estimating Foodborne Illness Source Attribution for Illnesses Caused by Salmonella, Escherichia coli
O157 (E. coli O157), Listeria monocytogenes (Lm), and Campylobacter
Joanna Zablotsky Kufel, USDA
Dana Cole, CDC
Michael Bazaco, FDA 1

Overview of Presentation
Overview of Project Approach
Exploratory Analyses
• Question and Answer Period
Methods and Model Results
Assumptions, Strengths, Limitations and Conclusions
• Question and Answer Period
2
Overview of Project Approach
Joanna Zablotsky Kufel, PhD, MPH Office of Data Integration and Food Protection (ODIFP)
Food Safety and Inspection Service (FSIS) United States Department of Agriculture
3
Outline
Purpose
Background
Selection of Pathogens
Data Sources
Selection of Estimator
Comparison to Painter et al, 2013
Conclusions
4
Purpose
To provide harmonized source attribution estimates by developing a single, robust method to produce estimates that all 3 agencies may use in their food safety activities
5
IFSAC Priority Pathogens
Identified four priority pathogens as the initial focus:
• Salmonella
• Escherichia coli O157 (E. coli O157)
• Listeria monocytogenes (Lm)
• Campylobacter
Pathogens were selected based on:
• Frequency and severity of illnesses
• Targeted interventions could be very effective
6
Phase 1: Background
Objective:
Determine the best approach to estimate source attribution using outbreak surveillance data while exploring the uncertainties and variability associated with computing attribution estimates using outbreak data
Approach:
• Explore ways to estimate percentages of illnesses caused by priority pathogens attributable to food categories in new categorization scheme using outbreak data
• Conduct a literature review to identify variability, methods and data sources used to estimate foodborne illness attribution
7
Phase 1: Modeling Approach
Determine data source and food categories:
• CDC Foodborne Disease Outbreak Surveillance System (FDOSS), 1998-2010
• Food categorization scheme (defined in a separate IFSAC project) designed to align with regulatory agency approaches
Define inclusion and exclusion criteria
Explore measures for estimating attribution:
• Fractions based on distribution of outbreak events across food categories, or distribution of outbreak illnesses across food categories?
8
Phase 1: Literature Review Methods
Data Sources:
PubMed, Web of Science, and EmBase
Studies Considered:
125 publications and 64 outbreak abstracts, including:
• Salmonella: 25 publications
• E. coli: 35 publications
• Lm: 27 publications
• Campylobacter: 21 publications
• Multi-Pathogen: 17 publications
9
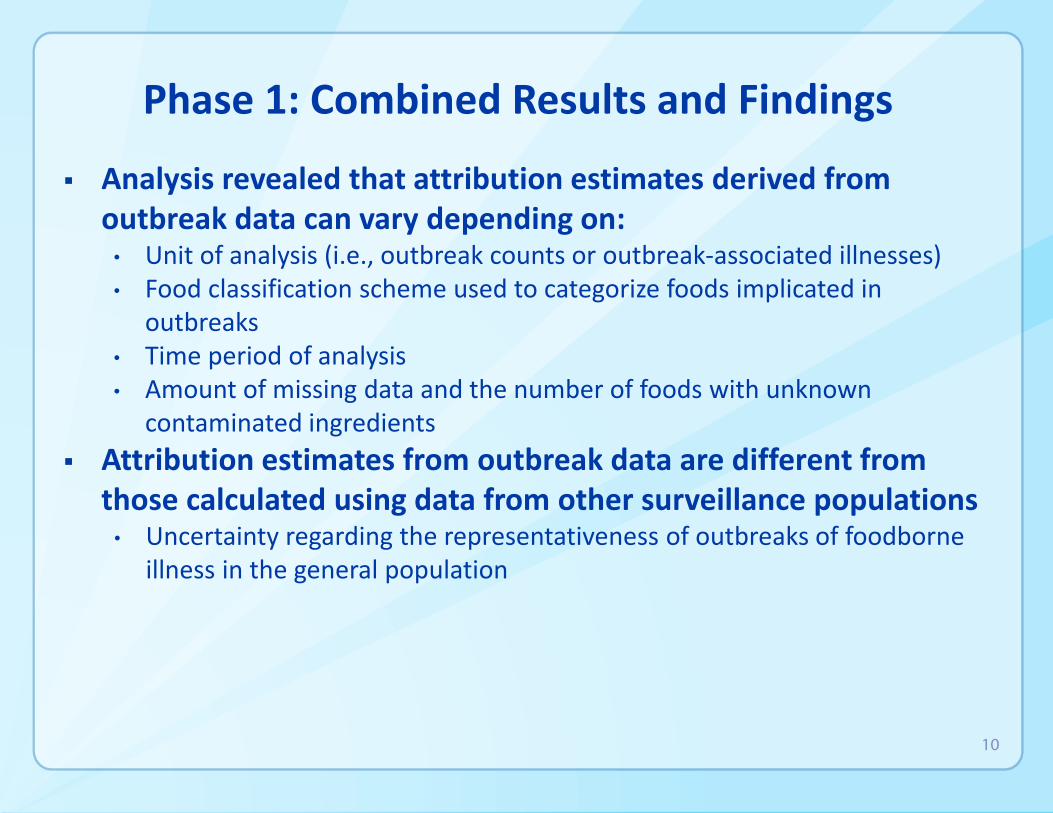
Phase 1: Combined Results and Findings
Analysis revealed that attribution estimates derived from outbreak data can vary depending on: • Unit of analysis (i.e., outbreak counts or outbreak-associated illnesses) • Food classification scheme used to categorize foods implicated in
outbreaks • Time period of analysis • Amount of missing data and the number of foods with unknown
contaminated ingredients Attribution estimates from outbreak data are different from
those calculated using data from other surveillance populations • Uncertainty regarding the representativeness of outbreaks of foodborne
illness in the general population
10
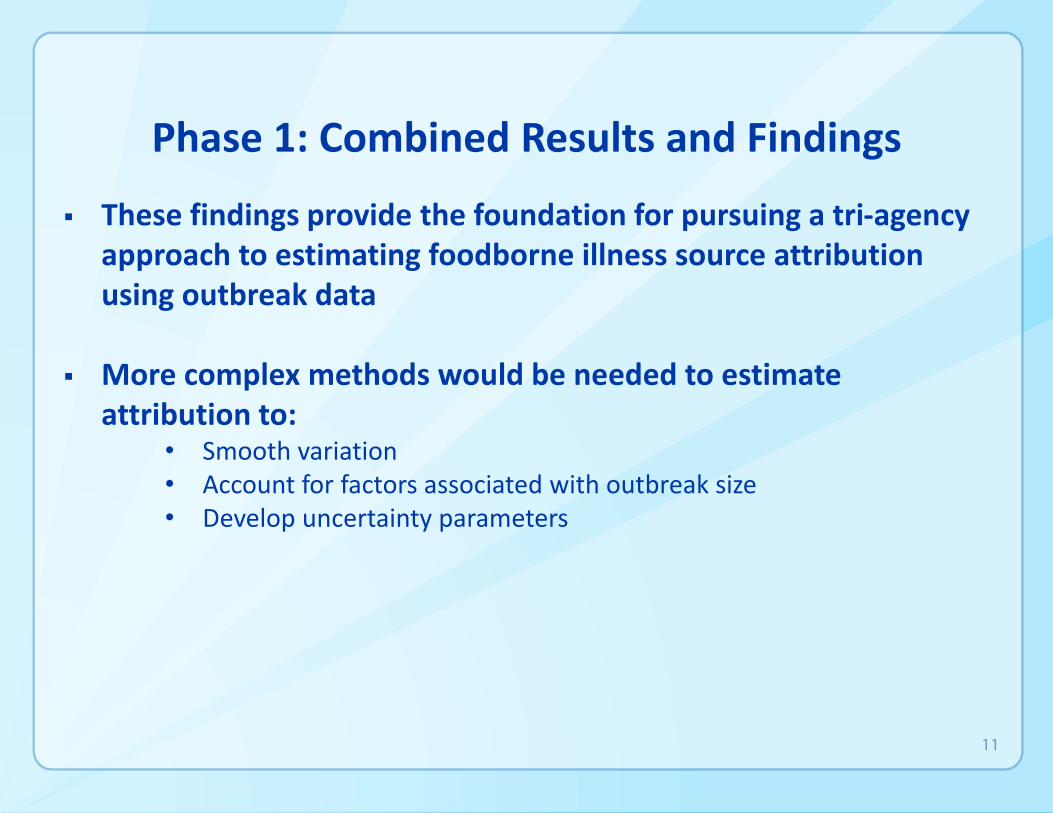
Phase 1: Combined Results and Findings
These findings provide the foundation for pursuing a tri-agency approach to estimating foodborne illness source attribution using outbreak data
More complex methods would be needed to estimate attribution to:
• Smooth variation • Account for factors associated with outbreak size • Develop uncertainty parameters
11
Estimating Foodborne Illness Source Attribution for Illnesses Caused by Salmonella, E. coli O157,
Lm, and Campylobacter Phase 2
12
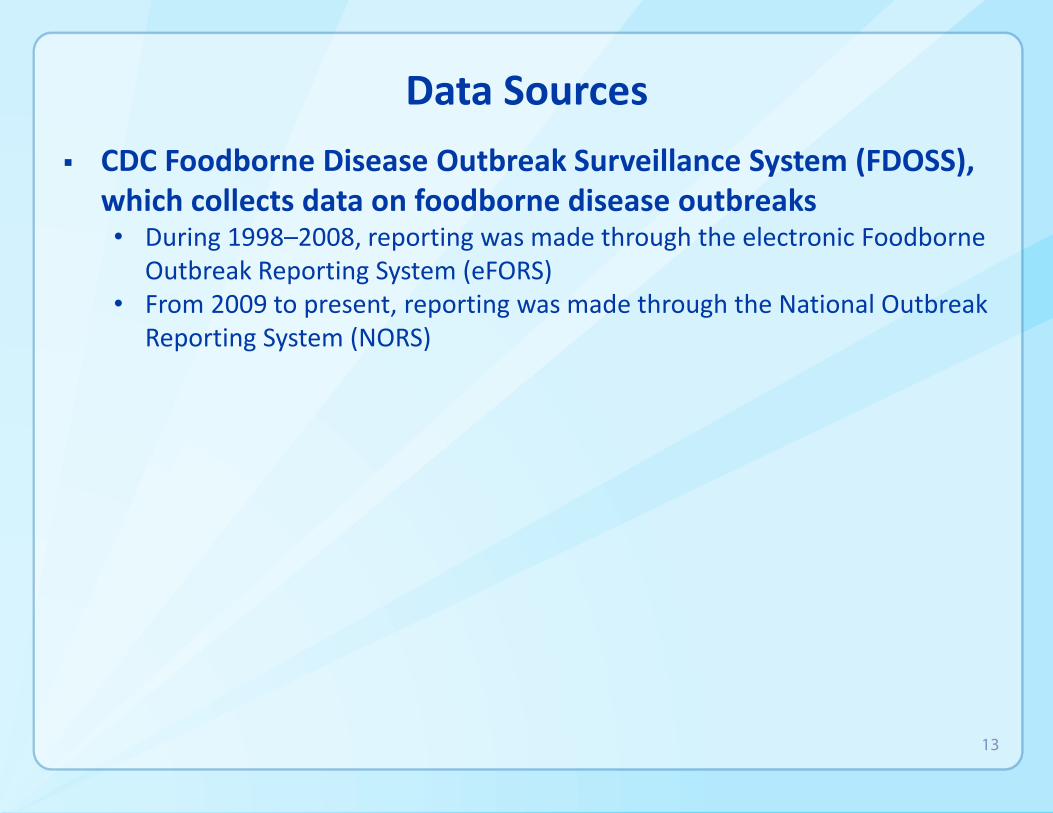
Data Sources
CDC Foodborne Disease Outbreak Surveillance System (FDOSS), which collects data on foodborne disease outbreaks • During 1998–2008, reporting was made through the electronic Foodborne
Outbreak Reporting System (eFORS) • From 2009 to present, reporting was made through the National Outbreak
Reporting System (NORS)
13
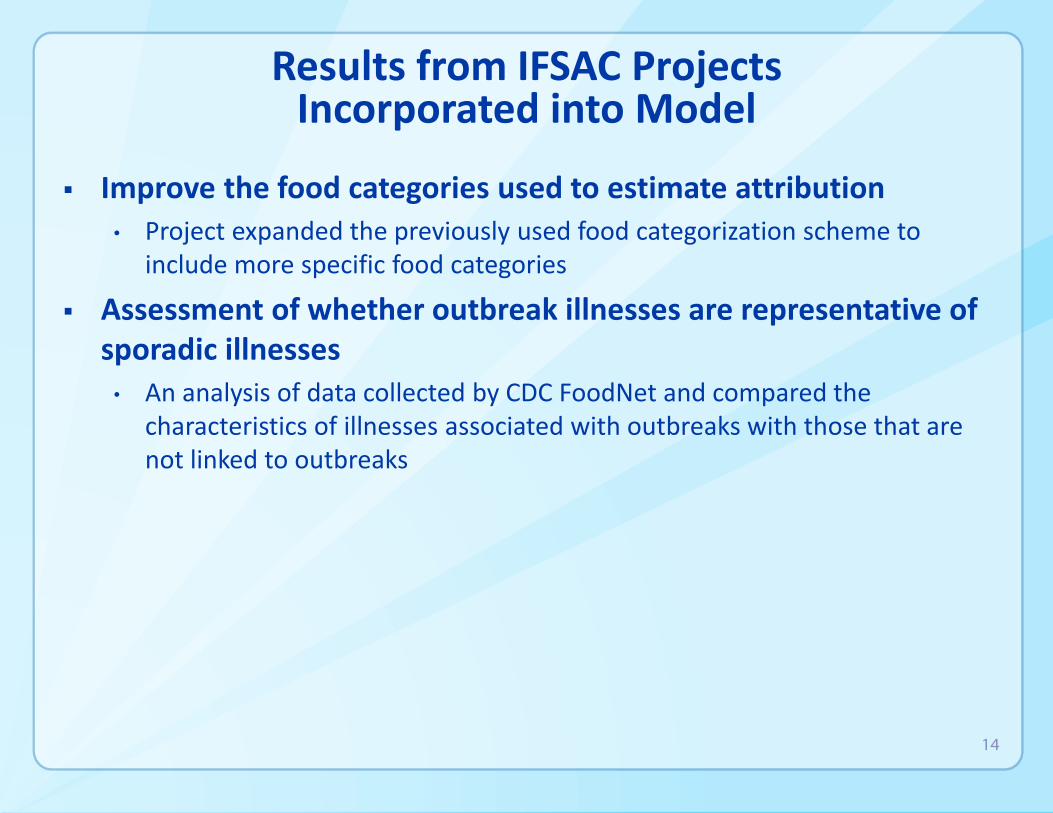
Results from IFSAC Projects Incorporated into Model
Improve the food categories used to estimate attribution
• Project expanded the previously used food categorization scheme to include more specific food categories
Assessment of whether outbreak illnesses are representative of sporadic illnesses
• An analysis of data collected by CDC FoodNet and compared the characteristics of illnesses associated with outbreaks with those that are not linked to outbreaks
14

Selection of Model Inputs
Simple v. Complex Foods
Suspected v. Confirmed Etiology
Outbreak Illnesses v. Outbreak Counts
15
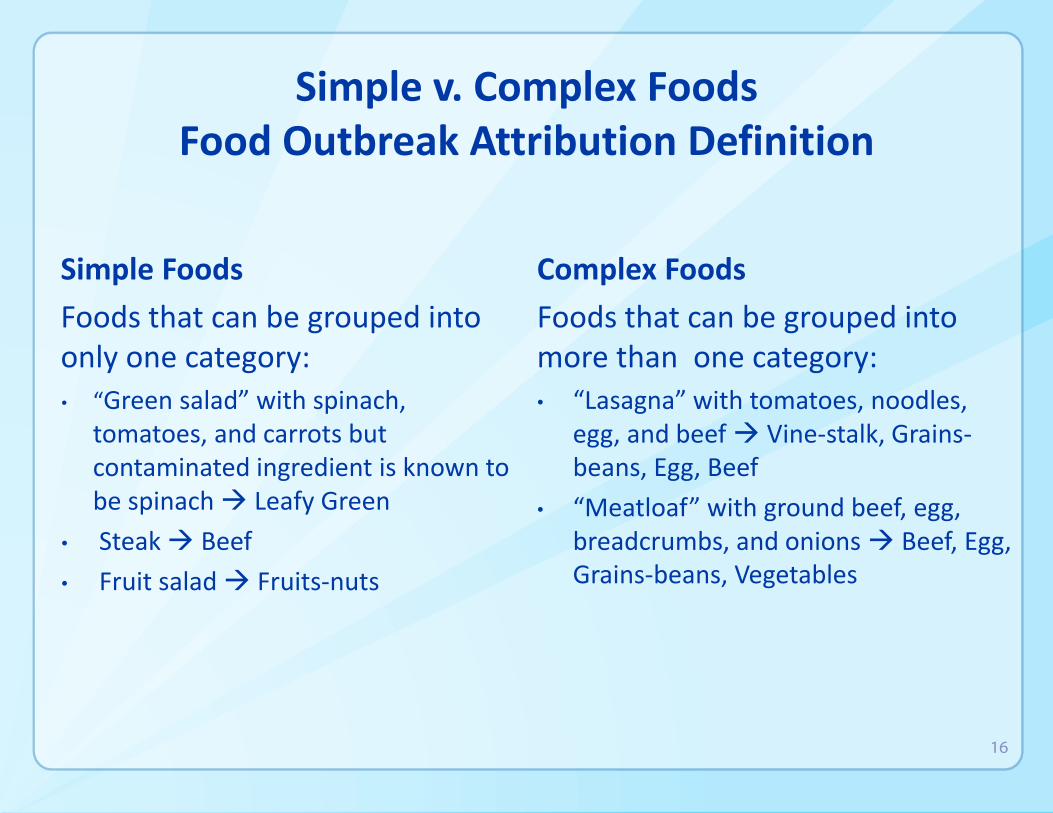
Simple v. Complex Foods Food Outbreak Attribution Definition
Simple Foods
Foods that can be grouped into only one category:
• “Green salad” with spinach, tomatoes, and carrots but contaminated ingredient is known to be spinach Leafy Green
• Steak Beef
• Fruit salad Fruits-nuts
Complex Foods
Foods that can be grouped into more than one category:
• “Lasagna” with tomatoes, noodles, egg, and beef Vine-stalk, Grains-beans, Egg, Beef
• “Meatloaf” with ground beef, egg, breadcrumbs, and onions Beef, Egg, Grains-beans, Vegetables
16
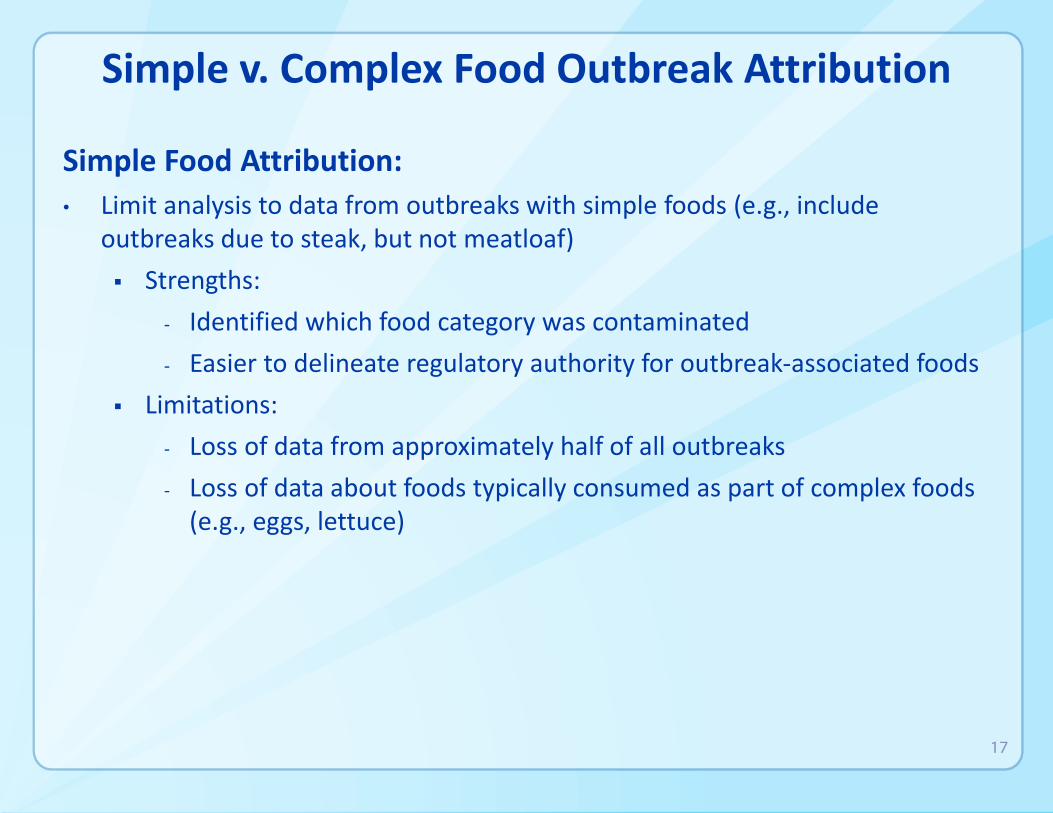
Simple v. Complex Food Outbreak Attribution
Simple Food Attribution:
• Limit analysis to data from outbreaks with simple foods (e.g., include outbreaks due to steak, but not meatloaf)
Strengths:
- Identified which food category was contaminated
- Easier to delineate regulatory authority for outbreak-associated foods
Limitations:
- Loss of data from approximately half of all outbreaks
- Loss of data about foods typically consumed as part of complex foods (e.g., eggs, lettuce)
17
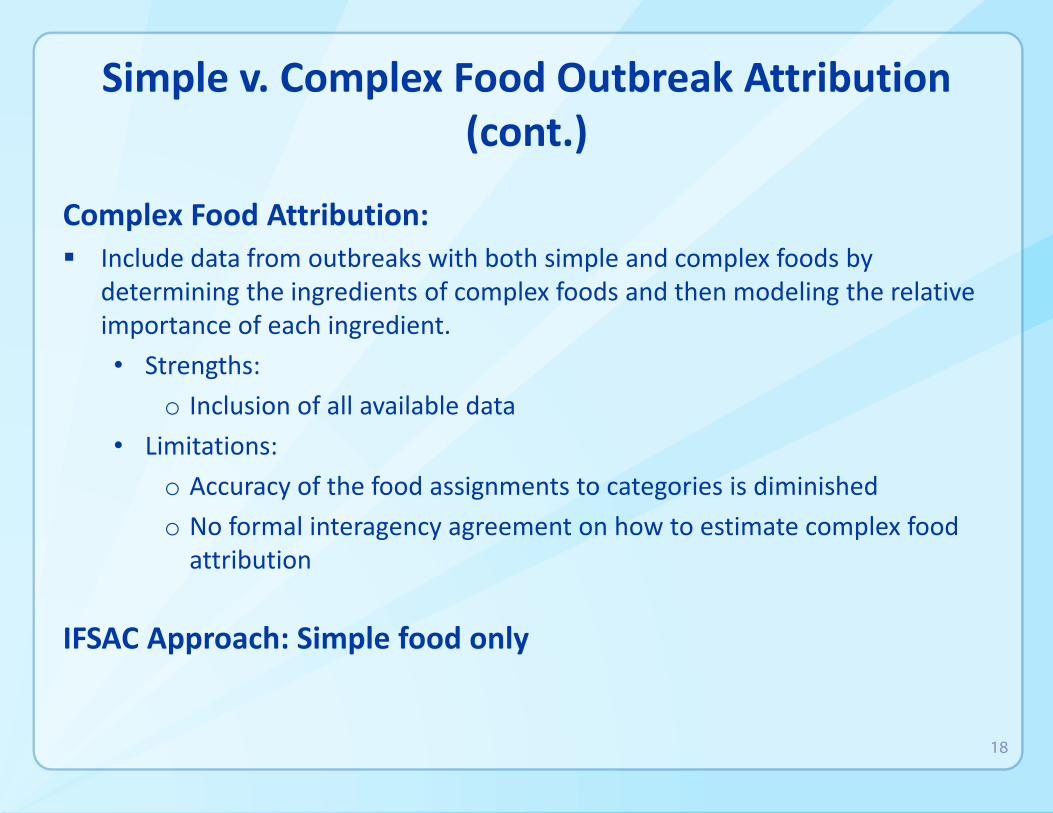
Simple v. Complex Food Outbreak Attribution (cont.)
Complex Food Attribution:
Include data from outbreaks with both simple and complex foods by determining the ingredients of complex foods and then modeling the relative importance of each ingredient.
• Strengths:
o Inclusion of all available data
• Limitations:
o Accuracy of the food assignments to categories is diminished
o No formal interagency agreement on how to estimate complex food attribution
IFSAC Approach: Simple food only
18
Confirmed v. Suspected Etiology Definitions
Laboratory and clinical guidelines for confirming an etiology are specific to each bacterial agent
If at least two outbreak illnesses are laboratory-confirmed, the outbreak is considered to have a confirmed etiology
An etiology is "suspected" unless it meets pre-defined criteria for confirming an outbreak etiology
19
Confirmed v. Suspected Etiology Strengths and Limitations
Confirmed Etiology Only
• Strengths:
o Ensures inclusion of only outbreaks definitively associated with particular pathogens
• Limitations:
o Loss of outbreak data for analysis
Confirmed + Suspected Etiology
• Strengths:
o Maximizes use of available data
o Concerns with using suspected etiology reduced with 4 IFSAC priority pathogens
• Limitations:
o Increased uncertainty
20
Confirmed v. Suspected Etiology IFSAC Approach
IFSAC conducted a quantitative assessment in Phase 1 to determine what information would be lost if only confirmed outbreaks were included in dataset
• Among outbreaks with an implicated etiology in the data:
o Confirmed outbreaks comprised 90% of the data
o Previous analyses by Painter et al utilized both confirmed and suspected etiologies to estimate attribution
IFSAC Approach: Explore all implicated etiology outbreaks for attribution
21
Outbreak Illnesses v. Outbreak Counts
Assumptions
Outbreak illnesses (cases of illness within outbreaks): the probability that a food commodity will cause illness varies across the different commodities
• e.g., raw ground chicken likely to cause more illnesses than raw chicken carcasses
Outbreak counts (number of outbreaks): each food commodity has the same probability of causing illness in the population
e.g., raw ground chicken likely to cause the same number of outbreaks as raw chicken
22
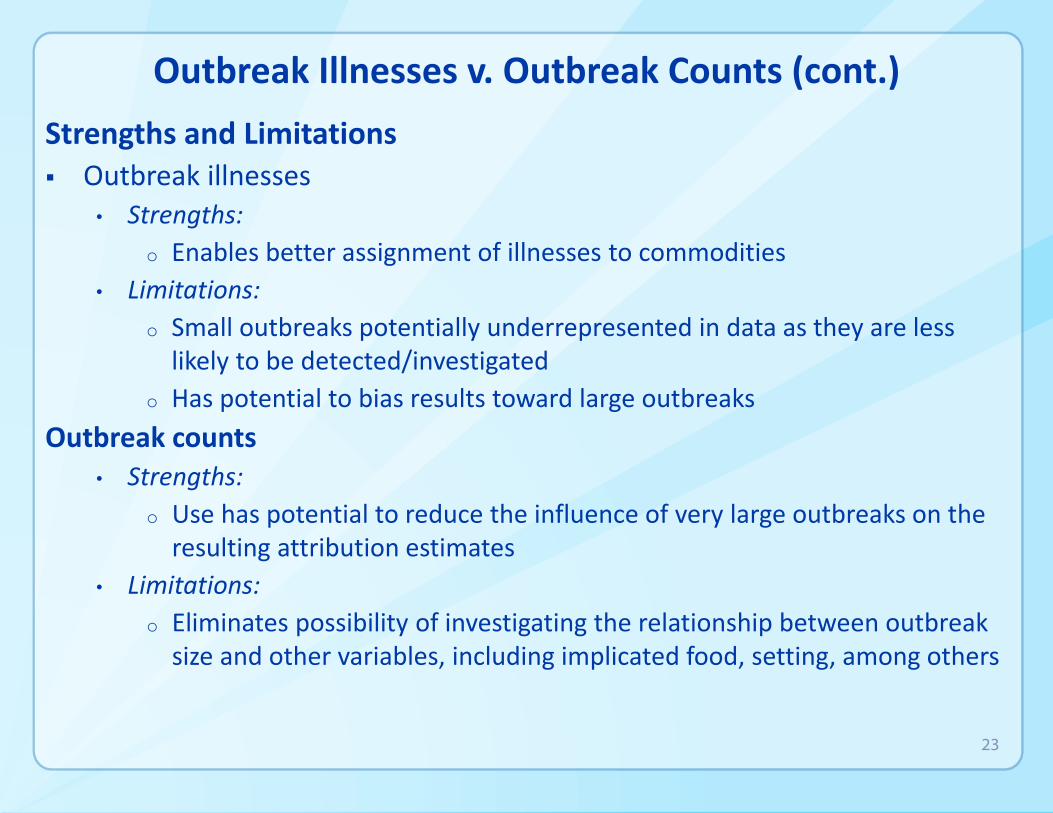
Outbreak Illnesses v. Outbreak Counts (cont.)
Strengths and Limitations Outbreak illnesses
• Strengths:
o Enables better assignment of illnesses to commodities
• Limitations:
o Small outbreaks potentially underrepresented in data as they are less likely to be detected/investigated
o Has potential to bias results toward large outbreaks
Outbreak counts
• Strengths:
o Use has potential to reduce the influence of very large outbreaks on the resulting attribution estimates
• Limitations:
o Eliminates possibility of investigating the relationship between outbreak size and other variables, including implicated food, setting, among others
23
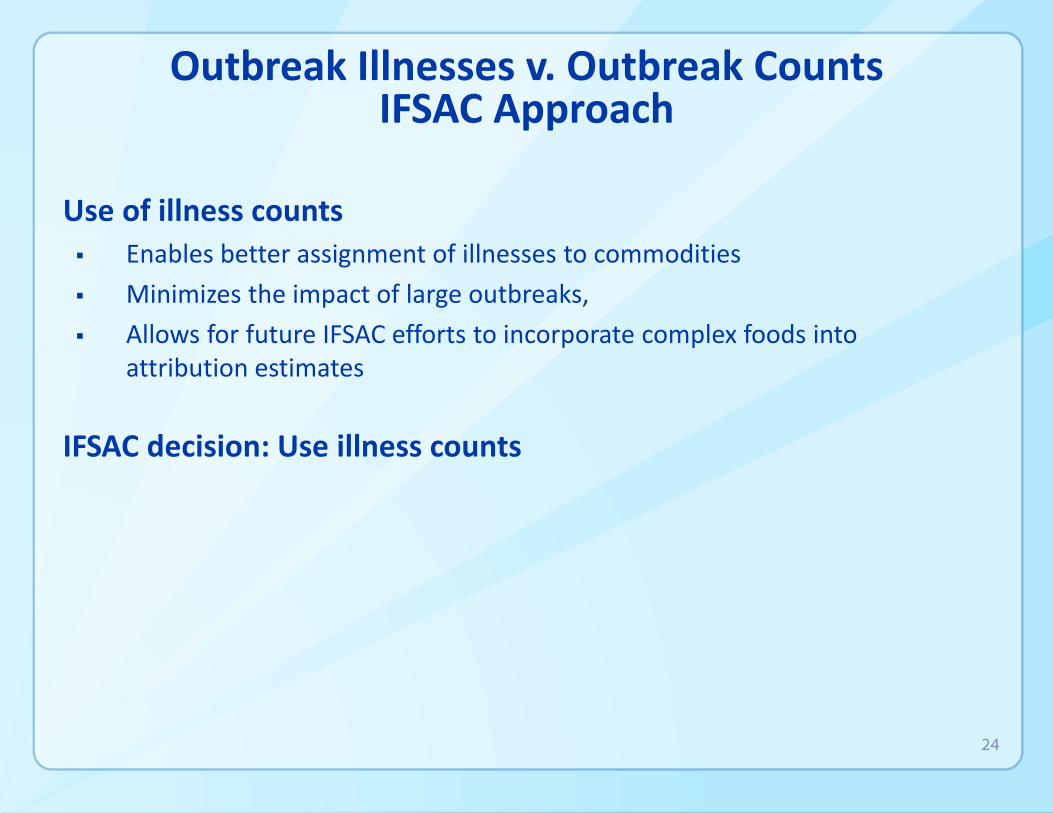
Outbreak Illnesses v. Outbreak Counts IFSAC Approach
Use of illness counts
Enables better assignment of illnesses to commodities
Minimizes the impact of large outbreaks,
Allows for future IFSAC efforts to incorporate complex foods into attribution estimates
IFSAC decision: Use illness counts
24
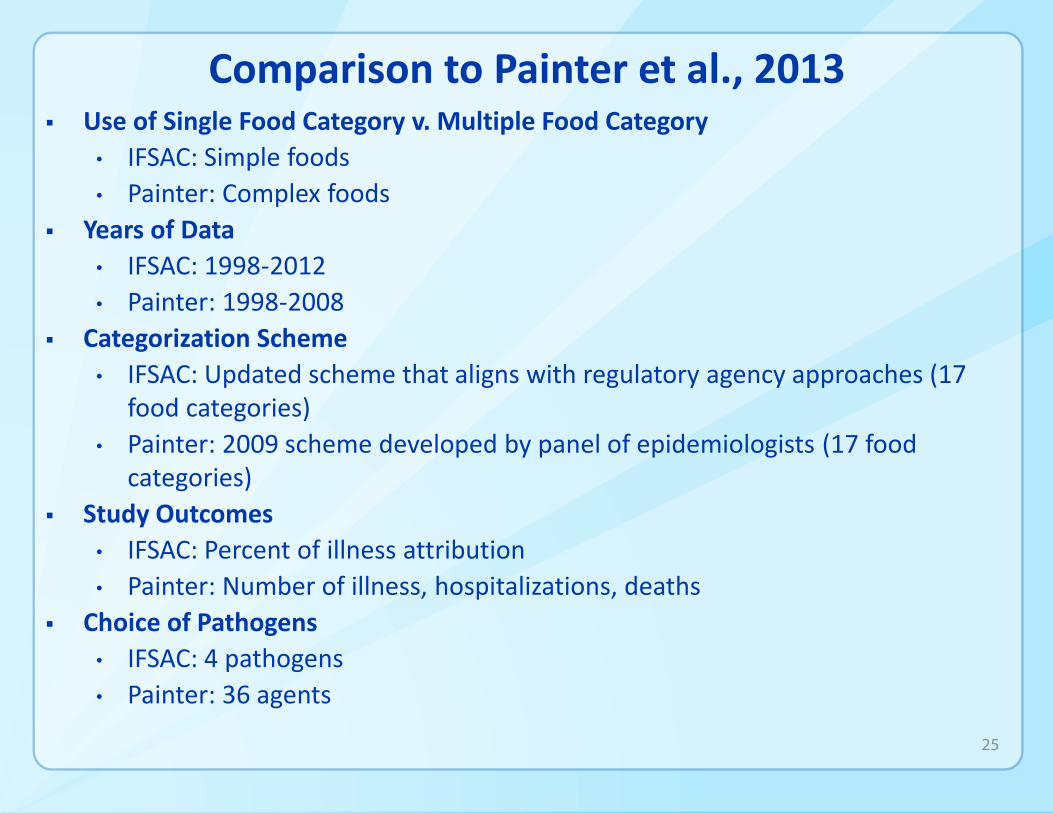
Comparison to Painter et al., 2013 Use of Single Food Category v. Multiple Food Category
• IFSAC: Simple foods
• Painter: Complex foods
Years of Data
• IFSAC: 1998-2012
• Painter: 1998-2008
Categorization Scheme
• IFSAC: Updated scheme that aligns with regulatory agency approaches (17 food categories)
• Painter: 2009 scheme developed by panel of epidemiologists (17 food categories)
Study Outcomes
• IFSAC: Percent of illness attribution
• Painter: Number of illness, hospitalizations, deaths
Choice of Pathogens
• IFSAC: 4 pathogens
• Painter: 36 agents
25
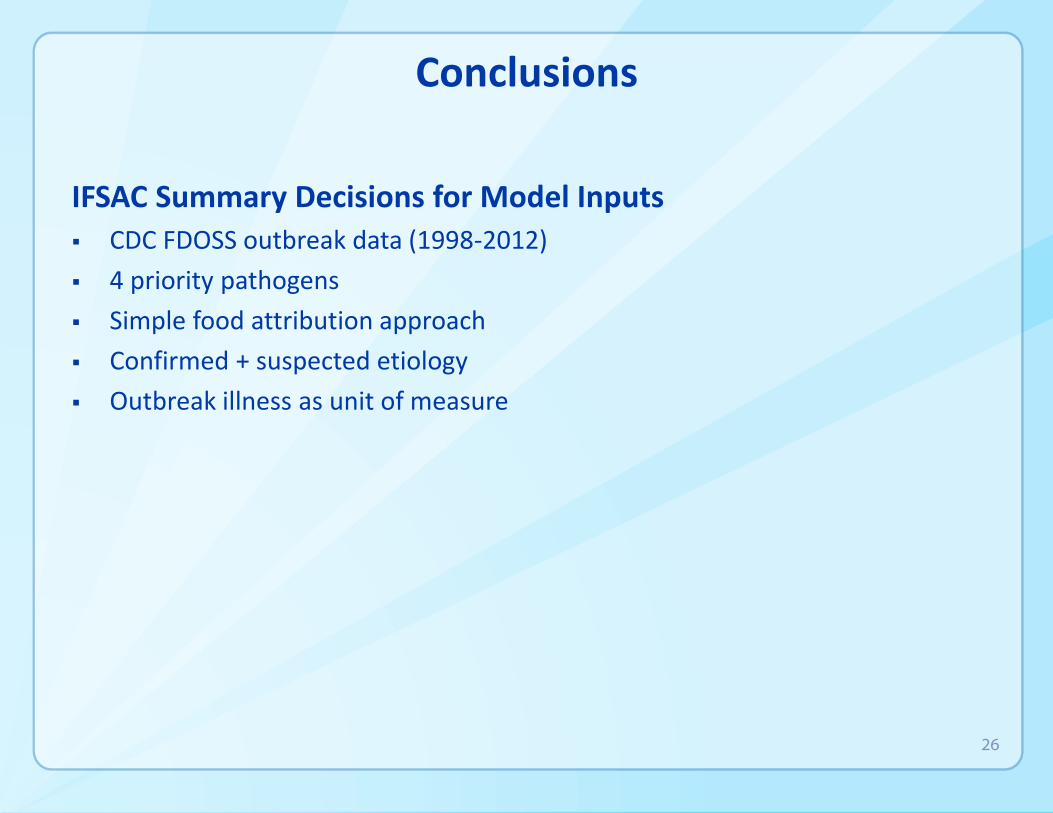
Conclusions
IFSAC Summary Decisions for Model Inputs CDC FDOSS outbreak data (1998-2012)
4 priority pathogens
Simple food attribution approach
Confirmed + suspected etiology
Outbreak illness as unit of measure
26

Overview of Presentation
Overview of Project Approach
Exploratory Analyses
• Question and Answer Period
Methods and Model Results
Assumptions, Strengths, Limitations and Conclusions
• Question and Answer Period
27
Exploratory Analyses
Dana Cole, DVM, PhD Lead, Analytics Team
Enteric Diseases Epidemiology Branch Centers for Disease Control and Prevention (CDC)
28
Exploratory Analyses Outline
Outbreak size variability
Food categories
Years to include in analysis
29
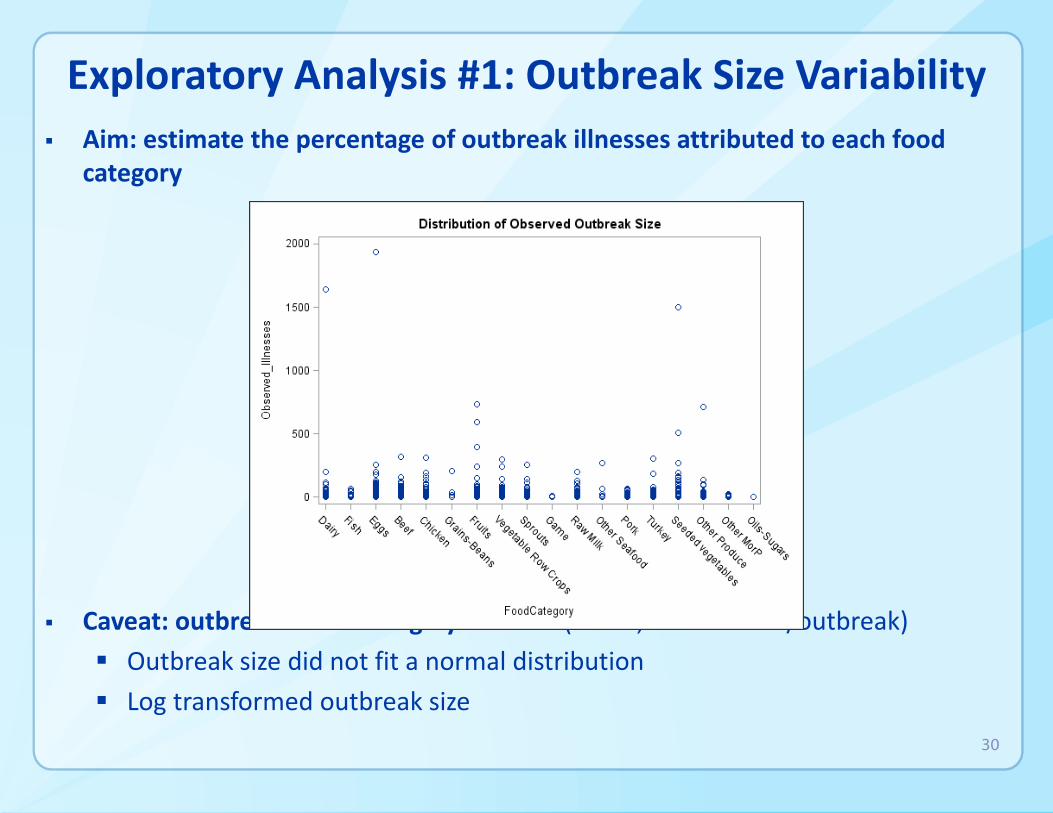
e w ariable 939 illnesses
Exploratory Analysis #1: Outbreak Size Variability Aim: estimate the percentage of outbreak illnesses attributed to each food
category
Caveat: outbreak siz as highly v (2 to 1, /outbreak)
Outbreak size did not fit a normal distribution
Log transformed outbreak size
30
Beef
Chicken
Dairy
Eggs
Fish
Fruits
Game
Grains-Beans
Oils-Sugars
Other MorP
Other Produce
Other Seafood
Pork
Seeded vegetables
Sprout
sTurkey
Vegetable Row Crops
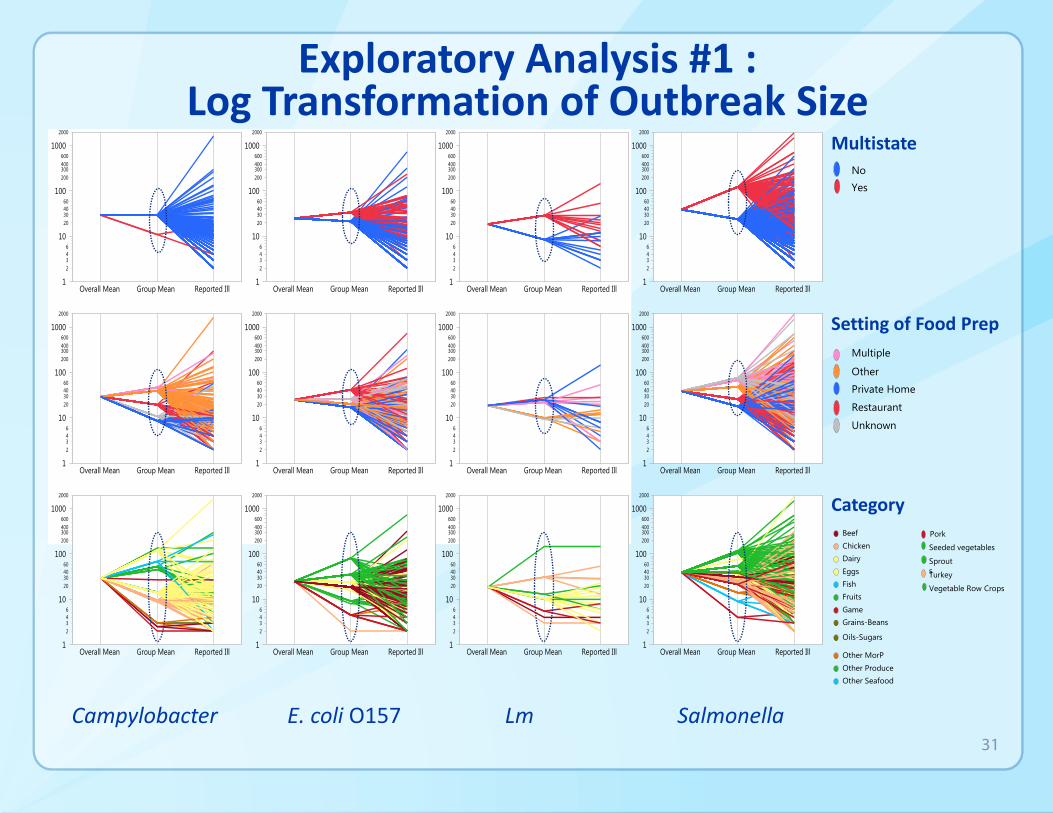
Exploratory Analysis #1 : Log Transformation of Outbreak Size
Multistate No
Yes
Setting of Food Prep Multiple
Other
Private Home
Restaurant
Unknown
Category
Campylobacter E. coli O157 Lm Salmonella 31
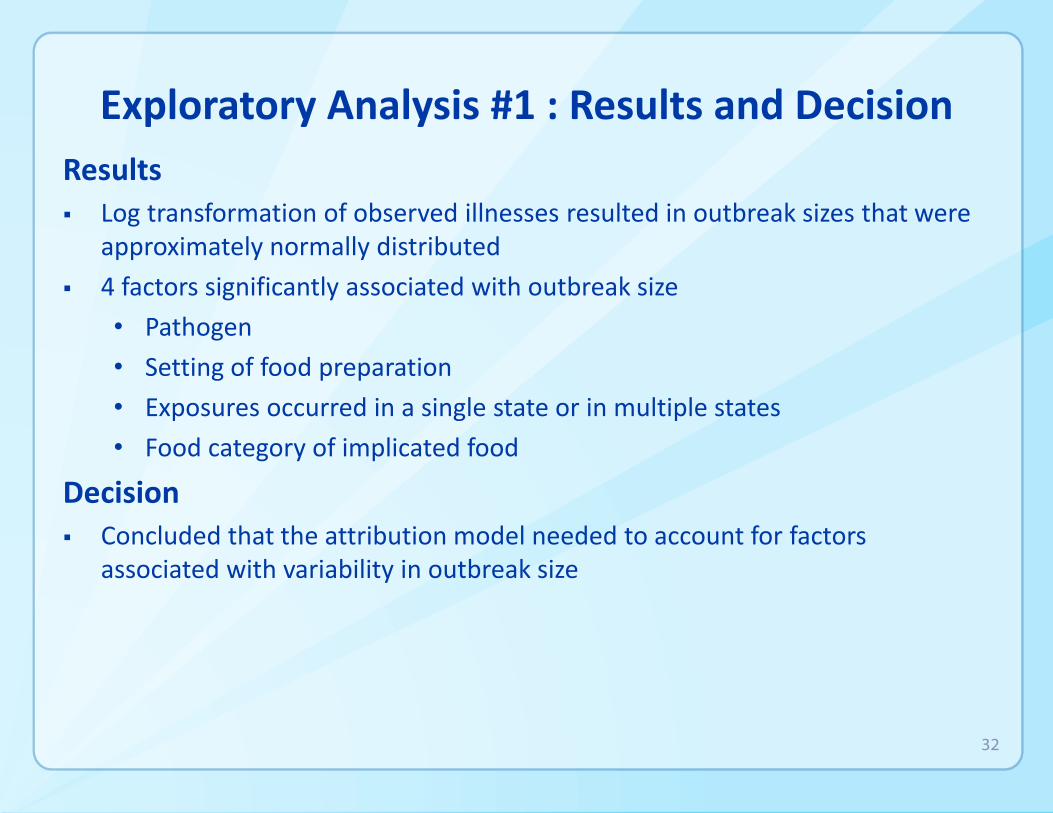
Exploratory Analysis #1 : Results and Decision
Results
Log transformation of observed illnesses resulted in outbreak sizes that were approximately normally distributed
4 factors significantly associated with outbreak size
• Pathogen
• Setting of food preparation
• Exposures occurred in a single state or in multiple states
• Food category of implicated food
Decision
Concluded that the attribution model needed to account for factors associated with variability in outbreak size
32
-
-
-
-
-
-
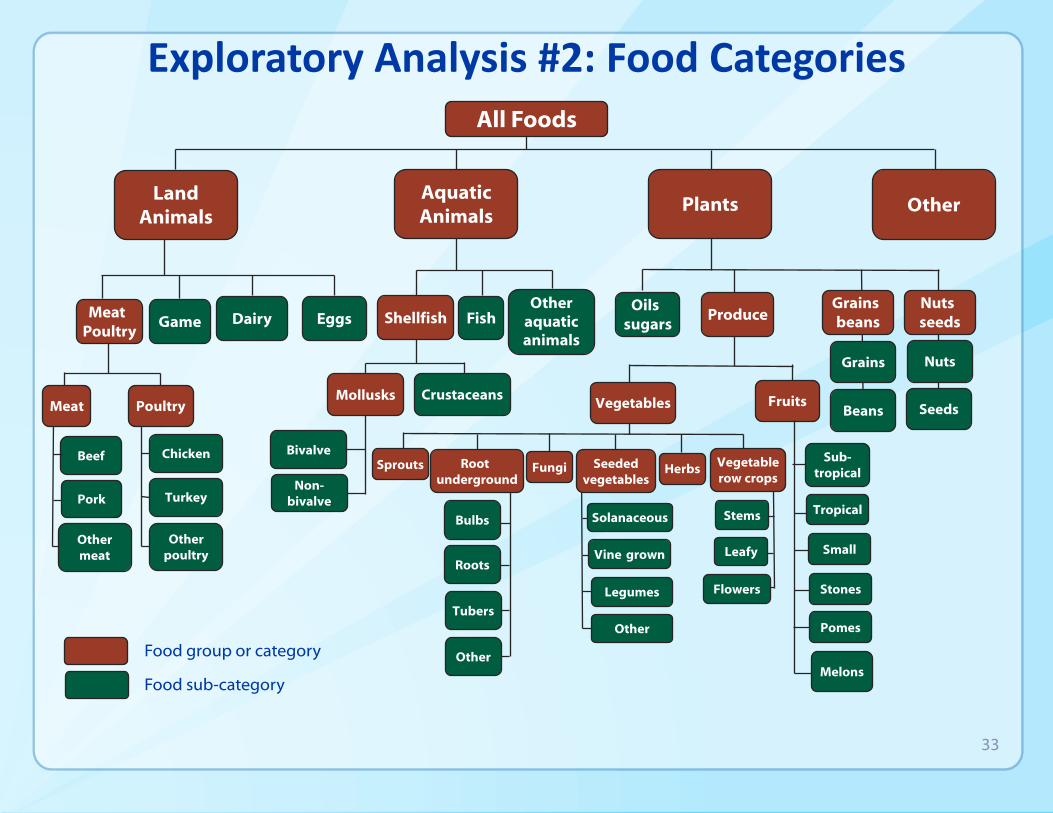
Exploratory Analysis #2: Food Categories All Foods
Other
Other aquatic animals
Oils sugars
Land Animals
Plants
Vegetables Fruits
Sub-tropical
Tropical
Small
Stones
Pomes
Melons
Fungi Sprouts Herbs Root underground
Bulbs
Roots
Tubers
Other
Seeded vegetables
Solanaceous
Vine grown
Legumes
Other
Vegetable row crops
Stems
Leafy
Flowers
Dairy Eggs
Aquatic Animals
Shellfish Fish
Mollusks Crustaceans
Bivalve
Non-bivalve
Meat Poultry
Game
Meat Poultry
Chicken
Turkey
Other poultry
Beef
Pork
Other meat
Grains beans
Grains
Beans
Nuts seeds
Nuts
Seeds
Produce
Food sub-category
Food group or category
33
-
- - -
-
All Foods
Land Animals
Meat Poultry
Meat
Beef
Pork
Other meat
Poultry
Chicken
Turkey
Other poultry
Game Dairy Eggs
Aquatic Animals
Fish
Shellfish
Other aq. animals
Grains beans Nuts seeds Oils sugars Produce
Fruits Vegetables
Fungi
Herbs
Root underground
Seeded vegetables
Sprouts
Vegetable row crops
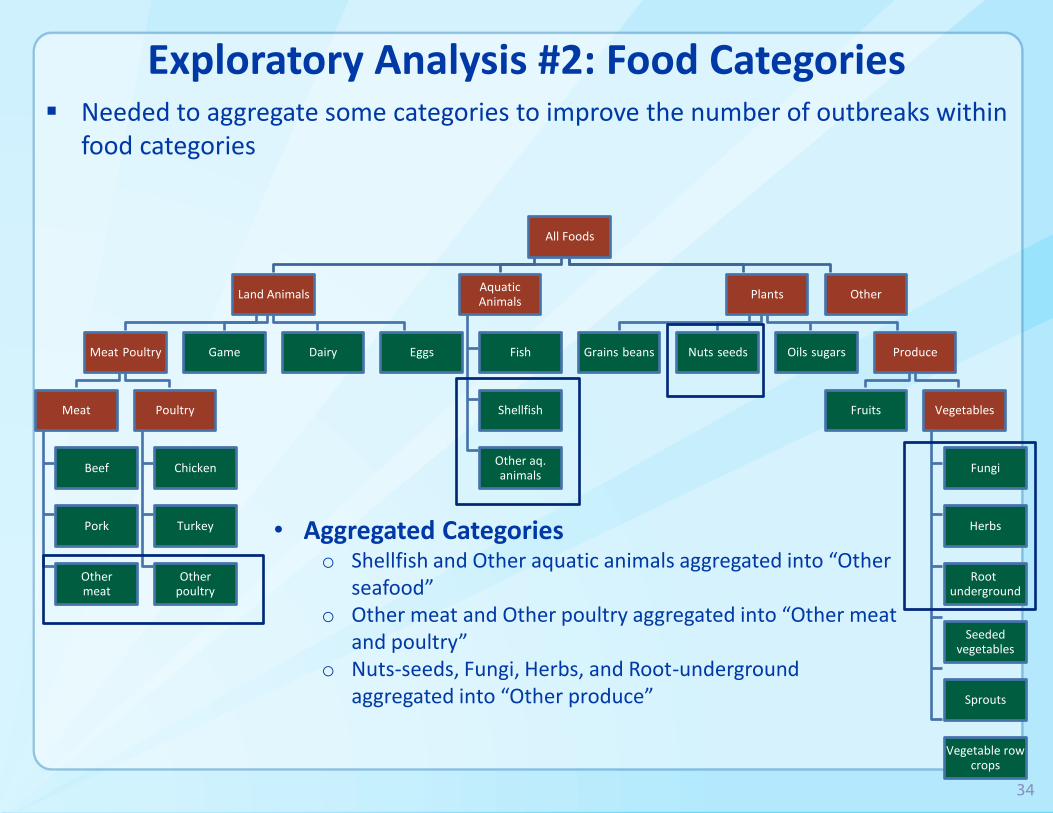
Exploratory Analysis #2: Food Categories
• Aggregated Categories o Shellfish and Other aquatic animals aggregated into “Other seafood”
o Other meat and Other poultry aggregated into “Other meat and poultry”
o Nuts-seeds, Fungi, Herbs, and Root-underground aggregated into “Other produce”
Needed to aggregate some categories to improve the number of outbreaks within food categories
34
Plants Other
3 Year Illnesses 5 Year Illnesses 7 Year Illnesses
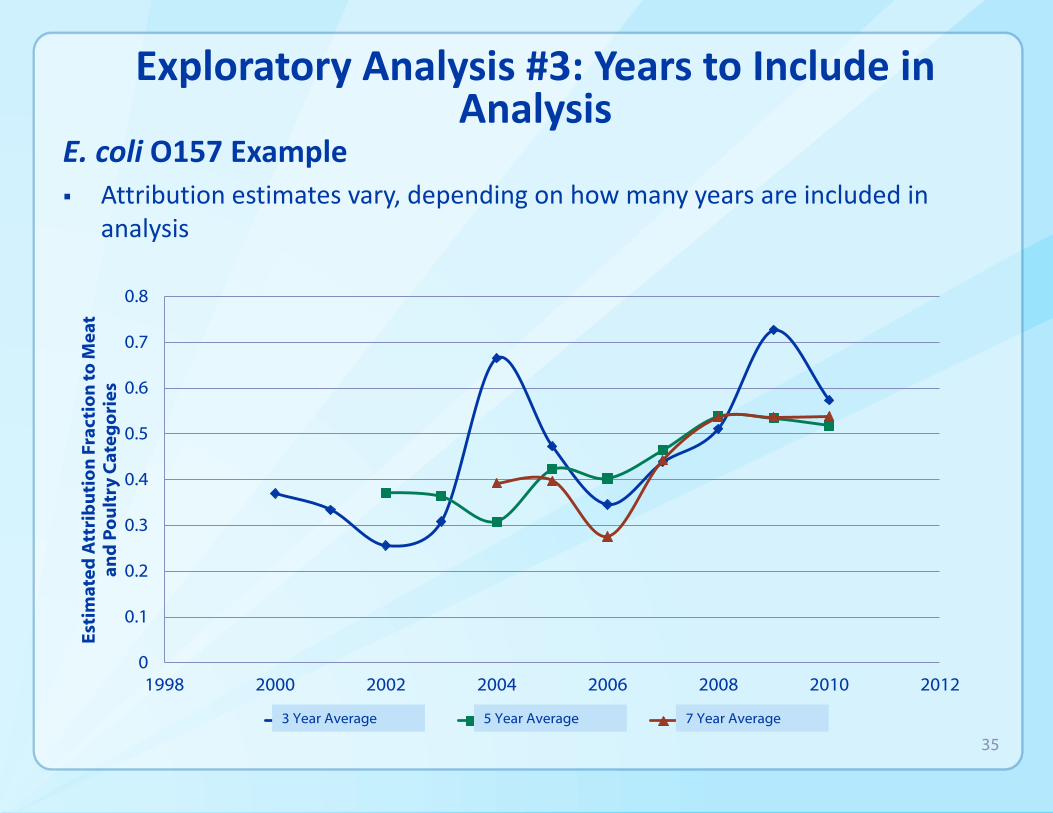
Exploratory Analysis #3: Years to Include in Analysis
E. coli O157 Example
Attribution estimates vary, depending on how many years are included in analysis
0.8
Est
ima
ted
Att
rib
uti
on
Fra
ctio
n t
o M
ea
ta
nd
Po
ult
ry C
ate
go
rie
s
0.7
0.6
0.5
0.4
0.3
0.2
0.1
0 1998 2000 2002 2004 2006 2008 2010 2012
3 Year Average 5 Year Average 7 Year Average
35
36
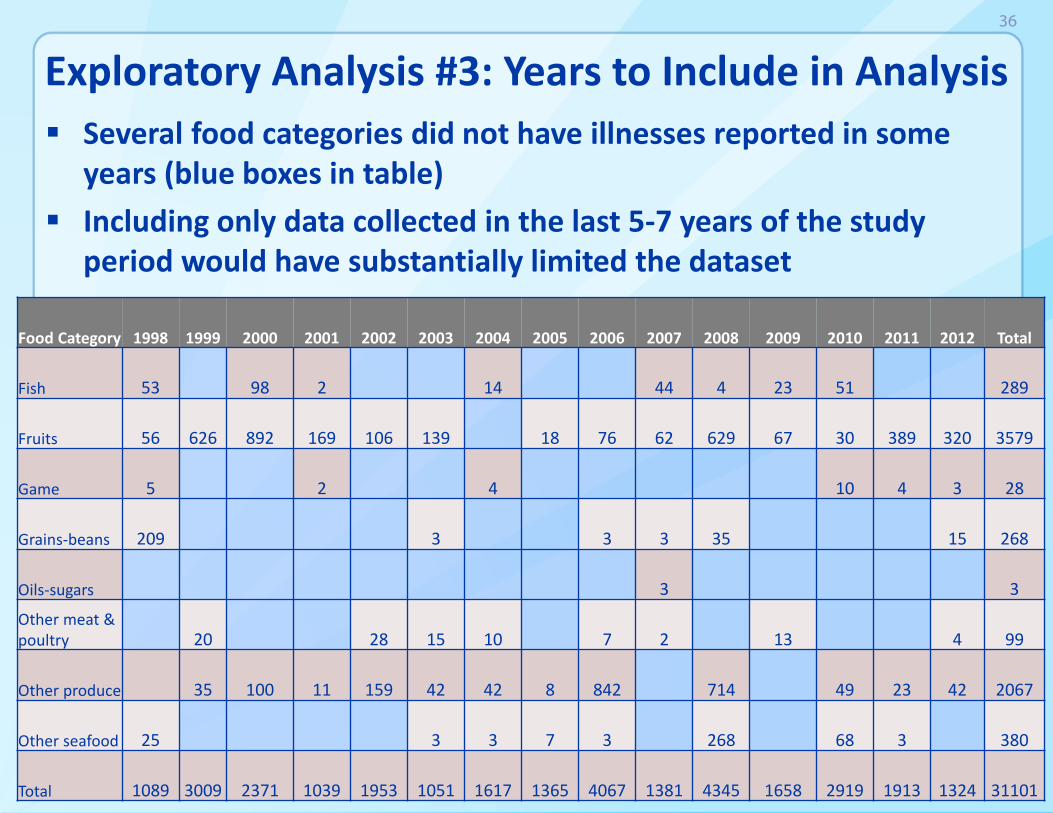
Exploratory Analysis #3: Years to Include in Analysis Several food categories did not have illnesses reported in some
years (blue boxes in table)
Including only data collected in the last 5-7 years of the study period would have substantially limited the dataset
Food Category 1998 1999 2000 2001 2002 2003 2004 2005 2006 2007 2008 2009 2010 2011 2012 Total
Fish 53 98 2 14 44 4 23 51 289
Fruits 56 626 892 169 106 139 18 76 62 629 67 30 389 320 3579
Game 5 2 4 10 4 3 28
Grains-beans 209 3 3 3 35 15 268
Oils-sugars 3 3
Other meat & poultry 20 28 15 10 7 2 13 4 99
Other produce 35 100 11 159 42 42 8 842 714 49 23 42 2067
Other seafood 25 3 3 7 3 268 68 3 380
Total 1089 3009 2371 1039 1953 1051 1617 1365 4067 1381 4345 1658 2919 1913 1324 31101
Exploratory Analysis #3: Results and Decisions
Results
Estimates based on the most recent 5 years of available data were more stable than those based on 3 years
When data older than 5 years was excluded:
• Some food categories had no data, or only a few years of data
• Main effect was on FDA-regulated food categories
Decisions
Use data from all years (1998-2012)
Give full weight to data reported in the most recent 5 years (2008-2012)
Discount weight of earlier years
37
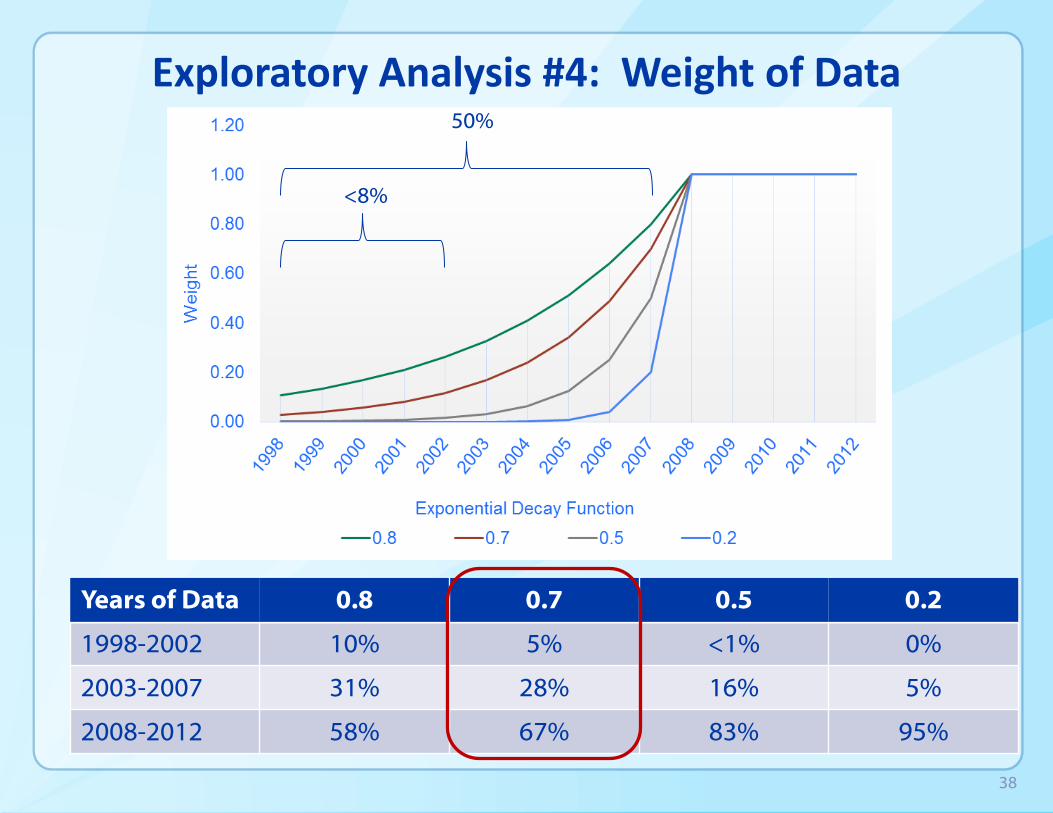
Exploratory Analysis #4: Weight of Data 50%
<8%
Years of Data 0.8 0.7 0.5 0.2
1998-2002 10% 5%
28%
67%
<1% 0%
2003-2007 31% 16% 5%
2008-2012 58% 83% 95%
38

Question and Answer Period
39

Overview of Presentation
Overview of Project Approach
Exploratory Analyses
• Question and Answer Period
Methods and Model Results
Assumptions, Strengths, Limitations and Conclusions
• Question and Answer Period
40
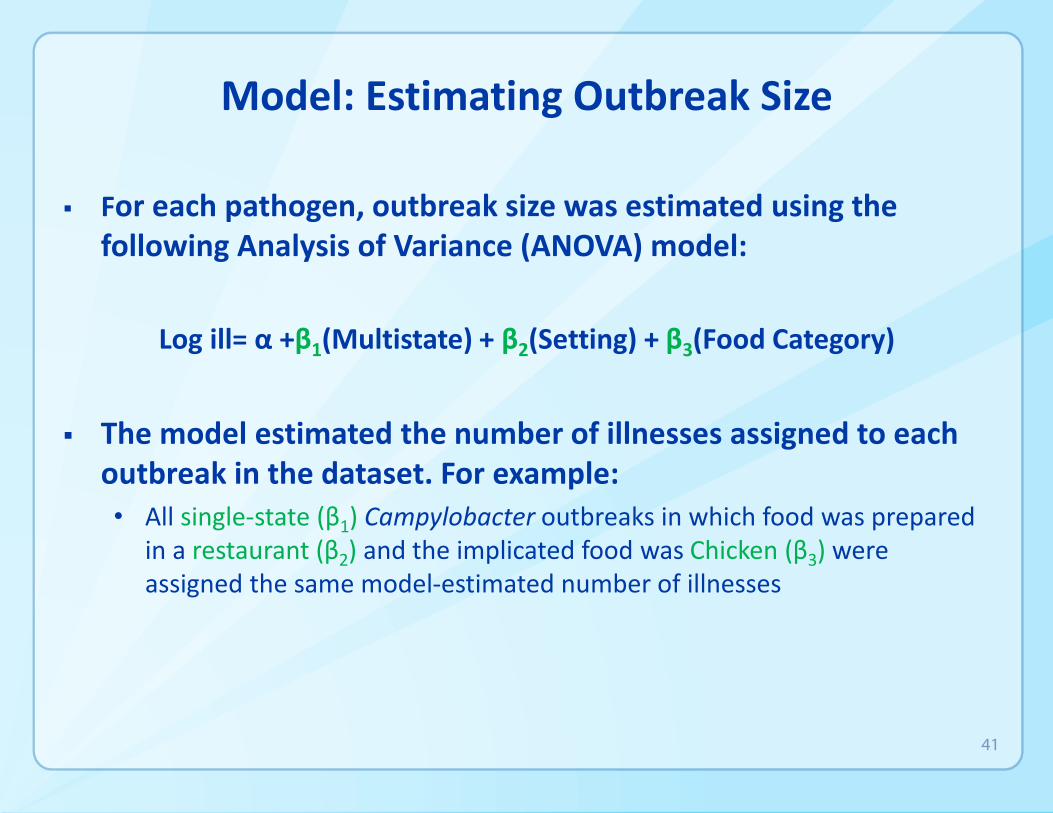
Model: Estimating Outbreak Size
For each pathogen, outbreak size was estimated using the following Analysis of Variance (ANOVA) model:
Log ill= α +β1(Multistate) + β2(Setting) + β3(Food Category)
The model estimated the number of illnesses assigned to each outbreak in the dataset. For example:
• All single-state (β1) Campylobacter outbreaks in which food was prepared in a restaurant (β2) and the implicated food was Chicken (β3) were assigned the same model-estimated number of illnesses
41
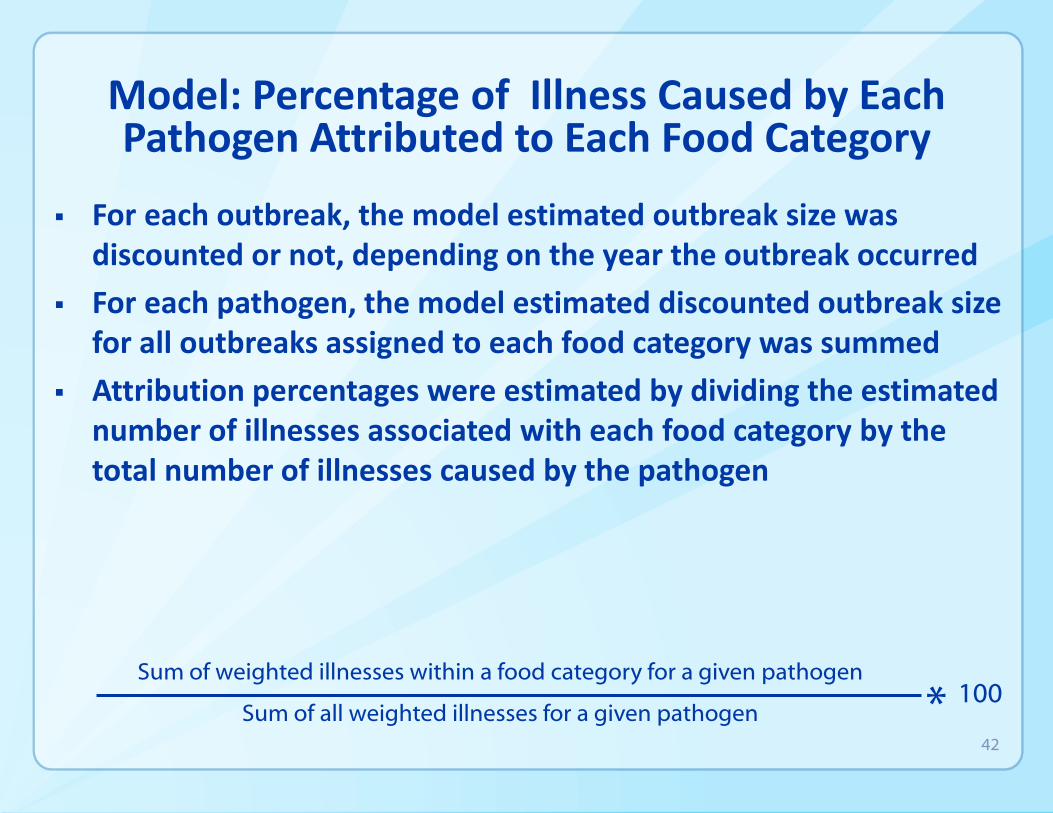
Model: Percentage of Illness Caused by Each Pathogen Attributed to Each Food Category
For each outbreak, the model estimated outbreak size was discounted or not, depending on the year the outbreak occurred
For each pathogen, the model estimated discounted outbreak size for all outbreaks assigned to each food category was summed
Attribution percentages were estimated by dividing the estimated number of illnesses associated with each food category by the total number of illnesses caused by the pathogen
Sum of weighted illnesses within a food category for a given pathogen
* 100 Sum of all weighted illnesses for a given pathogen
42

Model: Estimating Statistical Uncertainty
10,000 Bayesian bootstrap replications of the dataset were generated
• Probability of each outbreak being sampled was based on a prior probability defined by non-informative Dirichlet distribution
• For each replicate, the attribution percentage for each pathogen-food category pair was calculated
The attribution percentages were defined by the 5% and 95% values of the distribution of 10,000 data replicates to describe the 90% credibility intervals for each estimated attribution percentage
43
Results Overview
Summary of data
Data from most recent 5 years
Estimated attribution percentages
Estimated 90% credibility intervals
44

Summary of Data
2,739 reported outbreaks were caused by 1 of the 4 pathogens during 1998-2012. Excluded:
• 84 caused by multiple pathogens
• 1,011 for which no food vehicle was identified
• 3 that occurred in outlying U.S. territories
• 689 attributed to foods containing ingredients from multiple food categories
Used data from 952 outbreaks in which a simple food was implicated:
• 597 outbreaks caused by Salmonella
• 170 caused by E. coli O157
• 161 caused by Campylobacter
• 24 caused by Lm
45
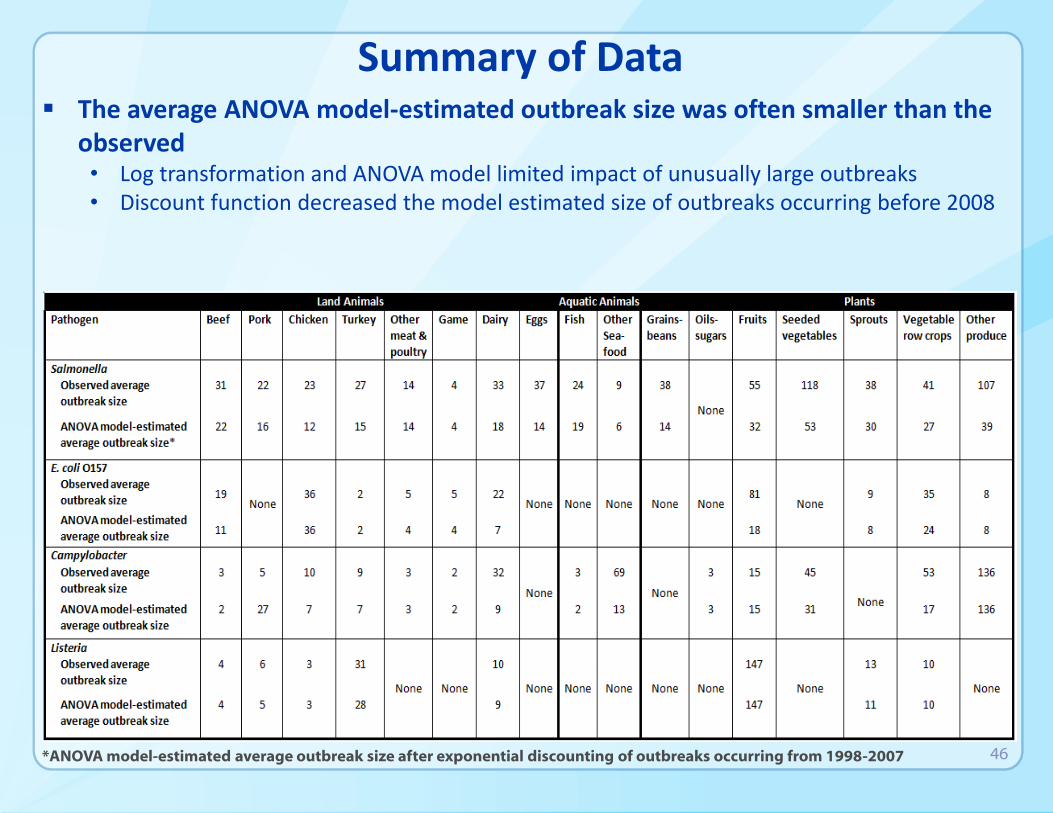
Summary of Data The average ANOVA model-estimated outbreak size was often smaller than the
observed • Log transformation and ANOVA model limited impact of unusually large outbreaks • Discount function decreased the model estimated size of outbreaks occurring before 2008
*ANOVA model-estimated average outbreak size after exponential discounting of outbreaks occurring from 1998-2007 46
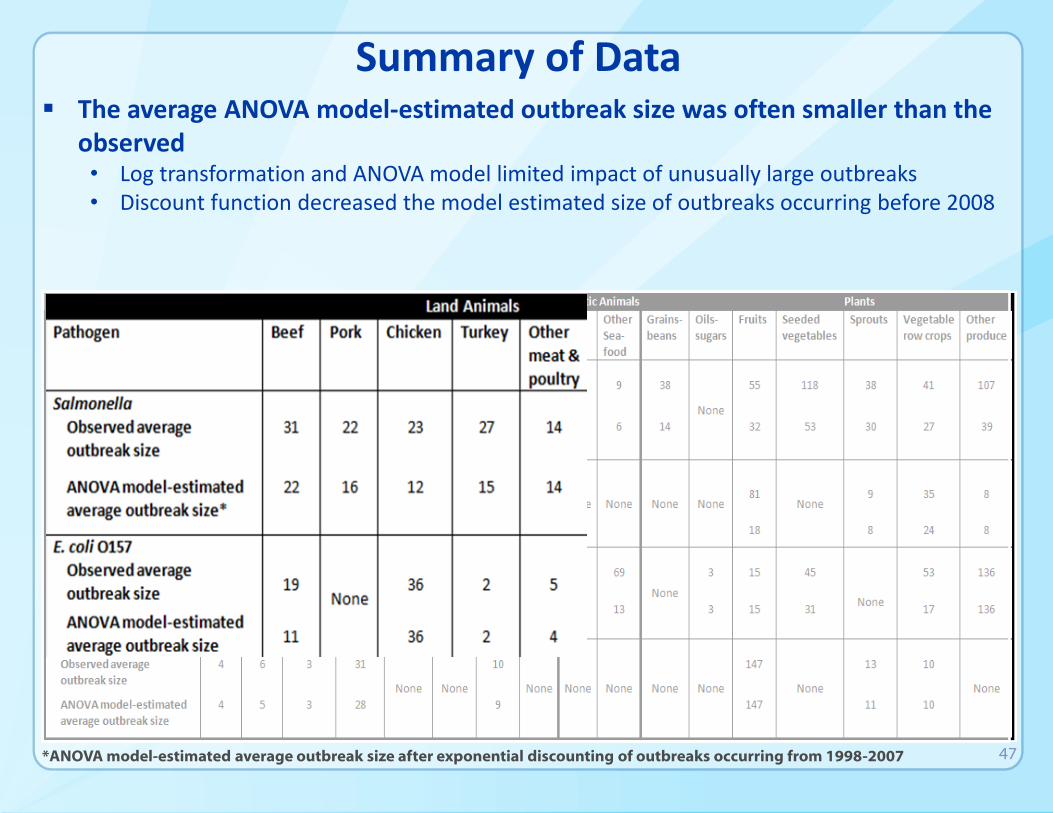
Summary of Data The average ANOVA model-estimated outbreak size was often smaller than the
observed • Log transformation and ANOVA model limited impact of unusually large outbreaks • Discount function decreased the model estimated size of outbreaks occurring before 2008
*ANOVA model-estimated average outbreak size after exponential discounting of outbreaks occurring from 1998-2007 47
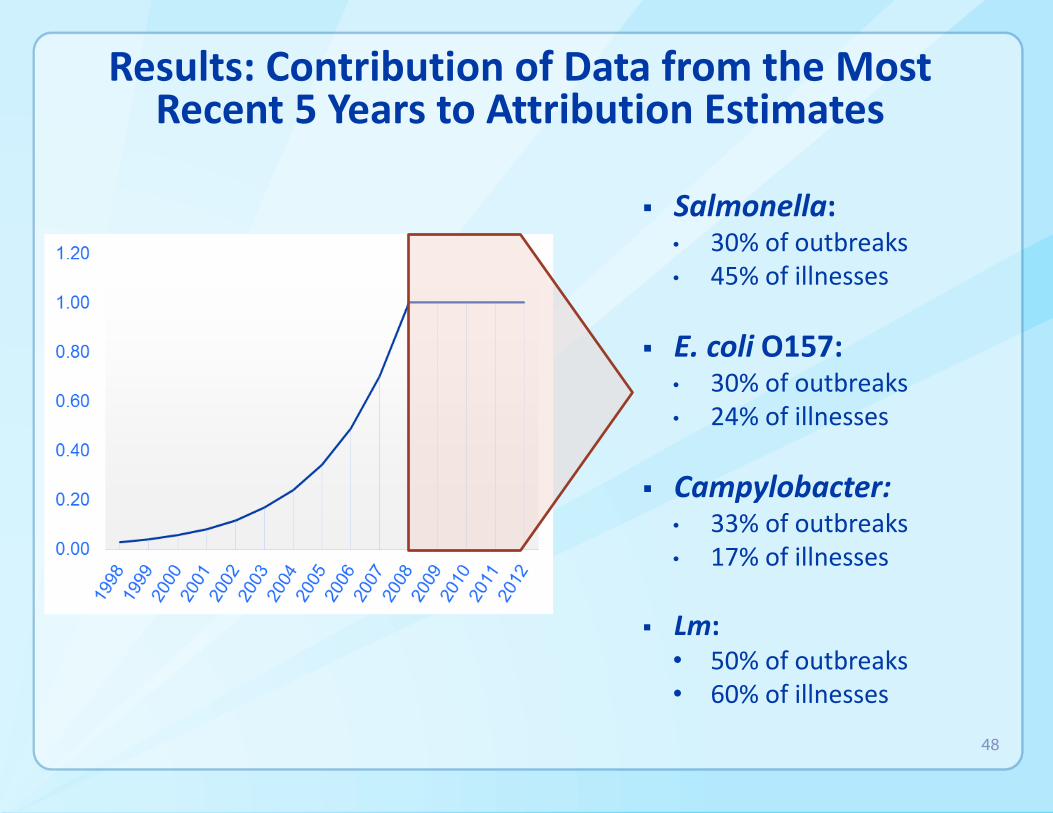
Results: Contribution of Data from the Most Recent 5 Years to Attribution Estimates
Salmonella: • 30% of outbreaks • 45% of illnesses
E. coli O157: • 30% of outbreaks • 24% of illnesses
Campylobacter: • 33% of outbreaks • 17% of illnesses
Lm: • 50% of outbreaks • 60% of illnesses
48
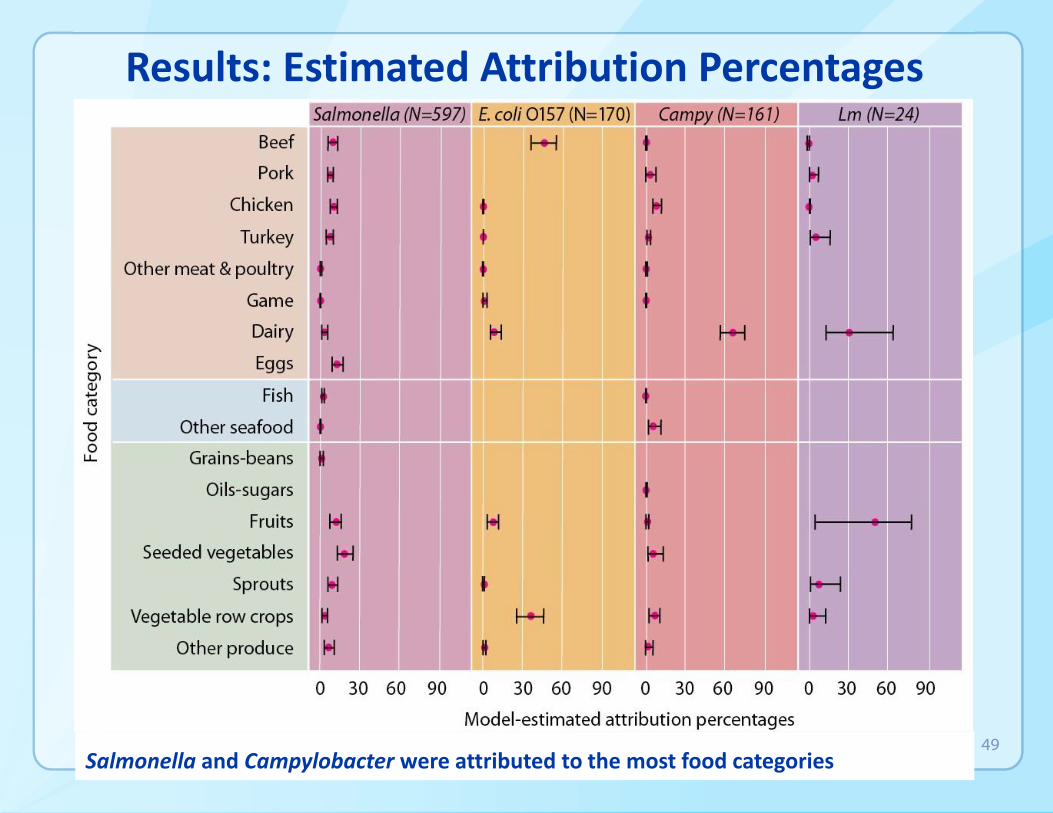
Results: Estimated Attribution Percentages
Salmonella and Campylobacter were attributed to the most food categories 49
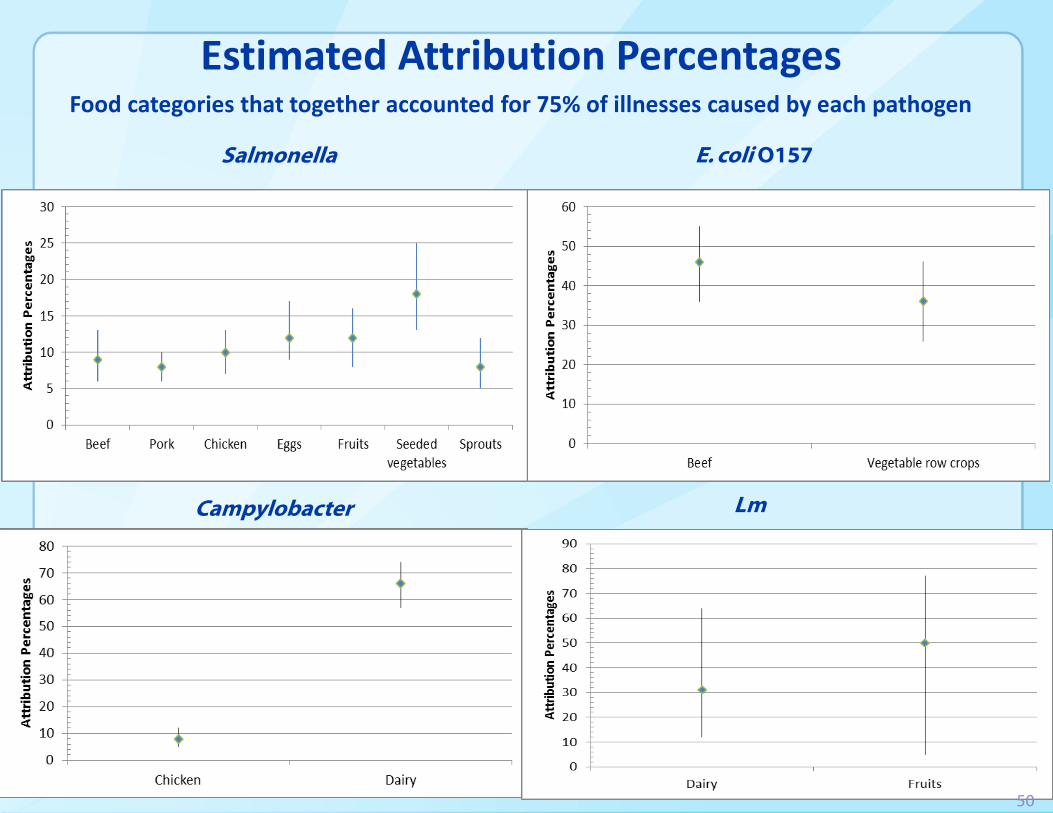
Estimated Attribution Percentages Food categories that together accounted for 75% of illnesses caused by each pathogen
Salmonella E. coli O157
Campylobacter Lm
50
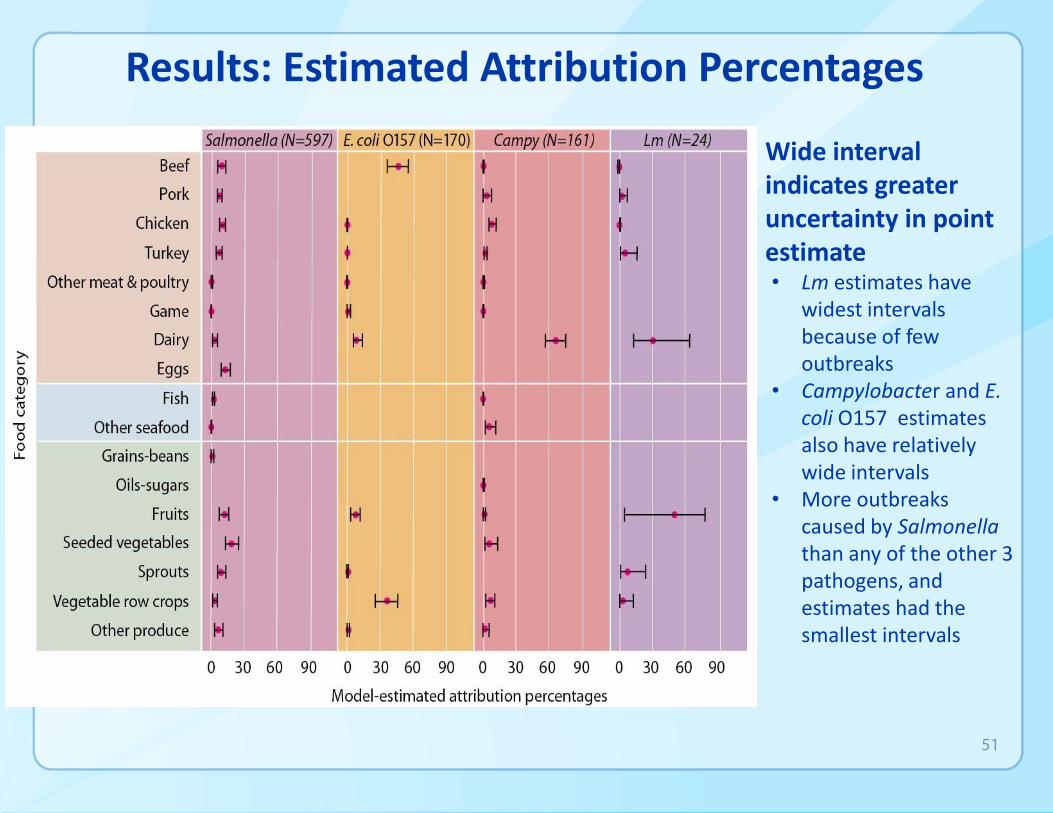
Results: Estimated Attribution Percentages
Wide interval indicates greater uncertainty in point estimate • Lm estimates have
widest intervals because of few outbreaks
• Campylobacter and E. coli O157 estimates also have relatively wide intervals
• More outbreaks caused by Salmonella than any of the other 3 pathogens, and estimates had the smallest intervals
51

Question and Answer Period
52

Overview of Presentation
Overview of Project Approach
Exploratory Analyses
• Question and Answer Period
Methods and Model Results
Assumptions, Strengths, Limitations and Conclusions
• Question and Answer Period
53

Model Assumptions, Strengths, and Limitations
Michael Bazaco, PhD Epidemiologist
Center for Food Safety and Applied Nutrition (CFSAN) U.S. Food and Drug Administration (FDA)
54

Outline
Assumptions
Limitations
• Sparse Data
• Outbreak Inclusion
• Representativeness
Strengths
• Outbreak Based Estimates
• Model Based Attribution Estimates
Conclusions
55
Assumptions
Generalizability
• Outbreak illnesses are the same as sporadic illnesses
• Foods implicated in outbreaks are the same foods causing sporadic illnesses
• Institutional populations and sources of food contamination are representative of the general U.S. population
Equivalence of disease risks within food categories
56
Limitations: Sparse Data Lm and Fruit
Outbreak data is sparse
• As seen with the Lm in fruit estimate, a single large outbreak can be heavily influential on specific model estimates
o The 2011 outbreak of Lm in cantaloupe was very influential in this analysis (147 illnesses)
• The combination of sparse data (24 total outbreaks) and this one very large outbreak is reflected in our Lm estimates and credibility intervals
57
Limitations: Outbreak Inclusion
Only analyzed 952 (36%), of the 2,739 total outbreaks attributed to the four priority pathogens
Excluded outbreaks due to:
• No food product was identified for many outbreaks
• Foods containing ingredients from multiple food categories were excluded
• Some outbreaks were caused by multiple pathogens
• Some outbreaks occurred in outlying U.S. territories
58
Limitations Representativeness:
Institutionalized Populations
10% of the outbreaks in this analysis occurred in institutionalized populations (prisons, hospitals, nursing homes) and these may not be representative of the U.S. population
• Institutionalized populations are demographically different
• Institutionalized populations have access to fewer food options
• Illnesses in an institution may be more likely to be captured during an outbreak
59
Limitations Representativeness:
Campylobacter and Dairy Products
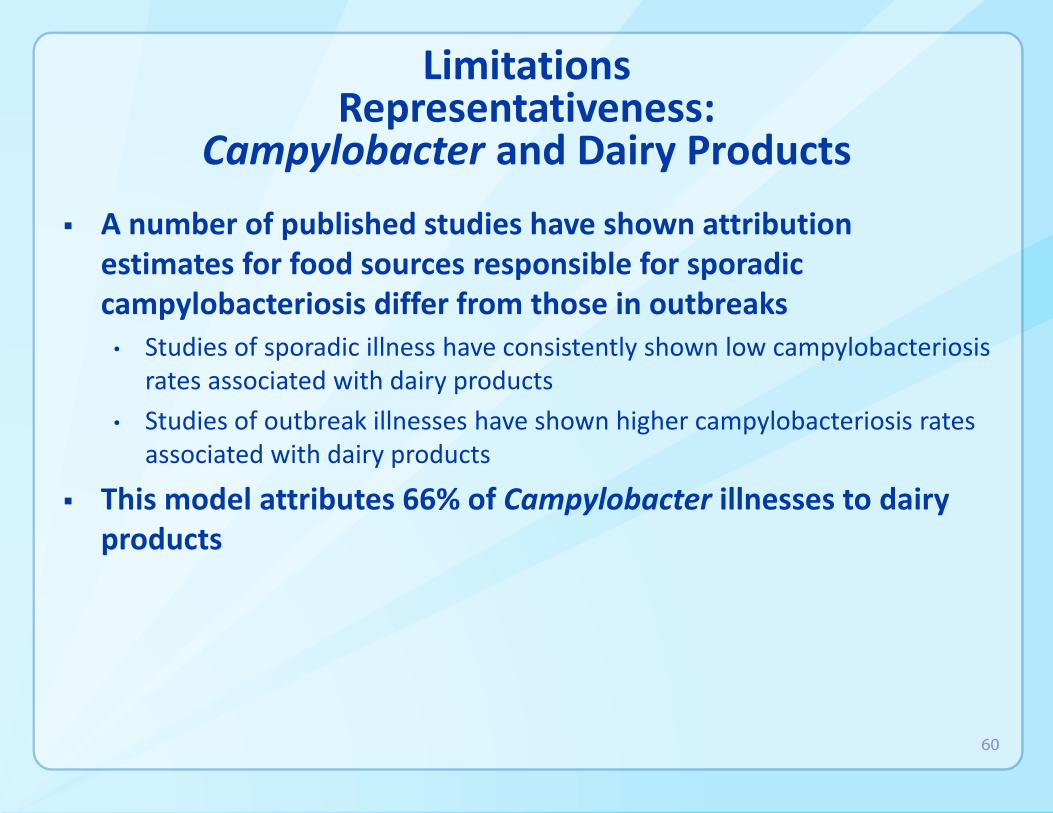
A number of published studies have shown attribution estimates for food sources responsible for sporadic campylobacteriosis differ from those in outbreaks
• Studies of sporadic illness have consistently shown low campylobacteriosis rates associated with dairy products
• Studies of outbreak illnesses have shown higher campylobacteriosis rates associated with dairy products
This model attributes 66% of Campylobacter illnesses to dairy products
60
Limitations Representativeness:
Campylobacter and Raw Milk
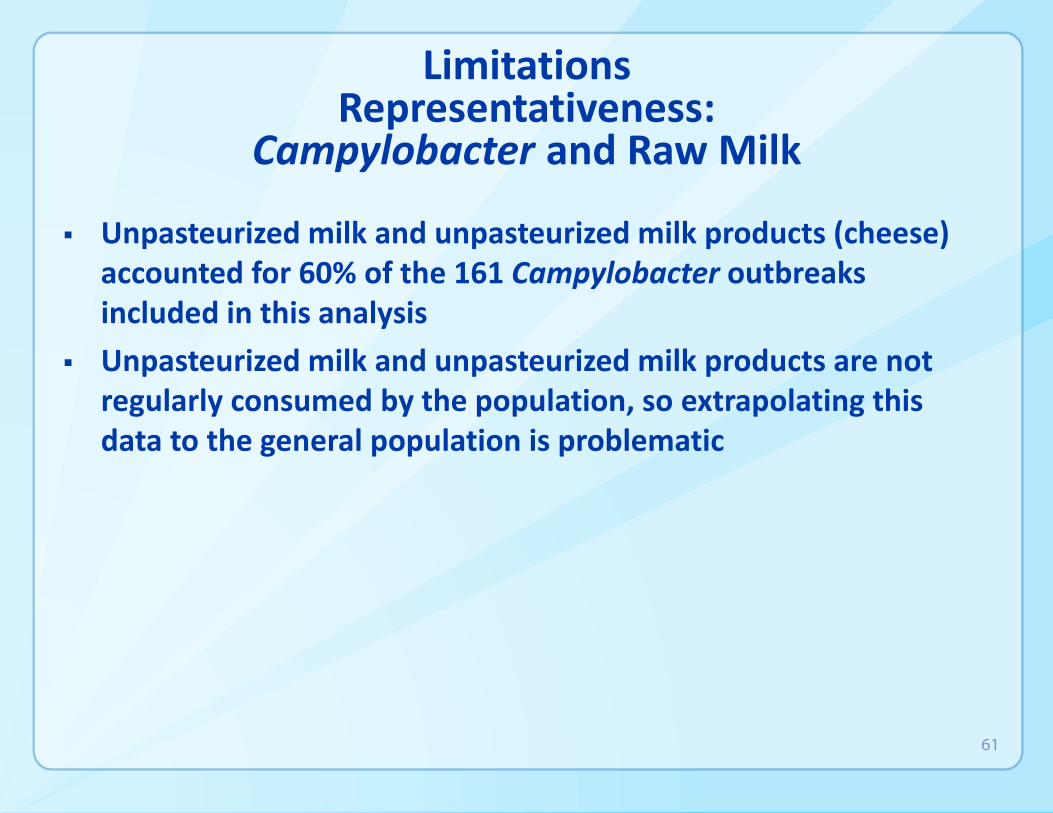
Unpasteurized milk and unpasteurized milk products (cheese) accounted for 60% of the 161 Campylobacter outbreaks included in this analysis
Unpasteurized milk and unpasteurized milk products are not regularly consumed by the population, so extrapolating this data to the general population is problematic
61
Strengths of Outbreak-Based Estimates
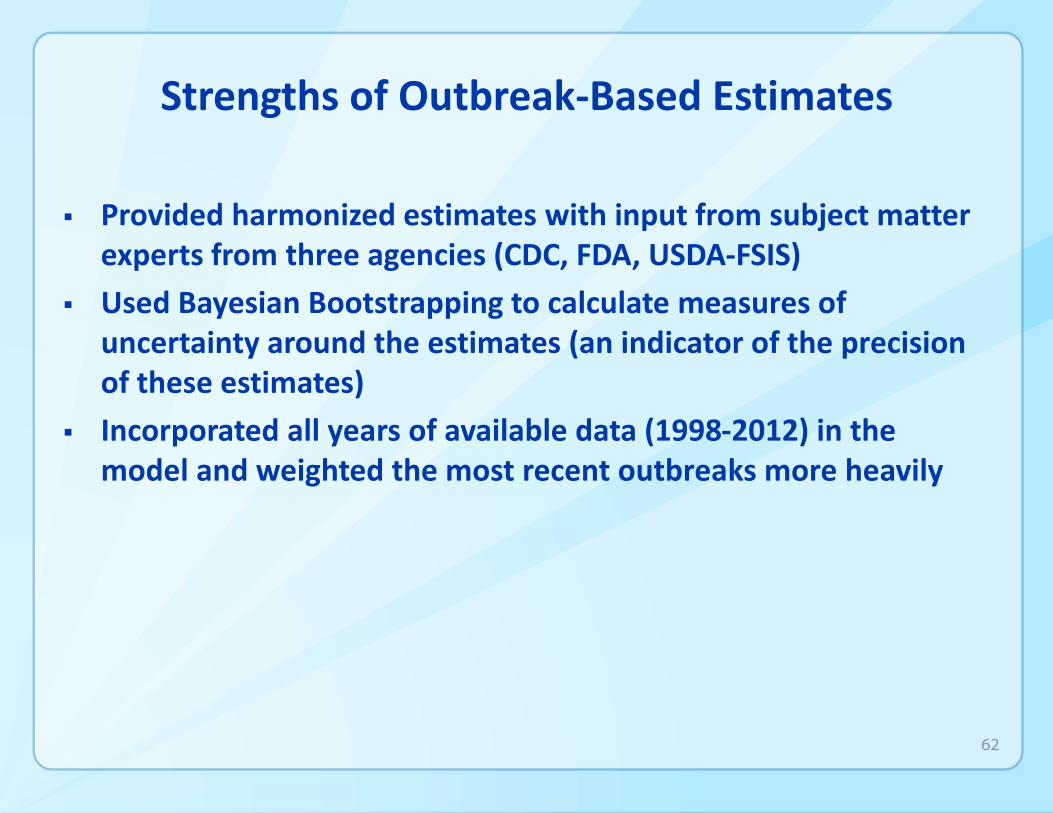
Provided harmonized estimates with input from subject matter experts from three agencies (CDC, FDA, USDA-FSIS)
Used Bayesian Bootstrapping to calculate measures of uncertainty around the estimates (an indicator of the precision of these estimates)
Incorporated all years of available data (1998-2012) in the model and weighted the most recent outbreaks more heavily
62
Strengths of Model-Based Attribution Estimates
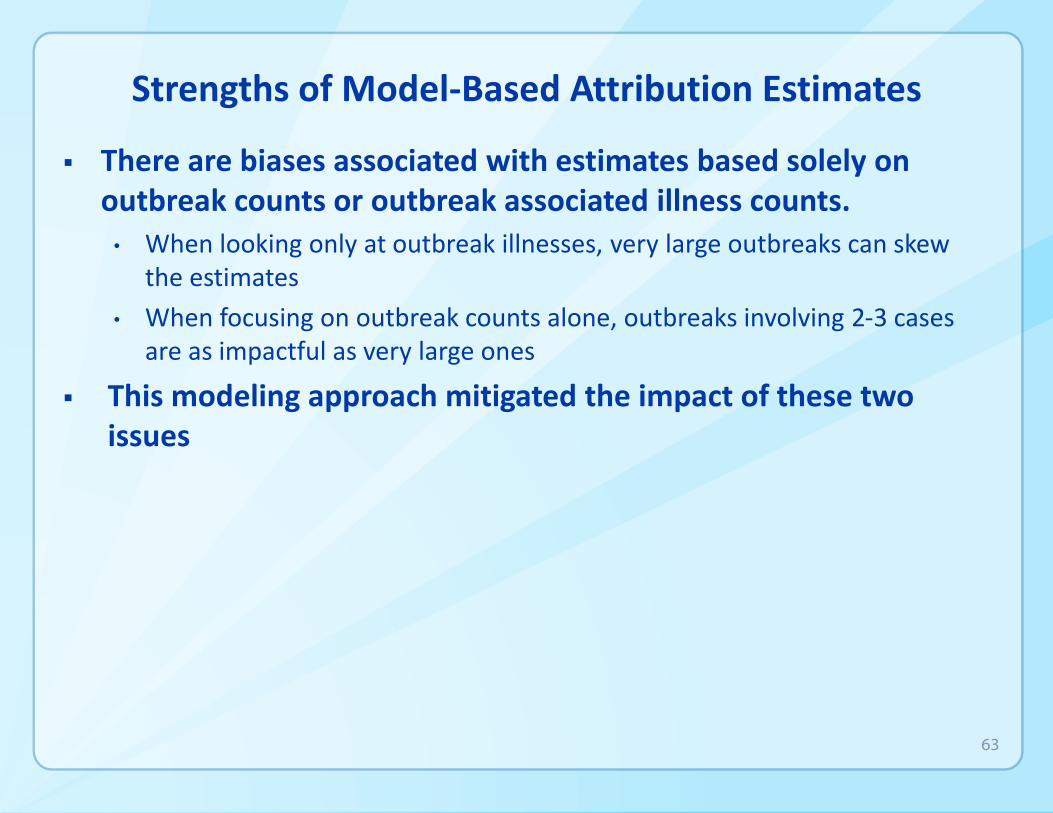
There are biases associated with estimates based solely on outbreak counts or outbreak associated illness counts.
• When looking only at outbreak illnesses, very large outbreaks can skew the estimates
• When focusing on outbreak counts alone, outbreaks involving 2-3 cases are as impactful as very large ones
This modeling approach mitigated the impact of these two issues
63
Strengths of Model-Based Attribution Estimates
The model accounted for other sources of potential bias and uncertainty
• Single state outbreaks v multi-state outbreaks
• Setting of food preparation
The ANOVA model of log-transformed data helped to smooth variability of data
By incorporating all years of available data (1998-2012), we minimized the variability that can be seen in foodborne illness attribution across years
We applied a shelf and decay function to put more emphasis on recent outbreaks
64
Conclusions
Salmonella illnesses were attributed to multiple food categories and attribution estimates had the least amount of statistical uncertainty compared with the other pathogens in the model
Campylobacter infections spanned a broad array of categories, but the point estimate for the Dairy category was notable (66%) and had wide credibility intervals (57-74%)
• High number of outbreaks associated with raw milk or cheese produced from raw milk (e.g., unpasteurized queso fresco)
65
Conclusions (cont.)
82% of E. coli O157 illnesses were attributed to Beef and Vegetable row crops
81% of Lm illnesses were attributed to Dairy and Fruit
• The limited number of Lm outbreaks and the wide credibility intervals dictate caution in interpreting the proportion of listeriosis illnesses attributed these two food categories
66
Conclusions (cont.)
Improved method for estimating attribution percentages from outbreak data
These estimates should be interpreted in the context of the analysis:
• The credibility intervals should be considered when evaluating the precision of the estimates
• Limitations associated with the use of outbreak data
We urge caution in interpreting results
• Lm in fruit
• Campylobacter in dairy
Results should be used with other scientific data when informing decisions on food safety activities
67

Question and Answer Period
68
![[The kitchen sink]: Detecting and monitoring antibiotic ... · Reducing foodborne pathogens in the food chain (1) • Preharvest control of STEC (E. coli O157:H7) in cattle –Develop](https://img.pdfslide.net/doc/110x75/5f04a2247e708231d40ef085/the-kitchen-sink-detecting-and-monitoring-antibiotic-reducing-foodborne-pathogens.jpg)