Embed Size (px)
Citation preview
Estimating Individual Behaviour from Massive
Social Data for AnUrban Agent-Based
Model
Nick Malleson & Mark BirkinSchool of Geography, University
ESSA 2012
OutlineResearch aim: develop a model of urban-
dynamics, calibrated using novel crowd-sourced data.
Background: Data for evaluating agent-based modelsCrowd-sourced data
Data and study area: Twitter in Leeds
Establishing behaviour from tweets
Integrating with a model of urban dynamics
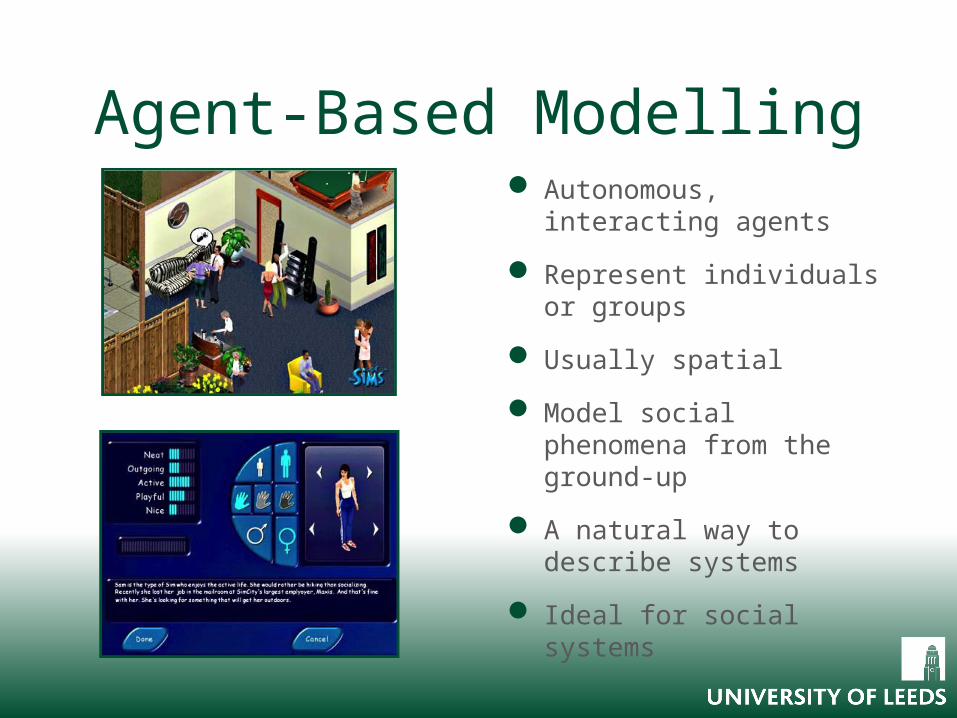
Agent-Based Modelling Autonomous, interacting
agents
Represent individuals or groups
Usually spatial
Model social phenomena from the ground-up
A natural way to describe systems
Ideal for social systems
Data in Agent-Based Models
Data required at every stage: Understanding the system Calibrating the model Validating the model
But high-quality data are hard to come by Many sources are too sparse, low spatial/temporal resolution Censuses focus on attributes rather than behaviour and
occur infrequently
Understanding social behaviour How to estimate leisure times / locations? Where to socialise?
Crowd-Sourced Data for Social Simulation
Movement towards use of massive data sets Fourth paradigm data intensive research (Bell et al., 2009) in the
physical sciences “Crisis” in “empirical sociology” (Savage and Burrows, 2007)
New sources Social media
- Facebook, Twitter, Flikr, FourSquare, etc. Volunteered geographical information (VGI: Goodchild, 2007)
- OpenStreetMap Commercial
- Loyalty cards, Amazon customer database, Axciom
Potentially very useful for agent-based models Calibration / validation Evaluating models in situ (c.f. meteorology models)
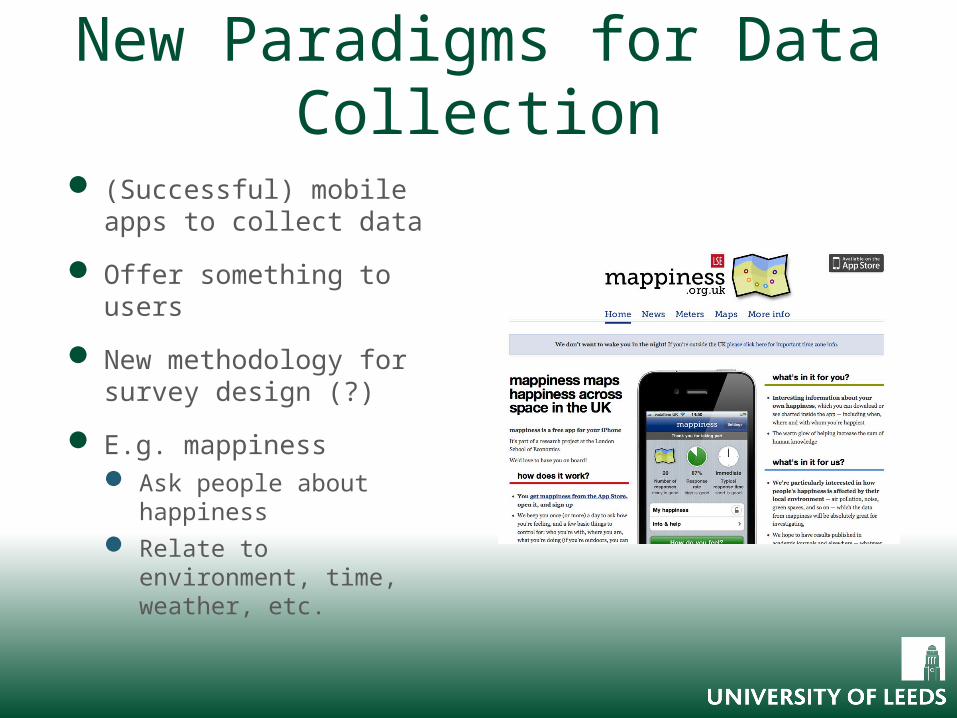
New Paradigms for Data Collection
(Successful) mobile apps to collect data
Offer something to users
New methodology for survey design (?)
E.g. mappiness Ask people about
happiness Relate to environment,
time, weather, etc.
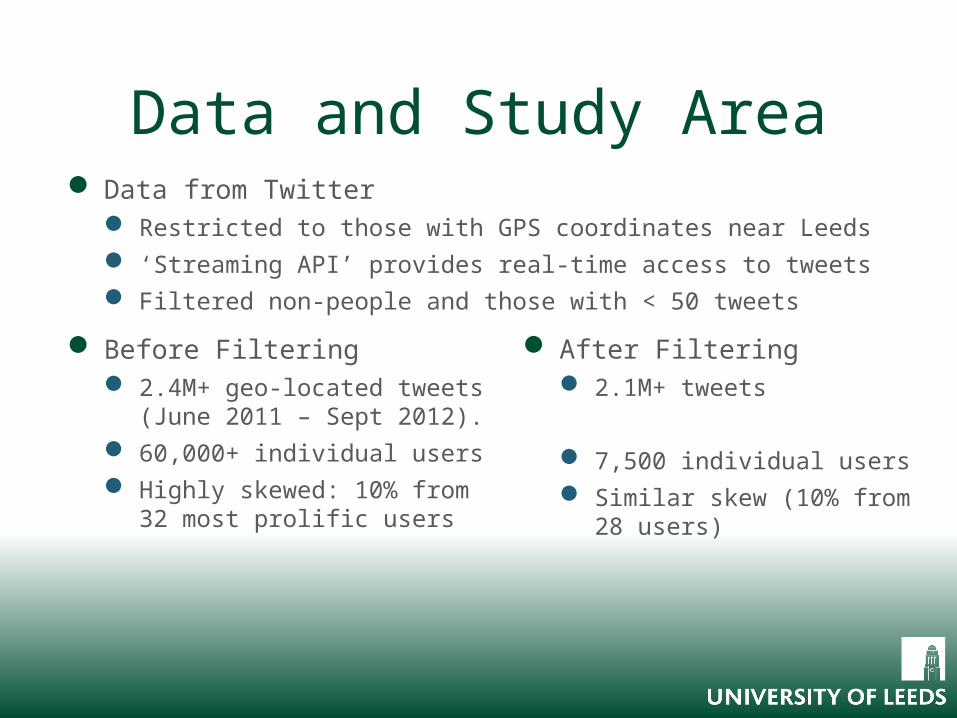
Data and Study Area Data from Twitter
Restricted to those with GPS coordinates near Leeds ‘Streaming API’ provides real-time access to tweets Filtered non-people and those with < 50 tweets
Before Filtering 2.4M+ geo-located tweets
(June 2011 – Sept 2012). 60,000+ individual users Highly skewed: 10% from 32
most prolific users
After Filtering 2.1M+ tweets
7,500 individual users Similar skew (10% from 28
users)
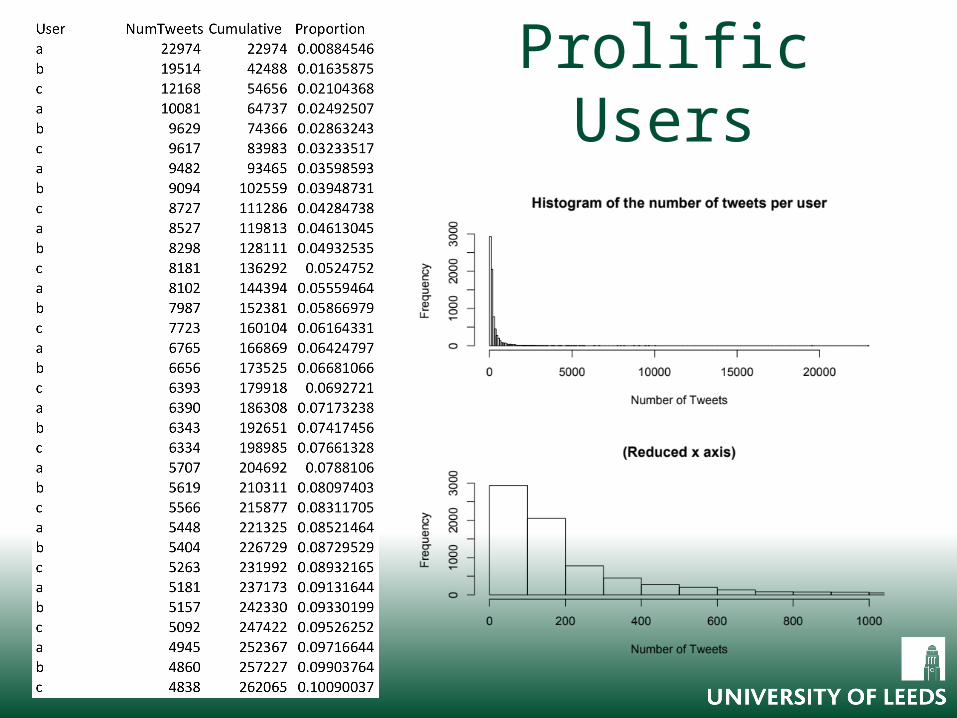
Prolific Users
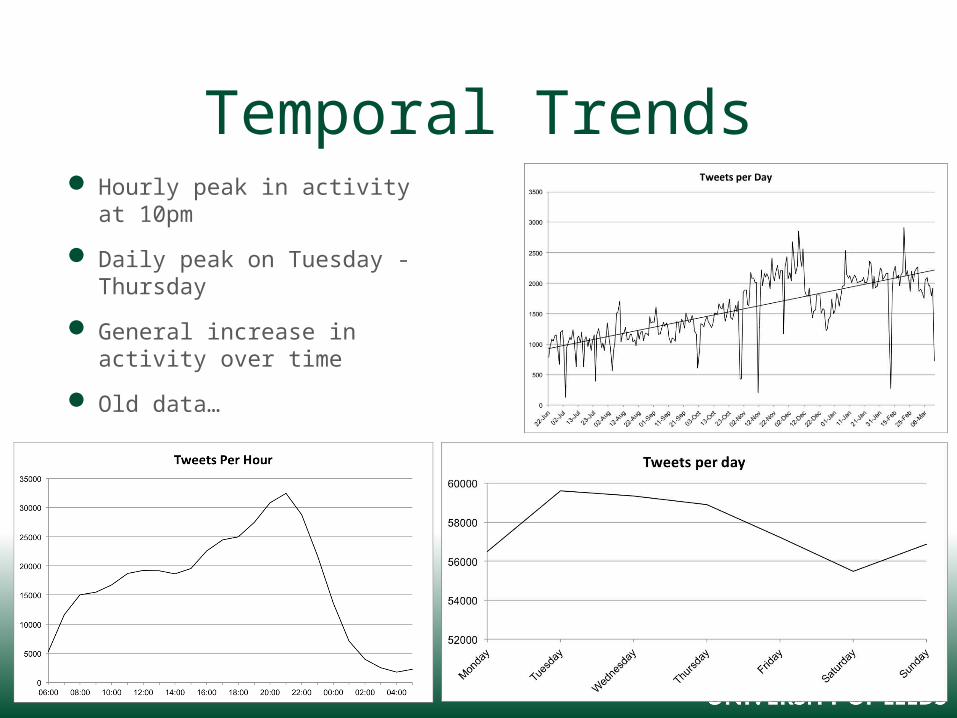
Temporal Trends Hourly peak in activity at
10pm
Daily peak on Tuesday - Thursday
General increase in activity over time
Old data…
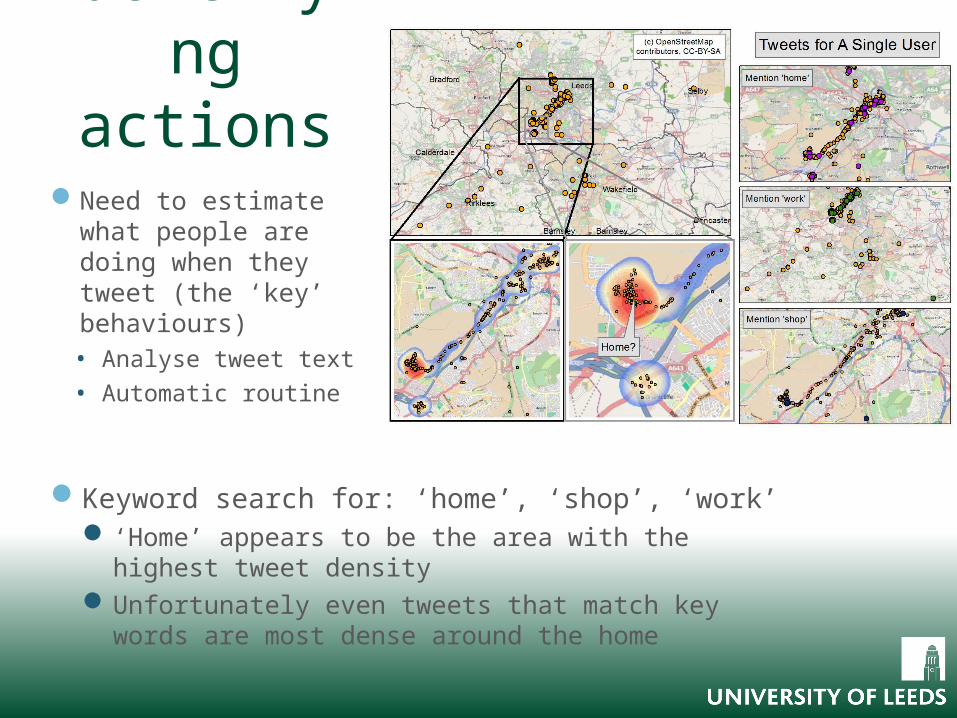
Identifying actions
Need to estimate what people are doing when they tweet (the ‘key’ behaviours)• Analyse tweet text• Automatic routine
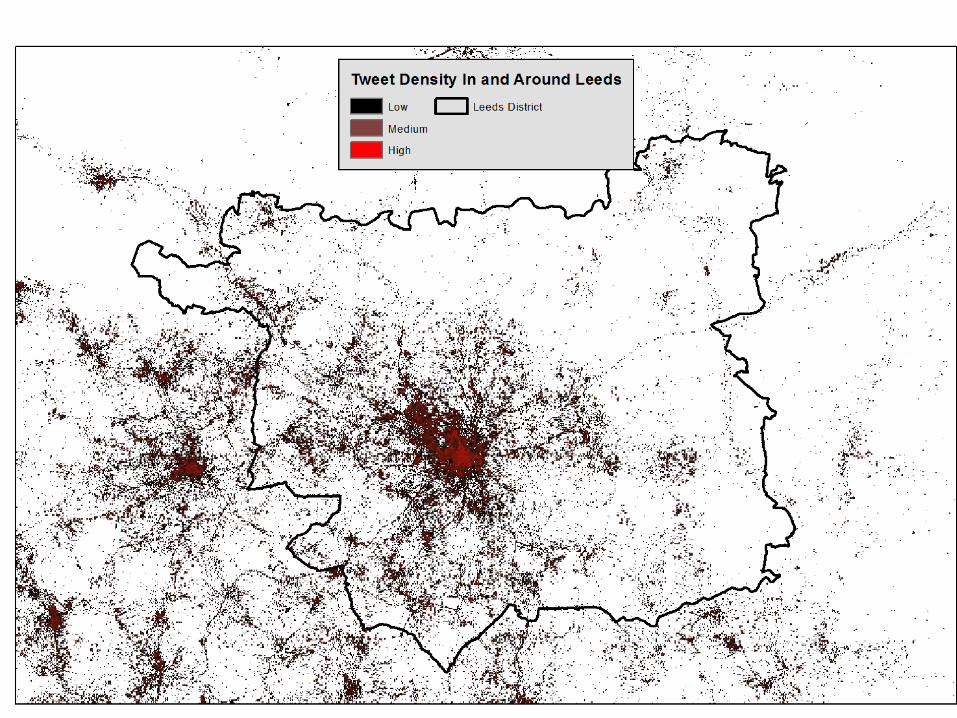
Keyword search for: ‘home’, ‘shop’, ‘work’ ‘Home’ appears to be the area with the highest
tweet density Unfortunately even tweets that match key words
are most dense around the home
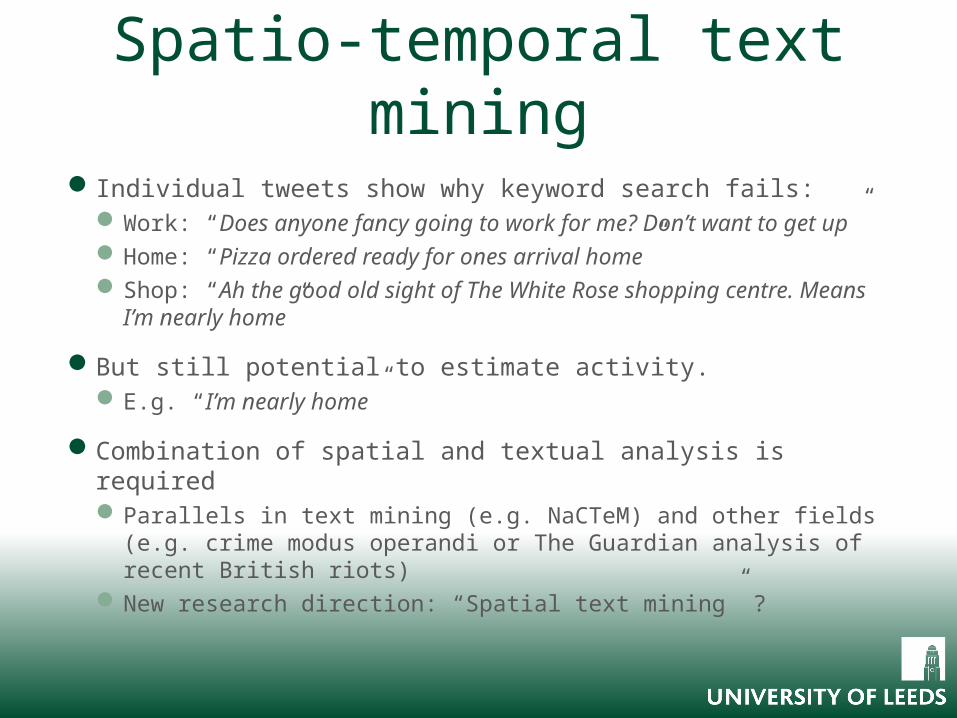
Spatio-temporal text mining
Individual tweets show why keyword search fails: Work: “Does anyone fancy going to work for me? Don’t want
to get up” Home: “Pizza ordered ready for ones arrival home” Shop: “Ah the good old sight of The White Rose shopping
centre. Means I’m nearly home”
But still potential to estimate activity. E.g. “I’m nearly home”
Combination of spatial and textual analysis is required Parallels in text mining (e.g. NaCTeM) and other fields (e.g.
crime modus operandi or The Guardian analysis of recent British riots)
New research direction: “Spatial text mining” ?
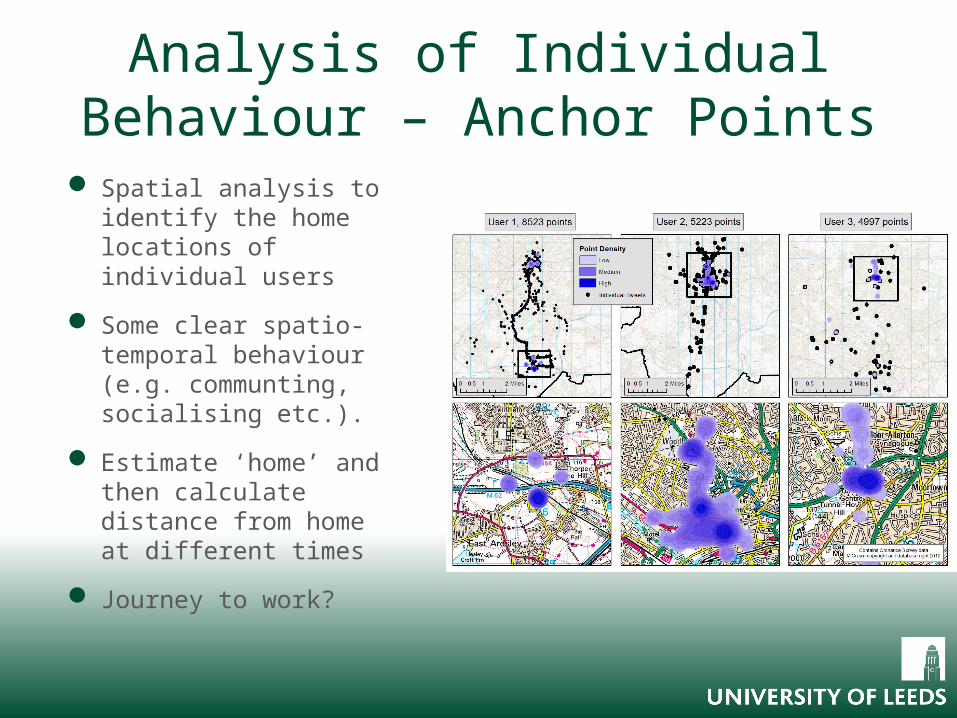
Analysis of Individual Behaviour – Anchor Points
Spatial analysis to identify the home locations of individual users
Some clear spatio-temporal behaviour (e.g. communting, socialising etc.).
Estimate ‘home’ and then calculate distance from home at different times
Journey to work?
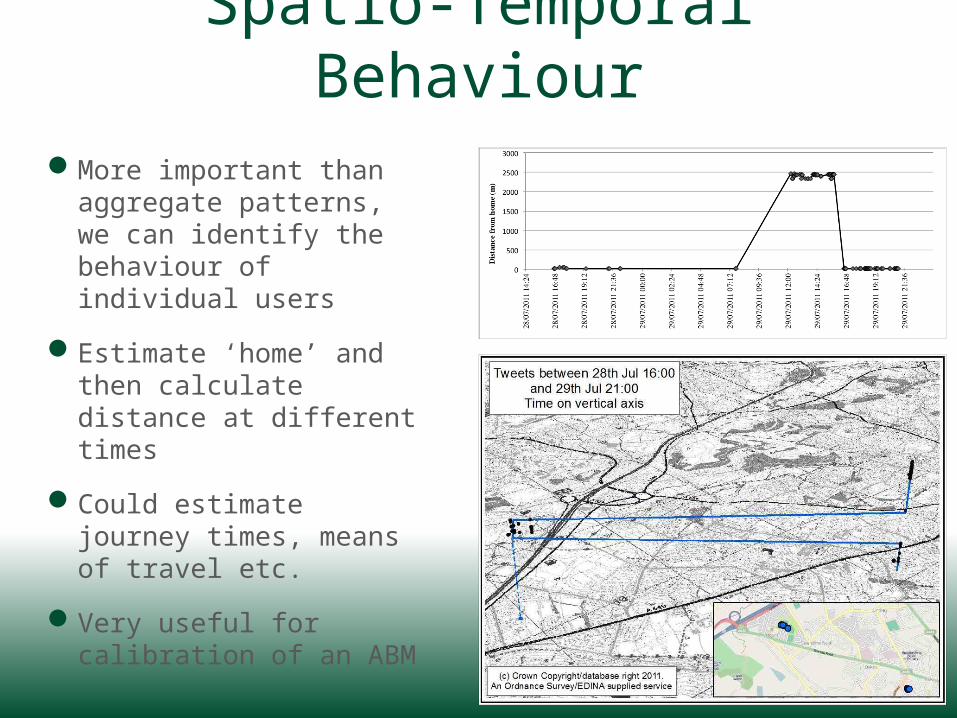
More important than aggregate patterns, we can identify the behaviour of individual users
Estimate ‘home’ and then calculate distance at different times
Could estimate journey times, means of travel etc.
Very useful for calibration of an ABM
Spatio-Temporal Behaviour
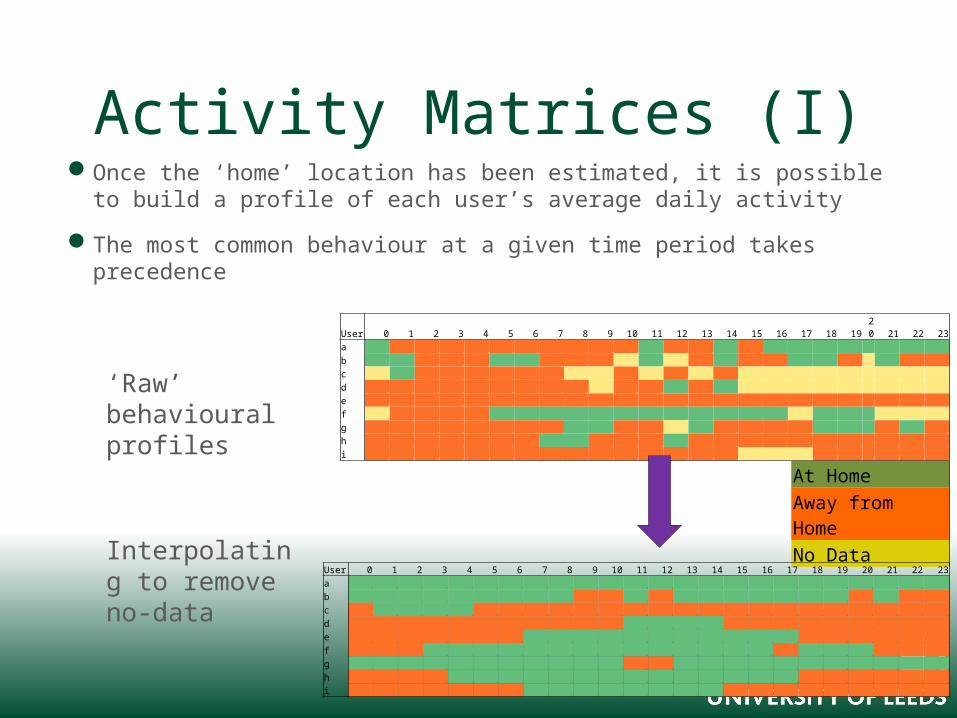
Activity Matrices (I) Once the ‘home’ location has been estimated, it is possible
to build a profile of each user’s average daily activity
The most common behaviour at a given time period takes precedence
‘Raw’ behavioural profiles
Interpolating to remove no-data
At HomeAway from HomeNo Data
User 0 1 2 3 4 5 6 7 8 9 10 11 12 13 14 15 16 17 18 19 20 21 22 23a
3 0 0 0 0 0 0 0 0 0 0 3 0 0 3 0 3 3 3 3 3 3 3 3
b3 3 0 0 0 3 3 0 0 0 1 3 1 0 3 0 0 3 3 0 1 3 0 0
c1 3 0 0 0 0 0 0 1 1 0 1 0 1 0 1 1 1 1 1 1 1 1 1
d0 0 0 0 0 0 0 0 0 1 0 0 3 0 3 1 1 1 1 1 1 1 1 1
e0 0 0 0 0 0 0 0 0 0 0 0 0 0 0 0 0 0 0 0 0 0 0 0
f1 0 0 0 0 3 3 3 3 3 3 3 3 3 3 3 3 1 3 3 3 1 1 1
g0 0 0 0 0 0 0 0 3 3 0 0 1 3 0 0 0 0 3 3 3 0 3 0
h0 0 0 0 0 0 0 3 3 0 0 0 3 0 0 0 0 0 0 0 0 0 0 0
i0 0 0 0 0 0 0 0 0 0 0 0 0 0 0 1 1 1 0 0 0 0 0 0
User 0 1 2 3 4 5 6 7 8 9 10 11 12 13 14 15 16 17 18 19 20 21 22 23a
3 3 3 3 3 3 3 3 3 3 3 3 3 3 3 3 3 3 3 3 3 3 3 3
b3 3 3 3 3 3 3 3 3 1 1 3 1 3 3 3 3 3 3 3 1 3 1 1
c1 3 3 3 3 1 1 1 1 1 1 1 1 1 1 1 1 1 1 1 1 1 1 1
d1 1 1 1 1 1 1 1 1 1 1 3 3 3 3 1 1 1 1 1 1 1 1 1
e1 1 1 1 1 1 1 3 3 3 3 3 3 3 3 3 3 3 1 1 1 1 1 1
f1 1 1 3 3 3 3 3 3 3 3 3 3 3 3 3 3 1 3 3 3 1 1 1
g3 3 3 3 3 3 3 3 3 3 3 1 1 3 3 3 3 3 3 3 3 3 3 3
h1 1 1 1 3 3 3 3 3 3 3 3 3 3 3 3 3 3 1 1 1 1 1 1
i1 1 1 1 1 1 1 3 3 3 3 3 3 3 3 1 1 1 1 1 1 1 1 1
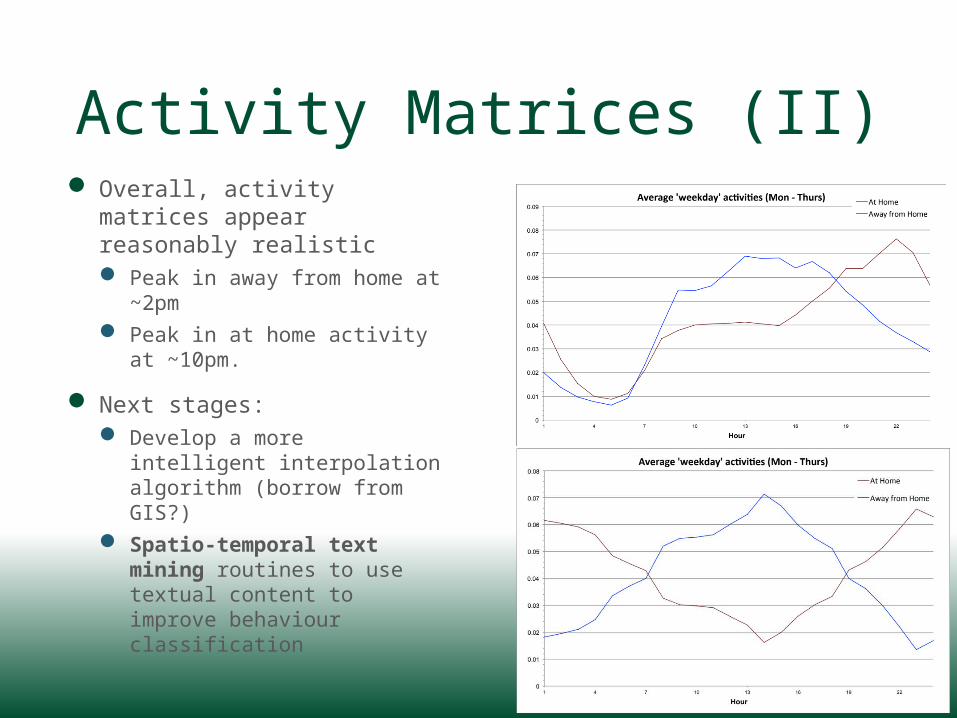
Activity Matrices (II) Overall, activity matrices
appear reasonably realistic Peak in away from home at
~2pm Peak in at home activity at
~10pm.
Next stages: Develop a more intelligent
interpolation algorithm (borrow from GIS?)
Spatio-temporal text mining routines to use textual content to improve behaviour classification
Towards A Model of Urban Dynamics
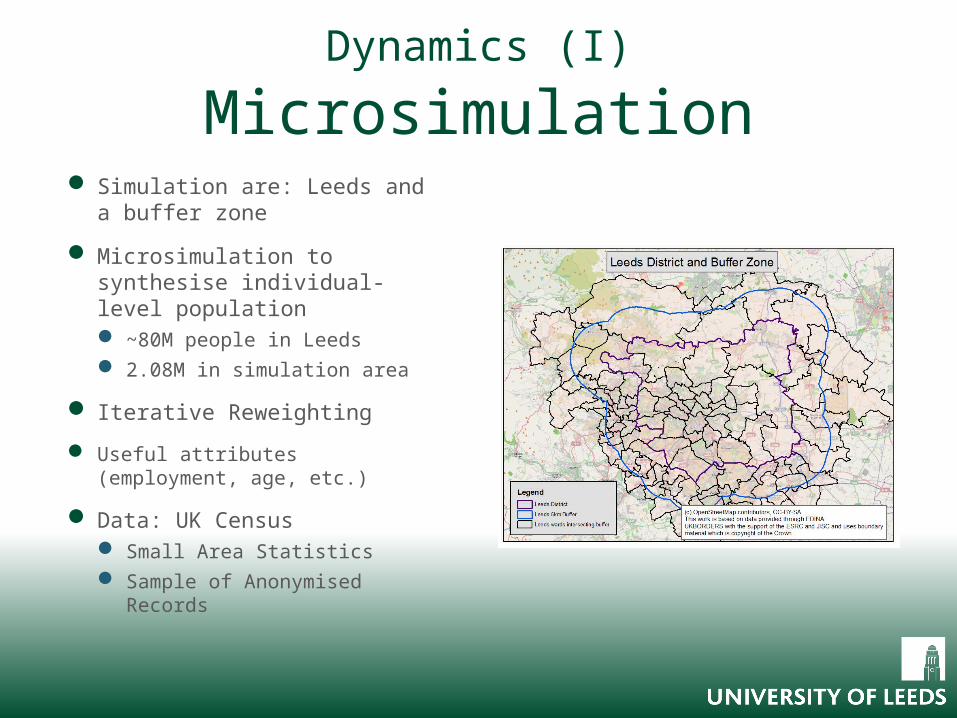
(I) Microsimulation Simulation are: Leeds and a
buffer zone
Microsimulation to synthesise individual-level population ~80M people in Leeds 2.08M in simulation area
Iterative Reweighting
Useful attributes (employment, age, etc.)
Data: UK Census Small Area Statistics Sample of Anonymised
Records
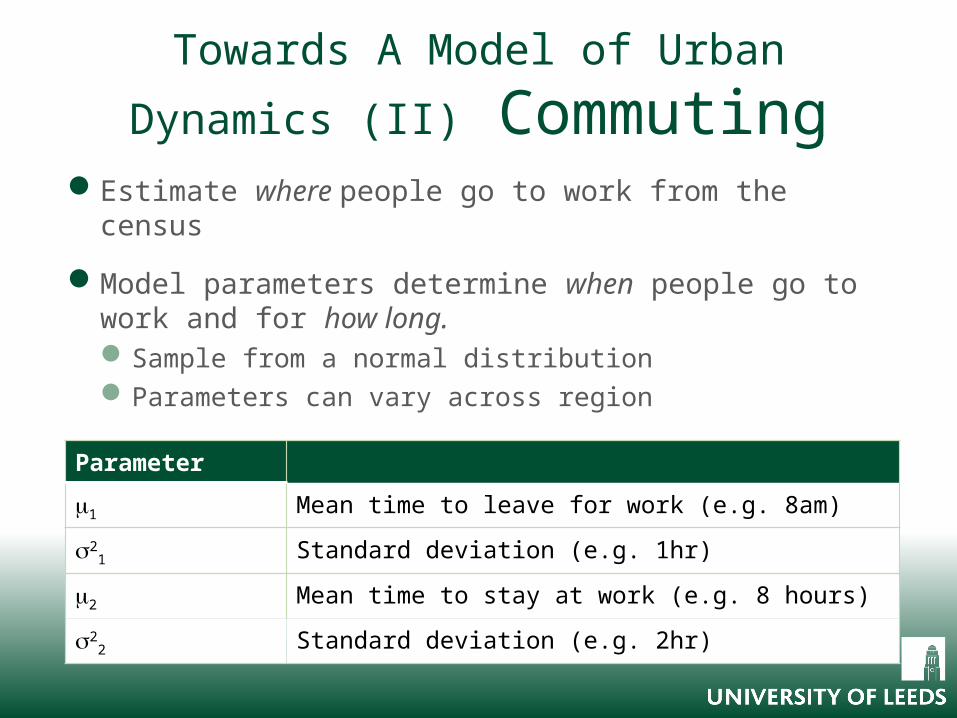
Towards A Model of Urban Dynamics
(II) CommutingEstimate where people go to work from the census
Model parameters determine when people go to work and for how long.Sample from a normal distributionParameters can vary across region
Parameter
1 Mean time to leave for work (e.g. 8am)
21 Standard deviation (e.g. 1hr)
2 Mean time to stay at work (e.g. 8 hours)
22 Standard deviation (e.g. 2hr)
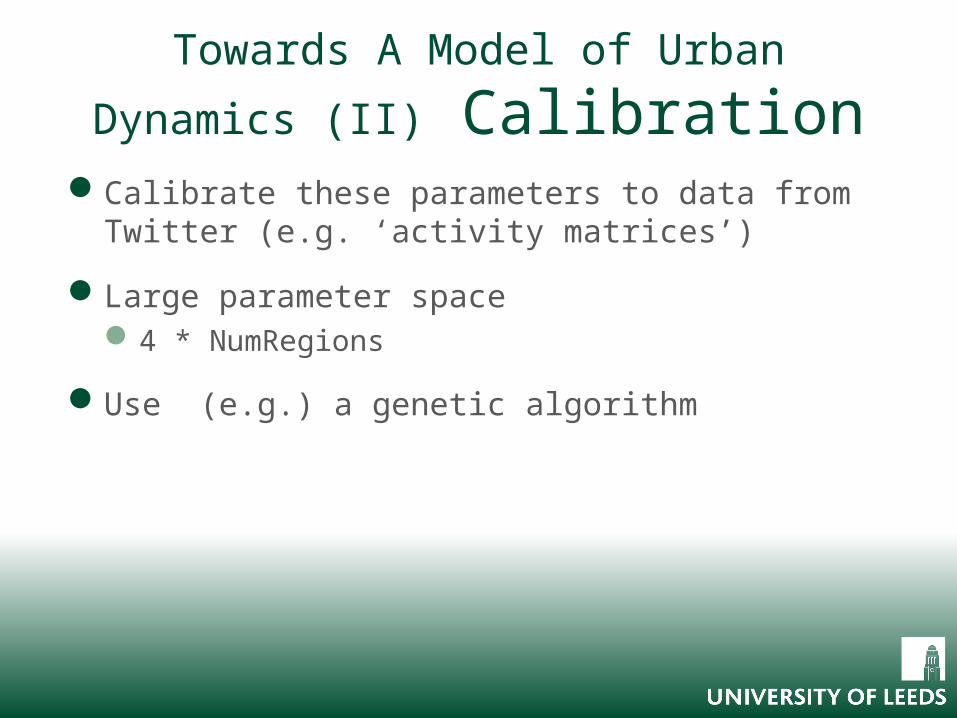
Towards A Model of Urban Dynamics
(II) CalibrationCalibrate these parameters to data from Twitter
(e.g. ‘activity matrices’)
Large parameter space4 * NumRegions
Use (e.g.) a genetic algorithm
Prototype Model

Videos..A video of the prototype model running is
available online:
http://youtu.be/wTw_Sv6aaz0
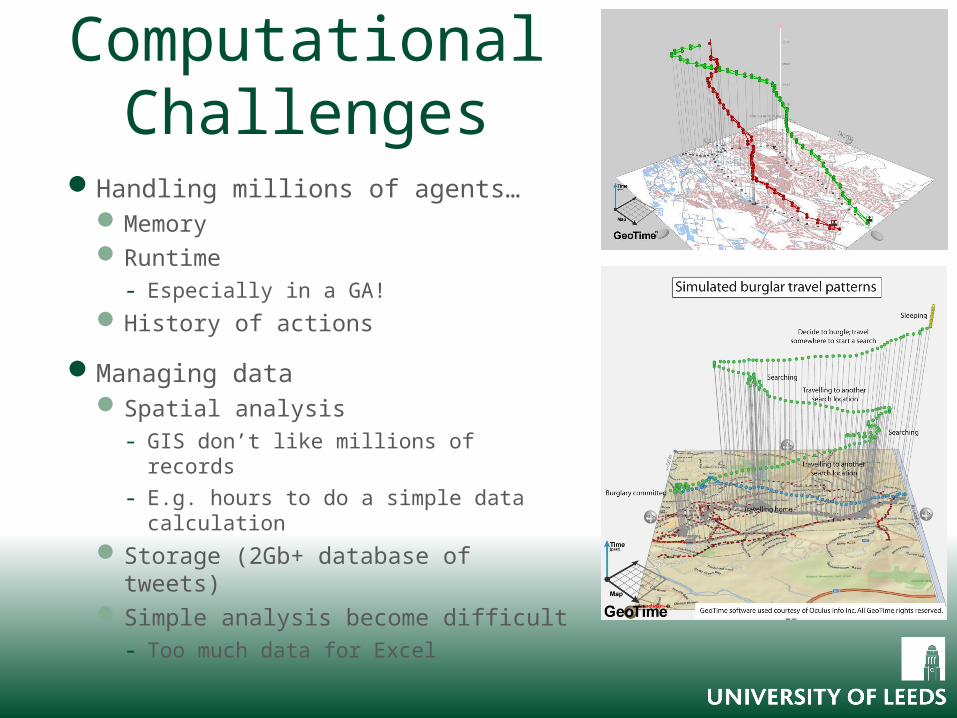
Computational Challenges
Handling millions of agents… Memory Runtime
- Especially in a GA! History of actions
Managing data Spatial analysis
- GIS don’t like millions of records
- E.g. hours to do a simple data calculation
Storage (2Gb+ database of tweets)
Simple analysis become difficult- Too much data for Excel
Data and Ethical Challenges
Data bias: Sampling
- 1% sample (from twitter)
- <10% sample (from GPS)
- Who’s missing? Enormous skew
- Large quantity generated by small proportion of users Similar problems with other data (e.g. rail travel smart
cards, Oyster) Some solutions?
- Geodemographics
- Linking to other individual-level data sets?
Ethics
ConclusionsAim: develop a model of urban-dynamics, calibrated
using novel crowd-sourced data.
New “crowd-sourced” data can help to improve social models (?) Possibly insurmountable problems with bias, but methods
potentially useful in the future Particularly in terms of how to manage the
data/computations
Improved identification of behaviour
New ways to handle computational complexity
In situ model calibration
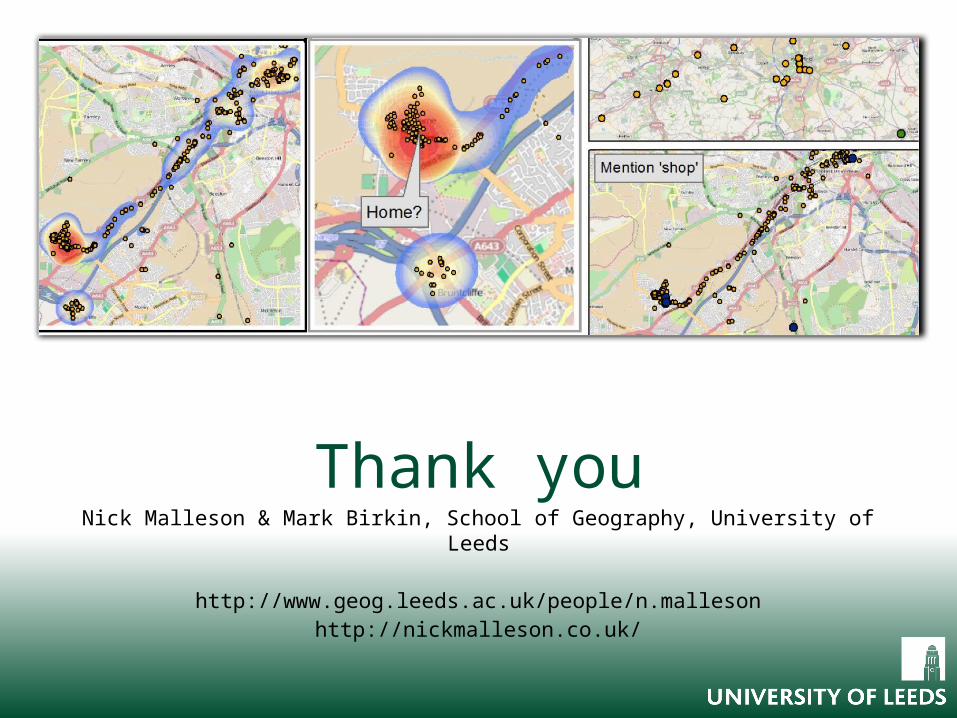
Thank youNick Malleson & Mark Birkin, School of Geography, University of Leeds
http://www.geog.leeds.ac.uk/people/n.mallesonhttp://nickmalleson.co.uk/