Embed Size (px)
Citation preview

NREL is a national laboratory of the U.S. Department of Energy, Office of Energy Efficiency and Renewable Energy, operated by the Alliance for Sustainable Energy, LLC.
Estimating the Costs and Benefits of Complying with Renewable Portfolio Standards: Reviewing Experience to Date
National Conference of State
Legislatures Webinar
March 20, 2014
Jenny Heeter (NREL) and Galen
Barbose (LBNL)

2 and LAWRENCE BERKELEY NATIONAL LABORATORY
Overview
1. Report background and highlights
2. Methods of determining cost impact
3. Incremental RPS compliance costs (Galen Barbose, LBNL)
4. Benefits of RPS
5. Conclusion and questions
3 and LAWRENCE BERKELEY NATIONAL LABORATORY
Highlights
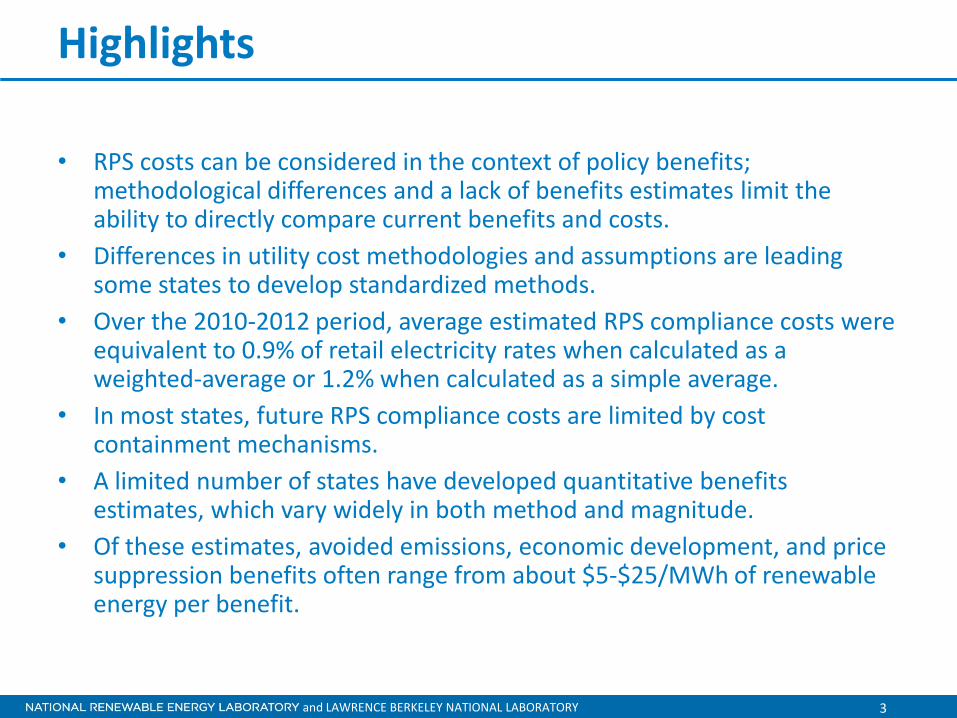
• RPS costs can be considered in the context of policy benefits; methodological differences and a lack of benefits estimates limit the ability to directly compare current benefits and costs.
• Differences in utility cost methodologies and assumptions are leading some states to develop standardized methods.
• Over the 2010-2012 period, average estimated RPS compliance costs were equivalent to 0.9% of retail electricity rates when calculated as a weighted-average or 1.2% when calculated as a simple average.
• In most states, future RPS compliance costs are limited by cost containment mechanisms.
• A limited number of states have developed quantitative benefits estimates, which vary widely in both method and magnitude.
• Of these estimates, avoided emissions, economic development, and price suppression benefits often range from about $5-$25/MWh of renewable energy per benefit.

Cost Methodologies

5 and LAWRENCE BERKELEY NATIONAL LABORATORY
Considerable Variation in RPS Cost Methodologies
• RPS costs may be defined as either “gross” or “incremental”; most states calculate the incremental cost of compliance. o Incremental costs refer to the cost of renewable electricity above and beyond what
would have been incurred absent an RPS.
• The method by which costs are determined is related to the regulatory structure of a given state.
• For traditionally-regulated states, utilities and PUCs use a variety of methods, which include: o Proxy generator: cost of generator that might otherwise operate if the renewables
were not operating o Market price: cost to purchase wholesale power o Modeling: using a tool to understand dispatch stack with and without renewables o and Hybrid approaches.
• For states in restructured markets, costs have generally not be calculated by states or load serving entities; we calculated compliance costs based on REC prices, compliance information, and to some degree, long-term contracting information.

6 and LAWRENCE BERKELEY NATIONAL LABORATORY
REC Price
Proxy Generator
Market Price
Modeling
Other/Hybrid
Gross Costs
No Data Available
No RPS
Traditionally regulated state
RR
R
R
R
R
R
RR R
R
R R R
R
R
R
Examples of Cost Methodologies
Note: While there is a spectrum of restructuring in states, for the purposes of this study, we classify the following RPS jurisdictions as operating in traditionally regulated markets: Arizona, California, Colorado, Iowa, Kansas, Michigan, Minnesota, Missouri, New Mexico, North Carolina, Oregon Washington, Wisconsin, and Wyoming.

7 and LAWRENCE BERKELEY NATIONAL LABORATORY
Factors Influencing Cost Calculations
• Treatment of pre-RPS renewable generation
• Treatment of indirect expenditures (e.g. integration or administrative costs)
• Timeframe over which incremental costs are estimated
• Inclusion of a “carbon adder”
• In restructured markets: REC price approach does not necessarily match the incremental cost of renewable generation; reflects the supply/demand balance in the region

8 and LAWRENCE BERKELEY NATIONAL LABORATORY
Efforts to Standardize Cost Calculation Methods
Some PUCs are Examining How to Evaluate RPS Costs on a Standardized Basis • California: The PUC is charged with developing a methodology to cap costs
under the 33% RPS.
• Delaware: DNREC is developing rules for calculating the cost of compliance; draft rules allow for some incorporation of benefits.
• Minnesota: The PUC is developing a uniform reporting system as well as guiding principles for assessing cost impacts.
• Oregon: The PUC approved a stakeholder agreement in January 2014 to address methodology for calculating incremental RPS costs.
• Washington: The PUC will be addressing cost standardization as part of its RPS revision docket.

Historical Cost Data

10 and LAWRENCE BERKELEY NATIONAL LABORATORY
Summarizing Historical Cost Data: Approach
• Focus on incremental compliance costs (i.e., net of avoided costs) over the 2010-2012 period
o Net cost to utility, not to society or to ratepayers
• Restructured Markets: Calculate costs based REC and ACP prices and volumes for each resource tier
o Data sources for REC pricing: PUC reports if available; otherwise used REC spot market prices, supplemented with data on long-term contract pricing
• Regulated States: Synthesize cost estimates published by utilities and PUCs, based on the varying methods and conventions used
• Calculated two cost metrics:
o $/MWh
o % of average retail rates

11 and LAWRENCE BERKELEY NATIONAL LABORATORY
RPS Costs for Restructured Markets: Key Caveats
• REC Price Volatility: Prices at any point in time reflect supply-demand balance and occasional changes to RPS rules; don’t always correspond well to underlying technology costs or levelized cost of energy (LCOE)
• Limited REC price transparency: Broker published spot market index data may be poor proxy for average REC costs, especially where a significant portion of REC purchases have occurred via long-term contracts
• Omitted costs and savings: REC and ACP costs don’t reflect all RPS-related costs (e.g., integration) or benefits to the utility (e.g., reduced wholesale electricity market prices)

12 and LAWRENCE BERKELEY NATIONAL LABORATORY
Restructured Markets: $/MWh
• Costs ranged from well below $10/MWh to upwards of $60/MWh
• Trends are partly a function of REC and ACP prices across states and years (e.g., main tier REC prices in New England states rose to ACP levels over this period, but remained low in most other states)
• Also reflects varying mixes of resource tiers across states (e.g., low costs in ME, which has large secondary tier; relatively high costs in states with large solar set-asides)
0
10
20
30
40
50
60
70
80
CT
DC
DE IL
MA
MD
ME
NH
NJ
NY
OH
PA RI
TX
2010
2011
2012
Incremental Cost of RPS*(Average Cost of RECs+ACPs Across All Tiers)
* Incremental costs are estimated from REC and ACP prices and volumes for each compliance year, which may differ from calendar years. If available, REC prices are based on average prices reported by the PUC (DC, IL, MD, ME, OH, NJ, PA); they are otherwise based on published spot market prices, supplemented with data on long-term contract prices where available. Incremental costs for NY are based on NYSERDA's annual RPS expenditures and estimated REC deliveries.
no
min
al $
/MW
h
Data represent an estimate of the weighted
average price of all RECs retired and ACPs made
in each year, across all tiers

13 and LAWRENCE BERKELEY NATIONAL LABORATORY
Restructured Markets: % of Retail Rates
• Costs were generally <2% of retail rates (10 out of 14 states in 2012), but also varied significantly
• Trends reflect the same drivers discussed previously (REC pricing and mix of resource tiers)
• Also reflect differences in RPS target level hence costs rose in most states as RPS targets rose (one exception being NJ, where the decline in SREC prices more-than-offset the increase in RPS targets)
Data represent the ratio of the dollar value of
RPS compliance costs to total
retail electricity costs in each
year
0%
1%
2%
3%
4%
5%
CT
DC
DE IL
MA
MD
ME
NH
NJ
NY
OH
PA RI
TX
2010 2011 2012
Incremental Cost of RPS*(Percent of Average Statewide Retail Electricity Rate)
* Incremental costs are estimated from REC and ACP prices and volumes for each compliance year, which may differ from calendar years. If available, REC prices are based on average prices reported by the PUC (DC, IL, MD, ME, OH, NJ, PA); they are otherwise based on published spot market prices, supplemented with data on long-term contract prices where available. Incremental costs for NY are based on NYSERDA's annual RPS expenditures and estimated REC deliveries.

14 and LAWRENCE BERKELEY NATIONAL LABORATORY
Restructured Markets: Costs Breakdowns
• Main tier requirements represented the bulk of RPS compliance costs in most states
• Exceptions in DC and NJ (high solar requirements and SREC prices) and MA and NH (high secondary tier REC prices)
• ACP costs generally minimal (reflecting adequate REC supply)
• Exceptions in MA, NH, and RI, where shortages led to significant reliance on ACPs in some years
0%
1%
2%
3%
4%
5%
CT
DC
DE IL
MA
MD
ME
NH
NJ
NY
OH
PA RI
TX
Solar/DG Set-Aside
Main Tier
Secondary Tier(s)
Incremental Cost of RPS (2010-2012 Avg.)*(Percent of Average Statewide Retail Electricity Rate)
* Incremental costs are estimated from REC and ACP prices and volumes for each compliance year, which may differ from calendar years. If available, REC prices are based on average prices reported by the PUC (DC, IL, MD, ME, OH, NJ, PA); they are otherwise based on published spot market prices, supplemented with data on long-term contract prices where available. Incremental costs for NY are based on NYSERDA's annual RPS expenditures and estimated REC deliveries.
0%
1%
2%
3%
4%
5%
CT
DC
DE IL
MA
MD
ME
NH
NJ
NY
OH
PA RI
TX
ACPs & Penalties
RECs
Incremental Cost of RPS (2010-2012 Avg.)*(Percent of Average Statewide Retail Electricity Rate)
* Incremental costs are estimated from REC and ACP prices and volumes, averaged over the 2010-2012 compliance years, based on those years for which data are available. Only 2010 data available for CT and DC. If available, REC prices are based on average prices reported by the PUC (DC, IL, MD, ME, OH, NJ, PA); they are otherwise based on published spot market prices, supplemented with data on long-term contract prices where available. For IL, ACP costs reflect the requirement that competitive suppliers must meet at least 50% of RPS target with ACPs. NY does not have ACPs or penalties; all costs are therefore associated with REC procurement and program administration.
RPS costs disaggregated into resource tiers (top) and RECs vs. ACPs (bottom)

15 and LAWRENCE BERKELEY NATIONAL LABORATORY
RPS Cost Estimates for Regulated States
• Incremental costs must be imputed relative to a counterfactual
• We summarize incremental costs for 11 states, based on estimates published by utilities and PUCs (annual compliance reports and other regulatory filings)
o Data for most states limited to IOUs
• Important limitations:
o Incremental cost data unavailable for a number of states (HI, IA, KS, MT, NV)
o Cost data summarized on statewide average basis, but costs may vary among utilities within a state
o Methods and conventions used by utilities and regulators when estimating incremental RPS costs vary considerably (or are not completely transparent)
o Temporal disconnects can occur between the timing of RPS obligations and when the costs associated with meeting those obligations are incurred

16 and LAWRENCE BERKELEY NATIONAL LABORATORY
Regulated States: $/MWh
• Incremental costs were typically near or below $20/MWh (the above-market cost of RPS contracts and utility-owned resources, as reported by utility/PUC)
• Negative incremental cost – i.e., net savings – in OR, where cost-effective renewables procured through IRP processes
• Some variation reflects methodological differences: WI relied on wholesale energy market prices as the basis for avoided costs; energy prices in 2010 were depressed due to economic downturn, resulting in higher incremental RPS costs
For reasons of data availability,
this figure focuses on only
general RPS obligations (i.e., excludes solar or
DG set asides)
-10
0
10
20
30
40
50
AZ
CO MI
OR
WA
WI
2010 2011 2012
no
min
al $
/MW
h
* Incremental cost of general RPS obligations (i.e., RPS obligations excluding any set-asides) are based on utility- or PUC-reported estimates. Data for AZ and CO are based only on the single largest utility in each state (APS and PSCo, respectively). States omitted if data on the incremental costs of general RPS obligations are unavailable (HI, IA, KS, MT, NV) or if available data cannot be translated into the requisite form for this figure (MN, NC, NM, MO). See Text Box 2 for data on CA.
Incremental Cost of General RPS Obligations*(Average Above-Market Cost of Utility RPS Procurement)

17 and LAWRENCE BERKELEY NATIONAL LABORATORY
Regulated States: % of Retail Rates
• RPS costs were at or below ~2% of average retail rates in most (7 of 10) states
• Costs were higher in AZ, CO, and NM due in part to solar/DG set-aside costs (right-hand chart), where costs are front-loaded via rebate programs and performance-based incentives
• Relatively low costs in a number of states (MI, MO, NC) with low RPS targets during the analysis period and/or where targets were met primarily with pre-existing renewables
These figures include
DG/solar set-aside costs along with
general RPS obligations
-1%
0%
1%
2%
3%
4%
5%
6%
AZ
CO MI
MN
MO
NC
NM
OR
WA
WI
2010 2011 2012
* Incremental costs are based on utility- or PUC-reported estimates and are based on either RPS resources procured or RPS resources applied to the target in each year. Data for AZ include administrative costs, which are grouped in "General RPS Obligations" in the right-hand figure. Data for CO are for Xcel only. Data for NM in the left-hand figure include SPS (2010-2012) and PNM (2010 and 2012), but include only SPS in the right-hand figure. States omitted if data on RPS incremental costs are unavailable (HI, IA, KS, MT, NV). See Text Box 2 for data on CA.
Incremental Cost of RPS* (Percent of Average Statewide Retail Electricity Rate)
0%
1%
2%
3%
4%
5%
6%
2010 2011 2012 2010 2011 2012 2011 2012
AZ CO NM
DG and/or Solar Set-AsideGeneral RPS Obligations

18 and LAWRENCE BERKELEY NATIONAL LABORATORY
Incremental RPS Costs in California
• California PUC RPS cost report includes two alternate methods for computing avoided costs from RPS procurement in 2011:
1. Market Price Referent (MPR): the estimated all-in cost of a CCGT, used by the CPUC for calculating the above-market costs of individual RPS contracts
2. CAISO energy and capacity market prices: used by utilities as a proxy for short-run avoided costs
• Incremental cost estimates diverge widely – i.e., net savings equal to 3.6% of average retail rates when using the MPR-based approach vs. net cost of 6.5% of retail rates using market prices
• A potent illustration of the importance of methodological issues for RPS costs
Alternate RPS Incremental Cost Estimates for California (2011)
RPS Procurement (% of Retail Sales)
Incremental Costs Calculated using MPR as Avoided Cost
Incremental Costs Calculated using Spot Market Prices as Avoided Cost
$/MWh % of Retail Rates $/MWh % of Retail
Rates
20% -24 -3.6% 43 6.5%

19 and LAWRENCE BERKELEY NATIONAL LABORATORY
RPS Surcharges: Residential Costs in 2012
• Dedicated “line-item” surcharges are sometimes used to recover RPS costs
• Represent the direct cost of the RPS to the customer, in contrast to utility costs presented previously
• Denominated in various ways:
o $/kWh charges (AZ, DE, OH, NY, RI)
o Fixed percentage of total bill (CO)
o Fixed monthly customer charges (MI, NC)
• When translated into the average monthly cost for residential customers, 2012 surcharges averaged $2/month
o Less than $0.50/month for several utilities and $3-4.50/month for a number of others
State Utility 2012 Surcharge
($/customer-mo.)
AZ
Arizona Public Service $3.84 Tucson Electric Power $3.15 UNSE/Citizens $4.50
CO Public Service Colorado (Xcel) $1.44 Black Hills Energy $2.04
DE Delmarva Power & Light $4.29
MI
Detroit Edison Co. $3.00 Consumers Energy Inc. $0.52 Indiana Michigan $0.07 Wisconsin Electric Co. $3.00 Alpena Power $0.24
NC Progress $0.56 Duke $0.49
NY
Central Hudson $2.02 Consolidated Edison $1.07 Orange and Rockland $1.86 New York State Electric & Gas $1.64 Niagara Mohawk $1.92 Rochester Gas & Electric $1.85
OH
Cleveland Electric Illuminating $3.25 Dayton Power & Light $0.59 Ohio Edison $2.49 Toledo Edison $3.02
RI Narragansett Electric $1.08
Average RPS Surcharges for Residential Customers in 2012

20 and LAWRENCE BERKELEY NATIONAL LABORATORY
Impact of Rising RPS Targets on RPS Costs
• RPS targets or procurement levels averaged roughly 7% of retail sales, for the most recent year with historical cost data (the open circles in the figure)
• The scheduled final-year RPS targets constitute, on average, roughly a three-fold increase in RPS obligations (the closed circles)
• Whether and the extent to which RPS costs rise in tandem depends on many factors: renewable energy technology costs, natural gas prices, federal tax incentives, environmental regulations, and RPS cost containment mechanisms
The figure shows RPS
costs for the most-recent year along with recent
and final RPS targets
-20%
-10%
0%
10%
20%
30%
40%
-4%
-2%
0%
2%
4%
6%
8%
CT
DC
DE IL
MA
MD
ME
NH
NJ
NY
OH
PA RI
TX
AZ
CA
CO MI
MN
MO
NC
NM
OR
WA
WI
Restructured Regulated
RPS Incremental Costs (Most-Recent Year)RPS Target (Most-Recent Year)RPS Target (Final Year)
RP
S C
os
t (%
of
Ave
rag
e R
eta
il R
ate
s)
RP
S T
arg
et
(% o
f R
eta
il S
ale
s)
* For most states shown, the most-recent year RPS cost and target data are for 2012; exceptions are CA (2011), MN (2010), and WI (2010). MA does not have single terminal year for its RPS; the final-year target shown is based on 2020. For CA, high and low cost estimates are shown, reflecting the alternate methodologies employed by the CPUC and utilities. Excluded from the chart arethose states without available data on historical incremental RPS costs (KS, HI, IA, MT, NV). The values shown for RPS targets exclude any secondary RPS tiers (e.g., for pre-existing resources). For most regulated states, RPS targets shown for the most-recent historical year represent actual RPS procurement percentages in those years, but for MO and OR represent REC retirements (for consistency with the cost data).

21 and LAWRENCE BERKELEY NATIONAL LABORATORY
Impact of Cost Containment Mechanisms
• Among states relying primarily on an ACP, costs generally capped at 6-9% of average retail rates (MA and NJ the exceptions)
o Upward pressure on REC prices and fixed/declining ACPs could constrain achievement of RPS targets and push costs towards the caps
• Among states with some other form of cost containment, effective cost caps are more restrictive, typically 1-4% of average retail rates
o Caps have already become binding in several states, and near-term potential exists in many others
The figure compares each
state’s effective cost
cap with actual costs for the most-recent
year
0%
5%
10%
15%
20%
CT
DC
MA
MD
ME
NH
NJ
RI
CO
DE IL MI
MT
NM
NC
NY
OH
OR
TX
WA
Cost Containment Based on ACP Other Cost Containment Mechanisms
Historical Compliance Costs (Most-Recent Year)
Effective Cost Cap (Max Retail Rate Increase)
* For states with multiple cost containment mechanisms, the cap shown here is based on the most-binding mechanism. MA does not have a single terminal year for its RPS; the calculated cost cap shown is based on RPS targets and ACP rates for 2020. "Other cost containment mechanisms" include: rate impact/revenue requirement caps (DE, KS, IL, NM, OH, OR, WA), surcharge caps (CO, MI, NC), renewable energy contract price cap (MT), renewable energy fund cap (NY), and financial penalty (TX). Excluded from the chart are those states currently without any mechanism to cap total incremental RPS costs (AZ, CA, IA, HI, KS, MN, MO, NV, PA, WI),though some of those states may have other kinds of mechanisms or regulatory processes to limit RPS costs.
RPS Cost Containment Mechansims*(Equivalent Maximum Percentage Increase in Average Retail Rates)

RPS Benefits Estimates

23 and LAWRENCE BERKELEY NATIONAL LABORATORY
RPS Benefits Overview
• Potential societal benefits of RPS policies include: o Reduced air emissions, health benefits, fuel diversity, electricity
price stability, energy security, and economic development. o Avoided costs of conventional generation included in cost
estimates.
• We reviewed literature on benefits estimates conducted for state RPS policies. o We did not include broader renewable energy benefits
literature. o Most studies examined were prepared for state legislatures.
• A variety of methods were used to assess impacts; the level of analytical rigor varies as well.

24 and LAWRENCE BERKELEY NATIONAL LABORATORY
Range of Benefits Studies Identified
State Emissions
and Health
Economic
Development
Impacts
Wholesale
Market
Impacts
Study
required?
Study
CT
a As part of
IRP
The Brattle
Group et al. 2010
a CEEEP and
R/ECON 2011
DE a As part of
IRP
DPL 2012
IL a a a a IPA 2013
ME a a a a LEI 2012
MA a a EOHED and
EOEEA 2011
MI a a a MPSC 2013
NY a a a a NYSERDA 2013b;
2013c
OH
a a PUCO 2013a
a a PUCO 2013b
OR a a ODOE 2011
25 and LAWRENCE BERKELEY NATIONAL LABORATORY
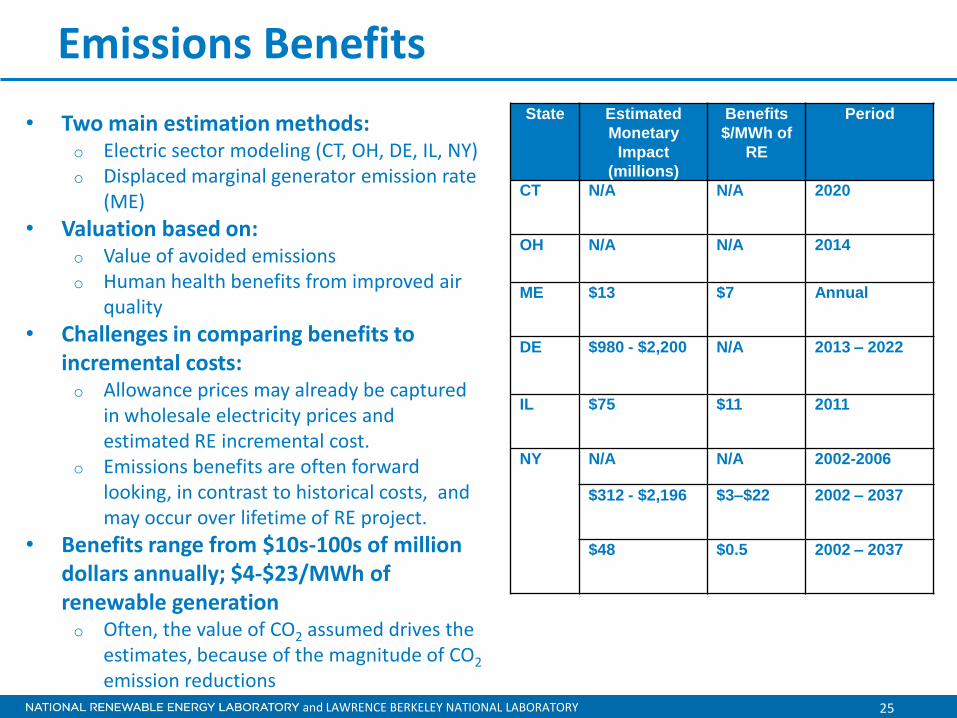
Emissions Benefits
• Two main estimation methods: o Electric sector modeling (CT, OH, DE, IL, NY) o Displaced marginal generator emission rate
(ME)
• Valuation based on: o Value of avoided emissions o Human health benefits from improved air
quality
• Challenges in comparing benefits to incremental costs: o Allowance prices may already be captured
in wholesale electricity prices and estimated RE incremental cost.
o Emissions benefits are often forward looking, in contrast to historical costs, and may occur over lifetime of RE project.
• Benefits range from $10s-100s of million dollars annually; $4-$23/MWh of renewable generation o Often, the value of CO2 assumed drives the
estimates, because of the magnitude of CO2
emission reductions
State Estimated
Monetary
Impact
(millions)
Benefits
$/MWh of
RE
Period
CT N/A N/A
2020
OH N/A N/A 2014
ME $13 $7 Annual
DE $980 - $2,200 N/A 2013 – 2022
IL $75 $11 2011
NY
N/A N/A 2002-2006
$312 - $2,196 $3–$22 2002 – 2037
$48 $0.5 2002 – 2037

26 and LAWRENCE BERKELEY NATIONAL LABORATORY
Economic Development Impacts
State Estimated
Monetary
Impact
(million)
Benefit
$/MWh of
RE
Period
CT Negative to
positive
GSP impact
N/A Through 2020
IL $5,980 $27 25-year lifespan
ME $1,140 $4 Construction
$7.3 $0.6 Annual, during
project lifespan
MI $159.8 N/A Construction
NY $1,252 $13 Project lifespan
$921 $9 Project lifespan
OR Not
estimated
N/A Project lifespan
• Economic impacts of RPS include: o Jobs, direct investment from construction
and operation of facilities, tax revenues, and indirect and induced spending
o Changes in electricity prices can have economic impacts
• Approaches to assessing economic impacts: o Input-output models or case studies (IL,
ME, MI, OR) o Economic modeling (CT, NY)
• Net or gross impacts is a key issue o Net impacts consider shifts in
employment o Typically assessed over project lifetime
• One-time construction benefits on order of $100s of millions; annual ongoing benefits over project lifetime in $10s to $100s millions
• Benefit equivalent to $5-$27/MWh of renewable generation

27 and LAWRENCE BERKELEY NATIONAL LABORATORY
Wholesale Market Price Suppression
State Estimated Monetary
Impact
Benefit
$/MWh
of RE
Period
ME $4.5 million
($0.375/MWh reduction
in wholesale prices)
$2 2010
MA $328 million ~$50 2012
IL $177 million
($1.3/MWh reduction
in wholesale prices)
$26
2011
MI 2% decline in
wholesale prices from
wind, net imports, and
decrease in load.
N/A 2011
NY $455 million $5 Project
lifespan
OH ($0.05-0.17/MWh
reduction in wholesale
prices)
N/A 2014
• Renewable energy can depress wholesale market prices by displacing more expensive generators from the dispatch stack
• Typically assessed through dispatch modeling
o Scenarios with and without RE
• Effect may be temporary
• Effects may be captured in incremental cost estimates
o Embedded in wholesale prices
• Market price suppression $0.05-1.3/MWh (total market effect)
• Benefit equivalent to $2-$50/MWh of renewable generation

28 and LAWRENCE BERKELEY NATIONAL LABORATORY
Benefits Summary
• Limited number of studies identified that examine RPS benefits
• Estimates more limited than for RPS costs, more difficult to bound range
• Methods and rigor of analysis vary widely • Difficult to compare to costs because:
o Some benefits may be captured in incremental costs o Analysis timeframes may differ o Only particular types of benefits may be assessed o Certain benefits (e.g., avoided emissions) may accrue for
the lifetime of the renewable plant, while costs are incurred over a shorter period

Conclusions

30 and LAWRENCE BERKELEY NATIONAL LABORATORY
Conclusions and Future Work
• Comparisons of incremental RPS cost data across states are limited by different methods employed; cost estimates rely on available data.
• Using the last available year of compliance data, estimated incremental RPS compliance costs are equivalent to less than 2% of retail rates in 17 states. o 10 of these states have estimated costs equivalent to less than 1% of retail
rates; the remaining 8 states have estimated costs equivalent to 2% to 4% of retail rates, averaging the two estimates for California.
• Benefits estimates are more limited, and methods and analytical rigor vary considerably.
• Comparison of benefits to costs is challenging because of differences in the timeframe of analysis, the limited benefits analyzed, and because incremental costs may be capturing some benefits.
• Future work could be done to comprehensively assess costs and benefits, using similar methodologies and level of rigor.
• Ongoing RPS cost assessment and standardization efforts in some states might also be useful to other states.

31 and LAWRENCE BERKELEY NATIONAL LABORATORY
Contact Information
Jenny Heeter [email protected] (303) 275-4366 Galen Barbose [email protected] (510) 984-3453