Embed Size (px)
Citation preview
1
Estimating the Effects of No Child Left Behind on Teachers and Their Work Environments
Jason A. Grissom1
Sean Nicholson‐Crotty2 James R. Harrington3
***
Several recent studies have examined the impacts of No Child Left Behind (NCLB) on school operations and student achievement. This paper complements that work by investigating the law’s impacts on teachers’ feelings about their jobs and work environments. Using the four most recent waves of the nationally representative Schools and Staffing Survey, which covers the period from 1994 to 2008, we take advantage of differences in the presence and strength of prior state accountability systems to isolate NCLB effects. We find evidence of positive impacts of NCLB on some attitudinal measures (e.g., feelings of job autonomy) but negative impacts on others, including job satisfaction and intent to remain in the profession. We observe, however, that those negative effects are small in the face of substantial overall increases in satisfaction and job commitment over the time period we study.
***
Ten years into the implementation of No Child Left Behind (NCLB), a growing body of
research seeks to assess the law’s impact on American public schools. Much of this work rightly
focuses on effects on students, with evidence suggesting that NCLB has resulted in small but
positive effects on student achievement, particularly in math (e.g., Ballou & Springer, 2011; Dee
& Jacob, 2011). Though research into the mediating factors driving this achievement growth is
nascent, it is unlikely that NCLB could affect student learning without affecting the learning
environment, including instruction. The logic of accountability underlying the law suggests as
much: providing measures of student outcomes pegged to established standards and enacting
consequences for poor performance should give schools incentives to find ways to improve,
including changing teachers’ approaches to teaching (Manna, 2011). Indeed, studies find that 1 Peabody College, Vanderbilt University. Email: [email protected]. 2 Department of Political Science and Harry S Truman School of Public Affairs, University of Missouri. Email: [email protected]. 3 Harry S Truman School of Public Affairs, University of Missouri. Email: [email protected].

2
NCLB has led teachers to devote more classroom time to core subjects, to spend more time
searching for better instructional strategies, and, perhaps less productively, to “teach to the test”
(Dee & Jacob, 2010; Reback, Rockoff, & Schwartz, 2011).
Of course, change comes with difficulty, and inducing enough change in the instructional
environment to impact student learning seems likely to have had effects on teachers, both
intended and unintended. For example, stronger accountability likely had the intended
consequence of increasing teachers’ feelings of performance pressure. If this pressure increased
too much or became too prolonged, however, it may also have had the unintended consequence
of increasing teacher stress or feelings of burnout, particularly if teachers see the tests as
inadequate or the goals as unattainable (see Hill & Barth, 2004). As another example,
accountability may focus teachers on some material over others or on specific students, but if this
external emphasis runs counter to their own professional judgment, they may experience internal
conflict, frustration, and, eventually, emotional exhaustion (Berryhill, Linney, & Fromewick,
2009). These stresses are in addition to those that may accompany working in a school labeled
(or perhaps soon to be labeled) as “failing” or subject to sanctions, which teachers can find
demoralizing (Santoro, 2011).
Anecdotal evidence suggests that these kinds of negative effects of NCLB on teachers are
legitimate concerns. For instance, in a USA Today feature on “five big ways [NCLB] is changing
schools,” Toppo (2007) says the law is “driving teachers crazy,” quoting teachers who use words
like frustration, embittered, and joyless. An Associated Press story about the first 10 years of
NCLB described teacher morale withering under the law as they felt they were being “judged on
3
factors out of their control and in ways that were unfair” (Hefling, 2012).4 Reports from
teachers’ unions echo similar concerns, suggesting that NCLB is “accelerating teacher burnout,
and, consequently, teacher turnover” (Gerson, 2007). Surveys of teachers typically confirm these
conclusions, finding unfavorable views of NCLB among teachers and concern from teachers
about the impact of the law on teachers (Center on Education Policy, 2006; Deniston & Gerrity,
2010; Sunderman et al., 2004), including concern that the testing required to fulfill the
accountability requirements of NCLB are burning teachers out and driving good teachers out of
the profession (Cavanagh, 2012; Teachers Network, 2007).
How significant has the impact of NCLB been on teachers, particularly on their attitudes
about their jobs and their assessments of their working conditions? Because most evidence in this
area has been limited to small or non-representative samples, the answer is unclear. Yet
understanding the impact of NCLB on teachers is keenly important, not only because teachers
are a main stakeholder group in education policy but because teacher attitudes have been linked
to policy-relevant outcomes, such as teacher turnover (Grissom, 2011; Ladd, 2011; Loeb,
Darling-Hammond, & Luczak, 2005).
Our examination of the impacts of NCLB on teachers is grounded in a prominent model
of job stress from the private sector, adapted to the case of teachers, which we argue can be used
to derive hypotheses about the effects of accountability reform. Specifically, we adapt the
Demand, Control, Support (DCS) model (Krasek & Theorell, 1990), which has recently been
applied to attitudes in the public sector (Noblett & Rodwell, 2009), to include compensation and
job security, which have been shown to be important predictors of teacher attitudes (see for
example Dinham & Scott, 2000). Notwithstanding the conventional wisdom that NCLB has
4 Commentary in popular education outlets similarly links NCLB to declining morale. For example, a February 2012 Education Week blog post noted that “the neoliberal policies of hyper accountability” enshrined in NCLB have “led to an increase of…burnout” (Cody, 2012).

4
negatively impacted teachers’ work attitudes, applying the DCS model to the NCLB case
predicts both positive and negative effects on the antecedents of job satisfaction and thus an
unclear effect on job satisfaction itself.
To test the model’s predictions, we utilize a nationally representative sample of more
than 150,000 teachers from multiple waves of the National Center for Education Statistics’
Schools and Staffing Survey. The use of large-scale data on teacher attitudes over time, including
pre- and post-NCLB, provides a vast improvement to most existing studies of NCLB effects on
teachers, which have relied on small samples and retrospective designs that have asked teachers
whether their morale or satisfaction has declined since NCLB, potentially subjecting them to
recall bias (e.g., Byrd-Blake et al., 2010). In contrast, our estimation strategy takes advantage of
the fact that some states had accountability systems of differing strength in place prior to the
implementation of NCLB to arrive at arguably causal estimates of the impact of that
implementation on teacher attitudes (Dee & Jacob, 2011).
Students and Teachers under Accountability Reforms
Not surprisingly, there has been considerable interest in the impact of both state- and
national-level accountability reforms in education. Studies focusing on the former have focused
primarily on student achievement (e,g., Hanushek & Raymond, 2005) and on organizational
behaviors, such as resource reallocation (e.g., Booher-Jennings, 2005; Reback, 2008), teaching to
the test (e.g., Pedulla et al., 2003; Hannaway & Hamilton, 2008), and outright cheating (Jacob &
Levitt, 2003), designed to improve performance on state exams. Studies of NCLB have focused
primarily on the impact of the reform on test scores (Ballou & Springer, 2011; Neal &
5
Schanzenbach, 2010) and on organizational responses by districts and schools (CEP, 2006;
Rouse et al., 2007; Dee & Jacob, 2011).
A limited number of studies have examined the impact of NCLB—or the state
accountability reforms that predated NCLB—on teacher attitudes, such as anxiety, job security,
and satisfaction. The results have been mixed but generally suggest a negative relationship
between accountability and teacher attitudes. For example, Haladyna et al. (1998) find that
accountability regimes produce tension and anxiety in teachers who feel that they are being
evaluated by standardized tests. Similarly, Mulvenson et al. (2005) suggest that teachers
mandated to use standardized assessments had higher levels of anxiety that those who were not
required to test and that the level of teacher anxiety correlated negatively with student
performance. Reback, Rockoff, and Schwartz (2011) find lower reported levels of job security in
schools that were close their state’s performance threshold and, thus, in the greatest danger of
failing to make AYP. They also found that teachers of high-stakes subjects in schools near
proficiency cutoffs worked longer hours than similar teachers in schools not under accountability
pressures. A Center on Education Policy report (2006) concluded that NCLB has increased
pressure on teachers while negatively affecting staff morale. Byrd-Blake et al. (2010) report that
teachers say retrospectively that their morale has declined in the years since NCLB was signed
and that they feel frustrated by a test-driven instructional culture. Dee and Jacob (2010) report
negative impacts of NCLB on teachers’ perceptions of overall school culture, as captured by
perceptions of student apathy, absenteeism, and other measures.
Reports of impacts of NCLB on teacher perceptions or attitudes have not been uniformly
negative, however. Hamilton et al. (2007) find that teachers felt an increased sense of autonomy
and that their schools had generally “changed for the better” under NCLB. Dee and Jacob (2010)
6
report that NCLB had a positive impact on teachers’ perceptions of student engagement.
Teachers in the Byrd-Blake et al. (2010) study identified positive changes to the instructional
climate in recent years, including “more engaged learning” and “more student involvement”
(461).
A Framework for Understanding the Impact of NCLB on Teachers
Existing literature suggests that NCLB and prior accountability reforms have had some
impact on teacher attitudes. The number of analyses, however, has been limited. More
importantly, the choice of teacher variables to examine has been largely unguided by theory.
This section draws on and expands a theoretical model from the private sector management
literature in order to provide a framework for the examination of NCLB’s impact on teacher
attitudes. We focus on two: job satisfaction and commitment to remain in the profession.
There exists a relatively well-developed line of inquiry in the private management and
occupational health literatures regarding the impact of performance-oriented reforms on the
attitudes of employees. Among the most commonly applied of these has been the Demand-
Control-Support, or Job Strain, model (Karasek, 1979; Karasek & Theorell, 1990). The model
hypothesizes that performance reforms will have a primary influence on three employee
perceptions: the demands placed on an individual by her job, the level of decision-making
authority that she feels she has, and the support that she receives from supervisors and coworkers
(see van der Doef & Maes, 1999, for a review). Ultimately, the model predicts that the impact of
reforms on employee stress or satisfaction is a product of the interaction of these perceptions.
When performance reforms create job demands that exceed the control and support necessary to
meet those demands, the model predicts high job stress and lower employee satisfaction and

7
commitment. The approach has received widespread support in research on private organizations
and is among the most commonly used theoretical approaches in occupational stress research
(Fox et al., 1993).
The predictors of satisfaction outlined in the DCS approach accord well with previous
work on teacher satisfaction. Studies in that literature have examined antecedents of satisfaction
that are likely to be impacted by performance and accountability reforms like NCLB. For
example, studies have demonstrated a consistent relationship between job stress, including long
hours, and satisfaction (Butt et al., 2005). Scholars have also shown that professional autonomy,
often measured as control in the classroom, predicts satisfaction among teachers (Shann, 1998;
Bogler, 2001). Finally, research has also found support from supervisors and colleagues to be a
strong correlate of satisfaction (Bloland & Selby, 1980).
Given these linkages, the DCS approach provides an intuitive framework for considering
the mechanisms by which accountability reforms like NCLB might influence satisfaction. Before
moving on, however, it is worth pointing out that several factors falling outside the DCS
framework clearly might both be affected by NCLB and impact teacher satisfaction and
commitment. Satisfaction and commitment research suggest that two are especially important.
The first is compensation. Salary has been a perennial predictor of satisfaction among teachers
(e.g., Dinham & Scott, 2000). It also predicts intended and observed teacher turnover (Imazeki,
2004; Ladd, 2011; Hanushek, Kain, and Rivkin, 2004). Because NCLB increased aid to school
districts, teacher pay may have increased in turn; some evidence suggests this was the case (Dee
& Jacob, 2010). The second is job security. A long line of research suggests that, all else being
equal, those who choose to work for government are more risk adverse than those who select
private firms (see for example Bellante and Link 1981; Houston 2000). Research on public
8
organizations confirms that reduced jobs security is, in part, responsible for the increase in job
stress among public sector employees following the widespread adoption of accountability and
performance reforms (Van Wart & Berman, 1999). These findings from the study of public
organizations more generally accord well with research suggesting that perceived job security is
an important factor influencing the decision to undertake a teaching career (Young, Worchel, &
Woehr, 1998).
Using the adapted model outlined above as a framework, the remainder of this paper
examines the impact of NCLB on perceptions among teachers of job demands, control, support,
compensation, and security. Specifically we examine:
• Whether the amount of effort expended by teachers went up or down after NCLB implementation. Research both in schools (Reback, Rockoff, & Schwartz, 2011) and in other public organizations (Korunga et al., 2003) suggests that accountability reforms can have this effect.
• Whether teachers’ perceived level of discretion in the classroom changed as a result of the reform. The broader performance reform literature suggests that autonomy and control might move in either direction (see Osborne & Gaebler, 1992; Brodkin, 2011), though research specifically focused in education finds that teachers reported a greater sense of autonomy in the classroom post-NCLB (Hamliton et al., 2007).
• Whether the pressure of performance targets eroded perceived relationships between teachers and principals or among fellow teachers, who now may view peers as competitors. Alternatively, it is possible that accountability reforms bonded school personnel more tightly together. Evidence from the broader literature in public performance reforms suggests that both outcomes are possible (Kellman, 2006; Brockner et al., 2004)
• Whether teacher pay changed after the implementation of NCLB, as some have suggested it should or did (Figlio, 1997; Hanushek & Woessmann, 2011).
• Whether the threat of dismissal or reorganization was sufficient to decrease perceived job security, as Reback, Rockoff, and Schwartz (2011) suggest is the case in some schools.
As the DCS framework suggests, the direction of these relationships—or more
specifically, the consistency of that direction—should help to predict the impact of NCLB on
teacher satisfaction and job commitment. If the reform is consistently associated with negative
9
outcomes for teachers (i.e., longer hours, less control, and so forth), then we would expect that it
ultimately diminished job satisfaction and decreased commitment. Alternatively, if the effect of
the NCLB on the antecedents of satisfaction were consistently positive (e.g., higher levels of
colleague support, more pay) then we would expect overall satisfaction and commitment to have
increased after the implementation of the reform. If, however, NCLB had a mixed impact on the
factors described above, then the impact on satisfaction is more difficult to predict. As a final set
of tests, we examine:
• Whether the reform had an observable impact on the more generalized construct of job satisfaction;
• And, finally, whether the reform influenced the related construct of intent to leave, which a large body of management research has linked closely to satisfaction with one’s employment (see Tett and Meyer 1993 for a meta-analytic review).
Data and Methods
For this study, we built a cross-sectional time series of data on teachers and schools
spanning four waves of the Schools and Staffing Survey (SASS). SASS is a nationally
representative survey of public school personnel collected approximately every four years. The
four waves we utilize were collected during the 1993-94, 1999-2000, 2003-04, and 2007-08
academic years, which means that we have data on two time points prior to the date that No
Child Left Behind took effect and two time points afterward. Throughout the remainder of the
paper we will refer to the survey years by the second year in the survey wave (i.e., 1993-94 will
be “1994”).
In selected SASS schools, survey data are collected from multiple randomly selected
teachers on such topics as school organization, professional development, and perceptions of the
school climate. Demographic, experience, and educational background data also are collected.

10
Unique respondent identifiers make teacher responses linkable to the schools in which they
work. Pooling the data across years, we utilize data on approximately 150,000 teachers. Survey
weights are used in all analysis to account for the complex sampling strategy SASS employs.
Dependent Variables
Drawing on the modified DCS framework, we aim to examine the impact of No Child
Left Behind on demand, control, job support, and job security, plus the related outcomes of
salary, job satisfaction, and job commitment, the last of which we consider in its reverse form,
intention to leave teaching. We measure each at the teacher level using items from the SASS
teacher questionnaires. Our measure of demand is total weekly hours worked, measured as a
teacher’s estimate of how many hours he or she works on all teaching-related duties during a
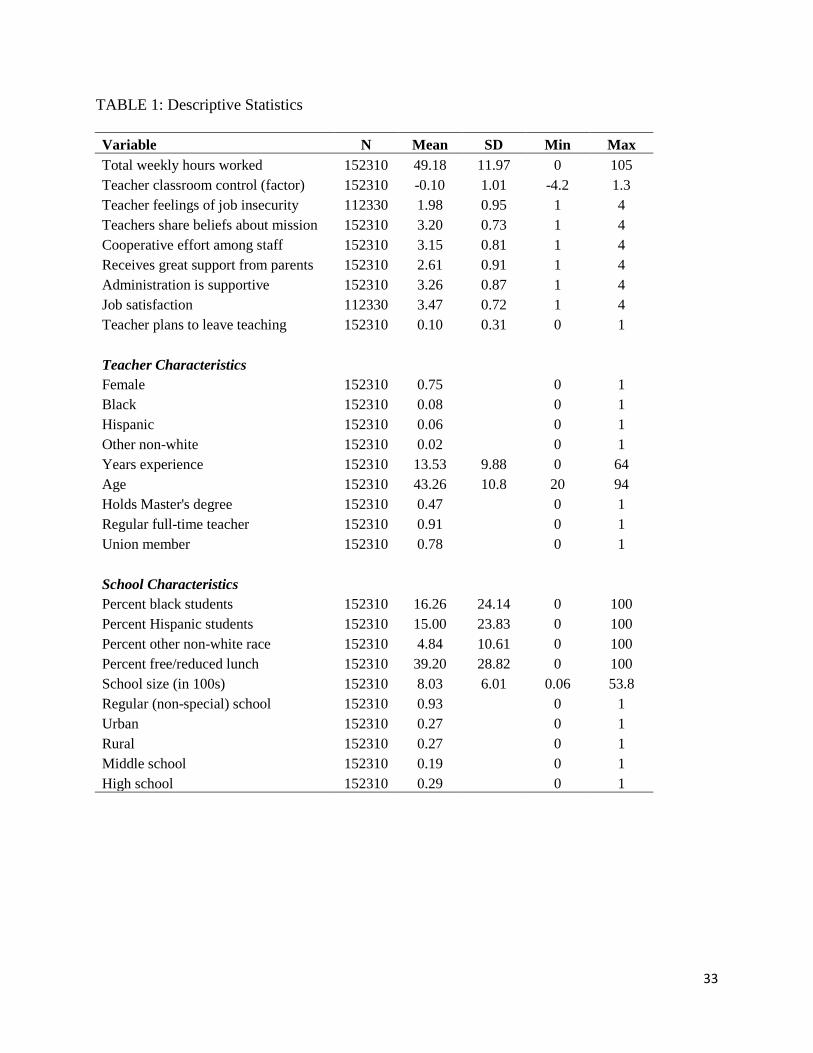
typical week.5 As shown in Table 1, which provides descriptive statistics for the study’s
variables, the mean across years is approximately 49 hours per week.
To capture control, we make use of six items asked in each SASS wave that ask teachers
how much control they feel they exercise in their own classrooms over: selecting textbooks and
materials; selecting content, topics and skills to be taught; selecting teaching techniques;
evaluating students; disciplining students; and determining the amount of homework to be
assigned. The scale for each item ranges from “No control” to “Complete control,”6 though the
number of points in the scale varies across years. To equate the scales, we converted each one to
a three-point scale for no control, some control, and complete control. Polychoric factor analysis
5 The questions concerning this variable vary somewhat across SASS waves. In 1994 and 2000, we created this total from a composite of three questions which asked respondents how many hours they were required to work each week during school hours, how many hours they spend on student interactions outside of school, and how much other time they spent. In 2004 and 2008, they were simply asked to estimate their total hours worked in a typical week. We cannot rule out the possibility that differences in answers between the two sets of years are not due in part to differences in question wording. 6 In 2004 and 2008, the range was “No control” to “A great deal of control.”
11
on the converted items revealed one underlying control factor (Eigenvalue = 3.7), which
Cronbach’s α suggested to have a high degree of reliability (α = 0.78). Factor scores were used
to assign a single control measure to each teacher and then standardized across observations to
facilitate interpretation.
Job support is captured using four items, the first two of which measure peer support:
“Most of my colleagues share my beliefs and values about what the central mission of the school
should be,” and “There is a great deal of cooperative effort among staff members.” Teachers
were asked to respond to each of these statements using a 4-point Likert scale (strongly disagree,
somewhat disagree, somewhat agree, strongly disagree) each year. Factor testing revealed that
these two measures could not be reasonably combined into one scale,7 so we chose to model
each variable separately. We also examine measures of how much support teachers feel they
receive from their principal and from parents. The measure of principal support is the Likert
response to the item, “The school administration’s behavior toward the staff is supportive and
encouraging.” The parent measure is the Likert response to the item, “I receive a great deal of
support from parents for the work I do.”
Our measure of job security comes from teachers’ Likert scale responses to the item: “I
worry about the security of my job because of the performance of my students on state or local
tests.” This item was not included on the 1994 survey. A higher value of this variable indicates
greater feelings of job insecurity.
We measure job satisfaction with the Likert response to: “I am generally satisfied with
being a teacher at this school.” Teachers are quite satisfied in general, averaging 3.47 of 4 points
across years.
7 Kaiser-Meyer-Olkin Measure of Sampling Adequacy = 0.65. Eigenvalue = 0.79.
12
Finally, we measure turnover intention using teachers’ responses to the questionnaire
item: “How long do you plan to remain in teaching?” Unfortunately, the response items for this
question, which remain consistent over the 1994, 2000, and 2004 waves of SASS, changed in
2008, though the changes were primarily to add specificity to the response “Until I am eligible
for retirement.”8 To measure intent to turnover, we created a dichotomous variable that was
equal to 1 if the person responded “Definitely plan to leave as soon as I can” or that they will
stay “until something better comes along,” which were both response items in all four waves.
The variable was coded as 0 for any other response, which included the aforementioned until
retirement, plus plan to stay as long as able and undecided. About 10% of the pooled sample
was coded as intending to leave by this definition.9
Independent Variables
Our primary interest is the impact of No Child Left Behind. We operationalize an
indicator variable for NCLB that is set equal to 0 prior to the law’s implementation and 1
afterward. Given that the first academic year that the law went into effect was 2002-03, we count
the 2004 and 2008 SASS years as being subject to NCLB and the prior years as not.
As an additional step toward identifying the causal impact of NCLB, we also utilize
information in prior accountability systems in the states. Specifically, we identify the states that
had implemented consequentialist accountability systems prior to NCLB. We code this binary
variable using information contained in Hanushek and Raymond (2005) and Dee and Jacob
8 In 2008, this response item was broken into “from this job” and “from a previous job,” and an additional item was added for “Until I am eligible for Social Security benefits.” An additional item, “Until a specific life event occurs (e.g., parenthood, marriage),” which was not included in earlier waves, was also added. 9 About 3% indicated that they planned to leave as soon as possible. The results presented later are the same if we define the “intend to leave” group to be these teachers only.

13
(2011).10 In additional tests, we also incorporate information on the strength of prior state
accountability systems using the Carnoy and Loeb (2002) index, which captures the strength of
state accountability systems as of 2000 on a scale of 0 (low accountability) to 5 (high
accountability).
Control Variables
Our models also include a number of control variables obtained from the SASS data that
are likely to be correlated with the outcome variables. At the teacher level, these included
indicators for being female, black, Hispanic, and other nonwhite race, plus total teaching
experience. We also included an indicator for holding a Master’s degree and for being a regular
full-time teacher. At the school level, we included the percentage of students who were black,
Hispanic, and other nonwhite race, and the percentage of students receiving free or reduced price
lunch, a measure of student poverty. We also included school enrollment and enrollment
squared, plus indicators for being a regular (non-specialized) school, urban and rural location
(suburban omitted), and school level (middle or high, with elementary omitted).
Regression Models
We run a series of four models for each dependent variable. The most basic model takes
the following form:
𝑌𝑖,𝑗,𝑡 = 𝛼 + 𝛽1𝑁𝐶𝐿𝐵𝑡 + 𝜃𝑇𝑖,𝑗,𝑡 + 𝛿𝑆𝑗,𝑡 + 𝛾 + 𝜏𝑡 + 𝜀𝑖,𝑗,𝑡 (1)
Equation (1) shows that outcome Y for teacher i in school j at time t is a function of being subject
to NCLB or not, plus covariates. In this model, β1 captures any difference in the level of Y
10 In some cases, Dee and Jacob’s (2011) rendering of the year in which a state had implemented consequentialist accountability differed from Hanushek and Raymond’s (2005). In these cases, we followed Dee and Jacob’s coding.
14
associated with the two time periods following the passage of NCLB. The vectors T and S
include control variables at the teacher and school level, respectively. 𝛾 represents a state fixed
effect. 𝜏 is a linear time trend, defined from the year 1990 (before any state had implemented
accountability reform) forward.
In this basic model, 𝛽1 will capture the mean shift in the outcome variable, controlling for
other factors, between the pre-NCLB and post-NCLB years. However, this coefficient will
capture not only the effect of NCLB but also the effects of other unobserved changes that
occurred in education across these same time periods. Fortunately, Dee and Jacob (2010) outline
a comparative interrupted time series method that can provide additional evidence on the causal
impact of NCLB. This method relies on the assumption that the effects of NCLB will be stronger
in states that did not have pre-existing consequentialist school accountability systems when
NCLB was implemented. For example, NCLB conceivably had a greater impact on teachers’
feelings of job security in Idaho, which did not link consequences to student performance prior to
NCLB, than in Texas or North Carolina, both of which put strong accountability systems in place
during the mid-1990s.
We run two sets of models based on this idea. The first of these follows Dee and Jacob
(2011) and adds the interaction between NCLB and No prior accountability to each model,
where no prior accountability is set equal to 1 for any state who had not implemented a
consequentialist accountability system prior to 2002. A significant coefficient on this interaction
term can be viewed as additional evidence of a causal impact of NCLB on the outcome variable
of interest.11 The second incorporates the idea that prior state accountability systems were of
different strength, interacting NCLB with the Carnoy and Loeb (2002) state accountability
11 Note that the “main effect” of No prior accountability falls out of the models because it is subsumed by the state fixed effect.
15
strength index. In this case, a significant interaction in the opposite direction as the NCLB
variable suggests that the observed impact for the reform was larger in states with weaker prior
accountability systems and provides additional evidence of causal impact. Because the Carnoy
and Loeb (2002) measure assesses state accountability strength only as of 2000, we drop the
1994 observations from the models that use the index, using 2000 as the only pre-NCLB time
point.
The validity of the claim that the interaction between NCLB and either no prior
accountability or the accountability strength variable helps identify the causal impact of NCLB
rests on the assumption that the prior/strong accountability states constitute a good “control”
group for those receiving the full force of the treatment of NCLB (i.e., the no or weak prior
accountability states). This assumption will be violated if, for example, having a strong prior
system somehow intensified the impact of NCLB, in which case the interaction strategy will
understate the true effect of the law on teachers. Perhaps more of a concern, it could be that other
aspects of NCLB aside from the accountability pressure it applies—e.g., the highly qualified
teacher (HQT) provision—have important impacts on teacher attitudes. Aspects of the law not
characteristic of prior accountability plans will not be accounted for using this strategy. The
impacts of such aspects will contribute to the coefficient on the NCLB term but cannot be
separated from other influences coincident with the law’s implementation.
Main Results
Demand, Control, and Support
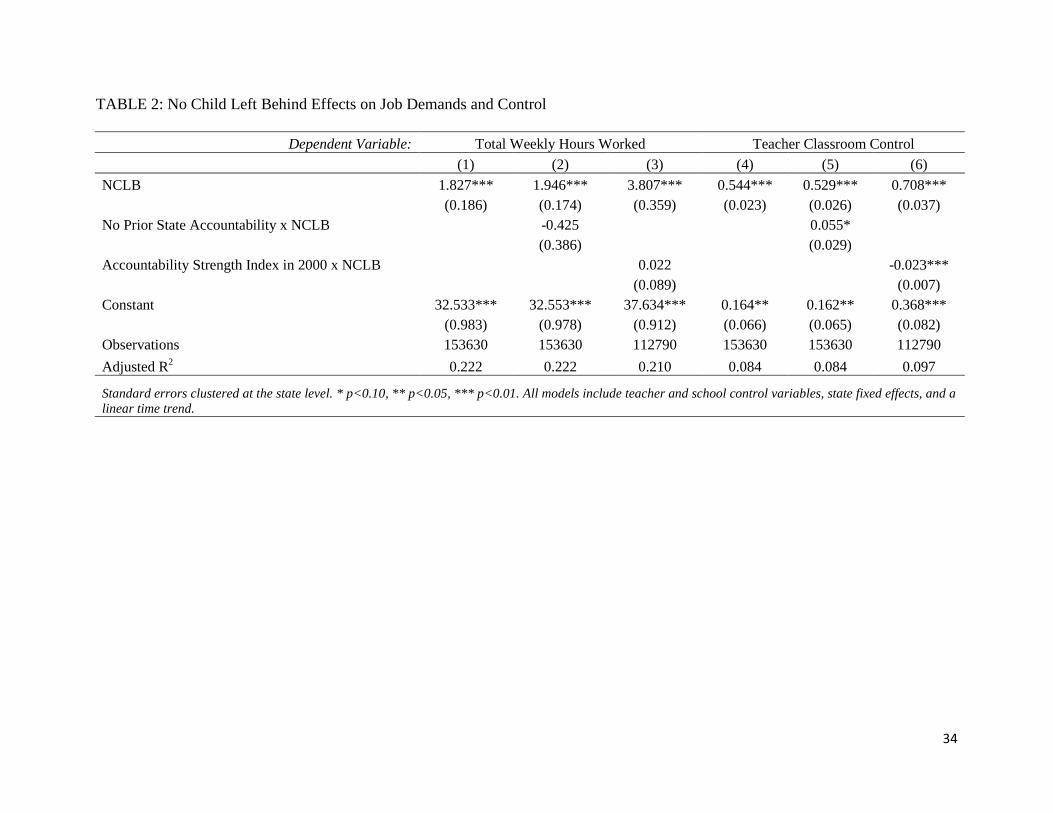
The first 3 columns of Table 2 present the results from the model of the impact of No
Child Left Behind on hours worked, which is our measure of task demands. For brevity, this and
16
subsequent tables show only the primary coefficients of interest, which are the coefficients on
NCLB, its interaction with no prior accountability, and its interaction with the strength of the
prior accountability system, though the extensive set of control variables described previously
are included in every model.
Though not shown, the time trend in all three models is positive and significant,
suggesting an increase in time worked per week in teaching of about 30 minutes each year, on
average, over the time period of the data. Even controlling for that trend, we observe that
teachers worked more hours following the implementation of NCLB. According to column 1, on
average, teachers worked almost 2 hours more each week after the implementation of the reform
in 2002-2003. The results in columns 2 and 3, however, are not consistent with the expectation
that NCLB increased hours worked more in states with weak or non-existent prior accountability
systems. The coefficients on the interaction between NCLB and no prior accountability (column
2) and accountability strength (column 3) are not statistically significant in either case. NCLB
may have increased teachers’ total hours worked, but if so, these increases affected teachers
similarly regardless of prior accountability status. Following the logic that NCLB should have
had stronger effects in states where it was introducing strong accountability, we do not find
strong evidence of a particular effect of the policy on work hours.
The remaining three columns of Table 2 contain the models of teachers’ perceived
control over their jobs. The set-up is the same as for hours worked. In this case, the time trend is
negative and significant, suggesting that teachers have generally felt a loss of control over the
last 15 years, though the implementation of NCLB corresponds to a positive shift (of about half a
standard deviation in column 4) with perceived control. Moreover, the interaction between
NCLB and no prior accountability is significant and positive, indicating that the federal law
17
increased perceived control to a greater degree in states that did not have performance based
accountability systems prior to 2002. Similarly, the negative interaction with the accountability
strength index in column 6 shows that NCLB had a greater impact in states with weaker prior
accountability systems. Both of these results suggest that NCLB in fact had a positive effect on
teachers’ perceptions of the control they exercise in their own classrooms, echoing some prior
findings about teachers’ views of NCLB (Hamilton et al., 2007).
Table 3 presents results from our models of peer, parent, and administrative support.
Models are run separately for each support variable. Across all four measures, teachers generally
report feeling greater feelings of support in the years following NCLB implementation than they
did in the years prior to NCLB, with the point estimates suggesting substantively meaningful
increases in feelings of support from fellow staff members and administrators in particular and
smaller increases in feelings of support from parents. As with hours worked, however, there is
little evidence in Table 3 of a differential impact of NCLB on feelings of support according to
prior state accountability policy. While feelings of support are higher post-NCLB, there is no
evidence of differential support growth in states with and without prior accountability systems,
nor differential growth by the strength of those systems. Again, either NCLB positively affected
teachers’ support feelings similarly across the two kinds of states, or these increased feelings of
job support are attributable to other, non-NCLB factors.
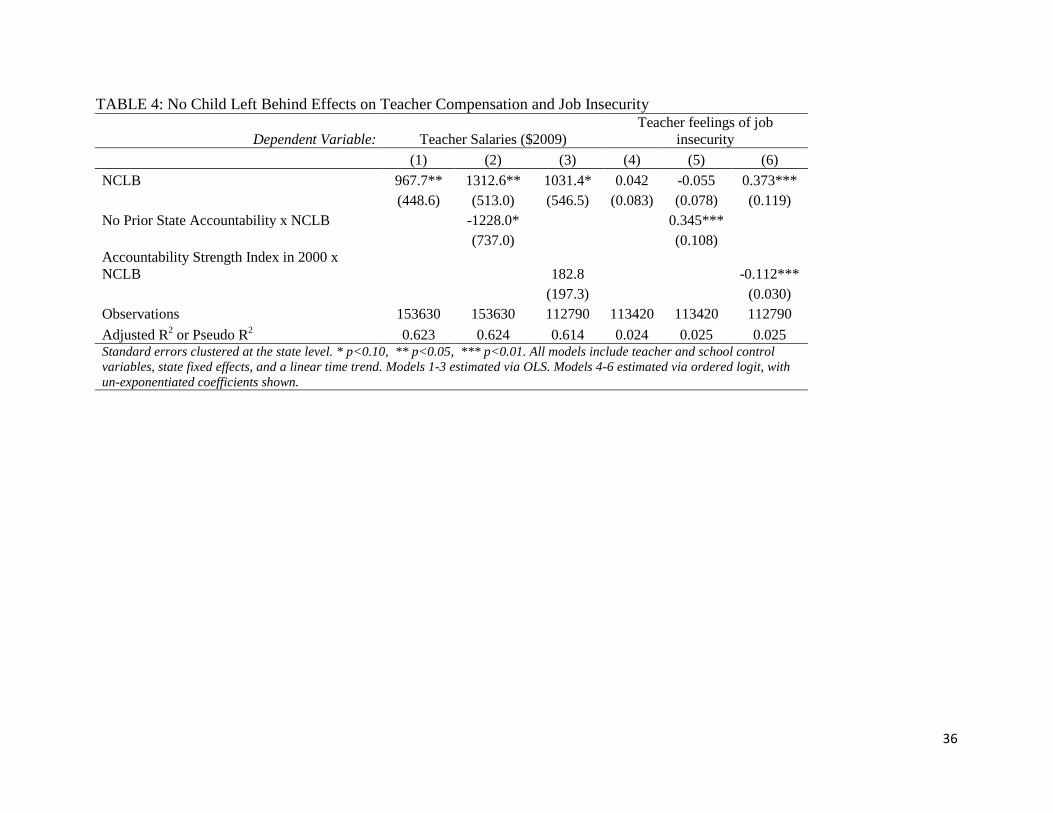
Compensation and Job Security
Table 4 turns to teacher compensation and teachers’ feelings of job security, or, in this
case, job insecurity. The first three columns display the estimates for teacher salaries. Dee and
Jacob (2010) show that NCLB increased K-12 instructional expenditures, suggesting the

18
possibility that the law positively impacted teacher pay. Indeed, the result in column 1 shows that
the typical teacher was paid $968 more in the years following NCLB than in years prior ($2009),
conditioning on important determinants of teacher pay such as experience and education level.12
Column 2, however, displays the surprising result that this salary growth was driven by states
with existing accountability systems prior to NCLB; these states paid the average teacher $1,228
more than in the no prior accountability states following NCLB, a difference that is significant at
the 0.10 level. Further muddying the waters, substituting prior accountability strength into the
interaction term results in a non-significant coefficient, though again the sign is consistent with
the conclusion that NCLB increased pay more in states with strong prior accountability systems.
Columns 4–6 turn to job insecurity. Higher values for this dependent variable indicate
greater concerns about the security of the teacher’s job because of student test performance.
Column 4 shows that there was no discernible average change in job insecurity between 2000
(the only year of data prior to NCLB available) and the two time points after NCLB (2004 and
2008). In columns 5 and 6, however, we see evidence of a more nuanced story. The significant
interaction between NCLB and no prior accountability suggests that the implementation of the
federal policy did significantly increase insecurity in those states that did not have a state-level
accountability system prior to 2002. In those states, the implementation of NCLB increased the
ordered log-odds of evaluating one’s feelings of insecurity in a higher Likert category by
approximately 0.35 points (odds ratio = 1.41) relative to states with prior accountability systems,
whose teachers presumably already were experiencing accountability pressure. A similar
conclusion can be drawn from the results in column 6, which suggests that feelings of job
insecurity went up overall after the implementation of NCLB and even more so in states with
lower scores on the accountability index. A one point decrease in prior accountability strength is 12 The time trend is not statistically significant.
19
associated with a 0.11-point increase in the ordered log odds of being at a higher job insecurity
rating after NCLB (odds ratio = 1.11).
Looking across the findings regarding the impact of NCLB on the potential precursors of
job satisfaction and commitment, some patterns emerge. The policy is associated, in the average
state, with increased task demands, increased control, and improved perceptions of support from
coworkers, administrators, and parents. Among these, only the results for classroom control
show significant differences between states with and without prior accountability systems,
increasing our confidence that the observed effect is causal and not an artifact of, for example,
other changes to the policy environment that were coincident with NCLB. We can make similar
assertions about the job security results; feelings of job insecurity increased after NCLB in states
with no (or weak) prior accountability systems. Findings for compensation suggest an increase in
pay for teachers post-NCLB but that this increase was concentrated among states already
experienced with high-stakes accountability; NCLB does not appear to have brought higher pay
to states without those existing policies.
Job Satisfaction and Intent to Leave Teaching
We have argued herein that the DCS framework—supplemented with compensation and
job security—can help us understand the impact of performance-based accountability reforms on
general employee attitudes, such as job satisfaction and job commitment. Yet predictions about
the impact of NCLB on these more general attitudes from our modified DCS model are thus far
unclear. On the one hand, the policy may have improved teachers’ work environments along
some dimensions, such as feelings of control. On the other hand, there apparently have been
competing negative effects on other dimensions, such as feelings of job insecurity. Because the
20
results are not all in the same direction, firm predictions are elusive. Even if these factors affect
job satisfaction or turnover intention linearly—with no interactions among them—without better-
developed theory about the weights that teachers attach to these competing effects, we have no
clear expectation about the overall effect of NCLB on satisfaction or commitment as potentially
mediated by these variables.
In Table 5, we turn to testing the two-sided hypotheses that NCLB had some effect on
teacher satisfaction and job commitment, operationalized here in its negative form, intent to
leave. The satisfaction results are on the left. Given the rhetoric and anecdotal evidence
surrounding NCLB and teacher satisfaction, we expect a negative impact of its implementation.
Yet the coefficient on NCLB in column 1 suggests that teacher satisfaction is, in fact, higher in
the years since the passage of NCLB than in the years prior, even controlling for a linear time
trend (the coefficient on which, though not shown, is also positive and significant). When we
turn to the interaction in column 2, we see perhaps some evidence of a negative effect; the
coefficient on the interaction is negative and statistically significant at the 0.10 level. An
interpretation of this result is that, while teacher satisfaction has risen substantially across the
years of the study, including after the implementation of NCLB, it increased less in states
experiencing high-stakes accountability for the first time. The coefficient on the interaction with
accountability strength in column 3, though consistent in direction with the result in column 2, is
not statistically significant, suggesting some caution in concluding that NCLB had a negative
effect even where it represented an introduction of strong accountability.
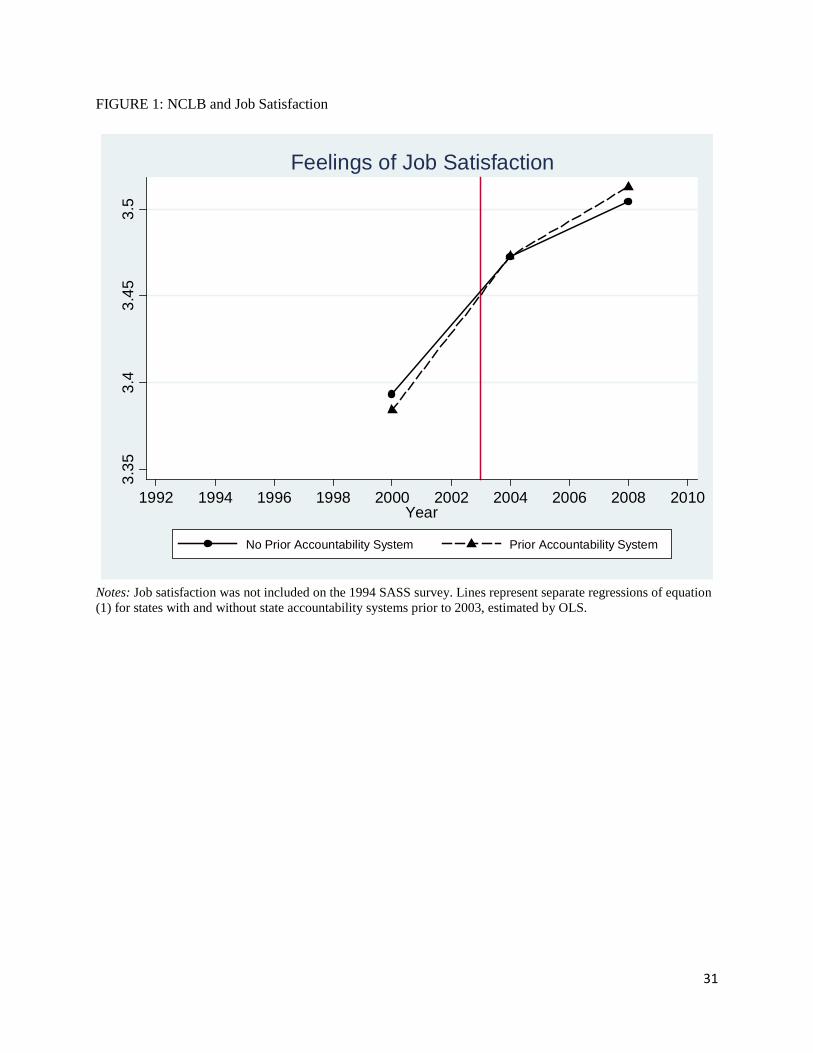
A visual illustration of the change in teacher satisfaction from prior to after NCLB is
given in Figure 1, which plots the predicted values over time of satisfaction from separate
regressions of states with and without prior accountability systems, with other variables in the
21
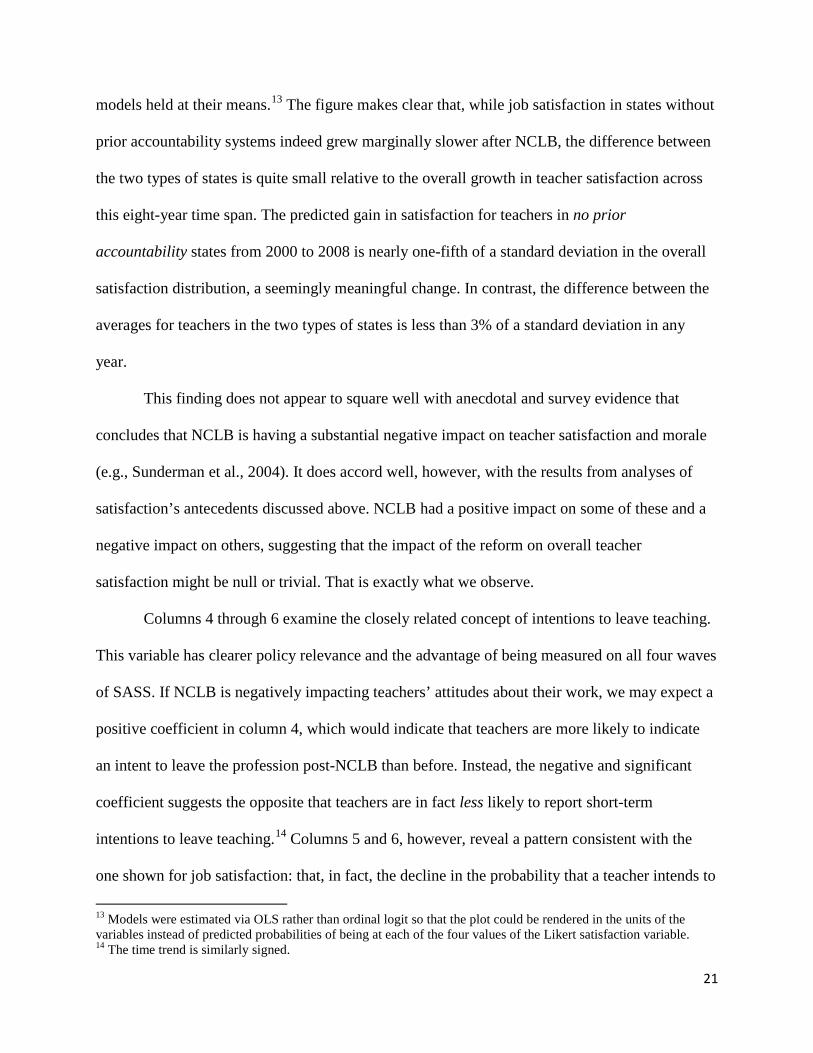
models held at their means.13 The figure makes clear that, while job satisfaction in states without
prior accountability systems indeed grew marginally slower after NCLB, the difference between
the two types of states is quite small relative to the overall growth in teacher satisfaction across
this eight-year time span. The predicted gain in satisfaction for teachers in no prior
accountability states from 2000 to 2008 is nearly one-fifth of a standard deviation in the overall
satisfaction distribution, a seemingly meaningful change. In contrast, the difference between the
averages for teachers in the two types of states is less than 3% of a standard deviation in any
year.
This finding does not appear to square well with anecdotal and survey evidence that
concludes that NCLB is having a substantial negative impact on teacher satisfaction and morale
(e.g., Sunderman et al., 2004). It does accord well, however, with the results from analyses of
satisfaction’s antecedents discussed above. NCLB had a positive impact on some of these and a
negative impact on others, suggesting that the impact of the reform on overall teacher
satisfaction might be null or trivial. That is exactly what we observe.
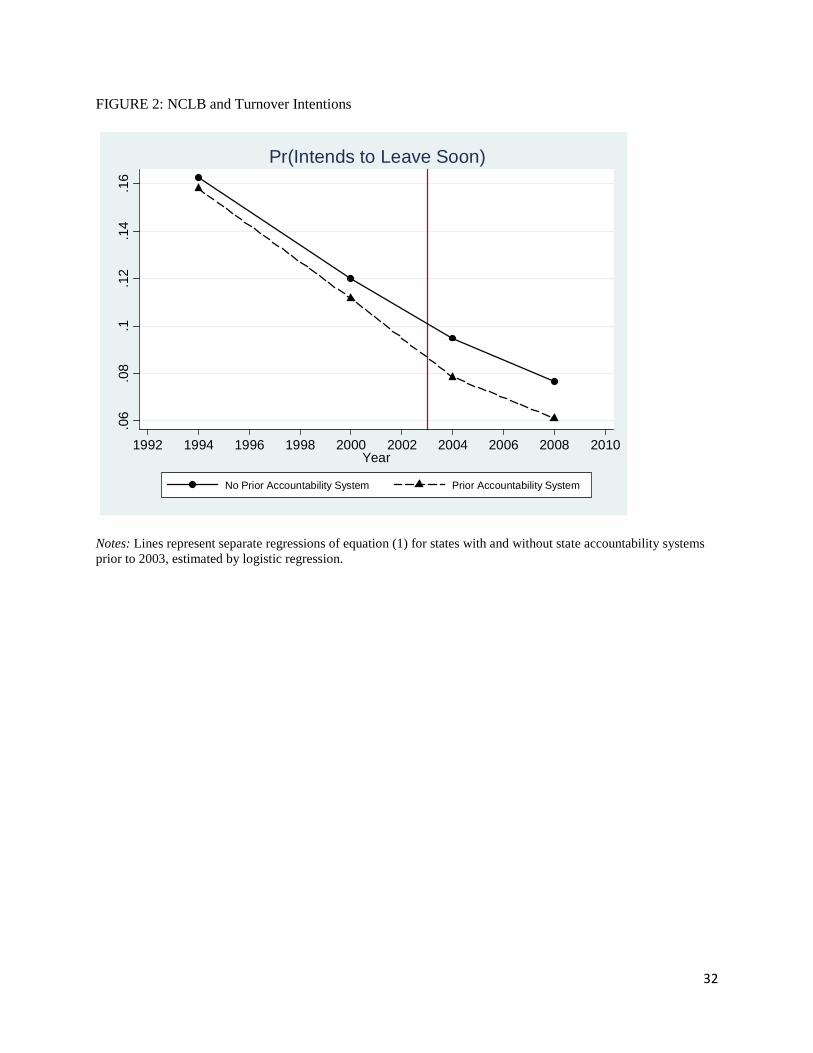
Columns 4 through 6 examine the closely related concept of intentions to leave teaching.
This variable has clearer policy relevance and the advantage of being measured on all four waves
of SASS. If NCLB is negatively impacting teachers’ attitudes about their work, we may expect a
positive coefficient in column 4, which would indicate that teachers are more likely to indicate
an intent to leave the profession post-NCLB than before. Instead, the negative and significant
coefficient suggests the opposite that teachers are in fact less likely to report short-term
intentions to leave teaching.14 Columns 5 and 6, however, reveal a pattern consistent with the
one shown for job satisfaction: that, in fact, the decline in the probability that a teacher intends to
13 Models were estimated via OLS rather than ordinal logit so that the plot could be rendered in the units of the variables instead of predicted probabilities of being at each of the four values of the Likert satisfaction variable. 14 The time trend is similarly signed.
22
leave teaching soon over time has been less steep in schools with no or weak prior accountability
systems. This interaction coefficient suggests that NCLB increased the probability that a teacher
would intend to leave in states for which it introduced high-stakes accountability, though, as
Figure 2 illustrates, this marginal increase appears small in the context of the quite steep decline
in turnover intention across states over this time period.
In short, for both satisfaction and turnover intention, we conclude that, while there indeed
were consequences of NCLB for teachers, those consequences were much less important than the
countervailing trend: that teachers’ job satisfaction and commitment to remain in teaching
increased substantially in the time period under study. Although our results are consistent with
negative effects of NCLB on these global teacher attitudes, they are not consistent with the
conclusion that NCLB has left teachers much less satisfied or committed to teaching than they
were before the law’s implementation. Counter to conventional wisdom, job satisfaction and
commitment in 2008 appear to be much higher than they were in the decade prior to the law’s
passage.
Discussion and Conclusions
This paper has considered the impact of NCLB on the job attitudes of public school
teachers, arguing that an application of an often-used framework from the private management
literature provides a useful lens for this examination. Drawing on multiple waves of the
nationally representative Schools and Staffing Survey and focusing on the comparison between
states with prior accountability systems and those without, we find that NCLB has had effects,
both positive and negative, on the antecedents of job satisfaction and turnover intention. Most
clearly, though perhaps unexpectedly, NCLB appears to have a positive impact on teachers’

23
feelings of autonomy in their classrooms. This finding is consistent with evidence from some
previous descriptive work on the impact of the reform (see Hamilton et al., 2007), though we
cannot, given the data analyzed in this study, offer any empirical insights into the causal
mechanism underlying this relationship. Less unexpectedly, the law appears to have negatively
impacted teachers’ feelings of job security. Though our research design does not allow these
perceptions to be moderated by the actual performance of a teacher’s school, the results show
that even in the average school, anxiety about losing one’s job was higher after the
implementation of NCLB. This was particularly true in states that did not have accountability
regimes in place before the federal law went into effect, which increases our confidence in the
causal impact of the reform on teacher perceptions of the security of their jobs.
Given the mixed results concerning the antecedents of generalized satisfaction, we
arrived at no clear prediction about the overall impact of NCLB on job satisfaction and
commitment, though conventional wisdom suggests negative effects. The empirical evidence
suggests that, on balance, NCLB negatively impacts teachers’ feelings of job satisfaction and
increases the likelihood that they intend to leave the profession. Importantly, however, we also
find these results to be substantively quite small in comparison to the large countervailing trends
for teachers in these variables. Overall, teacher satisfaction and commitment increased
substantially over the study period, though they increased at slightly lower rates in the states
without prior accountability systems (or with weak systems). These results do not support media
accounts portraying NCLB has a killer of morale and commitment among teachers.
One possible explanation for the inconsistency between our results and this conventional
wisdom is that, by focusing on average effects on teachers nationwide, we are not able to identify
the negative impact of NCLB on teachers in particular kinds of schools where the law’s
24
requirements bind most tightly. For example, we might expect NCLB to have its most
pronounced effects in low-performing schools that face the greatest obstacles in meeting
Adequate Yearly Progress. While testing this proposition directly is difficult without detailed
information about school performance, we test it indirectly by comparing the effects of NCLB
over time in high-poverty schools—defined as being in the highest quartile of free and reduced
price lunch in a survey year—versus other schools. We re-estimate the models separately for
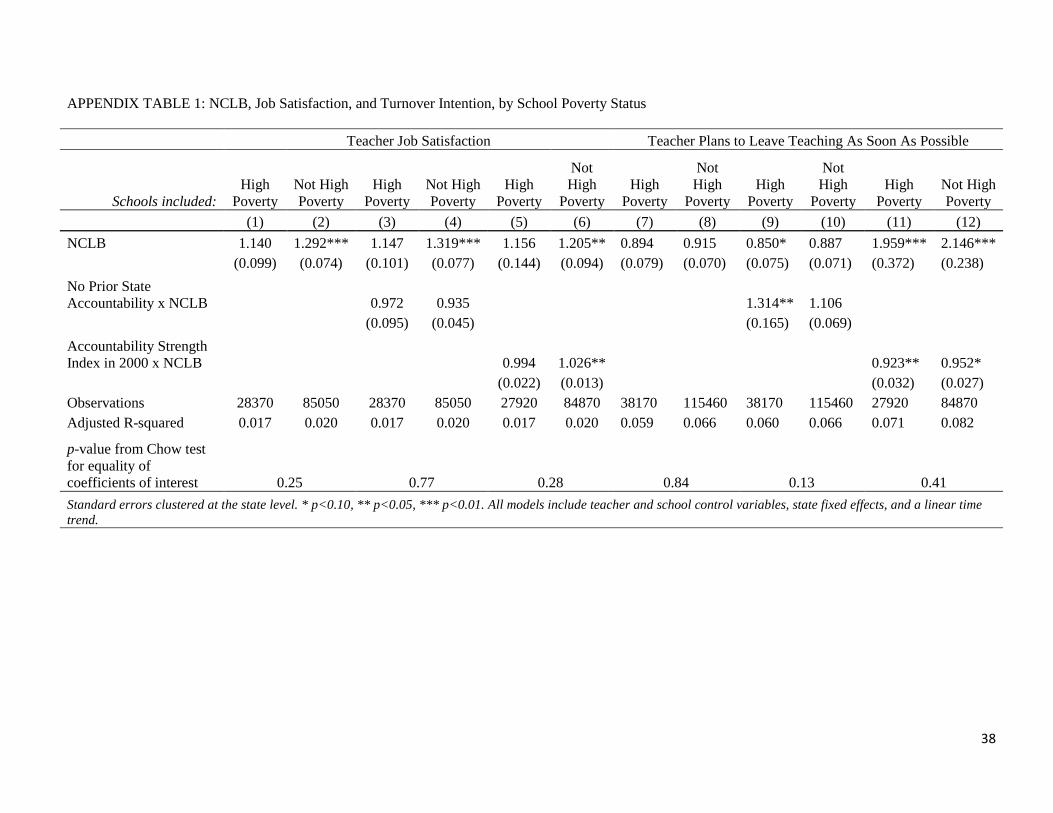
high-poverty and other schools. The results for job satisfaction and turnover intention, which are
shown in Appendix Table 1, show little evidence of differences in the impact of NCLB across
the two groups of schools. The coefficients are very similar between the two, and Chow tests of
equality of the coefficients of interest cannot be rejected at conventional levels for any of the
models.15 At least by these estimates, it does not appear that the job attitudes of teachers in high-
poverty schools have been differentially responsive to NCLB as compared to the average
teacher.
Of course, poverty is only a (potentially rough) proxy for heightened accountability
pressures across schools. More directly measures of accountability pressure may well yield
cleaner results, though operationalizing this pressure across the various state systems is
challenging. One promising empirical strategy has been developed by Reback, Rockoff, and
Schwartz (2011), who exploit the fact that state influence over the cutoffs for Adequate Yearly
Progress (AYP) means that schools “on the bubble” in one state may be well above or below in
another state. The resulting differences-in-differences approach they use to identify the impact of
accountability pressure on test scores could be adapted to examine impacts on teacher attitudes
15 Results for the antecedent variables are omitted for brevity but are available from the authors upon request. They generally show little evidence of differences between high-poverty and other schools. The exception is with job security, for which the results suggest that the impacts of NCLB are concentrated in high-poverty schools.
25
as well. Future research in this direction could further disentangle the impact NCLB has on
teacher satisfaction, its antecedents, and related constructs.
Still, the results of this study suggest that concerns about overwhelming negative impacts
of NCLB on the quality of the work experience of the average teacher are not well-founded.
Across the series of teacher outcomes examined here, effects of NCLB are a mixed set of both
positives and negatives for teachers. Or course, there are many potentially important teacher-
level outcomes we did not consider, and undoubtedly further study would uncover other effects
of the law on how teachers feel about their work. Nevertheless, it appears that the net effects of
NCLB on teacher satisfaction and turnover intention, while potentially negative, are quite
small—and, to the extent that pieces of the law have impacted states both with and without prior
accountability systems similarly16—conceivably even positive. Scholars will continue to debate
whether NCLB has fundamentally changed the way schools do business (see Manna 2011), but
we do not find much evidence that changes the law has brought to education include high levels
of teacher dissatisfaction or declining commitment to the profession. These findings are
important ones for the (currently ongoing) discourse surrounding the law’s reauthorization.
Lastly, it is important to place our findings within the context of recent changes in the
implementation of NCLB. In our study, school districts had good reason to believe they might
lose their federal funding if they did not meet AYP benchmarks set by their state. However, in
2012, the federal government granted waivers to 11 states with a high percentage of
underperforming districts, potentially lessening the stress placed on teachers and administrators
by the federal policy. Of course, by that same logic, waivers might also reduce the incentive for
districts and schools to provide teachers with greater autonomy in hopes of meeting AYP
standards, which is one plausible explanation for our empirical finding that teachers reported 16 Such impacts would be captured by the “main effect” of NCLB in the models, not the interaction.

26
greater control over their classrooms after the implementation of NCLB. However intriguing
they might be, answering questions about these and other potential impacts of waivers requires
that we first have an accurate understanding of the relationship between the policy as it was
originally implemented and the attitudes of teachers. For that reason, we believe that the results
reported in this paper remain relevant and important, despite recent changes to NCLB.

27
References
Ballou, D., & Springer, M. G. (2011). Has NCLB encouraged triage? Accountability and the distribution of achievement gains. Unpublished manuscript.
Bellante, D., & Link, A.N. (1981). Are public sector workers more risk averse than private sector workers? Industrial and Labor Relations Review, 34(3), 408-412.
Berryhill, J., Linney, J.A., & Fromewick, J. (2009). The effects of education accountability on teachers: Are policies too stress provoking for their own good? International Journal of Education Policy & Leadership, 4(5), 1-14.
Bloland P., & Selby T., (1980). Factors associated with career change among secondary school teachers: A review of the literature. Educational Research Quarterly, 5(3), 13–24.
Bogler, R. (2001). The influence of leadership style on teacher job satisfaction. Educational Administration Quarterly, 37(5), 662-683
Brockner, J., Spreitzer, G., Mishra, A., Hochwarter, W., Pepper, L. & Weinburg, J. (2004). Perceived control as an antidote to the negative effects of layoffs on survivors’ organizational commitment and job performance. Administrative Science Quarterly, 49(1), 76-100.
Brodkin, E.Z. (2011). Policy work: Street-level organizations under new managerialism. Journal of Public Administration Research and Theory, 21(2), 1253-1277.
Booher-Jennings, J. (2005). Below the bubble: Educational triage and the Texas accountability system. American Educational Research Journal, 42(2), 231-268.
Butt, G. & Lance, A. (2005), Secondary teacher workload and job satisfaction, Educational Management Administration and Leadership, 33(4), 401-22.
Byrd-Blake, M., Afolayan, M.O., Hunt, J.W., Fabunmi, M., Pryor, B.W., & Leander, R. (2010). Morale of teachers in high poverty schools: A post-NCLB mixed methods analysis. Education and Urban Society, 42(4), 450-472.
Carnoy, M., & Loeb, S. (2002). Does external accountability affect student outcomes? A cross-state analysis. Educational Evaluation and Policy Analysis, 24(4), 305-331.
Cavanagh, S. (2012). Survey: N.C. teachers say high-stakes tests dominate classes. Education Week, March 8, 2012. Available at http://blogs.edweek.org/edweek/state_edwatch/2012/03/survey_nc_teachers_dissatisfied_with_high-stakes_tests.html?cmp=ENL-EU-NEWS2.
Center on Education Policy. (2006). From the capital to the classroom: Year 4 of the No Child Left Behind Act. Available at www.cep-dc.org.
Cody, A. (2012). Hyper-accountability, burnout and blame: A TFA corps member speaks out. Education Week, February 24, 2012. Available at http://blogs.edweek.org/teachers/living-in-dialogue/2012/02/hyper-accountability_burnout_a.html?cmp=ENL-EU-VIEWS2.
Dee, T. & Jacob, B. (2010). The impact of no child left behind on students, teachers, and schools. Brookings Papers on Economic Activity, 149-207.
28
Dee, T. & Jacob, B. (2011). The impact of no child left behind on student achievement. Journal of Policy Analysis and Management, 30(3), 418-446.
Dinham, S. & Scott, C. (2000). Moving into the third, outer domain of teacher satisfaction. Journal of Educational Administration, 38, 379–396.
Deniston, R.D., & Gerrity, K.W. (2010). Elementary school teachers’ perceptions of no child left behind and its effect on morale. Scholarly Partnerships, 5(2), article 4.
Figlio, D.N. (1997). Teacher salaries and teacher quality. Economics Letters, (55)2, 267.
Fox, M.L., Dwyer, D.J., & Ganster, D.C. (1993). Effects of stressful job demands and control on physiological and attitudinal outcomes in a hospital setting. The Academy of Management, 36(2), 289-318.
Gerson, J. (2007). NCLB: Bad for teachers, bad for kids. United Teacher, 37(2). 14.
Grissom, J.A. (2011). Revisiting the impact of participative decision-making on public employee retention: The moderating influence of effective managers. American Review of Public Administration, in press. doi: 10.1177/0275074011404209.
Haladyna, T., Haas, N. & Allison, J. (1998). Continuing tensions in standardized testing. Childhood Education, 74(5), 262-273.
Hamilton, L., Stecher, B., Marsh, J., McCombs, J.S., Robyn, A., Russell, J.L., Naftel, S., & Barney, H. (2007). Standards-based accountability under no child left behind: Experiences of teachers and administrators in three states. Santa Monica, CA: RAND.
Hannaway, J., & Hamilton, L. (2008). Performance-based accountability policies: Implications for school and classroom practices. The Urban Institute and RAND Corporation. Washington, DC.
Hanushek, E.A., Kain, J., & Rivkin, S. (2004). Why public schools lose teachers. Journal of Human Resources, 39(2), 326–354.
Hanushek, E.A. & Raymond, M.E. (2005). Does school accountability lead to improved student performance? Journal of Policy Analysis and Management, 24(2), 297-327.
Hanushek, E.A. & Woessmann, L. (2011). How much do educational outcomes matter in OECD countries? Economic Policy, 67, 1-65.
Hefling, K. (2012, January 7). Education law’s promise falls short after 10 years. Associated Press.
Hill, D.M., & Barth, M. (2004). NCLB and teacher retention: Who will turn out the lights? Education and the Law, 16(2-3), 173-181.
Houston, D.J. (2000). Public-service motivation: A multivariate test. Journal of Public Administration Research and Theory, 10(4), 713-728.
Imazeki, J., & Reschovsky, A. (2004). Is no child left behind an un (or under) funded federal mandate? Evidence from Texas. National Tax Journal, 57, 571-588.
Jacob, B. A. & Levitt, S. (2003). “Rotten apples: An investigation of the prevalence and predictors of teacher cheating.” Quarterly Journal of Economics, 118(3), 843-877.
29
Karasek, R. A. (1979). Job demands, job decision latitude, and mental strain: Implications for job redesign. Administrative Science Quarterly, 24, 285-308.
Karasek, R., & Theorell, T. (1990). Healthy work: Stress, productivity, and the reconstruction of working life. New York: Basic Books.
Kellman, S. (2006). Downsizing, competition, and organizational change in government: Is necessity the mother of invention? Journal of Policy Analysis and Management, 25(4), 875-895.
Korunga, C, Scharitzer, D., Carayons, P. & Sainfort, F. (2003). Employee strain and job satisfaction related to an implementation of quality in a public service organization: A longitudinal study, Work and Stress, 17, 52-72.
Ladd, H.F. (2011). Teachers’ perceptions of their working conditions: How predictive of planned and actual teacher movement? Educational Evaluation and Policy Analysis, 33(2), 235-261.
Loeb S., Darling-Hammond L., & Luczak J. (2005). How teaching conditions predict teacher turnover in California schools. Peabody Journal of Education, 80(3), 44–70.
Manna, P. (2011). Education: Federal government programs and issues. Oxford Bibliographies. New York: Oxford University Press.
Mulvenson, S. W., Stegman, C. E., & Ritter, G. (2005). Test anxiety: A multifaceted study on the perceptions of teachers, principals, counselors, students, and parents. International Journal of Testing, 5(1), 37-61.
Neal, D., & Schanzenbach, D. W. (2010). Left behind by design: Proficiency counts and test- based accountability. Review of Economics and Statistics, 92(2), 263-283.
Noblett, A.J. & Rodwell, J.J. (2009). Integrating job stress and social exchange theories to predict employee strain in reformed public sector contexts. Journal of Public Administration Research and Theory, 19(3), 555-578.
Osborne, D. E., & Gaebler, T. (1992). Reinventing government: How the entrepreneurial spirit is transforming the public sector. Reading, MA: Addison-Wesley.
Pedulla, J. J., Abrams, L. M., Madaus, G. F., Russell, M. K., Ramos, M. A., & Miao, J. (2003). Perceived effects of state-mandated testing programs on teaching and learning: Findings from a national survey of teachers. Boston: Boston College, National Board on Testing and Public Policy.
Reback, R. (2008). Teaching to the rating: School accountability and the distribution of student achievement. Journal of Public Economics, 92, 1394-1415.
Reback, R., Rockoff, J. & Schwartz, H.L. (2011). Under press: Job security, resource allocation, and productivity in schools under NCLB. NBER Working Paper, No. 16745.
Rouse, C., Hannaway, J., Goldhaber, D., & Figlio, D. (2007). Feeling the Florida heat? How low-performing schools respond to voucher and accountability pressure. National Bureau of Economic Research, working paper 13681.
Santoro, D.A. (2011). Good teaching in difficult times: Demoralization in the pursuit of good work. American Journal of Education, 118(1), 1-23.
30
Shann, M. H. (1998). Professional commitment and satisfaction among teachers in urban middle schools. Journal of Educational Research, 92, 67–75.
Sunderman, G.L., Tracey, C.A., Kim, J., & Orfield, G. (2004). Listening to teachers: Classroom realities and No Child Left Behind. Cambridge, MA: The Civil Rights Project at Harvard University.
Teachers Network. (2007). A survey of teachers on No Child Left Behind. Available at http://teachersnetwork.org/TNLI/NCLB_Survey_Results.pdf.
Tett, R. P., & Meyer, J. P. (1993). Job satisfaction, organizational commitment, turnover intention, and turnover: Path analyses based on meta‐analytic findings. Personnel Psychology, 46(2), 259-293.
Toppo, G. (2007). How Bush education law has changed our schools. USA Today. http://www.usatoday.com/news/education/2007-01-07-no-child_x.htm.
van der Doef, M., & Maes, S. (1999). The job demand-control(-support) model and psychological well-being: A review of 20 years of empirical research. Work and Stress, 13, 87-114.
Van Wart, M., & Berman, E. (1999). Contemporary public sector productivity values: Narrower scope, tougher standards, and new rules of the game. Public Productivity & Management Review, 22(3), 326-347.
Young, B., Worchel, S., & Woehr, D. (1998). Organizational commitment among public service employees. Public Personnel Management, 27(3), 339-348.
31
FIGURE 1: NCLB and Job Satisfaction
Notes: Job satisfaction was not included on the 1994 SASS survey. Lines represent separate regressions of equation (1) for states with and without state accountability systems prior to 2003, estimated by OLS.
3.35
3.4
3.45
3.5
1992 1994 1996 1998 2000 2002 2004 2006 2008 2010Year
No Prior Accountability System Prior Accountability System
Feelings of Job Satisfaction
32
FIGURE 2: NCLB and Turnover Intentions
Notes: Lines represent separate regressions of equation (1) for states with and without state accountability systems prior to 2003, estimated by logistic regression.
.06
.08
.1.1
2.1
4.1
6
1992 1994 1996 1998 2000 2002 2004 2006 2008 2010Year
No Prior Accountability System Prior Accountability System
Pr(Intends to Leave Soon)
33
TABLE 1: Descriptive Statistics Variable N Mean SD Min Max Total weekly hours worked 152310 49.18 11.97 0 105 Teacher classroom control (factor) 152310 -0.10 1.01 -4.2 1.3 Teacher feelings of job insecurity 112330 1.98 0.95 1 4 Teachers share beliefs about mission 152310 3.20 0.73 1 4 Cooperative effort among staff 152310 3.15 0.81 1 4 Receives great support from parents 152310 2.61 0.91 1 4 Administration is supportive 152310 3.26 0.87 1 4 Job satisfaction 112330 3.47 0.72 1 4 Teacher plans to leave teaching 152310 0.10 0.31 0 1
Teacher Characteristics Female 152310 0.75
0 1
Black 152310 0.08
0 1 Hispanic 152310 0.06
0 1
Other non-white 152310 0.02
0 1 Years experience 152310 13.53 9.88 0 64 Age 152310 43.26 10.8 20 94 Holds Master's degree 152310 0.47
0 1
Regular full-time teacher 152310 0.91
0 1 Union member 152310 0.78
0 1
School Characteristics Percent black students 152310 16.26 24.14 0 100
Percent Hispanic students 152310 15.00 23.83 0 100 Percent other non-white race 152310 4.84 10.61 0 100 Percent free/reduced lunch 152310 39.20 28.82 0 100 School size (in 100s) 152310 8.03 6.01 0.06 53.8 Regular (non-special) school 152310 0.93
0 1
Urban 152310 0.27
0 1 Rural 152310 0.27
0 1
Middle school 152310 0.19
0 1 High school 152310 0.29
0 1
34
TABLE 2: No Child Left Behind Effects on Job Demands and Control
Dependent Variable: Total Weekly Hours Worked Teacher Classroom Control (1) (2) (3) (4) (5) (6) NCLB 1.827*** 1.946*** 3.807*** 0.544*** 0.529*** 0.708*** (0.186) (0.174) (0.359) (0.023) (0.026) (0.037) No Prior State Accountability x NCLB
-0.425
0.055*
(0.386)
(0.029) Accountability Strength Index in 2000 x NCLB
0.022
-0.023***
(0.089)
(0.007) Constant 32.533*** 32.553*** 37.634*** 0.164** 0.162** 0.368*** (0.983) (0.978) (0.912) (0.066) (0.065) (0.082) Observations 153630 153630 112790 153630 153630 112790 Adjusted R2 0.222 0.222 0.210 0.084 0.084 0.097
Standard errors clustered at the state level. * p<0.10, ** p<0.05, *** p<0.01. All models include teacher and school control variables, state fixed effects, and a linear time trend.

35
TABLE 3: Ordinal Logit Analysis of No Child Left Behind Effects on Job Support
Dependent Variable: Teachers Share Beliefs about Mission Cooperative Effort among Staff (1) (2) (3) (4) (5) (6) NCLB 0.268*** 0.274*** 0.261*** 0.348*** 0.349*** 0.297*** (0.036) (0.037) (0.052) (0.036) (0.043) (0.054) No Prior State Accountability x NCLB
-0.022
-0.005
(0.035)
(0.042) Accountability Strength Index in 2000 x
NCLB
0.001
0.006
(0.013)
(0.018)
Observations 153630 153630 112790 153630 153630 112790 Pseudo R2 0.031 0.031 0.032 0.022 0.022 0.021
Dependent Variable: Parent Support Administrative Support (7) (8) (9) (10) (11) (12) NCLB 0.064* 0.070* 0.023 0.447*** 0.430*** 0.338*** (0.037) (0.037) (0.045) (0.050) (0.050) (0.071) No Prior State Accountability x NCLB
-0.022
0.059
(0.042)
(0.044) Accountability Strength Index in 2000 x
NCLB
0.007
0.002
(0.014)
(0.016)
Observations 153630 153630 112790 153630 153630 112790 Pseudo R2 0.042 0.042 0.042 0.020 0.020 0.019
Ordinal logit coefficients shown. Standard errors clustered at the state level. * p<0.10, ** p<0.05, *** p<0.01. All models include teacher and school control variables, state fixed effects, and a linear time trend.
36
TABLE 4: No Child Left Behind Effects on Teacher Compensation and Job Insecurity
Dependent Variable: Teacher Salaries ($2009) Teacher feelings of job
insecurity (1) (2) (3) (4) (5) (6) NCLB 967.7** 1312.6** 1031.4* 0.042 -0.055 0.373*** (448.6) (513.0) (546.5) (0.083) (0.078) (0.119) No Prior State Accountability x NCLB
-1228.0*
0.345***
(737.0)
(0.108) Accountability Strength Index in 2000 x
NCLB
182.8
-0.112***
(197.3)
(0.030)
Observations 153630 153630 112790 113420 113420 112790 Adjusted R2 or Pseudo R2 0.623 0.624 0.614 0.024 0.025 0.025 Standard errors clustered at the state level. * p<0.10, ** p<0.05, *** p<0.01. All models include teacher and school control variables, state fixed effects, and a linear time trend. Models 1-3 estimated via OLS. Models 4-6 estimated via ordered logit, with un-exponentiated coefficients shown.

37
TABLE 5: No Child Left Behind Effects on Job Satisfaction and Intent to Leave
Dependent Variable: Teacher Job Satisfaction Teacher Plans to Leave Teaching As
Soon As Possible (1) (2) (3) (4) (5) (6) NCLB 0.220*** 0.233*** 0.184*** -0.099* -0.136** 0.701*** (0.045) (0.048) (0.057) (0.057) (0.061) (0.096) No Prior State Accountability x NCLB
-0.047*
0.135**
(0.028)
(0.066) Accountability Strength Index in 2000 x NCLB
0.012
-0.053**
(0.010)
(0.024) Observations 113420 113420 112790 153630 153630 112790 Pseudo R2 0.021 0.021 0.021 0.063 0.063 0.076
Ordinal logit coefficients (satisfaction) and logit coefficients (plans to leave) shown. Standard errors clustered at the state level. * p<0.10, ** p<0.05, *** p<0.01. All models include teacher and school control variables, state fixed effects, and a linear time trend.
38
APPENDIX TABLE 1: NCLB, Job Satisfaction, and Turnover Intention, by School Poverty Status Teacher Job Satisfaction Teacher Plans to Leave Teaching As Soon As Possible
Schools included: High
Poverty Not High Poverty
High Poverty
Not High Poverty
High Poverty
Not High
Poverty High
Poverty
Not High
Poverty High
Poverty
Not High
Poverty High
Poverty Not High Poverty
(1) (2) (3) (4) (5) (6) (7) (8) (9) (10) (11) (12) NCLB 1.140 1.292*** 1.147 1.319*** 1.156 1.205** 0.894 0.915 0.850* 0.887 1.959*** 2.146*** (0.099) (0.074) (0.101) (0.077) (0.144) (0.094) (0.079) (0.070) (0.075) (0.071) (0.372) (0.238) No Prior State Accountability x NCLB
0.972 0.935
1.314** 1.106
(0.095) (0.045)
(0.165) (0.069) Accountability Strength
Index in 2000 x NCLB
0.994 1.026**
0.923** 0.952*
(0.022) (0.013)
(0.032) (0.027)
Observations 28370 85050 28370 85050 27920 84870 38170 115460 38170 115460 27920 84870 Adjusted R-squared 0.017 0.020 0.017 0.020 0.017 0.020 0.059 0.066 0.060 0.066 0.071 0.082
p-value from Chow test for equality of coefficients of interest 0.25 0.77 0.28 0.84 0.13 0.41 Standard errors clustered at the state level. * p<0.10, ** p<0.05, *** p<0.01. All models include teacher and school control variables, state fixed effects, and a linear time trend.