Embed Size (px)
Citation preview

© 2016 Dobson DaVanzo & Associates, LLC. All Rights Reserved.
Estimating the Impact of Repealing the
Affordable Care Act on Hospitals
Findings, Assumptions and Methodology
Dobson DaVanzo & Associates, LLC Vienna, VA 703.260.1760 www.dobsondavanzo.com

© 2016 Dobson DaVanzo & Associates, LLC. All Rights Reserved.
Estimating the Impact of Repealing the
Affordable Care Act on Hospitals
Findings, Assumptions and Methodology
Submitted to:
The Federation of American Hospitals (FAH)
The American Hospital Association (AHA)
Prepared by:
Dobson|DaVanzo Allen Dobson, Ph.D.
Joan DaVanzo, Ph.D.
Randy Haught
Phap-Hoa Luu, M.B.A.
Tuesday, December 6, 2016 — Final Report
© 2016 Dobson DaVanzo & Associates, LLC. All Rights Reserved.
Table of Contents
Executive Summary ....................................................................................... 1
Introduction .................................................................................................. 5
Estimating the Impact of ACA Repeal on Hospitals ...................................... 7
Appendix A - Estimating the Impact of ACA on Hospital Revenues ............ 14
Appendix B - Medicare and Medicaid Reductions under the ACA .............. 32

ESTIMATING THE IMPACT OF REPEALING THE ACA ON HOSPITALS REPORT VERSION FINAL | 1 Dobson|DaVanzo
© 2016 Dobson DaVanzo & Associates, LLC. All Rights Reserved.
Dobson DaVanzo & Associates was commissioned by the Federation of American
Hospitals (FAH) and the American Hospital Association (AHA) to estimate the financial
impact on hospitals of repealing the Affordable Care Act (ACA) without any
implementation of a replacement for the Act.
For this analysis, we based our specifications for ACA repeal on H.R. 3762, the
Restoring Americans’ Healthcare Freedom Reconciliation Act over the period 2018 –
20261. That bill, which passed Congress under budget reconciliation rules and was vetoed
by the President:
Repeals ACA policies that expand coverage without offering a replacement.
Repeals ACA taxes intended to help finance that coverage.
Yet retains all ACA reductions in hospital payments that were intended to
finance that coverage except for the Medicaid Disproportionate Share Hospitals
(DSH) reductions. DSH payments provide vital financial support to hospitals that
serve the nation’s most vulnerable populations – Medicaid beneficiaries, low-income
Medicare beneficiaries, the uninsured and underinsured.
Findings
In modeling the repeal of the ACA as laid out in H.R. 3762, we found that between
2018 and 2026:
The loss of coverage would have a net impact on hospitals of $165.8 billion
with the restoration of Medicaid DSH reductions;
The ACA Medicare reductions are maintained and hospitals will suffer
additional losses of $289.5 billion from reductions in their inflation updates;
Full restoration of Medicare and Medicaid Disproportionate Share Hospital
(DSH) payment reductions embedded in ACA would amount to $102.9
billion.
1 2026 is the end of the ten-year budget window.
Executive Summary

Executive Summary
ESTIMATING THE IMPACT OF REPEALING THE ACA ON HOSPITALS REPORT VERSION FINAL | 2 Dobson|DaVanzo
© 2016 Dobson DaVanzo & Associates, LLC. All Rights Reserved.
As discussed below, these findings suggest that any repeal bill that does not replace
coverage also should reverse hospital payment reductions, particularly those for the
Medicare and Medicaid DSH programs as well as those in the inflation updates.
Model
Our model relied on assumptions, estimates, and findings from a number of studies
including the Congressional Budget Office (CBO) estimates of budgetary and economic
effects of repealing the ACA,2,3,4,5 the Office of Assistant Secretary for Planning and
Evaluation (ASPE) study of the impact of insurance expansion on hospital
uncompensated care costs;6 and the Urban Institute’s recently published work on the cost
of ACA repeal.7 Each step in the model development included review of all available
research to develop assumptions and validate results.
Our estimates of ACA repeal are based on the premise that the Medicaid expansion,
premium tax credits, cost-sharing subsidies and penalties established under the ACA
were the primary drivers of the reduction in the number of uninsured, which is projected
by CBO to be 24 million people by 2026. Individuals moving from their existing
commercial plans into subsidized Marketplace coverage or the Medicaid expansion that
was adopted in 31 states and the District of Columbia also played a role. Therefore, if
these provisions are repealed, we assume that health insurance coverage would return to
near pre-ACA levels, resulting in a loss of coverage for a large number of individuals
who had only recently gained coverage under ACA implementation.
Below is an outline of the rigorous, multi-step process we used to develop our model.
2 Congressional Budget Office. Federal Subsidies for Health Insurance Coverage for People under age 65: Tables from CBO’s March 2016 baseline. March 2016.
3 Congressional Budget Office. Updated Budget Projections: 2016 to 2026. March 2016.
4 Congressional Budget Office. Budgetary and Economic Effects of Repealing the Affordable Care Act. June 2015.
5 Congressional Budget Office. Updated Estimates of the Effects of the Insurance Coverage Provisions of the Affordable Care Act. April 2014.
6 ASPE Issue Brief. DeLeire et al. Impact of Insurance Expansion on Hospital Uncompensated Care Costs in 2014. Sept 2014.
7 Urban Institute. Buettgens et al. The Cost of ACA Repeal. June 2016.

Executive Summary
ESTIMATING THE IMPACT OF REPEALING THE ACA ON HOSPITALS REPORT VERSION FINAL | 3 Dobson|DaVanzo
© 2016 Dobson DaVanzo & Associates, LLC. All Rights Reserved.
ES-1: Five Steps used to Estimate ACA Effects on Hospitals
Step 1: Determine changes in health insurance coverage under the ACA;
Step 2: Estimate hospital costs associated with the newly insured;
Step 3: Estimate change in hospital revenues for the newly insured;
Step 4: Estimate the impact of movement from commercial insurance to Medicaid
and Marketplaces (Crowd-out); and
Step 5: Estimate impact on hospital revenues and net income due to the ACA.
Implications
If the ACA is repealed, we estimate that the number of uninsured would increase by 22
million people by 2026 -- from a projected 28 million under the ACA to 50 million with
repeal.8 This reversal of coverage would represent an unprecedented public health crisis
as individuals would lose their insurance coverage and no longer be able to follow their
prescribed regimen of care. In addition, reduced Medicare and Medicaid DSH payments,
if not restored in a repeal bill, would present serious challenges to hospitals, which would
have to absorb the cost of uncompensated care associated with these newly uninsured
individuals who need and receive hospital care.
The possible ACA coverage repeal and the resulting increase in uncompensated care,
combined with the remaining ACA reductions in hospital payments, comes at a
challenging time for hospitals. Hospitals are being asked or even mandated to invest
heavily in a variety of alternative payment models (APMs) as Medicare steers providers
toward a value-based purchasing model. Yet Medicare does not otherwise pay for the
expenses required to implement APMs, such as Accountable Care Organizations (ACOs)
or the various mandated payment bundling programs, and does not compensate for the
increased financial risk to the hospital industry as it accepts more operational risk under
APMs. The lost revenue associated with ACA repeal could well be counter-productive to
the overarching goal of “bending the cost curve” in order to reduce the impact of the
Medicare program on the federal deficit going forward. Moreover, CMS’s Office of the
Actuary has cautioned that ACA’s reductions to hospitals on their own could create
access issues for Medicare’s beneficiaries.
To put the level of these reductions into historical perspective, the 1997 Balanced Budget
Act, which included the largest reduction to date in Federal hospital payments levied a 5-
8 The one exception would be for new Medicaid enrollees who were currently eligible for Medicaid and gained coverage due to increased awareness and coordination between the Marketplaces and Medicaid (woodwork effect). We estimated 2 million individuals who enrolled prior to 2018 would continue to be eligible for Medicaid and would not be affected by repeal. Thus, our estimate is slightly below the CBO estimate.

Executive Summary
ESTIMATING THE IMPACT OF REPEALING THE ACA ON HOSPITALS REPORT VERSION FINAL | 4 Dobson|DaVanzo
© 2016 Dobson DaVanzo & Associates, LLC. All Rights Reserved.
year payment reduction on hospitals of 10.5 percent of expected payments.9 Congress
later reduced this amount through the Balanced Budget Refinement Act (BBRA) of 1999
and the Medicare, Medicaid, and SCHIP Benefits Improvement and Protection Act
(BIPA) of 2000 when it realized the BBA reductions were not sustainable. The impact of
the reduction of coverage to the field from the repeal of the ACA, on top of other
Medicare payment reductions that were embedded in the original Act, would be nearly
100 percent more than those in the BBA as a percent of projected Medicare hospital
expenditures. This magnitude of reductions would threaten hospitals’ ability to serve their
patients and communities.
9 The Lewin Group: Dobson A, et al. The Balanced Budget Act and Hospitals: The Dollars and Cents of Medicare Payment Cuts. May 10, 1999.

ESTIMATING THE IMPACT OF REPEALING THE ACA ON HOSPITALS REPORT VERSION FINAL | 5 Dobson|DaVanzo
© 2016 Dobson DaVanzo & Associates, LLC. All Rights Reserved.
Introduction
Dobson DaVanzo & Associates was commissioned by the Federation of American Hospitals
(FAH) and the American Hospital Association (AHA) to estimate the financial impact of
repealing the Affordable Care Act (ACA), without any implementation of a replacement
for the Act, on hospital revenues and net income at the national level. Our research consists
of two pieces:
Modeling the provisions in H.R. 3762, the Restoring Americans’ Healthcare
Freedom Reconciliation Act, which repeals provisions that provide coverage
without replacement.
Estimating the impact of scheduled future hospital payment reductions in the ACA
that were originally intended to offset the cost of the coverage expansions.
In order to estimate the financial impact on hospitals of repealing the Affordable Care Act
(ACA) under H.R. 3762, we took the following steps to estimate changes in hospital revenues
and net income that would result from specific insurance coverage expansion provisions
under the ACA:
Step 1: Determine changes in health insurance coverage under the ACA;
Step 2: Estimate hospital costs associated with the newly insured;
Step 3: Estimate change in hospital revenues for the newly insured;
Step 4: Estimate the impact of movement from commercial insurance to Medicaid
and Marketplaces (Crowd-out); and
Step 5: Estimate impact on hospital revenues and net income due to the ACA.
We also modeled the ACA's series of Medicare payment reductions that affect hospitals and
reductions to Medicaid Disproportionate Share Hospital (DSH) allotments, which also affect
payments to hospitals. Although the payment reductions began in 2010, this analysis only
estimated the impact on hospital revenues of the payment reductions from 2018 through 2026
to be consistent with the time period associated with the repeal bill that we modeled.
Estimates are provided for the following ACA provisions:
Medicare market basket update reductions and productivity adjustments;
Medicare DSH payment reductions;
Medicare Hospital Acquired Condition (HAC) Reduction Program;
Medicare Hospital Readmission Reduction (HRR) Program; and

Introduction
ESTIMATING THE IMPACT OF REPEALING THE ACA ON HOSPITALS REPORT VERSION FINAL | 6 Dobson|DaVanzo
© 2016 Dobson DaVanzo & Associates, LLC. All Rights Reserved.
Medicaid DSH Allotment Reductions.
A detailed description of the assumptions, methods, and findings that were used to produce
estimates of the impact of ACA on hospitals are presented in the Appendices of this report.
Estimating the impact of ACA repeal was modeled by eliminating or reducing hospital
revenues associated with specific ACA provisions, which would be repealed under H.R.
3762, the Restoring Americans’ Healthcare Freedom Reconciliation Act covering the
period of 2018 – 2026. The following sections provide a detailed description of the data,
methods and assumptions that were used to produce estimates of the impact of ACA repeal on
hospital revenues and net income.

ESTIMATING THE IMPACT OF REPEALING THE ACA ON HOSPITALS REPORT VERSION FINAL | 7 Dobson|DaVanzo
© 2016 Dobson DaVanzo & Associates, LLC. All Rights Reserved.
Estimating the Impact of ACA Repeal on Hospitals
Using the itemized estimates of the financial impact on hospitals due to the coverage
expansions of the ACA, which represent current law and are described in detail in the
Appendix, we estimate the effect on hospital revenues and net income if certain provisions of
the ACA are repealed. For this analysis we based our specifications for ACA repeal on H.R.
3762, the Restoring American’s Healthcare Freedom Reconciliation Act covering the period
of 2018 – 2026. The following features were removed/repealed under that bill, which would
be effective January 1, 2018 without a phase-out period:
Repeal individual tax penalties for not keeping qualifying health coverage;
Repeal tax penalties for employers that do not offer qualifying health coverage;
Repeal premium tax credits;
Repeal cost-sharing subsidies;
Repeal the transitional reinsurance program;
Repeal the Medicaid expansion;
Restore the Medicaid Disproportionate Share Hospital (DSH) payments that were
reduced under the ACA; and
Repeal other taxes specified in the ACA (i.e., medical device tax, prescription drug tax,
over-the-counter medication tax, deduction for expenses allocable to Medicare Part D
subsidy, taxes on employee health insurance premiums and health plan benefits,
limitations on contributions to flexible spending accounts, reduced tax treatment of health
savings accounts from 20% to 10%, reduction in chronic care tax from 10% to 7.5%, tax
on high-cost insurance plans, and Medicare tax increase on individual wages).
We designed our model using assumptions, estimates, and findings of a number of key
studies, which include the Congressional Budget Office (CBO)’s estimates of budgetary and
Impact of Repeal on Hospitals
ESTIMATING THE IMPACT OF REPEALING THE ACA ON HOSPITALS REPORT VERSION FINAL | 8 Dobson|DaVanzo
© 2016 Dobson DaVanzo & Associates, LLC. All Rights Reserved.
economic effects of repealing the ACA,10,11,12,13 the Office of Assistant Secretary for Planning
and Evaluation (ASPE)’s study on the impact of insurance expansion on hospital
uncompensated care costs;14 and the Urban Institute’s recently-published work on the cost of
ACA repeal.15 Each step in the model development included review of all available
research to develop assumptions and validate results. Appendix A provides details on the
model development.
Impact of Repealing the ACA Coverage Expansions on Hospitals
Our estimates of ACA repeal are based on the assumption that the Medicaid expansion,
premium tax credits, cost-sharing subsidies and penalties were the primary driver for the
reduction in the number of uninsured and individuals moving from their existing commercial
plans into subsidized Marketplace coverage or the Medicaid expansion in states that adopted
the expansion. Therefore, if these provisions are repealed, then we assume that coverage
would return to near pre-ACA levels. This would lead to a loss of coverage for a large
number of individuals who had just gained coverage under ACA implementation and a
reverse movement of a number of the insured from the Marketplaces and Medicaid back to
Commercial coverage.
The one exception would be for the Medicaid woodwork population who were currently
eligible for Medicaid and gained coverage due to increased awareness and coordination
between the Marketplaces and Medicaid. We estimate that 2 million individuals who enrolled
prior to 2018 would continue to be eligible for Medicaid and would not be affected by repeal.
However, the additional woodwork population that we estimate would enroll after 2018 are
assumed not to be enrolled and would result in a loss of revenue to hospitals for this group.
We estimate that repealing the Medicaid expansion, premium tax credits, cost-sharing
subsidies and penalties would result in a reduction of approximately $399.8 billion in hospital
revenues between 2018 and 2026 as people would lose coverage or take other coverage
options (Exhibit 1). As people become uninsured, we estimate that there would be a reduction
in utilization of hospital services for an estimated reduction of about $139.4 billion in hospital
costs between 2018 and 2026.
10 Congressional Budget Office. Federal Subsidies for Health Insurance Coverage for People under age 65: Tables from CBO’s March 2016 baseline. March 2016.
11 Congressional Budget Office. Updated Budget Projections: 2016 to 2026. March 2016.
12 Congressional Budget Office. Budgetary and Economic Effects of Repealing the Affordable Care Act. June 2015.
13 Congressional Budget Office. Updated Estimates of the Effects of the Insurance Coverage Provisions of the Affordable Care Act. April 2014.
14 ASPE Issue Brief. DeLeire et al. Impact of Insurance Expansion on Hospital Uncompensated Care Costs in 2014. Sept 2014.
15 Urban Institute. Buettgens et al. The Cost of ACA Repeal. June 2016.

Impact of Repeal on Hospitals
ESTIMATING THE IMPACT OF REPEALING THE ACA ON HOSPITALS REPORT VERSION FINAL | 9 Dobson|DaVanzo
© 2016 Dobson DaVanzo & Associates, LLC. All Rights Reserved.
Hospitals would see increased Medicaid DSH payments of $45.0 billion as the scheduled
reductions in the state DSH allotments are restored. In addition, hospitals would also see
increased Medicare DSH payments of $49.5 billion. The formula used by the Centers for
Medicare and Medicaid Services (CMS) to determine Medicare DSH payments is tied to the
change in the percent of persons under age 65 who are uninsured for the current year
compared to 2013. Under an ACA repeal, we assume that the percent of uninsured would
nearly return to 2013 levels (except for people currently eligible for Medicaid who enroll due
to the woodwork effect). This would effectively eliminate most of the Medicare DSH
reductions. Thus, the net impact of repeal on hospital net income would be a reduction of
$165.8 billion over the 2018 to 2026 period.

ESTIMATING THE IMPACT OF REPEALING THE ACA ON HOSPITALS REPORT VERSION FINAL | 10 Dobson|DaVanzo
© 2016 Dobson DaVanzo & Associates, LLC. All Rights Reserved.
Exhibit 1: Estimate of the Impact on Hospital Revenues and Net Income under Repeal of the ACA (in millions)
2018 2019 2020 2021 2022 2023 2024 2025 2026 2018-2026
Impact on Hospital Revenues from Newly Uninsured ($29,767) ($40,992) ($44,948) ($48,012) ($51,672) ($53,373) ($54,854) ($57,714) ($59,778) ($441,109)
New Coverage on Exchanges ($17,829) ($24,586) ($24,907) ($26,646) ($29,911) ($28,672) ($29,514) ($33,760) ($32,142) ($247,967)
Medicaid Newly Eligible ($11,938) ($16,406) ($18,219) ($17,481) ($19,782) ($20,550) ($21,080) ($21,777) ($23,030) ($170,263)
Medicaid Currently Eligible (Woodwork) $0 $0 ($1,822) ($3,885) ($1,978) ($4,151) ($4,259) ($2,178) ($4,606) ($22,879)
Impact on Hospital Revenues due to Crowd-out Population $2,867 $3,960 $4,421 $4,520 $4,772 $4,997 $5,152 $5,160 $5,493 $41,341
Commercial to Exchanges $1,671 $2,305 $2,569 $2,862 $2,763 $3,018 $3,107 $3,248 $3,453 $24,997
Commercial to Medicaid $1,195 $1,655 $1,852 $1,658 $2,009 $1,978 $2,045 $1,912 $2,040 $16,345
Impact of Repeal on Hospital Revenues ($26,900) ($37,032) ($40,527) ($43,491) ($46,900) ($48,377) ($49,702) ($52,554) ($54,285) ($399,768)
Impact on Hospital Costs of Reduced Utilization for Newly Uninsured ($9,518) ($13,043) ($14,403) ($15,250) ($16,704) ($16,669) ($17,057) ($18,158) ($18,555) ($139,358)
New Coverage on Exchanges ($4,986) ($6,832) ($6,878) ($7,312) ($8,429) ($7,769) ($7,947) ($9,336) ($8,546) ($68,035)
Medicaid Newly Eligible ($4,532) ($6,211) ($6,878) ($6,580) ($7,699) ($7,692) ($7,868) ($8,135) ($8,546) ($64,141)
Medicaid Currently Eligible (Woodwork) $0 $0 ($647) ($1,358) ($577) ($1,209) ($1,242) ($688) ($1,462) ($7,183)
Impact of ACA Repeal on Hospital Net Income before DSH Changes ($17,382) ($23,989) ($26,125) ($28,241) ($30,196) ($31,707) ($32,645) ($34,396) ($35,730) ($260,410)
Impact on Medicare DSH Payment $3,261 $4,590 $4,895 $5,215 $5,561 $5,931 $6,301 $6,687 $7,097 $49,537 Impact from Repealing Medicaid DSH Reductions $1,280 $2,814 $3,974 $5,152 $6,345 $7,639 $8,937 $8,894 $0 $45,034
Impact of ACA Repeal on Hospital Net Income after DSH Changes ($12,841) ($16,586) ($17,256) ($17,874) ($18,290) ($18,138) ($17,408) ($18,815) ($28,633) ($165,839)
Source: Dobson | DaVanzo estimates

ESTIMATING THE IMPACT OF REPEALING THE ACA ON HOSPITALS REPORT VERSION FINAL | 11 Dobson|DaVanzo
© 2016 Dobson DaVanzo & Associates, LLC. All Rights Reserved.
ACA Reductions to the Hospital Market Basket and Medicare and Medicaid DSH
The ACA also reduced hospital payments through a number of mechanisms. The reductions
in hospital inflation updates and those affecting the Medicare and Medicaid DSH programs
are of particular concern in the context of ACA repeal. The first because these reductions
served to offset the costs of expanded coverage; the second because reductions in coverage
will increase uncompensated care for hospitals. This section focuses on those reductions and
Appendix B details all of the reductions in the ACA.
Market Basket Reductions and Productivity Adjustments
The ACA includes specific reductions to the annual market basket payment rate increases for
acute care, rehabilitation, long-term care, and psychiatric hospitals from 2010 through 2019.
In addition, Section 3401 of the Affordable Care Act (ACA) requires that the market basket
updates under the Medicare prospective payment systems be reduced annually by the
productivity adjustment.
The nature of the payment update adjustments are that they accumulate over time. We
estimate that these reductions will reduce Medicare payments to hospitals by $289.5 billion
over the 2018 to 2026 period. These payment reductions are not restored under H.R. 3762 and
would continue to be incurred by hospitals under ACA repeal.
Medicaid DSH Allotment Reductions
Medicaid DSH payments are made to hospitals and Institutions for Mental Disease (IMDs)
that treat a high proportion of Medicaid and other low-income patients to help offset
uncompensated care costs for Medicaid and uninsured patients treated by these facilities. The
ACA specified scheduled reductions in federal Medicaid DSH allotments in order to account
for the decrease in uncompensated care anticipated under the ACA’s coverage expansions.
Several pieces of legislation have been enacted since 2010 that have delayed, altered and
extended the ACA’s original Medicaid DSH reduction schedule.16 As a result, we estimate
that the current Medicaid DSH allotment reductions would reduce payments to hospitals by
$45.0 billion over the 2018 to 2026 period.
Medicare DSH Payment Reductions
The ACA specifies a change to the formula for determining Medicare DSH payments to
hospitals. Under this new formula, hospitals receive 25 percent of the amount they previously
would have received under the current Medicare DSH formula effective for discharges
16 https://www.macpac.gov/subtopic/disproportionate-share-hospital-payments/
Impact of Repeal on Hospitals
ESTIMATING THE IMPACT OF REPEALING THE ACA ON HOSPITALS REPORT VERSION FINAL | 12 Dobson|DaVanzo
© 2016 Dobson DaVanzo & Associates, LLC. All Rights Reserved.
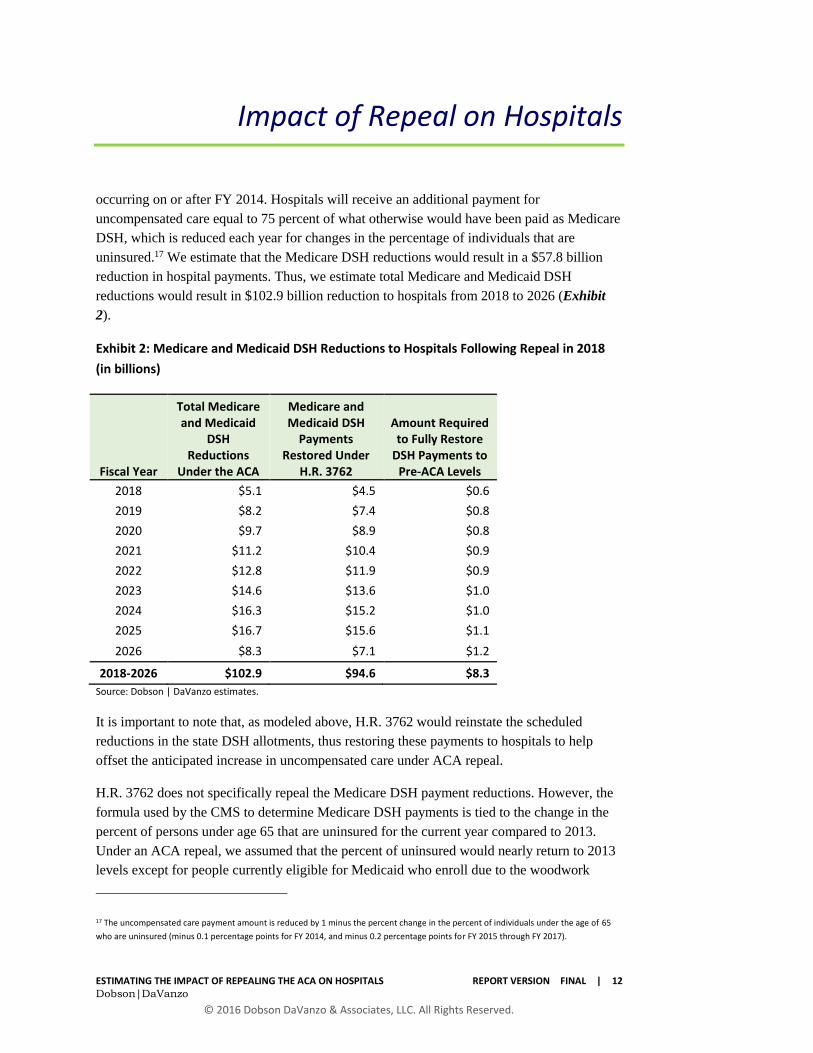
occurring on or after FY 2014. Hospitals will receive an additional payment for
uncompensated care equal to 75 percent of what otherwise would have been paid as Medicare
DSH, which is reduced each year for changes in the percentage of individuals that are
uninsured.17 We estimate that the Medicare DSH reductions would result in a $57.8 billion
reduction in hospital payments. Thus, we estimate total Medicare and Medicaid DSH
reductions would result in $102.9 billion reduction to hospitals from 2018 to 2026 (Exhibit
2).
Exhibit 2: Medicare and Medicaid DSH Reductions to Hospitals Following Repeal in 2018
(in billions)
Fiscal Year
Total Medicare and Medicaid
DSH Reductions
Under the ACA
Medicare and Medicaid DSH
Payments Restored Under
H.R. 3762
Amount Required to Fully Restore
DSH Payments to Pre-ACA Levels
2018 $5.1 $4.5 $0.6
2019 $8.2 $7.4 $0.8
2020 $9.7 $8.9 $0.8
2021 $11.2 $10.4 $0.9
2022 $12.8 $11.9 $0.9
2023 $14.6 $13.6 $1.0
2024 $16.3 $15.2 $1.0
2025 $16.7 $15.6 $1.1
2026 $8.3 $7.1 $1.2
2018-2026 $102.9 $94.6 $8.3
Source: Dobson | DaVanzo estimates.
It is important to note that, as modeled above, H.R. 3762 would reinstate the scheduled
reductions in the state DSH allotments, thus restoring these payments to hospitals to help
offset the anticipated increase in uncompensated care under ACA repeal.
H.R. 3762 does not specifically repeal the Medicare DSH payment reductions. However, the
formula used by the CMS to determine Medicare DSH payments is tied to the change in the
percent of persons under age 65 that are uninsured for the current year compared to 2013.
Under an ACA repeal, we assumed that the percent of uninsured would nearly return to 2013
levels except for people currently eligible for Medicaid who enroll due to the woodwork
17 The uncompensated care payment amount is reduced by 1 minus the percent change in the percent of individuals under the age of 65
who are uninsured (minus 0.1 percentage points for FY 2014, and minus 0.2 percentage points for FY 2015 through FY 2017).

Impact of Repeal on Hospitals
ESTIMATING THE IMPACT OF REPEALING THE ACA ON HOSPITALS REPORT VERSION FINAL | 13 Dobson|DaVanzo
© 2016 Dobson DaVanzo & Associates, LLC. All Rights Reserved.
effect. This would effectively eliminate most of the Medicare DSH reductions. However,
another $8.3 billion would be required to fully restore Medicare and Medicaid DSH
payments to its estimated pre-ACA level of $102.9 billion.
Summary
In modeling the repeal of the ACA as laid out in H.R. 3762, we found that between 2018
and 2026:
The loss of coverage would have a net impact on hospitals of $165.8 billion with
the restoration of Medicaid DSH reductions.
If the ACA Medicare reductions are maintained, hospitals will suffer additional
losses of $289.5 billion from reductions in their inflation updates.
Full restoration of Medicare and Medicaid Disproportionate Share Hospital (DSH)
payment reductions embedded in ACA would amount to $102.9 billion.
Our findings suggest that any repeal bill should also reverse hospital payment reductions,
particularly those for the Medicare and Medicaid DSH programs as well as those to the
inflation updates.

ESTIMATING THE IMPACT OF REPEALING THE ACA ON HOSPITALS REPORT VERSION FINAL | 14 Dobson|DaVanzo
© 2016 Dobson DaVanzo & Associates, LLC. All Rights Reserved.
For this analysis we based our specifications for ACA repeal on H.R. 3762, the Restoring
American’s Healthcare Freedom Reconciliation Act covering the period of 2018 – 2026. To
estimate the financial impact of repealing the Affordable Care Act (ACA) on hospital
revenues and net income, we conducted a five-step approach to estimate changes in hospital
revenues and net income that would result from specific insurance coverage expansion
provisions of the ACA.
These steps aim to use existing projections of changes in insurance coverage under the ACA
to estimate the impact of those coverage changes on hospital costs and revenues over the
2014 through 2026 period. Although some of the ACA coverage provisions began in 2010,
we selected 2014 as a starting point because the major coverage expansions (i.e., Medicaid
expansion and subsidized Marketplace coverage) began in 2014. The Congressional Budget
Office (CBO) estimated that the ACA coverage provisions prior to 2014 reduced the
uninsured by about one million people. The following sections describe each of the five steps
in detail.
Step 1: Determine Changes in Health Insurance Coverage under the ACA
Determining the changes in health insurance coverage under Medicaid and through the
Marketplaces under the ACA is a crucial part of our model construction, because increases in
the number of people who become insured drive reductions in hospital uncompensated care
and generate new revenues to hospitals. The methodology we adopted for this analysis
required us to estimate the number of people who would become newly insured through the
Marketplaces and through Medicaid in states that expanded eligibility under the ACA. The
model also required us to estimate the number of people who would substitute Medicaid or
subsidized Marketplace coverage for commercial coverage (i.e., crowd-out) since hospital
payment levels may be different across these payers. To estimate changes in insurance
coverage under the ACA’s coverage expansions, we relied on estimates by CBO for the
Appendix A - Estimating the Impact of ACA on Hospital Revenues

Appendix A
ESTIMATING THE IMPACT OF REPEALING THE ACA ON HOSPITALS REPORT VERSION FINAL | 15 Dobson|DaVanzo
© 2016 Dobson DaVanzo & Associates, LLC. All Rights Reserved.
period between 2016 and 2026,18 and incorporated the Urban Institute’s recent analysis of the
impact of repealing the ACA.19 The following sections describe our method for developing
these coverage change estimates.
Change in Number of Uninsured
Exhibit A-1 presents our estimates of changes in insurance coverage due to the ACA from
2014 to 2026. The reduction in uninsured is based on CBO estimates from their March 2016
baseline projections for 2016 through 2026. We used earlier estimates from CBO for 2014
and 2015, which were adjusted to be consistent with their latest projections.20 Estimates of
the change in the number of uninsured reflect the difference from the number of people who
would have been uninsured in the absence of the ACA that was due solely to the effects of the
ACA provisions. Recent estimates from the U.S. Bureau of the Census showed an 8.8 million
decline in the number of uninsured between 2013 and 2014 and a 12.8 million decline from
2013 to 2015.21 However, between 2010 and 2013 CBO estimated that the ACA reduced the
number of uninsured by about one million people due to various provisions including early
Medicaid expansion options for states, federal high-risk pools, extending dependent coverage
through age 26, and small employer tax credits. Also, the Bureau of the Census estimates
account for all other factors that may affect coverage in addition to the ACA. Thus, the CBO
estimates differ from the annual changes reported by the Bureau of the Census due to the fact
that CBO measures the change in the uninsured due solely to the accumulated effect of ACA
provisions.
Movement from Commercial Insurance to Medicaid and Marketplace Plans
CBO estimated that 13 million people would move from commercial employer coverage (9
million) and non-group coverage (4 million) into either Medicaid or Marketplace plans by
2021. However, employer coverage has remained stable after the ACA and has actually
increased since 2013.22 Based on these results, the Urban Institute assumed minimal
movement of individuals from commercial to Medicaid or Marketplace plans under the ACA.
The CBO argues that as people gain experience with the Marketplaces and their available
subsidies that more people will choose plans on the Marketplace. Likewise, as employers gain
experience with the Marketplaces and scheduled taxes on high-cost health plans (i.e.,
“Cadillac Tax”) are implemented then employers may be likely to decline offering coverage
18 Congressional Budget Office. Federal Subsidies for Health Insurance Coverage for People under age 65: Tables from CBO’s March 2016 baseline. March 2016.
19 Urban Institute. Buettgens et al. The Cost of ACA Repeal. June 2016.
20 Congressional Budget Office letter to Speaker Boehner, July 24, 2012.
21 Jessica C. Barnett and Marina S. Vornovitsky, “Health Insurance Coverage in the United States: 2015, Current Population Reports”, September 2016
22 Ibid.
Appendix A
ESTIMATING THE IMPACT OF REPEALING THE ACA ON HOSPITALS REPORT VERSION FINAL | 16 Dobson|DaVanzo
© 2016 Dobson DaVanzo & Associates, LLC. All Rights Reserved.
in the future and allow their employees to purchase Marketplace coverage. Finally, persons
purchasing individual non-group coverage can only receive subsidies through the
Marketplaces which provide a substantial incentive to substitute a Marketplace plan for a
non-Marketplace individual plan. Based on this information, we assumed that about 6 million
people would leave their existing plan to enroll in Medicaid or the Marketplace by 2021,
which is lower than CBO’s estimate but higher than the Urban Institute estimate.
We assumed that about one million newly eligible Medicaid enrollees would have
commercial coverage in absence of the expansion (as described below). We assume that the
remaining 5 million people moving from commercial plans would take coverage through the
Marketplaces.
Estimating Medicaid Enrollment under the ACA
CBO estimated that Medicaid enrollment would increase by 13 million in 2016 and grow to
19 million by 2026. They also estimated that Medicaid enrollment for persons newly eligible
in states that expanded coverage would be 11 million in 2016 growing to 15 million by 2026.
For this analysis, we assumed that the difference between these two numbers would represent
enrollment for people currently eligible for Medicaid (i.e. “Woodwork effect”). The
woodwork enrollment population is considered to be affected by the ACA due to the
increased awareness of Medicaid and the “no wrong door” policy of the Marketplaces that
coordinate with state Medicaid agencies to enroll eligible people into Medicaid when they
apply through the Marketplaces. We assumed that all woodwork enrollees were previously
uninsured.
For the newly eligible Medicaid population, we made two adjustments to CBO’s estimates.
First, CBO assumed that additional states would opt to expand coverage in the future. We
assumed that only the 31 states plus the District of Columbia that have adopted the Medicaid
expansion by 2016 would continue and did not attempt to infer which states might expand in
the future. Second, since we reduced the number of people CBO estimated that would move
from commercial plans into Medicaid or Marketplace plans during the projection period, we
reduced Medicaid enrollment accordingly.
For the newly eligible Medicaid population, we assumed a crowd-out rate of 10 percent based
on Dague’s 2012 study of BadgerCarePlus for 2016,23 and applied this throughout the study
period. The crowd-out assumption implies that 10 percent of the newly eligible Medicaid
enrollees would have been covered by a commercial plan in the absence of the Medicaid
23 Dague. Estimates of Crowd-out from a Public Health Insurance Expansion Using Administrative Data. NBER Working Paper Series. May 2011.

Appendix A
ESTIMATING THE IMPACT OF REPEALING THE ACA ON HOSPITALS REPORT VERSION FINAL | 17 Dobson|DaVanzo
© 2016 Dobson DaVanzo & Associates, LLC. All Rights Reserved.
expansion. Exhibit A-1 presents the projection of Medicaid enrollees that is used for the
study.
Estimating Enrollment on the Marketplaces
Based on recent 2016 open enrollment period data, the Urban Institute estimated that the
subsidized enrollment on the marketplace is just over 9 million people. Their projection was
similar to CBO’s estimate of 10 million in subsidized marketplace coverage. However, CBO
estimated a significant increase in future enrollment on the Marketplaces due to the number of
people that they assumed would move from commercial insurance into Medicaid and the
Marketplaces. The Urban Institute, on the other hand, predicted insignificant growth in the
Marketplace coverage after 2016. For this analysis, we used the Urban Institute’s more
conservative estimate of lower enrollment growth on the Marketplaces and lower reductions
in employer-based coverage.
As described above, we assume that 5 million people would move from commercial plans to
take coverage through the Marketplaces. We also assume that most of these 5 million
individuals would have moved from a non-group plan due to the subsidies that are available
only in the Marketplaces. Exhibit A-1 presents the projection of Marketplace enrollees that is
used for the study.

ESTIMATING THE IMPACT OF REPEALING THE ACA ON HOSPITALS REPORT VERSION FINAL | 18 Dobson|DaVanzo
© 2016 Dobson DaVanzo & Associates, LLC. All Rights Reserved.
Exhibit A-1: Changes in Health Insurance Coverage under the ACA 2014-2026 (in millions)
2014 2015 2016 2017 2018 2019 2020 2021 2022 2023 2024 2025 2026
Change in Uninsured Under the ACA -12 -16 -22 -24 -23 -23 -23 -23 -24 -24 -24 -24 -24
Total Number Moved from Commercial 3 4 4 6 6 6 6 6 6 6 6 6 6
Change in Medicaid and CHIP 6 8 13 14 14 14 15 15 15 15 15 15 15
Newly Eligible Group 5 7 11 11 12 12 12 11 12 11 11 12 11
Newly Insured 4 6 10 10 10 10 10 9 10 10 10 10 10
Moved from Commercial 1 1 1 1 1 1 1 1 1 1 1 1 1
Currently Eligible (Woodwork) 1 1 2 3 2 2 3 4 3 4 4 3 4
Enrollment on Health Insurance Marketplaces 9 12 13 16 16 16 15 15 16 15 15 16 15
Newly Insured 7 9 10 11 11 11 10 10 11 10 10 11 10
Moved from Commercial 2 3 3 5 5 5 5 5 5 5 5 5 5
Sources: Estimates were based on CBO's estimates of the effects of the ACA on health insurance coverage for people under age 65 - (See CBO. Federal Subsidies for Health
Insurance Coverage for People under Age 65: Tables for CBO's March 2016 Baseline; and CBO. Elmendorf. Letter to Boehner. July 24, 2012); and Urban Institute's recent
estimates of new enrollment on the Marketplaces - (See Buettgens et al. The Cost of ACA Repeal. Urban Institute. June 2016). Totals may not sum due to rounding.

Appendix A
ESTIMATING THE IMPACT OF REPEALING THE ACA ON HOSPITALS REPORT VERSION FINAL | 19 Dobson|DaVanzo
© 2016 Dobson DaVanzo & Associates, LLC. All Rights Reserved.
Step 2: Estimate Hospital Costs Associated with the Newly Insured
At the time of this report, data on hospital costs associated with the newly insured was
unavailable. Therefore, to estimate hospital costs for newly insured individuals, we examined
several data sources and methods. The first method builds up costs based on hospital
uncompensated care costs and applies assumed increases in hospital utilization as people
become insured. The second method uses hospital utilization and payments for an employer
sponsored insurance (ESI) population adjusted to match the demographic mix of the newly
insured and converts payments to costs.
Cost Build Up From Uncompensated Care Data
This method required a multi-step process. First, we estimated the reduction in hospital
uncompensated care costs at the national level based using a model developed by ASPE that
estimates the change in hospital uncompensated care costs based on changes in the number of
uninsured and the number of Medicaid enrollees (DeLeire et al.).24 Using this model, we
estimated the reduction in hospital uncompensated care between 2014 and 2026, accounting
for the projected change in the number of uninsured and the number of Medicaid enrollees.
Since total hospital uncompensated care is associated with both insured and uninsured
patients, this model provides a measure of costs associated only with the newly insured
population while they were uninsured. The model estimated that the ACA would result in a
reduction of $324 billion in hospital uncompensated care costs between 2014 and 2026
(Exhibit A-2).
This total amount results in a reduction in hospital uncompensated care costs of $937 per
newly insured person in 2016 ($20.6 billion/22 million people). However, not all hospital
care for the uninsured is free care. We assume that about 27 percent of hospital care for the
uninsured was paid out of pocket, according to an earlier study by the Institute of Medicine. 25
Thus, we estimate that initial hospital costs for this population while uninsured would be
$1,278 per person.
24 ASPE Issue Brief. DeLeire et al. Impact of Insurance Expansion on Hospital Uncompensated Care Costs in 2014. Sept 2014.
25 Institute of Medicine (US) Committee on the Consequences of Uninsurance. Hidden Costs, Values Lost: Uninsurance in America. Washington (DC): National Academies Press (US); 2003. 3, Spending on Health Care for Uninsured Americans: How Much, and Who Pays? Available from: http://www.ncbi.nlm.nih.gov/books/NBK221653/

Appendix A
ESTIMATING THE IMPACT OF REPEALING THE ACA ON HOSPITALS REPORT VERSION FINAL | 20 Dobson|DaVanzo
© 2016 Dobson DaVanzo & Associates, LLC. All Rights Reserved.
Exhibit A-2: Estimated Reduction in Hospital Uncompensated Care Costs for Newly Insured
2014-2026
Year
Estimated Reduction in Hospital Uncompensated
Care (in billions)
2014 $5.7
2015 $14.6
2016 $20.6
2017 $23.0
2018 $23.2
2019 $23.9
2020 $26.4
2021 $28.1
2022 $29.3
2023 $31.0
2024 $31.7
2025 $32.4
2026 $34.3
Total 2014-26 $324.2 Sources and Notes: Projections of change in hospital uncompensated care at the national level under the ACA were based
on ASPE's 2014 study – DeLeire et al. Impact of Insurance Expansion on Hospital Uncompensated Care Costs. Sept 2014.
Inflation factors are based on CMS' projections of market basket index for period 2014-2025, with the 2025 rate being
assumed to continue into 2026.
Newly insured persons are expected to increase their utilization of hospital services. There
have been a number of studies that have estimated the potential utilization increase as
uninsured persons become insured. For this analysis, we relied on the results of analyses by
McKinsey as the basis for our assumption for the newly insured’s utilization increase.26 We
then used a distribution ratio of service utilization, calculated based on the Price
Waterhouse’s capitation rate setting for 2014,27 to aggregate the service level utilization
increase estimates to a single utilization increase ratio of 44% across all sites of care (Exhibit
A-3). Thus, the per person costs is calculated as $1,278 x 1.44 = $1,839.
26 Levine et al. The Impact of Coverage Shifts on Hospital Utilization. McKinsey. May 2013. The McKinsey, in 2013, conducted a study of existing literature on change in the newly insured’ utilization behavior, and then built their own model to estimate potential utilization increases by type of service (i.e., inpatient, outpatient, and emergency) as the uninsured gain their coverage.
27 PWC. Commonwealth of Virginia. Department Of Medical Assistance Services. Medallion 3.0. Data Book and Capitation Rates Fiscal Year 2015: Rates Effective July 1, 2014.

Appendix A
ESTIMATING THE IMPACT OF REPEALING THE ACA ON HOSPITALS REPORT VERSION FINAL | 21 Dobson|DaVanzo
© 2016 Dobson DaVanzo & Associates, LLC. All Rights Reserved.
Exhibit A-3: Estimated Increase in Hospital Utilization for the Newly Insured
Type of Service Projected Increase in
Utilization 1
Proportion of Revenue by Type
of Service 2
Hospital Inpatient 35% 0.48
Emergency Department 15% 0.26
Hospital Outpatient 87% 0.27
Weighted Average Utilization Increase Estimate 44%
1) Levine et al. The Impact of Coverage Shifts on Hospital Utilization. McKinsey. May 2013;
2) PWC. Commonwealth of Virginia. Department Of Medical Assistance Services. Medallion 3.0. Data Book and
Capitation Rates Fiscal Year 2015: Rates Effective July 1, 2014.
Estimating Cost Based on an ESI Population
To estimate costs using this method, we used summary data from the Health Care Cost and
Utilization Project for 2014.28 This report provided per-capita hospital spending amounts
(hospital inpatient and outpatient, including emergency room) for an employer-sponsored
insurance (ESI) population in 2014 by age group. We applied these per-capita amounts to
estimates of the newly insured by age from the Urban Institute study (described above) to
estimate a per-capita amount specific to the demographic distribution of the newly insured.
We then adjusted the spending to reflect costs using 2014 hospital private payer payment-to-
cost ratios (143.7%) and inflated to 2016 by hospital market basket inflation from 2014 to
2016. This method yielded a cost per person of $1,724 for 2016 which is roughly comparable
to our estimate using the uncompensated care build-up method of $1,839 (Exhibit A-4).
28 Health Care Cost Institute (HCCI), “2014 Health Care Cost and Utilization Report”, October 2015

Appendix A
ESTIMATING THE IMPACT OF REPEALING THE ACA ON HOSPITALS REPORT VERSION FINAL | 22 Dobson|DaVanzo
© 2016 Dobson DaVanzo & Associates, LLC. All Rights Reserved.
Exhibit A-4: Estimated Hospital Cost Per Newly Insured Person
Age Group
Hospital Spending Per Capita 2014 1
Age Distribution of Newly Insured
People2
Under 18 $1,257 13%
19-25 $1,386 18%
26-44 $2,033 40%
45-54 $3,072 17%
55-64 $4,713 13%
Total $2,353 100%
Reduced to Costs (143.7 PTC) 3 $1,638
Inflated 2014 to 2016 (5.3%) 4 $1,724 1/ Health Care Cost Institute (HCCI), “2014 Health Care Cost and Utilization Report”, October 2015
2/ Urban Institute. Buettgens et al. The Cost of ACA Repeal. June 2016
3/ American Hospital Association, “Trendwatch Chartbook 2016: Trends Affecting Hospitals and Health Systems”
4/ https://www.cms.gov/Research-Statistics-Data-and-Systems/Statistics-Trends-and-
Reports/MedicareProgramRatesStats/MarketBasketData.html
For this analysis, we used the results from the uncompensated care cost build-up method to
estimate the impact of the ACA on hospitals or $1,839 in 2016. This method provided us with
an estimate of total hospital costs for this population as well as an estimate of the costs
associated with their increased utilization of hospitals services which is necessary for
determining the additional costs hospitals will incur for treating these patients.
Adjustment for Pent-up Demand for Health Care Service
Pent-up demand is defined as a spike in the demand for health care that occurs after obtaining
insurance because of delaying or foregoing care while uninsured or underinsured.29 Actuaries
have typically included an estimate of pent-up demand in their rating for new Marketplace
enrollees. The theory is that after a period of lack of access to health insurance, members
would immediately seek care at a rate that exceeded the use of care by members who had
continuous access to health insurance, even after adjusting for other factors such as morbidity
and demographics.30
Findings on pent-up demand for health care have been somewhat mixed, but seem to share
the common fact that pent-up demand is transitory (i.e., would decline after a certain time
following enrollment and become comparable to the demand of members experiencing
29 Fertig et al. Pent-up Health Care Demand among New Medicaid Enrollees after the Affordable Care Act. 2016.
30 Owen et al. Society of Actuaries. Indications of Pent-up Demand. New ACA enrollee use of preference-sensitive services. April 2015.

Appendix A
ESTIMATING THE IMPACT OF REPEALING THE ACA ON HOSPITALS REPORT VERSION FINAL | 23 Dobson|DaVanzo
© 2016 Dobson DaVanzo & Associates, LLC. All Rights Reserved.
continuous coverage).31,32 This phase-out period could range from 3 months in the case of
Indiana’s Medicaid Expansion;33,34 to 6 months in Minnesota’s Medicaid Expansion;35 or one
year in California’s Medicaid Expansion,36 and as reported by the Robert Johnson
Foundation.37
A number of studies reported that pent-up demand was insignificant among people who
enrolled in the public Marketplaces in 2014,38 Medicaid beneficiaries, 39 and even among the
uninsured near elderly who were approaching Medicare eligibility. 40 It was also found that
pent-up demand seemed to exist for physician care, but not for hospital inpatient care,41 and
that the newly insured were more likely to use preference-sensitive treatment, but the impact
of overall cost increase was marginal.42
Some studies yielded different results. Blue Cross Blue Shield (BCBS)’s study of utilization
of medical services among newly enrolled BCBS members versus previously enrolled
members and commercial insurance individuals for the period of 2014-2015 revealed that
pent-up demand averaged 38 percent for inpatient care, 10 percent for emergency, and 10
percent for outpatient services.43 In addition, Milliman, in their actuarial assessment of the
Medicaid Expansion in Indiana, estimated that newly insured individuals could incur an
approximate increase of 20 percent in overall spending and between 20 and 40 percent in
hospital inpatient and outpatient.44
As studies to date on the pent-up demand among ACA’s new coverage, which show such a
wide range of estimates, could be constrained by the lack of data and the inadequate
timeframe for observation following ACA implementation, we believe we might not yet have
31 Owen et al. Society of Actuaries. Indications of Pent-up Demand. New ACA enrollee use of preference-sensitive services. April 2015.
32 Lo et al. 2014. Increased Service Use Following Medicaid Expansion is Mostly Temporary: Evidence from California’s Low Income Health Program. UCLA Center for Health Policy Research.
33 Rob Damler. Society of Actuaries. Health Watch. October 2013 – Issue 73.
34 Rob Damler. Milliman. Experience under the Healthy Indiana Plan: The short-term cost challenges of expanding coverage to the uninsured. August 2009.
35 Fertig et al. Pent-up Health Care Demand among New Medicaid Enrollees after the Affordable Care Act. 2016.
36 Lo et al. 2014. Increased Service Use Following Medicaid Expansion is Mostly Temporary: Evidence from California’s Low Income Health Program. UCLA Center for Health Policy Research.
37 Robert Wood Johnson Foundation. Issue Brief. Health Plans Prepare for Pent-up Demand under Medicaid Expansion. November 2014.
38 Beth Umland. Pent-up Demand for Care Not There. Mercer Signal. Jan 20, 2015. http://ushealthnews.mercer.com/article/312/pent-up-demand-for-care-not-there.
39 Fertig et al. Pent-up Health Care Demand among New Medicaid Enrollees after the Affordable Care Act. 2016.
40 Chen et al. (2004). Pent-up Demand: Health Care Use of the Uninsured near Elderly. Economic Research Initiative on the Uninsured. July 2004.
41 Chen et al. (2004). Pent-up Demand: Health Care Use of the Uninsured near Elderly. Economic Research Initiative on the Uninsured. July 2004.
42 Owen et al. Society of Actuaries. Indications of Pent-up Demand. New ACA enrollee use of preference-sensitive services. April 2015. 43 Blue Cost Blue Shield. The Health of America Report. Newly Enrolled Members in the Individual Health Insurance Market After Health
Care Reform: The Experience from 2014 and 2015. March 2016.
http://www.bcbs.com/healthofamerica/newly_enrolled_individuals_after_aca.pdf
44 Rob Damler. Society of Actuaries. Health Watch. October 2013 – Issue 73.

Appendix A
ESTIMATING THE IMPACT OF REPEALING THE ACA ON HOSPITALS REPORT VERSION FINAL | 24 Dobson|DaVanzo
© 2016 Dobson DaVanzo & Associates, LLC. All Rights Reserved.
an accurate and full picture of the impact of the ACA on the newly insured’s spending
behavior and pent-up demand, in particular. We decided to adopt a rate of 24 percent in pent-
up demand for all hospital care among all of the newly insured. This pent-up demand estimate
was calculated as a weighted average based on the Blue Cross Blue Shield (BCBS)’s study of
utilization of medical services among their newly enrolled members over a one year period.45
Given the transitory nature of pent-up demand, we assumed that this 24 percent utilization
surge would only persist for the first 12 months following enrollment in our model.
Calculating Total Hospital Costs for the Newly Insured
For this analysis, we assume that newly insured Medicaid and Marketplace enrollees have
similar risk profiles and incur similar per-capita hospital cost. Therefore, total hospital costs
associated with newly insured individuals is calculated as the number of newly insured
multiplied by the average annual hospital cost. Based on these assumptions, we estimate that
total hospital costs associated with the newly insured would be $643.0 billion over the 2014
to 2026 period (Exhibit A-5).
A portion of these costs for newly insured persons are already being incurred by hospitals
through uncompensated care, but hospitals will now receive payment for that care. However,
as the newly insured increase their utilization of hospital services, this new utilization will
result in additional costs to hospitals in order to provide this additional care. We estimated the
incremental cost to hospitals resulting from utilization increase and pent-up demand. These
will be new costs incurred by hospitals of treating this population and thus will have an
impact on hospital net income.
As described above, we assumed that the newly insured would increase their use of hospital
services similar to the level of an insured person, which would result in a 44 percent increase.
In addition we assume that there will be a level of higher use during their first year of
coverage due to pent-up demand for certain hospital services. We estimated that hospitals’
total incremental costs from serving newly insured individuals under ACA implementation
could approximate $200.7 billion between 2014 and 2026. (Exhibit A-5). These additional
costs incurred by hospitals are subtracted from new revenues for newly insured to calculate
net income.
45 Blue Cost Blue Shield. The Health of America Report. Newly Enrolled Members in the Individual Health Insurance Market after Health Care Reform: The Experience from 2014 and 2015. March 2016. http://www.bcbs.com/healthofamerica/newly_enrolled_individuals_after_aca.pdf

ESTIMATING THE IMPACT OF REPEALING THE ACA ON HOSPITALS REPORT VERSION FINAL | 25 Dobson|DaVanzo
© 2016 Dobson DaVanzo & Associates, LLC. All Rights Reserved.
Exhibit A-5: Estimate of Hospital Costs Associated with the Newly Insured and the Incremental Cost due to Increased Utilization and Pent-up Demand (in millions)
2014 2015 2016 2017 2018 2019 2020 2021 2022 2023 2024 2025 2026 2014-2026
Hospital Costs for Newly Insured (millions)
New Enrollment on Marketplaces $7,709 $16,767 $18,882 $20,960 $21,796 $22,402 $22,551 $23,974 $26,743 $25,474 $26,058 $29,618 $28,022 $290,956
Newly Eligible Medicaid $4,224 $11,353 $19,378 $18,833 $19,815 $20,365 $22,551 $21,576 $24,347 $25,219 $25,797 $26,574 $28,022 $268,055
Currently Eligible Medicaid (Woodwork) $1,090 $1,884 $3,915 $5,650 $3,963 $4,073 $6,765 $9,590 $7,304 $10,190 $10,423 $7,972 $11,209 $84,028
Total Costs for Newly Insured $13,024 $30,004 $42,175 $45,443 $45,574 $46,840 $51,868 $55,140 $58,394 $60,883 $62,278 $64,164 $67,253 $643,039
Cost Due to Increased Utilization and Pent-up Demand
New Hospital Costs due to Increased Utilization for Newly Insured (millions)
New Enrollment on Marketplaces $3,106 $5,524 $5,971 $6,585 $6,647 $6,832 $6,878 $7,312 $8,429 $7,769 $7,947 $9,336 $8,546 $90,882
Newly Eligible Medicaid $1,702 $3,899 $6,722 $5,765 $6,043 $6,211 $6,878 $6,580 $7,699 $7,692 $7,868 $8,135 $8,546 $83,740
Currently Eligible Medicaid (Woodwork) $439 $647 $1,358 $1,730 $1,209 $1,242 $2,063 $2,925 $2,310 $3,108 $3,179 $2,440 $3,419 $26,068
Incremental Costs for Newly Insured $5,248 $10,070 $14,051 $14,080 $13,899 $14,285 $15,819 $16,817 $18,437 $18,568 $18,994 $19,911 $20,511 $200,690 Source: Dobson | DaVanzo estimates

Appendix A
ESTIMATING THE IMPACT OF REPEALING THE ACA ON HOSPITALS REPORT VERSION FINAL | 26 Dobson|DaVanzo
© 2016 Dobson DaVanzo & Associates, LLC. All Rights Reserved.
Step 3: Estimate change in hospital revenues for the newly insured
We calculated new hospital revenues associated with the newly insured by multiplying the
annual costs for this population by the average payment to cost ratio (PCR) depending upon
the program in which they enrolled.
For the newly insured covered under Medicaid, we assumed hospitals would be paid at
Medicaid rates, which are typically less than the cost of treating these patients. Our Medicaid
PCRs were calculated from CMS’ Medicare hospital cost report 2014 (Worksheet S-10) for
acute, rehabilitation and long-term care hospitals. We excluded Medicaid DSH, since these
additional payments would not be made for the expansion population. However, we included
Medicaid supplemental payments assuming these additional payments would be made for
new enrollees.46 Since a national average PCR would be heavily weighted toward expansion
states, we computed a weighted average using the estimated costs for Medicaid enrollees
(newly eligible and woodwork population) by state based on our model. We then projected
the Medicaid PCRs through 2026 using the historical change in Medicaid PCRs between
2010 and 2014 from the AHA Trend Watch Chart Book as shown in Exhibit A-6.
Commercial payment to cost ratios (PCRs) were obtained from the AHA Trend Watch Chart
Book, which were determined to be 143.7 percent in 2014.47 For this analysis, we assume that
most people moving from commercial plans into either Medicaid or Marketplace plans would
move from individual non-group insurance. We projected these PCRs through 2026 using the
average annual change in Commercial PCRs between 2004 and 2014.
We assumed that PCRs for Marketplace plans are lower than Commercial rates, but higher
than Medicaid reimbursement. A recent analysis of unsubsidized Marketplace plan premiums
found them to be about 10 percent lower than premiums in commercial employer-based plans
after adjusting for age, actuarial value of the plans and utilization.48 As a matter of fact, since
insurers have been competing by lowering payments to providers, providers have to make up
the difference by increased patient volume due to narrow networks, thereby reducing the cost
of the plans.49,50 Also the medical loss ratio for non-group plans (80%) is lower than for
employer plans (85%), meaning that for each premium dollar, non-group plans can spend less
46 We calculated Medicaid PTCs with and without DSH and Supplemental payments (DSH and supplemental payments are counted as a single category in the cost reports) by including only hospitals that reported not receiving DSH or Supplemental payments or reported these payments separately from regular Medicaid payments. We then estimated PCRs including supplemental payments by interpolating between PCRs with and without DSH and supplemental payments using the ratio of supplemental payments to total DSH and supplemental payments by state from the Medicaid Financial Management Report for FY 2014.
47 American Hospital Association, “Trendwatch Chartbook 2016: Trends Affecting Hospitals and Health Systems”
48 Blumberg, Holahan, Wengle, “Are Nongroup Marketplace Premiums Really High? Not in Comparison with Employer Insurance”, September 2016.
49 Rabin. Doctors Complain They Will Be Paid Less by Exchange Plans. Kaiser Health News. Nov 19, 2013.
50 Couture. Health Care Providers Are Opting Out of Obamacare Exchange Plans. American Action Forum. Oct 27, 2014.

Appendix A
ESTIMATING THE IMPACT OF REPEALING THE ACA ON HOSPITALS REPORT VERSION FINAL | 27 Dobson|DaVanzo
© 2016 Dobson DaVanzo & Associates, LLC. All Rights Reserved.
on provider payments than employer plans. For this analysis, we assume that these premium
differences have a direct effect on provider payment levels. Therefore, we reduced the
commercial PCR by 15 percent for each year of the study period to better reflect hospital
payment levels by Marketplace plans. This assumption is also consistent with CBO’s recent
analysis when it projected hospitals’ profit margins under different payment reduction
scenarios.51
Exhibit A-6: Hospital Payment to Cost Ratios by Payer 2014-2026
Year Commercial Non-Group
Medicaid (Expansion States' PCRs) without DSH
Health Insurance
Marketplaces
2014 143.7% 79.4% 120.9%
2015 144.6% 79.6% 121.6%
2016 145.5% 79.9% 122.4%
2017 146.4% 80.1% 123.2%
2018 147.4% 80.3% 123.9%
2019 148.3% 80.6% 124.7%
2020 149.2% 80.8% 125.5%
2021 150.2% 81.0% 126.3%
2022 151.1% 81.3% 127.1%
2023 152.1% 81.5% 127.9%
2024 153.0% 81.7% 128.7%
2025 154.0% 81.9% 129.5%
2026 155.0% 82.2% 130.3% Sources: American Hospital Association, “Trendwatch Chartbook 2016: Trends Affecting Hospitals
and Health Systems” and Dobson | DaVanzo estimates using the FY 2014 Medicare Hospital Cost
Report data.
Hospital revenues for newly insured Medicaid enrollees were calculated by multiplying the
annual hospital costs associated with this population by the average Medicaid PCR for
expansion states. Similarly, hospital revenues for the newly insured Marketplace enrollees
was calculated by multiplying the annual hospital costs associated with the newly insured
Marketplace population by our assumed Marketplace PCR.
Hospital revenues for the newly insured Marketplace enrollees assume that some portion of
their utilization would result in bad debt due to the fact that most Marketplace enrollees
51 Congressional Budget Office. Hayford et al. Projecting Hospitals’ Profit Margins under Several Illustrative Scenarios. Sept 2016.

Appendix A
ESTIMATING THE IMPACT OF REPEALING THE ACA ON HOSPITALS REPORT VERSION FINAL | 28 Dobson|DaVanzo
© 2016 Dobson DaVanzo & Associates, LLC. All Rights Reserved.
choose either the Silver or Bronze plans, which are high deductible plans. We estimated that
high deductibles would account for approximately 30% of the average cost of an inpatient
stay and that about 40% of patient responsibilities in high deductible health plans would be
written off as bad debt.52 Thus, we assume that 12% (30% deductible as percent of stay X
40% bad debt) of costs for newly insured enrollees on the Marketplaces would result in bad
debt.
Step 4: Estimate the impact of movement from commercial insurance to Medicaid
and Marketplaces at the national level (Crowd-out)
As described above, our analysis assumes that there will be about 6 million people by 2017
that move from their current commercial plans into either Medicaid or the Marketplaces (i.e.,
“crowd-out”). The impact on hospital revenues due to crowd-out is calculated as the
difference in PCRs between commercial insurance versus Medicaid and Marketplace plans,
multiplied by the estimated hospital costs for this population. We estimate that crowd-out
would lower hospital revenues by approximately $51.6 billion during the period between
2014 and 2026 (Exhibit A-7).
52 Estimates are from Monte Medical Center: “White Paper on the Impact of Consumer Directed Healthcare on Providers”. Oct 2008.

ESTIMATING THE IMPACT OF REPEALING THE ACA ON HOSPITALS REPORT VERSION FINAL | 29 Dobson|DaVanzo
© 2016 Dobson DaVanzo & Associates, LLC. All Rights Reserved.
Exhibit A-7: Estimate of Change in Hospital Revenues Due to Crowd-out
2014 2015 2016 2017 2018 2019 2020 2021 2022 2023 2024 2025 2026 2014-2026
New Enrollment on Marketplaces
Number Moved from Commercial (millions) 2 3 3 5 5 5 5 5 5 5 5 5 5
Average cost per person $937 $1,780 $1,839 $1,880 $1,981 $2,037 $2,255 $2,397 $2,395 $2,547 $2,606 $2,653 $2,802
Marketplace PCR 121% 122% 122% 123% 124% 125% 126% 126% 127% 128% 129% 130% 130%
Revenues at Marketplace Levels (mill) $2,298 $5,649 $6,528 $11,578 $11,788 $12,192 $13,586 $15,140 $14,614 $15,965 $16,434 $17,182 $18,263
Commercial non-group PCR 144% 145% 146% 146% 147% 148% 149% 150% 151% 152% 153% 154% 155%
Revenues at Commercial Levels (mill) $2,733 $6,717 $7,762 $13,767 $14,016 $14,497 $16,154 $18,002 $17,377 $18,984 $19,541 $20,430 $21,715
Change in Revenues (millions) ($434) ($1,068) ($1,234) ($2,189) ($2,229) ($2,305) ($2,569) ($2,862) ($2,763) ($3,018) ($3,107) ($3,248) ($3,453) ($30,480)
Change in Medicaid and CHIP
Number Moved from Commercial (millions) 1 1 1 1 1 1 1 1 1 1 1 1 1
Average cost per person $937 $1,780 $1,839 $1,880 $1,981 $2,037 $2,255 $2,397 $2,395 $2,547 $2,606 $2,653 $2,802
Medicaid PCR 79% 80% 80% 80% 80% 81% 81% 81% 81% 81% 82% 82% 82%
Revenues at Medicaid Levels (mill) $744 $1,417 $1,616 $1,506 $1,910 $1,969 $2,186 $1,942 $2,336 $2,283 $2,342 $2,174 $2,303
Commercial non-group PCR 144% 145% 146% 146% 147% 148% 149% 150% 151% 152% 153% 154% 155%
Revenues at Commercial Levels (mill) $1,346 $2,574 $2,944 $2,753 $3,504 $3,624 $4,039 $3,600 $4,344 $4,262 $4,387 $4,086 $4,343
Change in Revenues (millions) ($602) ($1,156) ($1,328) ($1,247) ($1,594) ($1,655) ($1,852) ($1,658) ($2,009) ($1,978) ($2,045) ($1,912) ($2,040) ($21,077)
Change in Hospital Revenues due to Crowd-out (Millions) ($1,037) ($2,224) ($2,562) ($3,436) ($3,823) ($3,960) ($4,421) ($4,520) ($4,772) ($4,997) ($5,152) ($5,160) ($5,493) ($51,557)
Note: 2014 cost per person estimates reflect partial year coverage.
Source: Dobson | DaVanzo estimates

Appendix A
ESTIMATING THE IMPACT OF REPEALING THE ACA ON HOSPITALS REPORT VERSION FINAL | 30 Dobson|DaVanzo
© 2016 Dobson DaVanzo & Associates, LLC. All Rights Reserved.
Step 5: Estimate impact on hospital revenues and net income due to the ACA
Using the above information on changes in hospital revenue due to the newly insured,
changes in hospital revenue due to crowd-out, and increased costs to hospitals due to new
utilization we estimated the net impact on hospital revenue and net income due to the
coverage provisions of the ACA. The impacts presented here do not take into account the
Medicare payment reductions specified in the ACA nor the Medicaid DSH reductions.
Estimates of these impacts are presented in the following section.
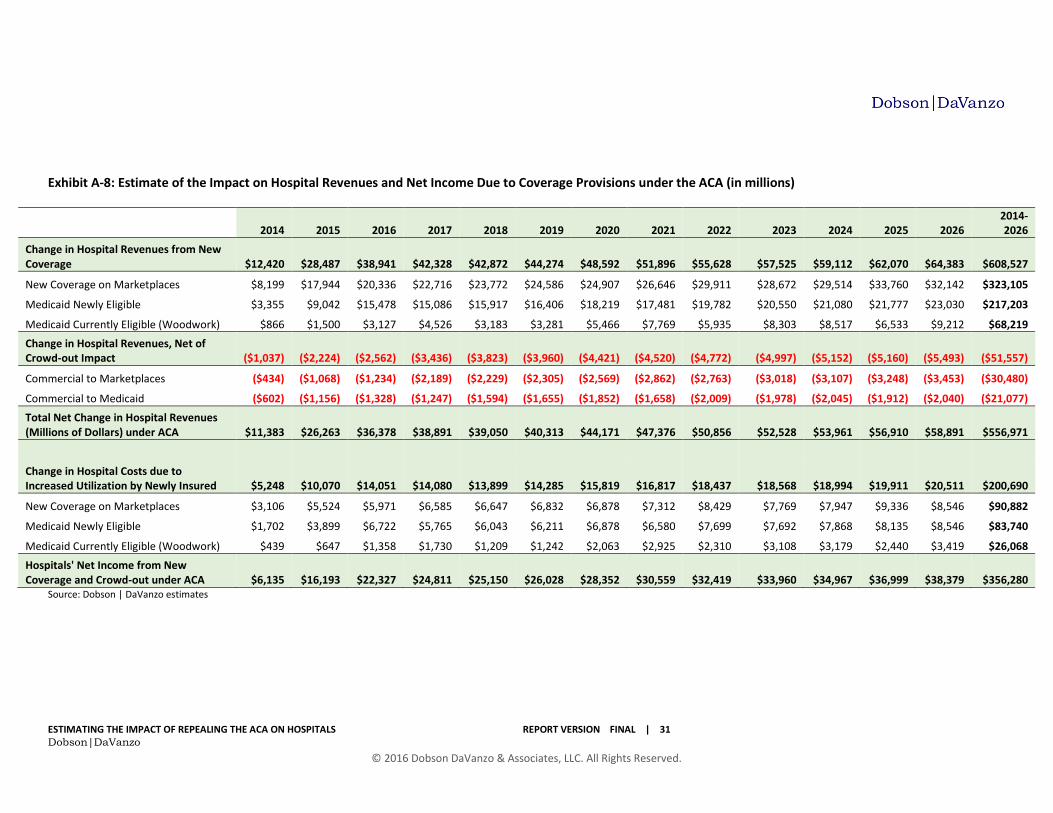
Exhibit A-8 shows the increase in hospital revenues from patients who become newly insured
through the Marketplaces and Medicaid, which we estimate will total $608.5 billion over the
2014 to 2026 period. We estimate the impact of crowd-out as persons move from commercial
coverage into Medicaid and Marketplace plans, which we assume will reimburse hospitals at
lower rates, will result in a reduction of $51.6 billion over the same period. Thus, the net
effect on hospital revenues we estimate will be $557.0 billion increase over the 2014 to 2026
period.
As described above, we assume that hospitals will incur additional costs of $200.7 billion as
the newly insured increase their utilization of hospital services. The difference between new
revenues received by hospitals and the increased costs results in an increase of $356.3 billion
in hospital net income over the 2014 to 2026 period.
ESTIMATING THE IMPACT OF REPEALING THE ACA ON HOSPITALS REPORT VERSION FINAL | 31 Dobson|DaVanzo
© 2016 Dobson DaVanzo & Associates, LLC. All Rights Reserved.
Exhibit A-8: Estimate of the Impact on Hospital Revenues and Net Income Due to Coverage Provisions under the ACA (in millions)
2014 2015 2016 2017 2018 2019 2020 2021 2022 2023 2024 2025 2026 2014-2026
Change in Hospital Revenues from New Coverage $12,420 $28,487 $38,941 $42,328 $42,872 $44,274 $48,592 $51,896 $55,628 $57,525 $59,112 $62,070 $64,383 $608,527
New Coverage on Marketplaces $8,199 $17,944 $20,336 $22,716 $23,772 $24,586 $24,907 $26,646 $29,911 $28,672 $29,514 $33,760 $32,142 $323,105
Medicaid Newly Eligible $3,355 $9,042 $15,478 $15,086 $15,917 $16,406 $18,219 $17,481 $19,782 $20,550 $21,080 $21,777 $23,030 $217,203
Medicaid Currently Eligible (Woodwork) $866 $1,500 $3,127 $4,526 $3,183 $3,281 $5,466 $7,769 $5,935 $8,303 $8,517 $6,533 $9,212 $68,219
Change in Hospital Revenues, Net of Crowd-out Impact ($1,037) ($2,224) ($2,562) ($3,436) ($3,823) ($3,960) ($4,421) ($4,520) ($4,772) ($4,997) ($5,152) ($5,160) ($5,493) ($51,557)
Commercial to Marketplaces ($434) ($1,068) ($1,234) ($2,189) ($2,229) ($2,305) ($2,569) ($2,862) ($2,763) ($3,018) ($3,107) ($3,248) ($3,453) ($30,480)
Commercial to Medicaid ($602) ($1,156) ($1,328) ($1,247) ($1,594) ($1,655) ($1,852) ($1,658) ($2,009) ($1,978) ($2,045) ($1,912) ($2,040) ($21,077)
Total Net Change in Hospital Revenues (Millions of Dollars) under ACA $11,383 $26,263 $36,378 $38,891 $39,050 $40,313 $44,171 $47,376 $50,856 $52,528 $53,961 $56,910 $58,891 $556,971
Change in Hospital Costs due to Increased Utilization by Newly Insured $5,248 $10,070 $14,051 $14,080 $13,899 $14,285 $15,819 $16,817 $18,437 $18,568 $18,994 $19,911 $20,511 $200,690
New Coverage on Marketplaces $3,106 $5,524 $5,971 $6,585 $6,647 $6,832 $6,878 $7,312 $8,429 $7,769 $7,947 $9,336 $8,546 $90,882
Medicaid Newly Eligible $1,702 $3,899 $6,722 $5,765 $6,043 $6,211 $6,878 $6,580 $7,699 $7,692 $7,868 $8,135 $8,546 $83,740
Medicaid Currently Eligible (Woodwork) $439 $647 $1,358 $1,730 $1,209 $1,242 $2,063 $2,925 $2,310 $3,108 $3,179 $2,440 $3,419 $26,068
Hospitals' Net Income from New Coverage and Crowd-out under ACA $6,135 $16,193 $22,327 $24,811 $25,150 $26,028 $28,352 $30,559 $32,419 $33,960 $34,967 $36,999 $38,379 $356,280
Source: Dobson | DaVanzo estimates

ESTIMATING THE IMPACT OF REPEALING THE ACA ON HOSPITALS REPORT VERSION FINAL | 32 Dobson|DaVanzo
© 2016 Dobson DaVanzo & Associates, LLC. All Rights Reserved.
Appendix B - Medicare and Medicaid Reductions under the ACA
The ACA included a number of provisions that affect Medicare payments to hospitals.
Although the payment reductions began in 2010, this analysis only estimated the impact on
hospitals of the payment reductions from January 2018 through FY 2026 to be consistent with
the time period associated with the repeal bill. Estimates are provided for the following ACA
provisions:
Medicare market basket update reductions and productivity adjustments;
Medicare DSH payment reductions;
Medicare Hospital Acquired Condition (HAC) Reduction Program;
Medicare Hospital Readmission Reduction (HRR) Program; and
Medicaid DSH Allotment Reductions.
To estimate the impacts, we used data from MedPAC for 2010 to 2014 on Medicare fee-for-
service (FFS) spending for hospital inpatient services covered by the acute care inpatient
prospective payment system; psychiatric, rehabilitation, long-term care, cancer, and
children’s hospitals and units; and hospital outpatient services. The payment data included
payments to providers from both the Medicare program and beneficiary cost sharing.53 We
then used data from CBO to calculate the annual change from 2014 to 2026 and applied these
growth factors to the 2014 spending from MedPAC.54 These data were used as our baseline
Medicare spending for estimating the amount of the reductions.
53 Medicare Payment Advisory Commission (MedPAC), A Data Book: Health Care Spending and the Medicare Program, June 2016
54 Congressional Budget Office (CBO), Medicare Baseline, March 2016

Appendix B
ESTIMATING THE IMPACT OF REPEALING THE ACA ON HOSPITALS REPORT VERSION FINAL | 33 Dobson|DaVanzo
© 2016 Dobson DaVanzo & Associates, LLC. All Rights Reserved.
We estimate that these reductions will amount to $407.6 billion reduction in hospital
payments between 2018 and 2026 (Exhibit B-1). The following sections describe each of the
reductions and our method for estimating the impact on hospitals.
Exhibit B-1: Impact of the ACA Medicare and Medicaid Payment Reductions on Hospital
Revenues 2018-2026 (in billions)
Fiscal Year
ACA MB Reductions and
Productivity Adjustments
Medicare DSH Reduction
Hospital Acquired Condition Penalties
Hospital Readmission
Reduction Program
Impact of Medicaid
DSH Reductions1
Total Impact of
All Reductions
2018 2 $12.0 $3.8 $0.4 $0.5 $1.3 $18.0
2019 $20.8 $5.4 $0.5 $0.9 $2.8 $30.3
2020 $24.0 $5.7 $0.5 $0.9 $4.0 $35.1
2021 $27.5 $6.1 $0.5 $1.1 $5.2 $40.3
2022 $31.5 $6.5 $0.6 $1.1 $6.3 $46.0
2023 $35.7 $6.9 $0.6 $1.3 $7.6 $52.2
2024 $40.6 $7.3 $0.6 $1.4 $8.9 $58.9
2025 $45.5 $7.8 $0.6 $1.5 $8.9 $64.2
2026 $52.0 $8.3 $0.7 $1.6 n/a $62.5
2018-2026 $289.5 $57.8 $4.9 $10.3 $45.0 $407.6
1/ Reductions to hospitals is estimated to be $45.0 and reductions to IMDs is estimated to be $8.6.
2/ Estimates for FY 2018 include only a 9 month period January - September 2018.
Source: Dobson | DaVanzo estimates using Medicare IPPS Impact files for 2013-2017.
Medicare Market Basket Update Reductions and Productivity Adjustments
The ACA includes specific reductions to the annual market basket payment rate increases for
acute care, rehabilitation, and psychiatric hospitals of 0.25 percent in both 2010 and 2011, 0.1
percent for 2012 and 2013, 0.3 percent for 2014, 0.2 percent for 2015 and 2016 and 0.75
percent for 2017 through 2019. These reductions were the same for long-term care hospitals
except that the reduction was 0.5 percent in 2011 instead of 0.2 percent.
In addition, Section 3401 of the Affordable Care Act (ACA) requires that the market basket
updates under the Medicare prospective payment systems be reduced annually by the
productivity adjustment. The ACA defines the productivity adjustment to be equal to “the 10-
year moving average of changes in annual economy-wide private nonfarm business
multifactor productivity (as projected by the Secretary for the 10-year period ending with the
applicable fiscal year, year, cost-reporting period, or other annual period).” The productivity
adjustments applied by CMS to hospital market basket updates were 1.0 percent in 2012, 0.7

Appendix B
ESTIMATING THE IMPACT OF REPEALING THE ACA ON HOSPITALS REPORT VERSION FINAL | 34 Dobson|DaVanzo
© 2016 Dobson DaVanzo & Associates, LLC. All Rights Reserved.
percent in 2013, 0.5 percent for 2014 through 2016 and 0.3 percent in 2017. For the 2018
through 2026 period, we assumed an average productivity adjustment of 0.8 percent to be
consistent with CBO projections.55
The nature of the payment update adjustments are that they accumulate over time. Applying
the market basket update reductions and the productivity adjustments to our Medicare
baseline spending data for each provider type and year, we estimate that these reductions will
reduce Medicare payments to hospitals by $289.5 billion over the 2018 to 2026 period
(Exhibit B-1).
Medicare DSH Payment Reductions
The ACA (Section 3133) specifies a change to the formula for determining Medicare DSH
payments to hospitals. Under this new formula, hospitals receive 25 percent of the amount
they previously would have received under the current Medicare DSH formula effective for
discharges occurring on or after FY 2014. Hospitals will receive an additional payment for
uncompensated care equal to 75 percent of what otherwise would have been paid as Medicare
DSH.56 The amount of uncompensated care payments available to hospitals is reduced each
year for changes in the percentage of individuals that are uninsured.57 Each Medicare DSH
hospital will receive an uncompensated care payment based on its share of insured low
income days (that is, the sum of Medicaid days and Medicare SSI days) reported by Medicare
DSH hospitals.
We modeled the revised formula for DSH and uncompensated care payments using our
baseline Medicare spending for DSH. Aggregate baseline Medicare DSH payments were
separated into the DSH portion (25%) and the uncompensated care portion (75%). The
uncompensated care portions were reduced using the factors: 0.9430 for 2014, 0.7619 for
2015, 0.6369 for 2016 and 0.5536 for 2017. For 2018 through 2019 we assumed the same
0.5536 factor since the CBO estimate for the reduction in the number of uninsured is virtually
unchanged from 2017 through 2026. For 2020 through 2026 we assumed the same factor but
excluded the 0.2 percent reduction specified in the Act.
55 Hayford, Nelson and Diorio,” Projecting Hospitals’ Profit Margins Under Several Illustrative Scenarios”, Congressional Budget Office Working Paper Series, September 2016
56 Federal Register, August 22, 2016 pp. 56761-57438
57 The uncompensated care payment amount is reduced by 1 minus the percent change in the percent of individuals under the age of 65
who are uninsured (minus 0.1 percentage points for FY 2014, and minus 0.2 percentage points for FY 2015 through FY 2017).

Appendix B
ESTIMATING THE IMPACT OF REPEALING THE ACA ON HOSPITALS REPORT VERSION FINAL | 35 Dobson|DaVanzo
© 2016 Dobson DaVanzo & Associates, LLC. All Rights Reserved.
Based on these assumptions, we estimate that the Medicare DSH reductions under the ACA
will reduce payments to hospitals by $57.8 billion over the 2018 to 2026 period (Exhibit B-
1).
Medicare Hospital Acquired Condition (HAC) Reduction Program
Beginning in Fiscal Year 2015, the HAC Reduction Program requires the Secretary of the
Department of Health and Human Services to adjust payments to applicable hospitals that
rank in the worst-performing quartile of all acute care (subsection (d)) hospitals with respect
to risk-adjusted HAC quality measures. These hospitals will have their payments reduced to
99 percent of what would otherwise have been paid for their Medicare discharges.58
To estimate the impact of the HAC Reduction Program of Medicare payments to hospitals,
we obtained a list of the hospitals that were in the highest quartile of hospitals based on their
total HAC quality score.59 We then matched the list of high-HAC hospitals with the Medicare
Inpatient Prospective Payment System (IPPS) Impact file for 2017 to calculate the amount of
a one-percent payment reduction for those hospitals relative to payments for all IPPS
hospitals. This resulted in an overall reduction of 0.39 percent in Medicare payments to all
hospitals. We applied this reduction factor to our Medicare baseline spending data for acute
care hospitals for FY 2015 through 2026 which resulted in a reduction of $4.9 billion over the
2018 to 2026 period (Exhibit B-1).
Medicare Hospital Readmission Reduction (HRR) Program
Section 3025 of the ACA established the HRR Program, which requires CMS to reduce
payments to IPPS hospitals with excess readmissions. Beginning in FY 2013 hospitals with
excess 30-day readmission for acute myocardial infarction (AMI), heart failure (HF), and
pneumonia (PN) received a payment reduction. Beginning in FY 2015 the HRR program was
expanded to include patients admitted for an acute exacerbation of chronic obstructive
pulmonary disease (COPD), elective total hip arthroplasty (THA) and total knee arthroplasty
(TKA). Beginning in FY 2017 the HRR program was expanded again to include patients
admitted for coronary artery bypass graft (CABG) surgery in the calculation of a hospital’s
readmission payment adjustment factor and to include additional pneumonia diagnoses: (i)
patients with aspiration pneumonia; and (ii) sepsis patients coded with pneumonia present on
admission (but not including severe sepsis).60
58 https://www.cms.gov/Medicare/Medicare-Fee-for-Service-Payment/AcuteInpatientPPS/HAC-Reduction-Program.html
59 https://www.qualitynet.org/dcs/ContentServer?c=Page&pagename=QnetPublic%2FPage%2FQnetTier2&cid=1228774189166
60 https://www.cms.gov/medicare/medicare-fee-for-service-payment/acuteinpatientpps/readmissions-reduction-program.html
Appendix B
ESTIMATING THE IMPACT OF REPEALING THE ACA ON HOSPITALS REPORT VERSION FINAL | 36 Dobson|DaVanzo
© 2016 Dobson DaVanzo & Associates, LLC. All Rights Reserved.
To estimate the impact of the HRR Program on Medicare payments to hospitals, we used the
IPPS Impact files for FY 2013 to 2017 to calculate the amount of HRR penalties relative to
payments for all IPPS hospitals. The IPPS Impact File contains the CMS-calculated HRR
reduction factor for each hospital for the applicable year. This analysis resulted in an overall
reduction in Medicare payments to hospitals of 0.29 percent in 2013, 0.32 percent in 2014,
0.49 percent if 2015 and 2016, and 0.6 percent in 2017. For subsequent years, we assumed
that CMS would continue to add conditions every other year and this would increase the
overall hospital payment reduction by 0.1 percentage point for each condition expansion. We
applied these annual reduction factors to our Medicare baseline spending data for acute care
hospitals for FY 2013 through 2026 which resulted in a reduction of $10.3 billion over the
2018 to 2026 period (Exhibit B-1).
Medicaid DSH Allotment Reductions
Medicaid DSH payments are made to hospitals and Institutions for Mental Disease (IMDs)
that treat a high proportion of Medicaid and other low-income patients to help offset
uncompensated care costs for Medicaid and uninsured patients treated by these facilities.
Medicaid DSH payments are funded by state governments and the states receive federal
matching funds for each dollar spent based on the states’ Federal Medical Assistance
Percentages (FMAP). However, Medicaid DSH payments are limited by annual federal
allotments that are specific to each state. These allotments vary widely and are based on
states’ historical DSH spending.61
The ACA specified scheduled reductions in federal Medicaid DSH allotments, which have
been about $12 billion annually, in order to account for the decrease in uncompensated care
anticipated under the ACA’s coverage expansions. As enacted, the Medicaid DSH allotment
reductions would have ended after FY 2020 and allotments would have reverted to their pre-
ACA levels. However, several pieces of legislation have been enacted since 2010 that have
delayed, altered and extended the ACA’s original Medicaid DSH reduction schedule.62 As a
result, the current schedule and amounts for the Medicaid DSH reductions are as follows:
$2.0 billion in FY 2018;
$3.0 billion in FY 2019;
$4.0 billion in FY 2020;
$5.0 billion in FY 2021;
$6.0 billion in FY 2022;
61 Medicaid and CHIP Payment and Access Commission, “Medicaid Report to Congress on Medicaid Disproportionate Share Hospital
Payments”, February 2016 62 https://www.macpac.gov/subtopic/disproportionate-share-hospital-payments/

Appendix B
ESTIMATING THE IMPACT OF REPEALING THE ACA ON HOSPITALS REPORT VERSION FINAL | 37 Dobson|DaVanzo
© 2016 Dobson DaVanzo & Associates, LLC. All Rights Reserved.
$7.0 billion in FY 2023; and,
$8.0 billion in FYs 2024 and 2025.
To determine the impact that the reduction in federal allotments will have on Medicaid DSH
payments to hospitals, we first estimated the amount of the reductions for each state by year.
The ACA requires the Secretary of Health and Human Services to develop a methodology to
implement the reductions that meets specific requirements that will affect states differently.
For this analysis, we used MACPAC’s estimate of the percent reduction in federal allotments
by state for 2018, applied these state-level reduction factors to our projection of federal DSH
allotments by state from 2018 to 2025, and adjusted them to meet the targeted reductions for
each year.
Not all states make DSH payments to hospitals up to the full amount of their allotment. In
some cases the allotment reduction may not affect states’ actual DSH payments to hospitals if
they are already spending less than the reduced DSH allotments. Therefore, we developed the
following method to estimate the impact of the Medicaid DSH allotment reductions on
payments to hospitals accounting for states spending below their allotments:
Obtained total Medicaid DSH payments to hospitals and IMDs for each state from
2010 actual spending from the Medicaid Budget and Expenditure System Reports
(CMS-64) and projected actual DSH spending to 2026 using CPI-U inflation rates;
Projected the unreduced Medicaid DSH allotments for each state from 2018 to 2025,
and applied the state’s FMAP rate to determine total DSH dollars available;
Calculated the amount of Medicaid DSH spending that was below the cap for each
state from 2018 to 2026;
Applied the state’s FMAP rate to the calculated state-level allotment reductions to
estimate total state and federal dollars that would be reduced by the reductions;
Calculated the effect of the allotment reductions on DSH payments to hospitals as the
difference between total reduction (state and federal) and the amount of spending
under the cap.

Appendix B
ESTIMATING THE IMPACT OF REPEALING THE ACA ON HOSPITALS REPORT VERSION FINAL | 38 Dobson|DaVanzo
© 2016 Dobson DaVanzo & Associates, LLC. All Rights Reserved.
The following table provides an example of the above calculations:
1 Federal Allotment Amount Before Reduction $50,000,000
2 State's FMAP 70%
3 Estimated Federal Allotment Reduction $4,000,000
4 Actual DSH Spending (State + Federal) $68,000,000
Calculations of Impact Estimates
5 Total DSH Spending Cap (State + Federal) (#1 / #2) $71,428,571
6 Spending Gap (#5 - #4, minimum of $0) $3,428,571
7 Allotment Reductions (State + Federal) (#3 / #2) $5,714,286
8 Impact on DSH Payments (#7 - #6, minimum of $0) $2,285,714
Using this methodology, we estimate that the impact of the federal Medicaid DSH allotment
reductions would be $53.6 billion over the 2018 through 2025 period (Exhibit B-1).
Assuming that DSH payments to hospitals and IMDs are distributed the same as actual 2010
amounts for each state, we estimate that Medicaid DSH payments to hospitals would be
reduced by $45.0 billion and DSH payments to IMDs would be reduced by $8.6 billion. Since
we did not include IMDs in this analysis, we reported only DSH reductions to hospitals of
$45.0 billion.