Embed Size (px)
Citation preview
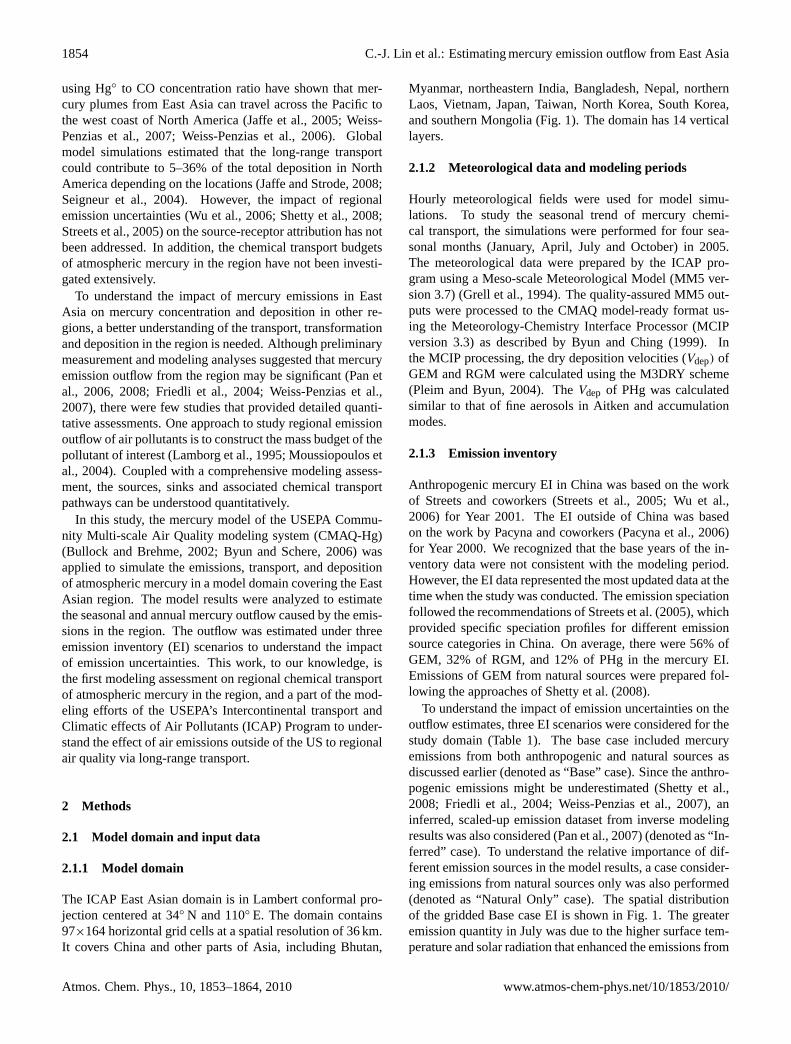
Atmos. Chem. Phys., 10, 1853–1864, 2010www.atmos-chem-phys.net/10/1853/2010/© Author(s) 2010. This work is distributed underthe Creative Commons Attribution 3.0 License.
AtmosphericChemistry
and Physics
Estimating mercury emission outflow from East Asia usingCMAQ-Hg
C.-J. Lin1,2, L. Pan3, D. G. Streets4, S. K. Shetty5, C. Jang6, X. Feng7, H.-W. Chu3, and T. C. Ho5
1Department of Civil Engineering, Lamar University, Beaumont, TX 77710, USA2School of Environmental Science & Engineering, South China University of Technology, Guangzhou, 510006,Guangdong, China3Department of Mechanical Engineering, Lamar University, Beaumont, TX 77710, USA4Decision and Information Sciences Division, Argonne National Laboratory, Argonne, IL 60439, USA5Department of Chemical Engineering, Lamar University, Beaumont, TX 77710, USA6Office of Air Quality Planning and Standards, USEPA, Research Triangle Park, NC 27711, USA7State Key Laboratory of Environmental Geochemistry, Institute of Geochemistry, Chinese Academy of Sciences,Guiyang 550002, China
Received: 19 September 2009 – Published in Atmos. Chem. Phys. Discuss.: 9 October 2009Revised: 2 February 2010 – Accepted: 3 February 2010 – Published: 17 February 2010
Abstract. East Asia contributes to nearly 50% of the globalanthropogenic mercury emissions into the atmosphere. Re-cently, there have been concerns about the long-range trans-port of mercury from East Asia, which may lead to enhanceddry and wet depositions in other regions. In this study, weperformed four monthly simulations (January, April, Julyand October in 2005) using CMAQ-Hg v4.6 for a numberof emission inventory scenarios in an East Asian model do-main. Coupled with mass balance analyses, the chemicaltransport of mercury in East Asia and the resulted mercuryemission outflow were investigated. The total annual mer-cury deposition in the region was estimated to be 821 Mg,with 396 Mg contributed by wet deposition and 425 Mg bydry deposition. Anthropogenic emissions were responsiblefor most of the estimated deposition (75%). The deposi-tion caused by emissions from natural sources was less im-portant (25%). Regional mercury transport budgets showedstrong seasonal variability, with a net removal of RGM (7–15 Mg month−1) and PHg (13–21 Mg month−1) in the do-main, and a net export of GEM (60–130 Mg month−1) fromthe domain. The outflow caused by East Asian emissions(anthropogenic plus natural) was estimated to be in the rangeof 1369–1671 Mg yr−1, of which 50–60% was caused byemissions from natural sources. The emission outflow rep-
Correspondence to:C.-J. Lin([email protected])
resented about 75% of the total mercury emissions in the re-gion, and would contribute to 20–30% of mercury depositionin remote receptors.
1 Introduction
Mercury is a global pollutant subject to long-range trans-port due to the long atmospheric lifetime of gaseous el-emental mercury (GEM, 0.5–2 years) (Selin et al., 2007;Schroeder and Munthe, 1998; Lin and Pehkonen, 1999; Shiaet al., 1999; Lindberg et al., 2007). On the other hand, oxi-dized mercury [likely Hg(II)], either in the form of reactivegaseous mercury (RGM) or particulate mercury (PHg), canbe quickly removed from the atmosphere via wet and dry de-position (Lindberg et al., 2002; Schroeder et al., 1998; Linand Pehkonen, 1999; Stratton et al., 2001). Once deposited,its methylation and bioaccumulation in the food chain posea threat to human health, particularly for the sensitive sub-populations (Rolfhus et al., 2003; Mason et al., 1995, 2006;Miller et al., 2007).
East Asia is the largest mercury source region in the world.It contributes to about 50% of all anthropogenic emissions tothe atmosphere (Pacyna et al., 2006; Streets et al., 2009).Recently, there were a number of studies reporting exper-imental and modeling evidences of long-range transport ofatmospheric mercury. For example, observational analyses
Published by Copernicus Publications on behalf of the European Geosciences Union.
1854 C.-J. Lin et al.: Estimating mercury emission outflow from East Asia
using Hg◦ to CO concentration ratio have shown that mer-cury plumes from East Asia can travel across the Pacific tothe west coast of North America (Jaffe et al., 2005; Weiss-Penzias et al., 2007; Weiss-Penzias et al., 2006). Globalmodel simulations estimated that the long-range transportcould contribute to 5–36% of the total deposition in NorthAmerica depending on the locations (Jaffe and Strode, 2008;Seigneur et al., 2004). However, the impact of regionalemission uncertainties (Wu et al., 2006; Shetty et al., 2008;Streets et al., 2005) on the source-receptor attribution has notbeen addressed. In addition, the chemical transport budgetsof atmospheric mercury in the region have not been investi-gated extensively.
To understand the impact of mercury emissions in EastAsia on mercury concentration and deposition in other re-gions, a better understanding of the transport, transformationand deposition in the region is needed. Although preliminarymeasurement and modeling analyses suggested that mercuryemission outflow from the region may be significant (Pan etal., 2006, 2008; Friedli et al., 2004; Weiss-Penzias et al.,2007), there were few studies that provided detailed quanti-tative assessments. One approach to study regional emissionoutflow of air pollutants is to construct the mass budget of thepollutant of interest (Lamborg et al., 1995; Moussiopoulos etal., 2004). Coupled with a comprehensive modeling assess-ment, the sources, sinks and associated chemical transportpathways can be understood quantitatively.
In this study, the mercury model of the USEPA Commu-nity Multi-scale Air Quality modeling system (CMAQ-Hg)(Bullock and Brehme, 2002; Byun and Schere, 2006) wasapplied to simulate the emissions, transport, and depositionof atmospheric mercury in a model domain covering the EastAsian region. The model results were analyzed to estimatethe seasonal and annual mercury outflow caused by the emis-sions in the region. The outflow was estimated under threeemission inventory (EI) scenarios to understand the impactof emission uncertainties. This work, to our knowledge, isthe first modeling assessment on regional chemical transportof atmospheric mercury in the region, and a part of the mod-eling efforts of the USEPA’s Intercontinental transport andClimatic effects of Air Pollutants (ICAP) Program to under-stand the effect of air emissions outside of the US to regionalair quality via long-range transport.
2 Methods
2.1 Model domain and input data
2.1.1 Model domain
The ICAP East Asian domain is in Lambert conformal pro-jection centered at 34◦ N and 110◦ E. The domain contains97×164 horizontal grid cells at a spatial resolution of 36 km.It covers China and other parts of Asia, including Bhutan,
Myanmar, northeastern India, Bangladesh, Nepal, northernLaos, Vietnam, Japan, Taiwan, North Korea, South Korea,and southern Mongolia (Fig. 1). The domain has 14 verticallayers.
2.1.2 Meteorological data and modeling periods
Hourly meteorological fields were used for model simu-lations. To study the seasonal trend of mercury chemi-cal transport, the simulations were performed for four sea-sonal months (January, April, July and October) in 2005.The meteorological data were prepared by the ICAP pro-gram using a Meso-scale Meteorological Model (MM5 ver-sion 3.7) (Grell et al., 1994). The quality-assured MM5 out-puts were processed to the CMAQ model-ready format us-ing the Meteorology-Chemistry Interface Processor (MCIPversion 3.3) as described by Byun and Ching (1999). Inthe MCIP processing, the dry deposition velocities (Vdep) ofGEM and RGM were calculated using the M3DRY scheme(Pleim and Byun, 2004). TheVdep of PHg was calculatedsimilar to that of fine aerosols in Aitken and accumulationmodes.
2.1.3 Emission inventory
Anthropogenic mercury EI in China was based on the workof Streets and coworkers (Streets et al., 2005; Wu et al.,2006) for Year 2001. The EI outside of China was basedon the work by Pacyna and coworkers (Pacyna et al., 2006)for Year 2000. We recognized that the base years of the in-ventory data were not consistent with the modeling period.However, the EI data represented the most updated data at thetime when the study was conducted. The emission speciationfollowed the recommendations of Streets et al. (2005), whichprovided specific speciation profiles for different emissionsource categories in China. On average, there were 56% ofGEM, 32% of RGM, and 12% of PHg in the mercury EI.Emissions of GEM from natural sources were prepared fol-lowing the approaches of Shetty et al. (2008).
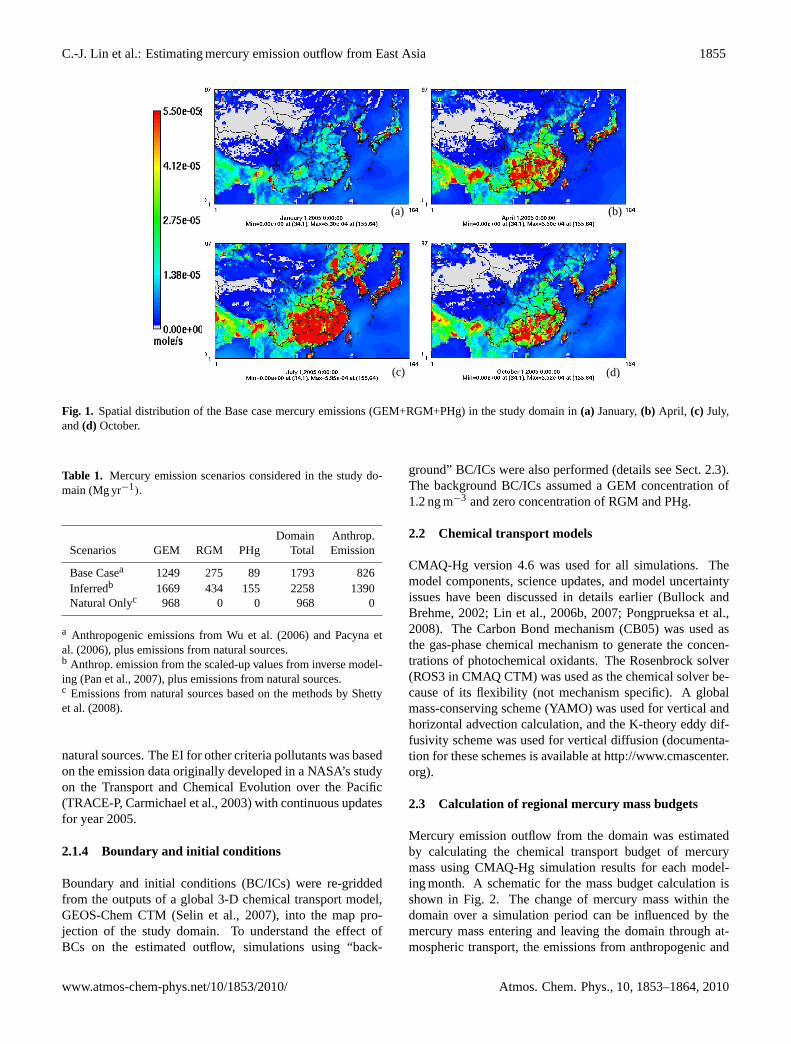
To understand the impact of emission uncertainties on theoutflow estimates, three EI scenarios were considered for thestudy domain (Table 1). The base case included mercuryemissions from both anthropogenic and natural sources asdiscussed earlier (denoted as “Base” case). Since the anthro-pogenic emissions might be underestimated (Shetty et al.,2008; Friedli et al., 2004; Weiss-Penzias et al., 2007), aninferred, scaled-up emission dataset from inverse modelingresults was also considered (Pan et al., 2007) (denoted as “In-ferred” case). To understand the relative importance of dif-ferent emission sources in the model results, a case consider-ing emissions from natural sources only was also performed(denoted as “Natural Only” case). The spatial distributionof the gridded Base case EI is shown in Fig. 1. The greateremission quantity in July was due to the higher surface tem-perature and solar radiation that enhanced the emissions from
Atmos. Chem. Phys., 10, 1853–1864, 2010 www.atmos-chem-phys.net/10/1853/2010/
C.-J. Lin et al.: Estimating mercury emission outflow from East Asia 1855
19
613
614
615
Fig. 1. Spatial distribution of the Base case mercury emissions (GEM + RGM + PHg) in the 616
study domain in (a) January, (b) April, (c) July, and (d) October. 617
618
(a) (b)
(c) (d)
Fig. 1. Spatial distribution of the Base case mercury emissions (GEM+RGM+PHg) in the study domain in(a) January,(b) April, (c) July,and(d) October.
Table 1. Mercury emission scenarios considered in the study do-main (Mg yr−1).
Domain Anthrop.Scenarios GEM RGM PHg Total Emission
Base Casea 1249 275 89 1793 826Inferredb 1669 434 155 2258 1390Natural Onlyc 968 0 0 968 0
a Anthropogenic emissions from Wu et al. (2006) and Pacyna etal. (2006), plus emissions from natural sources.b Anthrop. emission from the scaled-up values from inverse model-ing (Pan et al., 2007), plus emissions from natural sources.c Emissions from natural sources based on the methods by Shettyet al. (2008).
natural sources. The EI for other criteria pollutants was basedon the emission data originally developed in a NASA’s studyon the Transport and Chemical Evolution over the Pacific(TRACE-P, Carmichael et al., 2003) with continuous updatesfor year 2005.
2.1.4 Boundary and initial conditions
Boundary and initial conditions (BC/ICs) were re-griddedfrom the outputs of a global 3-D chemical transport model,GEOS-Chem CTM (Selin et al., 2007), into the map pro-jection of the study domain. To understand the effect ofBCs on the estimated outflow, simulations using “back-
ground” BC/ICs were also performed (details see Sect. 2.3).The background BC/ICs assumed a GEM concentration of1.2 ng m−3 and zero concentration of RGM and PHg.
2.2 Chemical transport models
CMAQ-Hg version 4.6 was used for all simulations. Themodel components, science updates, and model uncertaintyissues have been discussed in details earlier (Bullock andBrehme, 2002; Lin et al., 2006b, 2007; Pongprueksa et al.,2008). The Carbon Bond mechanism (CB05) was used asthe gas-phase chemical mechanism to generate the concen-trations of photochemical oxidants. The Rosenbrock solver(ROS3 in CMAQ CTM) was used as the chemical solver be-cause of its flexibility (not mechanism specific). A globalmass-conserving scheme (YAMO) was used for vertical andhorizontal advection calculation, and the K-theory eddy dif-fusivity scheme was used for vertical diffusion (documenta-tion for these schemes is available athttp://www.cmascenter.org).
2.3 Calculation of regional mercury mass budgets
Mercury emission outflow from the domain was estimatedby calculating the chemical transport budget of mercurymass using CMAQ-Hg simulation results for each model-ing month. A schematic for the mass budget calculation isshown in Fig. 2. The change of mercury mass within thedomain over a simulation period can be influenced by themercury mass entering and leaving the domain through at-mospheric transport, the emissions from anthropogenic and
www.atmos-chem-phys.net/10/1853/2010/ Atmos. Chem. Phys., 10, 1853–1864, 2010
1856 C.-J. Lin et al.: Estimating mercury emission outflow from East Asia
20
Mass In Mass Out
Domain Boundary
Emission Deposition
Atmospheric Mercury
Processes (GEM, RGM, PHg)
619
620
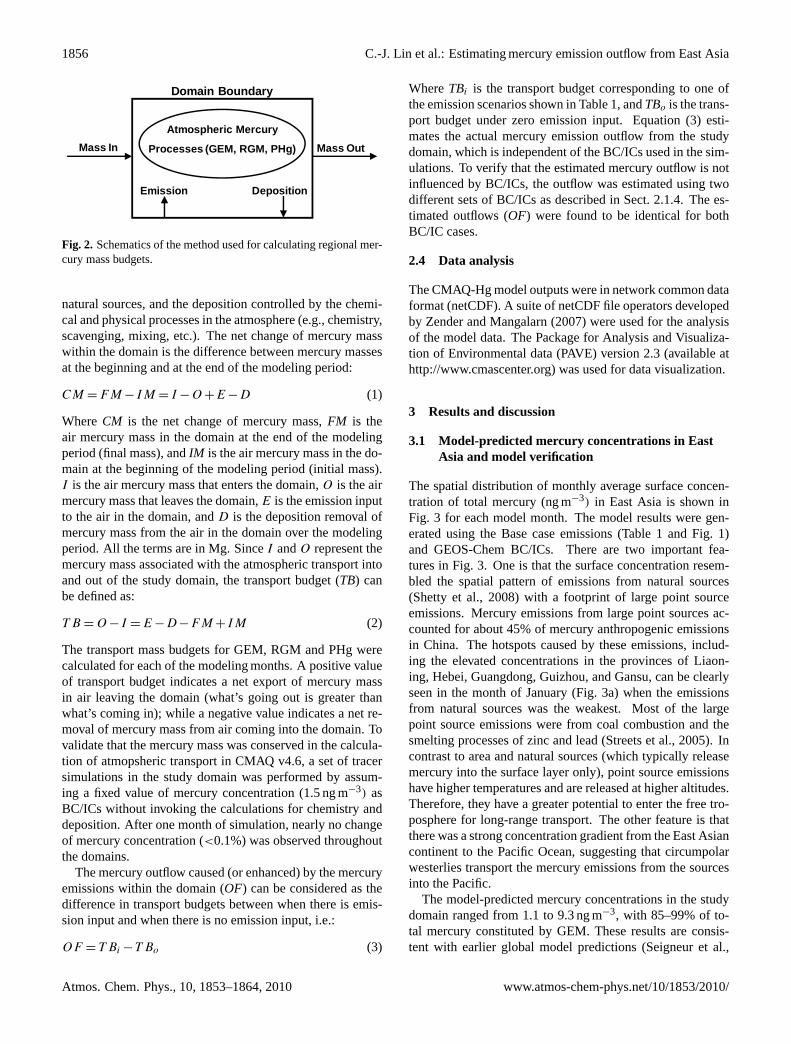
Fig. 2. Schematics of the method used for calculating regional mercury mass budgets 621
622
Fig. 2. Schematics of the method used for calculating regional mer-cury mass budgets.
natural sources, and the deposition controlled by the chemi-cal and physical processes in the atmosphere (e.g., chemistry,scavenging, mixing, etc.). The net change of mercury masswithin the domain is the difference between mercury massesat the beginning and at the end of the modeling period:
CM = FM −IM = I −O +E−D (1)
WhereCM is the net change of mercury mass,FM is theair mercury mass in the domain at the end of the modelingperiod (final mass), andIM is the air mercury mass in the do-main at the beginning of the modeling period (initial mass).I is the air mercury mass that enters the domain,O is the airmercury mass that leaves the domain,E is the emission inputto the air in the domain, andD is the deposition removal ofmercury mass from the air in the domain over the modelingperiod. All the terms are in Mg. SinceI andO represent themercury mass associated with the atmospheric transport intoand out of the study domain, the transport budget (TB) canbe defined as:
T B = O −I = E−D−FM +IM (2)
The transport mass budgets for GEM, RGM and PHg werecalculated for each of the modeling months. A positive valueof transport budget indicates a net export of mercury massin air leaving the domain (what’s going out is greater thanwhat’s coming in); while a negative value indicates a net re-moval of mercury mass from air coming into the domain. Tovalidate that the mercury mass was conserved in the calcula-tion of atmopsheric transport in CMAQ v4.6, a set of tracersimulations in the study domain was performed by assum-ing a fixed value of mercury concentration (1.5 ng m−3) asBC/ICs without invoking the calculations for chemistry anddeposition. After one month of simulation, nearly no changeof mercury concentration (<0.1%) was observed throughoutthe domains.
The mercury outflow caused (or enhanced) by the mercuryemissions within the domain (OF) can be considered as thedifference in transport budgets between when there is emis-sion input and when there is no emission input, i.e.:
OF = T Bi −T Bo (3)
WhereTBi is the transport budget corresponding to one ofthe emission scenarios shown in Table 1, andTBo is the trans-port budget under zero emission input. Equation (3) esti-mates the actual mercury emission outflow from the studydomain, which is independent of the BC/ICs used in the sim-ulations. To verify that the estimated mercury outflow is notinfluenced by BC/ICs, the outflow was estimated using twodifferent sets of BC/ICs as described in Sect. 2.1.4. The es-timated outflows (OF) were found to be identical for bothBC/IC cases.
2.4 Data analysis
The CMAQ-Hg model outputs were in network common dataformat (netCDF). A suite of netCDF file operators developedby Zender and Mangalarn (2007) were used for the analysisof the model data. The Package for Analysis and Visualiza-tion of Environmental data (PAVE) version 2.3 (available athttp://www.cmascenter.org) was used for data visualization.
3 Results and discussion
3.1 Model-predicted mercury concentrations in EastAsia and model verification
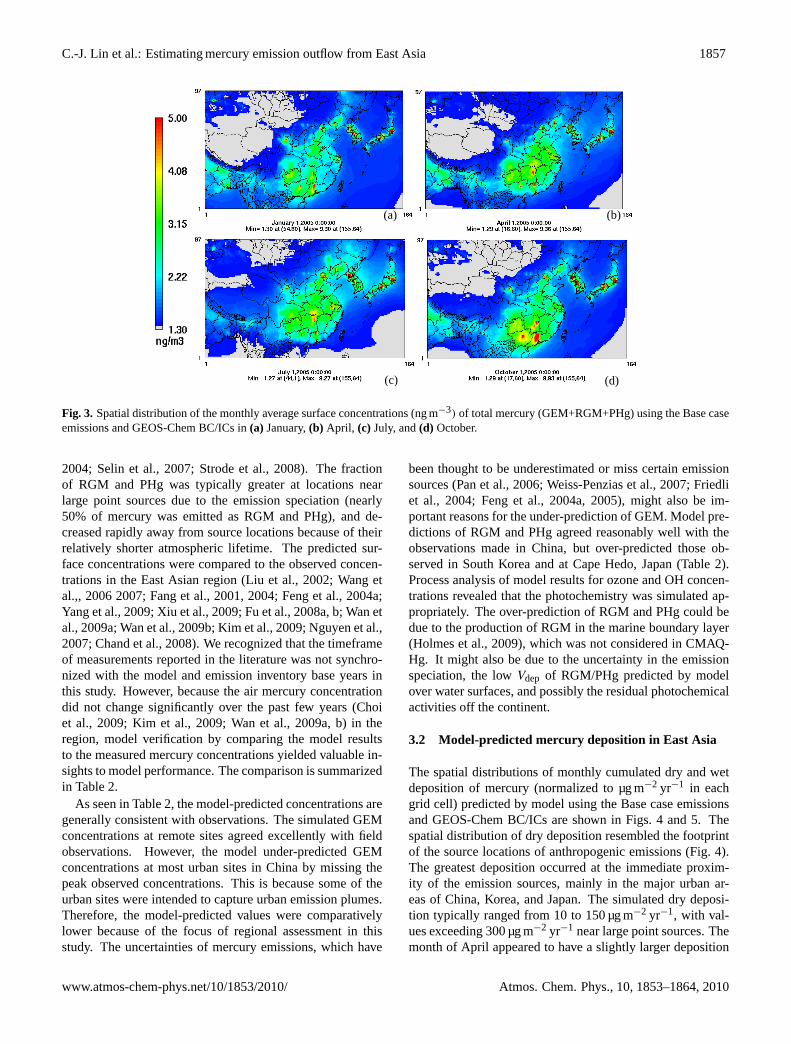
The spatial distribution of monthly average surface concen-tration of total mercury (ng m−3) in East Asia is shown inFig. 3 for each model month. The model results were gen-erated using the Base case emissions (Table 1 and Fig. 1)and GEOS-Chem BC/ICs. There are two important fea-tures in Fig. 3. One is that the surface concentration resem-bled the spatial pattern of emissions from natural sources(Shetty et al., 2008) with a footprint of large point sourceemissions. Mercury emissions from large point sources ac-counted for about 45% of mercury anthropogenic emissionsin China. The hotspots caused by these emissions, includ-ing the elevated concentrations in the provinces of Liaon-ing, Hebei, Guangdong, Guizhou, and Gansu, can be clearlyseen in the month of January (Fig. 3a) when the emissionsfrom natural sources was the weakest. Most of the largepoint source emissions were from coal combustion and thesmelting processes of zinc and lead (Streets et al., 2005). Incontrast to area and natural sources (which typically releasemercury into the surface layer only), point source emissionshave higher temperatures and are released at higher altitudes.Therefore, they have a greater potential to enter the free tro-posphere for long-range transport. The other feature is thatthere was a strong concentration gradient from the East Asiancontinent to the Pacific Ocean, suggesting that circumpolarwesterlies transport the mercury emissions from the sourcesinto the Pacific.
The model-predicted mercury concentrations in the studydomain ranged from 1.1 to 9.3 ng m−3, with 85–99% of to-tal mercury constituted by GEM. These results are consis-tent with earlier global model predictions (Seigneur et al.,
Atmos. Chem. Phys., 10, 1853–1864, 2010 www.atmos-chem-phys.net/10/1853/2010/
C.-J. Lin et al.: Estimating mercury emission outflow from East Asia 1857
21
623
624
625
626
Fig. 3. Spatial distribution of the monthly average surface concentrations (ng m-3) of total mercury 627
(GEM + RGM + PHg) using the Base case emissions and GEOS-Chem BC/ICs in (a) 628
January, (b) April, (c) July, and (d) October. 629
630
(a) (b)
(c) (d)
Fig. 3. Spatial distribution of the monthly average surface concentrations (ng m−3) of total mercury (GEM+RGM+PHg) using the Base caseemissions and GEOS-Chem BC/ICs in(a) January,(b) April, (c) July, and(d) October.
2004; Selin et al., 2007; Strode et al., 2008). The fractionof RGM and PHg was typically greater at locations nearlarge point sources due to the emission speciation (nearly50% of mercury was emitted as RGM and PHg), and de-creased rapidly away from source locations because of theirrelatively shorter atmospheric lifetime. The predicted sur-face concentrations were compared to the observed concen-trations in the East Asian region (Liu et al., 2002; Wang etal.,, 2006 2007; Fang et al., 2001, 2004; Feng et al., 2004a;Yang et al., 2009; Xiu et al., 2009; Fu et al., 2008a, b; Wan etal., 2009a; Wan et al., 2009b; Kim et al., 2009; Nguyen et al.,2007; Chand et al., 2008). We recognized that the timeframeof measurements reported in the literature was not synchro-nized with the model and emission inventory base years inthis study. However, because the air mercury concentrationdid not change significantly over the past few years (Choiet al., 2009; Kim et al., 2009; Wan et al., 2009a, b) in theregion, model verification by comparing the model resultsto the measured mercury concentrations yielded valuable in-sights to model performance. The comparison is summarizedin Table 2.
As seen in Table 2, the model-predicted concentrations aregenerally consistent with observations. The simulated GEMconcentrations at remote sites agreed excellently with fieldobservations. However, the model under-predicted GEMconcentrations at most urban sites in China by missing thepeak observed concentrations. This is because some of theurban sites were intended to capture urban emission plumes.Therefore, the model-predicted values were comparativelylower because of the focus of regional assessment in thisstudy. The uncertainties of mercury emissions, which have
been thought to be underestimated or miss certain emissionsources (Pan et al., 2006; Weiss-Penzias et al., 2007; Friedliet al., 2004; Feng et al., 2004a, 2005), might also be im-portant reasons for the under-prediction of GEM. Model pre-dictions of RGM and PHg agreed reasonably well with theobservations made in China, but over-predicted those ob-served in South Korea and at Cape Hedo, Japan (Table 2).Process analysis of model results for ozone and OH concen-trations revealed that the photochemistry was simulated ap-propriately. The over-prediction of RGM and PHg could bedue to the production of RGM in the marine boundary layer(Holmes et al., 2009), which was not considered in CMAQ-Hg. It might also be due to the uncertainty in the emissionspeciation, the lowVdep of RGM/PHg predicted by modelover water surfaces, and possibly the residual photochemicalactivities off the continent.
3.2 Model-predicted mercury deposition in East Asia
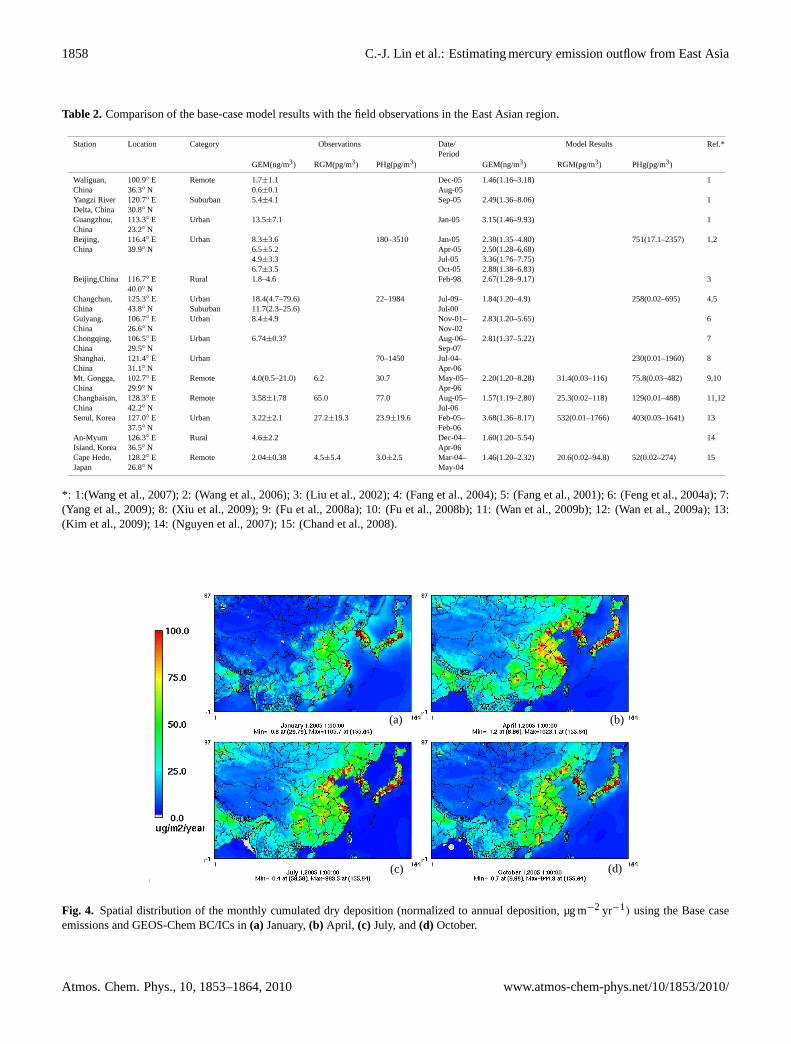
The spatial distributions of monthly cumulated dry and wetdeposition of mercury (normalized to µg m−2 yr−1 in eachgrid cell) predicted by model using the Base case emissionsand GEOS-Chem BC/ICs are shown in Figs. 4 and 5. Thespatial distribution of dry deposition resembled the footprintof the source locations of anthropogenic emissions (Fig. 4).The greatest deposition occurred at the immediate proxim-ity of the emission sources, mainly in the major urban ar-eas of China, Korea, and Japan. The simulated dry deposi-tion typically ranged from 10 to 150 µg m−2 yr−1, with val-ues exceeding 300 µg m−2 yr−1 near large point sources. Themonth of April appeared to have a slightly larger deposition
www.atmos-chem-phys.net/10/1853/2010/ Atmos. Chem. Phys., 10, 1853–1864, 2010
1858 C.-J. Lin et al.: Estimating mercury emission outflow from East Asia
Table 2. Comparison of the base-case model results with the field observations in the East Asian region.
Station Location Category Observations Date/Period
Model Results Ref.*
GEM(ng/m3) RGM(pg/m3) PHg(pg/m3) GEM(ng/m3) RGM(pg/m3) PHg(pg/m3)
Waliguan,China
100.9◦ E36.3◦ N
Remote 1.7±1.10.6±0.1
Dec-05Aug-05
1.46(1.16–3.18) 1
Yangzi RiverDelta, China
120.7◦ E30.8◦ N
Suburban 5.4±4.1 Sep-05 2.49(1.36–8.06) 1
Guangzhou,China
113.3◦ E23.2◦ N
Urban 13.5±7.1 Jan-05 3.15(1.46–9.93) 1
Beijing,China
116.4◦ E39.9◦ N
Urban 8.3±3.66.5±5.24.9±3.36.7±3.5
180–3510 Jan-05Apr-05Jul-05Oct-05
2.38(1.35–4.80)2.50(1.28–6.68)3.36(1.76–7.75)2.88(1.38–6.83)
751(17.1–2357) 1,2
Beijing,China 116.7◦ E40.0◦ N
Rural 1.8–4.6 Feb-98 2.67(1.28–9.17) 3
Changchun,China
125.3◦ E43.8◦ N
UrbanSuburban
18.4(4.7–79.6)11.7(2.3–25.6)
22–1984 Jul-09–Jul-00
1.84(1.20–4.9) 258(0.02–695) 4,5
Guiyang,China
106.7◦ E26.6◦ N
Urban 8.4±4.9 Nov-01–Nov-02
2.83(1.20–5.65) 6
Chongqing,China
106.5◦ E29.5◦ N
Urban 6.74±0.37 Aug-06–Sep-07
2.81(1.37–5.22) 7
Shanghai,China
121.4◦ E31.1◦ N
Urban 70–1450 Jul-04–Apr-06
230(0.01–1960) 8
Mt. Gongga,China
102.7◦ E29.9◦ N
Remote 4.0(0.5–21.0) 6.2 30.7 May-05–Apr-06
2.20(1.20–8.28) 31.4(0.03–116) 75.8(0.03–482) 9,10
Changbaisan,China
128.3◦ E42.2◦ N
Remote 3.58±1.78 65.0 77.0 Aug-05–Jul-06
1.57(1.19–2.80) 25.3(0.02–118) 129(0.01–488) 11,12
Seoul, Korea 127.0◦ E37.5◦ N
Urban 3.22±2.1 27.2±19.3 23.9±19.6 Feb-05–Feb-06
3.68(1.36–8.17) 532(0.01–1766) 403(0.03–1641) 13
An-MyumIsland, Korea
126.3◦ E36.5◦ N
Rural 4.6±2.2 Dec-04–Apr-06
1.60(1.20–5.54) 14
Cape Hedo,Japan
128.2◦ E26.8◦ N
Remote 2.04±0.38 4.5±5.4 3.0±2.5 Mar-04–May-04
1.46(1.20–2.32) 20.6(0.02–94.8) 52(0.02–274) 15
*: 1:(Wang et al., 2007); 2: (Wang et al., 2006); 3: (Liu et al., 2002); 4: (Fang et al., 2004); 5: (Fang et al., 2001); 6: (Feng et al., 2004a); 7:(Yang et al., 2009); 8: (Xiu et al., 2009); 9: (Fu et al., 2008a); 10: (Fu et al., 2008b); 11: (Wan et al., 2009b); 12: (Wan et al., 2009a); 13:(Kim et al., 2009); 14: (Nguyen et al., 2007); 15: (Chand et al., 2008).
22
631
632
633
634
Fig. 4. Spatial distribution of the monthly cumulated dry deposition (normalized to annual 635
deposition, g m-2 yr-1) using the Base case emissions and GEOS-Chem BC/ICs in (a) 636
January, (b) April, (c) July, and (d) October. 637
638
(a) (b)
(c) (d)
Fig. 4. Spatial distribution of the monthly cumulated dry deposition (normalized to annual deposition, µg m−2 yr−1) using the Base caseemissions and GEOS-Chem BC/ICs in(a) January,(b) April, (c) July, and(d) October.
Atmos. Chem. Phys., 10, 1853–1864, 2010 www.atmos-chem-phys.net/10/1853/2010/
C.-J. Lin et al.: Estimating mercury emission outflow from East Asia 1859
23
639
640
641
642
Fig. 5. Spatial distribution of the monthly cumulated wet deposition (normalized to annual 643
deposition, g m-2 yr-1) using the Base case emissions and GEOS-Chem BC/ICs in (a) 644
January, (b) April, (c) July, and (d) October. 645
646
(a) (b)
(c) (d)
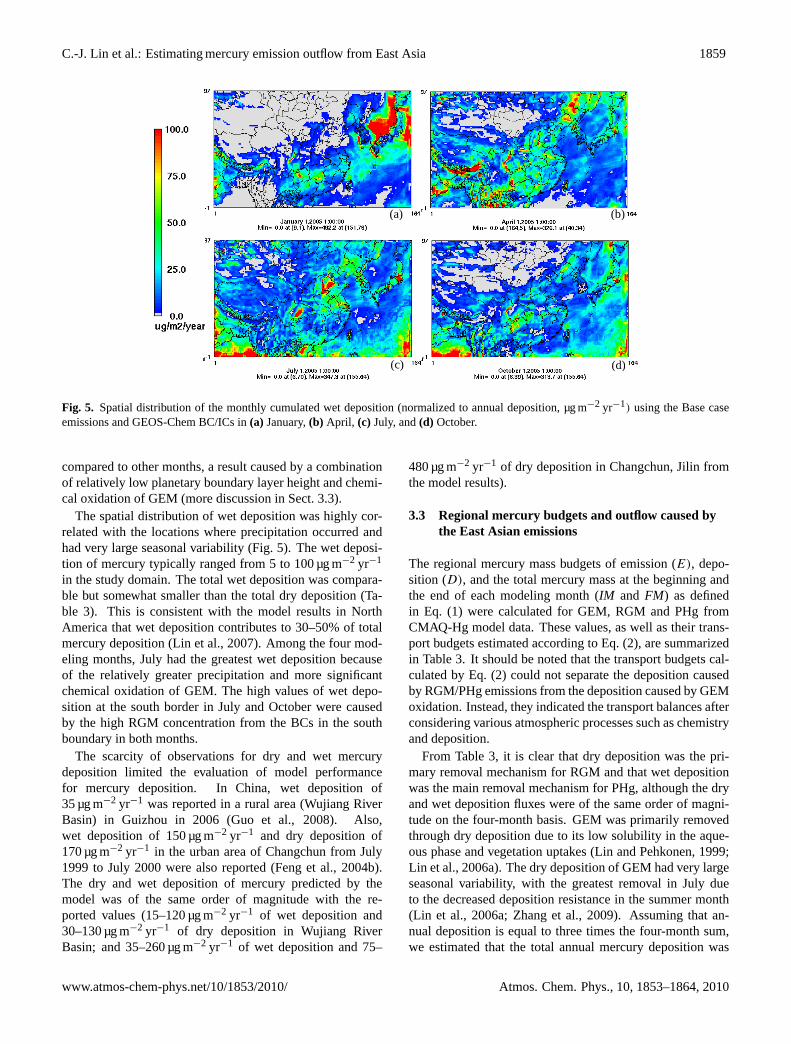
Fig. 5. Spatial distribution of the monthly cumulated wet deposition (normalized to annual deposition, µg m−2 yr−1) using the Base caseemissions and GEOS-Chem BC/ICs in(a) January,(b) April, (c) July, and(d) October.
compared to other months, a result caused by a combinationof relatively low planetary boundary layer height and chemi-cal oxidation of GEM (more discussion in Sect. 3.3).
The spatial distribution of wet deposition was highly cor-related with the locations where precipitation occurred andhad very large seasonal variability (Fig. 5). The wet deposi-tion of mercury typically ranged from 5 to 100 µg m−2 yr−1
in the study domain. The total wet deposition was compara-ble but somewhat smaller than the total dry deposition (Ta-ble 3). This is consistent with the model results in NorthAmerica that wet deposition contributes to 30–50% of totalmercury deposition (Lin et al., 2007). Among the four mod-eling months, July had the greatest wet deposition becauseof the relatively greater precipitation and more significantchemical oxidation of GEM. The high values of wet depo-sition at the south border in July and October were causedby the high RGM concentration from the BCs in the southboundary in both months.
The scarcity of observations for dry and wet mercurydeposition limited the evaluation of model performancefor mercury deposition. In China, wet deposition of35 µg m−2 yr−1 was reported in a rural area (Wujiang RiverBasin) in Guizhou in 2006 (Guo et al., 2008). Also,wet deposition of 150 µg m−2 yr−1 and dry deposition of170 µg m−2 yr−1 in the urban area of Changchun from July1999 to July 2000 were also reported (Feng et al., 2004b).The dry and wet deposition of mercury predicted by themodel was of the same order of magnitude with the re-ported values (15–120 µg m−2 yr−1 of wet deposition and30–130 µg m−2 yr−1 of dry deposition in Wujiang RiverBasin; and 35–260 µg m−2 yr−1 of wet deposition and 75–
480 µg m−2 yr−1 of dry deposition in Changchun, Jilin fromthe model results).
3.3 Regional mercury budgets and outflow caused bythe East Asian emissions
The regional mercury mass budgets of emission (E), depo-sition (D), and the total mercury mass at the beginning andthe end of each modeling month (IM and FM) as definedin Eq. (1) were calculated for GEM, RGM and PHg fromCMAQ-Hg model data. These values, as well as their trans-port budgets estimated according to Eq. (2), are summarizedin Table 3. It should be noted that the transport budgets cal-culated by Eq. (2) could not separate the deposition causedby RGM/PHg emissions from the deposition caused by GEMoxidation. Instead, they indicated the transport balances afterconsidering various atmospheric processes such as chemistryand deposition.
From Table 3, it is clear that dry deposition was the pri-mary removal mechanism for RGM and that wet depositionwas the main removal mechanism for PHg, although the dryand wet deposition fluxes were of the same order of magni-tude on the four-month basis. GEM was primarily removedthrough dry deposition due to its low solubility in the aque-ous phase and vegetation uptakes (Lin and Pehkonen, 1999;Lin et al., 2006a). The dry deposition of GEM had very largeseasonal variability, with the greatest removal in July dueto the decreased deposition resistance in the summer month(Lin et al., 2006a; Zhang et al., 2009). Assuming that an-nual deposition is equal to three times the four-month sum,we estimated that the total annual mercury deposition was
www.atmos-chem-phys.net/10/1853/2010/ Atmos. Chem. Phys., 10, 1853–1864, 2010
1860 C.-J. Lin et al.: Estimating mercury emission outflow from East Asia
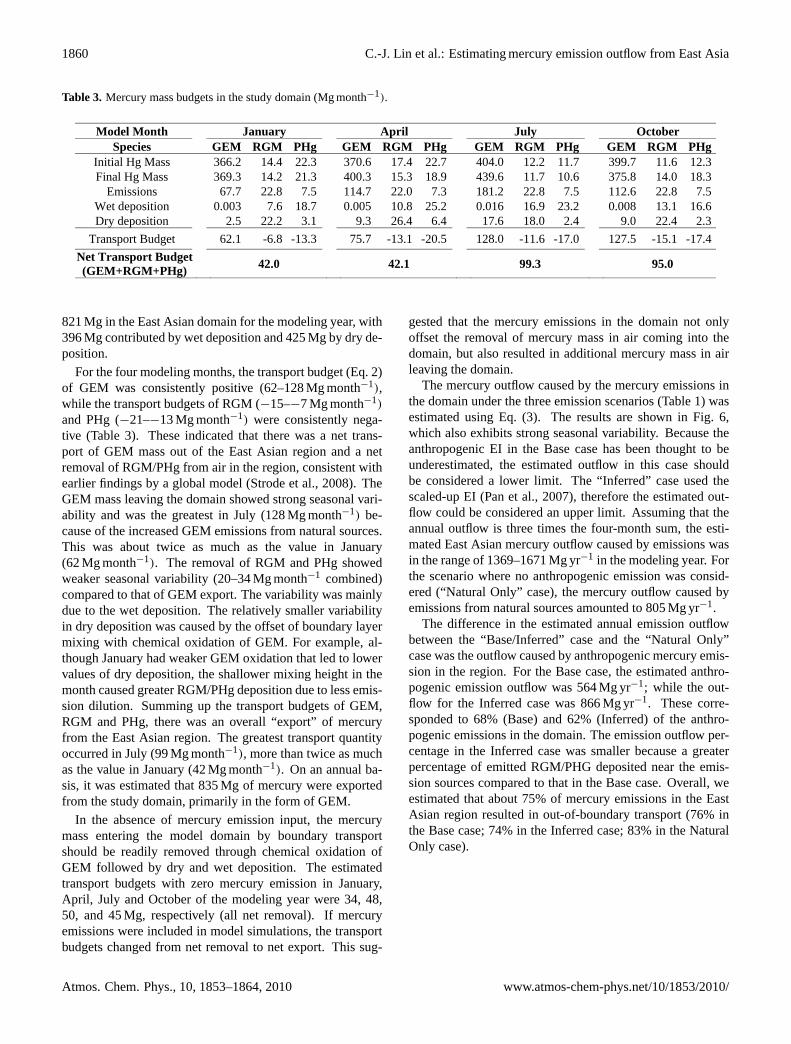
Table 3. Mercury mass budgets in the study domain (Mg month−1).
27
Table 3. Mercury mass budgets in the study domain (Mg month-1)
Model Month January April July October Species GEM RGM PHg GEM RGM PHg GEM RGM PHg GEM RGM PHg
Initial Hg Mass 366.2 14.4 22.3 370.6 17.4 22.7 404.0 12.2 11.7 399.7 11.6 12.3 Final Hg Mass 369.3 14.2 21.3 400.3 15.3 18.9 439.6 11.7 10.6 375.8 14.0 18.3
Emissions 67.7 22.8 7.5 114.7 22.0 7.3 181.2 22.8 7.5 112.6 22.8 7.5Wet deposition 0.003 7.6 18.7 0.005 10.8 25.2 0.016 16.9 23.2 0.008 13.1 16.6Dry deposition 2.5 22.2 3.1 9.3 26.4 6.4 17.6 18.0 2.4 9.0 22.4 2.3
Transport Budget 62.1 -6.8 -13.3 75.7 -13.1 -20.5 128.0 -11.6 -17.0 127.5 -15.1 -17.4Net Transport Budget (GEM+RGM+PHg) 42.0 42.1 99.3 95.0
821 Mg in the East Asian domain for the modeling year, with396 Mg contributed by wet deposition and 425 Mg by dry de-position.
For the four modeling months, the transport budget (Eq. 2)of GEM was consistently positive (62–128 Mg month−1),while the transport budgets of RGM (−15–−7 Mg month−1)
and PHg (−21–−13 Mg month−1) were consistently nega-tive (Table 3). These indicated that there was a net trans-port of GEM mass out of the East Asian region and a netremoval of RGM/PHg from air in the region, consistent withearlier findings by a global model (Strode et al., 2008). TheGEM mass leaving the domain showed strong seasonal vari-ability and was the greatest in July (128 Mg month−1) be-cause of the increased GEM emissions from natural sources.This was about twice as much as the value in January(62 Mg month−1). The removal of RGM and PHg showedweaker seasonal variability (20–34 Mg month−1 combined)compared to that of GEM export. The variability was mainlydue to the wet deposition. The relatively smaller variabilityin dry deposition was caused by the offset of boundary layermixing with chemical oxidation of GEM. For example, al-though January had weaker GEM oxidation that led to lowervalues of dry deposition, the shallower mixing height in themonth caused greater RGM/PHg deposition due to less emis-sion dilution. Summing up the transport budgets of GEM,RGM and PHg, there was an overall “export” of mercuryfrom the East Asian region. The greatest transport quantityoccurred in July (99 Mg month−1), more than twice as muchas the value in January (42 Mg month−1). On an annual ba-sis, it was estimated that 835 Mg of mercury were exportedfrom the study domain, primarily in the form of GEM.
In the absence of mercury emission input, the mercurymass entering the model domain by boundary transportshould be readily removed through chemical oxidation ofGEM followed by dry and wet deposition. The estimatedtransport budgets with zero mercury emission in January,April, July and October of the modeling year were 34, 48,50, and 45 Mg, respectively (all net removal). If mercuryemissions were included in model simulations, the transportbudgets changed from net removal to net export. This sug-
gested that the mercury emissions in the domain not onlyoffset the removal of mercury mass in air coming into thedomain, but also resulted in additional mercury mass in airleaving the domain.
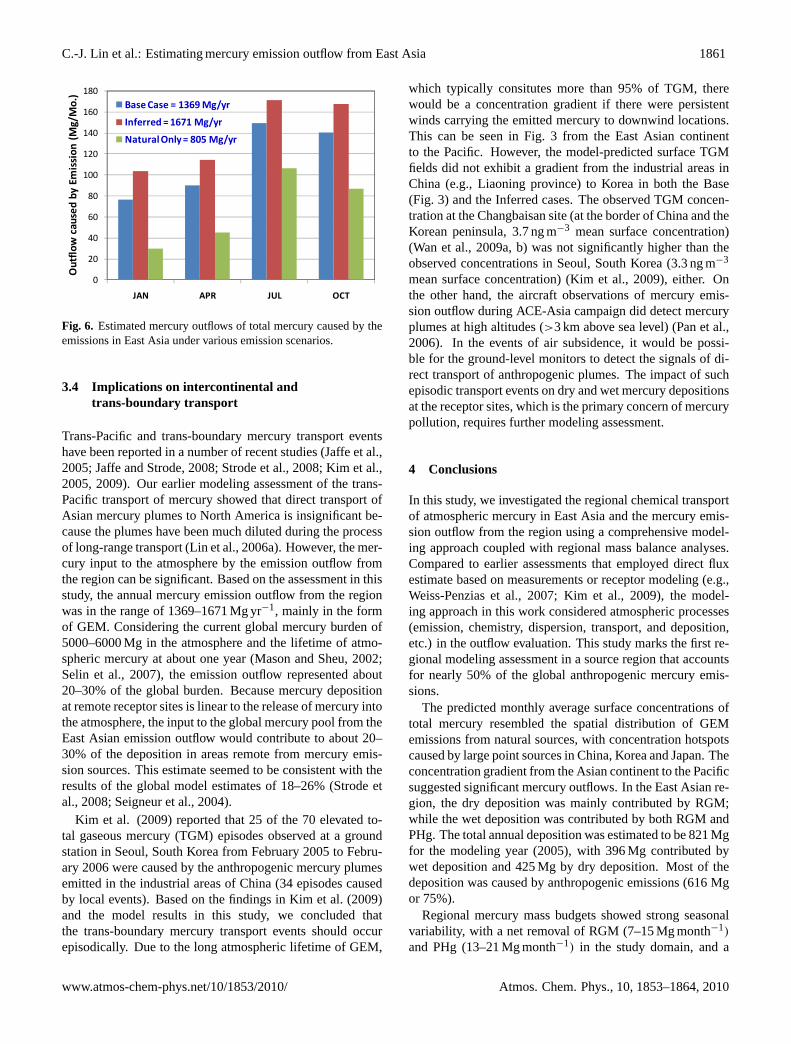
The mercury outflow caused by the mercury emissions inthe domain under the three emission scenarios (Table 1) wasestimated using Eq. (3). The results are shown in Fig. 6,which also exhibits strong seasonal variability. Because theanthropogenic EI in the Base case has been thought to beunderestimated, the estimated outflow in this case shouldbe considered a lower limit. The “Inferred” case used thescaled-up EI (Pan et al., 2007), therefore the estimated out-flow could be considered an upper limit. Assuming that theannual outflow is three times the four-month sum, the esti-mated East Asian mercury outflow caused by emissions wasin the range of 1369–1671 Mg yr−1 in the modeling year. Forthe scenario where no anthropogenic emission was consid-ered (“Natural Only” case), the mercury outflow caused byemissions from natural sources amounted to 805 Mg yr−1.
The difference in the estimated annual emission outflowbetween the “Base/Inferred” case and the “Natural Only”case was the outflow caused by anthropogenic mercury emis-sion in the region. For the Base case, the estimated anthro-pogenic emission outflow was 564 Mg yr−1; while the out-flow for the Inferred case was 866 Mg yr−1. These corre-sponded to 68% (Base) and 62% (Inferred) of the anthro-pogenic emissions in the domain. The emission outflow per-centage in the Inferred case was smaller because a greaterpercentage of emitted RGM/PHG deposited near the emis-sion sources compared to that in the Base case. Overall, weestimated that about 75% of mercury emissions in the EastAsian region resulted in out-of-boundary transport (76% inthe Base case; 74% in the Inferred case; 83% in the NaturalOnly case).
Atmos. Chem. Phys., 10, 1853–1864, 2010 www.atmos-chem-phys.net/10/1853/2010/
C.-J. Lin et al.: Estimating mercury emission outflow from East Asia 1861
24
0
20
40
60
80
100
120
140
160
180
JAN APR JUL OCT
Base Case = 1369 Mg/yr
Inferred = 1671 Mg/yr
Natural Only = 805 Mg/yr
Outflow caused by Em
ission (Mg/Mo.)
647
648
Fig. 6. Estimated mercury outflows of total mercury caused by the emissions in East Asia 649
under various emission scenarios 650
651
Fig. 6. Estimated mercury outflows of total mercury caused by theemissions in East Asia under various emission scenarios.
3.4 Implications on intercontinental andtrans-boundary transport
Trans-Pacific and trans-boundary mercury transport eventshave been reported in a number of recent studies (Jaffe et al.,2005; Jaffe and Strode, 2008; Strode et al., 2008; Kim et al.,2005, 2009). Our earlier modeling assessment of the trans-Pacific transport of mercury showed that direct transport ofAsian mercury plumes to North America is insignificant be-cause the plumes have been much diluted during the processof long-range transport (Lin et al., 2006a). However, the mer-cury input to the atmosphere by the emission outflow fromthe region can be significant. Based on the assessment in thisstudy, the annual mercury emission outflow from the regionwas in the range of 1369–1671 Mg yr−1, mainly in the formof GEM. Considering the current global mercury burden of5000–6000 Mg in the atmosphere and the lifetime of atmo-spheric mercury at about one year (Mason and Sheu, 2002;Selin et al., 2007), the emission outflow represented about20–30% of the global burden. Because mercury depositionat remote receptor sites is linear to the release of mercury intothe atmosphere, the input to the global mercury pool from theEast Asian emission outflow would contribute to about 20–30% of the deposition in areas remote from mercury emis-sion sources. This estimate seemed to be consistent with theresults of the global model estimates of 18–26% (Strode etal., 2008; Seigneur et al., 2004).
Kim et al. (2009) reported that 25 of the 70 elevated to-tal gaseous mercury (TGM) episodes observed at a groundstation in Seoul, South Korea from February 2005 to Febru-ary 2006 were caused by the anthropogenic mercury plumesemitted in the industrial areas of China (34 episodes causedby local events). Based on the findings in Kim et al. (2009)and the model results in this study, we concluded thatthe trans-boundary mercury transport events should occurepisodically. Due to the long atmospheric lifetime of GEM,
which typically consitutes more than 95% of TGM, therewould be a concentration gradient if there were persistentwinds carrying the emitted mercury to downwind locations.This can be seen in Fig. 3 from the East Asian continentto the Pacific. However, the model-predicted surface TGMfields did not exhibit a gradient from the industrial areas inChina (e.g., Liaoning province) to Korea in both the Base(Fig. 3) and the Inferred cases. The observed TGM concen-tration at the Changbaisan site (at the border of China and theKorean peninsula, 3.7 ng m−3 mean surface concentration)(Wan et al., 2009a, b) was not significantly higher than theobserved concentrations in Seoul, South Korea (3.3 ng m−3
mean surface concentration) (Kim et al., 2009), either. Onthe other hand, the aircraft observations of mercury emis-sion outflow during ACE-Asia campaign did detect mercuryplumes at high altitudes (>3 km above sea level) (Pan et al.,2006). In the events of air subsidence, it would be possi-ble for the ground-level monitors to detect the signals of di-rect transport of anthropogenic plumes. The impact of suchepisodic transport events on dry and wet mercury depositionsat the receptor sites, which is the primary concern of mercurypollution, requires further modeling assessment.
4 Conclusions
In this study, we investigated the regional chemical transportof atmospheric mercury in East Asia and the mercury emis-sion outflow from the region using a comprehensive model-ing approach coupled with regional mass balance analyses.Compared to earlier assessments that employed direct fluxestimate based on measurements or receptor modeling (e.g.,Weiss-Penzias et al., 2007; Kim et al., 2009), the model-ing approach in this work considered atmospheric processes(emission, chemistry, dispersion, transport, and deposition,etc.) in the outflow evaluation. This study marks the first re-gional modeling assessment in a source region that accountsfor nearly 50% of the global anthropogenic mercury emis-sions.
The predicted monthly average surface concentrations oftotal mercury resembled the spatial distribution of GEMemissions from natural sources, with concentration hotspotscaused by large point sources in China, Korea and Japan. Theconcentration gradient from the Asian continent to the Pacificsuggested significant mercury outflows. In the East Asian re-gion, the dry deposition was mainly contributed by RGM;while the wet deposition was contributed by both RGM andPHg. The total annual deposition was estimated to be 821 Mgfor the modeling year (2005), with 396 Mg contributed bywet deposition and 425 Mg by dry deposition. Most of thedeposition was caused by anthropogenic emissions (616 Mgor 75%).
Regional mercury mass budgets showed strong seasonalvariability, with a net removal of RGM (7–15 Mg month−1)
and PHg (13–21 Mg month−1) in the study domain, and a
www.atmos-chem-phys.net/10/1853/2010/ Atmos. Chem. Phys., 10, 1853–1864, 2010
1862 C.-J. Lin et al.: Estimating mercury emission outflow from East Asia
net export of GEM (60–130 Mg month−1) from the domainfor all four modeling months. The estimated annual emis-sion outflow from the East Asian region was in the range of1369–1671 Mg yr−1, of which 50–60% was caused by emis-sions from natural sources. This represents about 75% oftotal mercury emissions (anthropogenic plus natural) in theregion. About 65% of anthropogenic mercury emissions re-sulted in outflow, mainly into the Pacific.
The outflow caused by mercury emissions from the EastAsian region can contribute significantly to the global mer-cury pool in the atmosphere. Because mercury depositionat remote receptor sites is linear to the release of mercuryinto the atmosphere, the mercury outflow from the region cancontribute considerably to deposition in regions remote fromanthropogenic emissions. We estimated that the mercury out-flow from East Asia would contribute to 20–30% of mer-cury deposition at remote receptors. Major uncertainties ofthis assessment include mercury chemical mechanisms andmercury speciation of the anthropogenic emission estimates.Further understanding of mercury chemistry and emissionprocesses will greatly reduce the uncertainties.
Acknowledgements.The study is sponsored in parts by theTexas Air Research Center (Project No: 078LUB3068A), TexasCommission on Environmental Quality (Umbrella Contract No.582-7-83975), USEPA Office of Air Quality Planning & Standards(RTI Subcontract Number: 6-321-0210288), and the State KeyLaboratory of Environmental Geochemistry, Institute of Geo-chemistry, Chinese Academy of Sciences. The funding support isgratefully acknowledged.
Edited by: K.-H. Kim
References
Bullock, O. R. and Brehme, K. A.: Atmospheric mercury simula-tion using the cmaq model: Formulation description and analysisof wet deposition results, Atmos. Environ., 36, 2135–2146, 2002.
Byun, D. W. and Ching, J. K. S.: Science algorithms of the EPAModels-3 Community Multiscale Air Quality (CMAQ) modelingsystem. Rep EPA-600/R-99/030, Office of Research and Devel-opment, US Environmental Protection Agency, Washington, DC,1999.
Byun, D. and Schere, K. L.: Review of the governing equations,computational algorithms, and other components of the models-3 community multiscale air quality (CMAQ) modeling system,Appl. Mech. Rev., 59, 51–77, doi:10.1115/1.2128636, 2006.
Carmichael, G. R., Tang, Y., Kurata, G., Uno, I., Streets, D. G.,Thongboonchoo, N., Woo, J. H., Guttikunda, S., White, A.,Wang, T., Blake, D. R., Atlas, E., Fried, A., Potter, B., Avery,M. A., Sachse, G. W., Sandholm, S. T., Kondo, Y., Talbot, R. W.,Bandy, A., Thorton, D., and Clarke, A. D.: Evaluating regionalemission estimates using the trace-p observations, J. Geophys.Res.-Atmos., 108, 8810, doi:10.1029/2002jd003116, 2003.
Chand, D., Jaffe, D., Prestbo, E., Swartzendruber, P. C., Hafner,W., Weiss-Penzias, P., Kato, S., Takami, A., Hatakeyama, S., and
Kajii, Y.: Reactive and particulate mercury in the Asian marineboundary layer, Atmos. Environ., 42, 7988–7996, 2008.
Choi, E. M., Kim, S. H., Holsen, T. M., and Yi, S. M.: Total gaseousconcentrations in mercury in Seoul, Korea: Local sources com-pared to long-range transport from china and Japan, Environ.Pollut., 157, 816–822, doi:10.1016/j.envpol.2008.11.023, 2009.
Fang, F., Wang, Q., Liu, R., Ma, Z., and Hao, Q.: Atmosphericparticulate mercury in Changchun city, china, Atmos. Environ.,35, 4265–4272, 2001.
Fang, F. M., Wang, Q. C., and Li, J. F.: Urban environmen-tal mercury in Changchun, a metropolitan city in northeasternChina: Source, cycle, and fate, Sci. Total Environ., 330, 159–170, doi:10.1016/j.scitotenv.2004.04.006, 2004.
Feng, X. B., Shang, L. H., Wang, S. F., Tang, S. L., and Zheng,W.: Temporal variation of total gaseous mercury in the airof Guiyang, China, J. Geophys. Res.-Atmos., 109, D03303,doi:10.1029/2003JD004159, 2004a.
Feng, X. B., Yan, H. Y., Wang, S. F., Qiu, G. L., Tang, S. L., Shang,L. H., Dai, Q. J., and Hou, Y. M.: Seasonal variation of gaseousmercury exchange rate between air and water surface over Bai-hua reservoir, Guizhou, China, Atmos. Environ., 38, 4721–4732,2004b.
Feng, X. B., Wang, S. F., Qiu, G. A., Hou, Y. M., and Tang,S. L.: Total gaseous mercury emissions from soil in Guiyang,Guizhou, China, J. Geophys. Res.-Atmos., 110, D14306,doi:10.1029/2004JD005643, 2005.
Friedli, H. R., Radke, L. F., Prescott, R., Li, P., Woo, J. H.,and Carmichael, G. R.: Mercury in the atmosphere aroundJapan, Korea, and china as observed during the 2001 ACE-Asia field campaign: Measurements, distributions, sources,and implications, J. Geophys. Res.-Atmos., 109, D19S25,doi:10.1029/2003jd004244, 2004.
Fu, X. W., Feng, X. B., Zhu, W. Z., Wang, S. F., and Lu, J. L.: To-tal gaseous mercury concentrations in ambient air in the easternslope of Mt. Gongga, south-eastern fringe of the Tibetan plateau,china, Atmos. Environ., 42, 970–979, 2008a.
Fu, X. W., Feng, X. B., Zhu, W. Z., Zheng, W., Wang, S. F., and Lu,J. Y.: Total particulate and reactive gaseous mercury in ambientair on the eastern slope of the Mt. Gongga area, China, Appl.Geochem., 23, 408–418, 2008b.
Grell, G. A., Dudhia, J., and Stauffer, D. R.: A description ofthe fifth-generation Penn State/NCAR Mesoscale Model (MM5),NCAR Tech Note TN-398 + STR, 122 pp., 1994.
Guo, Y., Feng, X., Li, Z., He, T., Yan, H., Meng, B., Zhang, J.,and Qiu, G.: Distribution and wet deposition fluxes of total andmethyl mercury in Wujiang river basin, Guizhou, China, Atmos.Environ., 42, 7096–7103, 2008.
Holmes, C. D., Jacob, D. J., Mason, R. P., and Jaffe, D. A.: Sourcesand deposition of reactive gaseous mercury in the marine atmo-sphere, Atmos. Environ., 43, 2278–2285, 2009.
Jaffe, D., Prestbo, E., Swartzendruber, P., Weiss-Penzias, P., Kato,S., Takami, A., Hatakeyama, S., and Kajii, Y.: Export of atmo-spheric mercury from Asia, Atmos. Environ., 39, 3029–3038,doi:10.1016/j.atmosenv.2005.01.030, 2005.
Jaffe, D. and Strode, S.: Sources, fate and transport of at-mospheric mercury from Asia, Environ. Chem., 5, 121–126,doi:10.1071/en08010, 2008.
Kim, K. H., Ebinghaus, R., Schroeder, W. H., Blanchard, P., Kock,H. H., Steffen, A., Froude, F. A., Kim, M. Y., Hong, S. M., and
Atmos. Chem. Phys., 10, 1853–1864, 2010 www.atmos-chem-phys.net/10/1853/2010/
C.-J. Lin et al.: Estimating mercury emission outflow from East Asia 1863
Kim, J. H.: Atmospheric mercury concentrations from severalobservatory sites in the northern hemisphere, J. Atmos. Chem.,50, 1–24, doi:10.1007/s10874-005-9222-0, 2005.
Kim, S. H., Han, Y. J., Holsen, T. M., and Yi, S. M.: Characteristicsof atmospheric speciated mercury concentrations (TGM, Hg(II)and Hg(p)) in Seoul, Korea, Atmos. Environ., 43, 3267–3274,doi:10.1016/j.atmosenv.2009.02.038, 2009.
Lamborg, C. H., Fitzgerald, W. F., Vandal, G. M., and Rolfhus, K.R.: Atmospheric mercury in northern Wisconsin – sources andspecies, Water Air Soil Pollut., 80, 189–198, 1995.
Lin, C. J. and Pehkonen, S. O.: The chemistry of atmospheric mer-cury: A review, Atmos. Environ., 33, 2067–2079, 1999.
Lin, C.-J., Pongprueksa, P., Streets, D. G., Jang, C., Ho, T., and Chu,H.: Trans-Pacific Chemical Transport of Mercury: SensitivityAnalysis on Potential Asian Emission Contribution to MercuryDeposition in North America Using CMAQ-Hg, The 5th CMASConference, Research Triangle Park, NC, 16–18 October, 2006a.
Lin, C. J., Pongprueksa, P., Lindberg, S. E., Pehkonen, S. O., Byun,D., and Jang, C.: Scientific uncertainties in atmospheric mercurymodels I: Model science evaluation, Atmos. Environ., 40, 2911–2928, doi:10.1016/j.atmosenv.2006.01.009, 2006b.
Lin, C. J., Pongprueks, P., Rusell Bulock, O., Lindberg, S. E.,Pehkonen, S. O., Jang, C., Braverman, T., and Ho, T. C.: Sci-entific uncertainties in atmospheric mercury models II: Sensitiv-ity analysis in the CONUS domain, Atmos. Environ., 41, 6544–6560, doi:10.1016/j.atmosenv.2007.04.030, 2007.
Lindberg, S., Bullock, R., Ebinghaus, R., Engstrom, D., Feng, X.B., Fitzgerald, W., Pirrone, N., Prestbo, E., and Seigneur, C.: Asynthesis of progress and uncertainties in attributing the sourcesof mercury in deposition, Ambio, 36, 19–32, 2007.
Lindberg, S. E., Brooks, S., Lin, C. J., Scott, K. J., Landis, M. S.,Stevens, R. K., Goodsite, M., and Richter, A.: Dynamic oxida-tion of gaseous mercury in the arctic troposphere at polar sunrise,Environ. Sci. Technol., 36, 1245–1256, doi:10.1021/es0111941,2002.
Liu, S. L., Nadim, F., Perkins, C., Carley, R. J., Hoag, G. E., Lin, Y.H., and Chen, L. T.: Atmospheric mercury monitoring survey inBeijing, China, Chemosphere, 48, 97–107, 2002.
Mason, R. P., Morel, F. M. M., and Hemond, H. F.: The role of mi-croorganisms in elemental mercury formation in natural-waters,Water Air Soil Pollut., 80, 775–787, 1995.
Mason, R. P. and Sheu, G. R.: Role of the ocean in theglobal mercury cycle, Global Biogeochem. Cy., 16, 1093,doi:10.1029/2001gb001440, 2002.
Mason, R. P., Kim, E. H., Cornwell, J., and Heyes, D.: An exami-nation of the factors influencing the flux of mercury, methylmer-cury and other constituents from estuarine sediment, Ma-rine Chem., 102, 96–110, doi:10.1016/j.marchem.2005.09.021,2006.
Miller, C. L., Mason, R. P., Gilmour, C. C., and Heyes, A.: Influ-ence of dissolved organic matter on the complexation of mercuryunder sulfidic conditions, Environ. Toxic. Chem., 26, 624–633,2007.
Moussiopoulos, N., Helmis, C. G., Flocas, H. A., Louka, P.,Assimakopoulos, V. D., Naneris, C., and Sahm, P.: A mod-elling method for estimating transboundary air pollution insoutheastern Europe, Environ. Model. Softw., 19, 549–558,doi:10.1016/j.envsoft.2003.07.003, 2004.
Nguyen, H. T., Kim, K. H., Kim, M. Y., Hong, S. M., Youn, Y. H.,
Shon, Z. H., and Lee, J. S.: Monitoring of atmospheric mercuryat a global atmospheric watch (gaw) site on an-myun island, ko-rea, Water Air Soil Pollut., 185, 149–164, doi:10.1007/s11270-007-9438-5, 2007.
Pacyna, E. G., Pacyna, J. M., Steenhuisen, F., and Wilson, S.:Global anthropogenic mercury emission inventory for 2000, At-mos. Environ., 40, 4048–4063, 2006.
Pan, L., Woo, J. H., Carmichael, G. R., Tang, Y. H., Friedli,H. R., and Radke, L. F.: Regional distribution and emis-sions of mercury in East Asia: A modeling analysis of Asianpacific regional aerosol characterization experiment (ACE-Asia) observations, J. Geophys. Res.-Atmos., 111, D07109,doi:10.1029/2005jd006381, 2006.
Pan, L., Chai, T. F., Carmichael, G. R., Tang, Y. H., Streets, D.,Woo, J. H., Friedli, H. R., and Radke, L. F.: Top-down es-timate of mercury emissions in china using four-dimensionalvariational data assimilation, Atmos. Environ., 41, 2804–2819,doi:10.1016/j.atmosenv.2006.11.048, 2007.
Pan, L., Carmichael, G. R., Adhikary, B., Tang, Y. H., Streets, D.,Woo, J. H., Friedli, H. R., and Radke, L. F.: A regional analysisof the fate and transport of mercury in East Asia and an assess-ment of major uncertainties, Atmos. Environ., 42, 1144–1159,doi:10.1016/j.atmosenv.2007.10.045, 2008.
Pleim, J. E. and Byun, D. W.: Application of a new land-surface, drydeposition, and PBL model in the models-3 Community Multi-Scale Air Quality (CMAQ) model system, in: Air Pollution Mod-eling and Its Application XIV, edited by: Gryning, S. and Schier-meier, F. A., Kluwer Academic Publishers, New York, 297–305,2004.
Pongprueksa, P., Lin, C. J., Lindberg, S. E., Jang, C., Braver-man, T., Bullock, O. R., Ho, T. C., and Chu, H. W.:Scientific uncertainties in atmospheric mercury models III:Boundary and initial conditions, model grid resolution, andhg(ii) reduction mechanism, Atmos. Environ., 42, 1828–1845,doi:10.1016/j.atmosenv.2007.11.020, 2008.
Rolfhus, K. R., Sakamoto, H. E., Cleckner, L. B., Stoor, R. W.,Babiarz, C. L., Back, R. C., Manolopoulos, H., and Hurley, J.P.: Distribution and fluxes of total and methylmercury in lakesuperior, Environ. Sci. Technol., 37, 865–872, 2003.
Schroeder, W. H., Anlauf, K. G., Barrie, L. A., Lu, J. Y., Steffen, A.,Schneeberger, D. R., and Berg, T.: Arctic springtime depletion ofmercury, Nature, 394, 331–332, 1998.
Schroeder, W. H. and Munthe, J.: Atmospheric mercury – anoverview, Atmos. Environ., 32, 809–822, 1998.
Seigneur, C., Vijayaraghavan, K., Lohman, K., Karamchandani,P., and Scott, C.: Global source attribution for mercury depo-sition in the united states, Environ. Sci. Technol., 38, 555–569,doi:10.1021/es034109t, 2004.
Selin, N. E., Jacob, D. J., Park, R. J., Yantosca, R. M.,Strode, S., Jaegle, L., and Jaffe, D.: Chemical cyclingand deposition of atmospheric mercury: Global constraintsfrom observations, J. Geophys. Res.-Atmos., 112, D02308,doi:10.1029/2006jd007450, 2007.
Shetty, S. K., Lin, C. J., Streets, D. G., and Jang, C.: Model estimateof mercury emission from natural sources in East Asia, Atmos.Environ., 42, 8674–8685, doi:10.1016/j.atmosenv.2008.08.026,2008.
Shia, R. L., Seigneur, C., Pai, P., Ko, M., and Sze, N. D.: Globalsimulation of atmospheric mercury concentrations and deposi-
www.atmos-chem-phys.net/10/1853/2010/ Atmos. Chem. Phys., 10, 1853–1864, 2010
1864 C.-J. Lin et al.: Estimating mercury emission outflow from East Asia
tion fluxes, J. Geophys. Res.-Atmos., 104, 23747–23760, 1999.Stratton, W. J., Lindberg, S. E., and Perry, C. J.: Atmospheric mer-
cury speciation: Laboratory and field evaluation of a mist cham-ber method for measuring reactive gaseous mercury, Environ.Sci. Technol., 35, 170–177, 2001.
Streets, D. G., Hao, J. M., Wu, Y., Jiang, J. K., Chan, M., Tian, H.Z., and Feng, X. B.: Anthropogenic mercury emissions in china,Atmos. Environ., 39, 7789–7806, 2005.
Streets, D. G., Zhang, Q., and Wu, Y.: Projection of global mercuryemission in 2050, Environ. Sci. Technol., 43, 2983–2988, 2009.
Strode, S. A., Jaegle, L., Jaffe, D. A., Swartzendruber, P. C.,Selin, N. E., Holmes, C., and Yantosca, R. M.: Trans-pacifictransport of mercury, J. Geophys. Res.-Atmos., 113, D15305,doi:10.1029/2007jd009428, 2008.
Wan, Q., Feng, X. B., Lu, J., Zheng, W., Song, X. J., Li, P., Han,S. J., and Xu, H.: Atmospheric mercury in Changbai mountainarea, northeastern china II: The distribution of reactive gaseousmercury and particulate mercury and mercury deposition fluxes,Environ. Res., 109, 721–727, 2009a.
Wan, Q., Feng, X. B., Lu, J. L., Zheng, W., Song, X. J., Han, S. J.,and Xu, H.: Atmospheric mercury in Changbai mountain area,northeastern China I: The seasonal distribution pattern of totalgaseous mercury and its potential sources, Environ. Res., 109,201–206, 2009b.
Wang, Z. W., Zhang, X. S., Chen, Z. S., and Zhang, Y.: Mer-cury concentrations in size-fractionated airborne particles at ur-ban and suburban sites in Beijing, China, Atmos. Environ., 40,2194–2201, 2006.
Wang, Z. W., Chen, Z. S., Duan, N., and Zhang, X. S.: Gaseous ele-mental mercury concentration in atmosphere at urban and remotesites in china, J. Environ. Sci.-China, 19, 176–180, 2007.
Weiss-Penzias, P., Jaffe, D. A., Swartzendruber, P., Dennison, J. B.,Chand, D., Hafner, W., and Prestbo, E.: Observations of Asianair pollution in the free troposphere at mount bachelor observa-tory during the spring of 2004, J. Geophys. Res.-Atmos., 111,D10304, doi:10.1029/2005jd006522, 2006.
Weiss-Penzias, P., Jaffe, D., Swartzendruber, P., Hafner, W., Chand,D., and Prestbo, E.: Quantifying Asian and biomass burningsources of mercury using the Hg/CO ratio in pollution plumesobserved at the mount bachelor observatory, Atmos. Environ.,41, 4366–4379, doi:10.1016/j.atmosenv.2007.01.058, 2007.
Wu, Y., Wang, S. X., Streets, D. G., Hao, J. M., Chan, M., andJiang, J. K.: Trends in anthropogenic mercury emissions inChina from 1995 to 2003, Environ. Sci. Technol., 40, 5312–5318, doi:10.1021/es060406x, 2006.
Xiu, G. L., Cai, J., Zhang, W. Y., Zhang, D. N., Bueler, A., Lee, S.C., Shen, Y., Xu, L. H., Huang, X. J., and Zhang, P.: Speciatedmercury in size-fractionated particles in shanghai ambient air,Atmos. Environ., 43, 3145–3154, 2009.
Yang, Y. K., Chen, H., and Wang, D. Y.: Spatial and temporal distri-bution of gaseous elemental mercury in Chongqing, China, Env-iron. Monit. Assess., 156, 479–489, 2009.
Zender, C. S. and Mangalarn, H.: Scaling properties of commonstatistical operators for gridded datasets, International Journalof High Performance Computing Applications, 21, 485–498,doi:10.1177/1094342007083802, 2007.
Zhang, L., Wright, L. P., and Blanchard, P.: A review of currentknowledge concerning dry deposition of atmospheric mercury,Atmos. Environ., 43, 5853–5864, 2009.
Atmos. Chem. Phys., 10, 1853–1864, 2010 www.atmos-chem-phys.net/10/1853/2010/