Embed Size (px)
Citation preview
1
Estimation method for child mortality Used in: Level and Trends of Child mortality -Report 2013
Estimates developed by the WHO, UNICEF, UN Population Division
and World Bank consultation September 2013
The United Nations Inter-agency Group for Child Mortality Estimation (UN IGME), which includes members from UNICEF, WHO, the World Bank and United Nations Population Division, was established in 2004 to advance the work on monitoring progress towards the achievement of Millennium Development Goals regarding child mortality.
1. Strategy UN IGME follows the following broad strategy to arrive at annual estimates of child mortality: 1. Compile and assess the quality of all newly available nationally-representative data relevant to the
estimation of child mortality including data from vital registration systems, population censuses, household surveys and sample registration systems.
2. Assess data quality, recalculate data and make adjustments if needed by applying standard methods 3. Fit a statistical model to the data observations to generate a trend curve that smooths possibly disparate
estimates 4. Extrapolate the model to a target year, in this case 2012 Estimates for child mortality have been revised to take account of new data. Therefore they may not be entirely comparable with those published in the previous UN IGME report (1) or World Health Statistics 2013 (2). To increase the transparency of the estimation process, the UN IGME has developed a child mortality database CME Info (www.childmortality.org). It includes all available data and shows estimates for each country. as well as which data is currently officially used by UN IGME.
2. Data Sources Nationally-representative estimates of under-five mortality can be derived from a number of different sources, including civil registration and sample surveys, but excluding demographic surveillance sites and hospital data, which are rarely representative. The preferred source of data is a civil registration system which records births and deaths on a continuous basis. If registration is complete and the system functions efficiently, the resulting estimates will be accurate and timely. However, in the developing world most countries do not have well-functioning vital registration systems, and household surveys, such as the UNICEF-supported Multiple Indicator Cluster Surveys (MICS), the USAID-supported Demographic and Health Surveys (DHS) and periodic population censuses have become the primary source of data on under-five and infant mortality in developing countries. These surveys ask women about the survival of their children, and it is these reports that provide the basis of child mortality estimates for a majority of developing countries. The first step in the process of arriving at estimates of levels and recent trends of the under-5 mortality rate or infant mortality rate is to compile all newly available data, and add the data to a database. Newly available data will include newly released vital statistics from a civil registration system; results from recent
2
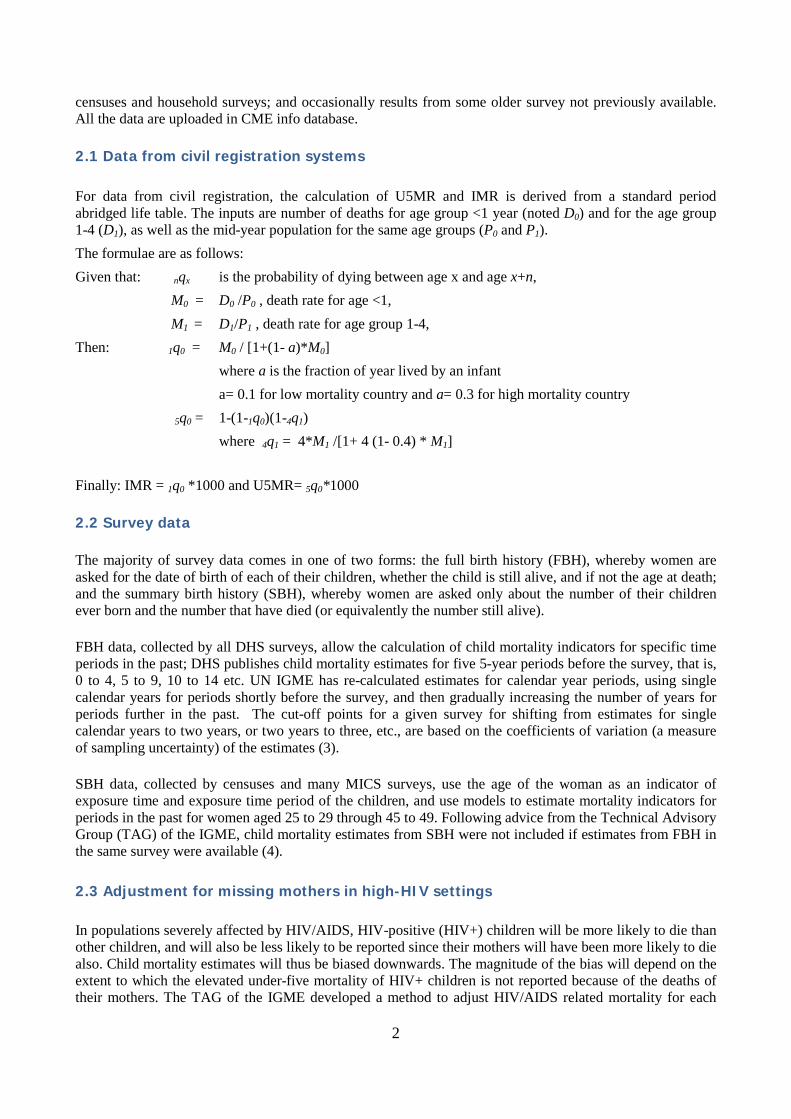
censuses and household surveys; and occasionally results from some older survey not previously available. All the data are uploaded in CME info database. 2.1 Data from civil registration systems For data from civil registration, the calculation of U5MR and IMR is derived from a standard period abridged life table. The inputs are number of deaths for age group <1 year (noted D0) and for the age group 1-4 (D1), as well as the mid-year population for the same age groups (P0 and P1). The formulae are as follows: Given that: nqx is the probability of dying between age x and age x+n,
M0 = D0 /P0 , death rate for age <1, M1 = D1/P1 , death rate for age group 1-4,
Then: 1q0 = M0 / [1+(1- a)*M0] where a is the fraction of year lived by an infant
a= 0.1 for low mortality country and a= 0.3 for high mortality country 5q0 = 1-(1-1q0)(1-4q1)
where 4q1 = 4*M1 /[1+ 4 (1- 0.4) * M1]
Finally: IMR = 1q0 *1000 and U5MR= 5q0*1000 2.2 Survey data The majority of survey data comes in one of two forms: the full birth history (FBH), whereby women are asked for the date of birth of each of their children, whether the child is still alive, and if not the age at death; and the summary birth history (SBH), whereby women are asked only about the number of their children ever born and the number that have died (or equivalently the number still alive).
FBH data, collected by all DHS surveys, allow the calculation of child mortality indicators for specific time periods in the past; DHS publishes child mortality estimates for five 5-year periods before the survey, that is, 0 to 4, 5 to 9, 10 to 14 etc. UN IGME has re-calculated estimates for calendar year periods, using single calendar years for periods shortly before the survey, and then gradually increasing the number of years for periods further in the past. The cut-off points for a given survey for shifting from estimates for single calendar years to two years, or two years to three, etc., are based on the coefficients of variation (a measure of sampling uncertainty) of the estimates (3).
SBH data, collected by censuses and many MICS surveys, use the age of the woman as an indicator of exposure time and exposure time period of the children, and use models to estimate mortality indicators for periods in the past for women aged 25 to 29 through 45 to 49. Following advice from the Technical Advisory Group (TAG) of the IGME, child mortality estimates from SBH were not included if estimates from FBH in the same survey were available (4).
2.3 Adjustment for missing mothers in high-HIV settings In populations severely affected by HIV/AIDS, HIV-positive (HIV+) children will be more likely to die than other children, and will also be less likely to be reported since their mothers will have been more likely to die also. Child mortality estimates will thus be biased downwards. The magnitude of the bias will depend on the extent to which the elevated under-five mortality of HIV+ children is not reported because of the deaths of their mothers. The TAG of the IGME developed a method to adjust HIV/AIDS related mortality for each
3
survey data observation from FBH during HIV/AIDS epidemic (1980-present), by adopting a set of simplified but reasonable assumptions about the distribution of births to HIV+ women, primarily relating to the duration of their infection, vertical transmission rates, and survival times of both mothers and children from the time of the birth (5). This method was applied to all World Fertility Surveys, as well as the Demographic and Health Surveys. 2.4 Adjustment for rapidly changing child mortality driven by HIV/AIDS To capture the extraordinarily rapid changes in child mortality driven by HIV/AIDS over the epidemic period in some countries, the regression models were fitted to data points for the U5MR from all other causes than HIV/AIDS, and then UNAIDS estimates of HIV/AIDS under-five mortality were added to estimates from the regression model. This method was used for 17 countries where the HIV prevalence rate exceeded 5% at any point in time since 1980. Steps were as follows:
1. Compile and assess the quality of all newly available nationally-representative data relevant to the estimation of child mortality.
2. Adjust survey data to account for possible biases in data collection and in HIV/AIDS epidemic. 3. Use UNAIDS estimates of HIV/AIDS child mortality (6) to adjust the data points from 1980
onwards to exclude HIV deaths. 4. Fit the standard statistical model (see Section 3) to the observations to HIV-free data points. 5. Extrapolate the model to the target year, in this case 2012. 6. Add back estimates of death due to HIV/UNAIDS (from UNAIDS) 7. For the epidemic period, a non-HIV curve of IMR is derived from U5MR using model life tables
(see Section 4) and then the UNAIDS estimates of HIV/AIDS deaths for children under age 1 are added to generate the final IMR estimates.
4
2.5 Adjustment for under-reporting of infant deaths There are concerns about incompleteness of early infant mortality data from civil registration in some European countries. An European report on perinatal indicators, for example, noted a wide variation in how European countries define infant mortality, due to differences in birth and death registration practices (that is, differences in the cut-off points for acceptable weight or estimated gestation period to be registered as a birth and subsequent death) (7-8). This discrepancy can lead to under-reporting of infant deaths by some countries, particularly when compared with countries that use a broader definition for live birth. The international discrepancies in data may have existed for some time, but they have been overlooked because of much higher infant mortality rates. Now that rates are so much lower, however, differences in registration may be more important in explaining inter-country differences in infant mortality. (9) Therefore, child mortality was first adjusted before running the regression model described in the following Section. The UN IGME examined the strong evidence that early neonatal deaths are under-reported for the Russian Federation and agreed that an adjustment of the order of 25% should be made to the Russian estimates of infant mortality based on the published analyses. As this problem was also known to be present for some other of the Eastern European countries (10), UN IGME carried out an analysis of the ratio of early neonatal (under 7 day) deaths to total neonatal deaths. The average value of this ratio for Western European countries was 0.77 with few values below 0.7. A statistical analysis of this ratio for available country-years found that the ratio was significantly lower than the Western European average for the following countries: Belarus, Bulgaria, Czech Republic, Estonia, Greece, Hungary, Latvia, Lithuania, Romania, Russian Federation, Slovakia, Spain. In only four countries did this ratio change significantly over time, and in all cases it was decreasing not increasing. Based on this analysis, it was decided to apply a 10% upward adjustment to under-5 mortality for Belarus, Hungary and Lithuania; and a 20% adjustment for the other countries, including the Russian Federation. In all cases, a single country-specific correction factor was applied to the entire time series, except for Estonia from 1992 onwards. 2.8 Systematic and random measurement error Data from these different sources require different calculation methods and may suffer from different errors, for example random errors in sample surveys or systematic errors due to misreporting. As a result, different surveys often yield widely different estimates of U5MR for a given time period. In order to reconcile these differences and take better account of the systematic biases associated with the various types of data inputs, the TAG has developed a new estimation method to fit a smoothed trend curve to a set of observations and to extrapolate that trend to a defined time point, in this case 2012. This method is described in the following section.
3. Improved estimates for levels and trends in under-5 mortality 3.1 Summary This year, a new estimation method is used for the estimation and projection of the under-5 mortality rate (U5MR), referred to as the Bayesian B-splines bias-adjusted model or the B3 model. The infant mortality rate (IMR) is obtained by either applying the B3 estimation method or by applying a model life table to the U5MR estimates as described in Section 4. In the B3 model, log(U5MR) is estimated with a flexible splines regression model, explained in section 3.2. The spline regression model is fitted to all U5MR observations in the country. An observed value for U5MR is considered to be the true value for U5MR multiplied by an error factor, i.e. observed U5MR = true U5MR * error, or on the log-scale, log(observed u5mr) = log(true U5MR) + log(error), where error refers to the
5
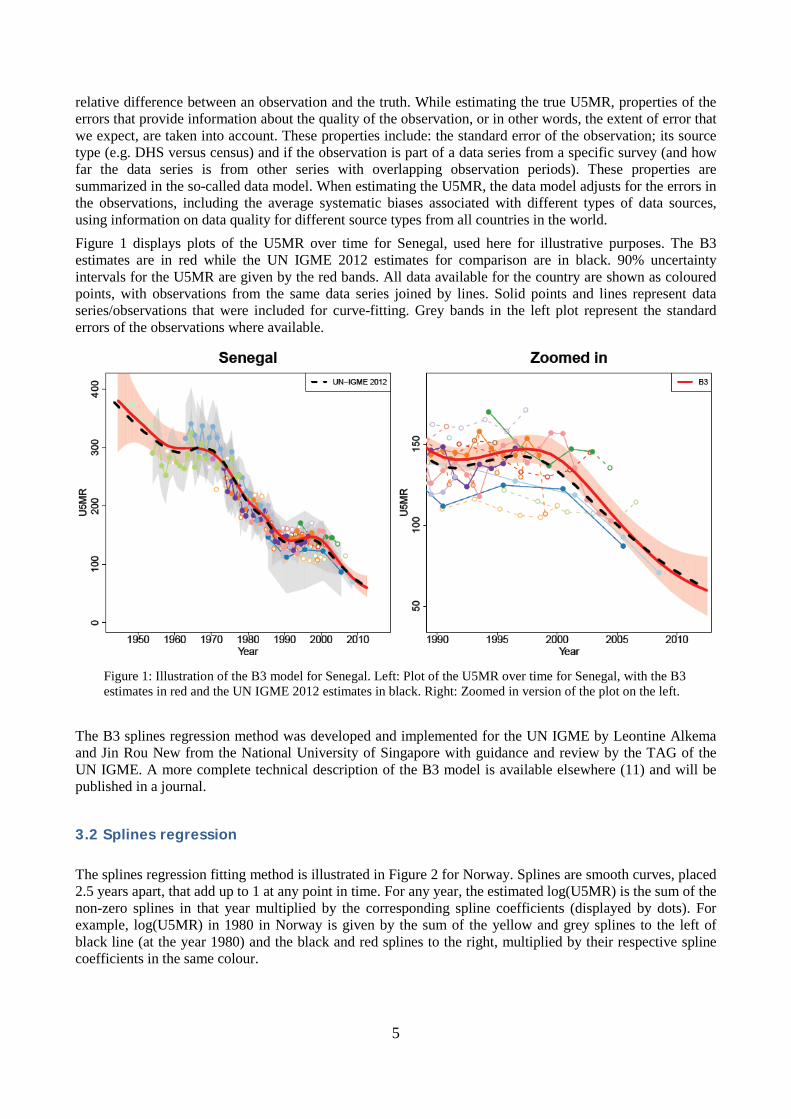
relative difference between an observation and the truth. While estimating the true U5MR, properties of the errors that provide information about the quality of the observation, or in other words, the extent of error that we expect, are taken into account. These properties include: the standard error of the observation; its source type (e.g. DHS versus census) and if the observation is part of a data series from a specific survey (and how far the data series is from other series with overlapping observation periods). These properties are summarized in the so-called data model. When estimating the U5MR, the data model adjusts for the errors in the observations, including the average systematic biases associated with different types of data sources, using information on data quality for different source types from all countries in the world. Figure 1 displays plots of the U5MR over time for Senegal, used here for illustrative purposes. The B3 estimates are in red while the UN IGME 2012 estimates for comparison are in black. 90% uncertainty intervals for the U5MR are given by the red bands. All data available for the country are shown as coloured points, with observations from the same data series joined by lines. Solid points and lines represent data series/observations that were included for curve-fitting. Grey bands in the left plot represent the standard errors of the observations where available.
Figure 1: Illustration of the B3 model for Senegal. Left: Plot of the U5MR over time for Senegal, with the B3 estimates in red and the UN IGME 2012 estimates in black. Right: Zoomed in version of the plot on the left.
The B3 splines regression method was developed and implemented for the UN IGME by Leontine Alkema and Jin Rou New from the National University of Singapore with guidance and review by the TAG of the UN IGME. A more complete technical description of the B3 model is available elsewhere (11) and will be published in a journal.
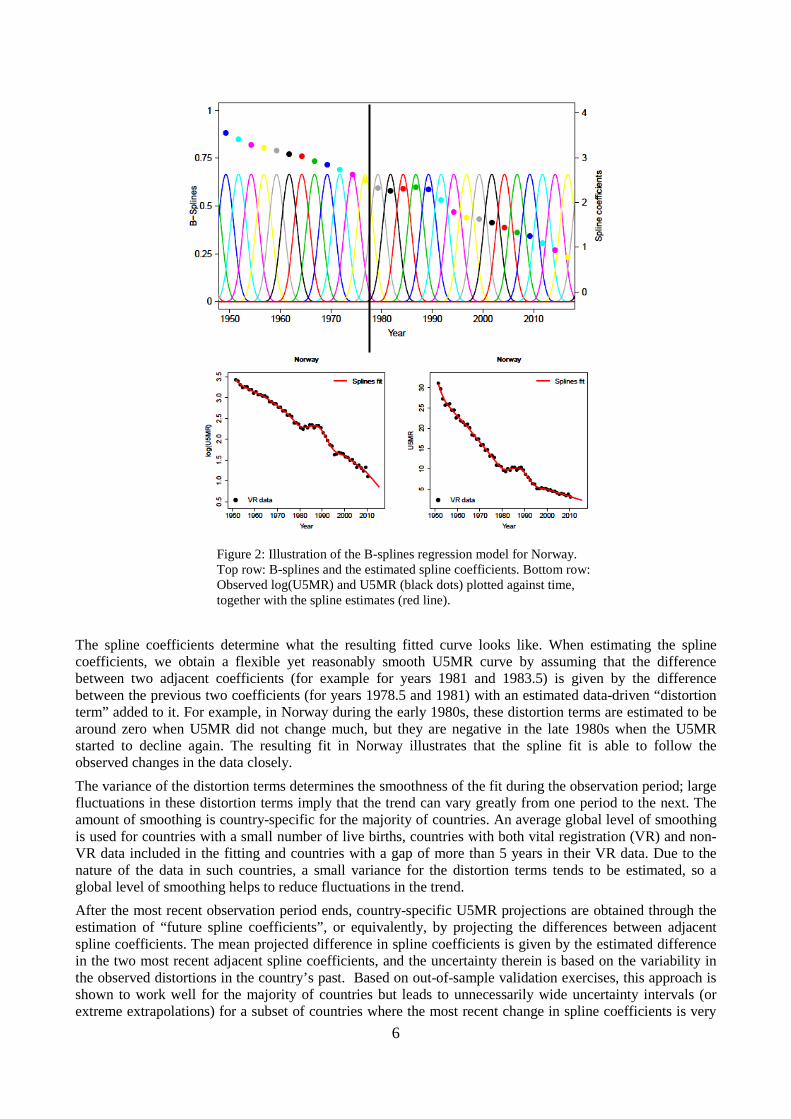
3.2 Splines regression The splines regression fitting method is illustrated in Figure 2 for Norway. Splines are smooth curves, placed 2.5 years apart, that add up to 1 at any point in time. For any year, the estimated log(U5MR) is the sum of the non-zero splines in that year multiplied by the corresponding spline coefficients (displayed by dots). For example, log(U5MR) in 1980 in Norway is given by the sum of the yellow and grey splines to the left of black line (at the year 1980) and the black and red splines to the right, multiplied by their respective spline coefficients in the same colour.
6
Figure 2: Illustration of the B-splines regression model for Norway. Top row: B-splines and the estimated spline coefficients. Bottom row: Observed log(U5MR) and U5MR (black dots) plotted against time, together with the spline estimates (red line).
The spline coefficients determine what the resulting fitted curve looks like. When estimating the spline coefficients, we obtain a flexible yet reasonably smooth U5MR curve by assuming that the difference between two adjacent coefficients (for example for years 1981 and 1983.5) is given by the difference between the previous two coefficients (for years 1978.5 and 1981) with an estimated data-driven “distortion term” added to it. For example, in Norway during the early 1980s, these distortion terms are estimated to be around zero when U5MR did not change much, but they are negative in the late 1980s when the U5MR started to decline again. The resulting fit in Norway illustrates that the spline fit is able to follow the observed changes in the data closely. The variance of the distortion terms determines the smoothness of the fit during the observation period; large fluctuations in these distortion terms imply that the trend can vary greatly from one period to the next. The amount of smoothing is country-specific for the majority of countries. An average global level of smoothing is used for countries with a small number of live births, countries with both vital registration (VR) and non-VR data included in the fitting and countries with a gap of more than 5 years in their VR data. Due to the nature of the data in such countries, a small variance for the distortion terms tends to be estimated, so a global level of smoothing helps to reduce fluctuations in the trend. After the most recent observation period ends, country-specific U5MR projections are obtained through the estimation of “future spline coefficients”, or equivalently, by projecting the differences between adjacent spline coefficients. The mean projected difference in spline coefficients is given by the estimated difference in the two most recent adjacent spline coefficients, and the uncertainty therein is based on the variability in the observed distortions in the country’s past. Based on out-of-sample validation exercises, this approach is shown to work well for the majority of countries but leads to unnecessarily wide uncertainty intervals (or extreme extrapolations) for a subset of countries where the most recent change in spline coefficients is very
7
uncertain (or an extreme value). We avoid such uncertain and extreme U5MR extrapolations in longer-term projections by combining the country-specific projected differences in spline coefficients with a global distribution of observed differences in the past. This final step results in the removal of very extreme U5MR extrapolations in the country-specific U5MR projections.
3.3 Why was a new fitting method implemented? For evaluating progress in reducing U5MR, accurate estimates of the rate of reduction and the uncertainty associated with it are required. The UN IGME 2012 estimates were based on the Loess estimation approach, and uncertainty bounds were obtained through a bootstrap method. The new B3 method was recommended by the TAG because compared to the previous method,
- The B3 model better accounts for data errors (including biases and sampling and non-sampling errors in the data),
- The splines model can better capture short-term fluctuations in the U5MR and ARR, and - The B3 model performs better in out-of-sample validation exercises. In summary, as compared to the
previous estimation approach, the B3 model is better able to take into account evidence of acceleration in the decline of U5MR from new surveys.
4. Estimation of infant mortality rates In general, the B3 model described above is applied to the U5MR for all countries (except for the Democratic Republic of Korea, where a nonstandard method was employed). For countries with high-quality VR data (covering a sufficient period of time and deemed to have high levels of completeness and coverage), the B3 model is also used, but is fitted to the logit transform of r, i.e. log(r/1-r), where r is the ratio of the IMR to the median B3 estimates of U5MR in the corresponding country-year. This is to restrict the IMR to be lower than the U5MR. For the remaining countries, the IMR is derived from the U5MR, through the use of model life tables that contain known regularities in age patterns of child mortality (12). The advantage of this approach is that it avoids potential problems with the under-reporting of neonatal deaths in some countries and ensures that the internal relationships of the three indicators are consistent with established norms.
5. Estimates by sex In 2012, the UN IGME produced estimates of U5MR for males and females separately for the first time (13). In many countries, fewer sources have provided data by sex than have provided data for both sexes combined. For this reason, the UN IGME, rather than estimate U5MR trends by sex directly from reported mortality levels by sex, uses the available data by sex to estimate a time trend in the sex ratio (male/female ratio) of U5MR instead. This year, Leontine Alkema and Fengqing Chao of the National University of Singapore have developed new Bayesian methods for the UN IGME estimation of sex ratios, with a focus on the estimation and identification of countries with outlying levels or trends (14). For each country-year, we assume that the sex ratio of infant mortality S1(t) which refers to the ratio of the probability of dying before age one for boys as compared to girls for country c in year t is given by S1(t) = W1(t) * P1(t),
where - W1(t) refers to the expected sex ratio for that country-year (subscripts c suppressed), - Country multiplier P1(t) represent the relative advantage or disadvantage of infant girls
to boys compared to other countries at similar levels of infant mortality.
8
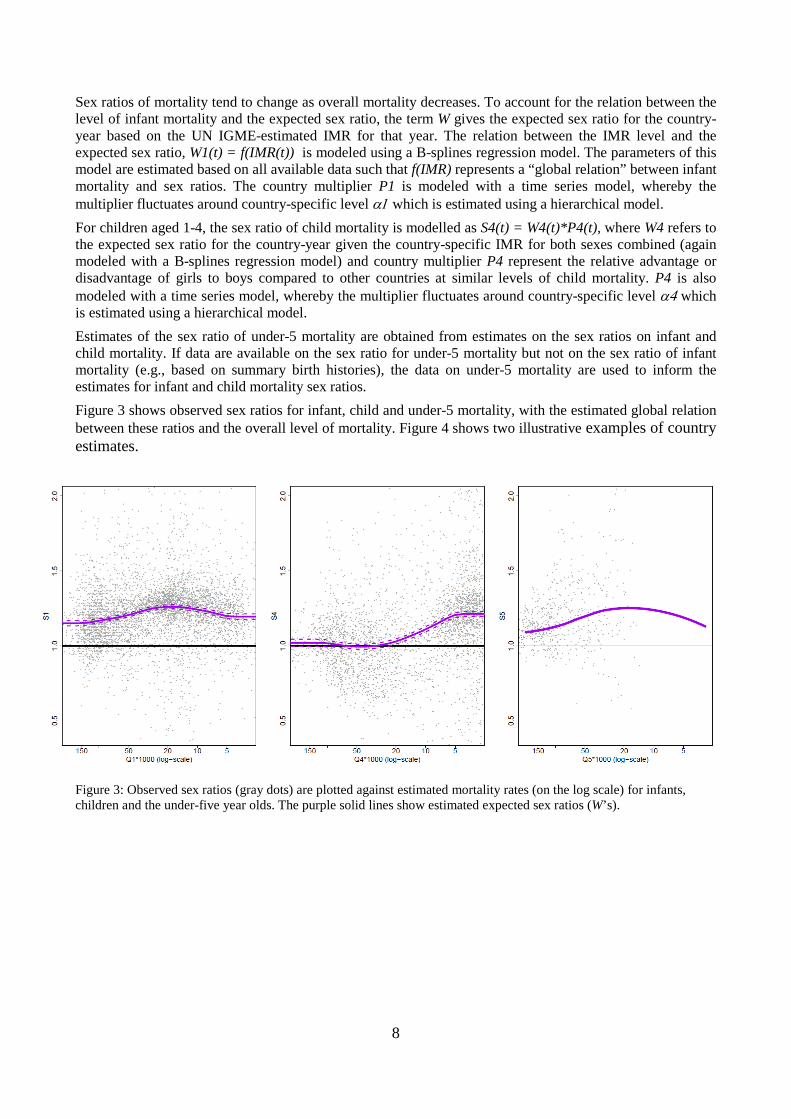
Sex ratios of mortality tend to change as overall mortality decreases. To account for the relation between the level of infant mortality and the expected sex ratio, the term W gives the expected sex ratio for the country-year based on the UN IGME-estimated IMR for that year. The relation between the IMR level and the expected sex ratio, W1(t) = f(IMR(t)) is modeled using a B-splines regression model. The parameters of this model are estimated based on all available data such that f(IMR) represents a “global relation” between infant mortality and sex ratios. The country multiplier P1 is modeled with a time series model, whereby the multiplier fluctuates around country-specific level α1 which is estimated using a hierarchical model. For children aged 1-4, the sex ratio of child mortality is modelled as S4(t) = W4(t)*P4(t), where W4 refers to the expected sex ratio for the country-year given the country-specific IMR for both sexes combined (again modeled with a B-splines regression model) and country multiplier P4 represent the relative advantage or disadvantage of girls to boys compared to other countries at similar levels of child mortality. P4 is also modeled with a time series model, whereby the multiplier fluctuates around country-specific level α4 which is estimated using a hierarchical model. Estimates of the sex ratio of under-5 mortality are obtained from estimates on the sex ratios on infant and child mortality. If data are available on the sex ratio for under-5 mortality but not on the sex ratio of infant mortality (e.g., based on summary birth histories), the data on under-5 mortality are used to inform the estimates for infant and child mortality sex ratios. Figure 3 shows observed sex ratios for infant, child and under-5 mortality, with the estimated global relation between these ratios and the overall level of mortality. Figure 4 shows two illustrative examples of country estimates.
Figure 3: Observed sex ratios (gray dots) are plotted against estimated mortality rates (on the log scale) for infants, children and the under-five year olds. The purple solid lines show estimated expected sex ratios (W’s).

9
Country A
Country B
Figure 4: Illustrative example of country estimates of sex ratios S and country multipliers P for two countries. In country A, for a subset of observed country-years for infants and under-five year olds, the sex ratio of mortality of boys versus girls is higher than expected based on the estimated world level relation between sex ratios and mortality levels. In country B, for a subset of observed country-years for infants and for all years for the 1-4 and under-five year olds, the sex ratio of mortality of boys versus girls is lower than expected based on the estimated world level relation between sex ratios and mortality levels.
Explanation of each country plot: Top row: Estimated sex ratio S for the three age groups (red) and world term W (green). Bottom row: Estimated country multipliers P for the three age groups. Shaded areas illustrate the 95% credible bounds.
10
6. Calculating number of deaths The absolute number of deaths among infants and children in a given year and country is calculated using the central death rates of age groups 0 and 1-4 years, M0 and M1, computed from the estimated U5MR and IMR as follows. First, the probability of dying between exact ages 1 and 5 is derived as follows: 4q1 = (U5MR - IMR/(1000-IMR). Then:
M0 = IMR /[1000 - (1-a)* IMR] M1 = 4*4q1 / 4*[1-(1-0.4)*4q1]
where a is the fraction of year lived by an infant = 0.1 for low mortality country and a= 0.3 for high mortality country
Finally, country population estimates from the World Population Prospects: the 2012 revision (15) are used to convert the death rates to numbers of deaths.
7. Methods to generate estimates of neonatal mortality The neonatal mortality rate (NMR) is defined as the probability of dying before 28 days per 1000 live births. UN IGME methods for analysis of NMR are slightly updated from those recently published (16). The sources of data for NMR are basically the same as for under-5 mortality and infant mortality rate. A database consisting of pairs of neonatal mortality per 1000 live births (NMRs) and under-5 mortality per 1000 live births (U5MRs) was compiled. For a given year, NMR and U5MR were included in the database when data for both of these were available. To ensure consistency with U5MR estimates produced by UN IGME, U5MR and NMR data points were rescaled for all years to match the UN IGME estimates produced by UN IGME. The following statistical model was used to estimate NMR:
log(NMR/1000) = α0+ β1*log(U5MR/1000) + β2*([log(U5MR/1000)] 2) with additional random effect intercept parameters for both country and region. For countries with good vital registration data covering the period 1990-2010, we added random effects parameters for slope or trend parameters as well. Based on predictive performance evaluation using ten-fold cross-validation, the statistical model was fitted to data point for 1990 onwards were retained and we only included the most recent data point from each survey. To obtain the number of neonatal deaths, live births were applied to neonatal mortality rates. The live births were calculated by taking the infant population from the World Population Prospects: the 2012 revision (15) and adding back the deaths in the neonatal and posteneonatal periods while accounting for the fraction of period lived before the death. It was assumed that a a neonate who dies in neonatal period lives an average of 4.7 days (or 0.0129 of the infant period) and that an infant who dies in the postneonatal period lives an average of 0.5 years.
11
TAG recommended that for neonatal mortality in HIV-affected populations, the NMR be estimated initially on using neonatal and child mortality observations for non-AIDS deaths, calculated by subtracting from total death rates the estimates HIV death rates in the neonatal and 1-59 month periods respectively, and then AIDS neonatal deaths be added back on to the non-HIV neonatal deaths to compute the total estimated neonatal death rate.
8. Child mortality due to conflict and natural disasters Estimated deaths for major natural disasters were obtained from the CRED International Disaster Database (17) and the under 5 proportion estimated as described elsewhere (18). Child deaths due to natural disasters were added to the smoothed estimates from the B3 model for Armenia (1988) and Haiti (2010). Tsunami deaths in 2011 were already included in the VR data used for Japan. Child mortality associated with conflict deaths was also taken into account for Rwanda (1993-1999) and Syria (2011-2012). In the case of Rwanda, a similar strategy was followed as that for HIV/AIDS. The crisis deaths evident in DHS birth history data for years 1993-1999 were subtracted from the data before using the B3 model to estimate a smoothed U5MR trajectory, and then the crisis deaths added back for affected years. For Syria, excess mortality in 2011 and 2012 due to the conflict was taken into account based on UN estimates of overall conflict deaths by month and age distribution of deaths (19).
9. Principles for WHO reporting on levels of health WHO has undertaken a series of technical consultations with the United Nations agencies who share reporting responsibilities for health-related Millennium Development Goals and core-health indicators. The objective of these consultations was to streamline and harmonize methods of measurement and estimation, to identify all available sources of data, and to define a common policy on missing data. This consultation with Member States is an opportunity for Member States to participate in the development of a data audit trail on national figures prior to their publication and, in case of disagreement, to exchange views and opinions with WHO in order to improve the figures. WHO applies standard methods to the analysis of Member State data to ensure comparability of estimates across countries. This will inevitably result in small differences for some Member States with official estimates for quantities such as life expectancy, where a variety of different projection methods and other methods are used. As in the World Health Statistics 2013 (2), the notes for this year’s release of child mortality trends by WHO on the Global Health Observatory (www.who.int/gho) and in World Health Statistics will make clear that the estimates have been constructed by applying standard methods to the available data from Member States, and the notes will clearly state that these are estimates of WHO and not necessarily those of the Member States themselves.
References (1) Levels & Trends in Child Mortality. Report 2012. Estimates Developed by the UN Interagency Group
for Child Mortality Estimation. New York, UNICEF, 2012 (http://www.who.int/maternal_child_adolescent/documents/levels_trends_child_mortality_2012.pdf).
(2) World Health Organization. World Health Statistics 2013. Geneva: WHO, 2013 (http://www.who.int/gho/publications/world_health_statistics/en/index.html).
(3) Pedersen J, Liu J (2012) Child mortality estimation: appropriate time periods for child mortality estimates from full birth histories. PLoS Med 9: e1001289 doi:10.1371/journal.pmed.1001289
12
(4) Silva R (2012) Child Mortality Estimation: Consistency of Under-Five Mortality Rate Estimates Using Full Birth Histories and Summary Birth Histories. PLoS Med 9(8): e1001296. doi:10.1371/journal.pmed.1001296
(5) Walker N, Hill K, Zhao F (2012) Child Mortality Estimation: Methods Used to Adjust for Bias due to AIDS in Estimating Trends in Under-Five Mortality. PLoS Med 9(8): e1001298. doi:10.1371/journal.pmed.1001298
(6) UNAIDS. 2012 UNAIDS Report on the Global AIDS Epidemic. Geneva, UNAIDS, 2012.
(7) Zeitlin J and Wildman K. Indicators for Monitoring and Evaluating Perinatal Health in Europe. European Union Health Monitoring Programme, 2000. (8) Graafmans WC et al. Comparability of Published Perinatal Mortality Rates in Western Europe: The Quantitative Impact of Differences in Gestational Age and Birthweight Criteria. BMOJ: An International Journal of Obstetrics and Gynaecology, 2001, 108:1237–45.
(9) Kramer MS et al.. Registration Artifacts in International Comparisons of Infant Mortality. Paediatric and Perinatal Epidemiology, 2002, 16 (Issue 1): p. 21.
(10) Kingkade WW and Cheryl CC. Infant Mortality in Eastern Europe and the Former Soviet Union Before and After the Breakup. Population Division, US Bureau of the Census, Washington, DC 20233. (Prepared for presentation at the 2001 Meetings of the International Union for the Scientific Study of Population, Salvador de Bahia, Brazil, August 19-24. Available at www.iussp.org/Brazil2001/s40/S44_02_kingkade.pdf)
(11) Alkema L, New JR (2013). Estimating levels and trends in under-5 mortality: an assessment of biases in data series and an improved estimation method. Paper to be presented at the XXVII IUSSP International Population Conference, Busan, Republic of Korea.
(12) Guillot M, Gerland P, Pelletier F, Saabneh A (2012) Child Mortality Estimation: A Global Overview of Infant and Child Mortality Age Patterns in Light of New Empirical Data. PLoS Med 9(8): e1001299. doi:10.1371/journal.pmed.1001299
(13) Sawyer CC (2012) Child Mortality Estimation: Estimating Sex Differences in Childhood Mortality since the 1970s. PLoS Med 9(8): e1001287. doi:10.1371/journal.pmed.1001287
(14) Alkema L, Chao F, Sawyer CC (2013). Sex Differences in U5MR: Estimation and identification of countries with outlying levels or trends. Paper to be presented at the XXVII IUSSP International Population Conference, Busan, Republic of Korea.
(15) UN Population Division. World Population Prospects - the 2012 revision. New York, United Nations, 2013.
(16) Oestergaard MZ, et al. (2011) Neonatal Mortality Levels for 193 Countries in 2009 with Trends since 1990: A Systematic Analysis of Progress, Projections, and Priorities. PLoS Medicine 8(8): e1001080. doi:10.1371/journal.pmed.1001080
(17) CRED. EM-DAT: The CRED International Disaster Database. Belgium, Université Catholique de Louvain, 2012.
(18) World Health Organization. WHO methods and data sources for global causes of death 2000-2011 (Global Health Estimates Technical Paper WHO/HIS/HSI/GHE/2013.3). Available at http://www.who.int/healthinfo/global_health_estimates/en/
(19) Price M, et al (2013). Preliminary Statistical Analysis of Documentation of Killings in Syria. UN OHCHR commissioned report, January 2013. http://www.ohchr.org/Documents/Countries/SY/PreliminaryStatAnalysisKillingsInSyria.pdf1.