Embed Size (px)
Citation preview
RESEARCH Open Access
Estimation of alternative splicing isoformfrequencies from RNA-Seq dataMarius Nicolae1*, Serghei Mangul2, Ion I Măndoiu1 and Alex Zelikovsky2
Abstract
Background: Massively parallel whole transcriptome sequencing, commonly referred as RNA-Seq, is quicklybecoming the technology of choice for gene expression profiling. However, due to the short read length deliveredby current sequencing technologies, estimation of expression levels for alternative splicing gene isoforms remainschallenging.
Results: In this paper we present a novel expectation-maximization algorithm for inference of isoform- and gene-specific expression levels from RNA-Seq data. Our algorithm, referred to as IsoEM, is based on disambiguatinginformation provided by the distribution of insert sizes generated during sequencing library preparation, and takesadvantage of base quality scores, strand and read pairing information when available. The open source Javaimplementation of IsoEM is freely available at http://dna.engr.uconn.edu/software/IsoEM/.
Conclusions: Empirical experiments on both synthetic and real RNA-Seq datasets show that IsoEM has scalablerunning time and outperforms existing methods of isoform and gene expression level estimation. Simulationexperiments confirm previous findings that, for a fixed sequencing cost, using reads longer than 25-36 bases doesnot necessarily lead to better accuracy for estimating expression levels of annotated isoforms and genes.
BackgroundUbiquitous regulatory mechanisms such as the use ofalternative transcription start and polyadenylation sites,alternative splicing, and RNA editing result in multiplemessenger RNA (mRNA) isoforms being generated froma single genomic locus. Most prevalently, alternativesplicing is estimated to take place for over 90% of themulti-exon human genes across diverse cell types [1],with as much as 68% of multi-exon genes expressingmultiple isoforms in a clonal cell line of colorectal can-cer origin [2]. Not surprisingly, the ability to reconstructfull length isoform sequences and accurately estimatetheir expression levels is widely believed to be criticalfor unraveling gene functions and transcription regula-tion mechanisms [3].Three key interrelated computational problems arise
in the context of transcriptome analysis: gene expressionlevel estimation (GE), isoform expression level estimation(IE), and novel isoform discovery (ID). Targeted GE using
methods such as quantitative PCR has long been a sta-ple of genetic studies. The completion of the humangenome has been a key enabler for genome-wide GEperformed using expression microarrays. Since expres-sion microarrays have limited capability of detectingalternative splicing events, specialized splicing arrayshave been developed for genome-wide interrogation ofboth annotated exons and exon-exon junctions. How-ever, despite sophisticated deconvolution algorithms[4,5], the fragmentary information provided by splicingarrays is typically insufficient for unambiguous identifi-cation of full-length transcripts [6,7]. Massively parallelwhole transcriptome sequencing, commonly referred toas RNA-Seq, is quickly replacing microarrays as thetechnology of choice for performing GE due to theirwider dynamic range and digital quantitation capabilities[8]. Unfortunately, most RNA-Seq studies to date stillignore alternative splicing or, similar to splicing arraystudies, restrict themselves to surveying the expressionlevels of exons and exon-exon junctions. The main diffi-culty in inferring expression levels for full-length iso-forms lies in the fact that current sequencingtechnologies generate short reads (from few tens to
* Correspondence: [email protected] of Computer Science & Engineering, University ofConnecticut,371 Fairfield Rd., Unit 2155, Storrs, CT 06269-2155, USAFull list of author information is available at the end of the article
Nicolae et al. Algorithms for Molecular Biology 2011, 6:9http://www.almob.org/content/6/1/9
© 2011 Nicolae et al; licensee BioMed Central Ltd. This is an Open Access article distributed under the terms of the Creative CommonsAttribution License (http://creativecommons.org/licenses/by/2.0), which permits unrestricted use, distribution, and reproduction inany medium, provided the original work is properly cited.
hundreds of bases), many of which cannot be unam-biguously assigned to individual isoforms.
Related workRNA-Seq analyses typically start by mapping sequencingreads onto the reference genome, transcript libraries,exon-exon junction libraries, or combinations thereof.Early RNA-Seq studies have recognized that limitedread lengths result in a significant percentage of socalled multireads, i.e., reads that map equally well atmultiple locations in the genome. A simple (and stillcommonly used) approach is to discard multireads, andestimate expression levels using only the so calledunique reads. Mortazavi et al. [9] proposed a multiread“rescue” method whereby initial gene expression levelsare estimated from unique reads and used to fractionallyallocate multireads, with final expression levels obtainedby re-estimation based on total counts obtained aftermultiread allocation. An expectation-maximization (EM)algorithm that extends this scheme by repeatedly alter-nating between fractional read allocation and re-estima-tion of gene expression levels was recently proposed in[10].A number of recent works have addressed the IE pro-
blem, namely isoform expression level estimation fromRNA-Seq reads. Under a simplified “exact information”model, [7] showed that neither single nor paired readRNA-Seq data can theoretically guarantee unambiguousinference of isoform expression levels, although pairedreads may be sufficient to deconvolute expression levelsfor the majority of annotated isoforms. The key chal-lenge in IE is accurate assignment of ambiguous readsto isoforms. Compared to the GE context, read ambigu-ity is much more significant, since it affects not onlymultireads, but also reads that map at a unique genomelocation expressed in multiple isoforms. Estimating iso-form expression levels based solely on unambiguousreads, as suggested, e.g., in [2], results in splicing-depen-dent biases similar to the transcript-length bias noted in[11], further complicating the design of unbiased differ-ential expression tests based on RNA-Seq data. To over-come this difficulty, [12] proposed a Poisson model ofsingle-read RNA-Seq data explicitly modeling isoformfrequencies. Under their model, maximum likelihoodestimates are obtained by solving a convex optimizationproblem, and uncertainty of estimates is obtained byimportance sampling from the posterior distribution. Liet al. [13] introduced an expectation-maximization (EM)algorithm similar to that of [10] but applied to isoformsinstead of genes. Unlike the method of [12], which esti-mates isoform frequencies only from reads that map toa unique location in the genome, the algorithm of [13]incorporates multireads as well. The IE problem for sin-gle reads is also tackled in [14], who propose an EM
algorithm for inferring isoform expression levels fromthe read coverage of exons (reads spanning exon junc-tions are ignored).The related novel isoform discovery (ID) problem is
also receiving much interest in the literature. Althoughshowing encouraging results, de novo transcriptomeassembly algorithms such as [15-17] have difficulties inidentifying transcripts with moderate coverage. Veryrecently, [18-20] proposed genome-assisted (i.e., map-ping based) methods for simultaneously solving ID andIE based on paired RNA-Seq reads. The method of Fenget al. [18] generates isoform candidates from the splicinggraph derived from annotations and reads spanningexon-exon junctions. After discarding multireads, [18]formulates IE for a given set of isoforms as a convexquadratic program (QP) that can be efficiently solvedfor each gene locus. The set of isoform candidates isiteratively refined until the p-value of the objective valueof the QP, assumed to follow a c2 distribution, exceedsan empirically selected threshold of 5%. Pair read infor-mation is not directly used in isoform frequency estima-tion, contributing only as secondary data to filter outfalse positives in the process of isoform selection. As in[18], Guttman et al. [19] construct a splicing graph fromthe mapped reads and filter candidate isoforms usingpaired-end information. Isoform specific expressionlevels are inferred using the method of [9]. After per-forming spliced alignment of (paired) reads onto thegenome using TopHat [21], the method of Trapnell etal. [20], referred to as Cufflinks, constructs a read over-lap graph and generates candidate isoforms by finding aminimal size path cover via a reduction to maximummatching in a weighted bipartite graph. Reads thatmatch equally well multiple locations in the genome arefractionally allocated to these locations, and estimationis then performed independently at different transcrip-tional loci, using an extension to paired reads of themethods in [12].
Our contributionsIn this paper we focus on the IE problem, namely esti-mating isoform expression levels (interchangeablyreferred to as frequencies) from RNA-Seq reads, underthe assumption that a complete list of candidate iso-forms is available. Projects such as [22] and [23] havealready assembled large libraries of full-length cDNAsequences for humans and other model organisms, andthe coverage of these libraries is expected to continue toincrease rapidly following ultra-deep paired-end tran-scriptome sequencing projects such as [19,20] and thewidely anticipated deployment of third-generationsequencing technologies such as [24,25], which deliverreads with significantly increased length. Inferringexpression at isoform level provides information for
Nicolae et al. Algorithms for Molecular Biology 2011, 6:9http://www.almob.org/content/6/1/9
Page 2 of 13
finer-resolution biological studies, and also leads tomore accurate estimates of expression at the gene levelby allowing rigorous length normalization. Indeed, asshown in the ‘Experimental results’ section, genome-wide gene expression level estimates derived from iso-form level estimates are significantly more accurate thanthose obtained directly from RNA-Seq data using iso-form-oblivious GE methods such as the widely usedcounting of unique reads, the rescue method of [9], orthe EM algorithm of [10].Our main contribution is a novel expectation-maximi-
zation algorithm for isoform frequency estimation fromany mixture of single and paired RNA-Seq reads. A keyfeature of our algorithm, referred to as IsoEM, is that itexploits information provided by the distribution ofinsert sizes, which is tightly controlled during sequen-cing library preparation under current RNA-Seq proto-cols. Such information is not modeled in the “exact”information models of [6,7], challenging the validity oftheir negative results. Guttman et al. [19] take intoaccount insert lengths derived from paired read data,but only for filtering candidate isoforms in ID. Trapnellet al. [20] is the only other work we are aware of thatexploits this information for IE, in conjunction withpaired read data. We show that modeling insert sizes ishighly benefficial for IE even for RNA-Seq data consist-ing of single reads. Insert sizes contribute to increasedestimation accuracy in two different ways. On one hand,they can help disambiguating the isoform of origin forthe reads. In IsoEM, insert lengths are combined withbase quality scores, and, if available, read pairing andstrand information to probabilistically allocate reads toisoforms during the expectation step of the algorithm.As in [13], the genomic locations of multireads are alsoresolved probabilistically in this step, further contribut-ing to improved overall accuracy compared to methodsthat ignore or fractionally pre-allocate multireads. Onthe other hand, insert size distribution is used to accu-rately adjust isoform lengths during frequency re-esti-mation in the maximization step of the IsoEMalgorithm.We also present the results of comprehensive experi-
ments conducted to assess the performance of IsoEMon both synthetic and real RNA-Seq datasets. Theseresults show that IsoEM consistently outperforms exist-ing methods under a wide range of sequencing para-meters and distribution assumptions. We also reportresults of experiments empirically evaluating the effectof sequencing parameters such as read length, read pair-ing, and strand information on estimation accuracy. Ourexperiments confirm the surprising finding of [13] that,for a fixed total number of sequenced bases, longerreads do not necessarily lead to better accuracy for esti-mation of isoform and gene expression levels.
MethodsRead mappingAs with many RNA-Seq analyses, the first step of IsoEMis to map the reads. Our approach is to map them ontothe library of known isoforms using any one of themany available ungapped aligners (we used Bowtie [26]with default parameters in our experiments). An alterna-tive strategy is to map the reads onto the genome usinga spliced alignment tool such as TopHat [21], as done,e.g., in [19,20]. However, preliminary experiments withTopHat resulted in fewer mapped reads and significantlyincreased mapping uncertainty, despite providingTopHat with a complete set of annotated junctions.Since further increases in read length coupled withimprovements in spliced alignment algorithms couldmake mapping onto the genome more attractive in thefuture, we made our IsoEM implementation compatiblewith both mapping approaches by always convertingread alignments to genome coordinates and performingall IsoEM read-isoform compatibility calculations ingenome space.
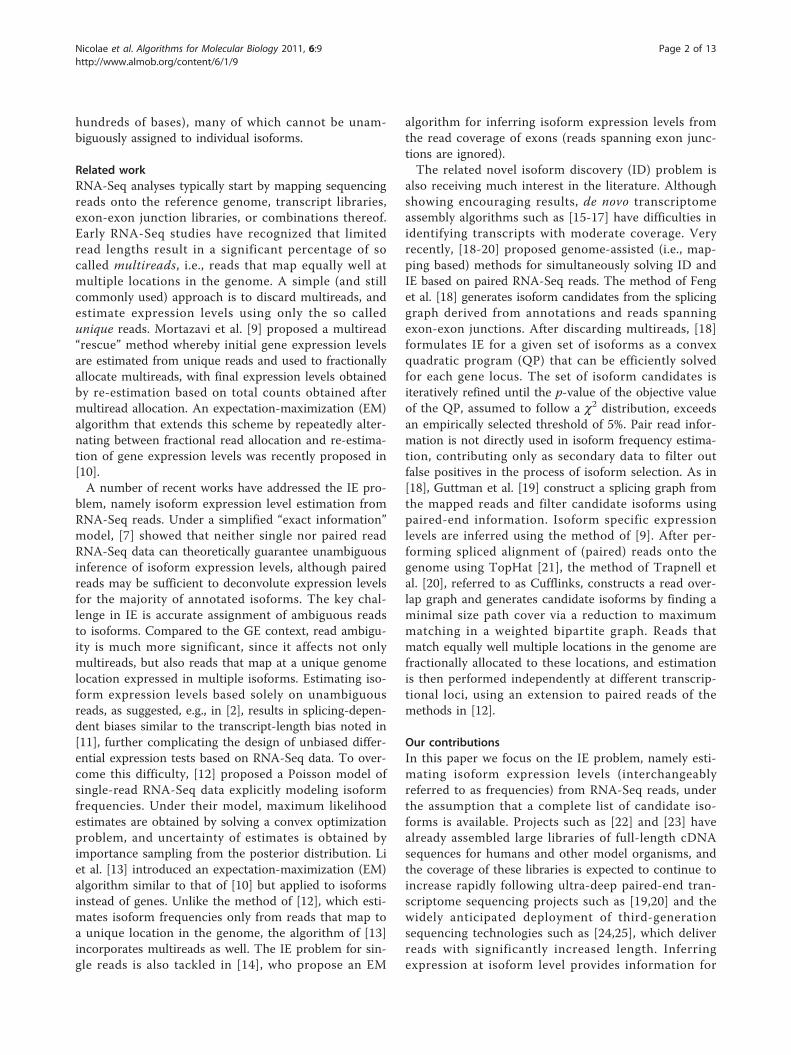
Finding read-isoform compatibilitiesThe candidate set of isoforms for each read is obtainedby combining all genome coordinates of reads and iso-forms, sorting them and using a line sweep technique todetect read-isoform compatibilities (see Figure 1). Asdetailed below, during the line sweep reads are groupedinto equivalence classes defined by their isoform com-patibility sets; this speeds up the E-step of the IsoEM
X = all the coordinates of all the entities (isoforms and reads)sort X (radix sort; for equal values, isoform coordinates come first)for x in X do
e = entityFor(x)if x is an entity end then
sig = signature[e]gap = getLastGap(sig)if x is an isoform end then
currentIsoformsForGap[gap].remove(e)else if x is a read end then
isoforms = currentIsoformsForGap[gap].keepOnlyMatching(sig)if read e is the second read in the pair then
isoformsForRead[e] = isoformsForRead[e]∩ isoformselse
isoformsForRead[e] = isoformsend if
readClasses[isoformsForRead[e]].add(e)end if
signature.remove(e)else
signature[e].add(x)end if
if x is an exon start then
sig = signature[e]lastButOneGap = getLastButOneGap(sig)currentIsoformsForGap[lastButOneGap].remove(e)lastGap = getLastGap(sig)currentIsoformsForGap[lastGap].add(e, sig)
end if
end for
Figure 1 The algorithm for identifying isoforms compatiblewith reads.
Nicolae et al. Algorithms for Molecular Biology 2011, 6:9http://www.almob.org/content/6/1/9
Page 3 of 13
algorithm by allowing the processing of an entire readclass at once.Some of the reads match multiple positions in the
genome, which we refer to as alignments (for paired endreads, an alignment consists of the positions where thetwo reads in the pair align with the genome). Eachalignment a can in turn be compatible with multipleisoforms that overlap at that position of the genome.During the line sweep, we compute the relative “weight”of assigning a given read/pair r to isoform j as wr, j = ∑a
QaFaOa, where the sum is over all alignments of r com-patible with j, and the factors of the summed productsare defined as follows:
• Qa represents the probability of observing the readfrom the genome locations described by the align-ment. This is computed from the base quality scores
as Qa =∏|r|
k=1 [(1 − εk)Mak + εk3 (1 − Mak)], where
Mak = 1 if position k of alignment a matches thereference genome sequence and 0 otherwise, whileεk denotes the error probability of k-th base of r.• For paired end reads, Fa represents the probabilityof the fragment length needed to produce alignmenta from isoform j; note that the length of this frag-ment can be inferred from the genome coordinatesof the two aligned reads and the available isoformannotation. For single reads, we can only estimatean upperbound u on the fragment length: if thealignment is on the same strand as the isoform thenu is the number of isoform annotated bases betweenthe 5’ end of the aligned read and the 3’ end of theisoform, otherwise u is the number of isoform anno-tated bases between the 5’ end of the aligned readand the 5’ end of the isoform. In this case Fa isdefined as the probability of observing a fragmentwith length of u bases or fewer.• Oa is 1 if alignment a of r is consistent with theorientation of isoform j, and 0 otherwise. Consis-tency between the orientations of r and j depends onwhether or not the library preparation protocol pre-serves the strand information. For single reads Oa =1 when reads are generated from fragment ends ran-domly or, for directional RNA-Seq, when they matchthe known isoform orientation. For paired-end reads,Oa = 1 if the two reads come from different strands,point to each other, and, in the case of directionalRNA-Seq, the orientation of first read matches theknown isoform orientation.
The IsoEM algorithmThe IsoEM algorithm starts with the set of N knownisoforms. For each isoform we denote by l (j) its length
and by f (j) its (unknown) frequency. If we denote by n(j) the number of reads coming from isoform j and let p(k) denote the probability of a fragment of length k, then
E[n(j)] ∝∑
k≤l(j)
p(k)(l(j) − k + 1) (1)
since, the number of fragments of length k is expectedto be proportional to the number of valid starting posi-tions for a fragment of that length in the isoform. Thus,if the isoform of origin is known for each read, the max-imum likelihood estimator for f(j) is given by c(j)/(c(1) +... + c(N)), where c(j) = n(j)/
∑k≤l(j) p(k)(l(j) − k + 1)
denotes the length-normalized fragment coverage. Notethat the length of most isoforms is significantly largerthan the mean fragment length μ typical of currentsequencing libraries; for such isoforms∑
k≤l(j) p(k)(l(j) − k + 1) ≈ l(j) − μ + 1 and c(j) can beapproximated by n(j)/(l(j) μ + 1).Since some reads match multiple isoforms, their iso-
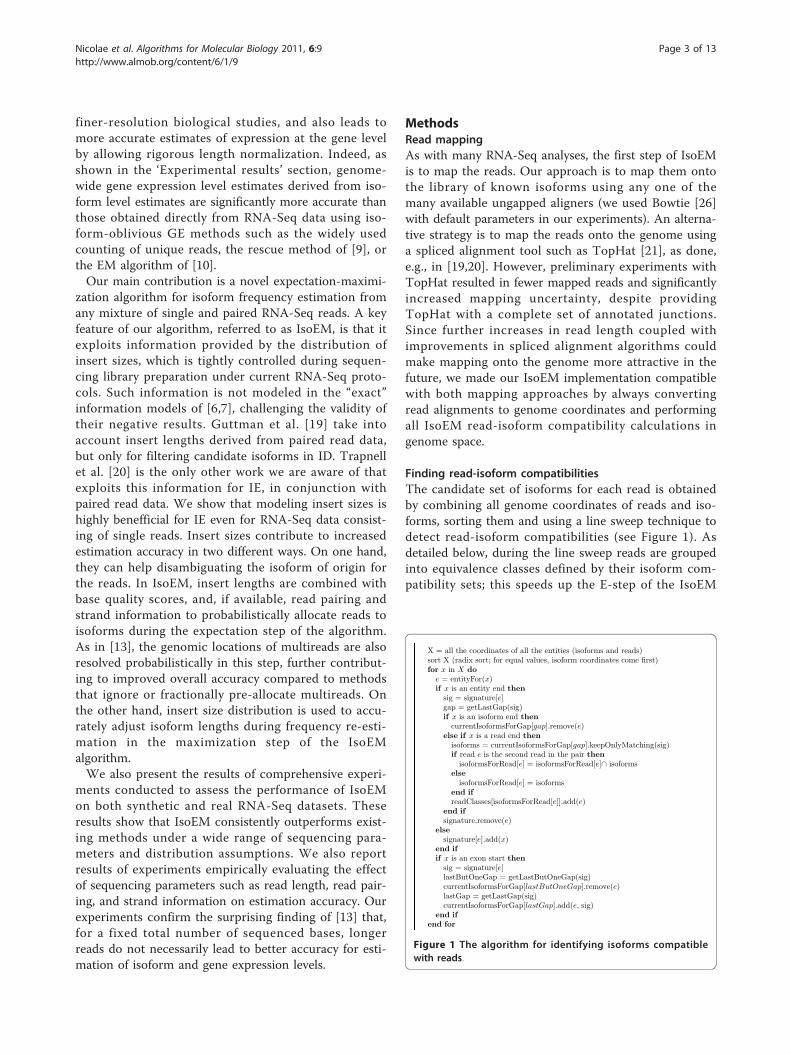
form of origin cannot be established unambiguously.The IsoEM algorithm (see Figure 2) overcomes this dif-ficulty by simultaneously estimating the frequencies andimputing the missing read origin within an iterative fra-mework. After initializing frequencies f (j) at random,the algorithm repeatedly performs the next two stepsuntil convergence:
• E-step: Compute the expected number n(j) of readsthat come from isoform j under the assumption thatisoform frequencies f(j) are correct, based on weightswr, j computed as described in the previous section• M-step: For each j, set the new value of f(j) to c(j)/(c(1)+ ... + c(N)), where normalized coverages c(j) are basedon expected counts computed in the prior E-step
assign random values to all f(i)while not converged do
E-step:
initialize all n(j) to 0for each read r do
sum =∑
j:wr,j>0 wr,jf(j)for each isoform j with wr,j > 0 do
n(j)+ = wr,jf(j)/sumend for
end for
M-step:
s =∑
j n(j)/(l(j)− μ + 1)for each isoform j do
f(j) = n(j)/(l(j)−μ+1)s
end for
end while
Figure 2 The expectation-maximization algorithm used byIsoEM.
Nicolae et al. Algorithms for Molecular Biology 2011, 6:9http://www.almob.org/content/6/1/9
Page 4 of 13
IsoEM optimizationsBelow we describe two implementation optimizationsthat significantly improve the performance of IsoEM byreducing both runtime and memory usage.The first optimization consists of partitioning the
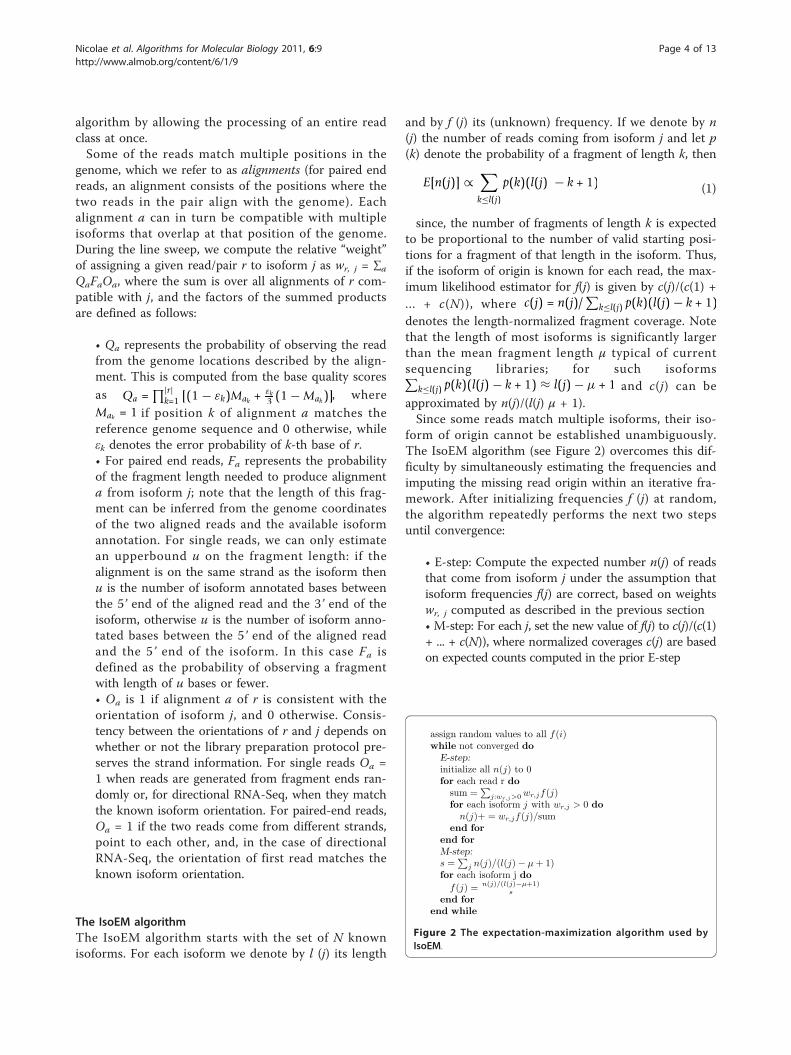
input into compatibility components. The compatibilitybetween reads and isoforms naturally induces a bipartiteread-isoform compatibility graph, with edges connectingeach isoform with all reads that can possibly originatefrom it. Connected components of the compatibilitygraph can be processed independently in IsoEM sincethe frequencies of isoforms in one connected compo-nent do not affect the frequencies of isoforms in anyother connected component. Although this optimizationcan be applied to any EM algorithm, its impact is parti-cularly significant in IsoEM. Indeed, in this context thecompatibility graph decomposes in numerous smallcomponents (see Figure 3(a) for a typical distribution ofcomponent sizes; a similar distribution of componentsizes is reported for Arabidopsis gene models in [27]).The resulting speed-up comes from the fact that in eachiteration of IsoEM we update frequencies of isoforms ina single compatibility component, avoiding needlessupdates for other isoforms.The second IsoEM optimization consists of partition-
ing the set of reads within each compatibility compo-nent into equivalence classes. Two reads are equivalentfor IsoEM if they are compatible with the same set ofisoforms and their compatibility weights to the isoformsare proportional. Keeping only a single representativefrom each read class (with appropriately adjusted fre-quency) drastically reduces the number of reads kept inmemory (see Figure 3(b)). As the number of readsincreases, the number of read classes increases muchslower. Eventually this reaches saturation and no newread classes appear - at which point the runtime of
IsoEM becomes virtually independent of the number ofreads. Indeed, in practice the runtime bottlenecks areparsing the reads, computing the compatibility graphand detecting equivalent reads.Once read classes are constructed, we only need a
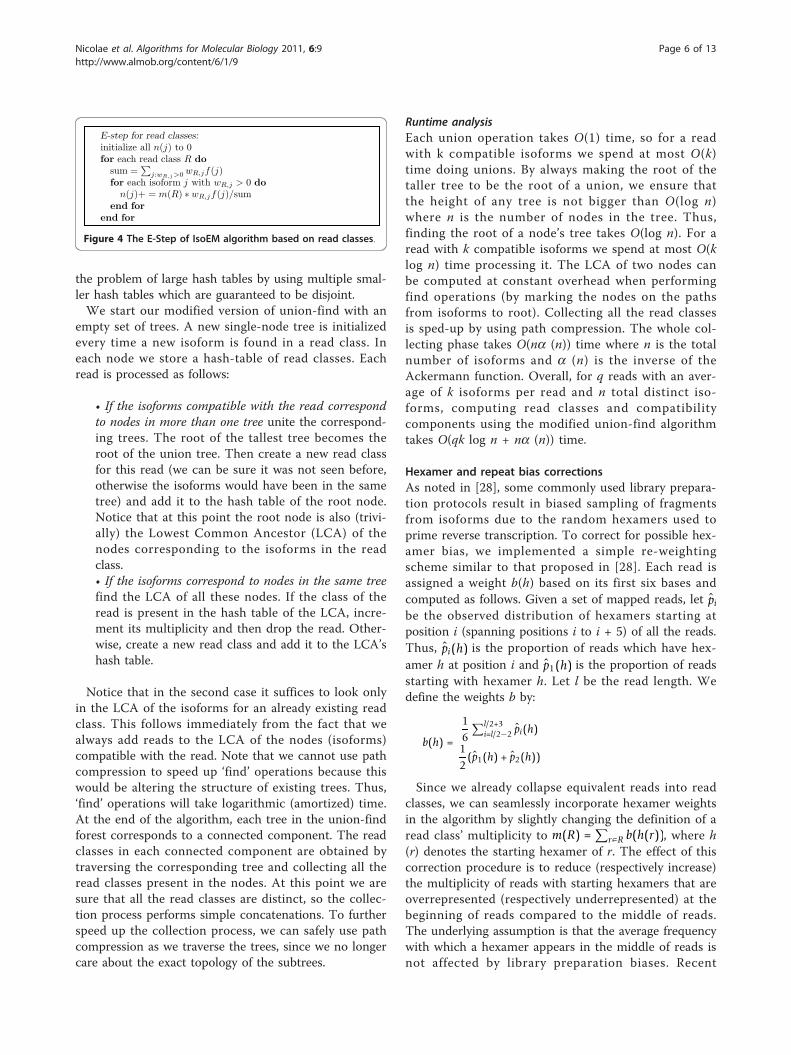
small modification of the E-step of IsoEM to use readclasses instead of reads (Figure 4). Next we describe theunion-find algorithm used for efficiently finding compat-ibility components and read classes in IsoEM. A readclass is defined as ⟨m,{(i, w) i = isoform, w = weight}⟩,where m is called the multiplicity of the read class.Given a collection of reads, we want to:
• Find the connected components of the compatibil-ity graph induced by the reads, and• Collapse equivalent reads into read classes withmultiplicity indicating the number of reads in eachclass.
A straightforward approach is to solve the first pro-blem using a union-find algorithm, then to take thereads corresponding to each connected component andremove equivalent reads, e.g., using hashing. However,there are two drawbacks to this approach:
• First, all reads need to be kept in memory until allconnected components have been computed.• Second, when the number of reads in a connectedcomponent is very large the number of collisionsincreases, which leads to poor performance.
We overcome the two problems presented aboveusing an online version of the union-find algorithmwhich computes connected components and eliminatesequivalent reads on the fly. This way, equivalent readswill never reside too long in memory. Also, we avoid
10,000
1,000
10,000
100
1,000
10,000
Componets
100
1,000
10,000
Number�of�Componets
10
100
1,000
10,000
Number�of�Componets
1
10
100
1,000
10,000
0 20 40 60 80 100 120 140 160 180
Number�of�Componets
Component Size (# isoforms)
1
10
100
1,000
10,000
0 20 40 60 80 100 120 140 160 180
Number�of�Componets
Component�Size�(#�isoforms)
1
10
100
1,000
10,000
0 20 40 60 80 100 120 140 160 180
Number�of�Componets
Component�Size�(#�isoforms)
(a)
0.4
0.6
0.8
1
1.2
Classes�(M
illions)
RandomStrand�Single
CodingStrand�Single
CodingStrand�Pairs
RandomStrand�Pairs
0
0.2
0.4
0.6
0.8
1
1.2
0 5 10 15 20 25 30
#�Classes�(M
illions)
#�Reads/Pairs�(Millions)
RandomStrand�Single
CodingStrand�Single
CodingStrand�Pairs
RandomStrand�Pairs
(b)
Figure 3 Distribution of compatibility component sizes (defined as the number of isoforms) for 10 million single reads of length 75(a) and number of read classes for 1 to 30 million single reads or pairs of reads of length 75 (b).
Nicolae et al. Algorithms for Molecular Biology 2011, 6:9http://www.almob.org/content/6/1/9
Page 5 of 13
the problem of large hash tables by using multiple smal-ler hash tables which are guaranteed to be disjoint.We start our modified version of union-find with an
empty set of trees. A new single-node tree is initializedevery time a new isoform is found in a read class. Ineach node we store a hash-table of read classes. Eachread is processed as follows:
• If the isoforms compatible with the read correspondto nodes in more than one tree unite the correspond-ing trees. The root of the tallest tree becomes theroot of the union tree. Then create a new read classfor this read (we can be sure it was not seen before,otherwise the isoforms would have been in the sametree) and add it to the hash table of the root node.Notice that at this point the root node is also (trivi-ally) the Lowest Common Ancestor (LCA) of thenodes corresponding to the isoforms in the readclass.• If the isoforms correspond to nodes in the same treefind the LCA of all these nodes. If the class of theread is present in the hash table of the LCA, incre-ment its multiplicity and then drop the read. Other-wise, create a new read class and add it to the LCA’shash table.
Notice that in the second case it suffices to look onlyin the LCA of the isoforms for an already existing readclass. This follows immediately from the fact that wealways add reads to the LCA of the nodes (isoforms)compatible with the read. Note that we cannot use pathcompression to speed up ‘find’ operations because thiswould be altering the structure of existing trees. Thus,‘find’ operations will take logarithmic (amortized) time.At the end of the algorithm, each tree in the union-findforest corresponds to a connected component. The readclasses in each connected component are obtained bytraversing the corresponding tree and collecting all theread classes present in the nodes. At this point we aresure that all the read classes are distinct, so the collec-tion process performs simple concatenations. To furtherspeed up the collection process, we can safely use pathcompression as we traverse the trees, since we no longercare about the exact topology of the subtrees.
Runtime analysisEach union operation takes O(1) time, so for a readwith k compatible isoforms we spend at most O(k)time doing unions. By always making the root of thetaller tree to be the root of a union, we ensure thatthe height of any tree is not bigger than O(log n)where n is the number of nodes in the tree. Thus,finding the root of a node’s tree takes O(log n). For aread with k compatible isoforms we spend at most O(klog n) time processing it. The LCA of two nodes canbe computed at constant overhead when performingfind operations (by marking the nodes on the pathsfrom isoforms to root). Collecting all the read classesis sped-up by using path compression. The whole col-lecting phase takes O(na (n)) time where n is the totalnumber of isoforms and a (n) is the inverse of theAckermann function. Overall, for q reads with an aver-age of k isoforms per read and n total distinct iso-forms, computing read classes and compatibilitycomponents using the modified union-find algorithmtakes O(qk log n + na (n)) time.
Hexamer and repeat bias correctionsAs noted in [28], some commonly used library prepara-tion protocols result in biased sampling of fragmentsfrom isoforms due to the random hexamers used toprime reverse transcription. To correct for possible hex-amer bias, we implemented a simple re-weightingscheme similar to that proposed in [28]. Each read isassigned a weight b(h) based on its first six bases andcomputed as follows. Given a set of mapped reads, let p̂i
be the observed distribution of hexamers starting atposition i (spanning positions i to i + 5) of all the reads.Thus, p̂i(h) is the proportion of reads which have hex-amer h at position i and p̂1(h) is the proportion of readsstarting with hexamer h. Let l be the read length. Wedefine the weights b by:
b(h) =
16
∑l/2+3i=l/2−2 p̂i(h)
12
(p̂1(h) + p̂2(h))
Since we already collapse equivalent reads into readclasses, we can seamlessly incorporate hexamer weightsin the algorithm by slightly changing the definition of aread class’ multiplicity to m(R) =
∑r∈R b(h(r)), where h
(r) denotes the starting hexamer of r. The effect of thiscorrection procedure is to reduce (respectively increase)the multiplicity of reads with starting hexamers that areoverrepresented (respectively underrepresented) at thebeginning of reads compared to the middle of reads.The underlying assumption is that the average frequencywith which a hexamer appears in the middle of reads isnot affected by library preparation biases. Recent
E-step for read classes:
initialize all n(j) to 0for each read class R do
sum =∑
j:wR,j>0 wR,jf(j)for each isoform j with wR,j > 0 do
n(j)+ = m(R) ∗ wR,jf(j)/sumend for
end for
Figure 4 The E-Step of IsoEM algorithm based on read classes.
Nicolae et al. Algorithms for Molecular Biology 2011, 6:9http://www.almob.org/content/6/1/9
Page 6 of 13
methods [29] also target biases surrounding the startsite of the read in addition to within reads.To avoid biases from incorrectly mapped reads origi-
nating from repetitive regions, IsoEM will also discardreads that overlap annotated repeats. When applyingthis correction, isoform lengths are automaticallyadjusted by subtracting the number of positions result-ing in reads that would be discarded.
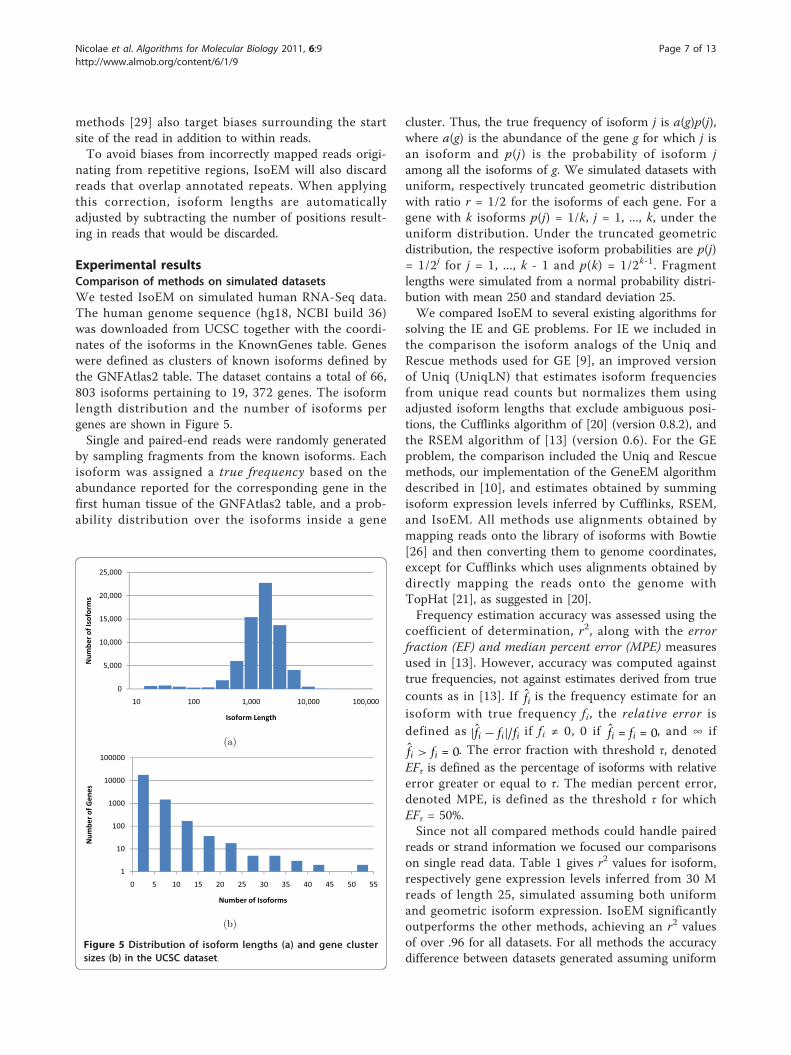
Experimental resultsComparison of methods on simulated datasetsWe tested IsoEM on simulated human RNA-Seq data.The human genome sequence (hg18, NCBI build 36)was downloaded from UCSC together with the coordi-nates of the isoforms in the KnownGenes table. Geneswere defined as clusters of known isoforms defined bythe GNFAtlas2 table. The dataset contains a total of 66,803 isoforms pertaining to 19, 372 genes. The isoformlength distribution and the number of isoforms pergenes are shown in Figure 5.Single and paired-end reads were randomly generated
by sampling fragments from the known isoforms. Eachisoform was assigned a true frequency based on theabundance reported for the corresponding gene in thefirst human tissue of the GNFAtlas2 table, and a prob-ability distribution over the isoforms inside a gene
cluster. Thus, the true frequency of isoform j is a(g)p(j),where a(g) is the abundance of the gene g for which j isan isoform and p(j) is the probability of isoform jamong all the isoforms of g. We simulated datasets withuniform, respectively truncated geometric distributionwith ratio r = 1/2 for the isoforms of each gene. For agene with k isoforms p(j) = 1/k, j = 1, ..., k, under theuniform distribution. Under the truncated geometricdistribution, the respective isoform probabilities are p(j)= 1/2j for j = 1, ..., k - 1 and p(k) = 1/2k-1. Fragmentlengths were simulated from a normal probability distri-bution with mean 250 and standard deviation 25.We compared IsoEM to several existing algorithms for
solving the IE and GE problems. For IE we included inthe comparison the isoform analogs of the Uniq andRescue methods used for GE [9], an improved versionof Uniq (UniqLN) that estimates isoform frequenciesfrom unique read counts but normalizes them usingadjusted isoform lengths that exclude ambiguous posi-tions, the Cufflinks algorithm of [20] (version 0.8.2), andthe RSEM algorithm of [13] (version 0.6). For the GEproblem, the comparison included the Uniq and Rescuemethods, our implementation of the GeneEM algorithmdescribed in [10], and estimates obtained by summingisoform expression levels inferred by Cufflinks, RSEM,and IsoEM. All methods use alignments obtained bymapping reads onto the library of isoforms with Bowtie[26] and then converting them to genome coordinates,except for Cufflinks which uses alignments obtained bydirectly mapping the reads onto the genome withTopHat [21], as suggested in [20].Frequency estimation accuracy was assessed using the
coefficient of determination, r2, along with the errorfraction (EF) and median percent error (MPE) measuresused in [13]. However, accuracy was computed againsttrue frequencies, not against estimates derived from truecounts as in [13]. If f̂i is the frequency estimate for anisoform with true frequency fi, the relative error isdefined as |f̂i − fi|/fi if fi ≠ 0, 0 if f̂i = fi = 0, and ∞ if
f̂i > fi = 0. The error fraction with threshold τ, denotedEFτ is defined as the percentage of isoforms with relativeerror greater or equal to τ. The median percent error,denoted MPE, is defined as the threshold τ for whichEFτ = 50%.Since not all compared methods could handle paired
reads or strand information we focused our comparisonson single read data. Table 1 gives r2 values for isoform,respectively gene expression levels inferred from 30 Mreads of length 25, simulated assuming both uniformand geometric isoform expression. IsoEM significantlyoutperforms the other methods, achieving an r2 valuesof over .96 for all datasets. For all methods the accuracydifference between datasets generated assuming uniform
5,000
10,000
15,000
20,000
25,000
Number�of�Isoform
s
0
5,000
10,000
15,000
20,000
25,000
10 100 1,000 10,000 100,000
Number�of�Isoform
s
Isoform�Length
(a)
10000
100000
1000
10000
100000
r�of�Genes
10
100
1000
10000
100000
Number�of�Genes
1
10
100
1000
10000
100000
Number�of�Genes
1
10
100
1000
10000
100000
0 5 10 15 20 25 30 35 40 45 50 55
Number�of�Genes
Number�of�Isoforms
1
10
100
1000
10000
100000
0 5 10 15 20 25 30 35 40 45 50 55
Number�of�Genes
Number�of�Isoforms
1
10
100
1000
10000
100000
0 5 10 15 20 25 30 35 40 45 50 55
Number�of�Genes
Number�of�Isoforms
(b)
Figure 5 Distribution of isoform lengths (a) and gene clustersizes (b) in the UCSC dataset.
Nicolae et al. Algorithms for Molecular Biology 2011, 6:9http://www.almob.org/content/6/1/9
Page 7 of 13
and geometric distribution of isoform expression levelsis small, with the latter one typically having a slightlyworse accuracy. Thus, in the interest of space we pre-sent remaining results only for datasets generated usinggeometric isoform expression.For a more detailed view of the relative performance
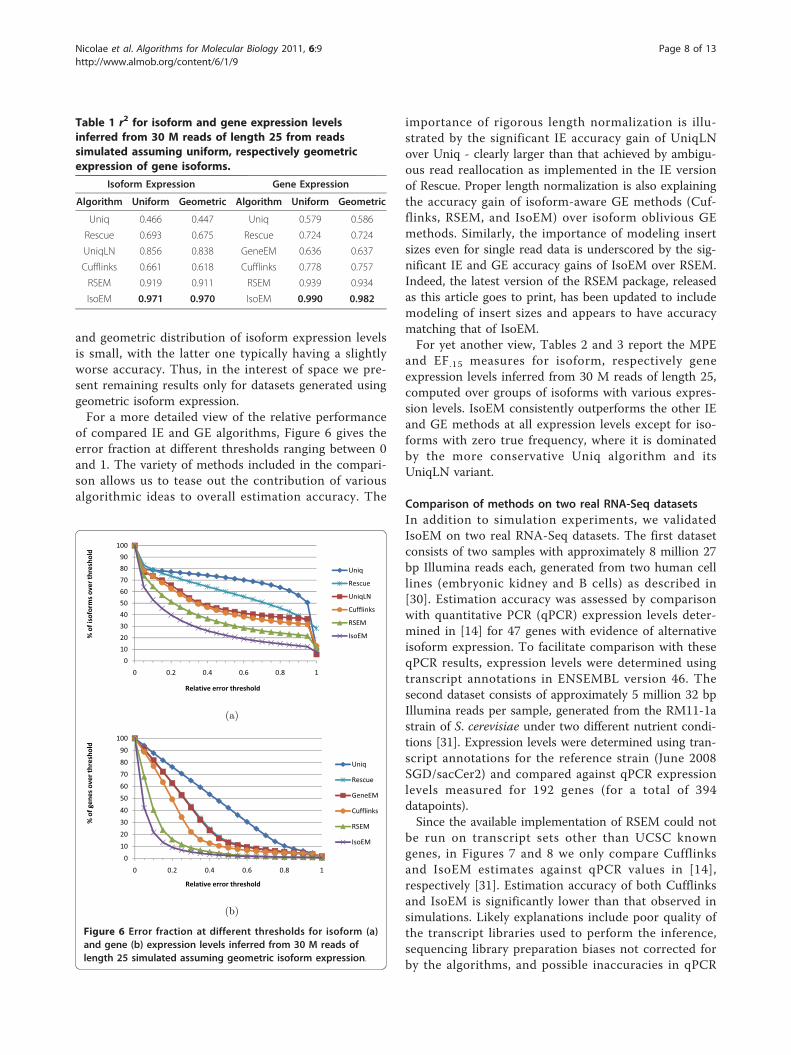
of compared IE and GE algorithms, Figure 6 gives theerror fraction at different thresholds ranging between 0and 1. The variety of methods included in the compari-son allows us to tease out the contribution of variousalgorithmic ideas to overall estimation accuracy. The
importance of rigorous length normalization is illu-strated by the significant IE accuracy gain of UniqLNover Uniq - clearly larger than that achieved by ambigu-ous read reallocation as implemented in the IE versionof Rescue. Proper length normalization is also explainingthe accuracy gain of isoform-aware GE methods (Cuf-flinks, RSEM, and IsoEM) over isoform oblivious GEmethods. Similarly, the importance of modeling insertsizes even for single read data is underscored by the sig-nificant IE and GE accuracy gains of IsoEM over RSEM.Indeed, the latest version of the RSEM package, releasedas this article goes to print, has been updated to includemodeling of insert sizes and appears to have accuracymatching that of IsoEM.For yet another view, Tables 2 and 3 report the MPE
and EF.15 measures for isoform, respectively geneexpression levels inferred from 30 M reads of length 25,computed over groups of isoforms with various expres-sion levels. IsoEM consistently outperforms the other IEand GE methods at all expression levels except for iso-forms with zero true frequency, where it is dominatedby the more conservative Uniq algorithm and itsUniqLN variant.
Comparison of methods on two real RNA-Seq datasetsIn addition to simulation experiments, we validatedIsoEM on two real RNA-Seq datasets. The first datasetconsists of two samples with approximately 8 million 27bp Illumina reads each, generated from two human celllines (embryonic kidney and B cells) as described in[30]. Estimation accuracy was assessed by comparisonwith quantitative PCR (qPCR) expression levels deter-mined in [14] for 47 genes with evidence of alternativeisoform expression. To facilitate comparison with theseqPCR results, expression levels were determined usingtranscript annotations in ENSEMBL version 46. Thesecond dataset consists of approximately 5 million 32 bpIllumina reads per sample, generated from the RM11-1astrain of S. cerevisiae under two different nutrient condi-tions [31]. Expression levels were determined using tran-script annotations for the reference strain (June 2008SGD/sacCer2) and compared against qPCR expressionlevels measured for 192 genes (for a total of 394datapoints).Since the available implementation of RSEM could not
be run on transcript sets other than UCSC knowngenes, in Figures 7 and 8 we only compare Cufflinksand IsoEM estimates against qPCR values in [14],respectively [31]. Estimation accuracy of both Cufflinksand IsoEM is significantly lower than that observed insimulations. Likely explanations include poor quality ofthe transcript libraries used to perform the inference,sequencing library preparation biases not corrected forby the algorithms, and possible inaccuracies in qPCR
100
70
80
90
100
threshold�
Uniq
50
60
70
80
90
100
orm
s�over�threshold�
Uniq
Rescue
UniqLN
Cufflinks
20
30
40
50
60
70
80
90
100
%�of�isoform
s�over�threshold�
Uniq
Rescue
UniqLN
Cufflinks
RSEM
IsoEM
0
10
20
30
40
50
60
70
80
90
100
0 0.2 0.4 0.6 0.8 1
%�of�isoform
s�over�threshold�
Uniq
Rescue
UniqLN
Cufflinks
RSEM
IsoEM
0
10
20
30
40
50
60
70
80
90
100
0 0.2 0.4 0.6 0.8 1
%�of�isoform
s�over�threshold�
Relative�error�threshold
Uniq
Rescue
UniqLN
Cufflinks
RSEM
IsoEM
0
10
20
30
40
50
60
70
80
90
100
0 0.2 0.4 0.6 0.8 1
%�of�isoform
s�over�threshold�
Relative�error�threshold
Uniq
Rescue
UniqLN
Cufflinks
RSEM
IsoEM
(a)
100
70
80
90
100
threshold�
Uniq
40
50
60
70
80
90
100
genes�over�threshold�
Uniq
Rescue
GeneEM
C ffli k
20
30
40
50
60
70
80
90
100
%�of�genes�over�threshold�
Uniq
Rescue
GeneEM
Cufflinks
RSEM
0
10
20
30
40
50
60
70
80
90
100
0 0.2 0.4 0.6 0.8 1
%�of�genes�over�threshold�
Uniq
Rescue
GeneEM
Cufflinks
RSEM
IsoEM
0
10
20
30
40
50
60
70
80
90
100
0 0.2 0.4 0.6 0.8 1
%�of�genes�over�threshold�
Relative�error�threshold
Uniq
Rescue
GeneEM
Cufflinks
RSEM
IsoEM
0
10
20
30
40
50
60
70
80
90
100
0 0.2 0.4 0.6 0.8 1
%�of�genes�over�threshold�
Relative�error�threshold
Uniq
Rescue
GeneEM
Cufflinks
RSEM
IsoEM
(b)
Figure 6 Error fraction at different thresholds for isoform (a)and gene (b) expression levels inferred from 30 M reads oflength 25 simulated assuming geometric isoform expression.
Table 1 r2 for isoform and gene expression levelsinferred from 30 M reads of length 25 from readssimulated assuming uniform, respectively geometricexpression of gene isoforms.
Isoform Expression Gene Expression
Algorithm Uniform Geometric Algorithm Uniform Geometric
Uniq 0.466 0.447 Uniq 0.579 0.586
Rescue 0.693 0.675 Rescue 0.724 0.724
UniqLN 0.856 0.838 GeneEM 0.636 0.637
Cufflinks 0.661 0.618 Cufflinks 0.778 0.757
RSEM 0.919 0.911 RSEM 0.939 0.934
IsoEM 0.971 0.970 IsoEM 0.990 0.982
Nicolae et al. Algorithms for Molecular Biology 2011, 6:9http://www.almob.org/content/6/1/9
Page 8 of 13
estimates. Nevertheless, the relative performance of thetwo algorithms is consistent with simulation results,with IsoEM outperforming Cufflinks on both datasets.
Influence of sequencing parameters and scalabilityAlthough high-throughput technologies allow users tomake tradeoffs between read length and the number ofgenerated reads, very little has been done to determineoptimal parameters even for common applications suchas RNA-Seq. The intuition that longer reads are bettercertainly holds true for many applications such as denovo genome and transcriptome assembly. Surprisingly,[13] found that shorter reads are better for IE when thetotal number of sequenced bases (as a rough approxima-tion for sequencing cost) is fixed. Figure 9 plots IE esti-mation accuracy for reads of length between 10 and 100when the total amount of sequence data is kept constantat 750 M bases. Our results confirm the finding of [13],
although the optimal read length is somewhat sensitiveto the accuracy measure used and to the availability ofpairing information. While 25 bp reads minimize MPEregardless of the availability of paired reads, the readlength that maximizes r2 is 25 for paired reads and 50for single reads. Although further experiments areneeded to determine how the optimum length dependson the amount of sequence data and transcriptomecomplexity, our simulations do suggest that for isoformand gene expression analysis, increasing the number ofreads may be more useful than increasing read lengthbeyond 50 bases. Figure 10(a) shows, for reads of length75, the effects of paired reads and strand information onestimation accuracy as measured by r2. Not surprisingly,for a fixed number of reads, paired reads yield betteraccuracy than single reads. Also not very surprisingly,adding strand information to paired sequencing yieldsno benefits to genome-wide IE accuracy (although it
Table 2 Median percent error (MPE) and 15% error fraction (EF.15) for isoform expression levels inferred from 30 Mreads of length 25 simulated assuming geometric isoform expression.
Expression range 0 (0, 10-6] (10-6, 10-5] (10-5, 10-4] (10-4, 10-3] (10-3, 10-2] All
# isoforms 13,290 10,024 23,882 18,359 1,182 66 66,803
Uniq 0.0 100.0 98.4 97.1 98.5 96.6 95.4
Rescue 0.0 294.7 75.5 49.2 30.4 28.3 71.9
MPE UniqLN 0.0 100.0 80.8 30.3 26.4 24.8 36.0
Cufflinks 0.0 100.0 49.7 25.5 27.2 44.6 34.1
RSEM 0.0 100.0 31.9 13.5 11.4 13.0 21.2
IsoEM 0.0 100.0 25.3 7.3 3.2 2.2 12.0
Uniq 0.2 98.4 97.2 96.9 97.0 95.5 78.0
Rescue 48.4 95.5 86.2 73.1 61.5 56.1 76.0EF.15 UniqLN 0.2 97.2 86.2 82.8 83.3 77.3 69.8
Cufflinks 17.6 96.4 81.3 71.0 74.7 80.3 67.9
RSEM 19.9 93.7 71.1 46.4 39.8 47.0 56.9
IsoEM 3.4 93.1 65.1 29.1 11.1 7.6 46.1
Table 3 Median percent error (MPE) and 15% error fraction (EF.15) for gene expression levels inferred from 30 M readsof length 25 simulated assuming geometric isoform expression.
Expression range (0, 10-6] (10-6, 10-5] (10-5, 10-4] (10-4, 10-3] (10-3, 10-2] All
# genes 120 5,610 11,907 1,632 102 19,372
Uniq 37.4 43.6 42.7 43.0 48.2 43.0
Rescue 32.8 28.7 26.0 25.1 28.8 26.7
MPE GeneEM 30.6 28.2 25.7 25.1 28.0 26.3
Cufflinks 33.0 21.1 19.0 20.2 40.2 19.7
RSEM 23.6 11.0 7.2 7.9 11.4 8.1
IsoEM 18.2 8.4 3.2 2.0 1.9 3.9
Uniq 77.5 82.4 81.7 79.7 82.4 81.7
Rescue 74.2 74.0 71.6 72.8 76.5 72.4
EF.15 GeneEM 72.5 73.8 71.5 73.0 74.5 72.3
Cufflinks 73.3 64.7 62.3 66.2 82.3 63.5
RSEM 64.2 37.3 17.4 16.3 41.2 23.5
IsoEM 57.5 28.1 6.7 6.1 4.9 13.2
Nicolae et al. Algorithms for Molecular Biology 2011, 6:9http://www.almob.org/content/6/1/9
Page 9 of 13
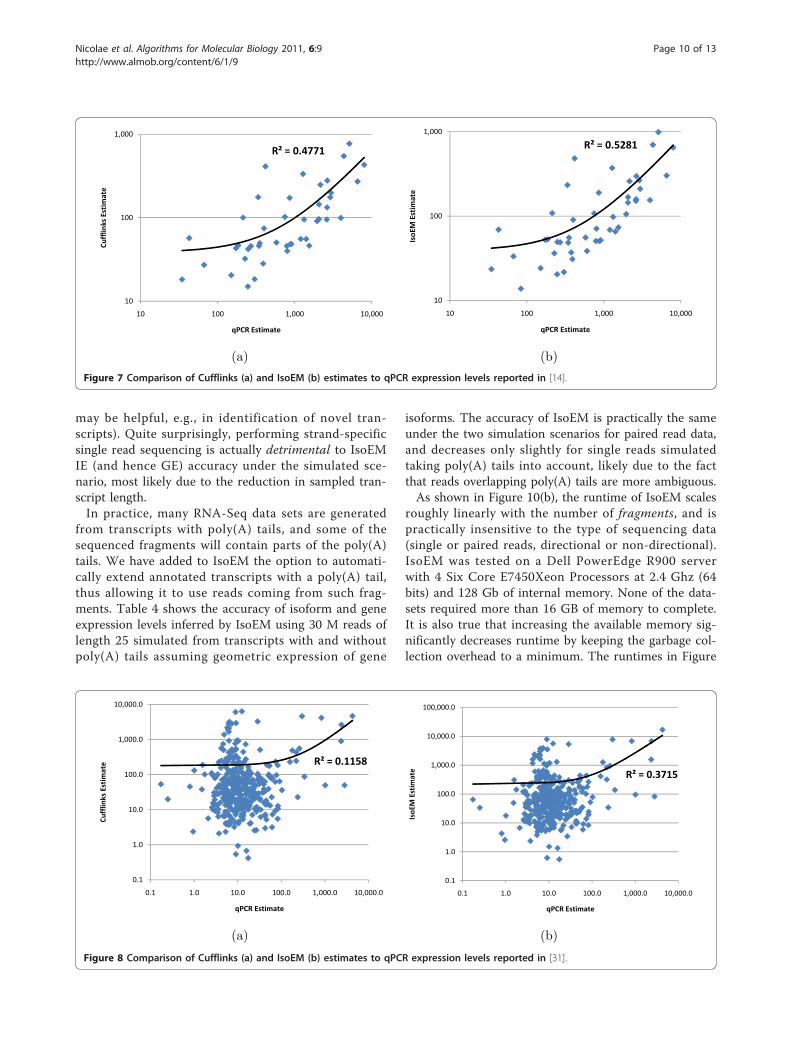
may be helpful, e.g., in identification of novel tran-scripts). Quite surprisingly, performing strand-specificsingle read sequencing is actually detrimental to IsoEMIE (and hence GE) accuracy under the simulated sce-nario, most likely due to the reduction in sampled tran-script length.In practice, many RNA-Seq data sets are generated
from transcripts with poly(A) tails, and some of thesequenced fragments will contain parts of the poly(A)tails. We have added to IsoEM the option to automati-cally extend annotated transcripts with a poly(A) tail,thus allowing it to use reads coming from such frag-ments. Table 4 shows the accuracy of isoform and geneexpression levels inferred by IsoEM using 30 M reads oflength 25 simulated from transcripts with and withoutpoly(A) tails assuming geometric expression of gene
isoforms. The accuracy of IsoEM is practically the sameunder the two simulation scenarios for paired read data,and decreases only slightly for single reads simulatedtaking poly(A) tails into account, likely due to the factthat reads overlapping poly(A) tails are more ambiguous.As shown in Figure 10(b), the runtime of IsoEM scales
roughly linearly with the number of fragments, and ispractically insensitive to the type of sequencing data(single or paired reads, directional or non-directional).IsoEM was tested on a Dell PowerEdge R900 serverwith 4 Six Core E7450Xeon Processors at 2.4 Ghz (64bits) and 128 Gb of internal memory. None of the data-sets required more than 16 GB of memory to complete.It is also true that increasing the available memory sig-nificantly decreases runtime by keeping the garbage col-lection overhead to a minimum. The runtimes in Figure
R²�=�0.4771
100
1,000
Cufflinks�Estim
ate
R²�=�0.4771
10
100
1,000
10 100 1,000 10,000
Cufflinks�Estim
ate
qPCR�Estimate
(a)
R²�=�0.5281
100
1,000
IsoEM�Estim
ate
R²�=�0.5281
10
100
1,000
10 100 1,000 10,000
IsoEM�Estim
ate
qPCR�Estimate
(b)
Figure 7 Comparison of Cufflinks (a) and IsoEM (b) estimates to qPCR expression levels reported in [14].
R²�=�0.1158
10.0
100.0
1,000.0
10,000.0
Cufflinks�Estim
ate
R²�=�0.1158
0.1
1.0
10.0
100.0
1,000.0
10,000.0
0.1 1.0 10.0 100.0 1,000.0 10,000.0
Cufflinks�Estim
ate
qPCR�Estimate
(a)
R²�=�0.3715
10.0
100.0
1,000.0
10,000.0
100,000.0
IsoEM�Estim
ate R²�=�0.3715
0.1
1.0
10.0
100.0
1,000.0
10,000.0
100,000.0
0.1 1.0 10.0 100.0 1,000.0 10,000.0
IsoEM�Estim
ate
qPCR�Estimate
(b)
Figure 8 Comparison of Cufflinks (a) and IsoEM (b) estimates to qPCR expression levels reported in [31].
Nicolae et al. Algorithms for Molecular Biology 2011, 6:9http://www.almob.org/content/6/1/9
Page 10 of 13
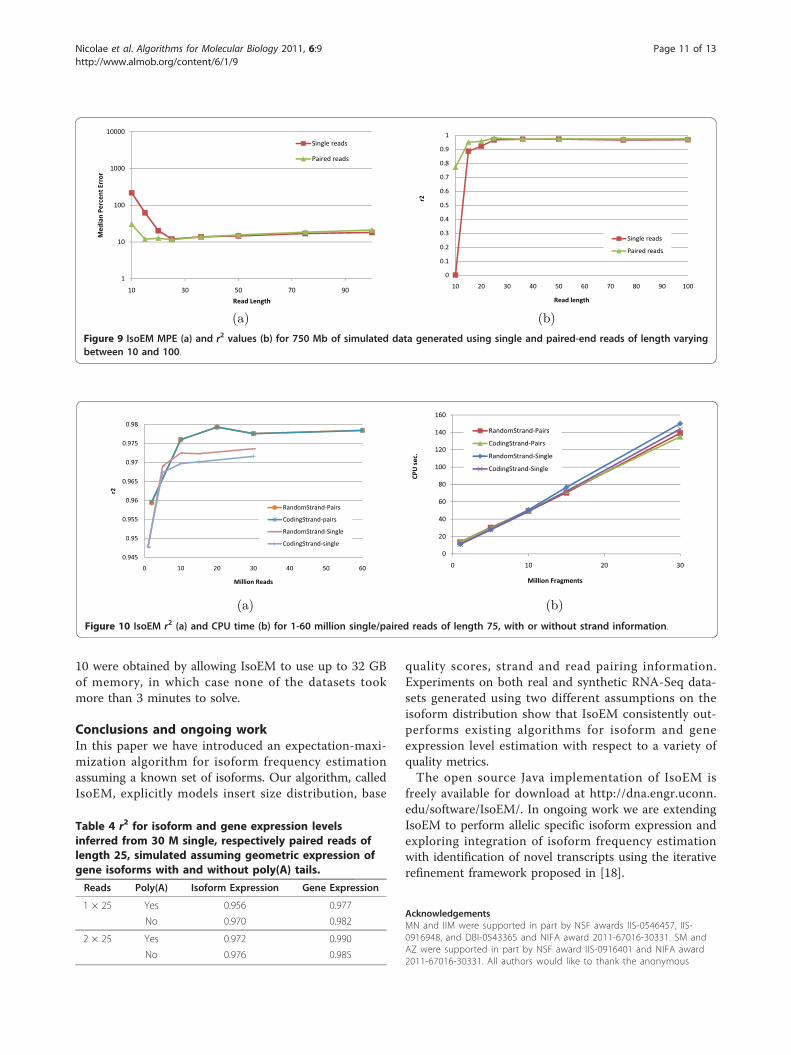
10 were obtained by allowing IsoEM to use up to 32 GBof memory, in which case none of the datasets tookmore than 3 minutes to solve.
Conclusions and ongoing workIn this paper we have introduced an expectation-maxi-mization algorithm for isoform frequency estimationassuming a known set of isoforms. Our algorithm, calledIsoEM, explicitly models insert size distribution, base
quality scores, strand and read pairing information.Experiments on both real and synthetic RNA-Seq data-sets generated using two different assumptions on theisoform distribution show that IsoEM consistently out-performs existing algorithms for isoform and geneexpression level estimation with respect to a variety ofquality metrics.The open source Java implementation of IsoEM is
freely available for download at http://dna.engr.uconn.edu/software/IsoEM/. In ongoing work we are extendingIsoEM to perform allelic specific isoform expression andexploring integration of isoform frequency estimationwith identification of novel transcripts using the iterativerefinement framework proposed in [18].
AcknowledgementsMN and IIM were supported in part by NSF awards IIS-0546457, IIS-0916948, and DBI-0543365 and NIFA award 2011-67016-30331. SM andAZ were supported in part by NSF award IIS-0916401 and NIFA award2011-67016-30331. All authors would like to thank the anonymous
Table 4 r2 for isoform and gene expression levelsinferred from 30 M single, respectively paired reads oflength 25, simulated assuming geometric expression ofgene isoforms with and without poly(A) tails.
Reads Poly(A) Isoform Expression Gene Expression
1 × 25 Yes 0.956 0.977
No 0.970 0.982
2 × 25 Yes 0.972 0.990
No 0.976 0.985
100
1000
10000
Median�Percent�Error
Single�reads
Paired�reads
1
10
100
1000
10000
10 30 50 70 90
Median�Percent�Error
Read�Length
Single�reads
Paired�reads
(a)
0.3
0.4
0.5
0.6
0.7
0.8
0.9
1
r2
Single�reads
0
0.1
0.2
0.3
0.4
0.5
0.6
0.7
0.8
0.9
1
10 20 30 40 50 60 70 80 90 100
r2
Read�length
Single�reads
Paired�reads
(b)
Figure 9 IsoEM MPE (a) and r2 values (b) for 750 Mb of simulated data generated using single and paired-end reads of length varyingbetween 10 and 100.
0 955
0.96
0.965
0.97
0.975
0.98
r2
RandomStrand�Pairs
CodingStrand pairs
0.945
0.95
0.955
0.96
0.965
0.97
0.975
0.98
0 10 20 30 40 50 60
r2
Million�Reads
RandomStrand�Pairs
CodingStrand�pairs
RandomStrand�Single
CodingStrand�single
(a)
60
80
100
120
140
160CPU�sec.
RandomStrand�Pairs
CodingStrand�Pairs
RandomStrand�Single
CodingStrand�Single
0
20
40
60
80
100
120
140
160
0 10 20 30
CPU�sec.
Million�Fragments
RandomStrand�Pairs
CodingStrand�Pairs
RandomStrand�Single
CodingStrand�Single
(b)
Figure 10 IsoEM r2 (a) and CPU time (b) for 1-60 million single/paired reads of length 75, with or without strand information.
Nicolae et al. Algorithms for Molecular Biology 2011, 6:9http://www.almob.org/content/6/1/9
Page 11 of 13
referees for many constructive comments that helped improving thepresentation.
Author details1Department of Computer Science & Engineering, University ofConnecticut,371 Fairfield Rd., Unit 2155, Storrs, CT 06269-2155, USA.2Computer Science Department, Georgia State University, University Plaza,Atlanta, Georgia 30303, USA.
Authors’ contributionsIIM and AZ conceived the study. MN designed and implemented thealgorithms and drafted the manuscript along with IIM. MN and SMconducted the experiments. All authors participated in data analysis andmanuscript revision. All authors have read and approved the finalmanuscript.
Competing interestsThe authors declare that they have no competing interests.
Received: 18 October 2010 Accepted: 19 April 2011Published: 19 April 2011
References1. Wang E, Sandberg R, Luo S, Khrebtukova I, Zhang L, Mayr C, Kingsmore S,
Schroth G, Burge C: Alternative isoform regulation in human tissuetranscriptomes. Nature 2008, 456(7221):470-476.
2. Griffith M, Griffith OL, Mwenifumbo J, Goya R, Morrissy AS, Morin RD,Corbett R, Tang MJ, Hou YC, Pugh TJ, Robertson G, Chittaranjan S, Ally A,Asano JK, Chan SY, Li HI, McDonald H, Teague K, Zhao Y, Zeng T,Delaney A, Hirst M, Morin GB, Jones SJM, Tai IT, Marra MA: Alternativeexpression analysis by RNA sequencing. Nature Methods 2010,7(10):843-847.
3. Ponting CP, Belgard TG: Transcribed dark matter: meaning or myth?Human Molecular Genetics 2010, 19(R2):R162-R168.
4. Anton M, Gorostiaga D, Guruceaga E, Segura V, Carmona-Saez P, Pascual-Montano A, Pio R, Montuenga L, Rubio A: SPACE: an algorithm to predictand quantify alternatively spliced isoforms using microarrays. GenomeBiology 2008, 9(2):R46.
5. She Y, Hubbell E, Wang H: Resolving deconvolution ambiguity in genealternative splicing. BMC Bioinformatics 2009, 10:237.
6. Hiller D, Jiang H, Xu W, Wong W: Identifiability of isoform deconvolutionfrom junction arrays and RNA-Seq. Bioinformatics 2009, 25(23):3056-3059.
7. Lacroix V, Sammeth M, Guigo R, Bergeron A: Exact TranscriptomeReconstruction from Short Sequence Reads. In Algorithms inBioinformatics, Lecture Notes in Computer Science. Volume 5251. Edited by:Crandall K, Lagergren J. Berlin, Germany: Springer; 2008:50-63.
8. Wang Z, Gerstein M, Snyder M: RNA-Seq: a revolutionary tool fortranscriptomics. Nat Rev Genet 2009, 10:57-63.
9. Mortazavi A, Williams BA, McCue K, Schaeffer L, Wold B: Mapping andquantifying mammalian transcriptomes by RNA-Seq. Nature Methods2008, 5(7):621-628.
10. Paşaniuc B, Zaitlen N, Halperin E: Accurate Estimation of Expression Levelsof Homologous Genes in RNA-seq Experiments. In Proc. 14th Annual Intl.Conf. on Research in Computational Molecular Biology (RECOMB), LectureNotes in Computer Science. Volume 6044. Edited by: Berger B. Berlin,Germany: Springer; 2010:397-409.
11. Oshlack A, Wakefield M: Transcript length bias in RNA-seq dataconfounds systems biology. Biology Direct 2009, 4:14.
12. Jiang H, Wong WH: Statistical inferences for isoform expression in RNA-Seq. Bioinformatics 2009, 25(8):1026-1032.
13. Li B, Ruotti V, Stewart R, Thomson J, Dewey C: RNA-Seq gene expressionestimation with read mapping uncertainty. Bioinformatics 2010,26(4):493-500.
14. Richard H, Schulz MH, Sultan M, Nurnberger A, Schrinner S, Balzereit D,Dagand E, Rasche A, Lehrach H, Vingron M, Haas S, Yaspo ML: Predictionof alternative isoforms from exon expression levels in RNA-Seqexperiments. Nucl Acids Res 2010, 38(10):e112+.
15. Birol I, Jackman S, Nielsen C, Qian J, Varhol R, Stazyk G, Morin R, Zhao Y,Hirst M, Schein J, Horsman D, Connors J, Gascoyne R, Marra M, Jones S: Denovo transcriptome assembly with ABySS. Bioinformatics 2009,25(21):2872-2877.
16. Jackson B, Schnable P, Aluru S: Parallel short sequence assembly oftranscriptomes. BMC Bioinformatics 2009, 10(Suppl 1):S14+.
17. Surget-Groba Y, Montoya-Burgos J: Optimization of de novotranscriptome assembly from next-generation sequencing data. GenomeResearch 2010, 20(10):1432-1440.
18. Feng J, Li W, Jiang T: Inference of Isoforms from Short Sequence Reads.In Research in Computational Molecular Biology, Lecture Notes in ComputerScience. Volume 6044. Edited by: Berger B. Berlin, Germany: Springer;2010:138-157.
19. Guttman M, Garber M, Levin J, Donaghey J, Robinson J, Adiconis X, Fan L,Koziol M, Gnirke A, Nusbaum C, Rinn J, Lander E, Regev A: Ab initioreconstruction of cell type-specific transcriptomes in mouse reveals theconserved multi-exonic structure of lincRNAs. Nature Biotechnology 2010,28(5):503-510.
20. Trapnell C, Williams B, Pertea G, Mortazavi A, Kwan G, van Baren M,Salzberg S, Wold B, Pachter L: Transcript assembly and quantification byRNA-Seq reveals unannotated transcripts and isoform switching duringcell differentiation. Nature biotechnology 2010, 28(5):511-515.
21. Trapnell C, Pachter L, Salzberg S: TopHat: discovering splice junctions withRNA-Seq. Bioinformatics 2009, 25(9):1105-1111.
22. Carninci P, Kasukawa T, Katayama S, Gough J, Frith MC, Maeda N, Oyama R,Ravasi T, Lenhard B, Wells C, Kodzius R, Shimokawa K, Bajic VB, Brenner SE,Batalov S, Forrest AR, Zavolan M, Davis MJ, Wilming LG, Aidinis V, Allen JE,Ambesi-Impiombato A, Apweiler R, Aturaliya RN, Bailey TL, Bansal M,Baxter L, Beisel KW, Bersano T, Bono H, Chalk AM, Chiu KP, Choudhary V,Christoffels A, Clutterbuck DR, Crowe ML, Dalla E, Dalrymple BP, de Bono B,Della Gatta G, di Bernardo D, Down T, Engstrom P, Fagiolini M, Faulkner G,Fletcher CF, Fukushima T, Furuno M, Futaki S, Gariboldi M, Georgii-Hemming P, Gingeras TR, Gojobori T, Green RE, Gustincich S, Harbers M,Hayashi Y, Hensch TK, Hirokawa N, Hill D, Huminiecki L, Iacono M, Ikeo K,Iwama A, Ishikawa T, Jakt M, Kanapin A, Katoh M, Kawasawa Y, Kelso J,Kitamura H, Kitano H, Kollias G, Krishnan SP, Kruger A, Kummerfeld SK,Kurochkin IV, Lareau LF, Lazarevic D, Lipovich L, Liu J, Liuni S, McWilliam S,Madan Babu M, Madera M, Marchionni L, Matsuda H, Matsuzawa S, Miki H,Mignone F, Miyake S, Morris K, Mottagui-Tabar S, Mulder N, Nakano N,Nakauchi H, Ng P, Nilsson R, Nishiguchi S, Nishikawa S, Nori F, Ohara O,Okazaki Y, Orlando V, Pang KC, Pavan WJ, Pavesi G, Pesole G, Petrovsky N,Piazza S, Reed J, Reid JF, Ring BZ, Ringwald M, Rost B, Ruan Y, Salzberg SL,Sandelin A, Schneider C, Schönbach C, Sekiguchi K, Semple CA, Seno S,Sessa L, Sheng Y, Shibata Y, Shimada H, Shimada K, Silva D, Sinclair B,Sperling S, Stupka E, Sugiura K, Sultana R, Takenaka Y, Taki K, Tammoja K,Tan SL, Tang S, Taylor MS, Tegner J, Teichmann SA, Ueda HR, vanNimwegen E, Verardo R, Wei CL, Yagi K, Yamanishi H, Zabarovsky E, Zhu S,Zimmer A, Hide W, Bult C, Grimmond SM, Teasdale RD, Liu ET, Brusic V,Quackenbush J, Wahlestedt C, Mattick JS, Hume DA, Kai C, Sasaki D,Tomaru Y, Fukuda S, Kanamori-Katayama M, Suzuki M, Aoki J, Arakawa T,Iida J, Imamura K, Itoh M, Kato T, Kawaji H, Kawagashira N, Kawashima T,Kojima M, Kondo S, Konno H, Nakano K, Ninomiya N, Nishio T, Okada M,Plessy C, Shibata K, Shiraki T, Suzuki S, Tagami M, Waki K, Watahiki A,Okamura-Oho Y, Suzuki H, Kawai J, Hayashizaki Y, FANTOM Consortium,RIKEN Genome Exploration Research Group and Genome Science Group(Genome Network Project Core Group): The Transcriptional Landscape ofthe Mammalian Genome. Science 2005, 309(5740):1559-1563.
23. MGC Project Team, Temple G, Gerhard DS, Rasooly R, Feingold EA, Good PJ,Robinson C, Mandich A, Derge JG, Lewis J, Shoaf D, Collins FS, Jang W,Wagner L, Shenmen CM, Misquitta L, Schaefer CF, Buetow KH, Bonner TI,Yankie L, Ward M, Phan L, Astashyn A, Brown G, Farrell C, Hart J,Landrum M, Maidak BL, Murphy M, Murphy T, Rajput B, Riddick L, Webb D,Weber J, Wu W, Pruitt KD, Maglott D, Siepel A, Brejova B, Diekhans M,Harte R, Baertsch R, Kent J, Haussler D, Brent M, Langton L, Comstock CL,Stevens M, Wei C, van Baren MJ, Salehi-Ashtiani K, Murray RR, Ghamsari L,Mello E, Lin C, Pennacchio C, Schreiber K, Shapiro N, Marsh A, Pardes E,Moore T, Lebeau A, Muratet M, Simmons B, Kloske D, Sieja S, Hudson J,Sethupathy P, Brownstein M, Bhat N, Lazar J, Jacob H, Gruber CE, Smith MR,McPherson J, Garcia AM, Gunaratne PH, Wu J, Muzny D, Gibbs RA,Young AC, Bouffard GG, Blakesley RW, Mullikin J, Green ED, Dickson MC,Rodriguez AC, Grimwood J, Schmutz J, Myers RM, Hirst M, Zeng T, Tse K,Moksa M, Deng M, Ma K, Mah D, Pang J, Taylor G, Chuah E, Deng A,Fichter K, Go A, Lee S, Wang J, Griffith M, Morin R, Moore RA, Mayo M,Munro S, Wagner S, Jones SJ, Holt RA, Marra MA, Lu S, Yang S, Hartigan J,Graf M, Wagner R, Letovksy S, Pulido JC, Robison K, Esposito D, Hartley J,
Nicolae et al. Algorithms for Molecular Biology 2011, 6:9http://www.almob.org/content/6/1/9
Page 12 of 13
Wall VE, Hopkins RF, Ohara O, Wiemann S: The completion of theMammalian Gene Collection (MGC). Genome Research 2009,19(12):2324-2333.
24. Clarke J, Wu HC, Jayasinghe L, Patel A, Reid S, Bayley H: Continuous baseidentification for single-molecule nanopore DNA sequencing. NatureNanotechnology 2009, 4(4):265-270.
25. Eid J, Fehr A, Gray J, Luong K, Lyle J, Otto G, Peluso P, Rank D, Baybayan P,Bettman B, Bibillo A, Bjornson K, Chaudhuri B, Christians F, Cicero R, Clark S,Dalal R, Dewinter A, Dixon J, Foquet M, Gaertner A, Hardenbol P, Heiner C,Hester K, Holden D, Kearns G, Kong X, Kuse R, Lacroix Y, Lin S, Lundquist P,Ma C, Marks P, Maxham M, Murphy D, Park I, Pham T, Phillips M, Roy J,Sebra R, Shen G, Sorenson J, Tomaney A, Travers K, Trulson M, Vieceli J,Wegener J, Wu D, Yang A, Zaccarin D, Zhao P, Zhong F, Korlach J, Turner S:Real-Time DNA Sequencing from Single Polymerase Molecules. Science2009, 323(5910):133-138.
26. Langmead B, Trapnell C, Pop M, Salzberg S: Ultrafast and memory-efficientalignment of short DNA sequences to the human genome. GenomeBiology 2009, 10(3):R25.
27. Howard BE, Heber S: Towards reliable isoform quantification using RNA-SEQ data. BMC bioinformatics 2010, 11(Suppl 3):S6+.
28. Hansen KD, Brenner SE, Dudoit S: Biases in Illumina transcriptomesequencing caused by random hexamer priming. Nucl Acids Res 2010,38(12):e131+.
29. Roberts A, Trapnell C, Donaghey J, Rinn J, Pachter L: Improving RNA-Seqexpression estimates by correcting for fragment bias. Genome Biology2011, 12(3):R22.
30. Sultan M, Schulz MH, Richard H, Magen A, Klingenhoff A, Scherf M,Seifert M, Borodina T, Soldatov A, Parkhomchuk D, Schmidt D, O’Keeffe S,Haas S, Vingron M, Lehrach H, Yaspo MLL: A Global View of Gene Activityand Alternative Splicing by Deep Sequencing of the HumanTranscriptome. Science 2008, 321(5891):956-960.
31. Bloom J, Khan Z, Kruglyak L, Singh M, Caudy A: Measuring differentialgene expression by short read sequencing: quantitative comparison to2-channel gene expression microarrays. BMC Genomics 2009, 10:221.
doi:10.1186/1748-7188-6-9Cite this article as: Nicolae et al.: Estimation of alternative splicingisoform frequencies from RNA-Seq data. Algorithms for Molecular Biology2011 6:9.
Submit your next manuscript to BioMed Centraland take full advantage of:
• Convenient online submission
• Thorough peer review
• No space constraints or color figure charges
• Immediate publication on acceptance
• Inclusion in PubMed, CAS, Scopus and Google Scholar
• Research which is freely available for redistribution
Submit your manuscript at www.biomedcentral.com/submit
Nicolae et al. Algorithms for Molecular Biology 2011, 6:9http://www.almob.org/content/6/1/9
Page 13 of 13


![Splicing isoform-specific functional genomic in cancer cells · 2018. 12. 14. · morpholinos, peptide nucleic acid (PNA), locked nucleic acid (LNA)] confer resistance to various](https://img.pdfslide.net/doc/110x75/614a7e2a12c9616cbc697388/splicing-isoform-specific-functional-genomic-in-cancer-cells-2018-12-14-morpholinos.jpg)