Embed Size (px)
Citation preview

COMITÉ INTER-AFRICAIN D'ÉTUDES HYDRAULIQUES
( C. 1. E. H. )
INTER-AFRICAN COMMITTEE FOR HYDROLOGIC STUDIES
(1. C. H. S. )
15, Square Max Hymans, PARIS 15·
ESTIMATION OF OISCHARGES OF TEN YEAR FLOOOS
FOR CATCHMENTS WITH A SURFACE AREA
LESS THAN 200 SQ. KM. IN WEST AFRICA
J. RODIEREngineer in Chief, E. D. F.
Head of the Hydrologie Service
of ORSTOM
C.AUVRAYDireetor of Researeh
for ORSTOM
Translation by
W. E. HERRIDGEChief Hydrologieal Engineer
Public Works Department • Ghana
JULY, 1965
OFFICE DE LA RECHERCHE SCIENTIFIQUE ET TECHNIQUE OUTRE-MER
24, Rue Bayard, PARIS 8·

COMITE.IN'l'~CAIN D,ETUDES HYDRAULIQUES.I.E.H.
INTER.A.FRICAN COMMITTEE :FUR HYDROIOOIC STODIES(I.C.H~S.)
ESTIMATION OF DISCHARGES OF TEN YEAR FlOODS
EOR CATCHMENTS WITH A SURFACE AREA LESS THAN 200 SQ. KM.
IN WEST !FRICA
: = :;:
J. RODIER
Engineer in Chief, E.D.F.Head of the ~Qg1.Q.Sarvice
of ORSTOM
Translation by
W.E. HERRIDGEChief Hydrolog1cal Engineer
~blio Worka' Department -Ghana
C. AUVRAY
Director- of Researohfor ORSTOM
JULY, 1965~. OFFICE DE LA RECHERCHE SCIENTIFIQUE Er TECHNI9UE OUTRE-MER

....
-2-
ESTIMATION OF DISCHARGES OF TEN YEAR FIroDSFOR CATCHMENTS WITH A SURFACE AREA LESS THAN 200 SQ. KM,
IN WEST AFRICA
..=", == :=1
At the end of 1961, M. Claude AUVRAY, Director of Researoh forORSTOM, made available to the Inte:r-A.frican Commi.ttee for Hydrolog:l.c Studies,presented at the MONROVIA Conference and at the first meeting of I.C.R.S.at COTONOU a paper entitled : "Estimation of discharges of 10 yearfloods intropical regimes~
This paper, forming the spearhead of our knowled.ge in this domainwas made available to the top planners, simply allowing them to obtain correctestimates for 10 year frequencies.
Since then the development of studies in experimental eatchmentsand the systematic study of storms in West Africa now permit the drawing-upof more precise and dependable rules for the estimation of 10 year floods insmall ~tcbments.
For this reason the I.C.R.S. decided to proceed with a remodellingof that first paper, starting from its data, without waiting on the generalstudy of the behaviour of the experimental and representative basine of ORSTOM,whioh will take several years.
TOt··thiseDd an agreement was ·conelud.edon 19 th December, 1963, betweenthe Minister - Delegate for Co-operation and the Directo~neral of OBSTOM, bywhich the latter organization was engaged to effect the following operation s
1. Bringing ~to-date, remodelling and confirming the paper of I.C.R.S. ofDecember 1961, relating to the estimation of the disChar'ges of 10 year floodsin tropioal regimes, as concerning catchments of less than 200 sq. lans. area.
2. The method of graphs will be maintained and if possible improved particularly('IIhen raina) are concerned. It must be determined up to what value of annualrainfall this principle of estimation is applicable.
3. The study of the dispersion of the results in relation to the actual valuesfrom the known catchments will eventually lead to an investigation into thedegree of precision of the proposed graphe.

..
, ..
- 3-
4. An attempt must be made to dE1fine properly the natural coefficients ofrun-off by concrete examples.
The present paper takes into account that study. It is wellunderstood that, in that paper the term "West Africa" must be taken in itswidest sense; that is, Africa west Of the Congo and south of the Sahara,covering to a great extent the tropical regimes.
General OoOOitions for the Formation of Floods in West Africa
The phenomenon of the formation (bu1ld up) of a flood, shown bythe line of a hydrograph. (curve of discharge as a function of time), depeOOson severa! factors conditional on the regime.
Firstly, the factors constant in time
- topography of catchment (Area, slope configuration)- nature of the soil.
Altitude, a factor essential in temperate regions often appears tobe secondary in a tropical regime.
Next, the factors variable in quantity from one year to another,and from one time of year to another :
- Rainfall (amount, intensity, frequency)- State of saturation of the catchment- Vegetal cOYer- Evapotranspiration- Influence of underground aquifers,- Flooding in the major beds (strata) or in interior sub catchments.
It i6 easy to aee that these factors are physically interlinked,fOllowing complex rules.
Accordingly they are not independent variables. Contrariwise theiractual effect on the amount of runoff may at different· times work in oppositedirections.
If one tries to interp rat statistically the factor "rainfall ll alone,over a period of several decades, one finds that it ia generally possible toapply a simple mathematical law covering frequencies of the order of 1/20for 24 hour precipitations, 1/50 or perhaps 1/100 for annual precipitations.

. _ IS!N
sca
12ca
....................,:! '.._ .. . .
(_0
o
....~~.~ .
expérimentauxet4
11111io
-.
000
00•... ......•...
1ca
_ AFRIQUE DE L'OUEST_
Situation des bassins représentatifs
2ca
ISUII
[
OUED "'OICTAII1 • OUED SE LOUNBO
ouED ALI
2 _ DIOIIAIA
I_T/II ADJAR
,,_ AFjrOLC
S .IN TIZIOUEN
'.sEeIICOTANE
7.KOUMElA"A
L CAIiAIl.\
~ _ 2AGTOULI
\0 .. MORO NABA
,,_ ,OULSA
'1. HAMlA _ ALOKOTO
\l_DOUNFIN514_ DJITIICO
15 _ fARAICO
:6. SEL05EN
11. BOUL Il
18- IAGOE
111. KOULOU
20- BOUKOMIE
2'. fERO IDJOU50IJ)
22. T1APALOU. WENOU
GORI E10UNIEROU
21. NADJOUDI
24. NAPAElOUR.KOUMFAB
2S. lIM81S
U_ICANDALA
17_MAVOIIICOURt
21. SOLOMOUGOU _ KORNOGO
21_ IAOULf IOOtlENNt 1JO _"IE IIIC lE SSEOOUGOU
JI_ICAN 1I0UAlCr)
12. LHOTO
U_ NION .GBOA. LouE
14_" ou
n. IAFO. SITOU.MANSO
11 _ AGIE8"

-4-
If one considera the BaIne test applied to the total arnounts ofmaximum flood discharge one ascertains fi~st of aIl that only relativelyimportant stream, for exarnple those for catchments greater than 10,000 sq.kms.privide flows of a sufficient duration to permit direct statistical studies.
For the average streams rith favourable conditions a ten or fifteenyears period of annual records allows eorrelations to be made, capable ofleading to the evaluation of discharges of floods of relatively low frequency.
Finally for streams of catchments less than 200 sq. kms. thereexists no series of records permitting dirèct statistieal studies. Theonly means of determinirig the characteristics of floods of rare frequenciesis by studying smaU experimental eatchments for several years, thé plannerfo11owing through the rainfall to run-off cycle, and building up the floodsof rare frequency, starting from their principal cause in sma11 catchmentsstorms of exceptional character. By this term we mean not only sudden .;;storms of exceptional deposition but equally storms hav-'.ng depos~tion mostspread out (in time), resulting in exceptional conditions of saturation.
&SIS OF THE STUDY
The obtaining of data for the estimation of exceptional floods hasbeen one of the major concerna of the Hydrologie Service of ORSTOM sinee1950. The many failures of bridges and dams occurring between 1950 and1960 , as weIl as the concern of the Technical Services to supply water bysurface reservoirs have aU tended to help ORSTOM to the utmost in thiscourse.
In this manner from 1955 the Federal Hydraulic Service has entrustedta ORSTOM 'the programme of setting up ten experimental eatcbments having inview the collection of essential data for the estimation of exceptionalfloods..
In total, 90 representative and experimental catchments have beenset up sinee the end of 1964 for the French speaking African countries. Somehave been coneerned solely with the study of heavy floods, but rith othersthe main object bas been the determination of other hydrologie characteristies;in a11 these catchments 1 t has to be seen that the management and measuringprogramme permits the study of the heaviest diseharges : in particular thelocation of gauging stations had to be such that the rating curves had asimple form up to maximum values, and the hydrologists were asked to carryout measurements up to these maximum values.

_AFRIQUE CENTRALE _
Situation des bassins représentatifs et expérl mentaux,o ,,,,.
Ji.DD 1<",
,~
/S! E
.'f
.~ SOUDAN.' ...' ".,..... ".~.
;1
)\.0-
1
4ca
2ca 5ca
1. BACHIKElE
2 .OUAO! KAOUN
2. BARlO
4. TARAï"'AN
li _ ABOU GOULE M
6 _ MAYO llGAN
7 • MAYO SOUlORE
•• MAYO KERENG
1 _ NGOlA
10 _ BADE
" .IOUNDJOUK
12 _ lEYOU: IISMIf..
12 _ COMBA
14 _ MAKA8ANA
AM·TIMANE
•
IQUE CENTRAFRICAINE
T CHA D
. .....l' ••••• :., .
• •/;
~..'.. '
10·
00....~0 .. .....-..1
...

- 5 -
Some of the basins have been under observation for too short aperiod to allow methodic interpretation ; for others i t bas not yet beenpossible to proceed with the analysis ; finally, some are of such a verypeeuliar (individual) character that they are of no help whatever in ageneral interpretation.
Eventually about 60 eatchments will be able to actually provideusuable data for a study of runoff.
A general build up is foreseen for the exploitation of this data,it will extend over several years and will require in the field, importantextension work, concerning most particularly geomorphology und pedology.But i t has been possible to effect in a few months a preliminary build-up,leading to more precise and dependable data than that of 1961.
On the other band, the 10 year depth of daily precipitation hasbeen the object of systematic study in Senegal, Mali, Niger; Upper Volta,Tchad, and partial study in the Ivory Coast, Dahomey and other neighbo'Ur:Î.ngcountries.
A second basis for the study of exceptional floods has therebybeen obtained.
Principles of Determination of exceptional floods in small catchments
If the flood depended only on rainfall, the 10 year flood wouldcorrespond exactly to the storm of 10 year intensity. In actual occurrence,the phenomena are very complexe
Suppose there is but one secondary factor : the soH saturation atthe start of the storm. A 10 year storm can give a flood having a dischargegreater or less than the 10 year flood if the saturation of the soil isabnormally high or abnormally low. On the contrary a storm of intensityless than the 10 year storm can give a 10 year flood if the soil is particularly saturated.
For simplicity wc have in our calculations assumed tbat the 10year flood (or annual flood) bas been caused by a 10 year storm (or annualstorm) having the characteristics of space and time distribution corresponding to the average conditions for heavy stoms and coinciding with theconditions of soil saturation and vegetal COVer corresponding equally tothese average situations. The operation is made more chancy since factorsothers than intensity of deposition, above aIl degree of soil saturationplay a very important role.

- 6 -
Fortunately in tbat part of Africa which concerna us,it does not occur in the zones giving the greatest runoff that the mostserious errors are where the floods will be most particularly dangerous.It is equally fortunate that, generally, in the case of a tornado, thehyetograph bas a form similar for different storms, for 25 square laDs., thestorm fai:dy well covering the whole basin, whereby the importance of twofactors is reduced : spatial and tirile distribution of precipitation.
The storm being known, the corresponding flood must bedetermined. For catchments of less than 50 sq. !ans. one can generally usethe unit hydrograph method. The essential principles of this method are asfollows : for a storm of equal spatial coverage of which the greatest duration and average intensity is léSS than a given limit (in praètice lessthan the time of rise of the flood) all run-off hydrographe have the sameform : they are refined curve8.
A storm having a duration greter than the limitingduration cao perhaps be split up into two or more stonns of duration lesathan the limiting duration and the resulting hiYdrographs can be joined vitha lag in time equal to the lag between the centres of gravity of thecomponent atorms. For each catchment there i8 therefore a correspondingtype hydrograph which is callOO "diagram of distribution", and which canperhaps be practically defined by a amall number of characteristica : thearea falling between this diagram and the axis of abscissae, the shape ofthe diagram. being roughly triangular ~ base time (tb) or duration ofrun-off, and a third factor which we ahall discuss later on, thé. degree ofsharpness· :o~· i ta Peak.
is equal to :The first characteristic, area described by the hydrograph
\tb
oJ Q-dt.
It cao be obtained by starting from the total volume ofprecipitation Vp over the catchment, and multiplying Vp by the coefficientof run-off Kr.
In certain cases, particularly for permeable soils,various different forma of the standard method for measuring the infiltrationcapacity bave been used : the loss by infiltration in mm/hr. is deduetedfrom the intensity of the storm in mm/hr on the storm diagram, and thequantity of runoff is then determin:d.B'"t. it is necessary always to knowthe losses by infiltration for various times of the year, for differentconditions of soil saturation, and for various storm durations. That method,more rational but much more difficult has been but little used, but itwill perhaps come back into greater usage. For the time being i t is ofgreat value in particular cases.

-7-
But in the major!ty of cases the coefficient of run-off i8used. This supposes, it is well known, that the 10 yeax value of Vp hasto be esti.mated, that is the 10 yeax value of depth of precipitation spreadevenly ovcr the catchment : we will return to this later.
The second characteristic, base time, may be determined bysystematic study of the distribution diagrams.
The third mny be defined by a coefficient
K = Q maxYM !
.here Qmax'(
M
K
= Peak discharge for the 10 year flood
= Mean discharge calculated for the 10 year flood during atime equal to the base time
= an overall function of geomorphological and vegetal coveragefactors : very fortunately it varies little for any giventype of catchment.
In these conditions the determination of the 10 year Uoodmay be effected as follows :
1. The total precipitation of the 10 year storm at a point is measured
2. The mean depth of precipitation over the catchment with a 10 year frequencyis determined by multiplying the point total precipitation by a coeffidientof reduction or a coefficient ofaxea reduction. : Thus Vp is obtained.
3. Knowledge of the catchment characteristics enables KR corresponding tothe 10 yeax flood to be determined.
4. The eatchment characteristics allow the base timetOœdetermined, whichmakes possible the evaluation of M.
5. Having chosen the value of K (K:z: Q;ex )corresponding to the catchment, Q max is determined (M being known)
6. Q maxr represems· only the immediate run-off, the base flow isadded to obtain the total maximum run-off.
Apaxt from surface run-off there i8 a sub-surface drainagewhich theoretically corresponds to drainage parallel to the ground surfaceand in the uppermost layera of soil, (in actual fact, the nature of suchdrainage 1s generally much more complez). In the following paragraphe thesurface run-off and subsurface drainage are grouped together, this beingin theory not very correct,but in practice does not introduce anyapprcciableerrors in calculations. VR, volume of run-off therefore includes subsurfacedrainage.

4. The coefficient K =
-8-
From the foregoing it is seen that determination of the10 year flood requires knowledge of the following data.
1. The 10 year storm at a fixed point
2. The area coefficient (for the catchment)
3. 4l'he run-off coefficient Vr.Qmax"V
M
With regard to base flow or underground water flow, itwould not be prudent to give general rules for its estimation. One mustnecessarily very ofton neglect it when the catchment is not too permeable,or when the annunl rainfall is less than 800 mm.
Estimation of the amount of the 10 year storm at a point.
To the north of an oblique line crossing from latitude 8°to go in the Ivory Coast to latitude 4° in Central African Republic, theheavier storms are generally tornados, tempestuous storms. presenting amain body of short duration and high intensity, followed by a drawn outtail of less intensity, and sometimes preceeded by a preliminary shower.It ma;y happen that the storm will be double or that the main body (of thestorm) is in two parts, but in general at a certain distance nearby thestorm is of simple form. It may be equally considered that in most routinecases thora is only one storm in 24 hours, of such a nature that thestatistical study of tornados establishes itself as the study of daily(24 hour) storms.
Individual tornados cover varying areas, but most often thearea affected by the hoaviest or near heaviest precipitation is of theorder of 20 to 100 square kilometres.
Over a narrow belt immediately north of the oblique linealready defined, the 10 year storm will be either a tornado of the sametype or a storm of continuous character over severa! hours with maximumintensities not very much in oxcess of 50 to 60 mm/hr.
But, generally i t is the tornadic type storm which leads tothe highest instantaneous mn-off (but not the grEBtest volume).
The storm of continuous character dominates in equatorialregions, that is to say over the southern part of the Ivory Coast, theextreme south of Togoland and Dahomey, the south of Cameroun, and the northpart of Congo.

DIV.2G1/15
150
e 130ec:III
~CI
~
.~ 90'1:1III"3it
70
50
Précipitations décennales de 24h en fonction
de la hauteur des pr-écipitations moyenne~ annuelles
1 • • ~••~•- ~
•• •~~~• • ••
~• •• ••• • • 1· .• • • •• • • • •• • • ~ •1" •• .~:: ! -
V"~"• • •• • ! • !• •••
i 1. .
•• _. ./4le. • _ •.,~ •.~.• •• • •..;.. . .... .
1-;' '.• •. .. .
• • Pluvlom~trie annuelle en mm• . .100 ]00 500 700 900 1100 1300 ·1500 1ïOO

- 9 -
The Coastal belt between St. Louis (Senega!) and Pointe Noire(Gabcn) has, over a breadth of 30 kilometres, storms of exceptionallylong duration, which reach between 200 and 300 mm deposition for the10 year frequency.
The amounts of 10 year precipitations have been the subjectof systematic studies over the greater part of West Africa ; in the east,regional studies have led to the finding for similar climates, of verysimilar precipitations.
The annual amount of precipitation is related quite closelyto the type of regime. If the equatorial regions and the coastal belt areset apart, the 10 yearly recurring daily amount of precipitation is anapproximate function of the annuel amount of precipitation, but varies very'. littJewhere annual precipitation amounts are more than 300 mm.
In the graph herewith (Graph 1), the 10 yearly daily precipitations are plotted as a function of annual precipitations : a certainamount of dispersion due to the peculiarities of exposure are noted ;particular areas are exposed to storms or, contreiwise protected from themj
This graph can be ueed for the determination of the 10 yearpoint precipitation, The 10 year precipitation maps already establishedfor Senegal, Mauritania, Mali, Upper Volta, Niger, Chad, and soon
for the Ivory Coast and Dahomey can also be referred to. Certain regionals tudies by ORSTOM also give values of 10 year procipitations for particularareas.
The maps are established for general conditions. It is certainthat a particular side of a hill exposed to storms will recoive greater10 year precipitations than those shown on the map, a sheltered side willreceive lesser precipitations.
Area reduction coefficient
At first sight it seems that if P is the 10 year pointprecipitation, the average precipitation ~ over a surface area S is smallerthan P and decreases proportionately as S increases.
The relationship ~ being calledcoefficient" experimental proof ha'â' to be lookeduntil now have not been correct :
the relationship
the "ares reductionfor. But the metr:.ods used
P..Mbas in actuality been de1;ermined, .where - P!1 is the maximUm -precipitation'
obeerved over the catchment wherever the point may be where PM J.S the outcome, and not ata fixed point in the catchment, which would be more correct.

... 10 -
In this way it will bo found that the coefficient of areareduction is about 0.85 for 25 sq. lans, for example.
If a catcbmEmt of 500 to 1000 sq. kms. is considered, as anaverage over 10 years perhaps 3 or 5-10 year point storms are observed atdifferent points, which facili tates confirmation that the average 1°yearprecipitation over the catchment corresponds to a storm of which themaximum point value (depth of precipitation) over the catchment area S isgreater than the 10 year point precipitation.
A thoorical study completod by a statistical summary studyh8s shown that the true coefficient of area reduction was clearly greaterthan was believed. The following Mtual values of the coefficient of areareduction are given :
0 ( s < 25 sq. km
25 < S / 50 .. 0,95\
50 < S 1 100 " 0,90,~oo , S / 150 " 0,85\
t50 < S / 200 " 0,80\
This 1s valid for the 10 year flood. For the annual flood i tcannot be ruled out that the Coefficient of area reduotion can be a littlehighèr than 1- {unity) for 5 km2 <S <15 sq. km.
Classification of Catchments bl their characteristics
Except for true mO\Ultain catchments, quito rare in the regionswhich concern us, 10 year precipitations are homogoneous, and as a tirstapproximation not dependant on the catchment, particularly on its topography.
On the contrary the coefficient of runoff, the base time andthe coefficient K depend on the physioal characteristics of the catchmentand in the first place on the vegetal cover, the slope and the soil penneability. (The nature of the drainage network would not come into play, beinga secondary factor).
Before continuing to study the data for the determination ofthe 10 year flood i t is therefore important to prepare a classification ofcatchments.

- 11 -
Coefficient of run-off and distribution pattern vary from onecatchment to another in the seme climatic region, being governed by severa!factors of which the most important are : the nature of the soil, the geomorphological charaater1stics and vegetal cover of the eatchment. It wouldbe ideal to define for any given catchment all these factors by a singlenumerical index.
At this stage of our study this ia not possible. We musttherefore be content with defining a certain number of classes of soilpermeability, of slope and of vegetal cover, and to classify the catchmentsin these various categories.
The permeability of the soil of a catchment is the most importanteharacteristic of a so11 as regards run-off ; it is difficult to enumeratefor the following reasons : natural catehment are riearly always more or lesshet,eroganeous. If a small catehment 1s homogeneous, there is the risk thatit 1s not representatiVeo Besides, what eounts is not the permeabilitymeasured in the labornry on a more or less disturbed sample, it is thepermeability in place, under the conditions et the start of the storm. Themost simple method for classifying permeabilities consists of using curveswhich for a catchmûnt, define the effect of run-off as a function of theamount of precipitation and the index of saturation. For this a very simpleform has bcen taken - the period of time in days from the proceding rain,groater than a given limit, 5 mm. for example.
Attached herewith iII a series of curvcs eorrosponding toseveral catchments. The flatter tho curve, the more impermeable the catehment.Th~ permeability can also be dcfined by the position of the curves : forexample the Iimiting precipitation for run-off after 3 days without rain.It 1s to be notcd that this classification takcs into aceount the eombi~~feot
of permeability and absorbtion by the vegetal cover, which is of notinconvenier· t for the study of the runoff. It would be preferable to replacethe term "pormeability" by that of "overall absorbtion capaeity of thecatchment".
In this manner 5 categories are defined :
P 1. Very impermeable catchments : catchments wholly rock or clay
P 2. Impermeable catchments with some permeable zones of small extent orhomogeneous catc1Jments almost impermeable.
P 3. CatohI:~nts fairly impermeable, having permeable zones of considorableextent, or homogeneous catchments not very permeable.
P 4. Fairly permeable catchments suoh as are found in zones of decomposedgranite with considerable sandy areas.

- 12 -
P 5. Permeable catchments : gravels or very fissued latoritic cover.
Within an,y one category the soil may vary in permoability. Bythe same reasoning i t is somewhat difficult to classify some catohments ina definite category. Resu!ting from this there is a certain "spreading" inour results. Points which a~e particularly deviating will be found for veryheterogeneous catchments, for example those with parts being of impermoableclay and parts with highly weather~~ laterite crusts •
.As i t i8 no longer possible to lay down a single gecmorphologicalindex usefUl for run-off, catchments are at present classified by their crossslopes and their longitudinal slopcs, in 6 categories characterized by anindex letter R. .
R 1. with very flat sIopes , less than 0.1 to 0.2 %R 2. with fiat sIopes less than 0.5 %: these are fiat country catchments
R 3. with moderate slopcs between 0.5 and 1 %: these are for the land intermediato betweon fiat country and rolling country
R 4. with rather steep slopes : longitudinal slopes between 1.0 %and 2.0 %,cross slopes greater than 2 %. Rolling country.
R 5. with steep alopos : longitudinal slopes between 2% and 5 %, cross slopesootweon 8 %and. 20 %. Rilly regions.
R.6~ with very steep slopes : longitudinal slopes greater than 5 '/0, crossslopes greater than 20 %. Mountainous regions.
To determine the slopes simple rules are set out, usable whenonly outline maps are available. To detennine the longitudinal slope thelongitudinal profile is taken following the principal water course of thecatchment :frot the watershed to the point on the river where worka (bridgeor outfall, otc •• ) are to be constructed, this point forming the downstreamlimit of the catchment. On the longitudinal profile the upper 20 %and. lower20 %extremitios are eliminated : the average longitudinal slope is thencalculated over the 60 %of the total longth of the profile. A similarprocess is used for the cross slope, considering half profiles aoross fromthe bed of' the water course (at the top of the bank:) to the edge of thecatchment, eliminating the upper 20 %and lower 20 %. If a catchment has afIat longitudinal slope and a very steep cross slope (this sometimes happensxith a mountain catchment), the cross slope must bo taken into considerationfor classify1ng the catchmont in a given R category.
- 13 -
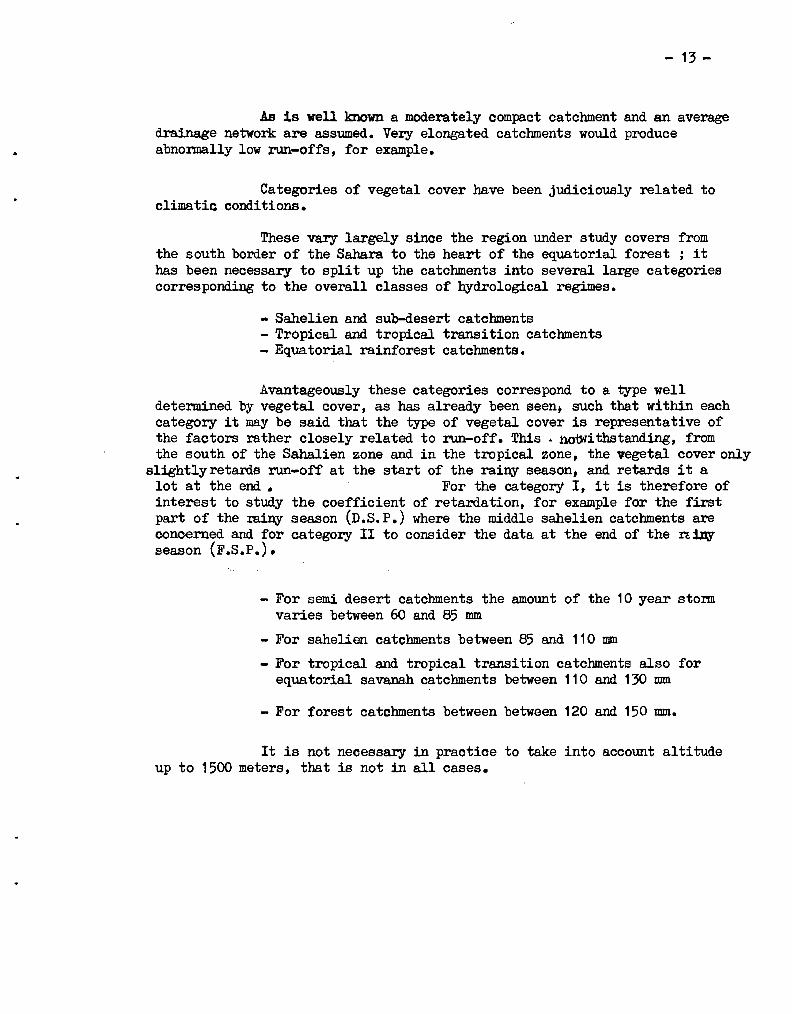
As ls well lmown a moderately compact catchment and an averagedrainage network are assumed. Very elongated catchments would produceabnormally low :run-offs, for example.
Categories of vegetal cover have been judiciously related toclimatic conditions.
These vary largely since the region under study covera fromthe south border of the Sahara to the heart of the equatorial forest ; ithas been necessary to split up the catchments into several large categoriescorresponding to the overall classes of hydrological regimes.
- Sahelien and sub-desert catchments- Tropical and tropieal transition catchments- Equatorial rainforest catchments.
Avantageously these categories correspond to a t,ype weIldetermined by vegetal cover, as has already been seen~ such that within eachcategory it may be said that the t,ype of vegetal cover is representative ofthe factors rather closely related to run-off. This • ilO"btIithstand.ing, fromthe south of the Sahalien zone and in the tropical zone, the vegetal cover only
slightlyretards run-off at the start of the rainy season. and. retards it alot a t the end • For the category l, i t is therefore ofinterest to study the coefficient of retardation, for example for the firetpart of the min;}'" season (n.s. P.) where the middle sahelien catchments areconoerned and. for category II to consider the data at the end of the rdDYseason (F.S.P.). .
- For semi desert catchments the amount of the 10 year stom.varies between 60 and 85 mm
- For sahelien catchments between 85 and 110 mm
- For tropical and tropical transition catchments also forequatorial savanah catchments between 110 and 130 mm
- For forest catchments between between 120 and 150 mm.
It i8 not necessary in praotice to take into account altitudeup to 1500 meters, that is not in all cases.

- 14 -
Study of Coefficient of Runoff
For a storm of given amount this factor varies with the permeabilityof the soil, the vegetal cover and the nature of the drainage network. Fora homogeneous region i t should vary litUe with the area of the catchment ;however in tropical Africa it decreases somewhat as the area increases. Thistakes into acoount theaerial coverage of storms and the losses to the ground.It ofen increases with the amount and intensity of the storm.
From effeetive studies of the same soils and of analogous conditionsof relief, but with storms heavier and more prolonged than in Africa··, themaximum limit of the run-off coefficient is in the neighbourhood of 85 - 90 %.
In certain earlier studies by ORSTOM the coefficient Kru was used,equal to the relation of the volume of run-off to the volume of utilizable
precipitation, that is to say to the VOlume correspondi~ only to the mostintense part of storms, the weaker tail ends (of storms) being ignored. Butthis concerned only a small number of cases and for homogenity of resultswa have here considered the ooefficient Kr ;the volume of precipitationconcerned is equal to the total volume of the storm responsible for theflood.
The three following cases can be identified
a) Sahelien and sub desert regimes(principally between the 150 and 750 - 800 mm annuel isohyetals)
Three variables have been considered : the area of the catchment,the slope, and the permeability. These last two variables cannot be represented numerically as we have seen earlier ; we must be content simply toseparate the catchments into different classes. That will suffice for thepresent stage of our studies.
Coefficients of run-off have been drawn as ordinates and the catchmentareas as logarithmic abscissae on the various graphs. The choice of the typeof oo-ordinates has been dictated by the need net to have represontativepoints too close for the very small catchments, whilst in fact it tends tomake the variation curves less simple than one would have obtained withcartesian co-ordinates.
Permeability being the most important factor, a series of graphshas been established, each corresponding not to a single permeability, buttwo permeabilities because it is not always certain that all catchments willbe weIl covered by the class in which they are typed.
COEFFICIENT DE RUISSELLEMENT
Régi mes sahéliens et subdésertiques( P varie de 150 ci 800 mm)
,... PERMËABILITË P1 - P2----1--... IV -JI'! _
-~ TfNADJAR
~ ~--------'''''''''''':+------+----
~......,
'2 CA jARA E.ST
0 R2 n ..........
f___---+-----+----+-....-...-...~..... ,J..&,+...o_al---.~~. " ~ CAG~RJ _.~Ué ST ~~_FtM....APiY0l_t_L_I_GA-IA+___t_-f___+_+__t___1- ..........,,........, ~ R3 PZ : 6
1
........< """ ! FS.P""'l..........'............... ~ 1",Z, ~70ULI HORO "1 BA TIN ADJAk i'o....
- "';;: ;;':;'. ---6-~-'>1!--P-'2----~.Ei,...~i---P-;l?--f---+--+---+I~.......k--+--+-+-lH::? P2 TARAiMAN____ ...... , • i ............
---..;;; 0R2P3? --...... ...... t XOUHSAKAII.~ """"",,---.......... BACHf c.L 0R4 2 1"""" ......
............... 0f 6 P2.............. .................. 1 .........
f---+--~I9--+----+----+--------+--...._...-....~ ...........- ~...... _.....................; 1 .......,r-
-...... ~rroL ......................... ?JR5P~ ......... ,,_ .....
..........~.. ~ ........................ DfCN4,8A
100
~1
~
,
901
IN riz; VEN01/.5 PZ
80CJ•-tPI .. ------.-_-
~---70 --...
1
CIPI 60u- r-...:z~..
50SES;KOTA/'iE.
,;..
H.2.3 P2.3
40 _.
2 3 4 5 10 20 1..0 50 60 70'-~ s.~: Fr,' .:saison des pluies

- 15 -
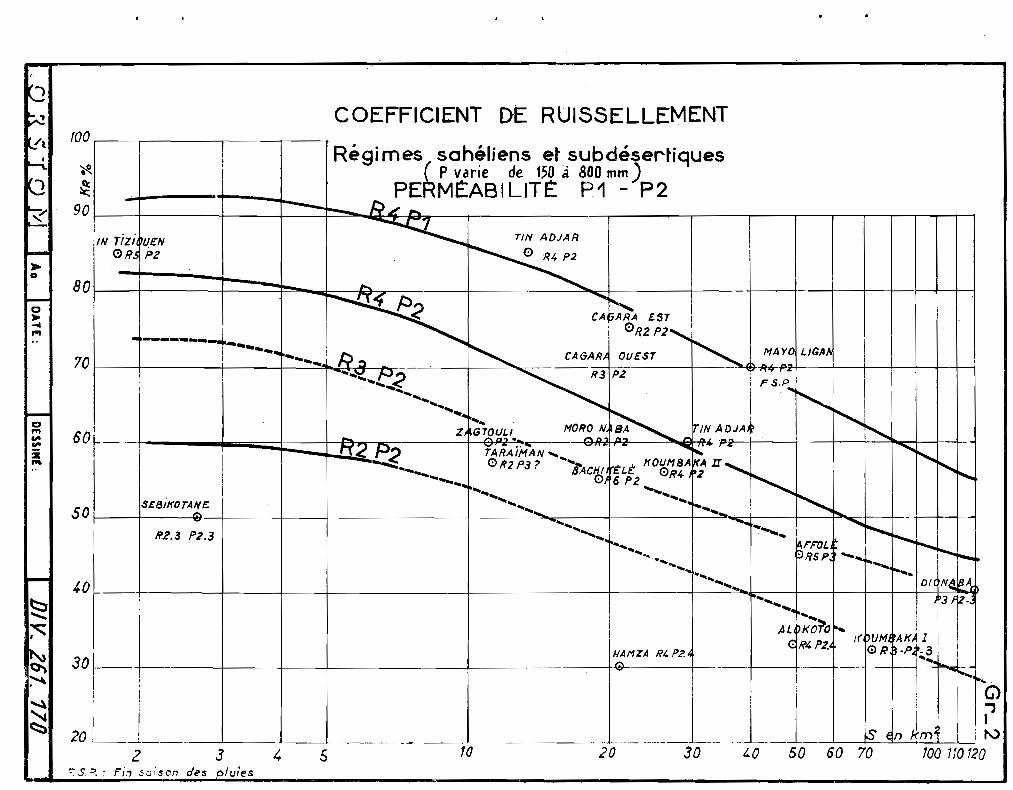
Graph 2 was established for P1 and P2 - impermeable soils ; beinggiven the range we do not have to look at the lines of a1l the curves corresponding to various combinations of Rand P. We have only to look for anapproximate line corresponding to the extreme situations met wi. th in practiceR 4 P 1 which corresponds to the highost coefficients of that category andR2 P2 which corresponds to the lowest observed values. The curve R 4 P 2 hasbeen delineated, corresponding to the catchments which are most frequentlyencountered.
Curves R4 P1 and R4 P2 being taken, for S = 2 km2, the higheet"';values of the coefficient of run-off : 85 - 90 %are used. They show a steepfalling off from 10 to 40 sq. km ; it is this which points to the degradationof the drainage netwol'k, wall known in the Sahelien regimos where evaporationplays a very great part ; for catchments a little larger, part of the area "escapes the stonne But approaching 100 sq. kms., the èoefficient of run-offagain flattenèl out. The relatively flat slope of the curve R2 P2 must be noted.Every catchment does not give results for the slope R1, but it is known thatfrom 2 or 3 sq. kms., the drainage is practicallY nil, water stagnating inswamps. But in such a case, once a single d~dinage route·bas been established onslope R 2, the coefficient of run-off becomes,; fairly high, as has beenshawn with slopes a little steeper, in the catchment CAGARA -East, for example.A large proportion of representative points clearly deviate from the curves,but the reasons are perfectl~' weIl known and in certain cases a correctioncoefficient can also be determined. The following cases are cited :
1. Dryest sub desert catchments (IN TIZIOUEN, BACHlKELE) have 10 yeax floodscorrespondingto storms of only about 50 mm., whilst all other catchmentsreceive a minimum of 8? mm, their coefficients of run-off being very low
2. Certain catchments near the 800 mm. isohyetal on the contrary are on thebordera of the tropical and sahelien regimes : this is tho case for BARLO,MORO NABA., NADJOUNDI, ~iA.YO LIGAN, for example ; they can supply usefulindications, but must be used with caution. In P2 terrain for example,prov:isional results are a litUe too high for the large catchments(BOUIBA, MAYO LIGAN), too low for the very small ones.
3. The three catchments of HA1VlZA., ALOKOTO and KOUMABKA 1 are very heterogeneous. They aIl have lateritic crusts more or less broken ~p, correspondingto P4 ; the remaining part of the surface is of type P2 or P1. In factonly part of the catchment has intense run-off characteristics ; if a1l thecatchment were of P 2 classification, it would be necessary to multiplythe coefficient of run-off by 2 or 3 for HAMZA and incrcase-: i t considerably for ALOKOTO and KOtJMBAKA 1.
4. The calculations for TIN ADJAR minor and CAGARA east are not very precise,the boundaries of the catchments being difficult to determine.

"V. 261/5G
COEFFICIENT DE RUISSELLEMENTRégimes sahél iens et subdésertiques
( Pvélrie de 150 ~ pOO mm _). PERMEABllITË P3 .
A
100 120 Ç)
ï'
~I
40 50 60 703020105 6 73
L1 - .._-~...._.
TARA/HAN 11
°
c----~~S!8//(OT~NE'--..
R1 P1?
~._-----t---O-I-·-~·- . . _.....- .._._-~----.---.-- ----_._-R}_3 P}_l BOU~~,q?"",,--r---.. ............
~- -
R6 Pl
---r---,:---. J) A,... . ~~RLO . A FF,DL t D/ONA8- 0_ 0---· o-~ stLgUM80 R5 P~r------ R5 Pl_} Rl P....
1r----RS Pli .
0, ~AHZA_ArDKDTD
-~--- RJ OR' Pl.t.'..1"'------~ st 8/:{DTANE'SlLOUM80_- R t. Plt. 0~ R?Pl • 08DULSA "B'ÂRLOI- R1 Pl K ,KAI
0Rl Pl.li
. ~ R1Pl °- --- R~R5 Pl i °BOUf SA" -
.I!.J. 1 Rl Pl .- 1
~---- --..., - -- _.-1'-___
KADUN -.............. °-----.~, RI. P1.1 1-----.. ,-t=-r-T--
1
1 Sen km2-o2
60
40
10
30
20

- 16 -
5. The catchment of TARAlMAN is formed by a range of classification, in P3at the start of the rainy season and mostly in P 2 at the end, but wherethe dividing line stands is a question as yet unanswered.
We see that these curves would be more reliable if our indiceR and P could be more accurate and equally more dependable, and if some ofour hydrologists would not have had ta arb1trarily overestïmate some coéfficients of run..off, above all for the impenneable catchments which they havehesitated to classify correctly.But, among these figuratively representedpoints we recall some corresponding to 10 year floods effectively observed(the case of KOUMBAKA II for example) and others extrapolated to a smalldegree.
Graph 3 is for permeability P3 ; dispersion is still high, butthe curves are clearly lower than those of graph 2. It is weIl known thatvery high coefficients of run-off will Ilot be found as for permeability P1and P2 areas of less than 20 sq. km. This is best evidenced by the twocatchments of SEHOUMBO. These two catchments are equally interesting fromanother viewpoint ; one of them is manifestly more permeable than the other,the proportion of fractured sandstone in i t being very high, but for the timebeing the two cannot be classified other than in P3. Here is seen the precision which would be obtained by a more precise classification of permeabilitiee.The wo points for SEHOUHBO need to be moved slightly higher. In effect theycorrespond to the semi-desert regime and have a 10 year storm of only 82 mm.,a little lower than the lower limit of the Sahelien regime. The graphiealpoint for TARAII~ is in this case changed in the opposite direction : ina heavy rainy season, its permeability approaches that of P2.
For l'Ouadi KAOliN (Sub-Catchment) the area cannot be definedprecisely and the determination of the coefficient of run-off has been veryprovisional.
The curve P2 P3 as given is purely indicative. There is nopractical data to trace it.
Graph 4 is for terrain of permeability P4. Run-off is only practieal for heavy storms and for catchments which are with steep and fairlysteep slopes. Two catchmentshaving very high permeability P5 are representedthese being FARAKO and DOUNFING. In fact these are tropical catchments havingten year storms of 110 and 130 1IIDl. respectively. In sahelien climates, theircoefficients of run-off should be clearly lower. The curve F. 4 P5 wouldprobably take the position of curve R 3 P 4 or could even be below i t. Itis to be noted that ground of permeability P5 in sahelien zones will notgive any effective run-off for areas of more than a few sq. kms.

t:::J 0......~1
~'4
......."-"""'"
C>.,1
""
40 50 60 70 80 100 110120·3020
COEFFICIENT DE RUISSELLEMENT
Régim.~ sahéliens et subdésertiques
(p var ie de· 1) O,i 800 mm ~ )
PËRMËABILITE P4
S 6 7 8 9 103
r1
1
1j 1
1
!1
1
11
1
i 1 1 i1 1 11
1_.
1 1
1li1
1.(1=~~ 1 1
1 ~8G lu GOIJLEI11r-I-- -
l 1R4 7. ______ KA~/,N1 ABOU c~OULEjW
1 DOUN~6NG~ 1
1
1.2
R ~ P,/ 1 r---- R" P ~A~~KO 1R5 PS1 , r---. 1
:-1'--. t--.... R' P5 1
~out.ou 1 KAOI N t--I'-.I--
RJOp-;-'-r------i ;R30" 1 10.... -1 1r---..10..... 1 l l ,5' er"~ m'
___"~___•___-1...- •• __ .-.....l...---
2
10
20
40

p~
~l
r--{
P
COEFFICIENT DE RUISSELLEMENT
Régimes tropicaux et tropicaux de transition(p varie de 800 à 1600 mm.).
PERMËABILITE: P2
G).,1(J1
-r--r--r-.... NADJ_( UNDIZA~.,r0ULI 0",~ PZ F.s.P.
. ~.~~I__t----'f-----i--+--+__-+-t__+__+___+____i
P2 110RO NA BA R2.~
r----r---r--I-...__~
Déb ut sais on des pluies _ F. S.P. Fin ",oison des pluiesD.S.P.
80 r------.----...___--..,------r------,---r------r--.------------,----------.-------r--..--~-__;______r-.__...____r___1
*-'1' ! ! 1 1 1 1
ct l' '1 1
~! 1 j 1
70 1 MAYO f;.:6AN . . 1
ri------t-----+----1L----t--+---+ f--+-------+----+---~---+--__+_-t____+____+__+-+--
PI, PZ F.!J.P.
60r1 ------- -----·---1?~__th2
!~--. --S 0 1 --- -- ~-._
. .......-............. ! 1 ~~. --. --
~ KERllt6 R.4 P'J.l 1 ----1--__ i 1 ~---8ou~l ~! . i "'--__1-_ 1
R ----... +------ --~~:::.·;------~-E') i: 1--- --- --- .. J 1 !-- --r-' • .$::1'-- -- l " 1--~-_.,.--.I.- -. B VL81./, 0 r-----+---+---+---+-----JL...:.-.--+-----+-I-...::.-'-+=I-~._~--.__ ------1-----__----=t=r: 1 +"1 ,_. IP~3
NADJaVNDI -l~--- --t- --i--'~- -. -----01 1 1 1
R4 P2! DS.P 1 . 1 1 1 1
30 '----~_------L__----'---_----L..._ __L._----L_L....-.--'----..I.__~ ----'--l ----JI4--_-------L_----l.._----J1----:S:....lI=en..:.,....L..:~. ..:...:..m.:.J..12---L.-..L--'
2 3 5 6 7 &t 9 r10 20 30 40 50 60 70 8090100110120
•
- 17 -
Similarly for permeability P4, it can be said that there is butlittle run-off, aven for hcavy flQods, for slopes flatter than R 3 catchmentsslopes.
b) Tropical and tropical transition regimes
We recall in this category the catchments situated at the borderof the tropical regime and the sahelien regime (between isohyetal curves 800 mmand 1000 mm) _ We also have in this category equatorial savanah catchmentswhich have the sarne type of te~ yeer storm, the same soil, the sarne vegetation as tropical transition catchments.
In classif,ying these catchments the vegetation plays a certainrole. In fact, the permeability index P takes into account both lOBS byinfiltration in permeable soil and the water absorbed by the vegetal cover.
Another characteristic point for tropical catchments is thedifference in behaviour of the catchment between the beginning and end ofthe rainy season. On our graphs the coefficient of run-off for the end ofthe rainy season, which is the highest is generally considered. Against this,the times of concentration are longer.
Few eatchments of permeability P1 or P2 are found, and thesemoreover are between annual isohyetals 800 mm and 1000 mm at the edge ofthe sahelien regime. This is because the vegetal cover is more dense, andalso because the very impermeable soils are less frequent in zones whichare weIl watered, and are better protected by vegetation.
Graph 5 is for permeability P2. There are no P2 catchments withsurface area less than 2 sq. kms. but the indications of Mayos IŒRENG andBOULORE for which permeability is close to P2, though a little greater,show that the curve passes a little below their representative points. Inas far as the number of representative points permits confirmation, thecoefficient of run-off would be lower for the very small catchments than forthose of a sahelien regime. It would be nearly the same for catchments of100 sq. km.
For now it is sufficient to attempt to trace the curve RA- P2 ;meanwhile the curves R3 & R2 have been traced in indicative form, but theyare very imprecise. Shown on this graph are the figurative points forNADJOUNDI at the beginning and end of the rainy season, to show adquatelythe difference between the two conditions.

G)JI0\
3020
COEFFICIENT DE RUISSELLEMENT
_-'__----lL--------'----_L------'-------'-------'------ --'-------__-------'---__--'-~~_~~'1'> Arri1.0 - 50' 60 70 80 100"0120
....t::J 10.......;"
11
~ L_ I0\0~ .,
3 4 5 6 7 8 9 10~. '"~
if")~
~
~l
hil")~
1'-/
~ 60
1-o......CI'.
:z
""
Régimes tropicaux et tropicaux de transition
CP varie de 800 à 1600mm)
PËRMËABILITE P3
"; ~~~~~" -----+---- --+--- -_. -_.... 1::.!sPJ RS r ll----~r 1n~ 1· ~--~~~ f~ !
l 50 ~I-----T KE~~:Gp, 2 . R.~ lP3 -----I-----~ -----~·----·I--- ---'.. ,--t-t-f-'1 0 ". 1 D. 1ri) 0 i ,
4.0 r--=t-----. . BOD 0 1( 00 mm) !!oRLO 1. 0 ;;j.ip4 i s,gULBI---- ----- ~--- ~--- ~--.~--I--.~- / f?5 P3 R3 P3 ! 1 1~-------______ 1 : ~ R2P3t------- ~. + '1 R2 P3. - --1 --- "'"-- ....-. -- "'"- ""'-t- ~-.
30 !11~KABANA i !/80~ è Ji. 00 mm) iI-""---~f__-__+-____I-_+-+__+__+__+_-------i_=.......__.~--I-----------J---f--
1 Rs P3 il 8o,jLSA BARLl ~EL GEl 1
r 0 1 1 0 1
1 R2P3 RSPJ i ! /?2 r~ gUL~A 1 1
1 -Hi 1 : 2P l!
2a ! 1 I-----+----1

COEFFICIENT DE RUISSELLEMENT
Régimes tropicaux et tropicaux de transition
( P varie de 800 à 1600 mm.)
PERMËABILITË Pit et P5
Q.,1~
10
50 r----r-----,r---~-,,______r___;_-.__r__------r__---_r__-____,--_,__- -,--~~~.______;_--.---'1
~ 1 II 1
40 r----------=-=i:=-:-~---jr---+_____If____+____+I-f____f___i!____I-B--I-~-'H'_---If____-----'--+_-_____t--+_il _+------.;~__I____+_---I-_+___1._. --~--.._--. +__' _' __tt.'::>_l:::."t. ! 1
° 1 AyJ"LJ ------11-~~~A~~-- 'II ----- ----~--- --- --1-- -- -- --__~_____ R5;4 r ' R4 P4 1 R3 Pl reRj2. : ~:o;t ,."KANDALA R31p s
30 -- -=f===f==F=t::::::T=T~T-!~-~~~"""""'--t":':'~~~~~4~~~~~$~S~::±=Ji ! FERKCfSEDOU6du i '
SOL o NOUCOIJ Il R3,(~?_4! GO ~I ou VlEfOU
"0 ODI ,fNt!: :R4~SO/Or 80~~~Otf 1 i M.. rON/(OI,:; P4i\ XAf1BO,L r-----;;;;;;;;;;;;;;;;;;;;;;r-;;;;;;;;;;=f;;;;;;;;;;~~-=î=~~~~~~~~~=-=--=--::1~-=-:::::::;!:tl;t::t:'=ttn"\!tirh'~Jt:j:=::t:::jt:Jt1J";::l:±:t~0 '1 5 5 " TTlT l 'Ù 1 .,. R P •
RPI! ! !
R3.f <; OU R'~ pl, l '50p5 ! ~;*:;NOU: 1 FA,!,"O
---'~----~---:-~~L:!~~~~=~t~q~_~_~I_H_~~~_-~S~~~~~-----~---------.--- --- -- !--.--J._____________ 2ES _
1 ----- ---- --- --- --- ---- --.--
il 8AD.t 1 R2 P6 i8AD~2 P6 1 8 i~to G> R3 P6 G> e .......-+--+-+-oooti-.-_---,...._...I.-- .L-_------L_....L-_L-...L...-----l.-_L-I_ _ . L_____ 1 _----'-___ __iL_""'""~--P8__I-_.L-L......J
2 3 ft S 6 7 8 9 10 20 30 40 50 60 70 80 90100110120S en km 2
-
-o~-1
'"
1. Galerie epa/$,se

..
- 18 -
Graph 6 is for permeability }>3. Here have been used the catchmentsat the northern boundary of the tropical regime which have already beenySed with reservations for the sahelien regimes •
Curve R4 1'3 1s sufficiently well known. The coefficient of run-offvaries only a 11ttle with area. But this curve corresponds generally to .catchments having an annual rainfall bétween 800 and 1200 mm ; i t would bethe same for catchments having from 1200 to 1600 mm the more dense vegetalcover directing it toward the lower values as tends to be indicated in theoase of BOUNDJOUK and MAKABANA outside the limiting belt between the sahelienand tropical zones.
Graph 7 is for permeabilities P4 and P5. The tracing of the curvesas given presented sorne considerable difficulty due to the wide dispersionof results, most of all in the tropical regime, for several reasons :
1. Forested areas lead to losses which are not negligible. A comparisoncan be made between the coefficient of run-off for TIAPAWU where they(the forested areas) are fairly dense and that of GORI BOUNIEROU wherethey are very scattered.
2. Permeable terrain is somewhat frequent in occurrence, but it is oftendifficult to make a distinction between categories P4 and P5 andsometimes between P3 and P4.
3. The amount of annual precipitation varies between 1200 mm and more than2.000 mm.
Secondly, aIl other factors being equal, storms closest togethergive tise to somewhat higher coefficients of run-off. All the sarne, forequal anounts of precipitation, the equatorial regions where the raina aredistributed over a great part of the year give a lower coefficient of runoff than the tropical transition regions where the rainy season rarelylasts mare than 6 montb&.
The set up of the curves of graph 7 shows that the coefficientof run-off tends to become independent of the catchment area, which isnormal when the good drainage network does not lead to large losses, and thehydrographs, more regular than for a sahelien regime do not change veryquickly from upstream to downstream.

- 19 -
c) Forest Régions
Undeniably the experimental data is insufficient to permitthe variations of coefficient of run.off to be graded as a function of thevarious parameters. There are eleven eatchments, too few even for the roughgraphs which we are presenting. We give heraafter the table of data relevantto the 10 year floods of these catchments~
What we call "run-off" in a forest zone is moreover aforro of drainage unlike that of the sahelien regime ; it would be morecomparable to sul?-surface drainage.
10 Ye4,t.Floods for small forest Catchmente
1 L ! 1 , J
; ~OEFFICIE~ BASE! ANNUAL ~SURFACE 10 YEAR: RAINFALL
,CATCHMENT ' AREA FLOOD . OF RUN-CFF ~ FLOW .
i (mm} ! km2 l/s.Jœ2 % ~ QO(m3/s1• •!
NION ! 1.800 10 2,000-2200 28 2j4!
R6P6 ! 1.800 62 600-700 42 6!
-GBOA R6P6 ! 2.300 11,5 2500 50 0;75!
LOUE R6 P6 ! 2.300 17 !.::~; 5œ-2S00 32
IFOU R3 P5 !1.200 38 ! 350 10 1,251 ! !
! B.AFO R2 P4 ! 1.600 27 ! 1,800 65 2! ! 1.600
,!
SITOU R2 P4 ! 29 ! 2,000 70 2
! MANSO R2P3 ! 1.600 92 1 600 60 4! AGBEBY R4 P6 ! 2.200 11 550 6 1! !
LEYOU R5 P4 !1 800 -2 '1000 1 6 1,000-1 100 11 0,35, ,BIBANGA R2 P4 '1 800 -2 000' 25,2 200 a 300 12 0,65, !.MALA R6 P3 2.250 9,2 17.500 46,5 0,50
MALA R6P3 2.250 6,7 10.500 30 0,30

-20-
On the other band the influence of the vegetal cover considerably masks the penneability of the soil. For instance the three catchmentsof BAFO, SITOU and ~~SO are classed in P3 and P4, whilst study of the soilsshows that they would be classed in P3 and P2 had they not baen forested.The forest certainly curbs the flow, and this is easily seen in the studyof the rise time, but the humid climate limits the losses by evaporationand the 10 year s torms (1 60 mm) are very much heavier than in the previouscases.
If the slope is very steep (R6), permeable soils would moreoverbe found having coefficients of run-off of 35 to 50 %as for N'ION GBOA, LOUEin the Ivory Coast (catchments with higher run-off have been found in theMonts de CRISTAL). But it must be noted that in this case the storms areheavier than 200 mm.
For much more moderate slopes (BAFO, SITOU, and MANSO) buton impermeable soils, coefficients of run-off of 60 to 70 %are found forcatc~ents of 25 to 100 sq. kms.
It d09S not seem however, that for such precipitations, thecoefficient of run-off in forest areas will reach values of 80 %as arefound in sahelien zones.
Setting aside these extreme cases, if the soil is not tooimpermeable, which is the general case, and with slopes less than R5, thecoefficients of run-off vary between 5 and 15 %: the first value oorresponds to moderate slopes and very permeable soils (P6 if there is no forest);the second to a slope R 5 and a soil of class P 3 if there is no forest.These are really low values when i t is considered that the 10 year stormsare at least equal to 130 mms.
But one must be suspicious of very impermeable soils (P2 ifthere is no forest), and very steep slopes of the order of R6. Moreover,in tropical cyclone countries coefficients of run-off in excess of 80 %are observed for catchments with a relief R6. A simple examination of thedrainage network indicates moreover if it is located in a dangeraus (iehigh flood potential) catchment or note
Run-off Time and Rise Time
The determination of these elements of the unit hydrographshould be more exact than that of the coefficient of run-off, as they do notresult frem extrapolation. Nevertheless there are sorne difficulties.

- 21
First, the unit hydrograph method i8 only an approximatemethod, it worka best for homogeneous catchments, which are not ofton found.
Moreover it frequently happons that the sarne catchment hasseveral distribution patterns : for example, one for weak floods, anotherfor very heavy floods, which is quite normal ; in the first case the flowconsists of a sheet of water fairly thin on the ground ; in the other casethe flow forms itself into a nappe (watercourse) and follows the normalhydraulic laws giving riSe to very different results.
Sahelien catchments, the wettost, and tropical catchments,the dryest show eq.ually two types of run-off ; that at the beginni.ng ofthe rainy season (D.S.P.) with soil very little covered.; a flash hydrograph and often a fairly low coefficient of run-off ; that ut the end ofthe rainy season (F.S.P.) with a fairly dense vegetal cove:r, a fairly highcoefficient of run-off, and a fairly flat, extended hydrographe Generallyone considers the first hydrograph for sahelien catchments, the second. fortropical catehmonts. The distribution pattern has always been studied onlyfor heavy floods ; by such study the graphs corresponding to a run-offwhich covers only a part of the catchment can be eliminated, except whenthey are characteristic of the catchment and the region (for example thecases of the catchments of HAl~ and ALOKOTO).
There has been hesitation over the choice of the parameterssuitable for the characterisation of the hydrograph : that is to say thetime of rise, the time between the beginning of the flood and i ts peak, orthe base time of the run-off, the time between the start and finish of thesuperficiel runoff. These times are determined only for unit floods, thati6 to say, theoretically for short and intense storms. It is often a delicate matter to determine unit floods with certainty. From a group of floodsi t is necessary to reject those which are not unitary (time too long or onthe other hand too short to provide more than a ~lal run-off). For thebase time the division between the run-off and the subsurface flow issomewhat arbitrary, particularly in a tropical transition regime, of sucBaturethat i t is not always known if the end of the run off hydrograph is in fact- ~
of the direct run off or of another form of drainage.
We have ropresented in the following paragraph the time ofrise or of run-off as a :f\mction of the araaa of catchments, and dividedthem into 3 categories :
Gr.S
$t~/KO'ANC( )
't1I~)-i-------+-----~'-----+-----+---·!"8-SA-+-~
III ~J
i----l
j---r-
1
Temps de montée en fonction de R et de SR(GIMES SAH(L1ENS - SuBD(SERT lOUES
1 -- -----r---l
1~_._--
1
i
1 -J-r--- --- -
,1 t1
1
th
7h
3h
5h
00
'"::.:è5 '- -..1

Temps de base en fonction de R et de S
R~GIMES SAHELIENS- SUBDESERTIQUES
J'A25h r-------.-----r----r~__,r____.-,.___,--....- __ ,.ONA 6
F.II'.
'"...--'0'":.:èi~__- ....... ..... ..;.;... .....

Gr. 10
remps de montée en fonction de R et de SKAU:JALA rlfENOIJ
R~GIMES TROPICAUX ET TROPICAUX DE TRANSITIONr-IlJ-~- fUN
. 1
---T'h f--------f-----+----+--
IUOt0-+--+--+-+--4
.,~,
12050 6D 70 80 !Xl 100
1 1 <b"! 1 1 1
7h r-------+---+---+------+' I,T. . 1 - ---- -- . r~ttltf'f:IIKESSCOIJUÇOIJ
; 1 ! 1 11I1T'i;--1-r--t-t----+-t-'1----::0C:-,t1 : 1 1 .,0110 NA.A 1
- 1 i 1 1 fil Pl _LSA1 1 1 .OUNDJOIJK ° '0 1
__ ~ _ i----rl-r-I
.....,.__11_._~J_ ~C;~Ei~~ 1
i fil ~. flJ ~,
1 1 TI~ALou-lRI ~,
_l.1S{--,--OlIL_'_ K1: ~fil ~,
2h
6hi-----1
1 \ '
1 r ,15hll- -1-1 1
! ! 1
'h I!-- +-t-IUOIIU
10III ~,,
13h r-------t----t--
0 .... ......

Gr_11
Temps de base en fonction de R et de S
REGIMES TROPICAUX ET TROPICAUX DE TRANSITION
1 1
11S1l•
• INA'llfA 6lU l'li
rSOit --------.------,
If' 1
----- --- -+---------+------+--'--+--+--+--1-+---+------j-~--r-1-1 1
/,Oh
'Oh
Il r'';JA Lov1 Il] l',
11
JO' ~---+------+---+---+--t-+-+-+-l---~, i
1
1
.,.~-~~èiL...i ...

- 22-
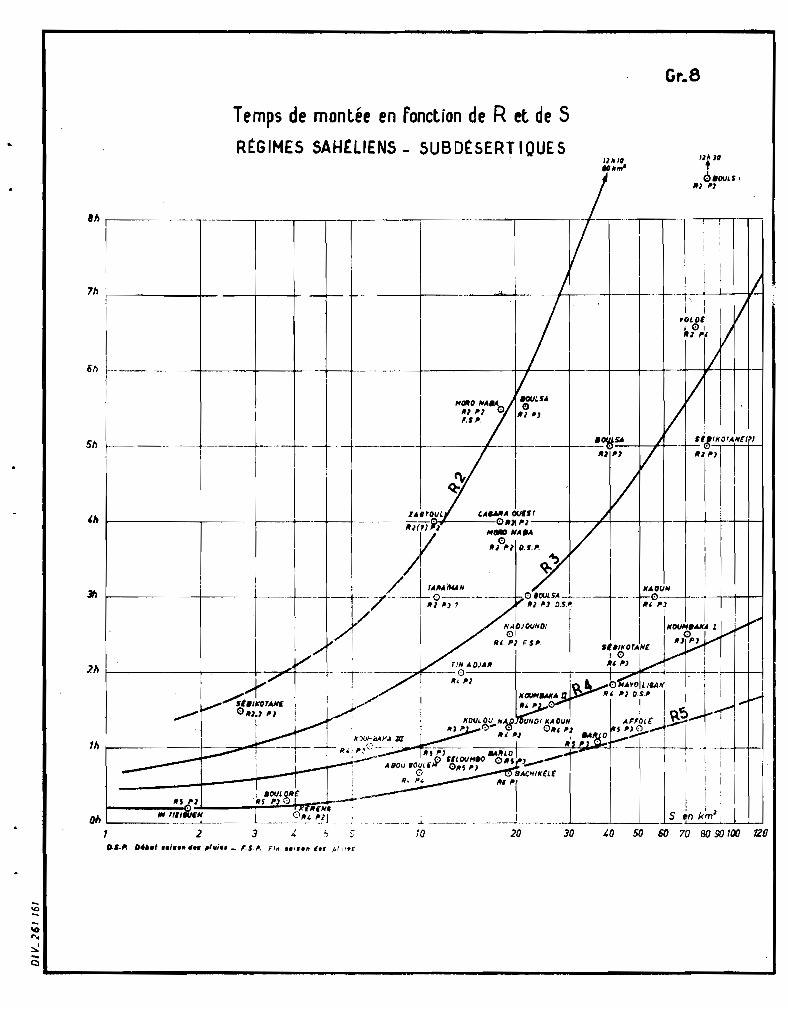
a) Sub desert and sahelien Retrnnes•
In graph 8 and 9 are found the curves of variation of time ofrise and base time as functions of the area. It is quickly seen that theinfluence of the permeability P was of little importance within a givencategory, whieh is logical when at a time of soil saturation a11 the soilsare similar (sufficiently so for a first approximation), this affecting therate of the runoff. Four curves for R 2, R 3, R 4 and R 5 have thereforebeen drawn : each representative point carries the two references R and P.A notable dispersion i8 II1oreover seen. which ls generèl.lly self-explanatory.Three principal causes are indicated
- abnormal elongation of catchments
• dense forest areas at the lowerend of the catchment
- eatchmonts which never givecontribution trom their entirearea
SEBIKOTANE (43 sq. !an)
KOUMBAKA l
SEBIKOTANE, YOLDE~ KAOON•
Playing an equal part in the dispersion of the representativepoints is the tact that certain catchments have slopes 1ntermediate betweenR2 and R3 for example.
A considerable deviation from normal is observed for pointsat the end of the rainy season : BOUU3A (F.S.P.), NAW"OUNDI (F.S.P.) whichwe have put on the graph to show clearly the difference from the points forthe n.s.p. !start of the rainy season}.
It 1s recalled that these points correspond to unit storms.These storms are not 10 year one for eatchments
-R2 less than 2 sq. !an
- R3 Il 3 sq. laD
-R4 " 15 sq. laD
• R5 Il 25 sq. km
Naturally, these graphs are val1d for catchments of not tooelongated fom with a drainage network which 1s neither too favourable infom nor too unfavourable for run-off, that 1s, an average network.

- 23-
Naturally also, if a swamp occurs in the course of the principal river of an R4 catchment, the tise time and base time are very muchincreased. It is sufficient ta compare the catChments of DOUNF'ING in whichthere o.re several low-lying swamps and of Maya IŒRENG where there are none.
For certain very small steeply sloping catchments, abnormallylow values for the rise time are observed, the case of Maya IŒRENG forexample. This is due ta flood wav'e phenomenon. The drainage coming from themost distant part~ of the catchmont channels more quickly than that fromthe closest parts, which tend ta travel more slowly along a dry stream bedwhilst re-saturating it. In any one case it is evidently difficult to giverules for the precise calculation of the rise time.
b) TroEical and tropical transition Regimes
Earlier, the curvce of variation of base time and rise timehave been drawn. The data for catchments situated near the borders of thesahelien and tropical regimos has been used, already taken into account inthe preceding study.
For the area between the 900 mm and 100 mm isohyetals we havetaken as a matter of preference the data at the end of the rainy season.Further ta the south this has but little importance.
The dispersion seems greater than for the former eategory :this is due ta the presence of forcsted areas. This has been clearly seenfor example for the catchments of TIAPAWU and WENOU which have the samecharacteristics as that of GARI BOUNIEROU, but this latter does not haveforested areas.
The highly cultivated catchments of KORHOGO and SOLOMOUGOUhave very short rise times, compared with those of sahelien catchments.
As a general TUle the rise times are longer than for tropicalcatchments. This is due ta the retarding effect of the vegatation.
This is less clear for catchments of more than 25 sq. kms andfor catchments, having flat slopes R2 and R3, for in such sahelien catchmentsthe degradation of the drainage system has an effect in the forementionedcases, retarding the drainage in the streams beds, whilst in their upperparts they drain more rapidly than for a tropical regime.

- 24 -
The base times for tropical regimes are the shortest. This isdue in part to the rule by which the surface run off and the subsurfacedrainage are separated because in a tropical rûgime there is nearly alwayssubsurface drainage. One tends to determine too short a run-off time, whilstfor a sahelien regime one often ignores the subsurface drainage, group1ngi t with the surface runoff, this leading to an excessively long base time.
But the degradation of drainage channels in the sahelien rogionacts equally in the samû sense and here i t 1s even more noticeable forflattish sloped catchments R2 and R3.
cl Forest catchments
These are too few in number for it to be possible to draw agroup of curves.
Following hereafter is a table, showing for the catchmentsnamed, the two indices R and P, the surface area S, the rise time Tm andthe base time Tb.
CATCHMENTS INDICES S (Km2) Tm Tb
NZANG (Mala) R6 P3 9,2 o h 40 3 h 30MITZIBE R6 P3 6,7 1 h 3 h 40NION B6 P6 10 6 h 16 h
R5 P6 62 30 h 80h
GBOA R6 P6 11 ,5 3 h. 30 17 h
LOUE R6 P6 17 3 h 13 h
LE.'YOU R5 P4 6 2 h 15 17 h 45AGBEBY R4 P6 11 3 h 30 11 h
mu R3 P5 38 7 h 17 h
BIBANGA R2 P4 25,2 19 h 35 h
BAFO R2 P4 27 13h 40 h
SITOU R2 P4 29 13 h 26 h
rIDIDO R2P3 92 15 to 20 h 52 h

- 25 -
It 1s neeessary to place catchments in zones baving thesteepest possible slopes· The first four catchments are true mountaincatehments. Unt'ortunately GBOA and UlUE are very elongated catchments, therise tima and base time tending ta be shorter than the time actually foundfor these catcbments. But, by placing the representative points on theeurvee of graphe 10 and 11 i t is varified(with difficulty, as thera areseveral points which do not conform.) that Tm is 2 to 5 times as great fora forest regime as for a tropical regime, the difference being probablygreater for very amall catchments. The proportionate relationship wouldbe a little leBS for base time, varying from 2 to 4. It is here that onesees the effect of the regulating influence of the forest. Meanwhile inthe case of very steep slopes : R 5 or R6, the difference from the tropicalcatchments is not so great~ For catchments of slope R6 the curve R4 of graph11 can be used.
Study of the Coefficient K = ~
We have seen earlier that to take account of the shape ofthe hydrograph we use the factor:
K = Q/M.
where Q i8 the maximum value of the unit runoff hydrograph and M is the meanflood discharge, taken as uniform. over the whole duration of the base time Tb.
It is assumed for simplicity that there is no subsurfaeedrainage ; the surface run-off only is considered. Being given that conditionfor the study of KR the surface runoff and sub-surface drainage have beeneonsidered j ointly, thus bringing in a new cause of dispersion (of results) ,but at this stage of the study it 1s not possible to proceed further withrefinements; and errors in the reeults for the flood discharges as oalculated,and which result from this simplification are SIDall.
It is easily seen that the hydrograph is a simple triangleSM = 2.
If tr~e hydrograph is very pointed with a rather wide basewhich is the case for many catchments having a high runoff, the volume ofthe flood will be less than that of the triangle and following from this ~will l'te somewhat greater than 2. M
If the hydrograph has a very rounded peak the volume of theflood will be mueh greater than that of the triangle, .Q. will be less than 2.This is so in the case of forest catchments. M
..
- 26 -
If the hydrograph, without being very pointed, has a narrowbase, sueh as in the case of catchments having a good run off, but with therun off considerably retarded"i will equally be less than 2.
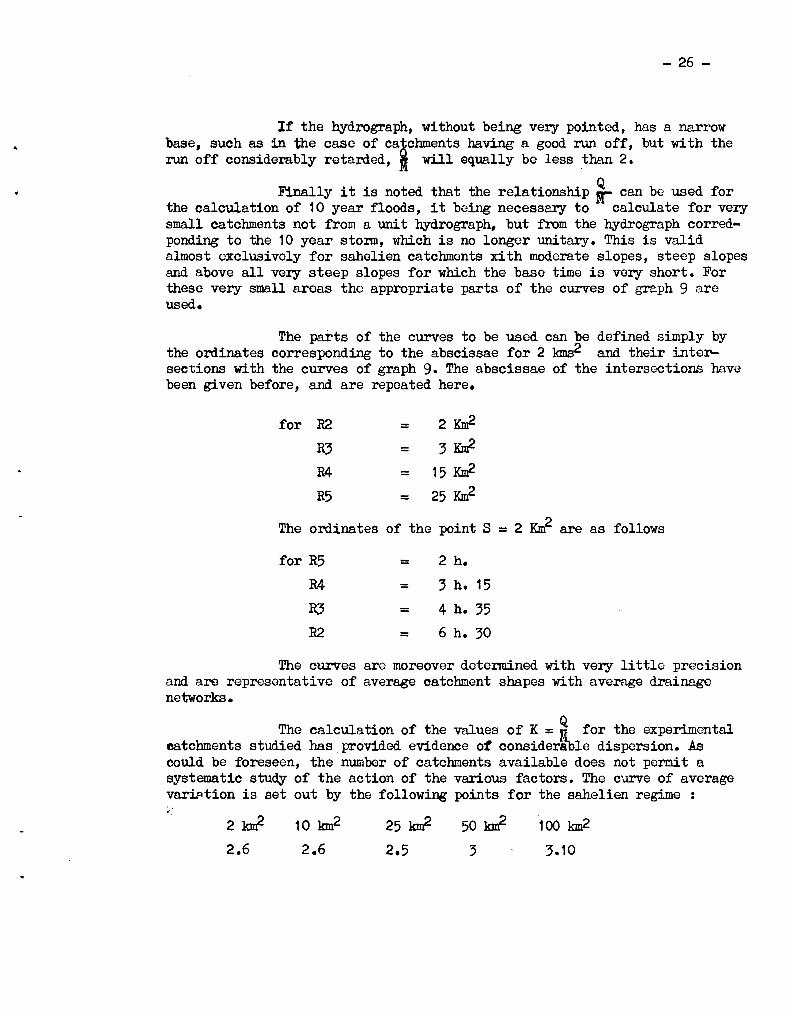
Finally it is noted that the relationship } can be used forthe calculation of 10 year floods, it being necessary to calculate for verysmall eatchments not from a unit hydrograph, but from the hydrograph corred...ponding to the 10 year stom, which is no longer unitary. This is validalmost exclusivoly for sahelien catchments xith moderate slopes, steep slopesand above all very steep slopes for which the base time is very short. Forthese very small araas the appropriate parts of the curves of graph 9 areused.
The parts of the curves to be used can be defined simply bythe ordinates corresponding to the abscissae for 2 kms2 and their intersections with the curves of graph 9. The abscissae of the intersections havebeen given before, and are repeated here.
for R2 = 2I{nr2
R3 = 3I{nr2
R4 = 15 KJn2R5 = 25 Km2
The ordinates of the point S = 2 1{m2 are as follows
for R5 = 2 h.
R4 = 3 h. 15
R3 = 4 h. 35
R2 = 6 h. 30
The curves are moreover determined with very little preC1S10nand are representative of average catchment shapes with average drainagenetworks.
The calculation of the values of K = ~ for the experimentaleatchments studied has provided evidence of considera~le dispersion. ABcould be foreseen, the number of catchments available does not permit asystematic study of the action of the various factors. The curve of averagevariFtion is set out by the following points for the sahelien regime
2knf2.6
10 km2
2.6
50 m23
100km2
3.10

- 21-
The increase of ~ from catchments of 25 km2 to those of 100 km2ls explained by the fact that as the flood progresses downstream thedrainage gradually becomes less and less adapted and. the hydrograph baseis elongated, that is to say as the surface area of the catchment increasesthe hydrograph devèlops a steeper peak: fairly quickly ; which leads to awide bas~ with a peak not too falttened. For small catchments of less than10 Km2 the hydrograph is no longer unitary, its shape varying littlebetween2 and 25 sq. kms.
Catchments with a particularly good run off : especially thecategories R4 P2 and R5 P2, above aIl those between annual isohyetals700 mm and 900 mm at the borders of the sahelien and. tropical regimes havemoreover a fairly lo~ base time and a very sharp flood peak, leading toa very high value of ~.
lt seems wise, for this category and in the case of drainagenetworks favourable to the runoff (fan shaped networks) to use thefollowing figures.
10 Km2
3
20 Km2
3
50 Km2
4.5
100 Km2
4
For tropical and tropical transition catchments a value of2.5 may be used for i ' whatever the area of tbe catchment, without therisk of serious errors. For forest, values of ~ about 1.7 are quite oftenfound.
Calculation of 10 year fioods
We'·,now have available aIl the materiel for the calculation.
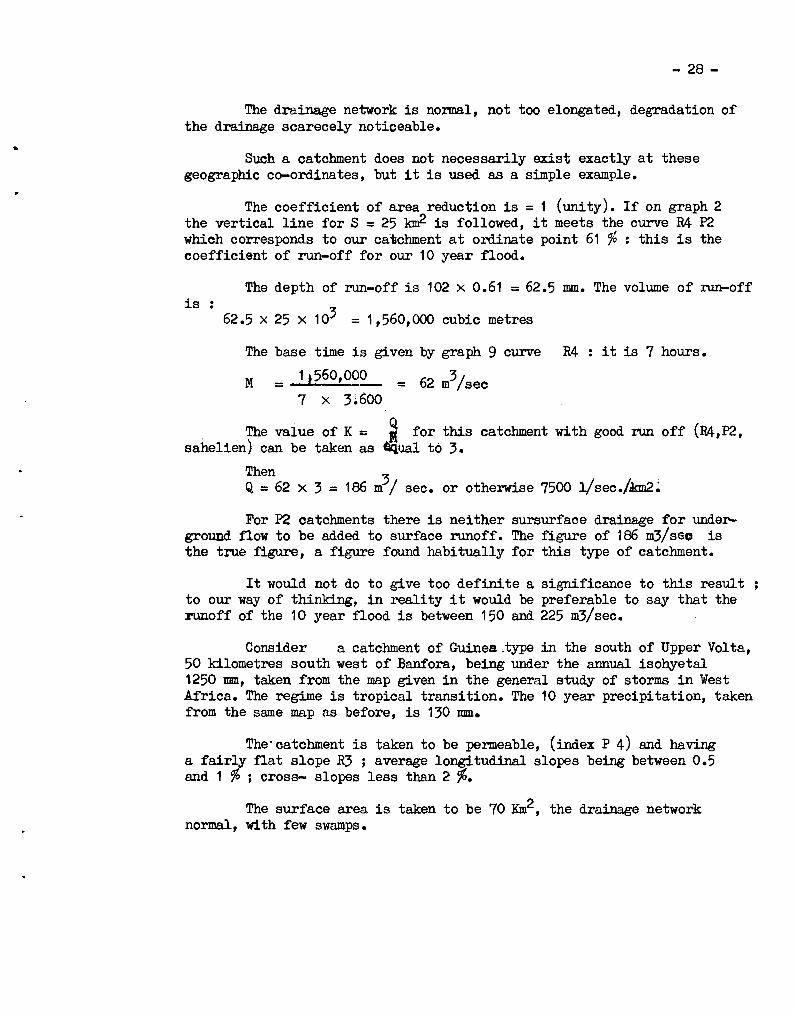
Consider a catchment under the annuel isohyetal 700 mm. To flxit we will place it in Upper Volta 10 Km. north of Kaya. For this amountof precipitation the climate ls sahelien. The 10 year precipitation givenby the map of 10 year precipitations for Upper Volta (see General studyof Storms in West Africa) is seen to be 102 mm in 24 hours.
We assume that the catchment is impermeable (permeability P 2)and that a quick ground survey enables us to classify i t in category R4(longitudinal slopes averaging between 1 and 2 %; cross slopes greaterthan 2,%, less than 8 %). The area, planimetered from a 1/50,000 mapand from aerial photographs, ls 25 km2.
..
- 28-
The drainage network is normal, not too elongated, degradation ofthe drainage scarecely noticeable •
Such a catchment does not necessarily exist exactly at thesegeographic co-ordinates, but it is used as a simple example.
The coefficient of area reduction is = 1 (unity). If on graph 2the vertical line for S == 25 km2 is followed, it meets the curve R4 P2which corresponds to our ca1lchment at ordinate point 61 %: this is thecoefficient of run-off for our 10 year flood.
isThe depth of run-off is 102 X 0.61 = 62.5 mm. The volume of run-off
62.5 X 25 X 103 = 1,560,000 cubic matres
The base time 1s given by graph 9 curve R4 it is 7 hours.
M = .1t560,00~ = 62 m3/sec7 x 3~600
. The value of K == ~ for this catchment with good r'iln off (R4,P2,sahelien) can be taken as ~ual t6 3.
Then 3 !
Q =62 X 3 = 186 m / sec. or otherwise 7500 l/sec.Ikrn2.~
For P2 catchments there 1s neither sursurfaee drainage for underground. flow to be added to surface runoff. The figure of 186 m3/seo isthe trua figure, a figure found habitually for this type of catchment.
It would not do to give too definite a signif1cance to this resultto our way of thinking, in reality i t would be preferable to say that therunoff of the 10 year flood is between 150 and 225 m3/sec.
Consider a catchment of Guinea.typa in the south of Upper Volta,50 ldlometres south west of Banfora, being under the armual isohyetal1250 mm, taken from the map given in the general study of storms in WestAfriea. The regime is tropical transition. The 10 year precipitation, takenfrom the same map as before, is 130 mm.
The' catchment is taken to be permeable, (index P 4) and havinga fairly fIat slope R3 ; average longitudinal slopes being between 0.5and 1 %; cross- slopes less than 2 %.
The surface area is taken to be 70 Km2 , the drainage networknormal, with few swamps.

- 29 -
The cOéfficient of area reduction is equal to 0.90. The averageamount of precipitation to be taken into account ia :
130 x 0.9 = 117 mm.
Graph 7 (Curve R3 P4) ahows that for the 10 year flood for anR3 P4 catchment of 70 km2 , the coefficient of runoff is 18.5 %.
The depth of run-off ia 117 mm x 0.185 = 21.6 mm.
The volume of runoff for '70 km2 is
21.6 x 70 x 103 = 1,520,000 m3
The base time from graph 11 is 30 hours (it ia taken that theforested areas are not too thiek, which could double or triple the baseUme).
M =1,520,000
=30 x 3600
The value of K = S for this tropical transition catchment willbe taken as 2.5. M
Then
Q ::; 14 x 2.5 = 35 m3/ sec, corresponding to 500 1/eec/Km2 •
A base flow of 2m3/sec must be added which cannot very weIl bedetermined until after an on the spot examination of the flow of groundwater, in the absence of an examination of base flow in a fUll rainy season.
One gets Q. 10 = 37 m3/ sec. as a final result, this being530 1/sec/kIr?- •
It is noted that this figure corresponds to ground with itsnatural cover. If a11 the area has been cultivated without attention todrainage requirementa, it would he necessary to give attention to a change:ln the conditions of runoff, a11 of which would become similar to those fora catchment having a permeability P 3 or perhaps even P2, depending on thetype of soil.
Take now an example of a very ama11 catchment of 2 km2, whichwe imagine to be in Niger, under the annual isohyetal 550 mm, west of Madaoua.The climate ia sahelien type. We assume that the slope is in the R 4 range,

-30-
and that the catchment consists almost entirely of the clays common in thatregion, which can without hesitation be classed as P2. We have not thoughtof any particular catchment, but it would be fairly easy to find on of thistype in the region indicated. It is noted ~hat it 1s not always easy tadefine with precision the boundaries of a catchment of 2 km2.
The 10 year point prec1pitation, taken from a map establishedfor N1ger is 100 mm.
The coefficient of area reduction 1s 1, the average amount ofprecipitation is therefore 100 mm.
Graph 2 (curve R 4 P2) shows that for the 10 year flood for anR 4 P 2 catchment of 2 km2, the coefficient of run-off is 82 %.
The depth of run"off 1s 100 x 0.82 = 82 mm.
The volume of run-off for 2 ~ i8 82 x 2 x 103 = 164,000 m3
For a catchment so small we have seen earlier that the flood.would not be unitary, consequently the base time will be given by thespecial curve corresponding to the curve of graph 9, For 2 km2 the basetime is 3 h. 15.
M =164,000
= 14 m3/sec.3.25 x 3600
For an R 4 P 2 catchment of 2 km2, K~ = 3.M
Q 10 = 14 x 3 = 42 m3/sec.
This is the true 10 year discharge for a P2 catchment, there 1sno subsurface flow.
This runoff corresponds to 21.000 l/sec/kIrf2., a figure often foundfor these impermeable catchments of 2 km2.
Consider a catchment of 120 km2 which we take to be in Senegal,40 kilometres to the East of KEDOUGOU, under the annual isohyetal of1300 mm. The hydrological regime will be tropical trans1tion.
For a catchment of this s1ze, in a region where the relief isnot very accentuated, one assumes a slope corresponding to category R3.Assuming that the ground 1s not too permeable, the catchment can be class1f1ed as P3. The 10 year depth of precipitation, taken from the maps ofthe I.C.R.S. 1s 135 mm. For 120 sq. km. the coefficient of area reductionis 0.85.

- 31 -
The average depth of precipitation over the eatchment will be135 mm x 0.85 = 115 mm.
G:ra.ph 6 (curve R3 P3) eorresponding to category P 3 shows thatthe coefficient of runoff is 34 %for the 10 year flood.
The depth of run-off is
115 lliI1 x 0.34 = 39 mm.
The volume cr! run-off t()r 120 km2 will be 39 x 120 >< 103=4i700,000m3
The base time taken from graph 11 1s 37 h. 12 m.
M = 4,700,000 = 35 m3/sec.37.2 >< 3600
The value of K = -S- for this tropical transition catchmentwill be 2.5. M
Then Q = 2.5 >< 35 =87.5 m3/sec.
A base flow of 2.5 m3/sec. can be assumed.
Then the final Q 10 = 90 m3/see., that 1s 750 1/sec/km2 •
Finally we take as a representative type, an example of a forestcatcbment in the Ivory Coast; area 10 km2, fairly steeply sloped, R4, moderate permeability (for the forest) P4.
Assume a 10 year storm of 160 mm. The coefficient of area reductian 1s 1. The vaerage storm over the catchment is 160 mm. A coefficient ofrun-off of 12 %is likely. The depth of run-off is 19.2 mm. The volume ofrunoff for 10 km2 is 19.2 x 10 x 103 = 192,000 m3•
= 3.8 m3/sec.192.000
M=
In a tropical regime the base time will he 7 hours ; we allowhere that 1t is doubled, which is perhaps a litUe low, but acts as a safetyfactor.
of 1.7.
14 x 3600
It has been seen earlier that generally S ls in the region)1
Q = 3.8 x 1.7 = 6.46 m3/sec.

- 32 -
A base flow of 1 m3/sec. may be assumed.
The 10 yêar flood disebarge Q 10 will be in the order of7.5 m3/see., tbat is 750 l/sOO/kID2. But in this instance it is simplya question of order of size.
The caleulation of exceptional floods for eatehments exeeeding120 kmf requires a different procedure in eaeh case.
The small number of experimental points, the faet that the unithydrograph method is more and. more diffieult to apply (most of all with thistype of storm) brings in a great amount of impreeision :
a) In the case of sahelien and semi desert eatehments greater than 120 sq.lans,the caleulation of the averages as proposed herein ean lead to veryerroneous results. The degradation of the drainage network interferes fromthe start, spoiling the results. Moreover heterogenity of eatehment isvery eommon for these relatively large areas, and likewise leads toerrors. We note that very often the meximum diseharge of 10 years frequeney is due to a flood oeeuring over one of the tributaries of thedownstream part of thé eatehment. One must therefore be most earef'ul in ealeulating the 10 year floods for these small tributaries and if they cometo a confluence at a short distance from the study station, one shouldoompare their floods with the 10 year flood for the whole of the eatehment
if it is greater than 40 sq. km. For the volume of the 10 year flood on theother band, i t will often be neeessary to eonsider a flood for the entireeatehment.
If the eatehment is very homogeneous, if there is only smalldegradation of the drainage network, and if the runoff is suffieient, oneean determine the specifie run-off in l/soo. sq.km. proportionate toareas, between the 120 sq. km., pointWlDohean be ealeulated fi'om. thegraph, and the 200 sq. km., point for whieh we give specifie run-offfor 10 year floods for the various types of eatehments :
MP2 = 2.000 l/see/sq. km. R4 P3 = 1.100 l/see./ sq.km.
R3 1'2 = 700 l/see/sq. km. R3 P3 = 325 l/see./sq. km.
R2P2 = 400 l/see/sq. km. R2P3 = 110 l/see./sq. km.
R4 P4 = 225 l/seeJsq. km.
R3 P4 = 0
- 33 -
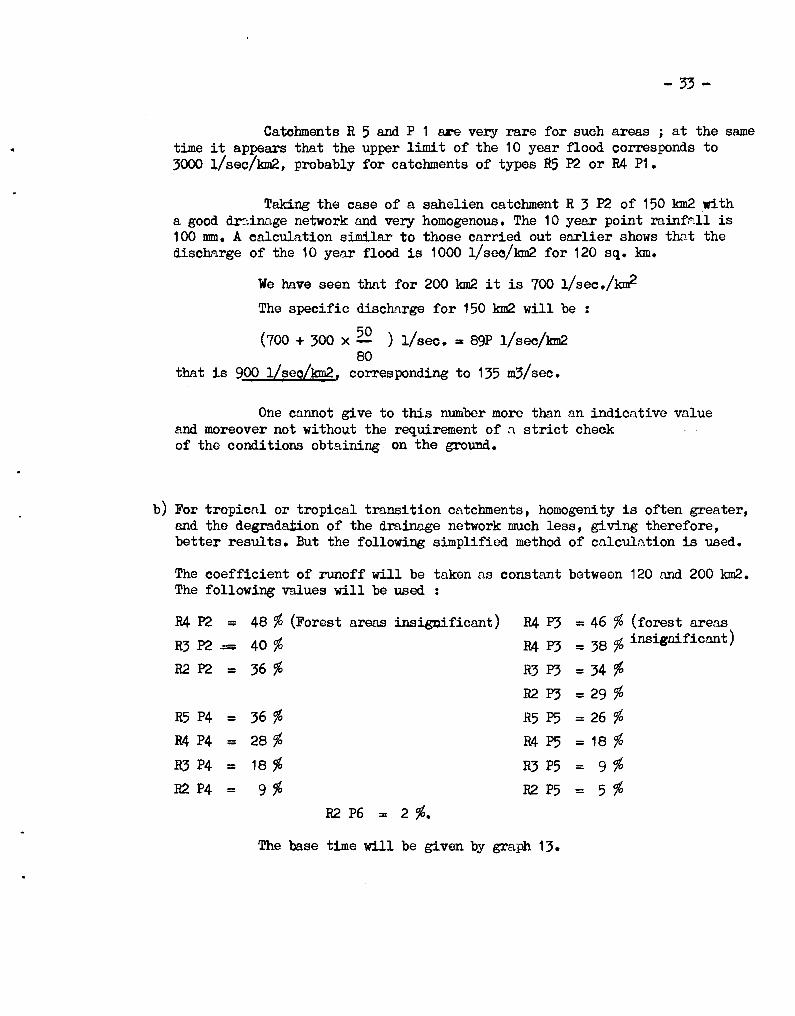
Catchments R 5 and P 1 are very rare for such areas ; at the sametime i t appears that the upper limit of the 10 year flood corresponds to3000 l/sec/km2, probably for eatchments of types R5 P2 or R4 P1.
Taking the case of a sahelien catchment R 3 P2 of 150 km2 ritha good dretinnge network and very homogenous. The 10 year point rainfpcll is100 mm. A ealeulation similar to those carried out earlier shows trot thedischc1.rge of the 10 year flood is 1000 l/sOO/km2 for 120 sq. km.
We have seen thnt for 200 km2 it is 700 l/sec./kmf
The specifie dischnrge for 150 km2 will be
(700 + 300 x 50 ) 1/sec. ;: 89P 1/sec/lan280
that is 900 l/sec/km2. eorresponding to 135 m3/sec.
One cnnnot give to this number more than an indicative valueand mereover not without the requirement of n strict eheckof the conditions obtaining on the ground.
b) For tropieal or tropical transition catehments, homogenity is often greater,and the degradation of the drainage network much less, giving therefore,better results. But the following simplified method of enlculation is used.
The coefficient of runoff will be taken as constant between 120 and 200 km2.The following values will be used
R4 P2 ;: 48 %(Forest areas insigmficant) R4 P3 = 46 %(forest areas
R3 P2 .= 40 % R4 P3 = 38 %insignificant)
R2P2 ;: 36 % R3 P3 = 34 %R2P3 = 29 %
R5 P4 = 36 % R5 P5 = 26 %R4 P4 ;: 28 % R4 P5 = 18 %R3 P4 ;: 18 % R3 P5 = 9%
R2 P4 = 9% R2 P5 = 5 %
R2 P6 = 2 %.
The base Ume will be given by graph. 13.

1
200km'
r-----
150 Sup~rficie du 8.V.100
.__ .._--- -~-----~~-
50
1
o1
~~._-+--1
1
! R4-b------+-----I
L---------J.....---=_~~:::::==:y----------f_------.-:.....--~.-.RS
Réqimes SU bdésertioues ft sahél ifn s,...
----I-----~--
11
i1
11
1
f----,------~--- ~-__I__----------___t-----------I1
1
1
Te:l'p~ ~E hft~o ~n fonction de la superficie du bassin
40h
10 h
30h
o
20h
60 h41III~
..Q..""IIIe-..
50h'"

~~
" 70h "1\) IIItJ
~. ~
~ "'b;.~
~ '"Q.
E4lI. ..... f50h
·50h
40h .!
30h
20h
10h
R~gimes tropicaux et tropicaux de transi tfon
Temps de base en fonction,de la $Uperficfe du bassin
1
.. ~-T---~----'----" .- .....~. ---.--.----------..~-+---....---'--
RS--------- --/:.=~-.-:..:.:..:-. --==..-.... -.-=.:::-..._-;:;;;.;::-~-;=r----:...;.~I
-\,.,)

-34-
The relationship ~ will be taken as 3.2 except for cntchmentsR4 P2 for whichit will be t8ke..l ns 3.. 5 •
Consider 11 cntchment of 150 km2, R4 P4, 10 yenr point precipitation 130 mm.
The coefficient of area reduction is 0.85. The average precipitation over the cntchment 1s 110 mm. The coefficient of run-off is 28 %.
The volume of run-off will be
110 x 0.28 x 150 x 103 = 4,610,000 m3
The base time from graph 13 is 23 hours
M =4,610,000
= 55 m3/sec.23 ~ 3,600
K = 3.1
Q = 55 x 3.1 = 170 m3/sec.
The base flow will be taken as 5 m3/sec.
Q 10= 175 m3/sec. that is 1150 1/sec/sq. km.
c) For forest areas we have only two examples one for a catchment of 92 km2and the other for a catchment of 150 lan2 (the specifie 10 year run-offsare 1600 l/sec/km2 and 250 l/see/km2 respectively). It is impossible togive true rules for these. Meanwhile the indications are that in asahelien zone the maximum 10 year runoff will emanate from a smallertributary in the lower part of the catchment.

- 35 -
CONCLUSIONS• cle •
The methods set out in this note for the use of engineers are morereliable than those given in the previoua note: important researeh bas beencarried outbetween the time of the two notes, on 10 year precipitations,the coefficient of area reduction, the coefficient of ~ff and the basetime, but there is still more to he done to make the methods of calculationprecise,
It now remains to take into account the disposition of the drainagenetwork of which the effect on the base time is very important, and ofthickly forested areas.
It would be of help to trace the network of different eurves fortropical and equatorialsavanah regimes, and also for the various classes ofannual precipitation: 800 - 1000 mm., 1000· - 1200 mm., 120b - 1400 mmetc •• beoause, for the sarne RF index and the sarne annual depth of precipitation KR increases slightly as the annual depth of precipitation increases.
But above a11, the princi]:al source of imprecision rests in theclassification of catchments in the categories R and P. This classificationis not sufficiently fine, and moreover there is no means of saying whethera catchment is P4 or P5 when no discharge measurement bas been made there.It is hard to rely on laboratory measurements of permeability, or on theovera11 data of the eatchment ; similarly the limiting precipitation forrunoff to occur is very imperfectly defined.
We indicate simply that a very impermeable clay or slatelike rocksnot too fraetured correspond to P2.
Very fissured non-calcareo1JS rocks correspond to P3 and sometimes
Laterit1c formations with their crusts more or less weathered correspond to P4, or P3 if the cruet is in good condition.
Ferralitic soils with granitic sands can be classE d as P4 and P5.
Gravels/sands often correspond to P5 or P6, when they are particularly permeable.

•
-36-
In forest areas P must be overestimated as we have seen earlier, totake into account the role of the vegetal cover.
The examples which have been given in this present note must beapplied with considerable judgement, and a careful examination of the ground,and in particular of the drainage network, to provide acceptable results.
Finally, these rules for calculation are valid for Africa south ofthe Sahara and West of the Congo (omitting the coastal areas, and areashaVing more than 2200 rmn of precipitation aIUlually~ It is not impossiblethat they will be of value in other regions in particular in tropical areaswith neither typhoons nor' cyclones, but it would be very imprudent to applythem in such cases rlthout adequately verif.ying their validity in thesecountries.