Embed Size (px)
Citation preview

7/27/2019 Estimation of Hydrogen Production in Genetically Modified e Coli Fermentations Using Artificial Neural Network
http://slidepdf.com/reader/full/estimation-of-hydrogen-production-in-genetically-modified-e-coli-fermentations 1/7
Estimation of hydrogen production in genetically modified
E. coli fermentations using an artificial neural network
Luis Manuel Rosales-Colunga a, Rau l Gonza lez Garcı a b, Antonio De Leo n Rodrı guez a,*aDivisio n de Biologıa Molecular, Instituto Potosino de Investigacio n Cientı fica y Tecnolo gica, Camino a la Presa San Jose 2055, Col. Lomas 4a
secc, San Luis Potosı, SLP 78216, MexicobCentro de Investigacio n y Estudios de Posgrado, Facultad de Ciencias Quı micas, Universidad Auto noma de San Luis Potosı,
Av. Dr. Manuel Nava 6, San Luis Potosı, SLP 78210, Mexico
a r t i c l e i n f o
Article history:
Received 6 July 2010
Received in revised form
26 August 2010
Accepted 28 August 2010
Available online 8 October 2010
Keywords:
Back propagation neural network
Dissolved CO2
HydrogenRedox potential
pH
Cheese whey
a b s t r a c t
Biological hydrogen production is an active research area due to the importance of this gas
as an energy carrier and the advantages of using biological systems to produce it. A cheap
and practical on-line hydrogen determination is desired in those processes. In this study,
an artificial neural network (ANN) was developed to estimate the hydrogen production in
fermentative processes. A back propagation neural network (BPNN) of one hidden layer
with 12 nodes was selected. The BPNN training was done using the conjugated gradient
algorithm and on-line measurements of dissolved CO2, pH and oxidation-reduction
potential during the fermentations of cheese whey by Escherichia coli DhycA DlacI (WDHL)
strain with or without pH control. The correlation coefficient between the hydrogen
production determined by gas chromatography and the hydrogen production estimated by
the BPNN was 0.955. Results showed that the BPNN successfully estimated the hydrogenproduction using only on-line parameters in genetically modified E. coli fermentations
either with or without pH control. This approach could be used for other hydrogen
production systems.
ª 2010 Professor T. Nejat Veziroglu. Published by Elsevier Ltd. All rights reserved.
1. Introduction
Hydrogen is considered as a good choice as future energy
carrier since it has the highest energy content per weight unit
and its use either via combustion or fuel cells results in purewater [1]. Among the hydrogen production processes, the
biological production is an attractive method because it is
carried out at ambient pressure and temperature, therefore
consumes less energy than chemical or electrochemical
processes [2]. The fermentative hydrogen production is
a promising method since it has the higher production rate; it
does not need lightand utilizes a wide range of carbon sources
[2e5]. In the dark fermentation, several microorganisms can
use carbohydrate rich substrates. From the enterobacteria,
Escherichia coli is the main microorganism used for studies of
hydrogen production, since its genetic and metabolism are
well documented [6e
12]. Under anaerobic conditions and inabsence of external electron acceptors E. coli converts sugarsto
pyruvate that may be converted to lactate or broken into
formate and acetyl-coenzyme A (acetyl-CoA), which is con-
vertedto acetate or ethanol, whereas formate is metabolized to
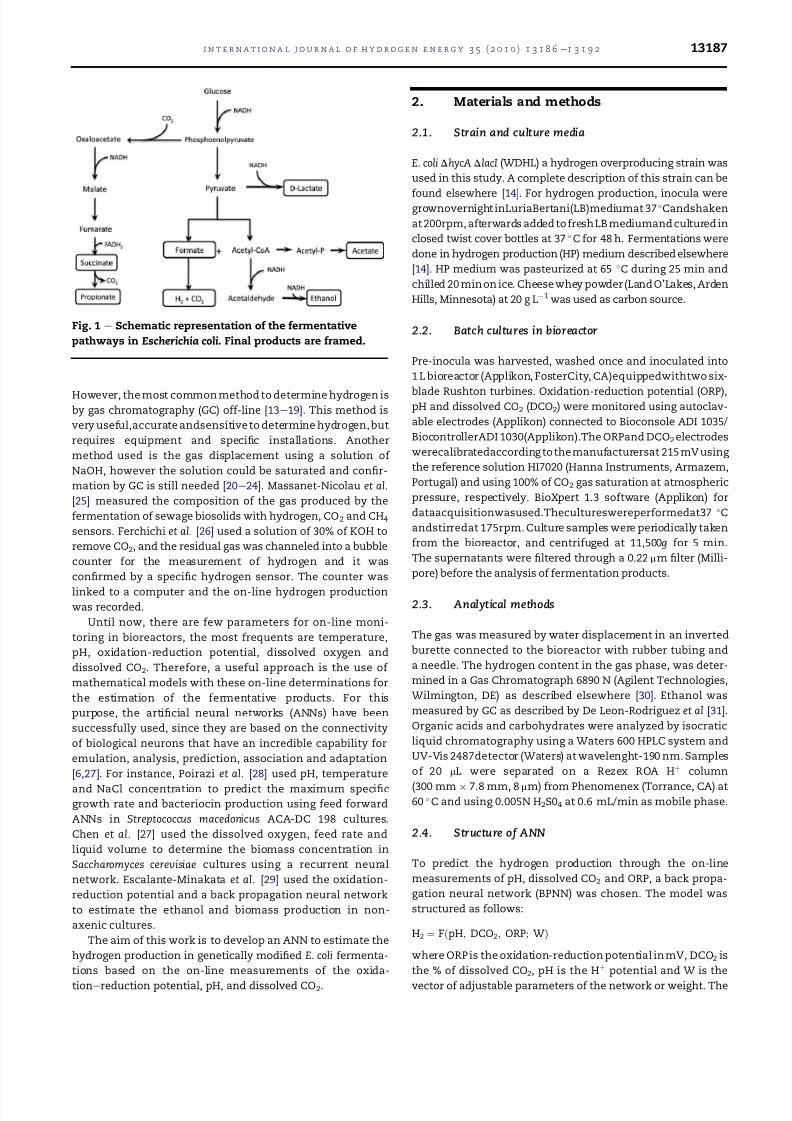
hydrogen and CO2 (Fig. 1).
The on-line hydrogen determination is strongly desired to
establish feedback or feed forward control algorithms.
* Corresponding author. Tel.: þ52 444 8342000; fax: þ52 444 8342010.E-mail address: [email protected] (A. De Leon Rodrıguez).
A v a i l a b l e a t w w w . s c i e n c e d i r e c t . c o m
j o u r n a l h o m e p a g e : w w w . e l s e v i e r . c o m / l o c a t e / h e
i n t e r n a t i o n a l j o u r n a l o f h y d r o g e n e n e r g y 3 5 ( 2 0 1 0 ) 1 3 1 8 6 e1 3 1 9 2
0360-3199/$ e see front matter ª 2010 Professor T. Nejat Veziroglu. Published by Elsevier Ltd. All rights reserved.
doi:10.1016/j.ijhydene.2010.08.137
7/27/2019 Estimation of Hydrogen Production in Genetically Modified e Coli Fermentations Using Artificial Neural Network
http://slidepdf.com/reader/full/estimation-of-hydrogen-production-in-genetically-modified-e-coli-fermentations 2/7
However, the most common method to determine hydrogen isby gas chromatography (GC) off-line [13e19]. This method is
very useful,accurate andsensitive to determine hydrogen, but
requires equipment and specific installations. Another
method used is the gas displacement using a solution of
NaOH, however the solution could be saturated and confir-
mation by GC is still needed [20e24]. Massanet-Nicolau et al.
[25] measured the composition of the gas produced by the
fermentation of sewage biosolids with hydrogen, CO2 and CH4
sensors. Ferchichi et al. [26] used a solution of 30% of KOH to
remove CO2, and the residual gas was channeled into a bubble
counter for the measurement of hydrogen and it was
confirmed by a specific hydrogen sensor. The counter was
linked to a computer and the on-line hydrogen productionwas recorded.
Until now, there are few parameters for on-line moni-
toring in bioreactors, the most frequents are temperature,
pH, oxidation-reduction potential, dissolved oxygen and
dissolved CO2. Therefore, a useful approach is the use of
mathematical models with these on-line determinations for
the estimation of the fermentative products. For this
purpose, the artificial neural networks (ANNs) have been
successfully used, since they are based on the connectivity
of biological neurons that have an incredible capability for
emulation, analysis, prediction, association and adaptation
[6,27]. For instance, Poirazi et al. [28] used pH, temperature
and NaCl concentration to predict the maximum specificgrowth rate and bacteriocin production using feed forward
ANNs in Streptococcus macedonicus ACA-DC 198 cultures.
Chen et al. [27] used the dissolved oxygen, feed rate and
liquid volume to determine the biomass concentration in
Saccharomyces cerevisiae cultures using a recurrent neural
network. Escalante-Minakata et al. [29] used the oxidation-
reduction potential and a back propagation neural network
to estimate the ethanol and biomass production in non-
axenic cultures.
The aim of this work is to develop an ANN to estimate the
hydrogen production in genetically modified E. coli fermenta-
tions based on the on-line measurements of the oxida-
tionereduction potential, pH, and dissolved CO2.
2. Materials and methods
2.1. Strain and culture media
E. coli DhycA DlacI (WDHL) a hydrogen overproducing strain was
used in this study. A complete description of this strain can be
found elsewhere [14]. For hydrogen production, inocula weregrownovernight inLuriaBertani(LB)mediumat 37Candshaken
at 200rpm, afterwards added to fresh LB mediumand cultured in
closed twist cover bottles at 37 C for 48 h. Fermentations were
done in hydrogen production (HP) medium described elsewhere
[14]. HP medium was pasteurized at 65 C during 25 min and
chilled 20 min on ice. Cheese whey powder (Land O’Lakes, Arden
Hills, Minnesota) at 20 g LÀ1 was used as carbon source.
2.2. Batch cultures in bioreactor
Pre-inocula was harvested, washed once and inoculated into
1 L bioreactor (Applikon, FosterCity, CA)equippedwithtwo six-
blade Rushton turbines. Oxidation-reduction potential (ORP),pH and dissolved CO2 (DCO2) were monitored using autoclav-
able electrodes (Applikon) connected to Bioconsole ADI 1035/
BiocontrollerADI 1030(Applikon).The ORPand DCO2electrodes
werecalibratedaccording to the manufacturersat 215 mV using
the reference solution HI7020 (Hanna Instruments, Armazem,
Portugal) and using 100% of CO2 gas saturation at atmospheric
pressure, respectively. BioXpert 1.3 software (Applikon) for
dataacquisitionwasused.Thecultureswereperformedat37 C
andstirredat 175rpm. Culture samples were periodically taken
from the bioreactor, and centrifuged at 11,500g for 5 min.
The supernatants were filtered through a 0.22 mm filter (Milli-
pore) before the analysis of fermentation products.
2.3. Analytical methods
The gas was measured by water displacement in an inverted
burette connected to the bioreactor with rubber tubing and
a needle. The hydrogen content in the gas phase, was deter-
mined in a Gas Chromatograph 6890 N (Agilent Technologies,
Wilmington, DE) as described elsewhere [30]. Ethanol was
measured by GC as described by De Leon-Rodriguez et al [31].
Organic acids and carbohydrates were analyzed by isocratic
liquid chromatography using a Waters 600 HPLC system and
UV-Vis 2487detector (Waters) at wavelenght-190 nm. Samples
of 20 mL were separated on a Rezex ROA Hþ column
(300 mm  7.8 mm, 8 mm) from Phenomenex (Torrance, CA) at60 C and using 0.005N H2S04 at 0.6 mL/min as mobile phase.
2.4. Structure of ANN
To predict the hydrogen production through the on-line
measurements of pH, dissolved CO2 and ORP, a back propa-
gation neural network (BPNN) was chosen. The model was
structured as follows:
H2 ¼ FðpH; DCO2; ORP; WÞ
where ORP is the oxidation-reduction potential in mV, DCO2 is
the % of dissolved CO2, pH is the Hþ potential and W is the
vector of adjustable parameters of the network or weight. The
Fig. 1 e Schematic representation of the fermentative
pathways in Escherichia coli. Final products are framed.
i n t e r n a t i o n a l j o u r n a l o f h y d r o g e n e n e r g y 3 5 ( 2 0 1 0 ) 1 3 1 8 6 e1 3 1 9 2 13187

7/27/2019 Estimation of Hydrogen Production in Genetically Modified e Coli Fermentations Using Artificial Neural Network
http://slidepdf.com/reader/full/estimation-of-hydrogen-production-in-genetically-modified-e-coli-fermentations 3/7
variable of response H2 is the hydrogen produced in mL. The
selected architecture was a standard network of one hidden
layer with 12 nodes [32]. Thestructure ofthe BPNN is shown in
Fig. 2. The output layer had a node that predicted the value of
hydrogen production whereas the input layer consisted on 3
nodes for pH, DCO2 and ORP. All the neurons of hidden layer
were non-linear with sigmoid activation function. The output
layer neuron had a lineal activation function. The BPNN wastrained on a Matlab platform R2008 (MathWorks, Inc.).
2.5. BPNN training
One hundred and two data of 7 different experiments were
used for the BPNN training. The characteristics of the exper-
iments are shown in Table 1. The data of the input variables
were scaled in the range (À1, þ1) and the output variable was
scaled in the range (0, þ1). The training was made by minimal
squares methodology with respect to error function as follow:
Error ¼ ð1=ð2PÞÞX p
iðH2Þ
iexp À ðH2Þ
i
2
Where (H2 )expi is the experimental value forthe i-point, (H2 )
i isthe
value estimated by the network, p is the number of data. The
network training was done using the conjugated gradient algo-
rithm [33]. The BPNN parameters W were randomly assigned in
the range of (À0.5, þ0.5). 25 full cycles of conjugated gradient
were needed to reach convergence and the error was 0.0016.
3. Results and discussion
3.1. Hydrogen production by E. coli
A typical batch culture of E. coli WDHL at pH 5.5 is showed in
Fig. 3. Cultures at other operational conditions showed similar
trends as those in Fig. 3, although rates of the various
parameters measured, their maximum concentrations, and
times to reach them were different in each case. Lactose was
consumed quickly and was undetectable after 18 h of
fermentation (Fig. 3A). Only a slight increment on the biomass
was observed and the maximum concentration was 1.16 g/Land dropped gradually after 10 h of culture (Fig. 3A). In the
Fig. 3B the production of organic acids and ethanol are shown.
Lactate was the main organic acid produced essentially in the
first 12 h and reached a maximum of 5 g/L in this fermenta-
tion. Succinate, propionate and acetate were also produced
and each acid reached around 1.6 g/L at 30 h. Only slight
amount below of 0.2 g/L of formate was detected in the
experiment, because it was rapidly used to produce hydrogen
and CO2 as soon as is produced. Ethanol was also produced
and the final concentration was 0.75 g/L. Fig. 3C shows the
hydrogen and the DCO2 profile. A fast increase on DCO2 was
observed on the first 10 h as result of metabolically activity,
reached 90% and then remained constant at this value. Sinceinoculation, the hydrogen production was observed and
became slow according the lactose concentration decreased.
For this culture, the maximum hydrogen production was
745 mL. The hydrogen and DCO2 trends are similar (Fig. 3C)
and it is explained because the production of hydrogen and
CO2 are linked, formate is broken down to give 1 mol of
hydrogen per mole of CO2 (Fig. 1). The relation should be direct
if no other reactions involve CO2 production or degradation,
but oxaloacetate is formed by the condensation of phospho-
enolpyruvate and CO2 [34]. The initial pH was 7.5 and dropped
to 5.5 at 2.5 h because the accumulation of organic acids, then
it was automatically controlled at this value with NaOH
(Fig. 3D). The pH is one of the most important parameters inhydrogen production by different microorganisms. For
instance, Li et al. [35] reported a direct relationship between
initial pH of 5-7 and hydrogen production rate using glucose in
non-axenic cultures. Davila-Vazquez et al. [30] reached the
highesthydrogen molar yield at pH of 7.5 and 6.5using lactose
and cheese whey respectively. Working with axenic cultures,
the highest hydrogen production rate was attained at initial
pH of 6 by Clostridium saccharoperbutylacetonicum using cheese
whey as substrate [26], whereas the maximum hydrogen
production was reached at initial pH of 6.5 and 7.5 by meta-
bolically engineered E. coli strains using glucose [36] and CW
[14] respectively. The role of the pH on the hydrogen produc-
tion in E. coli is explained because the metabolism and the
Fig. 2 e Structure of the Artificial Neural Network used in
this work. A standard network of one hidden layer with 12
nodes was selected. The continuous lines represent
adjustable parameters W; dashed lines are for W < 0. The
ANN training was done using on-line measurements of
ORP, DCO2 and pH during the fermentations of cheese
whey by Escherichia coli WDHL strain.
Table 1 e Characteristics of the experiments used for theBPNN training.
Experiment InitialpH
pHcontrolled
Number of experimental data
Time(h)
1 6.5 N.C. 12 249
2 7.5 N.C. 27 358
3 7.5 5.5 7 544 7.5 6.5 16 122
5 7.5 5.9 9 76
6 7.5 6.0 16 143
7 7.5 6.0 15 215
N.C. ¼ not controlled.
i n t e r n a t i o n a l j o u r n a l o f h y d r o g e n e n e r g y 3 5 ( 2 0 1 0 ) 1 3 1 8 6 e1 3 1 9 213188

7/27/2019 Estimation of Hydrogen Production in Genetically Modified e Coli Fermentations Using Artificial Neural Network
http://slidepdf.com/reader/full/estimation-of-hydrogen-production-in-genetically-modified-e-coli-fermentations 4/7
import-export of formate are pH-dependent. Moreover, the
transcription of the FHL complex which converts formate to
hydrogen and CO2 depends on the acidic pH of the growth
medium [37]. The fermentative metabolism had an effect on
ORP and its drops at the beginning of fermentation and then
remained constant around À500 mV (Fig. 3D). The global
measured ORP corresponds to the sum of the allredox species.
Table 2 shows the standard reduction potentials of main
redox pairs involved in the hydrogen metabolism by E. coli.
The ORP has been considered as a variable related to hydrogen
production. For instance, Hussy et al. [19] reported that ORP
was negatively related to hydrogen production rate in
a continuous process with non-axenic cultures. Ren et al. [38]
found that ORP and pH determined to fermentation type in
a continuous flow reactor with non-axenic cultures and the
best condition for hydrogen production occurred in the alco-
holic fermentation at ORP and pH below of À217 mV and 4.5,respectively. Rosales-Colunga et al. [14] related the ORP with
the cell-growth in a batch processes using a hydrogen over-
producer E. coli strain.
ORP, dissolved CO2 and pH are important parameters in
hydrogen production as discussed above and can be easily
measured on-line. By these reasons the three parameters were
chosen to estimate the hydrogen production by the BPNN.
3.2. Prediction of hydrogen production using a BPNN
The final parameters of the BPNN after training are shown in
Table 3. The weights between the input layer and the hiddenlayer are represented by the W1 values, whereas W2 repre-
sents the weights between the hidden layer and the output
layer. The BPNN was used with theses parameters to estimate
H2 for the new values of pH, CO2 and ORP. The comparison
between experimental hydrogen values and predicted values
Table 2 e Standard reduction potentials of redox pairs inEscherichia coli mixed acid fermentation.
Oxidant Reductor DE (volts)
Acetate Acetaldehyde À0.60
2Hþ H2 À0.42
NADþ NADHþ þ Hþ À0.32
Acetaldehyde Ethanol À0.20Pyruvate Lactate À0.19
Oxaloacetate Malate À0.17
FAD FADH2 0
Fumarate Succinate þ0.03
Fig. 3 e Typical batch culture of E. coli WDHL during the
hydrogen production using cheese whey as substrate at pH5.5. A) Lactose and biomass concentration; B) Metabolites;
C) Hydrogen production and dissolved CO2; D) ORP and pH.
Table 3 e BPNN Parameters after training.
Weights between theinput and the hiddenlayer (W1)
Thresholdfor W1
Weights for thehidden layer and the
output (W2)a
ORP DCO2 pH
À0.1469 0.3770 À0.0104 0.0038 À0.6307
0.4730 À0.4577 0.4635 À0.0506 À7.7839
0.1751 0.0864 0.1671 À0.3108 14.7107
À0.4807 0.3112 0.1203 À0.1390 À0.8163
À0.2688 0.1513 0.4748 À0.4161 À13.6800
À0.2422 À0.2316 À0.3780 À0.0965 15.8115
À0.3783 À0.1520 À0.3478 À0.1683 0.1201
À0.1010 0.4300 À0.4057 0.3842 3.3378
0.2947 0.2360 À0.1576 À0.4526 À2.7498
À0.4452 0.3936 0.1862 0.0449 9.4509
0.2202 À0.3045 À0.4538 À0.1963 17.6505
À0.4293 0.0824 0.3778 0.2218 12.4244
a Threshold for W2 was À7.3080.
i n t e r n a t i o n a l j o u r n a l o f h y d r o g e n e n e r g y 3 5 ( 2 0 1 0 ) 1 3 1 8 6 e1 3 1 9 2 13189

7/27/2019 Estimation of Hydrogen Production in Genetically Modified e Coli Fermentations Using Artificial Neural Network
http://slidepdf.com/reader/full/estimation-of-hydrogen-production-in-genetically-modified-e-coli-fermentations 5/7
based on the BPNN for the cultures at pH 5.5 and 6 is shown in
Fig. 4. In both cultures, there is a good fit in the trends betweenthe predicted and the experimental data. Similar behavior was
observed for the cultures without pH control (data not shown).
BPNN application was in off-line mode, however, the BPNN
can be applied on-line mode by the incorporation of
a subroutine on the acquisition software. The Fig. 5 shows the
correlation between the hydrogen production determined
experimentally by GC and the hydrogen estimated by the
BPNN for all experiments with or without control of pH. The R2
value of 0.955 confirms that the model can predict the
hydrogen production well. ANNs have been used in another
hydrogen production processes (Table 4). For instance, Nikhil
et al. [39] reported a BPNN to predict the hydrogen production
rate in a Continuous Stirred Tank Reactor (CSTR) using
sucrose as substrate. Shi et al. [40] reported a similar system
but using kitchen wastes as substrate. Mu and Yu [41] useda neural network and genetic algorithm to predict the
hydrogen production and the steady-state of an Upflow
Anaerobic Sludge Blanket (UASB) reactor at various sucrose
concentration and hydraulic retention times. Guo et al. [42]
estimated hydrogen yield and the chemical oxygen demand
Fig. 4 e Comparison between the experimental data of
hydrogen production measured experimentally by gas
chromatography (closed symbols) and the prediction based
on the BPNN model (continuous line). A) Culture at pH 5.5.
B) Culture at pH 6.
Fig. 5 e Correlation between the hydrogen measured
experimentally and the values estimated by the BPNN. The
lineal regression is y [ 0.9005x D 189.85 and r2 [ 0.955.
Table 4 e Some ANN reported in hydrogen production processes.
Input Output Type of reactor
Substrate Inoculum Typeof
ANN
Ref.
ORP, pH, dissolved CO2 H2P Batch CW E. coli
WDHL
BPNN This
work
HRT, sucrose, biomass, ethanol, organic acids
conc., ORP, pH, recycle ratio and alkalinity
H2PR CSTR Sucrose Sludge BPNN [39]
OLR, ORP, alkalinity, pH H2P CSTR Kitchen wastes Sludge BPNN [40]
OLR, HRT, influent alkalinity Percent of H2, H2PR, H2Y, total organic
carbon in effluent, products conc.
UASB Sucrose rich
synthetic waste
water
Sludge NN and
GA
[41]
OLR, pH, HRT, starch conc. in influent H2Y, effluent COD EGSB Starch containing
waste water
Sludge BPNN [42]
H2P ¼ Hydrogen Production; CSTR ¼ Continuous Stirred Tank Reactor; CW ¼ Cheese Whey; BPNN ¼ Back Propagation Neural Network;
HRT ¼ Hydraulic Retention Time; ORP ¼ Oxidation-Reduction Potential; H2PR ¼ Hydrogen Production Rate; OLR ¼ Organic Loading Rate;
H2Y ¼ Hydrogen Yield; UASB ¼ Upflow Anaerobic Sludge Blanket; NN ¼ Neural Network GA ¼ Genetic Algorithm; COD ¼ Chemical Oxygen
Demand; EGSB ¼ Expanded Granular Sludge Bed Reactor.
i n t e r n a t i o n a l j o u r n a l o f h y d r o g e n e n e r g y 3 5 ( 2 0 1 0 ) 1 3 1 8 6 e1 3 1 9 213190

7/27/2019 Estimation of Hydrogen Production in Genetically Modified e Coli Fermentations Using Artificial Neural Network
http://slidepdf.com/reader/full/estimation-of-hydrogen-production-in-genetically-modified-e-coli-fermentations 6/7
through a BPNN in an Expanded Granular Sludge Bed (EGSB)
reactor using starch as substrate. Therefore, BPNNs are useful
for prediction of hydrogen production, since their ability to
learn complex non-linear input-output relationships, use
sequential training procedures and adapt themselves to data
[39e43]. Aforementioned works were for non-axenic cultures
and they used off-line data such as alkalinity, substrate or
metabolites concentration as input variables, and only whenthe BPNNs were chosen, additional on-line variables were
included. To our knowledge, this is the first report on the use
of BPNN to estimate the hydrogen production by genetically
modified microorganisms and using only on-line variables.
4. Conclusions
There are few methods for hydrogen determination. The on-
line determination can be performed using expensive devices.
Thus, cheap and practical approaches for hydrogen determi-
nation are necessary. According to the results, the BPNN
predicted successfully the hydrogen production using onlyon-line parameters in E. coli fermentations either with or
without control of pH. This approach could be used for other
hydrogen production systems. The BPNN can be applied in off-
line mode as showed here and in on-line mode by incorpo-
ration a subroutine in the acquisition software.
Acknowledgements
L.M. Rosales thanks CONACyT for him scholarship No. 174494.
The authors acknowledge the technical assistance of Leandro
G. Ordon ˜ ez- Acevedo.
r e f e r e n c e s
[1] Claassen PAM, Van Lier JB, Lopez Contreras AM, VanNiel EWJ, Sijtsma L, Stams AJM, et al. Utilisation of biomassfor the supply of energy carriers. Appl Microbiol Biotechnol1999;52:741e55.
[2] Nath K, Das D. Improvement of fermentative hydrogenproduction: various approaches. Appl Microbiol Biotechnol2004;65:520e9.
[3] Kapdan IK, Kargi F. Bio-hydrogen production from wastematerials. Enzym Microb Technol 2006;38:569e82.
[4] Levin DB, Pitt L, Love M. Biohydrogen production: prospectsand limitations to practical application. Int J HydrogenEnergy 2004;29:173e85.
[5] Nandi R, Sengupta S. Microbial production of hydrogen: anoverview. Crit Rev Microbiol 1998;24:61e84.
[6] Hallenbeck PC, Ghosh D. Advances in fermentativebiohydrogen production: the way forward? TrendsBiotechnol 2009;27:287e97.
[7] Davila-Vazquez G, Arriaga S, Alatriste-Mondragon F, DeLeon-Rodrıguez A, Rosales-Colunga LM, Razo-Flores E.Fermentative biohydrogen production: trends andperspectives. Rev Environ Sci Biotechnol 2008;7:27e45.
[8] Kim S, Seol E, Oh Y-K, Wang GY, Park S. Hydrogen productionand metabolic flux analysis of metabolically engineeredEscherichia coli strains. Int J Hydrogen Energy 2009;34:
7417e27.
[9] Mathews J, Wang GY. Metabolic pathway engineering forenhanced biohydrogen production. Int J Hydrogen Energy2009;34:7404e16.
[10] Seol E, Kim S, Raj SM, Park S. Comparison of hydrogen-production capability of four different Enterobacteriaceae
strains under growing and non-growing conditions. Int J Hydrogen Energy 2008;33:5169e75.
[11] Vardar-Schara G, Maeda T, Wood TK. Metabolically
engineered bacteria for producing hydrogen viafermentation. Microb Biotechnol 2008;1:107e25.
[12] Haller T, Buckel T, Retey J, Gerlt JA. Discovering newenzymes and metabolic pathways: conversion of succinateto propionate by Escherichia coli. Biochem 2000;39:4622e9.
[13] Davila-Vazquez G, Cota-Navarro CB, Rosales-Colunga LM, DeLeon-Rodrıguez A, Razo-Flores E. Continuous biohydrogenproduction using cheese whey: improving the hydrogenproduction rate. Int J Hydrogen Energy 2009;34:4296e304.
[14] Rosales-Colunga LM, Razo-Flores E, Ordon ˜ ez LG, Alatriste-Mondragon F, De Leon-Rodrıguez A. Hydrogen production byEscherichia coli DhycA DlacI using cheese whey as substrate.Int J Hydrogen Energy 2010;35:491e9.
[15] Turcot J, Bisaillon A, Hallenbeck PC. Hydrogen production bycontinuous cultures of Escherchia coli under different nutrient
regimes. Int J Hydrogen Energy 2008;33:1465e70.[16] Bisaillon A, Turcot J, Hallenbeck PC. The effect of nutrient
limitation on hydrogen production by batch cultures of Escherichia coli. Int J Hydrogen Energy 2006;31:1504e8.
[17] Yoshida A, Nishimura T, Kawaguchi H, Inui M, Yukawa H.Enhanced hydrogen production from formic acid by formatehydrogen lyase-overexpressing Escherichia coli strains. ApplEnviron Microbiol 2005;71:6762e8.
[18] Maeda T, Vardar G, Self W, Wood T. Inhibition of hydrogenuptake in Escherichia coli by expressing the hydrogenase fromthe cyanobacterium Synechocystis sp. PCC 6803. BMC Biotech2007;7:25.
[19] Hussy I, Hawkes FR, Dinsdale R, Hawkes DL. Continuousfermentative hydrogen production from sucrose andsugarbeet. Int J Hydrogen Energy 2005;30:471e83.
[20] Penfold DW, Forster CF, Macaskie LE. Increased hydrogenproduction by Escherichia coli strain HD701 in comparisonwith the wild-type parent strain MC4100. Enzym MicrobTechnol 2003;33:185e9.
[21] Redwood MD, Macaskie LE. A two-stage, two-organismprocess for biohydrogen from glucose. Int J Hydrogen Energy2006;31:1514e21.
[22] Penfold DW, Macaskie LE. Production of H2 from sucrose byEscherichia coli strains carrying the pUR400 plasmid, whichencodes invertase activity. Biotechnol Lett 2004;26:1879e83.
[23] Klibanov AM, Alberti BN, Zale SE. Enzymatic synthesis of formic acid from H2 and CO2 and production of hydrogenfrom formic acid. Biotechnol Bioeng 1982;24:25e36.
[24] Redwood MD, Mikheenko IP, Sargent F, Macaskie LE.Dissecting the roles of Escherichia coli hydrogenases in
biohydrogen production. FEMS Microbiol Lett 2008;278:48e55.
[25] Massanet-Nicolau J, Guwy A, Dinsdale R, Premier G, Esteves S.Production of hydrogen from sewage biosolids ina continuously fed bioreactor: effect of hydraulic retentiontime and sparging. Int J Hydrogen Energy;35:469e478.
[26] Ferchichi M, Crabbe E, Gil GH, Hintz W, Almadidy A.Influence of initial pH on hydrogen production from cheesewhey. J Biotechnol 2005;120:402e9.
[27] Chen L, Nguang S, Li X, Chen X. Soft sensors for on-linebiomass measurements. Bioprocess Biosyst Eng 2004;26:191e5.
[28] Poirazi P, Leroy F, Georgalaki MD, Aktypis A, De Vuyst L,Tsakalidou E. Use of artificial neural networks and a gamma-concept-based approach to model growth of and bacteriocin
i n t e r n a t i o n a l j o u r n a l o f h y d r o g e n e n e r g y 3 5 ( 2 0 1 0 ) 1 3 1 8 6 e1 3 1 9 2 13191

7/27/2019 Estimation of Hydrogen Production in Genetically Modified e Coli Fermentations Using Artificial Neural Network
http://slidepdf.com/reader/full/estimation-of-hydrogen-production-in-genetically-modified-e-coli-fermentations 7/7
production by Streptococcus macedonicus ACA-DC 198 undersimulated conditions of kasseri cheese production. ApplEnviron Microbiol 2007;73:768e76.
[29] Escalante-Minakata P, Ibarra-Junquera V, Rosu H, De Leon-Rodrıguez A, Gonzalez-Garcıa R. On-line monitoring of mezcal fermentation based on redox potentialmeasurements. Bioprocess Biosyst Eng 2009;32:47e52.
[30] Davila-Vazquez G, Alatriste-Mondragon F, De Leon-
Rodrıguez A, Razo-Flores E. Fermentative hydrogenproduction in batch experiments using lactose, cheese wheyand glucose: influence of initial substrate concentration andpH. Int J Hydrogen Energy 2008;33:4989e97.
[31] De Leon-Rodriguez A, Gonzalez-Hernandez L, Barba de laRosa AP, Escalante-Minakata P, Lopez MG. Characterizationof volatile compounds of mezcal, an ethnic alcoholicbeverage obtained from Agave salmiana. J Agric Food Chem2006;54:1337e41.
[32] Lapedes A, Farber R. Nonlinear signal processing using neural networks: prediction and system modelling.Technical Report LA-UR-87-2662. Los Alamos NationalLaboratory; 1987.
[33] Rumelhart DE, McClelland JL, Pdp Research Group, editors.Parallel distributed processing: explorations in the
microstructure of cognition. Foundations, vol. 1. Cambridge,MA: MIT Press; 1986. p. 318e62.
[34] Clark DP. The fermentation pathways of Escherichia coli. FEMSMicrobiol Lett 1989;63:223e34.
[35] Li Z, Wang H, Tang Z, Wang X, Bai J. Effects of pH value andsubstrate concentration on hydrogen production from theanaerobic fermentation of glucose. Int J Hydrogen Energy2008;33:7413e8.
[36] Ghosh D, Hallenbeck PC. Fermentative hydrogen yields fromdifferent sugars by batch cultures of metabolicallyengineered Escherichia coli DJT135. Int J Hydrogen Energy2009;34:7979e82.
[37] Sawers RG. Formate and its role in hydrogen production inEscherichia coli. Biochem Soc Trans 2005;33:42e6.
[38] Ren NQ, Chua H, Chan SY, Tsang YF, Wang YJ, Sin N.Assessing optimal fermentation type for bio-hydrogen
production in continuous-flow acidogenic reactors. BioresTechnol 2007;98:1774e80.
[39] Nikhil O ¨ zkaya B, Visa A, Lin CY, Puhakka JA, Yli-Harja O. Anartificial neural network based model for predicting H2
production rates in a sucrose-based bioreactor system.World Academy of Science, Engineering and Technology;2008. pp. 20e25.
[40] Shi Y, Xt Zhao, Cao P, Hu Y, Zhang L, Jia Y, et al. Hydrogenbio-production through anaerobic microorganismfermentation using kitchen wastes as substrate. BiotechnolLett 2009;31:1327e33.
[41] Mu Y, Yu HQ. Simulation of biological hydrogenproduction in a UASB reactor using neural network andgenetic algorithm. Int J Hydrogen Energy 2007;32:3308e14.
[42] Guo WQ, Ren NQ, Chen ZB, Liu BF, Wang XJ, Xiang WS, et al.Simultaneous biohydrogen production and starchwastewater treatment in an acidogenic expanded granularsludge bed reactor by mixed culture for long-term operation.Int J Hydrogen Energy 2008;33:7397e404.
[43] Effendi Z, Ramli R, Ghani JA. A back propagation neuralnetworks for grading Jatropha curcas fruits maturity. Am JAppl Sci 2010;7:390e4.
i n t e r n a t i o n a l j o u r n a l o f h y d r o g e n e n e r g y 3 5 ( 2 0 1 0 ) 1 3 1 8 6 e1 3 1 9 213192